
NIH Public Access - University of North Carolina
24
The Quality of Toddler Child Care and Cognitive Skills at 24 Months: Propensity Score Analysis Results from the ECLS-B Erik Ruzek a , Margaret Burchinal b , George Farkas c , and Greg J. Duncan c Margaret Burchinal: [email protected]; George Farkas: [email protected]; Greg J. Duncan: [email protected] a Center for Advanced Study of Teaching and Learning, University of Virginia; 350 Old Ivy Way, Suite 202, Charlottesville, VA 22903, USA b FPG Child Development Institute, University of North Carolina; Campus Box 8185, Chapel Hill, NC 27599-8185, USA c School of Education, University of California, Irvine; 3200 Education, Irvine, CA 92697-5500, USA Abstract Over half of the toddlers in the U.S. experience routine nonparental care, but much less is known about early care than about preschool care. This study analyzed 2-year-old child care and child outcome data from the nationally representative ECLS-B sample of children born in 2001. At two- years of age, 51% of children experienced exclusive parental care, 18% relative care, 15% family child care, and 16% center care. More children in nonparental care were in medium quality care (61%) than in high quality (26%) or low quality (13%) care. Low-income children were more likely than non-low income children to be cared for by their parents and, when in care, were more often in lower quality care. The impact of toddler care quality on cognitive skills was estimated using propensity score adjustments to account for potential selection confounds due to family and child characteristics. Children’s cognitive scores were higher in high or medium quality care than in low quality care, but no evidence emerged suggesting that poverty moderated the quality effects. Nevertheless, this suggests that increasing the proportion of low-income children in high quality care could reduce the achievement gap because low-income children are very unlikely to experience high quality care. Keywords toddler care; child care quality; ECLS-B; cognitive skills; propensity scores The care of infants and toddlers has undergone significant changes over the last 40 years. In decades past, the vast majority of 12–24-month-old children were cared for at home by their mothers. By the mid 2000’s, however, less than half of infants and toddlers in the U.S. stayed at home with their mothers, indicating that the majority of 1- to 2-year-old U.S. children receive part- or full-time care by people other than their parents (Laughlin, 2010). Ensuring that infants and toddlers benefit from positive early experiences is important to © 2013 Elsevier Inc. All rights reserved. Corresponding author contact: [email protected]; 350 Old Ivy Way, Suite 202, Charlottesville, VA 22903; 001-434-243-3412. Publisher's Disclaimer: This is a PDF file of an unedited manuscript that has been accepted for publication. As a service to our customers we are providing this early version of the manuscript. The manuscript will undergo copyediting, typesetting, and review of the resulting proof before it is published in its final citable form. Please note that during the production process errors may be discovered which could affect the content, and all legal disclaimers that apply to the journal pertain. NIH Public Access Author Manuscript Early Child Res Q. Author manuscript; available in PMC 2015 January 01. Published in final edited form as: Early Child Res Q. 2014 January 1; 28(1): . doi:10.1016/j.ecresq.2013.09.002. NIH-PA Author Manuscript NIH-PA Author Manuscript NIH-PA Author Manuscript
-
Upload
khangminh22 -
Category
Documents
-
view
1 -
download
0
Transcript of NIH Public Access - University of North Carolina

The Quality of Toddler Child Care and Cognitive Skills at 24Months: Propensity Score Analysis Results from the ECLS-B
Erik Ruzeka, Margaret Burchinalb, George Farkasc, and Greg J. Duncanc
Margaret Burchinal: [email protected]; George Farkas: [email protected]; Greg J. Duncan: [email protected] for Advanced Study of Teaching and Learning, University of Virginia; 350 Old Ivy Way,Suite 202, Charlottesville, VA 22903, USAbFPG Child Development Institute, University of North Carolina; Campus Box 8185, Chapel Hill,NC 27599-8185, USAcSchool of Education, University of California, Irvine; 3200 Education, Irvine, CA 92697-5500,USA
AbstractOver half of the toddlers in the U.S. experience routine nonparental care, but much less is knownabout early care than about preschool care. This study analyzed 2-year-old child care and childoutcome data from the nationally representative ECLS-B sample of children born in 2001. At two-years of age, 51% of children experienced exclusive parental care, 18% relative care, 15% familychild care, and 16% center care. More children in nonparental care were in medium quality care(61%) than in high quality (26%) or low quality (13%) care. Low-income children were morelikely than non-low income children to be cared for by their parents and, when in care, were moreoften in lower quality care. The impact of toddler care quality on cognitive skills was estimatedusing propensity score adjustments to account for potential selection confounds due to family andchild characteristics. Children’s cognitive scores were higher in high or medium quality care thanin low quality care, but no evidence emerged suggesting that poverty moderated the qualityeffects. Nevertheless, this suggests that increasing the proportion of low-income children in highquality care could reduce the achievement gap because low-income children are very unlikely toexperience high quality care.
Keywordstoddler care; child care quality; ECLS-B; cognitive skills; propensity scores
The care of infants and toddlers has undergone significant changes over the last 40 years. Indecades past, the vast majority of 12–24-month-old children were cared for at home by theirmothers. By the mid 2000’s, however, less than half of infants and toddlers in the U.S.stayed at home with their mothers, indicating that the majority of 1- to 2-year-old U.S.children receive part- or full-time care by people other than their parents (Laughlin, 2010).Ensuring that infants and toddlers benefit from positive early experiences is important to
© 2013 Elsevier Inc. All rights reserved.
Corresponding author contact: [email protected]; 350 Old Ivy Way, Suite 202, Charlottesville, VA 22903; 001-434-243-3412.
Publisher's Disclaimer: This is a PDF file of an unedited manuscript that has been accepted for publication. As a service to ourcustomers we are providing this early version of the manuscript. The manuscript will undergo copyediting, typesetting, and review ofthe resulting proof before it is published in its final citable form. Please note that during the production process errors may bediscovered which could affect the content, and all legal disclaimers that apply to the journal pertain.
NIH Public AccessAuthor ManuscriptEarly Child Res Q. Author manuscript; available in PMC 2015 January 01.
Published in final edited form as:Early Child Res Q. 2014 January 1; 28(1): . doi:10.1016/j.ecresq.2013.09.002.
NIH
-PA Author Manuscript
NIH
-PA Author Manuscript
NIH
-PA Author Manuscript

parents, and is of growing concern for policy makers. Since most child care research focuseson the preschool period, little is known about the impact of nonparental child careexperiences during the infant and toddler period, especially at the national level. Thepurpose of this study is to extend our understanding of the impact of child care experiencesfor infants and toddlers by analyzing a nationally-representative data source on children’searly development, the Early Childhood Longitudinal Study-Birth cohort of children born in2001 (Flanagan & West, 2005). Propensity score methods are used to reduce bias in theestimation of the effect of child care quality on the cognitive development of 2-year-oldchildren owing to parental selection of different types and quality of child care.
High Quality Child CareThe quality of care received by infants and toddlers is thought to be crucial to theirdevelopment, and in order to provide maximal developmental benefit, child-adultinteractions must be continually sustained and grow increasingly complex over time(Bronfenbrenner & Morris, 2006). Increasing complexity arises when caregiver-childinteractions are scaffolded to reflect the child’s understanding of relationships and objects.Constructionist theorists extend the interaction-based child care quality model to argue thatyoung children construct their own learning by interacting with and operating in their naturalenvironments (Bodrova & Leong, 2006; Piaget, 2007; Vygotsky, 1978). These theories havebeen influential in shaping our understanding of the quality of child care, and specificallythe importance of both the quality of adult-child interactions and the child’s opportunity tointeract with varied and rich materials within the child care classroom. In prior child careresearch, developmentally-supportive environments were found to be rich in spokenlanguage experiences; encourage children to safely explore their physical, social, andintellectual environment; and contain play environments that stimulate children’s cognitivedevelopment (National Institute of Child Health and Human Development, Early Child CareResearch Network [NICHD ECCRN], 2000a; Vandell, 2004). We define high quality childcare as care that occurs in safe settings where children are provided with rich playenvironments and reciprocal interactions that encourage exploration and learning.
Child Care Quality and Children’s Cognitive DevelopmentStudies of preschool children consistently find a positive association between child carequality and children’s cognitive skills (Burchinal & Cryer, 2003; Burchinal, Kainz, & Cai,2011; Camilli, Vargas, Ryan, & Barnett, 2010; Gormley, Gayer, Phillips, & Dawson, 2005;Howes et al., 2008; Mashburn et al., 2008; NICHD ECCRN, 2000a, 2002a, 2005; NICHDECCRN & Duncan, 2003; Peisner-Feinberg & Burchinal, 1997; Peisner-Feinberg et al.,2001; Pianta, Barnett, Burchinal, & Thornburg, 2009; Reynolds, Temple, Robertson, &Mann, 2002; Vandell, 2004; Votruba-Drzal, Coley, & Chase-Lansdale, 2004). However,much less is known about child care quality effects on infant and toddler cognitivedevelopment. Experimental studies, which eliminate bias due to parental selection intodifferent types of child care, find that, at 36 months, children’s cognitive skills are enhancedby high-quality child care, with effect sizes ranging from d = .12 in the Early Head StartStudy (Love et al., 2005) to d = .83 in the Infant Health and Development Program(McCormick et al, 2005) to d = 1.23 in the Abecedarian study (Campbell, Pungello, Miller-Johnson, Burchinal, & Ramey, 2001). The quality of care in these interventions was likely tobe high due to involvement of research staff and use of evidence-based curricula, but childcare quality was not actually measured in the treatment or control conditions in theAbecedarian and Infant Health and Development Program interventions.
In the case of younger children (12–24 months), the focus of the present paper, associationsbetween child care quality and cognitive skills are rarely investigated, and were observed in
Ruzek et al. Page 2
Early Child Res Q. Author manuscript; available in PMC 2015 January 01.
NIH
-PA Author Manuscript
NIH
-PA Author Manuscript
NIH
-PA Author Manuscript

a handful of non-experimental studies. These include both small, single-site studies(Burchinal, Roberts, Nabors, & Bryant, 1996) and larger multisite studies using datacollected in the 1990s (NICHD ECCRN, 2006; NICHD ECCRN & Duncan, 2003). Childsamples in prior work were primarily low income (e.g., Early Head Start) or from middle-class backgrounds (e.g., National Institute of Child Health and Development Study of EarlyChild Care and Youth Development [NICHD-SECCYD]) and thus not fully representative.While studies using the National Longitudinal Study of Youth (Han, Waldfogel, & Brooks-Gunn, 2001) are nationally representative, they do not adequately address associationsbetween child care quality and cognitive skills due to the fact that child care quality was notmeasured. In addition, few large observational studies use statistically rigorous methods toaccount for parental selection into differing levels of child care quality, types of care, andquantity of care (an exception is work by Dearing, McCartney, and Taylor [2009] with theNICHD-SECCYD sample). The present study therefore uses propensity scores to examinethe effect of early child care on cognitive skills at 24 months for children in the ECLS-B, anationally-representative sample of children born in 2001.
Other Facets of Child Care that May Relate to Cognitive SkillsIn order to account for the relation between child care quality and cognitive skills in anunbiased manner, it is necessary to also account for other facets of early child care that, inprior work, have been linked to children’s cognitive skills. Principal among these are theamount of time children spend in child care, the age at which they enter care, and the type ofcare they receive. Of these, the type of care a child receives (center care or not) may beparticularly important because being in center care is associated with increases in cognitiveskills (Clarke-Stewart, Gruber, & Fitzgerald, 1994). While center care predicts cognitiveskills over and above the measured quality of care in many studies (Brooks-Gunn, Han, &Waldfogel, 2002; NICHD ECCRN, 2000b, 2006; NICHD ECCRN & Duncan, 2003), otherresearch finds no cognitive benefit (measured at age 3) for center care versus mother-onlycare during the first year of a child’s life (Han et al., 2001). Loeb, Bridges, Bassok, Fuller,and Rumberger (2007) found that first entering center care between ages 2 and 3 resulted ingreater cognitive gains than entering center care in the year prior to kindergarten. Beginningcenter care prior to two years of age yielded no additional cognitive benefits. Studies thatsimultaneously examined the amount of time children spent in child care and the quality ofchild care found only a quality effect on cognitive outcomes (NICHD ECCRN, 2000b;NICHD ECCRN, 2006; NICHD ECCRN & Duncan, 2003).
Given the above evidence, it is questionable how important these other dimensions of childcare are in terms of predicting cognitive skills over and above the measured quality of childcare. However, these dimensions of child care may be linked with cognitive skills, andcannot be ignored since doing so may bias any estimates of the effects of child care quality.The present study therefore tests whether these dimensions are related to cognitive skills.
Differential Effects of Child Care on Low-Income ChildrenWhether or not child care quality has an overall impact on cognitive skills, it is important totest for the effect of quality on low-income children, since public policies are often targetedtoward children from low-income backgrounds. Additionally, estimating the relativemagnitudes of effect for low-income and middle-income children is useful for understandingthe ability of subsidized, high-quality child care for low-income children to narrowachievement gaps. Some evidence from the preschool period suggests that high-quality caremight be a protective factor for low-income children (Burchinal, Roberts, Zeisel, Hennon, &Hooper, 2006). Quality of care appears to be related to cognitive development for allchildren (Vandell, 2004), but may be a stronger predictor for low-income children in the
Ruzek et al. Page 3
Early Child Res Q. Author manuscript; available in PMC 2015 January 01.
NIH
-PA Author Manuscript
NIH
-PA Author Manuscript
NIH
-PA Author Manuscript

first year of grade school (Dearing et al., 2009). Although Dearing et al. (2009) consideredearly care, they did not isolate it from later child care, instead measuring child care qualityby the number of times a child experienced high-quality care from 6 to 54 months. It is,thus, important to know whether high-quality infant/toddler care is protective separate fromhigh-quality preschool care.
Present StudyThis study has two aims. First, descriptive information about toddler care experiences areprovided using the nationally-representative Early Childhood Longitudinal Survey – BirthCohort (ECLS-B) to address the need for more information about the type, quantity, andespecially quality of child care for toddlers in the US. Second, it addresses the understudiedquestion of whether early cognitive development is related to the quality of toddler care. TheECLS-B provides rich information on children’s socio-demographic and psychologicalcharacteristics that enable us to use propensity score procedures to reduce bias in estimatingthe relation between measured child care quality and children’s cognitive development from9 to 24 months of age. We hypothesize that higher quality child care promotes toddlers’cognitive development.
MethodParticipants
Data are drawn from the Early Childhood Longitudinal Study—Birth Cohort, a nationallyrepresentative, longitudinal cohort study of U.S. children born in 2001 (Flanagan & West,2005). Sampling from birth certificate records, the ECLS-B oversampled Asian and PacificIslanders, Native Americans and Alaska Natives, low-birth-weight (1,500–2,500g) and very-low-birth-weight (less than 1,500g) children, as well as twins. At 9 and 24 months, childrenand their caregivers were assessed. The ECLS-B collected data on 10,600 children at the 24-month data collection period, representing 99% of the original study sample. Descriptivestatistics on the 24-month sample of children is presented in Table 1, appropriately weightedso that the means, standard deviations, and percentages are representative of children born inthe U.S, in 2001. The means and standard deviations in Table 1 were estimated for themaximum number of children in the ECLS-B with valid data.
The N of the full sample of children in Table 1 is larger than the N of children in the mainanalysis of the paper. For the analytic models assessing child care quality effects oncognitive skills, the sample includes all children with non-missing values for their 24-monthchild care arrangement, 24 month Bayley mental score, and ECLS-B sample weight(W2C0); and who met eligibility criteria for the child care observation subsample (describedbelow), whether they were in child care or stayed at home with parents (n = 8,350).Excluding the 500 children who were ineligible for child care observation, there were somesmall, but significant differences between children with missing values on these variablesand those without. Children with missing values were less likely to be in poverty or speakEnglish at home, had lower 9-month Bayley scores (difference of 0.8), and lower maternalsensitivity (NCATS) scores. These children were more likely to be from non-white, -black,or -Hispanic backgrounds; be the first born child; be born at a very low birth weight; havemothers with less than a high school education and have higher observed HOME scores at 9months.
MeasuresComprehensive data were collected on study children when they were approximately 9 and24 months of age via direct child assessment, parent surveys, and observational measures.
Ruzek et al. Page 4
Early Child Res Q. Author manuscript; available in PMC 2015 January 01.
NIH
-PA Author Manuscript
NIH
-PA Author Manuscript
NIH
-PA Author Manuscript

One-to-one assessments of children’s cognitive ability were carried out by ECLS-B staff inthe child’s home, as were observations of interactions between children and their mothers.Child care observations were also carried out by ECLS-B staff in the settings in which thestudy child’s primary care took place, i.e. where the child spent the most number of hoursper week in nonparental care. This was either in a child care center or in the child’s, arelative’s, or a non-relative’s home. Other measures used as control variables were collectedvia parent surveys, which were administered in children’s homes.
All analyses were weighted to provide nationally representative statistics and all tables werecreated in accordance with IES reporting guidelines. In keeping with NCES/IES reportingguidelines for the ECLS-B, case counts in all tables are rounded to the nearest 50. Alldescriptive statistics were weighted by the appropriate analytic weight; standard errors werecalculated using appropriate PSU and stratum variables supplied by the ECLS-B study.
Socio-demographic, family, and other child and maternal characteristics—Detailed demographic information about children and their families was collected via birthcertificate records and a 60-minute in-person interview of a child’s parent (typically themother) in which the ECLS-B trained interviewer asked questions aloud and entered theresponses in a computer. In order to control for selection into different types of infant andtoddler child care experiences (NICHD ECCRN, 2005), our regressions include thefollowing controls: child’s age (in months), gender, ethnicity (non-Hispanic white, AfricanAmerican, Hispanic, or other), mother’s education (less than HS, HS graduate, somecollege, BA or greater) and marital status (at 9 months), and whether family income at 9months was above the 185% poverty line, the cutoff for Head Start and Free and ReducedLunch eligibility. In 2003, a family of four below 1.85 times the poverty threshold had anincome under $34,040. Also accounted for were the following structural features of thefamily: whether the child was first born, the child’s number of older siblings, and whetherEnglish was spoken at home. Children’s birth weight, either moderately low birth weight(1,500 to 2,500 grams) or very low birth weight (less than 1,500 grams), were included in allmodels.
Finally, maternal teaching behaviors as measured by the Nursing Child AssessmentTeaching Scale (NCATS) were included in all models. When children were 9 months old,the ECLS-B videotaped the parent (the main respondent – typically the mother) selecting anNCATS task that the sampled child had no experience with and then teaching the child thattask. Trained raters then coded the videotapes. All models include total parent score fromthe NCATS (α= .68), which measured parental responsivity to cues (e.g., pausing as childinitiates action), cognitive growth fostering (e.g., type of instructions and modeling), socio-emotional growth fostering (e.g., cheerleading), and response to distress (e.g., rearrangingtoys).
Children’s cognitive skills—We used the mental scale of the Bayley Short Form-Research Edition (BSF-R) at 24 months as the child outcome. The BSF-R was developedspecifically for the ECLS-B and includes a subset of questions from the larger Bayley Scalesof Infant Development – Second Edition (BSID-II). At 24 months, the BSF-R mental scalemeasures a child’s performance on tasks requiring memory, problem solving, and languageskills. Children were presented tasks such as naming pictures, verbal comprehension,comparing sizes, and matching colors. ECLS-B staffers who administered the BSF-Rreceived a 3-day intensive training on administering and scoring the individual BSF-R items,which culminated in each staffer administering a live BSF-R to a 21 to 30-month old childto ensure and measure accuracy. Those staffers who ended up administering the BSF-R aspart of the full data collection effort scored an average of 93 percent for administrationaccuracy and an average of 97 percent for scoring accuracy on the BSF-R mental scale. The
Ruzek et al. Page 5
Early Child Res Q. Author manuscript; available in PMC 2015 January 01.
NIH
-PA Author Manuscript
NIH
-PA Author Manuscript
NIH
-PA Author Manuscript

scale scores were calculated using IRT true-score equating so that BSF-R scores were on thesame scale as the BSID-II. The observed overall BSF-R mental scale reliability coefficientwas 0.975. ECLS-B guidelines indicate that scale scores are most appropriate for use inanalyses of developmental growth over time.
Child care quantity and type—The primary caregiver, typically the mother, wasinterviewed and asked whether the child was currently in child care, the number of hours perweek in child care, and the type of care the child received during the year that the childturned 2-years-old (between January 2003 and December 2003).
Child care quality—For cost reasons, the ECLS-B observed child care quality for arandomly-chosen 25% subsample of the children whose parents reported using nonparentalcare for at least 10 hours per week. This group is referred to as the Child Care Observation(CCO) sample. Children who lived in Alaska, Hawaii, resided in American Indiansupplement Population Sampling Units, or in a care setting where the language spoken wasone other than English or Spanish were not eligible for observation and thus not included inanalyses presented below, which amounted to a total of 500 children. All eligible caseswhere the child lived in poverty and spent the most hours per week in a center-based carearrangement were included in the CCO sample with certainty. All other eligible cases weresubsampled at rates designed to reduce the variability in probabilities of selection resultingfrom the oversampling of low and very low birth weight children in the base ECLS-Bsample.
The measures of child care quality in centers and in home-based care used in the ECLS-Bwere developed to measure comparable dimensions in the two settings from a constructivisttheory of early development (Piaget, 2007; Vygotsky, 1978). In this study, theEnvironmental Rating Scales (ERS), including the Infant/Toddler Environmental RatingScale (ITERS) and Family Day Care Rating Scale (FDCRS), were used to measure thequality of the child care environment. ERS instruments measure the extent to which adultsprovide frequent stimulating and sensitive interactions, children have the opportunity tointeract with a variety of age-appropriate objects and activities (e.g., water, sand, dress-upclothes), and the child’s health and safety is maintained within that environment.
For children in center-based care, ECLS-B observers rated quality of care using the ITERSand for children in family or non-relative home-based care, observers rated child carequality using the FDCRS. The ITERS is a classroom-level measure of child care quality thatexamines the child’s experiences in the care setting. The ITERS examines interactions withadults and peers, exposure to materials and activities, the extent to which and the manner inwhich routine care needs are met, and the furnishings and displays in the classroom (9month to 2 year User’s Manual). Harms, Cryer, and Clifford (1990) report inter-rater andtest-retest reliability of r = 0.58 and r = 0.89, respectively, internal consistency was α =0.83, criterion validity at 83 percent, and content validity between 75 and 86 percent. ECLS-B conducted 69 quality control visits to assess reliability of ITERS scoring among its raters,finding an average reliability score across all quality control visits of 87.2 (range 78.3–96.5).The total quality score on the ITERS (α=.86 in the ECLS-B) was used in analyses. Thisscore contains 29 items from the broad categories mentioned above and is on a 7-point scale.The FDCRS is a setting-level measure of child care quality that examines the child’sexperiences in the care setting, including interactions with adults and peers, materials andactivities exposure, whether, how much, and the manner in which routine care needs aremet, and classroom furnishings and displays (9-month to 2-year user’s manual). Inter-raterreliability for the FDCRS was reported to be r = .90, internal consistency was only reportedfor the subscales and varied from α = 0.7 to α = .93 and while the original manual did notreport on concurrent validity, other studies report high correlations (.80) between the
Ruzek et al. Page 6
Early Child Res Q. Author manuscript; available in PMC 2015 January 01.
NIH
-PA Author Manuscript
NIH
-PA Author Manuscript
NIH
-PA Author Manuscript

FDCRS and visitors’ ratings of family day care settings (U.S. Administration for Childrenand Families, 2013). We used the total quality score on the FDCRS (α= .88 in the ECLS-B),which contains 33 items drawn from the categories mentioned above and is also on a 7-pointscale.
ECLS-B staffers who rated the quality of care for study children received an extensivemulti-day training split roughly 35–65 between direct instruction and field observations thatincluded conducting observations in small groups lead by a trainer and then discussingexperiences and scoring with the same small groups in the afternoon. To be certified oneither the ITERS or FDCRS, observers were required to have 80 percent of their scoreswithin one point of the consensus score as well as a positive trainer evaluation.
Published guidelines provide an interpretation of the meaning of different values along the7-point scale of the ITERS and FDCRS: 1 (inadequate), 3 (minimal), 5 (good), and 7(excellent). Following Kontos, Howes, Shinn, and Galinsky (1995) and Phillipsen,Burchinal, Howes, and Cryer (1997), low-quality care is categorized as a score on theITERS or FDCRS below 3, medium-quality care as a score greater than or equal to 3 andless than 5, and high-quality care as a score of 5 and above. In using this approach tomeasure overall child care quality, we borrow from prior research (Burchinal et al., 2000)that treated scores from different child care quality measures equally in analyses thataccounted for potential differences in mean scores and variability across the twoinstruments. To ensure the quality construct is appropriate, the regression models describedbelow allow for the combined quality score to vary by type of care (by including a type-of-care-by-quality interaction term) to account for any differences that might be measure based.A series of robustness checks, in which the final model is estimated separately by child caretype, among others, are estimated to ensure the validity of treating ITERS and FDCRSscores as equivalent. The outcomes of these checks are presented at the end of the Resultssection.
Child care categorization for analysis—Two issues complicate ECLS-B-basedanalyses of child care type and quality. First, type of care has been divided into exclusiveparental care and routine nonparental care. It is noteworthy that the nonparental group isfurther distinguished by where child care is provided and who provides it (i.e., relatives,non-relatives in a home-based setting, or center care). Second, as mentioned above, childcare quality was only observed for a random subsample of about 25% of children who werein at least 10 hours of nonparental care, coded here as receiving high-, medium-, or low-quality care based on their ITERS or FDCRS scores. Thus, for analytic purposes, a total offive child care categories were possible, which encompassed all children in the ECLS-B at24 months: i) exclusive parental care; ii) nonparental care that was not-observed; iii) lowquality care; iv) medium quality care; and v) high quality care.
Analytic ApproachTwo sets of analyses were conducted. The first provides a nationally representativedescription of the child care experiences of 2-year-olds in 2003. The type, quantity, andquality of care are described for the entire sample and separately by poverty status of thefamily. The use of appropriate ECLS-B sample weights ensures that the child careexperiences described are nationally representative
The second set of analyses estimated differences in cognitive development among childrenin high-, medium-, and low-quality toddler care. Preliminary analyses tested quality-by-quantity and quality-by-type interactions and found no consistent evidence of them. Basedon the results from this analysis, the analyses presented in this paper utilize propensity scoremethodology to test for associations between child care quality and 24 month Bayley mental
Ruzek et al. Page 7
Early Child Res Q. Author manuscript; available in PMC 2015 January 01.
NIH
-PA Author Manuscript
NIH
-PA Author Manuscript
NIH
-PA Author Manuscript

scores across the entire ECLS-B sample, including those children in exclusive parental careor for whom child care was unobserved.
Generalized propensity scores to account for selection into child care—Tohelp account for the selection processes involved in the decision to keep a child at home orplace him/her in child care (whether low, medium, or high in quality), generalizedpropensity score models were estimated on the entire ECLS-B sample. Because the ECLS-Bis an observational study, estimated associations between child care quality and childoutcomes may over- or understate causal effects owing to family and child factors that arecorrelated with child care quality and child outcomes. In cases when there are a largenumber of such factors, and the distribution of these factors varies with treatment status(child care quality in this analysis), covariate adjustment via regression analysis alone isoften inadequate (Imbens, 2000). Building on Rosenbaum and Rubin’s (1983) propensityscore adjustment technique, Imbens (2000) and Imbens and Wooldridge (2009) outline amethod of adjusting for treatment choice based on pre-treatment characteristics in situationswhere treatment takes on more than two values, termed generalized propensity scores.
First, a multinomial logistic regression is estimated to predict whether a child was inparental care, nonparental care not observed, low quality, medium quality, or high qualitynonparental care during the 12–24 month period using a wide range of covariates.Covariates drawn from the literature include the child’s development, ethnicity, and povertystatus, were related to family choice of child care (Early & Burchinal, 2001; Gamble,Ewing, & Wilhelm, 2009). In addition, the representativeness of the ECLS-B sampleprovides further assurances that the analytic models to predict propensity to select care arereliable (Burchinal & Nelson, 2000). A list of the variables used in the propensity scoreanalysis, including descriptive statistics for each of the child care groups, and the results ofthe multinomial logistic regression are presented as online supplementary tables 1 and 2,respectively. The coefficient estimates from the multinomial logistic regression predictingcare categories are then used to calculate a child’s probability of being in each one of thedifferent categories. The generalized propensity score for each child is equal to the inverseof the child’s probability of being in the appropriate care category given their 24-monthparenting or child care experience.
We assessed the adequacy of the propensity score model by checking for balance across thetreatment groups on each of the key independent variables in our final model, both beforeand after propensity score adjustment. Before propensity score adjustment, only 3 of the 17independent variables in our final model were balanced across treatment groups; afterpropensity score adjustment, balance across treatment groups was achieved in 11 of the 17independent variables. In addition, for each of the 17 variables, we conducted 10 pairwisecomparisons of standardized means for a total of 170 comparisons. Only 13 (8%) of thepropensity-adjusted comparisons had standardized mean differences below −.1 or above .1,a common criteria for assessing balance. By comparison, 64 of the 170 (38%) of the pre-propensity score adjusted comparisons had standardized mean differences outside the −.1to .1 interval.
The final step in the analysis is to use the generalized propensity scores to weight an OLSregression predicting the Bayley cognitive score at 24 months using indicators for child caretype and the set of variables in Table 2 as independent predictors as follows,
Ruzek et al. Page 8
Early Child Res Q. Author manuscript; available in PMC 2015 January 01.
NIH
-PA Author Manuscript
NIH
-PA Author Manuscript
NIH
-PA Author Manuscript
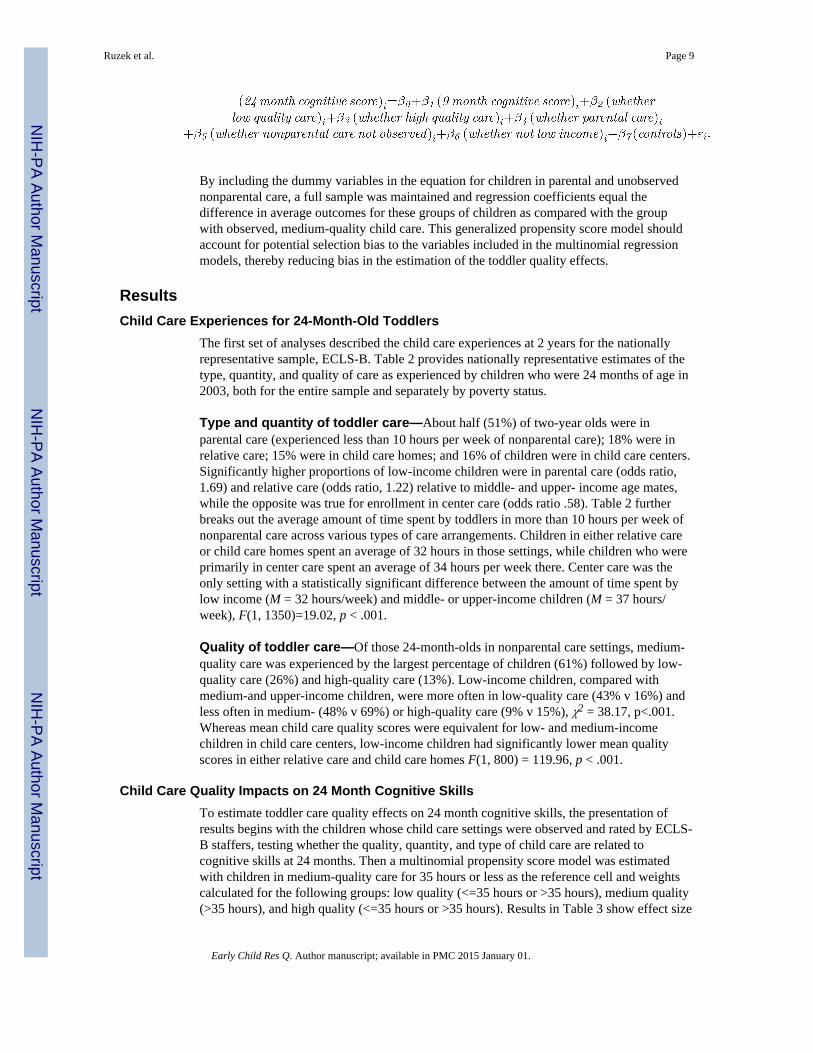
By including the dummy variables in the equation for children in parental and unobservednonparental care, a full sample was maintained and regression coefficients equal thedifference in average outcomes for these groups of children as compared with the groupwith observed, medium-quality child care. This generalized propensity score model shouldaccount for potential selection bias to the variables included in the multinomial regressionmodels, thereby reducing bias in the estimation of the toddler quality effects.
ResultsChild Care Experiences for 24-Month-Old Toddlers
The first set of analyses described the child care experiences at 2 years for the nationallyrepresentative sample, ECLS-B. Table 2 provides nationally representative estimates of thetype, quantity, and quality of care as experienced by children who were 24 months of age in2003, both for the entire sample and separately by poverty status.
Type and quantity of toddler care—About half (51%) of two-year olds were inparental care (experienced less than 10 hours per week of nonparental care); 18% were inrelative care; 15% were in child care homes; and 16% of children were in child care centers.Significantly higher proportions of low-income children were in parental care (odds ratio,1.69) and relative care (odds ratio, 1.22) relative to middle- and upper- income age mates,while the opposite was true for enrollment in center care (odds ratio .58). Table 2 furtherbreaks out the average amount of time spent by toddlers in more than 10 hours per week ofnonparental care across various types of care arrangements. Children in either relative careor child care homes spent an average of 32 hours in those settings, while children who wereprimarily in center care spent an average of 34 hours per week there. Center care was theonly setting with a statistically significant difference between the amount of time spent bylow income (M = 32 hours/week) and middle- or upper-income children (M = 37 hours/week), F(1, 1350)=19.02, p < .001.
Quality of toddler care—Of those 24-month-olds in nonparental care settings, medium-quality care was experienced by the largest percentage of children (61%) followed by low-quality care (26%) and high-quality care (13%). Low-income children, compared withmedium-and upper-income children, were more often in low-quality care (43% v 16%) andless often in medium- (48% v 69%) or high-quality care (9% v 15%), χ2 = 38.17, p<.001.Whereas mean child care quality scores were equivalent for low- and medium-incomechildren in child care centers, low-income children had significantly lower mean qualityscores in either relative care and child care homes F(1, 800) = 119.96, p < .001.
Child Care Quality Impacts on 24 Month Cognitive SkillsTo estimate toddler care quality effects on 24 month cognitive skills, the presentation ofresults begins with the children whose child care settings were observed and rated by ECLS-B staffers, testing whether the quality, quantity, and type of child care are related tocognitive skills at 24 months. Then a multinomial propensity score model was estimatedwith children in medium-quality care for 35 hours or less as the reference cell and weightscalculated for the following groups: low quality (<=35 hours or >35 hours), medium quality(>35 hours), and high quality (<=35 hours or >35 hours). Results in Table 3 show effect size
Ruzek et al. Page 9
Early Child Res Q. Author manuscript; available in PMC 2015 January 01.
NIH
-PA Author Manuscript
NIH
-PA Author Manuscript
NIH
-PA Author Manuscript

estimates from regressions of 24 month Bayley mental scores on joint indicators of qualityand quantity of care, whether in center care or not, income status, and controls. Results incolumn 1 come from a regression weighted by the appropriate ECLS-B child careobservation sampling weight, while the regression results in column 2 are propensity scoreweighted, specifically the inverse of the child’s propensity to be in the quantity by qualitycategories described above. Post-hoc tests of the main effects of child care quality, quantity,and type reveal that only the main effect of quality was statistically significant, and that thequality-by-quantity interaction was not statistically significant. Follow-up analyses (notshown) also indicated that quality-by-poverty status interactions were not statisticallysignificant (all p-values > 0.15). Child care quality appears to be the only child caredimension significantly associated with cognitive skills at 24 months.
The above analysis included only children in child care and therefore does not take intoaccount potential bias associated with who decides to use or not use toddler care. Thisdecision involves two steps: 1) families choose whether or not to put their child in child careand 2) if they opt into child care, families decide to place their child into the best care theycan given a wide variety of constraints. In reality, this means a child can get placed into ahigh-, medium-, or low-quality setting. To help account for these selection processes andachieve less biased estimates of the association between child care quality and cognitiveskills, we analyzed data from the entire ECLS-B sample. These analyses employed indicatorvariables for each of the following: whether a child experienced exclusive parental care,whether a child was in nonparental care of unobserved quality, and whether a child wasobserved to be in low-, medium-, or high-quality child care.
To address this question, three sets of analyses were conducted. The first column in Table 4shows the results from a multiple regression (i.e., OLS) analyses. The second column showsthe results from multiple regression analyses that included the appropriate sample weights tomake the results nationally representative for 2-year-olds in 2003. The third column showsthe results from multiple regression analyses that included the propensity score weights. Inall analyses, the coefficients for child care type compares that group with the group ofchildren in middle quality toddler care adjusted for the same covariates. The propensityscore approach (column 3) is the preferred method of dealing with the selection processesinvolved in early child care decisions, and is the focus of the rest of the results section. Allcontinuous variables, independent and dependent, were standardized to have a mean of zeroand standard deviation of 1 so coefficients can be interpreted in terms of effect sizes.
The propensity-score-weighted estimates in column 3 indicate that low-quality care isassociated with significantly lower Bayley scores than medium-quality care (d = −0.17), andhigh-quality care yields significantly higher Bayley scores than medium-quality care (d =0.38). The association between high-quality care and Bayley scores is more than twice aslarge of an effect size compared with the negative effect size associated with low-qualitycare. The Bayley scores of children in either parental care or home-based (unobserved) childcare are not reliably different from the scores of children in medium-quality settings.Though not shown, tests for interactions between poverty status and child care qualityindicated that the effect of higher-quality child care does not vary by poverty status.Likewise, the negative cognitive skills effect of being in low-quality care was not reliablydifferent by poverty status.
Robustness of ResultsThe models in Table 4 group ITERS and FDCRS scores into categories based on theassumption that the scores from these two measures are equivalent. Descriptively, FDCRSscores for children in the child care sample tend to be clustered around the lower-end of thescale while ITERS scores are more clustered at the upper end of the scale. We tested the
Ruzek et al. Page 10
Early Child Res Q. Author manuscript; available in PMC 2015 January 01.
NIH
-PA Author Manuscript
NIH
-PA Author Manuscript
NIH
-PA Author Manuscript

equivalence assumption by running separate regression models for children in center care(ITERS) and children in home-based care (FDCRS-results available from first author). Inhome-based care settings, a significant increase in Bayley scores is observed only forchildren in medium-quality care (versus low-quality care). In center care settings, Bayleyscores are significantly higher only for children in high-quality care (versus medium-qualitycare). In models where the quality scores are kept as continuous variables, coefficients forthe effect of child care quality on Bayley scores are both significantly positive and of asimilar magnitude. Finally, we ran a model identical to the final model in Table 4 thatincluded an indicator for whether childcare was assessed with the ITERS or FDCRS, toallow for the possibility of an instrument-based effect. Results from this model did notchange the significance or direction of the key treatment variables, nor was qualityassessment by ITERS/FDCRS associated with 24 month Bayley scores. We conclude thatour results are, in general, robust to the assumption of equivalence between the ITERS andFDCRS.
DiscussionIn this paper, we employed a nationally representative sample to examine the distribution ofthe quality of toddler care and its relation to cognitive performance at 24 months of age. Aswith prior work with preschool-age children, the results demonstrate that nonparent care isnow normative for a large fraction of U.S. toddlers, and that child care quality is related toearly cognitive development as well as to preschool language, academic, and socialdevelopment.
The descriptive analyses of the children’s child care indicated that almost half of 2-year-oldchildren in 2003 experienced routine nonparental care, which is consistent with estimatesfrom non-representative samples (NICHD ECCERN, 2006) as well as from earlierrepresentative samples such as the National Survey of American Families and the NationalHousehold Education Surveys Program. For those children in child care, about one-thirdwere cared for by relatives, another third by nonrelatives in home-based care, and the lastthird in child care centers. Toddlers in child care tended to experience between 30 and 35hours of care per week. The quality of center care was, on average, in the medium rangeaccording the ITERS (M = 4.2) and in the low-medium range according to the FDCRS (M =3.5), with 60% of toddlers attending a setting rated in the medium range. Consistent withprior reports (NICHD ECCRN, 2006), toddlers from low-income families were much lesslikely to be in child care, and if in care, experienced lower quality care on average in home-based but not center-based settings.
These findings provide a consistent, but more complete, picture of the child care experiencesof toddlers in the US. As in the Cost, Quality, and Outcomes Study (Helburn, 1995), theysuggest that the quality of toddler care tends to be somewhat lower than the quality ofpreschool care. This is not surprising as it is more expensive to provide high-quality infant/toddler care than preschool care (Helburn & Howes, 1996) given that infants and toddlersrequire more adult caregiving for routine care and more individual interactions to scaffoldearly learning and social development. Unlike the NICHD Study of Early Child Care(NICHD ECCRN, 2002), these findings suggest that quality of home-based care was lowerthan the quality of center-based care for 2-year-olds. This discrepancy is likely related todifferences in the samples and the quality measures. The NICHD study was not nationallyrepresentative, although both are cohort studies of children, albeit separated in time by 10years.
These results could be helpful to policy makers as they wrestle with questions of how best tohelp parents obtain child care for toddlers and create tracking mechanisms to promote higher
Ruzek et al. Page 11
Early Child Res Q. Author manuscript; available in PMC 2015 January 01.
NIH
-PA Author Manuscript
NIH
-PA Author Manuscript
NIH
-PA Author Manuscript

quality care (e.g., quality rating and improvement systems; Tout et al., 2010). Existing staterating systems include some measure of the quality of infant/toddler care provided; however,these are typically combined with the quality of preschool care in settings that provide carefor infants and preschoolers. It might be more helpful for parents if the quality of infant/toddler care was rated separately from the quality of the preschool care. This study alsoextends our understanding of toddler care by demonstrating associations between child carequality and cognitive skills at 24 months using a nationally representative sample. Comparedwith low-quality care, children had modestly to moderately higher cognitive scores inmedium-quality care (d = .17) and high-quality care (d = .38). These findings are generallyconsistent with those reported in previous studies with non-representative samples(Burchinal et al., 1996; Clarke-Stewart et al., 1994; NICHD ECCRN & Duncan, 2003;Schliecker, White, & Jacobs, 1991), and provide similar or somewhat larger effect sizes.Furthermore, in models where child care quality, type and amount of time spent in care wereconsidered, no evidence emerged that the type or amount of child care independentlypredicted cognitive skills at 24 months over and above child care quality. These findingsprovide further evidence that early cognitive skills are enhanced in higher-quality caresettings, even for children as young as two years of age.
Publicly-funded preschool programs are designed to help address poverty-basedachievement gaps, largely built on the assumption that exposure to high-quality care willimprove school readiness skills for children from low-income families. This study providessome information that can aid policymakers as they consider whether such policies mighthelp prevent the income achievement gap that is apparent by two years of age in the ECLS-B. Differences in cognitive scores by poverty status were small but statistically significant at9 months of age, but grew substantially to approximately half a standard deviation at 24months of age. High-quality child care at two years of age appears to convey similar benefitsacross the income specturm; we could not reject the hypothesis of equal impacts by povertystatus. However, since fewer low-income children were in medium- and high-quality care,increasing the proportion of low-income toddlers in medium- and high-quality care mayhelp reduce the income achievement gap.
A first potential limitation of this study is that overall scores from two different measures ofchild care quality were treated as equivalent. While the ITERS and FDCRS share much incommon, from the standpoint of their development as measures of child care quality, it isunclear the degree to which scores from the separate measures can be considered equivalent.To address this limitation, we ran a series of regression models for each type of careseparately, which supported the results from models that treated the scores as equivalent. Asecond limitation of this study is that while propensity score methods account for selectionon observed variables, the possibility of selection bias due to unobserved confounds stillexists. For this reason, it is important to be careful in interpreting the practical implicationsof this research, as the findings are not causal. Future studies might replicate and build onthe present analysis by focusing on non-cognitive outcomes. The Bayley measure ofcognitive development is highly reliable and valid but only measures one aspect of thedeveloping child. Ideally, we would be able to use other reliable and valid measures ofchildren’s behavioral outcomes. Such variables were recorded by the staffer administeringthe 24-month Bayley, and have been successfully analyzed by others (Morgan, Farkas,Hillemeier, and Maczuga, 2009).
Much of the research on whether the quality of early child care experiences matter forchildren’s cognitive skills development have focused on the pre-K period. The present studyaddressed this issue for 12–24-month-old children, and found that both medium- and high-quality child care are positively associated with the cognitive skills development of allchildren. No evidence was found to indicate that higher-quality child care was more
Ruzek et al. Page 12
Early Child Res Q. Author manuscript; available in PMC 2015 January 01.
NIH
-PA Author Manuscript
NIH
-PA Author Manuscript
NIH
-PA Author Manuscript

beneficial for low-income children than non-low-income children. However, the fact thatlow-income children were much less likely to experience medium- or high-quality care at 24months of age suggest that child care quality may play a role in widening the achievementgap between infancy and the preschool years. Public funding that increases the supply ofhigh-quality care for low-income children might therefore help narrow the cognitive skillsgap at two years of age.
Supplementary MaterialRefer to Web version on PubMed Central for supplementary material.
AcknowledgmentsWe are grateful to the Institute of Education Sciences (IES) for supporting this work through grantR305A090467-10 awarded to Principal Investigator George Farkas and Co-Principal Investigators MargaretBurchinal and Greg J. Duncan. The opinions expressed are those of the authors and do not represent views of theInstitute or the U.S. Department of Education. Research reported in this publication was also supported by theEunice Kennedy Shriver National Institute of Child Health & Human Development of the National Institutes ofHealth under Award Number P01HD065704. The content is solely the responsibility of the authors and does notnecessarily represent the official views of IES, the U.S. Department of Education, or the National Institutes ofHealth.
ReferencesBodrova, E.; Leong, D. Vygotskian perspectives on teaching and learning early literacy. In: Dickinson,
DK.; Neuman, SB., editors. Handbook of early literacy research. New York, NY: Guilford; 2006.
Bronfenbrenner, U.; Morris, PA. The bioecological model of human development. In: Damon, W.;Lerner, RM., editors. Handbook of child psychology, Vol. 1: Theoretical models of humandevelopment. 6. New York, NY: Wiley; 2006. p. 793-828.
Brooks–Gunn J, Han W, Waldfogel J. Maternal employment and child cognitive outcomes in the firstthree years of life: The NICHD Study of Early Child Care. Child Development. 2002; 73(4):1052–1072.10.1111/1467-8624.00457 [PubMed: 12146733]
Burchinal MR, Cryer D. Diversity, child care quality, and developmental outcomes. Early ChildhoodResearch Quarterly. 2003; 18:401–426.10.1016/j.ecresq.2003.09.003
Burchinal, M.; Kainz, K.; Cai, Y. How well do our measures of quality predict child outcomes? Ameta-analysis and coordinated analysis of data from large-scale studies of early childhood settings.In: Zaslow, M., editor. Quality measurement in early childhood settings. Baltimore, MD: Paul H.Brookes; 2011.
Burchinal MR, Nelson L. Family selection and child care experiences: implications for studies of childoutcomes. Early Childhood Research Quarterly. 2000; 15(3):385–411.10.1016/S0885-2006(00)00072-7
Burchinal MR, Roberts JE, Nabors LA, Bryant DM. Quality of center child care and infant cognitiveand language development. Child Development. 1996; 67(2):606–620.10.2307/1131835 [PubMed:8625731]
Burchinal M, Roberts JE, Zeisel SA, Hennon EA, Hooper S. Social risk and protective child,parenting, and child care factors in early elementary school years. Parenting: Science and Practice.2006; 6:79–113.10.1207/s15327922par0601_4
Camilli G, Vargas S, Ryan S, Barnett WS. Meta-analysis of the effects of early education interventionson cognitive and social development. Teachers College Record. 2010; 112(3):579–620.
Campbell FA, Pungello EP, Miller-Johnson S, Burchinal MR, Ramey C. The development of cognitiveand academic abilities: Growth curves from an early intervention educational experiment.Developmental Psychology. 2001; 37(2):231–242.10.1037/0012-1649.37.2.231 [PubMed:11269391]
Clarke-Stewart, A.; Gruber, CP.; Fitzgerald, LM. Children at home and in day care. Hillsdale, NJ:Erlbaum; 1994.
Ruzek et al. Page 13
Early Child Res Q. Author manuscript; available in PMC 2015 January 01.
NIH
-PA Author Manuscript
NIH
-PA Author Manuscript
NIH
-PA Author Manuscript

Dearing E, McCartney K, Taylor BA. Does higher quality early child care promote low-incomechildren’s math and reading achievement in middle childhood? Child Development. 2009; 80(5):1329–1349.10.1111/j.1467-8624.2009.01336.x [PubMed: 19765003]
Early DM, Burchinal MR. Early childhood care: relations with family characteristics and preferredcare characteristics. Early Childhood Research Quarterly. 2001; 16(4):475–497.10.1016/S0885-2006(01)00120-X
Flanagan KD, West J. Children born in 2001: First results from the base year of the Early ChildhoodLongitudinal Study, Birth Cohort (ECLS-B). Education Statistics Quarterly. 2005; 6(4)
Gamble WC, Ewing AR, Wilhelm MS. Parental perceptions of characteristics of nonparental childcare: Belief dimensions, family, and child correlates. Journal of Child and Family Studies. 2008;18(1):70–82.10.1007/s10826-008-9208-z
Gormley WT, Gayer T, Phillips D, Dawson B. The effects of universal pre-K on cognitivedevelopment. Developmental Psychology. 2005; 41(6):872–884.10.1037/0012-1649.41.6.872[PubMed: 16351334]
Han W, Waldfogel J, Brooks-Gunn J. The effects of early maternal employment on later cognitive andbehavioral outcomes. Journal of Marriage and Family. 2001; 63(2):336–354.10.1111/j.1741-3737.2001.00336.x
Harms, T.; Cryer, D.; Clifford, RM. Infant/toddler Environment Rating Scale. New York, NY:Teachers College Press; 1990.
Helburn, S., editor. Cost, quality, and child outcomes in child care centers: Technical Report. Denver:Department of Economics, Center for Research in Economic and Social Policy, University ofColorado at Denver; 1995.
Helburn SW, Howes C. Child care cost and quality. The Future of Children. 1996; 6(2):62–82.[PubMed: 8972128]
Howes C, Burchinal M, Pianta R, Bryant D, Early DM, Clifford R. Ready to learn? Children’s pre-academic achievement in pre-kindergarten programs. Early Childhood Research Quarterly. 2008;23:27–50.10.1016/j.ecresq.2007.05.002
Imbens G. The role of propensity score in estimating dose-response in observational studies for causaleffect. Biometrika. 2000; 3:706–710.10.1093/biomet/87.3.706
Imbens GW, Wooldridge JM. Recent developments in the econometrics of program evaluation.Journal of Economic Literature. 2009; 47(1):5–86.10.1257/jel.47.1.5
Kontos S, Howes C, Galinsky E. Does training make a difference to quality in family child care? EarlyChildhood Research Quarterly. 1996; 11(4):427–445.10.1016/S0885-2006(96)90016-2
Laughlin, L. Current Population Reports. Washington, DC: U.S. Census Bureau; 2010. Who’s mindingthe kids?: Child care arrangements, Spring 2005/Summer 2006; p. 70-121.Retrieved from: http://www.census.gov/prod/2010pubs/p70-121.pdf
Loeb S, Bridges M, Bassok D, Fuller B, Rumberger RW. How much is too much? The influence ofpreschool centers on children’s social and cognitive development. Economics of EducationReview. 2007; 26(1):52–66.10.1016/j.econedurev.2005.11.005
Love JM, Kisker EE, Ross C, Raikes H, Constantine J, Boller K, Vogel C. The Effectiveness of EarlyHead Start for 3-Year-Old Children and Their Parents: Lessons for Policy and Programs.Developmental Psychology. 2005; 41(6):885–901.10.1037/0012-1649.41.6.885 [PubMed:16351335]
Mashburn AJ, Pianta RC, Hamre BK, Downer JT, Barbarin OA, Bryant D, Howes C. Measures ofclassroom quality in prekindergarten and children’s development of academic, language, andsocial skills. Child Development. 2008; 79(3):732–749.10.1111/j.1467-8624.2008.01154.x[PubMed: 18489424]
McCormick M, Brooks-Gunn J, Buka S, Goldman J, Yu J, Salganik M, Patrick H. Early interventionin low birth weight premature infants: Results at 18 years of age for the Infant Health andDevelopment Program. Pediatrics. 2006; 117:771–780.10.1542/peds.2005-1316 [PubMed:16510657]
Morgan PL, Farkas G, Hillemeier MM, Maczuga S. Risk factors for learning-related behaviorproblems at 24 months of age: population-based estimates. Journal of abnormal child psychology.2009; 37(3):401–413.10.1007/s10802-008-9279-8 [PubMed: 19057886]
Ruzek et al. Page 14
Early Child Res Q. Author manuscript; available in PMC 2015 January 01.
NIH
-PA Author Manuscript
NIH
-PA Author Manuscript
NIH
-PA Author Manuscript

NICHD Early Child Care Research Network. The relation of child care to cognitive and languagedevelopment. Child Development. 2000a; 71:960–980.10.2307/1132337 [PubMed: 11016559]
NICHD Early Child Care Research Network. Characteristics and quality of child care for toddlers andpreschoolers. Applied Developmental Science. 2000b; 4(3):116–35.10.1207/S1532480XADS0403_2
NICHD Early Child Care Research Network. Early child care and children’s development prior toschool entry: Results from the NICHD Study of Early Child Care. American Educational ResearchJournal. 2002; 39:133–164.10.2307/3202474
NICHD Early Child Care Research Network. Early child care and children’s development in theprimary grades: Follow-up results from the NICHD Study of Early Child care. AmericanEducational Research Journal. 2005; 42(3):537–570.10.2307/3700462
NICHD Early Child Care Research Network. Child-care effect sizes for the NICHD study of earlychild care and youth development. American Psychologist. 2006; 61(2):99–116.10.1037/0003-066X.61.2.99 [PubMed: 16478355]
Duncan G. NICHD Early Child Care Research Network. Modeling the impacts of child care quality onchildren’s preschool cognitive development. Child Development. 2003; 74(5):1454–1475.10.1111/1467-8624.00617 [PubMed: 14552408]
Peisner-Feinberg E, Burchinal M. Relations between preschool children’s child-care experiences andconcurrent development: The cost, quality, and outcomes study. Merrill-Palmer Quarterly. 1997;43:451–477.
Peisner-Feinberg ES, Burchinal MR, Clifford RM, Culkin ML, Howes C, Kagan SL, Yazejian N. Therelation of preschool childcare quality to children’s cognitive and social developmental trajectoriesthrough second grade. Child Development. 2001; 72(5):1534–1553.10.1111/1467-8624.00364[PubMed: 11699686]
Phillipsen L, Burchinal MR, Howes C, Cryer D. The prediction of process quality from structuralfeatures of child care. Early Childhood Research Quarterly. 1997; 12(3):281–303.10.1016/S0885-2006(97)90004-1
Piaget, J. The Child’s Conception of the World. Lanham, MD: Rowman & Littlefield; 2007.
Pianta RC, Barnett WS, Burchinal M, Thornburg KR. The effects of preschool education: What weknow, how public policy is or is not aligned with the evidence base, and what we need to know.Psychological Science in the Public Interest. 2009; 10(2):49–88.10.1177/1529100610381908
Reynolds AJ, Temple JA, Robertson DL, Mann EA. Age 21 cost-benefit analysis of the Title IChicago child-parent centers. Educational Evaluation and Policy Analysis. 2002; 24(4):267–303.10.3102/01623737024004267
Rosenbaum PR, Rubin DB. The central role of the propensity score in observational studies for causaleffects. Biometrika. 1983; 70(1):41–55.10.1093/biomet/70.1.41
Rutter M. ERA Study Team. Developmental catch-up, and deficit, following adoption after severeglobal early privation. The Journal of Child Psychology and Psychiatry and Allied Disciplines.1998; 39(4):465–476.10.1111/1469-7610.00343
Schliecker E, White DR, Jacobs E. The role of day care quality in the prediction of children’svocabulary. Canadian Journal of Behavioural Science/Revue canadienne des sciences ducomportement. 1991; 23(1):12.10.1037/h0078960
Tout, K.; Starr, R.; Soli, M.; Moodie, S.; Kirby, G.; Boller, K. The Child Care Quality Rating System(QRS) assessment: Compendium of quality rating systems and evaluations. Washington, DC:Child Trends; 2010. Retrieved from http://www.acf.hhs.gov/sites/default/files/opre/qrs_compendium_final.pdf
U.S. Administration for Children and Families, Office of Planning, Research & Evaluation. FamilyChild Care Environment Rating Scale-Revised Edition (FCCERS-R), 2007. 2013. Retrieved fromhttp://archive.acf.hhs.gov/programs/opre/ehs/perf_measures/reports/resources_measuring/res_meas_impk.html
Vandell D. Early child care: The known and the unknown. Merrill-Palmer Quarterly. 2004; 50(3):387–414.
Ruzek et al. Page 15
Early Child Res Q. Author manuscript; available in PMC 2015 January 01.
NIH
-PA Author Manuscript
NIH
-PA Author Manuscript
NIH
-PA Author Manuscript

Votruba-Drzal E, Coley RL, Chase-Lansdale PL. Child care and low-income children’s development:Direct and moderated effects. Child Development. 2004; 75(1):296–312.10.1111/j.1467-8624.2004.00670.x [PubMed: 15015691]
Vygotsky, L. Mind in Society. Cambridge, MA: Harvard University Press; 1978.
Ruzek et al. Page 16
Early Child Res Q. Author manuscript; available in PMC 2015 January 01.
NIH
-PA Author Manuscript
NIH
-PA Author Manuscript
NIH
-PA Author Manuscript

Highlights
• The quantity, type, and quality of child care are reported on for U.S. toddlers in2003.
• Low income children were in lower quality care than non-low income children.
• Propensity score adjustment is used to account for parental selection into childcare.
• Quality of child care is significantly associated with cognitive skills at 24-months.
• Increasing quality of care for low income children critical to closing cognitiveskills gap.
Ruzek et al. Page 17
Early Child Res Q. Author manuscript; available in PMC 2015 January 01.
NIH
-PA Author Manuscript
NIH
-PA Author Manuscript
NIH
-PA Author Manuscript

NIH
-PA Author Manuscript
NIH
-PA Author Manuscript
NIH
-PA Author Manuscript
Ruzek et al. Page 18
Table 1
Family and Child Characteristics (N=10200, unless otherwise noted)
Variable Mean (SD) or Percentage
Cognitive Development
Bayley Mental Score 9 months 76.69 (9.79)
9-month Low Income/Non-low Income Difference in Bayley Scores .63**
F(1, 10200) = 10.51
Bayley Mental Score 24 months (N = 8900) 127.09 (10.65)
24-month Low Income/Non-low Income Difference in Bayley Scores 5.02***
F(1, 8900) = 525.30
Child and Family Characteristics
Family Income (>1.85 poverty threshold) 51.51%
English Spoken at Home 81.17%
Parent-reported Home Score 12.30 (2.45)
ECLS-B Observed HOME Score 10.58 (1.28)
Single Mom 19.57%
Maternal Sensitivity (NCATS) 34.64 (4.17)
Maternal Education (N = 8950)
Less than High School Diploma 17.78%
High School Diplomaa 30.94%
Some College 26.57%
Bachelor’s Degree or Higher 24.71%
Child Characteristics
Black 13.77%
Hispanic 25.58%
Whitea 53.38%
Other 7.27%
Male 51.11%
Child’s Age in Months at 9 Month Data Collection 10.48 (1.95)
Hours of Care at 9 Months 15.61 (20.03)
Maternal Care at 9 Months 49.92%
First-born Status 40.71%
Number of Siblings .99 (1.11)
Low Birth Weight 6.21%
Very Low Birth Weight 1.29%
Note.
aOmitted category in multinomial logistic regression.
*p < 0.05,
**p < 0.01,
***p < 0.001.
Early Child Res Q. Author manuscript; available in PMC 2015 January 01.

NIH
-PA Author Manuscript
NIH
-PA Author Manuscript
NIH
-PA Author Manuscript
Ruzek et al. Page 19
All variables were measured at 9 months unless otherwise noted. Means were weighted using ECLS-B weight W1C0 for 9 month variables andW2C0 for 24-month Bayley score and maternal education. Ns are rounded to the nearest 50.
Early Child Res Q. Author manuscript; available in PMC 2015 January 01.

NIH
-PA Author Manuscript
NIH
-PA Author Manuscript
NIH
-PA Author Manuscript
Ruzek et al. Page 20
Tabl
e 2
Tod
dler
Car
e C
hara
cter
istic
s at
24
Mon
ths
Ove
rall
Low
Inc
ome
Mid
dle
Inco
me
Low
/Mid
dle
Inco
me
Dif
fere
nces
Typ
e of
Car
eN
8950
4200
4750
Pa
rent
al c
are
only
51%
58%
45%
F(1
, 895
0)=
86.
38**
*
R
elat
ive
Car
e18
%20
%17
%F
(1, 8
950)
= 6
.07*
N
on-R
elat
ive
Car
e15
%10
%19
%F
(1, 8
950)
= 8
0.61
***
C
ente
r C
are
16%
12%
19%
F(1
, 895
0)=
46.
07**
*
Hrs
/Wee
k in
Any
Non
pare
ntal
Car
en
4450
1800
2650
F(1
, 445
0)=
3.8
932
.36
(15.
36)
33.0
5 (1
5.37
)31
.90
(15.
34)
Hrs
/Wee
k in
Rel
ativ
e C
are
n17
5085
090
0F
(1, 1
750)
= .7
531
.65
(16.
17)
31.9
9 (1
5.85
)31
.32
(16.
47)
Hrs
/Wee
k in
Non
-Rel
ativ
e C
are
n13
0040
090
0F
(1, 1
300)
= 1
.59
31.9
3 (1
4.79
)30
.92
(14.
16)
32.3
8 (1
5.06
)
Hrs
/Wee
k in
Cen
ter
Car
en
1350
550
800
F(1
, 135
0)=
19.
02**
*33
.59
(14.
84)
36.5
9 (1
4.36
)31
.96
(14.
85)
Chi
ld C
are
Qua
litya
n14
0060
080
0
χ2 (
1, N
= 1
400)
=38
.17*
**
Low
Qua
lity
Obs
erve
d C
are
(1–3
)26
%43
%16
%
M
ediu
m Q
ualit
y O
bser
ved
Car
e (>
3–5)
61%
48%
69%
H
igh
Qua
lity
Obs
erve
d C
are
(>5–
7)13
%9%
15%
C
ente
r C
are
(IT
ER
S T
otal
)n
600
250
350
F(1
, 600
)= 1
.80
4.24
(.9
9)4.
16 (
1.08
)4.
29 (
.93)
H
ome-
base
d C
are
(FD
CR
S T
otal
)n
800
350
450
F(1
, 800
)= 1
19.9
6***
3.47
(1.
02)
2.96
(.9
9)3.
82 (
.88)
Not
e.
* p <
0.0
5,
**p
< 0
.01,
*** p
< 0
.001
.
Wei
ghte
d M
eans
usi
ng E
CL
S-B
wei
ght W
2C0
for
vari
able
s w
ith N
of
8900
and
W22
P0
for
obse
rved
qua
lity
vari
able
s. N
s w
ere
roun
ded
to th
e ne
ares
t 50.
Early Child Res Q. Author manuscript; available in PMC 2015 January 01.

NIH
-PA Author Manuscript
NIH
-PA Author Manuscript
NIH
-PA Author Manuscript
Ruzek et al. Page 21a Q
ualit
y w
as m
easu
red
by th
e sc
ore
from
the
ITE
RS
(cen
ter
care
) or
FD
CR
S (f
amily
day
car
e).
Early Child Res Q. Author manuscript; available in PMC 2015 January 01.

NIH
-PA Author Manuscript
NIH
-PA Author Manuscript
NIH
-PA Author Manuscript
Ruzek et al. Page 22
Table 3
Child Care Sample Regressions Predicting Bayley Mental Scale at 24 Mos. (effect size estimates)
(1) Child Care Sample WeightB (SE)
(2) Propensity WeightB (SE)
Low Quality <=35 Hours −0.25* (0.10) −0.10 (0.09)
Low Quality >35 Hours −0.27** (0.10) −0.19* (0.09)
Medium Quality <=35 Hours Reference Reference
Medium Quality >35 Hours 0.14 (0.08) 0.15* (0.08)
High Quality <=35 Hours 0.08 (0.12) 0.24 (0.14)
High Quality >35 Hours 0.08 (0.12) 0.33** (0.11)
Center Care 24 Mos. −0.19 (0.07) 0.04 (0.07)
Medium Income 0.04 (0.08) −0.03 (0.09)
Main effect of quality tests
Low vs. medium −3.93*** (0.89) −3.26*** (0.78)
Medium vs. high 0.14 (0.94) 2.29* (0.96)
Low vs. high −3.47** (1.18) −4.71*** (1.07)
Main effect of quantity −0.38 (0.72) −0.53 (0.71)
Quality X Quantity Interactions ns ns
Constant −0.07*** (0.16) −0.02*** (0.17)
N 1350 1350
R2 0.26 0.29
Note.
*p < 0.05,
**p < 0.01,
***p < 0.001.
Regression 1 was weighted using the 24 month child care weight W2C2P0 and standard errors were calculated using the appropriate PSU andstratum variables. Regression 2 was weighted by the inverse of the propensity that a child would be in the actual care category they were observedto be in. Controls include 9-month Bayley, child’s ethnicity, gender, and age, Mother’s education, maternal sensitivity (NCATS), family structure(whether single mother), whether low or very low birth weight, whether home language is English, whether first born, and number of siblings. Nswere rounded to the nearest 50.
Early Child Res Q. Author manuscript; available in PMC 2015 January 01.

NIH
-PA Author Manuscript
NIH
-PA Author Manuscript
NIH
-PA Author Manuscript
Ruzek et al. Page 23
Table 4
Propensity Score Regressions Predicting Bayley Cognitive Score at 24 Months by Quality and Type of ChildCare (effect size estimates)
(1) Unweightedβ (SE) (2) ECLS-B Wave 2 Weight (3) Propensity Score Weighted
Toddler Care Groups
Low quality care −0.25*** (0.06) −0.29*** (0.06) −0.17* (0.08)
Medium quality care Reference Reference Reference
High quality care 0.13 (0.07) 0.07 (0.08) 0.38*** (0.11)
Exclusive parental care −0.16*** (0.04) −0.17*** (0.04) −0.05 (0.06)
In child care – quality not observed −0.11** (0.04) −0.16*** (0.04) 0.01 (0.06)
Child Covariates
Above 1.85 poverty threshold 0.09*** (0.02) 0.10** (0.03) 0.01 (0.06)
9m cognitive score 0.32*** (0.02) 0.32*** (0.03) 0.32*** (0.04)
Race/ethnciiy (reference: white)
Black −0.29*** (0.03) −0.31*** (0.04) −0.26*** (0.07)
Hispanic −0.23*** (0.03) −0.23*** (0.04) −0.12 (0.08)
Other −0.07** (0.03) −0.14*** (0.04) 0.03 (0.08)
Male −0.31*** (0.02) −0.31*** (0.03) −0.36*** (0.05)
Birth Weight (reference not low)
Low birth weight −0.19*** (0.03) −0.20*** (0.03) −0.08 (0.06)
Very low birth weight −0.47*** (0.04) −0.48*** (0.05) −0.50*** (0.14)
Age at Bayley testing −0.19*** (0.02) −0.19*** (0.03) −0.20*** (0.03)
First born child −0.04 (0.03) −0.02 (0.04) −0.05 (0.07)
Family Covariates
Single mother −0.02 (0.03) −0.04 (0.04) −0.21** (0.08)
Maternal care at 9 months −0.04 (0.02) −0.08** (0.03) −0.05 (0.05)
English as Home Language 0.23*** (0.03) 0.27*** (0.04) 0.30** (0.10)
Number of siblings −0.07*** (0.01) −0.04* (0.20) −0.06 (0.03)
Maternal Ed (reference HS Diploma)
Less than HS −0.06 (0.03) −0.07 (0.04) −0.26** (0.09)
Some College 0.07** (0.03) 0.06 (0.03) 0.02 (0.06)
Bachelor’s or Higher 0.31*** (0.03) 0.29*** (0.04) 0.18* (0.07)
Intercept 1.24*** (0.09) 1.26*** (0.15) 0.14 (0.12)
N 8350 8350 8350
R2 .246 .218 .294
Note. Standard errors in parentheses.
*p < 0.05,
Early Child Res Q. Author manuscript; available in PMC 2015 January 01.

NIH
-PA Author Manuscript
NIH
-PA Author Manuscript
NIH
-PA Author Manuscript
Ruzek et al. Page 24
**p < 0.01,
***p < 0.001.
All covariates were measured at nine months. The dependent variable, prior Bayley score, child’s age, and number of siblings are z-scored. Anindicator variable for whether a child was missing the Bayley at 9 months was included. ECLS-B weight W2C0 was used in regression 2. Tests forinteractions between care type and poverty status were non-significant, as were tests for interactions between care type and quality (low, medium,and high). Ns were rounded to the nearest 50.
Early Child Res Q. Author manuscript; available in PMC 2015 January 01.


![North Carolina register [serial] - NC.gov](https://static.fdokumen.com/doc/165x107/6327f539e491bcb36c0b8a23/north-carolina-register-serial-ncgov.jpg)

