Tilburg University The human right of free access to public ...
Upload
khangminh22Category
view
0download
0
Electronic medical records for discovery research in rheumatoidarthritis
Katherine P. Liao, MD1, Tianxi Cai, ScD2, Vivian Gainer, MS3, Sergey Goryachev, MS4, QingZeng-Treitler, PhD5, Soumya Raychaudhuri, MD, PhD1,6, Pete Szolovits, PhD7, SusanneChurchill, PhD4, Shawn Murphy, MD, PhD8, Isaac Kohane, MD, PhD9, Elizabeth W. Karlson,MD1, and Robert M. Plenge, MD, PhD1,6
1Division of Rheumatology, Immunology and Allergy, Brigham and Women's Hospital, Boston,MA2Department of Biostatistics, Harvard School of Public Health, Boston, MA3Partners Research Computing, Partners HealthCare System, Boston, MA4Information Systems, Partners HealthCare System, Boston, MA5Department of Biomedical Informatics, University of Utah, Salt Lake City, UT6The Broad Institute, Cambridge, MA7 Computer Science and Artificial Intelligence Laboratory, Massachusetts Institute of Technology,Cambridge, MA8Department of Neurology, Massachusetts General Hospital, Boston, MA9Department of Medicine, Brigham and Women's Hospital, Boston, MA
AbstractObjective—Electronic medical records (EMRs) are a rich data source for discovery research butare underutilized due to the difficulty of extracting highly accurate clinical data. We assessedwhether a classification algorithm incorporating narrative EMR data (typed physician notes), moreaccurately classifies subjects with rheumatoid arthritis (RA) compared to an algorithm usingcodified EMR data alone.
Methods—Subjects with ≥1 ICD9 RA code (714.xx) or who had anti-CCP checked in the EMRof two large academic centers were included into an ‘RA Mart’ (n=29,432). For all 29,432subjects, we extracted narrative (using natural language processing) and codified RA clinicalinformation. In a training set of 96 RA and 404 non-RA cases from the RA Mart classified bymedical record review, we used narrative and codified data to develop classification algorithmsusing logistic regression. These algorithms were applied to the entire RA Mart. We calculated andcompared the positive predictive value (PPV) of these algorithms by reviewing records of anadditional 400 subjects classified as RA by the algorithms.
Results—A complete algorithm (narrative and codified data) classified RA subjects with asignificantly higher PPV of 94%, than an algorithm with codified data alone (PPV 88%).Characteristics of the RA cohort identified by the complete algorithm were comparable to existingRA cohorts (80% female, 63% anti-CCP+, 59% erosion+).
© 2010 American College of RheumatologyCorresponding author: Robert M. Plenge, MD, PhD Division of Rheumatology, Immunology and Allergy Brigham and Women'sHospital 77 Avenue Louis Pasteur, Suite 168 Boston, MA 02115 tel: 617-525-4451 fax: 617-525-4488 [email protected].
NIH Public AccessAuthor ManuscriptArthritis Care Res (Hoboken). Author manuscript; available in PMC 2011 June 23.
Published in final edited form as:Arthritis Care Res (Hoboken). 2010 August ; 62(8): 1120–1127. doi:10.1002/acr.20184.
NIH
-PA Author Manuscript
NIH
-PA Author Manuscript
NIH
-PA Author Manuscript
brought to you by COREView metadata, citation and similar papers at core.ac.uk
provided by DSpace@MIT
Conclusion—We demonstrate the ability to utilize complete EMR data to define an RA cohortwith a PPV of 94%, which was superior to an algorithm using codified data alone.
Electronic medical records (EMRs) used as part of routine clinical care, have great potentialto serve as a rich resource of data for clinical and translational research. There are two typesof EMR data: ‘codified’ (e.g., entered in a structured format) and ‘narrative’ (e.g., free-formtyped text in physician notes). While the exact content will depend on an institutions’ EMR,codified EMR data often include basic information such as age, demographics, billing codes,and laboratory results. The content of narrative data, which often consists of typedinformation within physician notes, is usually broader in scope, providing information on apatient's chief complaint, symptoms, comorbidities, medications, physical exam, and thephysician's impression and plan (1). The ability to tap into this treasure trove of clinicalinformation has widespread appeal – from biologists who link EMR with biospecimen data(2) to epidemiologists who link codified medical record data with outcomes of interest (3).However, EMR clinical data have been underutilized for discovery research because ofconcerns about data accuracy and validity.
Several studies have used codified EMR data – but not the complete EMR consisting of bothnarrative and codified data – to classify whether or not a patient has rheumatoid arthritis(RA) (3-7). In one study, at least 3 physician diagnoses of RA according to the InternationalClassification of Disease, 9th Revision (ICD9) was used to identify RA subjects as thismethod resulted in RA estimates similar to population based studies (8). A 1994 study fromthe Mayo clinic found that computerized diagnostic codes for RA had a sensitivity of 89%,but a positive predictive value (PPV) of only 57% (4). In the Veterans Administration (VA)database, one ICD9 code for RA was found to be 100% sensitive, but not very specific oraccurate (specificity of 55%, PPV of 66%) (5). Addition of a prescription for a diseasemodifying anti-rheumatic drug (DMARD) increased PPV to 81%, but with a decrease insensitivity to 85%. These rates of disease misclassification can have a profound impact onresearch studies that require precise disease definitions.
More recently, computational methods have been developed to extract clinical data enteredin typed format from the narrative EMR using a systematic approach. The conventionalmethod of extracting narrative information for clinical research, which requires researchersto manually review charts, is labor intensive and inefficient. In contrast, natural languageprocessing (NLP) represents an automated method of chart review by processing typed textinto meaningful components based on a set of rules. To use NLP, a concept is defined thatcorresponds to a specific clinical variable of interest (e.g. radiographic erosions). Clinicalexperts developed lists of terms to be used for each NLP query. Terms for erosions mightinclude: ‘presence of erosions on radiographs,’ ‘erosions consistent with RA,’ or ’erosionpositive.’ NLP can also incorporate abbreviations (e.g. ‘erosion+’, misspellings-‘radeograhic erosions’), and negation terms (e.g. ’absence of erosions’). NLP has beenapplied to a limited number of biomedical settings – for example, mandatory reporting ofnotifiable diseases (9-11), definition of co-morbid conditions (12-14) and medications(15,16), and identification of adverse events (17,18) – but not yet for classification ofdiseases in an EMR.
In the current study, our objective was to classify RA subjects in our EMR with highpositive predictive value. We assessed whether the combination of narrative EMR data(obtained using NLP) and codified EMR data (ICD9 codes, medications, laboratory testresults), together with robust analytical methods, can more accurately classify subjects withRA than the standard approach of using codified data alone.
Liao et al. Page 2
Arthritis Care Res (Hoboken). Author manuscript; available in PMC 2011 June 23.
NIH
-PA Author Manuscript
NIH
-PA Author Manuscript
NIH
-PA Author Manuscript
PATIENTS AND METHODSAn overview of our approach is outlined in Figure 1. Starting with the complete EMR(narrative + codified data), we : (1) created an RA database (RA Mart) of all possible RApatients; (2) randomly selected 500 subjects from the RA Mart for medical record review todevelop a training set of RA and non-RA cases; (3) developed and trained 3 classificationalgorithms on the training set; (4) applied the 3 classification algorithms to the RA Mart toobtain the predicted RA cases; and (5) validated the classification algorithm by performingmedical record reviews on 400 of the predicted RA cases, a validation set, to confirm RAstatus to determine the positive predictive value (PPV). Steps 3-5 were conducted for eachalgorithm: narrative + codified EMR data (complete), codified EMR data, narrative onlyEMR data.
Data sourceWe studied the Partners HealthCare EMR, which is utilized by two large hospitals, Brighamand Women's Hospital (BWH) and Massachusetts General Hospital (MGH), that combined,care for approximately 4 million patients in the Boston metropolitan area (Massachusetts,USA). The EMR began on October 1, 1996 for BWH and October 3, 1994 for MGH. Tobuild an initial database of potential RA subjects (‘RA Mart’), we selected all subjects with≥1 ICD9 code for RA and related diseases (714.xx) or subjects who had been tested forantibodies to cyclic citrullinated peptide (anti-CCP) (Figure 1). Subjects who were deceasedor age< 18 at the time of the RA Mart creation (June 5, 2008) were excluded. In total 29,432subjects had at least one ICD9 code for RA (714.xx) (n=25,830) or had been tested for anti-CCP (n=3,602) (4,283 subjects had at least one ICD9 code for RA and had anti-CCPchecked). The Partners Institutional Review Board approved all aspects of this study.
Codified EMR dataWe used the following codified data in our analysis: ICD9 codes, electronic prescriptions,and anti-CCP and rheumatoid factor (RF) laboratory values. The ICD9 codes included RAand related diseases 714.xx (excluding juvenile idiopathic arthritis/juvenile rheumatoidarthritis (JRA) codes), systemic lupus erythematosus (SLE) 710.0, psoriatic arthritis (PsA)696, and JRA 714.3x (abbreviated as RA ICD9, PsA ICD9, SLE ICD9, and JRA ICD9).Because a single visit could result in multiple tests and notes, leading to multiple codes forthe same day, we eliminated codes that occurred less than one week after a prior code. In ouranalysis, RA ICD9 was analyzed in two forms: (1) number of RA ICD9 codes for eachsubject at least one week apart (RA ICD9) and (2) number of normalized RA ICD9 codeswhich is the natural log of the number RA ICD9 codes for each subject at least one weekapart. We determined which subjects were RF and anti-CCP positive according to thecutoffs at each hospital laboratory. The presence of a coded medication signifies that apatient was prescribed the medication by a physician using a computerized prescriptionprogram embedded within our EMR or had the medication entered onto a medication listmaintained by a physician. The presence of a coded medication does not signify that themedication was actually filled as patients can take prescriptions to any pharmacy. The codedmedications assessed in this study included the disease modifying anti-rheumaticmedications (DMARDs): methotrexate, azathioprine, leflunomide, sulfasalazine,hydroxychloroquine, penicillamine, cyclosporine, and gold. Biologic agents included theanti-tumor necrosis factors (anti-TNF): infliximab and etanercept, and other agents includingabatacept, rituximab and anakinra. Adalimumab was not available as coded data in oursystem. To provide an index of medical care utilization, we assessed the number of ‘facts’,which is related to the number of medical entries a subject has in the EMR. Examples of afact include: a physician visit, a visit to the laboratory for a blood draw, a visit to radiologyfor an X-ray.
Liao et al. Page 3
Arthritis Care Res (Hoboken). Author manuscript; available in PMC 2011 June 23.
NIH
-PA Author Manuscript
NIH
-PA Author Manuscript
NIH
-PA Author Manuscript
Narrative EMR data and natural language processing (NLP)We used five types of notes to extract information from narrative data: health care providernotes, radiology reports, pathology reports, discharge summaries, and operative reports. Weutilized natural language processing (NLP) to extract clinical variables from the narrativedata entered in a typed format (no scanned hand-written notes were used). We used theHealth Information Text Extraction (HITex) system (19) to extract the clinical informationfrom narrative text. HITEx is an open source NLP tool written in Java and built on theGeneral Architecture for Text Engineering (GATE) framework (20). The NLP applicationdetermines the structure of unstructured text records and outputs an annotated documenttagging variables of interest (further details provided in Zeng et al., 2006 (19)).
The variables included broad concept terms such as disease diagnoses (RA, SLE, PsA,JRA), medications (listed above, with the addition of adalimumab), laboratory data (RF,anti-CCP, the term seropositive) and radiology findings of erosions on x-rays. We used theHealth Information Text Extraction (HITEx) system (19) to extract clinical information fromnarrative text. We extracted the variables mentioned above from the narrative data andcreated coded NLP variables for the number of mentions per subject as well as dichotomousvariables for each disease diagnosis, medication, laboratory test result, and erosions on x-rays. To account for variability in language usage, a variety of specific phrases can bedefined which is then collapsed into a single concept term for analyses. The clinicians on theteam developed lists of terms to be used for each NLP query. Further analysis wasperformed to determine positive or negative variables. For example, a patient was flagged asCCP positive by NLP if terms were found in their records such as ‘anti-CCP+’, ‘CCPpositive RA.’ For RF, anti-CCP, seropositive and erosions, a negation finding algorithm wasused to distinguish subjects who were positive or negative for the variable. For example, thealgorithm could distinguish a subject who was anti-CCP positive vs. anti-CCP negative.
Two reviewers (KPL and RMP) assessed the precision of select NLP concepts: anti-CCPpositive, RF positive, seropositive, methotrexate and etanercept. For each concept, onesentence containing the concept was selected from each of 150 randomly selected subjectswith records containing the concept. The reviewers assessed whether the concept extractionwas correctly described in the context of the sentence. We assessed two categories of NLPconcepts. The first assessment for precision identifies whether a concept was identifiedappropriately from the physician note within a specific sentence. Concepts in this groupinclude disease diagnoses and medications. A patient was scored as ‘correct’ formethotrexate by NLP if the term methotrexate was present in the sentence extracted fromthe medical record. This includes instances where subjects were prescribed the medication,the medication was held, contemplated or if the subject had taken the medication in the past.The second assessment for precision requires that the patient have a positive result. Thispertains to the concepts RF, anti-CCP, seropositive, and erosions. We scored the NLP ascorrect for ‘RF positive’ only if the patient was also found to be RF positive on review fromthe sentence extracted from the medical record. We scored NLP as incorrect if RF wasmentioned with no evidence that the patient was RF positive (RFpos) in the sentence. Anexample of how precision (with respect to positive predictive value) was calculated asfollows:
Precision= (# sentences RFpos by NLP and confirmed as RFpos on review)/(#sentencesRFpos by NLP) The precision of NLP concepts was high: erosions, 88% (95% CI: 84, 91%);seropositive, 96% (95% CI: 95, 97%); CCP+, 98.7% (95% CI: 98, 99%); RF+, 99.3% (95%CI: 99.1, 99.4%); methotrexate, 100%; and etanercept, 100%.
Liao et al. Page 4
Arthritis Care Res (Hoboken). Author manuscript; available in PMC 2011 June 23.
NIH
-PA Author Manuscript
NIH
-PA Author Manuscript
NIH
-PA Author Manuscript
Training set of 500 subjectsWe established a training set of 500 subjects randomly selected from the RA Mart formedical record review. To establish the gold standard diagnosis, two rheumatologists (KPLand RMP) reviewed the medical records for the presence of the 1987 American College ofRheumatology Classification Criteria for RA (21) and classified subjects as definite,possible/probable and not RA. Definite RA was defined as subjects who had arheumatologists’ diagnosis of RA and supporting clinical data such as records describingsynovitis, erosions, or greater than one hour of morning stiffness. Possible RA was definedas subjects with persistent inflammatory arthritis with RA in the differential diagnosis by aphysician. Subjects with a diagnosis of RA by a physician, but insufficient supportinginformation of clinical signs and symptoms of the disease, were also classified as possibleRA. Finally, subjects with an alternate rheumatologic diagnosis or whose diagnosis wasunclear were considered to not have RA.
For our training set, subjects classified as definite RA were considered ‘RA cases’, whilesubjects classified as possible and as not having RA were classified as ‘controls’. Eighty-onepercent of RA cases had sufficient information from the EMR to fulfill the 1987 ACRClassification Criteria for RA (21). This is consistent with the published specificity of the1987 ACR criteria which ranges from 80-90% when compared to the gold-standard ofrheumatologists’ diagnosis of RA (21,22). Both RMP and KPL reviewed the same 20subjects to assess percent agreement, and were in 100% agreement on the final diagnosis.
Classification algorithm: selecting informative variables and assigning parametersWe used penalized logistic regression to develop a classification algorithm to predict theprobability of having RA (23,24). To avoid over-fitting the model, we used the adaptiveLASSO procedure which simultaneously identifies influential variables and provides stableestimates of the model parameters (25). The optimal penalty parameter was determinedbased on Bayes’ Information Criterion (BIC). We developed three different algorithms using(i) codified EMR variables only; (ii) narrative EMR variables only; and (iii) completevariables (narrative + codified). All three models were adjusted for age and gender and allpredictors were standardized to have unit variance. The predicted probabilities based onthese models were used to classify subjects as having RA.
We selected the threshold probability value for classifying RA by setting the specificitylevel at 97% for all 3 algorithms. Subjects whose predicted probability exceeds the thresholdvalue were classified as having RA, denoted by Alg. To assess the overall accuracy of thesealgorithms in classifying RA with the training data and to estimate the threshold value forAlg, we used three-fold cross-validation repeated 50 times to correct for potential over-fitting bias. Furthermore, we used the bootstrap method to estimate the standard error andobtain confidence intervals for the accuracy measures. The predictive accuracy of thealgorithm to classify RA vs. non-RA was subsequently validated using a separate validationset.
Validation of classification algorithm and assessment of sensitivity, specificity and PPVOnce the classification algorithm was established, we applied it to the remaining RA Martand assigned a probability of RA to each subject. To validate the performance of theclassification algorithm, we randomly sampled an independent set of 400 subjects(validation set) from the subset of subjects who were classified as RA (Alg by any of thethree algorithms). These cases were then validated through a blinded medical record reviewby two rheumatologists, KPL and RMP for RA. The sensitivity, specificity and PPV werecalculated using the following formulas:
Liao et al. Page 5
Arthritis Care Res (Hoboken). Author manuscript; available in PMC 2011 June 23.
NIH
-PA Author Manuscript
NIH
-PA Author Manuscript
NIH
-PA Author Manuscript
PPV= (Number of Alg subject confirmed as RA on medical record review)/(Number of Algsubjects)
Sensitivity= (PPV × PAlg)/PRA
Specificity= 1- [((1-PPV) × PAlg)/(1- PRA)]
PAlg is the proportion of subjects identified by the algorithm as having RA in the RA Mart,and PRA is the RA prevalence estimated from the training set. Sampling the validation setfrom the subset of subjects who were classified as RA can improve the precision inestimating PPV which is the primary accuracy parameter and outcome of interest.
To assess and compare the difference in accuracy between the 3 algorithms, we comparedtheir PPV values and obtained confidence intervals (CIs) using the validation data:
Difference in PPV= PPV complete algorithm- PPV codified variables only algorithm;
Difference in PPV= PPV complete algorithm- PPV narrative variables only algorithm
The differences in PPV were significant if the 95% CI did not include zero. Although thePPV values between the 3 algorithms can be compared, the 95% CIs associated with thePPV values (in contrast to the difference in PPV) cannot since these estimates were derivedfrom the same validation set of 400 subjects for all 3 algorithms.
For comparison, we also assessed the accuracy of criteria used in administrative databasestudies: ≥3 ICD codes for RA (8) and ≥ 1 RA ICD9 code + at least one DMARD (5). Weused the training set to generate these data as it allows for unbiased estimates of these simplecriteria. To compare differences in accuracy between our algorithms and the simple criteriaabove, we also used the difference in PPV and 95% CI.
Descriptive statisticsWe assessed differences in characteristics between RA cases and controls in the training setusing the t-test and the Wilcoxon Rank Sum test to compare differences between means andmedians respectively. P-values are two-sided. Chi-square was used for between-groupcomparisons expressed as proportions and analysis of variance (ANOVA) for comparison ofmultiple groups.
Case only analysisTo assess whether our EMR RA cohort can replicate known associations among clinicalvariables, we performed a case only analysis to compare the risk of erosions in anti-CCP+vs. CCP- subjects and RF+ vs. RF- subjects. We assessed the association between anti-CCPand radiographic erosions by including only those subjects in our database who have hadanti-CCP tested in the clinical laboratory (e.g., autoantibody status was derived fromcodified data). Similarly, we assessed the relationship between RF and erosions only amongthose who had RF tested. Odds ratios and 95% CI were calculated using 2×2 contingencytables. All analyses were conducted with SAS software, version 9.2 (SAS Institute) and theR package (The R project for Statistical Computing, http://www.r-project.org/).
RESULTSClassification algorithm
An overview of our approach is shown in Figure 1. Out of 500 subjects sampled from theRA Mart (training set), 96 (19%) subjects with a single ICD9 code for RA were determined
Liao et al. Page 6
Arthritis Care Res (Hoboken). Author manuscript; available in PMC 2011 June 23.
NIH
-PA Author Manuscript
NIH
-PA Author Manuscript
NIH
-PA Author Manuscript
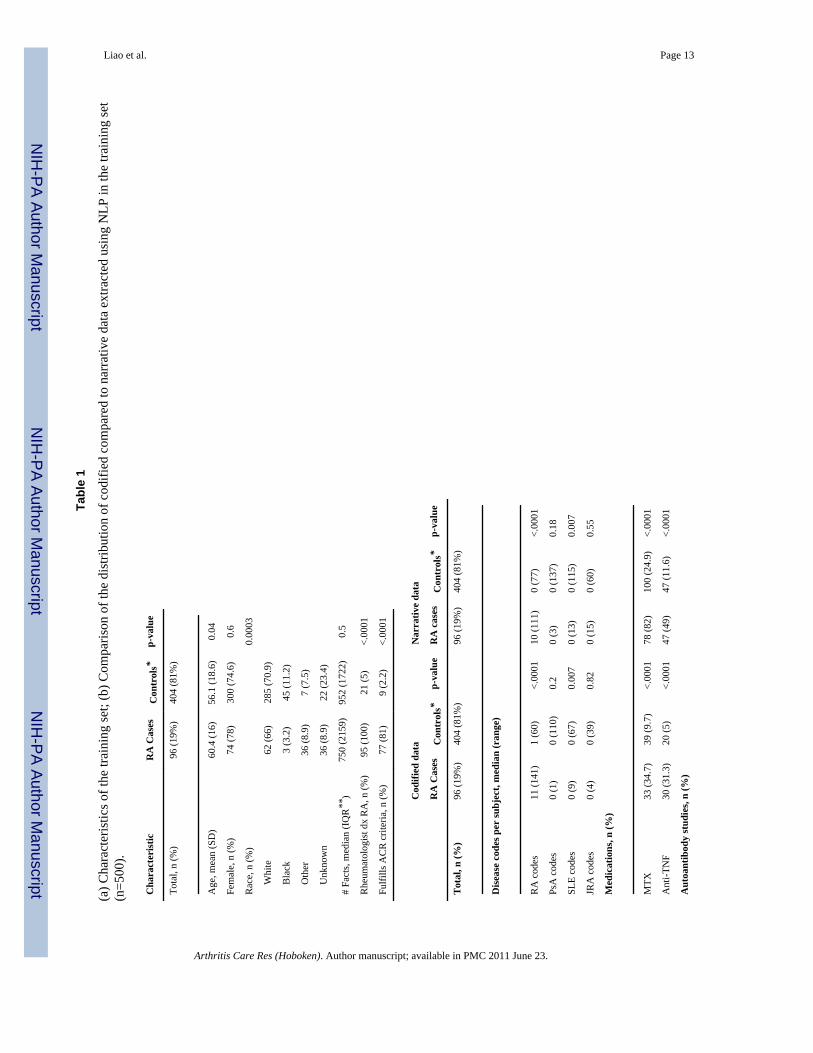
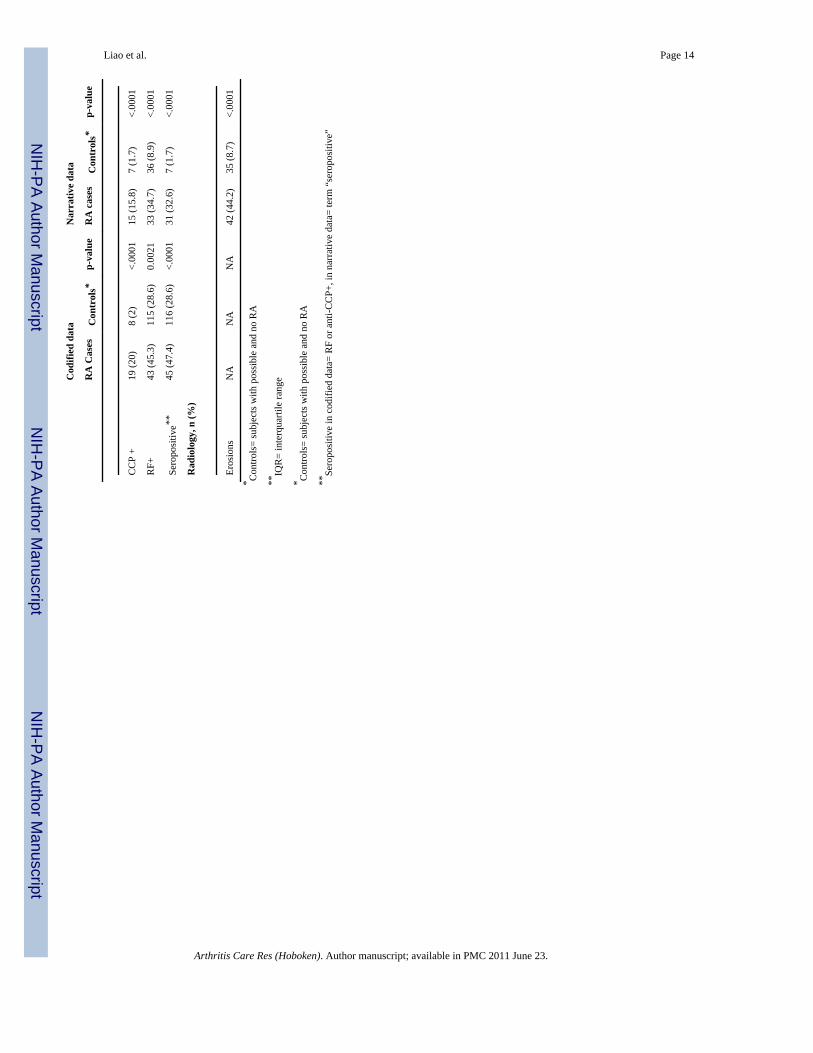
to have a diagnosis of RA by medical record review; the remaining 404 subjects had eitherpossible RA (n=84) or no evidence of RA (n=320). The clinical characteristics extractedfrom the codified compared to narrative EMR data are shown in Tables 1a and 1b for the500 subjects in our training set. There was a strong correlation between identification as anRA case on medical record review and having a higher number of RA ICD9 codes and ahigher number of NLP mentions of RA (P<0.0001). Methotrexate was the most commonmedication prescribed for RA cases (34.7% in the codified EMR data ) and was also themost commonly mentioned medication in the text notes (82% in the narrative EMR data).
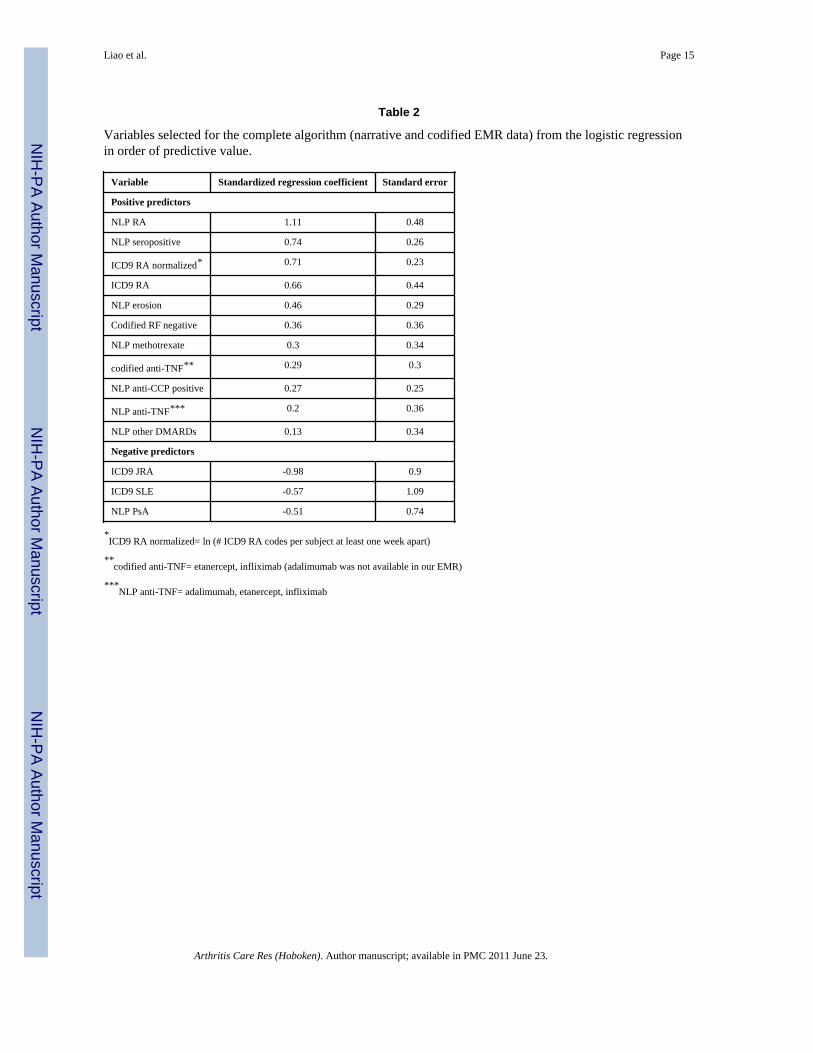
To select the most informative variables that differentiate the RA cases from the controls inour training set, we used a statistical method based on penalized logistic regression. Thismethod identified 14 variables for the narrative and codified (complete) classificationalgorithm shown in Table 2 in order of predictive value. The features selected for thecodified EMR variables only algorithm included in order of predictive value, for positivepredictors: ICD9 RA, normalized ICD9 RA, anti-TNF, RF positive, methotrexate; negativepredictors included: ICD9 JRA, ICD9 SLE, ICD9 PsA. The features selected for narrative(NLP) EMR variables only algorithm included, for positive predictors: RA, seropositive,anti-TNF, positive erosions, methotrexate, CCP positive, other DMARDs, age; negativepredictors included: SLE, PsA, JRA.
We applied the three algorithms to the entire RA Mart of 29,432 subjects (excluding the 500subjects from the training set). The narrative and codified (complete) classificationalgorithm classified 3,585 subjects as having RA (Table 3). The codified-only and narrative-only algorithms classified 3,046 and 3,341 subjects, respectively, as having RA.
Validation of the classification algorithmThe narrative and codified (complete) classification algorithm performed significantly betterthan algorithms using either codified or narrative data alone (Table 3). There was a 6%(95% CI 2, 9%) difference in PPV between the complete algorithm compared to thecodified-only algorithm, and a 5% (95% CI 1, 8) difference in PPV between the completealgorithm and the narrative-only algorithm. The estimated sensitivities were also lower inthe codified-only and narrative-only algorithms (51% and 56%, respectively, compared to63% for the complete algorithm). Examples of the diagnoses of the subjects misclassified inthe complete algorithm were: erosive osteoarthritis, psoriatic arthritis, a “spondylyticvariant,” and “right knee monoarthritis.”
We also applied criteria used in administrative database studies for comparison: ≥3 ICDcodes for RA (8) and ≥ 1 RA ICD9 code + at least one DMARD (5) (Table 3). The PPV ofthe former was 56% (95% CI: 47, 64%) and the latter was 45% (95% CI: 37, 52%). Usingthe complete classification algorithm resulted in an increase in PPV of 38% (95% CI 29,47%) when compared to ≥3 RA ICD codes, and an increase in PPV of 49% (95% CI: 40,57%) when compared to ≥1 RA ICD9 code + at least one DMARD.
We used the PPV estimates to determine the increase in the total number of RA subjectsclassified by our three algorithms. The complete algorithm with a PPV of 94% wouldidentify 3,370 RA subjects, the codified data-only algorithm with a PPV of 88% wouldidentify 2,680 RA subjects, and a narrative data-only algorithm would identify 2973 RAsubjects. This represents a 26% increase in the identification of true RA subjects if thecomplete algorithm were used compared to the codified-only algorithm.
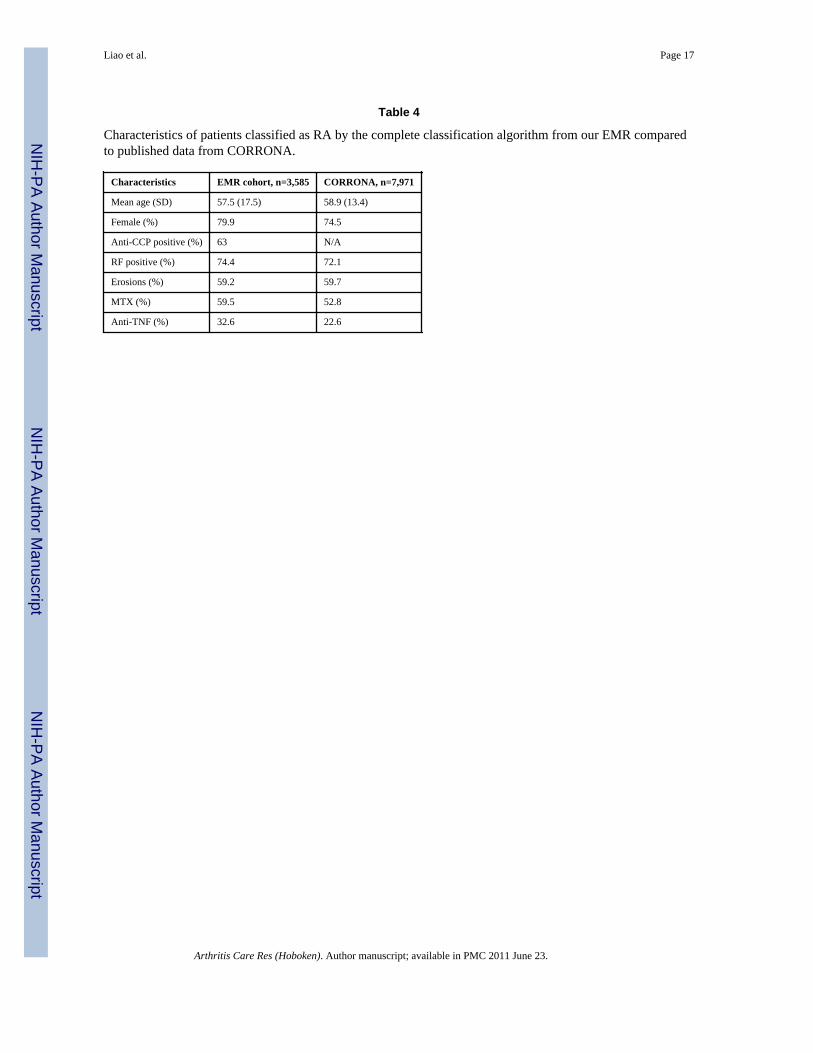
Clinical characteristics of EMR RA cohortWe assessed the clinical characteristics of the 3,585 subjects classified as having RA (EMRcohort). The clinical characteristics of our EMR cohort were similar to published data from
Liao et al. Page 7
Arthritis Care Res (Hoboken). Author manuscript; available in PMC 2011 June 23.
NIH
-PA Author Manuscript
NIH
-PA Author Manuscript
NIH
-PA Author Manuscript
the Consortium of Rheumatology Researchers of North America (CORRONA) (26), anindependent cohort of RA subjects assembled through traditional patient recruitment (Table4).
We also assessed whether we could reproduce known associations between clinical featureswithin our EMR cohort. Consistent with previous reports, we found that anti-CCP+ subjects(defined using codified EMR data) have an elevated risk of erosions (defined using NLPfrom narrative data) compared to anti-CCP- subjects, OR 1.5 (95% CI 1.2, 1.9) (27). Weobserved a similar relationship when RF+ were compared to RF- subjects, OR 1.3 (95% CI1.1, 1.6). The trend towards higher risk of erosions in RA subjects seen in anti-CCP+compared to those who are RF+ is consistent to those seen in the published literature(28,29).
DISCUSSIONWith the increasing adoption of electronic medical records (30,31) and the high cost ofmaintaining large cohort studies, harnessing the complete EMR (narrative and codified data)for use in biomedical research offers an untapped resource for clinical and translationalresearch. We have demonstrated that it is possible to accurately identify a cohort of RAsubjects within an EMR with characteristics comparable to those of large cohort studiesrecruited using conventional methods. This represents a novel approach for establishinglarge patient registries in a high-throughput and cost-effective manner.
A major criticism of EMR data is accuracy. In our study, we provide convincing evidencethat complete EMR data (narrative and codified data), together with robust analyticalmethods, can be used to identify subjects with RA with a high PPV of 94% for the completealgorithm. There was a significant increase in the PPV of 6% when narrative data wasincluded to an algorithm containing only codified data. This degree of accuracy issubstantially higher than previous studies that use EMR data (5). In our study the PPV of asingle ICD9 code was only 19% (prevalence of RA in the training set). Published studiesusing a combination of codified data only, had lower PPVs when applied to our dataset; ≥3ICD codes for RA (8) had a PPV of 56%, and ≥ 1 RA ICD9 code + one DMARD (5) had aPPV of 45% in our dataset. Moreover, incorporation of narrative data into a classificationalgorithm containing codified data only not only increased the PPV, but also the sensitivity,thereby increasing the sample size by 26%. The increase in PPV and sample size can have aprofound impact on the power of the study, particularly those requiring precise diseasephenotypes.
There are at least two reasons why our approach outperformed previous methods. First, weused NLP to incorporate the narrative EMR data into our classification algorithm. NarrativeEMR data are increasingly accessible, with an estimated 20-30% of physicians maintainingelectronic notes on their subjects (31-33). In our RA Mart, some clinical data were availablein narrative notes but not in the codified EMR (e.g., radiographic erosions), and someclinical data were more detailed in the narrative notes than in the codified EMR data. Forexample, codified data for methotrexate is present only if it was prescribed, whereasnarrative methotrexate data were available if a subject was on methotrexate, if it was takenin the past, or if it was considered. Second, we developed a robust algorithm that selectedthe most informative variables from an expanded list of potential clinical variables. We didnot rely on a pre-specified set of rules to categorize subjects as is often used inadministrative database studies. In our complete model, using both narrative and codifiedEMR data, the selected variables were quite diverse, including diagnostic codes of RA (NLPfor rheumatoid arthritis and codified ICD9 codes for RA), concurrent medication (NLP formethotrexate), absence of diseases that mimic RA (SLE, JRA and psoriasis), and presence
Liao et al. Page 8
Arthritis Care Res (Hoboken). Author manuscript; available in PMC 2011 June 23.
NIH
-PA Author Manuscript
NIH
-PA Author Manuscript
NIH
-PA Author Manuscript
of RA-specific autoantibodies. This technique using a multivariable model can result with acounterintuitive direction of influence for a particular variable due to collinearity; in ourmodel using both codified and NLP data, the codified RF negative variable had a positiveinfluence on selecting RA subjects. This was likely due to collinearity of the codified RFnegative variable with the NLP anti-CCP positive variable. Overall, it is the combinedinfluence of all the variables in the model that are important for prediction of RA. In thealgorithm using codified data alone, RF positive had a positive influence and RF negativewas not included into the model.
An exciting prospect is implementation of our approach in EMRs at other institutions todemonstrate portability of our EMR algorithm to classify RA patients. The tools andtechniques utilized in building our EMR database, such as the program used for NLP areopen source and are freely available to the rheumatology community (www.i2b2.org).Similarly, institutions with primarily codified EMR data can implement our codified-onlyEMR algorithm (sensitivity of 51%, PPV of 88%). Institution specific expertise fromclinicians, statisticians and bioinformaticians would be required to optimize the performanceof any EMR algorithm.
Increasingly, efforts have been made to link EMR data with biospecimen repositories (2). Atour institution (Partners HealthCare), a concerted effort has been made to link discardedblood samples to EMR data, thereby enabling serologic and genetic studies (34). Once thisinfrastructure is in place, collection of biospecimen is affordable on a large scale (and acrossmultiple diseases). A similar infrastructure at other institutions would create a large nationalRA registry with access to biospecimen linked to detailed EMR clinical data.
An important limitation of conducting studies based in EMRs is access to only clinical datathat are collected as part of routine patient care at the institution(s). For our study, we usedan EMR with comprehensive outcomes and clinical information for subjects who obtainedcare at two tertiary care academic medical centers; other centers may have more limitedEMR clinical data. Without additional institutional review board approval, we cannot re-contact subjects to employ detailed questionnaires on exposures or other clinical variables.
In conclusion, creating clinical research databases from an EMR is an efficient and powerfultool for clinical and translational research. If successfully implemented across multipleinstitutions, it is theoretically possible to establish large patient registries with detailedclinical outcome data, where each institution could maintain local control of confidentialpatient clinical data. Biomedical research – and ultimately patients with RA – have much togain by utilization of EMRs for discovery research.
AcknowledgmentsPartners Research Patient Database Registry (RPDR)
T. Cai, S. Churchill, S. Goryachev, E. Karlson, I. Kohane, S. Murphy, R. Plenge, P. Szolovits and Q. Zeng-Treitlerare supported by the i2b2 grant (NIH U54 LM008748); S. Murphy is also supported by NIH grants UL1RR02578-01 and R01 HL091495-01A1; E. Karlson is supported by NIH grants R01 AR049880, P60 AR047782,K24 AR0524-01; K. Liao is supported by NIH T32 AR055885; R. Plenge holds a Career Award for MedicalScientists from the Burroughs Wellcome Fund; S. Raychaudhuri is supported by NIH K08 AR 055688-01A1; Q.Zeng-Treitler is also supported by NIH grants R01 LM007222, R01 DK075837, R01 LM009966, R21NR0101710-01, R21 NS067463.
Liao et al. Page 9
Arthritis Care Res (Hoboken). Author manuscript; available in PMC 2011 June 23.
NIH
-PA Author Manuscript
NIH
-PA Author Manuscript
NIH
-PA Author Manuscript
REFERENCES1. Poon EG, Jha AK, Christino M, Honour MM, Fernandopulle R, Middleton B, et al. Assessing the
level of healthcare information technology adoption in the United States: a snapshot. BMC MedInform Decis Mak. 2006; 6:1. [PubMed: 16396679]
2. Trivedi B. Biomedical science: betting the bank. Nature. 2008; 452(7190):926–9. [PubMed:18441548]
3. Solomon DH, Goodson NJ, Katz JN, Weinblatt ME, Avorn J, Setoguchi S, et al. Patterns ofcardiovascular risk in rheumatoid arthritis. Ann Rheum Dis. 2006; 65(12):1608–12. [PubMed:16793844]
4. Gabriel SE. The sensitivity and specificity of computerized databases for the diagnosis ofrheumatoid arthritis. Arthritis Rheum. 1994; 37(6):821–3. [PubMed: 8003054]
5. Singh JA, Holmgren AR, Noorbaloochi S. Accuracy of Veterans Administration databases for adiagnosis of rheumatoid arthritis. Arthritis Rheum. 2004; 51(6):952–7. [PubMed: 15593102]
6. Katz JN, Barrett J, Liang MH, Bacon AM, Kaplan H, Kieval RI, et al. Sensitivity and positivepredictive value of Medicare Part B physician claims for rheumatologic diagnoses and procedures.Arthritis Rheum. 1997; 40(9):1594–600. [PubMed: 9324013]
7. Losina E, Barrett J, Baron JA, Katz JN. Accuracy of Medicare claims data for rheumatologicdiagnoses in total hip replacement recipients. J Clin Epidemiol. 2003; 56(6):515–9. [PubMed:12873645]
8. Schneeweiss S, Setoguchi S, Weinblatt ME, Katz JN, Avorn J, Sax PE, et al. Anti-tumor necrosisfactor alpha therapy and the risk of serious bacterial infections in elderly patients with rheumatoidarthritis. Arthritis Rheum. 2007; 56(6):1754–64. [PubMed: 17530704]
9. Effler P, Ching-Lee M, Bogard A, Ieong MC, Nekomoto T, Jernigan D. Statewide system ofelectronic notifiable disease reporting from clinical laboratories: comparing automated reportingwith conventional methods. Jama. 1999; 282(19):1845–50. [PubMed: 10573276]
10. Klompas M, Haney G, Church D, Lazarus R, Hou X, Platt R. Automated identification of acutehepatitis B using electronic medical record data to facilitate public health surveillance. PLoS One.2008; 3(7):e2626. [PubMed: 18612462]
11. Lazarus R, Klompas M, Campion FX, McNabb SJ, Hou X, Daniel J, et al. Electronic Support forPublic Health: validated case finding and reporting for notifiable diseases using electronic medicaldata. J Am Med Inform Assoc. 2009; 16(1):18–24. [PubMed: 18952940]
12. Meystre S, Haug P. Improving the sensitivity of the problem list in an intensive care unit by usingnatural language processing. AMIA Annu Symp Proc. 2006:554–8. [PubMed: 17238402]
13. Meystre S, Haug PJ. Natural language processing to extract medical problems from electronicclinical documents: performance evaluation. J Biomed Inform. 2006; 39(6):589–99. [PubMed:16359928]
14. Solti I, Aaronson B, Fletcher G, Solti M, Gennari JH, Cooper M, et al. Building an AutomatedProblem List Based on Natural Language Processing: Lessons Learned in the Early Phase ofDevelopment. AMIA Annu Symp Proc. 2008; 2008(2008):687–691. [PubMed: 18999050]
15. Levin MA, Krol M, Doshi AM, Reich DL. Extraction and mapping of drug names from free text toa standardized nomenclature. AMIA Annu Symp Proc. 2007:438–42. [PubMed: 18693874]
16. Turchin A, Morin L, Semere LG, Kashyap V, Palchuk MB, Shubina M, et al. Comparativeevaluation of accuracy of extraction of medication information from narrative physician notes bycommercial and academic natural language processing software packages. AMIA Annu SympProc. 2006:789–93. [PubMed: 17238449]
17. Bates DW, Evans RS, Murff H, Stetson PD, Pizziferri L, Hripcsak G. Detecting adverse eventsusing information technology. J Am Med Inform Assoc. 2003; 10(2):115–28. [PubMed:12595401]
18. Penz JF, Wilcox AB, Hurdle JF. Automated identification of adverse events related to centralvenous catheters. J Biomed Inform. 2007; 40(2):174–82. [PubMed: 16901760]
19. Zeng QT, Goryachev S, Weiss S, Sordo M, Murphy SN, Lazarus R. Extracting principal diagnosis,co-morbidity and smoking status for asthma research: evaluation of a natural language processingsystem. BMC Med Inform Decis Mak. 2006; 6(30)
Liao et al. Page 10
Arthritis Care Res (Hoboken). Author manuscript; available in PMC 2011 June 23.
NIH
-PA Author Manuscript
NIH
-PA Author Manuscript
NIH
-PA Author Manuscript
20. Cunningham, H.; Humphreys, K.; Gaizauskas, R. GATE - a TIPSTER-based General Architecturefor Text Engineering.. Proceedings of the TIPSTER Text Program (Phase III) 6 Month Workshop;DARPA. 1997;
21. Arnett FC, Edworthy SM, Bloch DA, McShane DJ, Fries JF, Cooper NS, et al. The AmericanRheumatism Association 1987 revised criteria for the classification of rheumatoid arthritis.Arthritis Rheum. 1988; 31(3):315–24. [PubMed: 3358796]
22. Banal F, Dougados M, Combescure C, Gossec L. Sensitivity and specificity of the AmericanCollege of Rheumatology 1987 criteria for the diagnosis of rheumatoid arthritis according todisease duration: a systematic literature review and meta-analysis. Ann Rheum Dis. 2009; 68(7):1184–91. [PubMed: 18728049]
23. Zou H, Hastie T, Tibshirani R. On the ‘Degrees of Freedom’ of LASSO. Technical report:Stanford University Department of Statistics. 2004
24. Wang H, Li R, Tsai CL. On the Consistency of SCAD Tuning Parameter Selector. Biometrika.2008 in press.
25. Zou H. The adaptive lasso and its oracle properties. Journal of the American StatisticalAssociation. 2006; 101(476):1418–1429.
26. Greenberg JD, Reed G, Kremer JM, Tindall E, Kavanaugh A, Zheng C, et al. Association ofMethotrexate and TNF antagonists with risk of infection outcomes including opportunisticinfections in the CORRONA registry. Ann Rheum Dis. 2009
27. Forslind K, Ahlmen M, Eberhardt K, Hafstrom I, Svensson B. Prediction of radiological outcomein early rheumatoid arthritis in clinical practice: role of antibodies to citrullinated peptides (anti-CCP). Ann Rheum Dis. 2004; 63(9):1090–5. [PubMed: 15308518]
28. Bukhari M, Thomson W, Naseem H, Bunn D, Silman A, Symmons D, et al. The performance ofanti-cyclic citrullinated peptide antibodies in predicting the severity of radiologic damage ininflammatory polyarthritis: results from the Norfolk Arthritis Register. Arthritis Rheum. 2007;56(9):2929–35. [PubMed: 17763407]
29. Lee DM, Schur PH. Clinical utility of the anti-CCP assay in patients with rheumatic diseases. AnnRheum Dis. 2003; 62(9):870–4. [PubMed: 12922961]
30. Jha AK, DesRoches CM, Campbell EG, Donelan K, Rao SR, Ferris TG, et al. Use of electronichealth records in U.S. hospitals. N Engl J Med. 2009; 360(16):1628–38. [PubMed: 19321858]
31. Jha AK, Ferris TG, Donelan K, DesRoches C, Shields A, Rosenbaum S, et al. How common areelectronic health records in the United States? A summary of the evidence. Health Aff (Millwood).2006; 25(6):w496–507. [PubMed: 17035341]
32. Berner ES, Detmer DE, Simborg D. Will the wave finally break? A brief view of the adoption ofelectronic medical records in the United States. J Am Med Inform Assoc. 2005; 12(1):3–7.[PubMed: 15492029]
33. DesRoches CM, Campbell EG, Rao SR, Donelan K, Ferris TG, Jha A, et al. Electronic healthrecords in ambulatory care--a national survey of physicians. N Engl J Med. 2008; 359(1):50–60.[PubMed: 18565855]
34. Murphy S, Churchill S, Bry L, Chueh H, Weiss S, Lazarus R, et al. Instrumenting the health careenterprise for discovery research in the genomic era. Genome Res. 2009; 19(9):1675–81.[PubMed: 19602638]
Liao et al. Page 11
Arthritis Care Res (Hoboken). Author manuscript; available in PMC 2011 June 23.
NIH
-PA Author Manuscript
NIH
-PA Author Manuscript
NIH
-PA Author Manuscript
Figure 1.Overview of approach for classifying RA subjects in the electronic medical record (EMR).Subjects were selected from the EMR with ≥1 ICD9 RA code or had anti-CCP checked tocreate the RA Mart. 500 subjects were randomly selected from the RA Mart to undergomedical record review to establish a training set. This training set of RA and non-RA caseswas used to develop and train the classification algorithm. The classification algorithm wasapplied to the entire RA Mart to determine predicted RA cases. 400 subjects were randomlyselected from the predicted RA cases to undergo medical record review to determine thePPV of the algorithm (validation set). 279×89mm (96 × 96 DPI)
Liao et al. Page 12
Arthritis Care Res (Hoboken). Author manuscript; available in PMC 2011 June 23.
NIH
-PA Author Manuscript
NIH
-PA Author Manuscript
NIH
-PA Author Manuscript
NIH
-PA Author Manuscript
NIH
-PA Author Manuscript
NIH
-PA Author Manuscript
Liao et al. Page 13
Tabl
e 1
(a) C
hara
cter
istic
s of t
he tr
aini
ng se
t; (b
) Com
paris
on o
f the
dis
tribu
tion
of c
odifi
ed c
ompa
red
to n
arra
tive
data
ext
ract
ed u
sing
NLP
in th
e tra
inin
g se
t(n
=500
).
Cha
ract
eris
ticR
A C
ases
Con
trol
s*p-
valu
e
Tota
l, n
(%)
96 (1
9%)
404
(81%
)
Age
, mea
n (S
D)
60.4
(16)
56.1
(18.
6)0.
04
Fem
ale,
n (%
)74
(78)
300
(74.
6)0.
6
Rac
e, n
(%)
0.00
03
W
hite
62 (6
6)28
5 (7
0.9)
B
lack
3 (3
.2)
45 (1
1.2)
O
ther
36 (8
.9)
7 (7
.5)
U
nkno
wn
36 (8
.9)
22 (2
3.4)
# Fa
cts,
med
ian
(IQ
R**
)75
0 (2
159)
952
(172
2)0.
5
Rhe
umat
olog
ist d
x R
A, n
(%)
95 (1
00)
21 (5
)<.
0001
Fulfi
lls A
CR
crit
eria
, n (%
)77
(81)
9 (2
.2)
<.00
01
Cod
ified
dat
aN
arra
tive
data
RA
Cas
esC
ontr
ols*
p-va
lue
RA
cas
esC
ontr
ols*
p-va
lue
Tot
al, n
(%)
96 (1
9%)
404
(81%
)96
(19%
)40
4 (8
1%)
Dis
ease
cod
es p
er su
bjec
t, m
edia
n (r
ange
)
RA
cod
es11
(141
)1
(60)
<.00
0110
(111
)0
(77)
<.00
01
PsA
cod
es0
(1)
0 (1
10)
0.2
0 (3
)0
(137
)0.
18
SLE
code
s0
(9)
0 (6
7)0.
007
0 (1
3)0
(115
)0.
007
JRA
cod
es0
(4)
0 (3
9)0.
820
(15)
0 (6
0)0.
55
Med
icat
ions
, n (%
)
MTX
33 (3
4.7)
39 (9
.7)
<.00
0178
(82)
100
(24.
9)<.
0001
Ant
i-TN
F30
(31.
3)20
(5)
<.00
0147
(49)
47 (1
1.6)
<.00
01
Aut
oant
ibod
y st
udie
s, n
(%)
Arthritis Care Res (Hoboken). Author manuscript; available in PMC 2011 June 23.
NIH
-PA Author Manuscript
NIH
-PA Author Manuscript
NIH
-PA Author Manuscript
Liao et al. Page 14C
odifi
ed d
ata
Nar
rativ
e da
ta
RA
Cas
esC
ontr
ols*
p-va
lue
RA
cas
esC
ontr
ols*
p-va
lue
CC
P +
19 (2
0)8
(2)
<.00
0115
(15.
8)7
(1.7
)<.
0001
RF+
43 (4
5.3)
115
(28.
6)0.
0021
33 (3
4.7)
36 (8
.9)
<.00
01
Sero
posi
tive*
*45
(47.
4)11
6 (2
8.6)
<.00
0131
(32.
6)7
(1.7
)<.
0001
Rad
iolo
gy, n
(%)
Eros
ions
NA
NA
NA
42 (4
4.2)
35 (8
.7)
<.00
01
* Con
trols
= su
bjec
ts w
ith p
ossi
ble
and
no R
A
**IQ
R=
inte
rqua
rtile
rang
e
* Con
trols
= su
bjec
ts w
ith p
ossi
ble
and
no R
A
**Se
ropo
sitiv
e in
cod
ified
dat
a= R
F or
ant
i-CC
P+, i
n na
rrat
ive
data
= te
rm “
sero
posi
tive”
Arthritis Care Res (Hoboken). Author manuscript; available in PMC 2011 June 23.
NIH
-PA Author Manuscript
NIH
-PA Author Manuscript
NIH
-PA Author Manuscript
Liao et al. Page 15
Table 2
Variables selected for the complete algorithm (narrative and codified EMR data) from the logistic regressionin order of predictive value.
Variable Standardized regression coefficient Standard error
Positive predictors
NLP RA 1.11 0.48
NLP seropositive 0.74 0.26
ICD9 RA normalized* 0.71 0.23
ICD9 RA 0.66 0.44
NLP erosion 0.46 0.29
Codified RF negative 0.36 0.36
NLP methotrexate 0.3 0.34
codified anti-TNF** 0.29 0.3
NLP anti-CCP positive 0.27 0.25
NLP anti-TNF*** 0.2 0.36
NLP other DMARDs 0.13 0.34
Negative predictors
ICD9 JRA -0.98 0.9
ICD9 SLE -0.57 1.09
NLP PsA -0.51 0.74
*ICD9 RA normalized= ln (# ICD9 RA codes per subject at least one week apart)
**codified anti-TNF= etanercept, infliximab (adalimumab was not available in our EMR)
***NLP anti-TNF= adalimumab, etanercept, infliximab
Arthritis Care Res (Hoboken). Author manuscript; available in PMC 2011 June 23.

NIH
-PA Author Manuscript
NIH
-PA Author Manuscript
NIH
-PA Author Manuscript
Liao et al. Page 16
Table 3
Comparison of performance characteristics from validation of the complete classification algorithm (narrative+ codified) to algorithms containing codified-only and narrative-only data; the complete classificationalgorithm was also compared to criteria for RA used in published administrative database studies.
Model RA by algorithm orcriteria, n
PPV (%) (95% CI) Sens (%) (95% CI) Difference in PPV* (95%CI)
Algorithms
Narrative + codified (complete) 3585 94 (91, 96) 63 (51, 75) reference
Codified only 3046 88 (84, 92) 51 (42, 60) 6 (2,9)**
NLP only 3341 89 (86, 93) 56 (46, 66) 5(1,8)**
Published administrative codified criteria
≥ 3 ICD9 RA 7960 56 (47,64) 80 (72,88) 38 (29, 47)**
≥1 ICD9 RA + DMARD 7799 45 (37, 53) 66 (57,76) 49 (40, 57)**
*Difference in PPV= (PPV of complete algorithm) – (comparison algorithm or criteria)
**Significant difference in PPV compared to complete algorithm
Arthritis Care Res (Hoboken). Author manuscript; available in PMC 2011 June 23.
NIH
-PA Author Manuscript
NIH
-PA Author Manuscript
NIH
-PA Author Manuscript
Liao et al. Page 17
Table 4
Characteristics of patients classified as RA by the complete classification algorithm from our EMR comparedto published data from CORRONA.
Characteristics EMR cohort, n=3,585 CORRONA, n=7,971
Mean age (SD) 57.5 (17.5) 58.9 (13.4)
Female (%) 79.9 74.5
Anti-CCP positive (%) 63 N/A
RF positive (%) 74.4 72.1
Erosions (%) 59.2 59.7
MTX (%) 59.5 52.8
Anti-TNF (%) 32.6 22.6
Arthritis Care Res (Hoboken). Author manuscript; available in PMC 2011 June 23.
Copyright © 2022 FDOKUMEN