Nickel localization and response to increasing Ni soil levels in leaves of the Ni hyperaccumulator...
18
Plant and Soil 265: 225–242, 2004. © 2004 Kluwer Academic Publishers. Printed in the Netherlands. 225 Nickel Localization and Response to Increasing Ni Soil Levels in Leaves of the Ni Hyperaccumulator Alyssum murale C. Leigh Broadhurst 1,5 , Rufus L. Chaney 1 , J. Scott Angle 2 , Eric F. Erbe 3 & Timothy K. Maugel 4 1 Animal Manure and Byproducts Laboratory, Animal and Natural Resources Institute, Bldg. 007, US Department of Agriculture Henry A. Wallace Agricultural Research Center, Beltsville, MD 20705 USA. 2 Agricultural Experiment Station, University of Maryland, College Park, MD 20742; USA. 3 Electron Microscopy Unit, Soybean Genomics and Improvement Laboratory, Plant Sciences Institute, USDA Beltsville. 4 Laboratory for Biological Ultrastructure, Department of Biology, University of Maryland, College Park. 5 Corresponding author ∗ Received 22 May 2003. Accepted in revised form 10 February 2004 Key words: Alyssum, hyperaccumulator, nickel localization, phytoremediation, trichomes, SEM-EDX Abstract We have previously developed phytoremediation and phytomining technologies employing Alyssum Ni hyperac- cumulators to quantitatively extract Ni from soils. Implementation of these technologies requires knowledge of Ni localization patterns for the Alyssum species/ecotypes of interest under realistic growth conditions. We investigated Ni uptake and localization in mature Alyssum murale ‘Kotodesh’ and ‘AJ9’ leaves. Seedlings were grown in potting mix with an increasing series of NiSO 4 addition (0, 5, 10, 20, 40, 80 mmol Ni kg −1 ), NiC 4 H 6 O 4 addition (0, 5, 10, 30, 60, 90 mmol Ni kg −1 ), in Ni-contaminated soil from metal refining operations, and serpentine soil. Plants at Ni levels 0, 5, 10, 20 mmolkg −1 and in native soils grew normally. Plants at 40 mmolkg −1 exhibited the onset of phytotoxicity, and 60, 80, and 90 mmolkg −1 were demonstrably phytotoxic, but symptoms of phytotoxicity abated within 6 months. Cryogenic complement fractures were made from frozen hydrated samples. High-resolution scanning electron microscope (SEM) images were taken of one half. The other half was freeze-dried and examined with SEM and semi-quantitative energy dispersive x-ray analysis. Ni was highly concentrated in epidermal cell vacuoles and Ni and S counts showed a positive correlation. Trichome pedicles and the epidermal tissue from which the trichome grows were primary Ni compartments, but Ni was not distributed throughout trichomes. Palisade and spongy mesophyll and guard/substomatal cells contained lesser Ni concentrations but palisade mesophyll was an increasingly important compartment as Ni soil levels increased. Ni was virtually excluded from vascular tissue and trichome rays. Introduction Over the past 8 years our research consortium led by the USDA Agricultural Research Service has developed and demonstrated commercially feas- ible phytoremediation and phytomining technologies that can potentially clean up Ni-contaminated soils (Chaney et al. 1999; Li et al. 2003a, b). The tech- nology employs two Ni-hyperaccumulating species, Alyssum murale and Alyssum corsicum to quantitat- ively extract Ni from serpentine soils that are naturally ∗ FAX No: 301-504-5031. E-mail: [email protected] rich in Ni. These species are endemic to serpentine soils throughout Mediterranean Southern Europe. Un- like many serpentine-endemic species, A. murale and A. corsicum can grow prolifically and hyperaccumu- late Ni in other soil types, such as limestone soils, organic soils, and loam. Successful development of hyperaccumulator spe- cies for large-scale phytoremediation/phytomining re- quires knowledge of Ni localization patterns for each genus/species/ecotype of interest, and for a variety of realistic growth conditions. Microscopy techniques that combine scanning electron microscopy (SEM) with energy dispersive x-ray analysis (EDX) have
-
Upload
independent -
Category
Documents
-
view
2 -
download
0
Transcript of Nickel localization and response to increasing Ni soil levels in leaves of the Ni hyperaccumulator...

Plant and Soil 265: 225–242, 2004.© 2004 Kluwer Academic Publishers. Printed in the Netherlands.
225
Nickel Localization and Response to Increasing Ni Soil Levels in Leaves ofthe Ni Hyperaccumulator Alyssum murale
C. Leigh Broadhurst1,5, Rufus L. Chaney1, J. Scott Angle2, Eric F. Erbe3 & Timothy K. Maugel41Animal Manure and Byproducts Laboratory, Animal and Natural Resources Institute, Bldg. 007,US Department of Agriculture Henry A. Wallace Agricultural Research Center, Beltsville, MD 20705 USA.2Agricultural Experiment Station, University of Maryland, College Park, MD 20742; USA. 3Electron MicroscopyUnit, Soybean Genomics and Improvement Laboratory, Plant Sciences Institute, USDA Beltsville. 4Laboratory forBiological Ultrastructure, Department of Biology, University of Maryland, College Park. 5Corresponding author∗
Received 22 May 2003. Accepted in revised form 10 February 2004
Key words: Alyssum, hyperaccumulator, nickel localization, phytoremediation, trichomes, SEM-EDX
Abstract
We have previously developed phytoremediation and phytomining technologies employing Alyssum Ni hyperac-cumulators to quantitatively extract Ni from soils. Implementation of these technologies requires knowledge of Nilocalization patterns for the Alyssum species/ecotypes of interest under realistic growth conditions. We investigatedNi uptake and localization in mature Alyssum murale ‘Kotodesh’ and ‘AJ9’ leaves. Seedlings were grown in pottingmix with an increasing series of NiSO4 addition (0, 5, 10, 20, 40, 80 mmol Ni kg−1), NiC4H6O4 addition (0, 5,10, 30, 60, 90 mmol Ni kg−1), in Ni-contaminated soil from metal refining operations, and serpentine soil. Plantsat Ni levels 0, 5, 10, 20 mmolkg−1 and in native soils grew normally. Plants at 40 mmolkg−1 exhibited the onset ofphytotoxicity, and 60, 80, and 90 mmolkg−1 were demonstrably phytotoxic, but symptoms of phytotoxicity abatedwithin 6 months. Cryogenic complement fractures were made from frozen hydrated samples. High-resolutionscanning electron microscope (SEM) images were taken of one half. The other half was freeze-dried and examinedwith SEM and semi-quantitative energy dispersive x-ray analysis. Ni was highly concentrated in epidermal cellvacuoles and Ni and S counts showed a positive correlation. Trichome pedicles and the epidermal tissue from whichthe trichome grows were primary Ni compartments, but Ni was not distributed throughout trichomes. Palisade andspongy mesophyll and guard/substomatal cells contained lesser Ni concentrations but palisade mesophyll was anincreasingly important compartment as Ni soil levels increased. Ni was virtually excluded from vascular tissue andtrichome rays.
Introduction
Over the past 8 years our research consortiumled by the USDA Agricultural Research Servicehas developed and demonstrated commercially feas-ible phytoremediation and phytomining technologiesthat can potentially clean up Ni-contaminated soils(Chaney et al. 1999; Li et al. 2003a, b). The tech-nology employs two Ni-hyperaccumulating species,Alyssum murale and Alyssum corsicum to quantitat-ively extract Ni from serpentine soils that are naturally
∗FAX No: 301-504-5031. E-mail: [email protected]
rich in Ni. These species are endemic to serpentinesoils throughout Mediterranean Southern Europe. Un-like many serpentine-endemic species, A. murale andA. corsicum can grow prolifically and hyperaccumu-late Ni in other soil types, such as limestone soils,organic soils, and loam.
Successful development of hyperaccumulator spe-cies for large-scale phytoremediation/phytomining re-quires knowledge of Ni localization patterns for eachgenus/species/ecotype of interest, and for a varietyof realistic growth conditions. Microscopy techniquesthat combine scanning electron microscopy (SEM)with energy dispersive x-ray analysis (EDX) have

226
been successfully utilized to identify sites of metallocalization in Alyssum and other hyperaccumulatorplants.
It is clear from the limited previous research that arange of cell types and structures are involved in heavymetal compartmentation in hyperaccumulators, andlocalization data from one species may not be applic-able to another. However, a wide range of techniqueshave been utilized rather than a standard procedure,therefore it is expected that localization data will besomewhat contradictory. Cryogenic SEM/EDX tech-niques that use frozen bulk samples may be idealsince there is minimal processing of the samples andcell types and structures can be easily identified (Ech-lin, 1986; Van Steveninck and Van Steveninck, 1991;Wergin et al., 1999). Similar techniques developed toidentify pollutant-derived heavy metal localization inaquatic species are also relevant (Pedersen et al., 1981;Nott, 1991).
Ni enrichment is typically greatest in the leavesof hyperaccumulators, therefore leaf tissue has beenthe subject of most previous investigations. Protonor nuclear microprobe analyses of Ni hyperaccumu-lators collected from native South African ultramaficsoils found Ni concentrated in leaf mesophyll andepidermis in Berkheya coddii (Mesjasz-Przybylowiczet al., 2001a), leaf epidermis in Senecio coronatus(Mesjasz-Przybylowicz et al., 1994) and through-out the leaf but increasing in concentration frommesophyll to epidermis in Senecio anomalochrous(Mesjasz-Przybylowicz et al., 2001b). For B. coddiigrown hydroponically at varying nontoxic levels ofNi, the greatest concentration of Ni was in the apo-plast of the upper epidermis, particularly in the cuticle(Robinson et al., 2003). The proton-induced x-rayfluorescence mapping technique utilized by Mesjasz-Przybylowicz et al. (2001b) for S. anomalochrousis particularly sensitive, and yielded a range of dryweight Ni concentrations from 1000 µg g−1 in vas-cular bundles to 9000 µg g−1 in epidermis.
Heath et al. (1997) examined the epidermis of adimethylglyoxime fixed critical point dried Thlaspimontanum ‘Siskiyouense’ leaf from native Oregon ul-tramafic soil. Energy dispersive x-ray analysis analysisshowed that Ni was not in elongate epidermal cellsor guard cells–it was only concentrated in subsidi-ary cells. Freeze-substitution and EDX analysis ofHybanthus floribundus and Stackhousia tryonii col-lected from native Australian ultramafic soils foundthat Ni is concentrated specifically in the leaf cuticlein S. tryonii. For H. floribundus, Ni was distributed
homogeneously in high concentrations in the vacu-oles of epidermal cells and neighboring palisade andmesophyll cells (Bidwell, 2000).
Psaras et al. (2000) presented x-ray maps ofleaf epidermis which showed no Ni whatsoever inthe trichomes or guard cells of eight hyperaccumu-lator species collected from native Greek ultramaficsoils. Four of these were Alyssum: A. lesbiacum,A. smolikanum, A. heldreichii, A. euboeum. One leafcross section (Thlaspi pindicum) showed that Ni wasstrongly concentrated in the upper and lower epi-dermis. Marmiroli et al. (2002) studied localizationof Ni in the hyperaccumulator Alyssum bertolonii col-lected from native Tuscan ultramafic soil or normalgarden soil and oven dried with EDX analysis. Alys-sum bertolonii root cross sections showed strong Niconcentration in parenchyma and sclerenchyma. Stemcross sections showed Ni concentrated in epidermaltissues vs. interior tissues, but leaf data were incon-clusive. There was no tissue-type specificity for Ni inthe plants grown in garden soil.
Krämer et al. (2000) examined Thlaspi goesin-gense (hyperaccumulator) and T. arvense (nonhyper-accumulator) plants grown hydroponically in Ni-richsolutions. Radioactive Ni was given to the plants for1 d, and counts of the vacuolar isolate indicated thatabout 75% of the total Ni was in the vacuoles ofT. goesingense, with considerably less in the vacu-oles of T. arvense. However, the Ni concentrationsused in the growth medium were low enough to benontoxic to T. arvense, and the exposure was short-term–insufficient time for Ni redistribution within theplant.
Only one Ni hyperaccumulator study to date hasused plants grown in Ni-rich soil under controlled con-ditions. Küpper et al. (2001) grew T. goesingense,A. lesbiacum, and A. bertolonii in compost with 0,500, 2000, or 4000 mg kg−1 Ni for 64 or 84 days. Bulkfrozen hydrated samples were examined by cryogenicSEM/EDX analysis. X-ray mapping of leaf cross sec-tions from the 4000 mg kg−1 Ni treated A. lesbiacumand A. bertolonii plants showed that Ni was stronglylocalized in the epidermal cells. Nickel was mainly inepidermal cell interiors, with some in epidermal cellwalls. There was very little Ni in the mesophyll cellsor the vascular bundle. Thlaspi goesingense failed tosurvive at 4000 mg kg−1 Ni, so the 2000 mg kg−1
plant was examined. Nickel localization followed thesame pattern as seen for Alyssum, however the totalconcentration in the shoot was about half that of eitherAlyssum species.

227
A characteristic feature of Alyssum (and Arabidop-sis halleri) is the presence of numerous trichomes onleaf upper and lower epidermal sufaces. There is noconsensus as to whether trichomes are a storage loc-ation for hyperacummulated metals (Krämer et al.,1997; Küpper et al., 2000; Psaras et al., 2000; Zhaoet al., 2000; Marmiroli et al., 2002). It remains to bedetermined whether the interior of trichomes is a loca-tion for metal sequestration, or whether only the pointof attachment is metal-rich, reflecting conditions atthe interface between the trichome and the epidermisproper.
We have designed and implemented an experi-mental program for identifying Ni localization sitesin the leaves of Alyssum hyperaccumulator species.Plants are grown long-term in soils as opposed toshort-term hydroponically, and the species of interestserve as their own controls. Preparatory proceduresthat can relocate or remove Ni from plant tissues areavoided.
Materials and methods
Horticulture
Alyssum murale ‘Kotodesh’ and ‘AJ9’ were star-ted from seed 28/08/02 in a greenhouse at USDABeltsville. Twenty-one days later ‘Kotodesh’ seed-lings were transplanted to prepared and equilibrated250 g pots containing Promix� soil with an increas-ing series of NiSO4·6H2O addition (0, 5, 10, 20, 40,80 mmol Ni kg−1; these are designated in the text byNI 00, NI 5, NI 10, NI 20, NI 40, and NI 80 re-spectively.) Carbonates (half CaCO3 and half MgCO3)were added to each pot at amounts equimolar withNiSO4. ‘Kotodesh’ and ‘AJ9’ Seedlings were alsotransplanted into calcareous mineral soil associatedwith nickel mining tailings from Inco Ltd. operationsat Port Colborne, Ontario (Welland soil, Typic Epi-aquoll; Canadian classification, Terric Mesisol with30 gkg−1 CaCO3 added). The Inco soil typicallyyields 1% Ni in Alyssum whole shoots and 1.7% inleaves, and would be phytotoxic to normal plants(Kukier and Chaney, 2001). There were duplicateplants for each treatment.
Based on preliminary results, a second group of‘Kotodesh’ seedlings were started and transplantedafter 21 days on 05/03/03 to prepared and equilibrated250 g pots containing Promix� soil with an increas-ing series of NiC4H6O4·5H2O addition (0, 5, 10, 30,
60, 90 mmol Ni kg−1), and equimolar carbonatesas above. ‘Kotodesh’ and ‘AJ9’ seedlings were alsotransplanted on 17/03/03 into natural Brockman vari-ant serpentine soil from Josephine Co., Oregon (TypicXerochrepts) with 10 wt% Promix added to improvedrainage.
The experiments were conducted in a greenhouseunder controlled temperature and light conditions andambient humidity. Photoperiod was 15/9 day/night.During this time high-intensity sodium and incandes-cent lights supplying 400 µmol m−2s−1 supplementedsunlight if necessary. Daytime temperature was 24 ◦Cwith cooling initiated at 27 ◦C. Night temperature was18 ◦C with cooling initiated at 21 ◦C. Plants weregrown in freely drained plastic pots with saucers toprevent loss of leachate, and watered with deionizedwater. The plants received standard fertilization (Mir-acle Grow�) once per month, and MgSO4 (1.5 gL−1)bimonthly for the NiSO4 series and Inco plants. TheNiC4H6O4 plants received 1.5 g supplemental MgCO3and the serpentine soil plants did not receive supple-mental Mg. Magnesium supplementation was initiatedbecause there are 7 species of Alyssum hyperaccumu-lators under cultivation in the greenhouse, and someshowed signs of Mg deficiency, probably due to beingadapted to high-Mg serpentine soils.
Total metals analysis
Two centimeter lengths of apical stem tip fromthree locations on each plant were harvested on25/10/02 (NiSO4 and ‘Kotodesh’ Inco) and 17/06/03(NiC7H6O4 and ‘AJ9’ Inco) for total metal ana-lysis. The plants grown in the serpentine soil hadnot achieved enough biomass to be harvested withoutharming them. Only mature growth was used, andleaves were stripped from the stem. Harvested leaveswere rinsed in deionized water to remove any adheringsoil particles. Leaf samples for each treatment weredried for 24 h at 60 ◦C, weighed, and ashed in a 480 ◦Coven for 16 h. After cooling, the ash was digestedwith 2 mL concentrated HNO3, swirled and taken todryness. The sample was then dissolved in 10 mL 3 N
HCl, filtered through Whatman #40 filter paper andbrought to volume in a 25 mL volumetric flask using0.1 N HCl (final concentration 1 N HCl). For qualitycontrol, reagent blanks and an in-house Alyssum stand-ard were included. Calcium, Cu, Mg, Mn, Ni, andZn were determined by inductively-coupled plasmaatomic emission spectrometry (Perkin-Elmer Optima

228
4300 DV) using 40 mgL−1 yttrium as an internalstandard.
Sample preparation and electron microscopy
At the USDA Beltsville Electron Microscopy Facilitywe have developed low temperature scanning electronmicroscopy techniques for a wide range of bulk hy-drated botanical specimens, including whole leaves(Steere and Erbe, 1979; Wergin et al., 1999; Erbeet al., 2003). Bulk samples cannot be rapidly frozenbeyond about 20 µm depth regardless of the cryo-gen utilized because the surface layer of ice thatforms initially acts as an insulator (Robards and Sleytr,1985). High pressure freezing, which has shown bet-ter freezing in some samples, can extend the depth ofgood freezing in some tissues. However, high pres-sure freezing would significantly damage our freshleaves because we would have to dissect the leavesprior to freezing, and the samples are exposed to pres-sure and chemicals (i.e. hexadecene). Liquid nitrogen(LN2) has distinct advantages in terms of ease ofuse and consistency of results. For bulk tissues, nofreezing technique has been shown to be effective inpreventing ice crystal formation. Given that all bulkfreezing methods are relatively poor, we have foundover more than 20 years of experience that freezing ona precooled metal surface in a large volume of LN2produces very consistent freezing throughout a givensample. We do not claim that our freezing techniqueis superior or even good, only that it is consistent(Yaklich et al., 1996, 1999, 2001).
We also utilized this technique because it does notrequire any dissection of leaves, nor does it subjectthe samples to croypreservation treatments that couldpotentially leach or redistribute Ni, and most import-antly break or damage trichomes. In the worst casescenario, our freezing technique would result in themovement of solutes within cells or to adjacent cells,not throughout the leaf sample. Our previous experi-ence with handling delicate trichomes has shown thatrapid plunge freezing on copper stubs allows struc-tures and details to be observed that would not bepresent after chemical fixation (Wergin et al., 1999;Erbe et al., 2003).
Mature leaves near the apical tip of a stem for eachNiSO4 addition level were harvested on 20/10/02,after the plants had been growing in high-Ni soilfor a month. The Ni level 80 plant was harves-ted again on 13/12/02 for a follow-up analysis. Theplants with NiC4H6O4 addition levels 30 and and
60 mmol Ni kg−1 (designated in the text by NiAc 30and NiAc 60) and ‘AJ9’ Inco were harvested on12/06/03. We did not examine all the Ni acetate levelsat this time because we were also examining otherAlyssum hyperaccumulator species; these data will bereported elsewhere.
Fresh plant tissue was placed onto copper metalplate sample holders containing methyl cellulose solu-tion (Tissue Tek�). The sample holders were fash-ioned from 1.5 mm sheets of stock copper cut intoindividual 15 mm × 29 mm pieces. The plates wereimmediately plunged into a reservoir of LN2 whichrapidly cools them to −196 ◦C and firmly attaches thetissue.
Flat samples used for SEM examination of trich-ome density and general physiology were mountedand frozen in the above manner. Cross fracturedsamples for SEM-EDX analysis study were preparedby a slightly different complement fracture method.A single mature leaf near the apical tip of a stem foreach Ni addition level was harvested on 20/10/02. Leafpieces were placed into Tissue Tek-filled slots (3 mmdeep, 1 mm wide) machined in a copper cylindricalstub. The stub was plunge-frozen in LN2. Frozenleaf sections (∼ 6 × 6 mm) were fractured off underLN2, using precooled flat wafer-tipped forceps. Frac-tured pieces were placed in cryovials under LN2 anddocumented as exact complements of the leaf halvesretained in the slotted stub, and stored at −196 ◦C untilanalysis.
Upon SEM observation, the slotted stub sampleholder was transferred to the preparation chamber ofan Oxford CT 1500 HF Cryotrans System and etchedat −90 ◦C to remove contaminating water vapor andtissue water. After reducing the specimen temperaturebelow −110 ◦C, samples were Pt sputter coated andplaced on the precooled (−170 ◦C) stage of a HitachiS-4100 field emission scanning electron microscope.A series of high resolution photographs of one half ofeach complement fracture were taken at 2.0 kV.
The other halves of the complement fractures wereprepared for x-ray microanalysis by freeze drying ina custom apparatus attached to a vacuum evapor-ator. The frozen samples were placed into individualscreen vials under LN2 and stacked into a welded fit-ting. The fitting was quickly coupled to the vacuumchamber via flexible hose, and placed into a styro-foam box preloaded with metal ballast cooled withLN2 and packed with dry ice pellets. Under vacuum,the entire apparatus slowly warmed from −196 ◦Cto dry ice temperature (−78 ◦C), then upwards to

229
Figure 1. SEM-EDX guide photo of freeze dried leaf margin, Alyssum murale ‘Kotodesh’ greenhouse grown in natural serpentine soil. At theleaf margin the cell walls are thick enough to analyze independently. Letters a, b, c, denote locations of sequential spectra in keV vs. counts per100 ls (a) epidermal cell wall; (b) epidermal cell interior, note vacuolar material; (c) first layer palisade mesophyll interior.
room temperature over the course of one week. Freezedried samples remained under vacuum in the appar-atus at room temperature until mounting for x-raymicroanalysis.
X-ray microanalysis
Freeze dried samples were transported in their screenvials to the Laboratory for Biological Ultrastructureat the University of Maryland for semiquantitativeSEM-EDX analysis. We did not utilize frozen hy-drated samples for EDX because significant problemsremain with this technique with respect to (1) detec-

230
tion limits and (2) variability in water content amongcell/tissue types–both of which can be alleviated byremoving water–and (3) reduced x-ray spatial resolu-tion in frozen hydrated bulk samples (Goldstein et al.,1981; Van Steveninck and Van Steveninck, 1991). Fur-ther, Al sample coating was not available for cryogenicsamples, but proved necessary in order to analyzeindividual trichomes.
Samples were individually mounted on standardaluminum stubs coated with silver adhesive paste.Each complement fracture sample was mounted withthe aid of a binocular microscope, and handled withlightweight glass microrods. Samples were placed onedge to view the cross sections that correspond to thecomplement fracture planes. Before analysis a lightcoat of carbon was deposited on the samples at apressure of 13 Pa followed by 20 nm of aluminumdeposited at 1.3 × 10⁻³ Pa. The dual coating providesbetter dissipation of charge in biological samples, butAl has no detectable influence on x-ray signals, unlikeAu or Pt (Reid et al., 1993). The samples were storedin a dessicator until analysis.
We used an Amray 1820D scanning electron mi-croscope (KLA Tencor Corp., AMRAY Division,Bedford, MA), an EDAX ECON 4 detector with anactive area of 10 mm and an EDAX DX Prime ana-lyzer (EDAX Inc., Mahwah, NJ). The samples wereanalyzed under the following conditions: 20 kV ac-celerating voltage, 20◦ tilt, 12 mm working distance,17.66◦ takeoff angle. Each location was counted for100 live seconds (ls). Beam spot was 3 to 10 µmdepending on the application, but always less than acell diameter when targeting a specific cell/location.Every location that was analyzed was also digitallyphotographed with the AMRAY instrument (Figure 1).Figure 1 illustrates the spatial resolution we were ableto attain with the x-ray beam
Modeling the excitation volume for Ni in a plantmatrix with the EDAX software provided indicatedthat we could easily penetrate cell walls and excite theentire volume of a given cell, and this was borne out inthe spectra obtained. We counted k lines for C, O, Mg,Si, P, S, Cl, K, Ca, Mn, and k and l lines for Ni. Dataare reported in peak/background count ratios. Ratiosat or below unity indicate the element concentration isbelow detection limits. Iron Cu, Co, and Zn were be-low detection limits in all samples so are not reported.Magnesium was often below detection limits becausethe background correction was highest circa 1.5 keV.
The Alyssum leaves posed analytical challengesdue to the irregular leaf surfaces and the large number
of trichomes. Surface trichomes and epidermal tissueextending into free space had a tendency to charge andoften shifted or waved. Recoating and thicker coat-ings were utilized with these samples and subsequentsamples in order to reduce charging with only partialsuccess. In the time span of 100 ls, a location of in-terest may move completely out of the electron beam,thus potentially allowing Ni from another location tobe detected in error. Each time we analyzed a narrowor small diameter feature such as a trichome ray orguard cell we checked for beam drift, and repeated theanalysis if necessary.
ZAF calculation to 100 wt% on an H and N freebasis was utilized as a qualitative guide to Ni con-centrations in the set of samples. The Cu K line froma polished stub was the internal calibration standard.The ZAF model is not designed for biological ma-terials, however there is no truly suitable means ofhandling the high, heterogenenous concentrations ofNi (and Ca in trichomes) our bulk plant samples con-tained. The ZAF model is applicable freeze dried orfreeze substituted biological materials with mineral-containing deposits if peak/background counts areutilized, and a high degree of accuracy in light ele-ment analyses is not critical (Goldstein et al., 1981;Van Steveninck and Van Steveninck, 1991).
Aluminum and Ag peaks from the sample mountmaterial were removed from the spectrum prior tocalculation. Approximately 2 wt% N was present inthe samples, however the intensity of the N peak wasbelow the background correction for the large C andO peaks, so it was not entered into the analysis pro-gram. Concave leaf surfaces or holes can trap a certainpercentage of low energy x-rays, resulting in someanalyses with low C and O. This does not affect the Nipeak/background counts, however the ZAF calculationyields a relative Ni concentration that is too high. Inmost cases low C and O can be corrected by changingthe sample geometry or increasing the beam size, buton occasion a location simply cannot be used.
Results
Plant growth
A. murale plants at Ni levels 0, 5, 10, 20 mmol kg−1
and in Inco soil grew normally and were eventuallytransplanted to 500 g pots with the same Ni levelsand allowed to grow indefinitely. Plants grown in soilwith 40 mmol Ni kg−1 (NI 40) exhibited the onset

231
Table 1. Selected element concentrations in Alyssum murale leaves for Ni addition series (zero to80 mmol Ni kg−1) in dry weight ppm. KD: ‘Kotodesh’; AJ: ‘AJ9’. Letters a and b represent ana-lyses of duplicate plants/treatments. NI designates NiSO4 addition; NiAc designates NiC4H6O4addition. Inco samples are plants grown in contaminated mineral soil from a Ni refinery area inOntario. Alyssum std. 1, 2, 3 are duplicates of our laboratory high-Ni Alyssum standard
Sample Dry wt. (g) Ni Ca Cu Mg Mn Zn
KD NI 0a 0.072 4.60 18,300 5.77 3890 91.4 131
KD NI 0b 0.157 5.20 20,700 7.23 2740 154 145
KD NI 5a 0.198 2640 22,200 6.57 5080 201 165
KD NI 5b 0.116 4230 25,400 8.74 4010 271 400
KD NiAc 5 0.923 9240 24,900 11.0 1560 483 152
KD NI 10a 0.101 10,900 29,100 6.47 4110 286 307
KD NI 10b 0.159 9470 33,600 5.39 4550 389 199
KD NiAc 10 0.640 10,800 32,200 9.32 3110 550 125
KD NI 20a 0.160 16,300 28,500 5.29 5340 322 179
KD NI 20b 0.216 13,700 24,300 7.80 2960 223 474
KD NiAc 30a 0.430 21,200 43,200 6.7 6680 388 217
KD NiAc 30b 0.584 25,000 30,300 10.1 4820 532 204
KD NI 40a 0.133 17,300 32,400 11.4 4140 279 1110
KD NI 40b 0.108 17,000 39,700 7.35 5820 223 452
KD NiAc 60a 0.261 45,900 39,600 5.15 8000 741 272
KD NiAc 60b 0.397 30,900 37,600 5.44 5420 394 135
KD NI 80a 0.044 36,800 31,000 4.64 4210 386 266
KD NI 80b 0.087 25,900 27,500 6.67 6150 254 297
KD NiAc 90a 0.278 30,200 36,100 6.59 8670 326 224
KD Ni Ac 90b 0.462 22,400 34,100 4.79 5270 368 85.4
KD Inco a 0.133 3040 43,700 25.4 3220 125 1480
KD Inco b 0.101 1670 42,800 14.2 2500 122 139
AJ 00 (control) 0.967 5.00 48,400 8.58 4690 295 55.1
AJ Inco a 1.684 3350 29,700 7.69 5005 133 40.4
AJ Inco b 1.178 3520 29,500 11.4 4130 155 44.4
Alyssum std. 1 0.150 15,700 12,200 0.02 2080 23.4 60.2
Alyssum std. 2 0.136 15,900 12,400 0.21 2120 24.2 59.0
Alyssum std. 3 0.202 15,100 11,200 0.28 2060 23.1 60.5
of phytotoxicity, with 20% of leaves chlorotic, andleaf habit more blade-like and flattened as opposedto curved. There was no significant reduction in bio-mass for NI 40, so these plants were also transplantedto 500 g pots. NI 80 was demonstrably phytotoxic,with severe chlorosis, 60–70% reduction in biomass,minaturization of leaves, and loss of prostrate habit.After 3 months the aerial parts of NI 80 plants werenearly dead, but we continued to water them. After2–3 weeks they regrew healthy, normal size, non-chlorotic leaves. Eventually chlorosis returned to theplants but they are only 50–60% affected, and continueto grow slowly.
Plants grown at NiC4H6O4 addition levels 0, 5 10,and 30 mmol Ni kg−1 grew normally without signs of
phytoxicity. Both NiC4H6O4 60 and 90 mmol Ni kg−1
levels were demonstrably phytotoxic, with severechlorosis, 50–60% reduction in biomass, minaturiza-tion of leaves, and loss of prostrate habit. However,none of the NiC4H6O4 addition series plants died andhave been allowed to grow indefinitely. By 01/11/03,chlorosis in the NiAc 60 plants was diminished toless than 10% of leaves. Leaf size, plant growthhabit, and vigorous growth returned to normal in theNiAc 60 plants so that they became virtually indis-tinguishable from NiAc 5 and NiAc 10 plants. TheNiAc 90 plants have remained 60% chlorotic, with ex-treme miniaturization of leaves and very slow growth.Plants grown in the Oregon serpentine soil were notchlorotic, but grew more slowly, achieving only 20–

232
Figure 2. (a) Lower epidermis, frozen hydrated Alyssum murale ‘Kotodesh’ leaf, NI 00 (control). Note all following figures are frozen hydratedleaf. (b) Upper epidermis, NI 00. (c) Lower epidermis, NI 80. Trichome density is greatly reduced in this chlorotic leaf. (d) Upper epidermis,NI 80. Leaf from second growth (regeneration) of plant. Trichome density remains reduced although this leaf is not chlorotic.
25% of the biomass of the NiAc 0, 5, 10, and 30 plantsafter 9 months.
Trichomes and trichome density
The leaves of all the Alyssum species/ecotypes wegrew are covered with an overlapping network of stel-late trichomes on both the upper and lower epidermis(Figure 2). Each trichome has 8 to 14 elongate rays,some of which bifurcate. The upper sides of the raysare covered with hemispherical nodules, but the un-derside is smooth. The trichomes are attached to theepidermis with a roughly 20 µm cylindrical pediclewhich is also smooth. For A. murale ‘Kotodesh’ wehave recently utilized transmission electron micro-scopy to determine that the epidermal compartmentfrom which the trichome grows and the trichome it-
self consist of a single large cell (Broadhurst, Chaney,Angle, Erbe, Maugel, CA Murphy in preparation).
The trichome densities for A. murale ‘Kotodesh’and ‘AJ9’ were greater on the lower epidermis. Fig-ures 2a and 2b show the lower and upper epidermis ofcontrol (NI 00) ‘Kotodesh’ plants. At strongly phyto-toxic Ni levels (NI 80, NiAc 90), the trichome densitywas greatly reduced, with no overlapping trichomes(Figure 2c). The trichome density remained low whenthe NI 80 plants regenerated, although the new leaveshad not yet developed severe chlorosis (Figure 2d).The low trichome density in the NI 80 and NiAc 90plants remained unchanged after 9 to 12 months.
Metal concentrations
Total Ni levels in the whole leaves increased positivelywith Ni addition levels to a maximum of 36,800 ppm

233
(Table 1). Leaf Ni concentrations from Inco soil plantswere comparable to those achieved with NI 5. How-ever, the Ni concentration in the Inco soil is reportedat 2.9 g kg−1 (Chambers et al., 1998; Kukier andChaney, 2001), even higher than our NI 40 concen-tration (2.4 g kg−1). Manganese and Zn levels wereelevated throughout both Ni addition series as com-pared to control and standards, but do not increasewith increasing Ni.
Semiquantitative SEM-EDX analysis
Semiquantitative SEM-EDX analyses of the comple-ment fractured leaves are given in Tables 2 and 3 andFigures 1 and 3–8. The entire data set represents acomprehensive survey of cell/tissue types. For eachNi level we analyzed upper epidermal, mesophyll,and lower epidermal tissue. When a sample permitted,we analyzed multiple locations of the same cell/tissuetype. Additionally, individual samples had certain sec-ondary features that could be accessed easily or hadfavorable geometry. We analyzed trichomes, trichomepedicles, vascular tissue, cell wall, and stomates inthe samples that fortuitously presented analytical op-portunities. It was not possible to accurately analyzethese features in every sample because their pres-ence is dependent on the leaf fracture and the samplegeometry.
The cryogenic complement fracture method cleanlyshears cells, or removes discs of cell membrane sothat cell interiors can be accessed (c.f. Figures 4and 5). At all levels Ni was mainly concentrated inupper and lower epidermal cells, but was also some-what distributed throughout the mesophyll. Upper andlower epidermal cell interiors often contained roughlyspherical tissue masses which were almost certainlyvacuoles. For example, in the NiAc 60 and Incosamples (Table 2), upper epidermal cells in which thex-ray beam was focused directly on a large vacuoleare compared to cells in which the vacuole was smallor mostly absent. One advantage of freeze-drying isthat it clearly defines the vacuolar tissue. When thevacuolar tissue mass was not present in an epidermalcell interior, the Ni counts were reduced. We did notobserve the vacuolar material in any cell type exceptepidermal. A positive correlation of elevated Ni and Scounts was observed throughout the analyses (Table 2and Figure 3–8), and was very robust for epidermalcell vacuoles (r = 0.97, P < 0.001). Since thepossibility existed that additional S was provided byNiSO4 or MgSO4 we started the NiC4H6O4 series and
serpentine plants. The Ni and S correlation was alsoobserved in the plants grown with nickel acetate and inserpentine soil. We have observed this Ni/S correlationin other Alyssum hyperaccumulator species as well.
Palisade mesophyll cells directly adjacent to theupper epidermis tended to contain more Ni than thesecond layer. At most levels Ni was was not detec-ted in spongy mesophyll (Table 3). Ni was presentin all the guard cells and associated substomatal cellswe analyzed, but there were not many guard cells ac-cessible in the cross-sectioned samples. Nickel wasvirtually excluded from vascular tissue.
The cell walls of A. murale ‘Kotodesh’ are so thinthat in almost all cases they could not be analyzedindependent of the cell interiors. The majority of ana-lyses are of cell interiors; however, occasionally wedirected the beam through an intact cell wall into thecell interior to determine if there was a dramatic dif-ference in Ni counts. Without exception there was nosignificant difference in Ni counts by including cellwall. In order to further clarify this issue we lookedat leaf margin epidermal cells, where the cell wallwas thicker. Figure 1 shows spectra from the cellinterior and cell wall, illustrating that Ni is mainlyconcentrated in the cell interior.
We specifically focused on trichomes and trichomeattachment points, analyzing the following locations:(1) trichome rays on the upper and lower surface, bothproximal and distal to the attachment point. This in-cluded (1) nodules on the upper surfaces of trichomerays (see Figures 2 and 3); (2) trichome pedicles, bothattached and broken free; (3) trichome rays brokenopen so that the interior could be accessed; (4) epi-dermal compartments from which the trichome grows(trichome basal compartment); (5) intact trichome raysin which we could be certain the x-ray beam com-pletely penetrated and passed through the ray. Thislast type of trichome ray extended into free space so itcould be determined that the beam penetrated throughthe entire trichome ray but could not have hit the leafelsewhere. Beam drift was strictly controlled, and theappearance of Ag in the spectrum (from the silverpaste mounting substrate) showed that the beam fullypenetrated (i.e. ‘punched through’), which indicatesthat the excitation volume included the entire distalray, not just the surface. We found that the trich-ome basal compartment, trichome pedicle, and theepidermal cells adjacent to the trichome basal com-partment strongly concentrate Ni, but there was noappreciable Ni in the rays or nodules, or within aninner core inside the trichome. Ni x-ray counts de-

234
Figure 3. Entire leaf cross section at margin, oblique view. Selected EDX-SEM x-ray spectra to left of each image. Upper spec-trum: NI 5 guard cell on lower epidermis. Lower spectrum: NI 40 trichome basal compartment that accumulated Ni and Mn.
Figure 4. Upper epidermis and several layers of palisade mesophyll. Spectra from uppermost down: NI 80 upper epidermal cell interior; NI 40upper epidermal cell interior; NI 5 palisade mesophyll cell, first layer (directly adjacent to epidermis); NI 5 palisade mesophyll cell, second layer
Figure 5. Entire leaf cross section at margin, oblique view. Selected EDX-SEM x-ray spectra to left of each image. Upper spectrum: NI 5guard cell on lower epidermis. Lower spectrum: NI 40 trichome basal compartment that accumulated Ni and Mn.
235
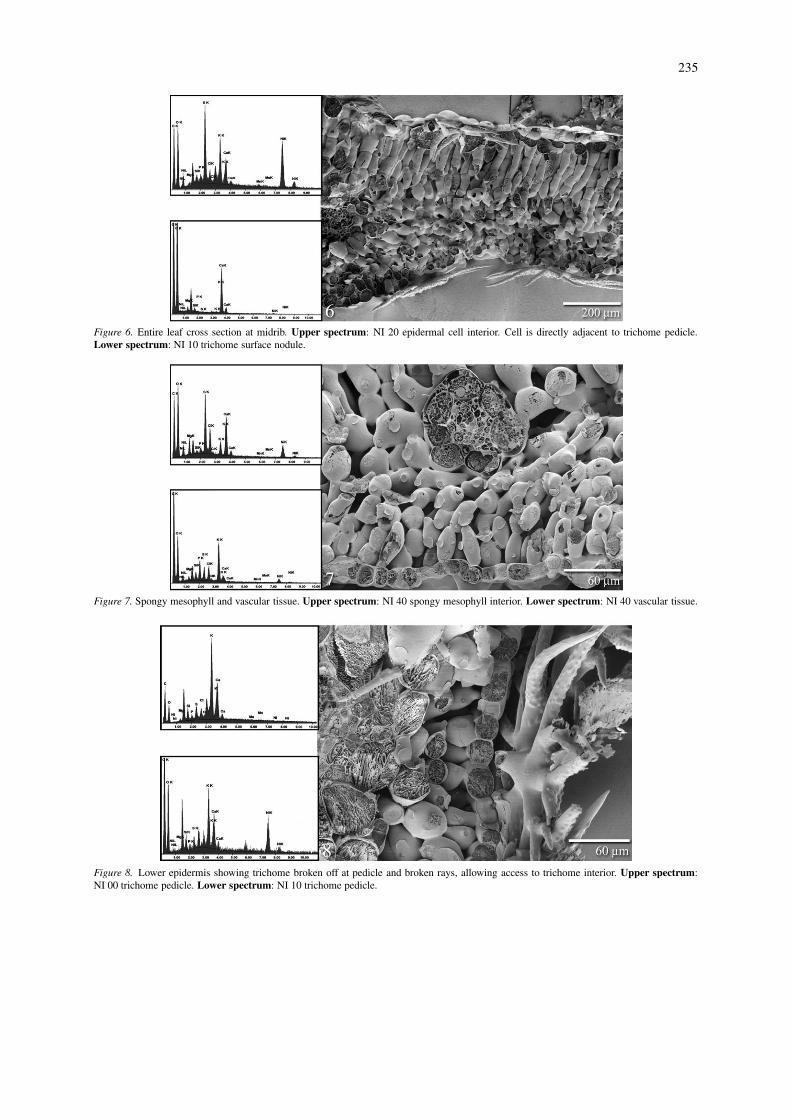
Figure 6. Entire leaf cross section at midrib. Upper spectrum: NI 20 epidermal cell interior. Cell is directly adjacent to trichome pedicle.Lower spectrum: NI 10 trichome surface nodule.
Figure 7. Spongy mesophyll and vascular tissue. Upper spectrum: NI 40 spongy mesophyll interior. Lower spectrum: NI 40 vascular tissue.
Figure 8. Lower epidermis showing trichome broken off at pedicle and broken rays, allowing access to trichome interior. Upper spectrum:NI 00 trichome pedicle. Lower spectrum: NI 10 trichome pedicle.

236
Table 2. Semiquantitative SEM-EDX analysis of Ni and other selected elements in various cell/tissue types in Alys-sum murale freeze dried leaf. All samples are ‘Kotodesh’ except Inco (‘AJ9’). Data are peak/background count ratiosfor 100 ls. Values at or below unity indicate nondetection (–). Mean and standard error (> 3 analyses) for differentcells/locations given when possible; number of analyses averaged in parentheses. Note peak and background countsfor the suite of elements analyzed are given in the spectra. First layer palisade adjacent to epidermis. +CW indicatesanalysis included cell wall and cell interior; LE: lower epidermis; UE: upper epidermis, VT: vascular tissue
X-Ray Spectral Line
Cell Type/Location Ni K Ni L S K K K Ca K Mg K
0 mmolkg−1 Ni (control) –
upper epidermal 1.5 – 1.2 6.0 1.1 1.2
palisade mesophyll – – 1.8 4.9 4.9 2.4
spongy mesophyll – – 3.1 15 1.8 3.5
lower epidermal – – 1.5 14 – –
vascular tissue – – 1.4 8.4 1.5 1.5
trichome nodule 1.4 – – – 18 2.8
trichome pedicle – – 4.1 18 7.6 1.4
5 mmolkg−1 Niupper epidermal (5) 6.6 ± 2.0 1.8 ± 0.5 6.3 ± 1.9 17 ± 2.6 3.2 ± 2.8 –
palisade mesophyll, 1st 7.1 2.3 5.8 14 3.4 –
palisade mesophyll, 2nd – – 2.6 6.7 5.6 –
spongy mesophyll – – 3.5 8.4 9.9 –
lower epidermal (3) 7.8 ± 1.2 3.7 ± 1.3 5.7 ± 1.9 18 ± 4.4 2.0 ± 0.18 1.7 ± 0.27
vascular tissue (2) – – 1.4 15 – –
guard and substomatal cells (3) 2.5 ± 0.34 – 4.2 ± 1.5 16 ± 2.2 6.7 ± 4.3 –
trichome nodule (2) – – – 4.3 23 1.5
trichome pedicle 11 1.3 3.4 10 2.5 –
trichome ray, proximala 6.1 1.7 3.5 11 9.1 1.5
trichome ray, distalb(3) – – 1.5 ± 0.08 7.0 ± 0.25 29 ± 4.5 –
10 mmolkg−1 Niupper epidermalc(3) 2.5 ± 0.5 – 6.3 ± 1.3 15 ± 2.4 – –
upper epidermal+cw (2) 4.0 1.5 7.6 19 – –
palisade mesophyll, 1st (2) 1.9 – 5.0 20 – –
palisade mesophyll, 2nd – – 3.2 13 2.7 –
palisade mesophyll, 2nd+cw – – 2.5 11 – –
spongy mesophyll – – 1.5 8.7 – –
lower epidermal (3) 6.2 ± 0.38 – 11 ± 8.0 30 ± 4.2 – –
trichome nodule (3) – – – – 31 ± 4.4 –
trichome pedicle, proximala (3) 7.5 ± 3.6 2.2 ± 1.7d 2.3 ± 0.90 8.9 ± 1.5 8.3 ± 2.1 –
trichome pedicle, distal 2.2 – – 4.35 18 –
trichome ray – – 1.8 7.0 18 –
crease as one moves distally from the trichome pointof attachment.
Calcium is strongly concentrated in trichomes, par-ticularly on the upper surface of rays and nodules.Trichome nodule analyses detected mainly C, O, andCa. On occasion Mn was strongly concentrated alongwith Ni in trichome pedicles and basal compartmentsalthough there was no enrichment of Mn in the ex-perimental soils. In the ‘Kotodesh’ plant grown in
serpentine soil, we observed a sequential enrichmentof Mn, Mn + Ni, Ni, Ni + Ca, and Ca as we movedfrom the floor of a trichome basal compartment upthrough the compartment into the pedicle. We ana-lyzed cells directly adjacent to some of the high-Mncells in order to determine if there was a contamin-ation problem, and to see if our sample preparationwas redistributing metals. To the contrary we foundthat Mn was highly localized in specific areas of trich-

237
Table 2. Continued.
X-Ray Spectral Line
Cell Type/Location Ni K Ni L S K K K Ca K Mg K
20 mmolkg−1 Niupper epidermal (3) 14 ± 2.5 3.3 ± 1.7 11 ± 5.4 17 ± 8.2 2.1 ± 0.60 –
palisade mesophyll, 1st 1.5 – 5.2 8.9 7.7 1.5
palisade mesophyll, 2nd+cw – – 2.1 6.7 9.6 1.7
spongy mesophyll + cw – – 8.2 8.2 11 4.1
lower epidermal (3) 17 ± 2.4 7.9 ± 1.0 7.5 ± 0.68 7.3 ± 2.5 – –
trichome nodule – – – – 25 4.0
trichome pediclee (2) 5.0 1.2 3.9 7.7 13 –
trichome basal compart. UE (2) 21 5.6 14 8.5 4.0 –
trichome ray, distala (3) – – – 3.0 ± 0.32 39 ± 10 –
30 mmolkg−1 Ni (NiAc)upper epidermal (3) 14 ± 0.92 3.5 ± 0.73 11 ± 5.4 5.6 ± 2.1 3.3 ± 0.92 2.0 ± 0.94
palisade mesophyll, 1st+cw (2) 1.8 – 1.8 12 – –
palisade mesophyll, 2nd+cw 5.0 1.8 2.7 14 – 1.9
spongy mesophyll, adj. VT (4) – – – 17 ± 0.94 – –
spongy mesophyll + cw 1.5 – – 6.4 – –
lower epidermal 19 1.3 6.8 5.5 2.6 –
vascular tissue (3) 1.2 ± 0.14 – – 12 ± 7.9 – –
trichome pedicle 4.7 1.3 – 3.8 5.4 2.5
trichome basal compart. LEf (3) 23 ± 4.5 4.0 ± 3.4 8.1 ± 1.6 3.9 ± 2.6 1.7 ± 0.79 nd
40 mmolkg−1 Niupper epidermal (4) 18 ± 4.1 5.2 ± 0.66 11 ± 0.1.0 10 ± 3.8 3.0 ± 0.74 –
p. mes. 1st adj. hi Mng (3) 7.1 ± 3.9 3.3 ± 1.7 7.0 ± 0.96 4.1 ± 0.52 11 ± 1.0 2.2 ± 0.47
palisade mesophyll, 1st (2) 7.8 2.7 9.4 4.2 17 1.5
palisade mesophyll, 1st + cw (2) 7.3 1.8 9.0 2.9 14 –
palisade mesophyll 3rd – – 3.74 20 1.3 4.1
spongy mesophyll (2) 11 3.5 9.2 2.8 14 3.7
lower epidermal (4) 16 ± 2.7 5.6 ± 0.63 13 ± 5.7 5.8 ± 2.6 3.0 ± 1.7 –
vascular tissue (4) 4.1 ± 1.5 1.6 ± 0.9d 3.6 ± 1.1 10 ± 4.3 1.6 ± 0.44 –
guard cell (4) 5.6 ± 0.70 3.0 ± 0.44 5.3 ± 0.86 13 ± 3.8 2.0 ± 0.59 –
trichome nodule – – – 1.7 35 1.9
trichome bsl. compart. UEg (3) 3.5 2.6 4.2 13 2.2 –
60 mmolkg−1 Ni (NiAc)UE, large vacuoles (5) 21 ± 1.3 4.8 ± 0.74 9.6 ± 0.74 8.7 ± 2.1 2.9 ± 0.89 1.5 ± 0.46
UE, small or no vacuoles (5) 7.5 ± 2.5 2.7 ± 1.4 5.1 ± 0.77 9.7 ± 3.2 2.1 ± 0.29 1.3 ± 0.21
UE, adj. high Mnh (2) 2.6 – 4.3 13 2.4 1.2
epidermis, lateral margin 12 – 8.8 13 1.8 1.2
palisade mesophyll, 1st (2) 4.2 1.8 2.2 13 7.3 2.1
p. mes., 1st , adj. hi Mnh (2) 5.0 1.2 2.6 15 7.8 1.9
vascular tissue (3) – – 1.3 ± 0.03 10 ± 2.1 1.7 ± 0.35 –
trichome bsl. compart. UEh (3) 3.7 ± 0.74 – 3.6 ± 1.8 10 ± 4.1 2.7 ± 1.1 –

238
Table 2. Continued.
X-Ray Spectral Line
Cell Type/Location Ni K Ni L S K K K Ca K Mg K
80 mmolkg−1 Niupper epidermal (5) 17 ± 1.7 4.6 ± 2.9 9.9 ± 3.8 12 ± 5.1 2.7 ± 0.38 –
palisade mesophyll, 1st (3) 1.6 ± 0.40 – 3.2 ± 0.49 13 ± 1.5 4.1 ± 1.0 1.7 ± 0.48
palisade mesophyll, 3rd 1.2 – 2.5 9.0 1.8 1.5
spongy mesophyll (2) 3.3 1.8 3.8 8.9 4.2 2.5
spongy mesophyll + cw 2.7 1.3 2.0 5.9 1.4 2.6
lower epidermal (2) 16 7.2 6.0 6.0 3.0 1.3
vascular tissue – – – 8.6 1.2 –
guard cell 5.3 3.6 1.7 2.9 2.1 –
trichome ray 2.8 – – – 27 –
bf serpentine soil
upper epidermal (3) 8.8 ± 3.2 – 12 ± 2.2 8.4 ± 8.0 11 ± 2.1 –
epidermis, lateral margin (4) 6.4 ± 1.4 – 7.2 ± 2.2 6.2 ± 2.4 5.2 ± 1.7 1.6 ± 0.42
epidermis, lat. mar. cell wall (2) 4 – 3.5 3.0 2.4 –
palisade mesophyll, 1st 2.1 – 7.4 3.5 7.3 1.7
vascular tissue – – – 6.9 3.2 –
lower epidermal (2) 11 2.0 4.9 2.9 5.8 1.1
tri. ped. c, prox. to UEi (2) – – 1.2 2.6 65 1.9
Tri. ped. d, dist. to UEi (2) – – – 2.5 120 3.9
tri. bsl. compart. b, UEi (2) 19 2.2 13 10 9.0 1.6
tri. bsl. compart. a, dist. to UEi – – 13 11 2.6 3.2
Inco soil ‘AJ9’UE, large vacuoles (3) 18 ± 5.2 2.5 ± 2.2 6.9 ± 0.68 1.3 ± 0.76d 2.2 ± 1.7d –
UE, small vacuoles (2) 5.0 – 2.3 1.8 4.5 1.2
palisade mesophyll, 1st (2) 2.0 – 3.0 3.7 1.3 1.6
palisade mesophyll, 2nd – – 3.2 5.5 – 3.1
spongy mesophyll, 1st 2.1 – 2.4 5.5 – 1.5
spongy mesophyll, 2nd – – 1.5 6.5 – –
vascular tissue (5) – – – 7.5 ± 2.6 1.3 ± 0.31 –
trichome pedicle, LE 3.1 1.5 3.3 2.9 1.5 1.7
aSample was fractured so trichome interior was accessible to the beam. Proximal is nearest trichome pedicle.bTrichome rays extended into free space and it was determined that the beam penetrated through the entire trichomeray but could not have hit any other cell types. Distal is near the end of the ray, farthest from the pedicle.cEpidermal cells contained very few vacuoles in this sample.dAt detection limit.eMn (1.5, 2.2 cts) detected at both trichome pedicle locations.fMn (3.9 cts) detected at one trichome basal compartment location.gMn (11, 8.3 cts) detected at both trichome basal compartment locations. The first layer palisade mesophyll cellsdirectly adjacent to the trichome basal compartment did not contain Mn but contained Ni.hMn (26, 22, 9 cts) detected at all 3 trichome basal compartment locations. The upper epidermal cells adjacent tothe trichome basal compartment contained Mn (3.3, 4.8) and Ni.ia, b, c, d are sequential scans moving up a single trichome basal compartment towards the upper epidermis, acrossthe epidermal line, then up the trichome pedicle away from the upper epidermis towards the trichome rays. Mncounts in the locations are (a) 21; (b) 2.7, 4.5 (c) 4.9; (d) nd.

239
Table 3. Summary of Ni localization patterns in Alyssum murale ‘Kotodesh’ leaf. Range of approxim-ate concentration values in dry weight percent. nd: not detected. na: cell type/location not observed oraccessible for analysis. First layer palisade mesophyll is adjacent to upper epidermis
Plant Treatment
Location NI 5 NI 10 NI 20 NiAc 30 NI 40 NiAc 60 NI 80
upper epidermis 2–5 1–3 14–23 6–7 5–10 1–29d, 1–3c 9–18
lower epidermis 6–7 2–14 7–8 20 15–19 22–30 7–10
palisade mesophyll, 1st layer 4 1 1 >1 4–5 1–4 1–2
P. mesophyll lower layers <1 1 1 3 4–5 na 1
spongy mesophyll <1 1 1 nd-2 8 na 1–4
vascular tissue nd na na nd 2–3 1–2 <1
trichome pedicle 9 14–19 8, 3b, 3–4 na na na
trichome ray and nodule nd-1 nd-3a nd-2a nd 1 1
trichome basal compartment na na 18–21 20–32, 4c 4, 4c 1–3, 4–20c na
guard cell and substomatal 2–4 na nd na 3–5 na 1
a First entry in range is nodule value.bTrichome pedicle at distal end, near bifurcation of rays.cSecond entry is concentration of Mn also detected. Upper epidermal cells with Mn are directly adjacentto Mn-rich trichome basal compartment.dLow end of range for 11 cells represents analyses cells without vacuoles.
ome bases, and could not be a contaminant. Overallthe strong and specific localization of Ni, Mn, Ca,and S demonstrated that our relatively simple freezingmethod is more than sufficient and does not signi-ficantly redistribute Ni or cause problems with x-raymicroanalysis.
Discussion
Alyssum murale has a remarkable ability to ac-cumulate and compartmentalize high levels of Niwithout apparent phytotoxicity. Our results for NI 40and NI 80 (2350 and 4700 mgkg−1, respectively)agree with Küpper et al. (2001), who found that2000 mgkg−1 was phytotoxic to T. goesingense,whereas 4000 mgkg−1 was nontoxic to A. lesbiacum,and A. bertolonii, and yielded 23,000 mgkg−1 Ni inleaves.
We obtained roughly equivalent total leaf Ni levelswith a soil Ni concentration from NiSO4 in Promixthat is an order of magnitude lower than the concen-tration in Inco soil. Over time Ni becomes less mobileand less phytotoxic in natural soils (Singh and Jeng,1993; Scheckel and Sparks, 2001), which could ac-count for the lower Ni levels achieved with Inco soil.Sing and Jeng (1993) reported with an initial applic-ation of 50 mg kg−1 Ni chloride to a sandy naturalsoil, the Ni concentration in rye grass declined from
48 ppm in year 1 to 8 ppm in year 3. Over 3 yearsthere was no yield reduction or phytotoxicity in theryegrass crops. A reduction in Ni phytotoxicity overtime is apparently occurring within our Promix ex-periments also, since the plants have been growingnow for 10 to 18 months. The aerial portions of theNI 80 plants were almost completely dead, yet theplant regenerated, and showed decreasing symptomsof phytotoxicity over the next 8 months. Also theNiAc 60 plants almost fully recovered from severe ini-tial phytotoxicity in less than 6 months. These resultsreinforce the premise that Ni accumulation and local-ization studies based on short-term hydroponic growthmay not be applicable to field conditions.
Our dose-response experiments revealed that Nilocalization is more complex than previously reported.We observed that some but not all lower and upperepidermal cells contain vacuoles with very high con-centrations of Ni. Basically this agrees with previousauthors who found Ni localized mainly in the epi-dermis. In A. lesbiacum and A. bertolonii treated with4000 mg kg−1 Ni, Küpper et al. (2001) found that Niwas strongly localized in epidermal cell interiors, withlesser amounts in cell walls. They observed very littleNi in the mesophyll cells or the vascular bundle. Wefound similar results, except there was little or no Ni incell walls, and the mesophyll can contain appreciableNi although the distribution is heterogeneous.

240
Previous authors utilizing similar SEM-EDX tech-niques were also able to identify more subtle metallocalization patterns. In H. floribundus, Bidwell(2000) found Ni distributed in high concentrations inthe vacuoles of epidermal cells and neighboring palis-ade and mesophyll cells. Mesjasz-Przybylowicz et al.(2001b) reported increasing Ni concentration from thecenter of the leaf outwards through the mesophyllto the epidermis in Senecio anomalochrous. We alsofound greater concentrations of Ni in mesophyll cellsdirectly adjacent to the epidermis. At phytotoxic levelsNi may not be fully excluded from any tissue, but vas-cular tissue and trichome rays are clearly not preferredNi compartments in Alyssum murale.
With detailed examination, we found that the trich-ome pedicle, trichome basal compartment, and epi-dermal cells adjacent to the trichome attachment areprimary Ni storage locations. Thus far we have ex-amined 5 of the 7 Alyssum hyperaccumulators we aregrowing, and in all cases this trichome basal compart-ment and vacuoles inside the epidermal cells directlyadjacent to it have the greatest concentrations of Niobserved anywhere in the leaf. On occasion the trich-ome basal compartment or pedicle concentrated Mnalong with Ni, even though Mn was not added to theexperimental soils.
Prior to this study there was no consensus as towhether trichomes are a storage location for hyper-acummulated metals. Psaras et al. (2000) found noNi in trichomes, whereas proton microprobe analysisof freeze-dried A. lesbiacum leaf cross sections foundthat Ni was concentrated in trichomes (Krämer et al.,1997). Several authors report that the surfaces of trich-omes are covered with Ca-rich crystallites (Psaraset al., 2000; Zhao et al., 2000; Küpper et al., 2001;Marmiroli et al., 2002). The high Ca counts can renderheavy metal mapping of the leaf surface impossible.Marmiroli et al. (2002) found one case where an A. les-biacum trichome had broken off and was inverted.The hole where the pedicle was attached gave highNi counts, indicating that Ni is concentrated in theinterior, but firm conclusions could not be based ona single trichome. Küpper et al. (2001) found identicalresults for A. lesbiacum–Ni absent from the trichomeitself, but a suggestion (observed by staining) that Niwas concentrated at the pedicle attachment point.
Küpper et al. (2000) and Zhao et al. (2000) foundthat Zn and Cd were consistently concentrated at thebase of leaf trichomes in Arabidopsis halleri, but notdistributed throughout the trichome. Blamey et al.(1986) reported that Mn was concentrated at the base
of leaf trichomes in Helianthus annuus, however theirgrowth solution had elevated levels of Mn, thus Mn ac-cumulation was interpreted as a response to potentialMn toxicity. Mn distribution was strongly heterogen-eous in the H. annuus leaf. Our results for A. muraleconcur: the trichome pedicle and trichome basal com-partment consistently yielded high Ni counts, yet Niwas not distributed throughout the trichome. In thesmall number of locations that Mn was detected, it wasfound along with Ni (i.e., dual hyperaccumulation)in the trichome pedicle, trichome basal compartment,or in (one case) epidermal cells adjacent to an Mn-rich trichome. The Ni counts were relatively reducedwhere dual hyperaccumulation was observed com-pared to trichomes where Mn was not present. Inagreement with previous work we found Ca stronglyconcentrated in trichomes, particularly on the uppersurface of rays and nodules. Trichome nodule analysesconfirm the presence of calcium carbonate or oxalatecrystallites on the trichome surface. While the Ca-richtrichomes (and their unavoidable motion in the elec-tron beam) may render conventional x-ray mapping ofa leaf surface difficult or impossible, regions on indi-vidual trichomes can be accurately analyzed with ourtechnique.
The positive correlation of elevated Ni and Scounts within epidermal cells is an interesting fea-ture of this work that deserves further study. Küpperet al. (2001) reported a positive correlation betweenNi and S in individual EDX cell analyses of A. ber-tolonii and A. lesbiacum but not for T. goesingense.The correlation was particularly robust for epidermalcell interiors, and Küpper et al. (2001) attributed it toSO2−
4 behaving as counter ion to Ni2+ in vacuoles. Weagree with this explanation: the levels of S that wehave measured consistently in leaves grown in soilswith and without SO2−
4 addition are so high that acounter ion seems the only reasonable role. It doesnot seem likely that this much S can be accounted forby sulfur-containing organic ligands. It is possible thatfor Alyssum most Ni is stored in an inorganic sulfateform in vacuoles, with lesser amounts linked to or-ganic ligands such as citrate or histidine (Sagner et al.,1998; Krämer et al., 2000; Kerkeb and Krämer, 2003)in other locations or cell types. In contrast, althoughBidwell (2000) found the same general Ni localizationpattern in Hybanthus floribundus as we did, she didnot observe an association of Ni and S in vacuoles.
We do not consider point analyses as a substitutefor x-ray mapping, but rather a complement to thatprocedure. Given the number of Alyssum hyperaccu-

241
mulator species alone, x-ray mapping of leaf crosssections at one Ni soil level must be used to under-stand the basic Ni localization patterns throughout thegenus. However, each x-ray map produced is likelyto turn up the same information–namely that Ni islocalized in the epidermis. X-ray mapping of hyper-accumulator leaves is not sensitive in depicting smallvariations in element concentration (Zhao et al., 2000).In order to identify heterogeneity in metal localizationpatterns within a given species, and subtle variationsin hyperaccumulation between species/ecotypes, it isnecessary to examine individual cells or tissues, andto optimize the sample geometry for that particularlocation. The Ni storage patterns in trichomes and va-cuoles, and the dual hyperaccumulation of Mn and Niin trichome basal compartments could never have beenobserved or understood without doing this.
Acknowledgements
We greatly appreciate the assistance of USDA-ARSpersonnel Carrie Green for ICP analyses and Chris-topher Pooley for computer graphics.
References
Bidwell S D 2000 Hyperaccumulation of Metals in AustralianNative Plants. Ph.D. thesis, School of Botany, University ofMelbourne, Australia.
Blamey F P C, Joyce D C, Edwards D G and Asher C J 1986 Roleof trichomes in sunflower tolerance to manganese toxicity. PlantSoil 91, 171–180.
Chambers D B, Chaney R L, Conard B R, Garisto N C, Kukier U,Phillips H A and Fernandes S 1998 Risk Assessment for Nickelin Soil, with a Critical Review of Soil-Nickel Phytotoxicity.White Paper Report to Ontario Ministry of the Environment forInco Ltd.
Chaney R L, Angle J S, Baker A J M and Li Y.-M 1999 Methodfor Phytomining of Nickel, Cobalt and Other Metals from Soil.US Patent No. 5,944,872 issued Aug. 31, 1999. (Continuation-in-Part of US Patent 5,711,784 issued Jan. 27, 1998).
Echlin P and Taylor S E 1986 The preparation and x-ray microana-lysis of bulk frozen hydrated vacuolate plant tissue. J. Microsc.141, 329–348.
Erbe E F, Rango A, Foster J, Josberger E, Pooley C and Wer-gin W P 2003 Collecting, shipping, storing and imaging snowcrystals and ice grains with low temperature scanning electronmicroscopy. Microsc. Res. Tech. 62, 19–32.
Goldstein J I, Newbury D E, Echlin P, Joy D C, Fiori C and LifshinE 1981 Scanning Electron Microscopy and X-ray Microanalysis.Plenum Press, New York.
Heath S M, Southworth D and D’Allura J A 1997 Localizationof nickel in epidermal subsidiary cells of leaves of Thlaspimontanum var. Siskiyouense (Brassicacea) using energy dispers-ive x-ray microanalysis. Int. J. Plant Sci. 158, 184–188.
Kerkeb J and Krämer U 2003 The role of free histidine in xylemloading of nickel in Alyssum lesbiacum and Brassica juncea.Plant Physiol. 131, 716–724.
Krämer U Grime G W, Smith J A C, Hawes C R and Baker A J M1997 Micro-PIXE as a technique for studying nickel localizationin leaves of the hyperaccumulator Alyssum lesbiacum. NuclearInst. Meth. Phys. Res. B130, 346–350.
Krämer U Pickering I J, Prince R C, Raskin I and Salt D E2000 Subcellular localization and speciation of nickel in hyper-accumulator and non-hyperaccumulator Thlaspi species. PlantPhysiol. 122, 1343–1353.
Kukier U and Chaney R L 2001 Amelioration of nickel phytotox-icity in muck and mineral soils. J. Environ. Qual. 30, 1949–1960.
Küpper H, Lombi E, Zhao F-J and McGrath S P 2000 Cellular com-partmentation of cadmium and zinc in relation to other metals inthe hyperaccumulator Arabidopsis halleri. Planta 212, 75–84.
Küpper H, Lombi E, Zhao F-J, Wieshammer G and McGrath S P2001 Cellular compartmentation of nickel in the hyperaccu-mulators Alyssum lesbiacum, Alyssum bertolonii and Thlaspigoesingense. J. Exp. Bot. 52, 2291–2300.
Li Y-M Chaney R L, Brewer E, Angle J S and Nelkin J 2003aPhytoextraction of nickel and cobalt by hyperaccumulator Alys-sum species grown on nickel-contaminated soils. Environ. Sci.Technol. 37, 1463–1468.
Li Y-M Chaney R, Brewer E, Rosenberg R, Angle J S, Baker A,Reeves R and Nelkin J 2003b Development of a technology forcommercial phytoextraction of nickel: economic and technicalconsiderations. Plant Soil 249, 107–115.
Marmiroli M, Maestri E, Gonelli C, Gabrielli R and Marmiroli N2002 Dealing with Ni: comparison between a hyperaccumulatorand a non-hyperaccumulator species of Alyssum on serpentinesoils. Abstracts for the New Phytologist Symposium ‘HeavyMetals and Plants: form Ecosystems to Biomolecules’, 30 Sept to1 Oct 2002, University of Pennsylvania, Philadelphia, PA. NewPhytologist trust, London.
Mesjasz-Przybylowicz J, Balkwill K, Przybylowicz W J and An-negarn H J 1994 Proton microprobe and x-ray fluorescence in-vestigations of nickel distribution in serpentine flora from SouthAfrica. Nuclear Inst. Meth. Phys. Res. B 89, 208–212.
Mesjasz-Przybylowicz J, Przybylowicz W J and Pineda C A 2001aNuclear microprobe studies of elemental distribution in apicalleaves of the Ni hyperaccumulator Berkheya coddii. S. Afr. J.Sci. 97, 591–593.
Mesjasz-Przybylowicz J, Przybylowicz W J, Rama DBK and PinedaC A 2001b Elemental distribution in Senecio anomalochrous, aNi hyperaccumulator from South Africa. S. Afr. J. Sci. 97, 593–595.
Nott J A 1991 Cytology of pollutant metals in marine invertebrates:a review of microanalytical applications. Scan. Micros. 5, 191–205.
Pedersen M, Roomans G M, Andren M, Lignell Å, Lindhahl A,Wallström K and Forsberg Å 1981 X-ray microanalysis of metalsin algae: a contribution to the study of environmental pollution.Scan. Electron Micros. II, 499–509.
Psaras G K, Constantinidis T H, Cotsopoulos B and Maneta Y 2000Relative abundance of nickel in the leaf epidermis of eight hy-peraccumulators: evidence that the metal is excluded from bothguard cells and trichomes. Ann. Bot. 86, 73–78.
Reid A P, Oates K and Potts W T W 1993 The effect of aluminumcoating on elemental signals in x-ray microanalysis. Microsc.Res. Tech. 24, 168–172.
Robinson B H, Lombi E, Zhao F J and McGrath S P 2003 Uptakeand distribution of nickel and other metals in the hyperaccumu-lator Berkheya coddii. New Phytol. 158, 279–285.

242
Sanger S, Kneer R, Wanner G, Cosson J P, Deus-Neumann B andZenk M H 1998 Hyperacumulation, complexation and distribu-tion of nickel in Serbertia acuminata. Phytochem. 47, 339–347.
Scheckel K G and Sparks D L 2001 Dissolution kinetics of nickelsurface precipitates on clay minerals and oxide surfaces. Soil Sci.Am. J. 65, 685–694.
Singh B R and Jeng A S 1993 Uptake of zinc, cadmium, mercury,lead, chromium, and nickel by ryegrass grown in a sandy soil.Norw. J. Agric. Sci. 7, 147–157.
Steere R L and Erbe E F 1979 Complementary freeze-fracture,freeze-etch specimens. J. Microscopy 117 pt. 2, 211–218.
Van Steveninck R F M and Van Steveninck M E 1991 Microanlysis.In Electron Microscopy of Plant Cells. Eds. J L Hall and CHawes. pp. 415–455. Academic Press, New York
Vazquez M D, Barcelo J, Poschendrieder C H, Madico J, HattonP, Baker A J M and Cope G H 1992 Localization of zinc andcadmium in Thlaspi caerulescens (Brassicacea), a metallophytethat can hyperaccumulate both metals. J. Plant Physiol. 140,350–355.
Wergin W P R, Yaklich R W and Erbe E F 1999 Advantages andapplications of low temperature scanning electron microscopy. InFocus on Multidimensional Microscopy, Vol. 1. Eds. P C Chenget al. pp. 262–279. World Scientific, Singapore.
Yaklich R W, Wergin W P, Murphy C A and Erbe E F 2001 Anatomyof the phloem and xylem in the vascular sutures of the soybeanpod. Seed Sci. Technol. 29, 109–120.
Yaklich R W, Wergin W P, Erbe, E F and Murphy C A 1999 Scan-ning and transmission electron microscopy of the soybean carpelpericarp. Seed Sci. Technol. 27, 579–590.
Yaklich R W, Wergin W P and Erbe E F 1996 Observation ofunique structures between the endosperm and embryo in seedsof Glycine Max. Seed Sci. Res. 6, 1–7.
Zhao F-J, Lombi E, Breedon T and McGrath, S P 2000 Zinc hy-peraccumulation and cellular distribution in Arabidopsis halleri.Plant Cell Environ. 23, 507–514.
Section editor: A.J.M. Baker