NEW TYLOPHORINE ANALOGS AS POTENTIAL ... - CORE
162
NEW TYLOPHORINE ANALOGS AS POTENTIAL ANTITUMOR AGENTS Linyi Wei A dissertation submitted to the faculty of the University of North Carolina at Chapel Hill in partial fulfillment of the requirements for the degree of Doctor of Philosophy in School of Pharmacy. Chapel Hill 2006 Approved by: Advisor: Dr. Kuo-Hsiung Lee Reader: Dr. Kenneth F. Bastow Reader: Dr. Arnold Brossi Reader: Dr. Jian Liu Reader: Dr.Qian Shi brought to you by CORE View metadata, citation and similar papers at core.ac.uk provided by Carolina Digital Repository
-
Upload
khangminh22 -
Category
Documents
-
view
0 -
download
0
Transcript of NEW TYLOPHORINE ANALOGS AS POTENTIAL ... - CORE

NEW TYLOPHORINE ANALOGS AS POTENTIAL ANTITUMOR AGENTS
Linyi Wei
A dissertation submitted to the faculty of the University of North Carolina at Chapel Hill in partial fulfillment of the requirements for the degree of Doctor of Philosophy in School of Pharmacy.
Chapel Hill 2006
Approved by:
Advisor: Dr. Kuo-Hsiung Lee
Reader: Dr. Kenneth F. Bastow Reader: Dr. Arnold Brossi Reader: Dr. Jian Liu Reader: Dr.Qian Shi
brought to you by COREView metadata, citation and similar papers at core.ac.uk
provided by Carolina Digital Repository

©2006 Linyi Wei
ALL RIGHTS RESERVED
ii

1 ABSTRACT
LINYI WEI: Design, Synthesis and Biological Evaluation of New Tylophorine
Analogs as Potential Antitumor Agents
(Under the direction of Kenan Professor Kuo-Hsiung Lee)
Tylophorine and related phenanthroindolizidine alkaloids isolated principally from
Asclepiadaceae have been targets of synthetic modification because of their profound
cytotoxic antitumor activity. As part of our interest in plant-derived antitumor agents, novel
water-soluble phenanthrene-based tylophorine derivatives (PBTs) were designed, synthesized
and evaluated for anticancer activity.
Several PBTs showed superior activity profiles with EC50 values in the sub-micromolar
range, which are comparable to those of currently used antitumor drugs. A structure-activity
relationship (SAR) study was also explored to facilitate the further development of this new
compound class.
Subsequently, C9-substituted PBTs were designed and synthesized using 2, 3
methylenedioxy-6-methoxyphenanthrene as a common skeleton based on our prior SAR
findings. The C-9 site is an ideal position for introducing more polar, water-solubility-
enhancing moieties. We also extended the in vitro antitumor screening to include additional
significant tumor types [A549 (lung), DU-145 (prostate), ZR-751 (breast), KB
(nasopharyngeal)] as well as a multi-drug resistant cancer cell subline [KB-Vin (multi-drug
iii

resistant KB subline)]. Most of the compounds showed fairly uniform and potent cytotoxic
activity with EC50 ≅10-7 M against both wild type and matched multi-drug resistant KB cell
lines, and displayed notable selectivity toward DU-145 (prostate) and ZR-751 (breast) cancer
cell lines.
A combination of QSAR modeling and database mining was used to facilitate further
design and discovery of novel anticancer PBTs. MolConnZ 2D topological descriptors were
applied to a dataset of 52 chemically diverse PBTs and variable selection models were
generated using the κ nearest neighbor (κNN) method. The derived κNN QSAR models
have high internal accuracy, with leave-one-out cross-validated R2 (q2) values ranging
between 0.6 and 0.8. The original dataset was then divided into several training and test sets
to provide highly predictive models with q2 values greater than 0.5 for the training sets and
R2 values greater than 0.6 for the test sets. The ten best models were capable of mining the
commercially available ChemDiv Database (450,000 compounds) and resulted in 34
consensus hits. Of these 34 compounds, 10 compounds were tested and 8 were confirmed to
be active with a best EC50 of 1.8 µM. These models were further validated by predicting the
activity of four new PBTs compounds with reasonable accuracy and 11 consensuses hits with
R2 of 0.52. These results indicate that this approach can be successfully applied to further
design and discovery of anticancer drug candidates from this compound class.
iv

2 ACKNOWLEDGEMENTS
This work is a result of several people’s direct and indirect tireless contributions. My
thesis would not have been successful without all of them. I would like to express my sincere
appreciation and respect to the following:
To my advisor, Dr. Kuo-Hsiung Lee, for his encouragement, support, guidance and
criticism as I fumbled my way through my Ph.D. study.
To my co-advisors Dr. Kenneth F. Bastow and Dr. Arnold Brossi, for their direct
contribution and continuous support on organic synthesis and biological evaluation, without
them, this project could not be completed.
To Dr. Jian Liu and Dr. Qian Shi, for their advice, criticism and encouragement.
To Dr. Susan Morris-Natschke for her tremendous time and patience on my
publications and dissertation.
To Dana Deason for her cheering me up and Dr. Shuxing Zhang for his help on
molecular modeling study.
I also would like to extend my thanks to all members and collaborators of the NPL for
their help and friendship over the years.
Finally, my deepest grateful thanks are due to my parents, Ningzheng Wei and
Youying Liang, for their love, support, understanding and encouragement of my life!
v

3 TABLE OF CONTENTS
LIST OF TABLES............................................................................................................ xii
LIST OF FIGURES ......................................................................................................... xiii
LIST OF SCHEMES......................................................................................................... xv
LIST OF SYMBOLS AND ABBREVIATIONS………………………………………..xvi
CHAPTER I. Tylophorine and Its Analogs ....................................................................... 1
1.1 Isolation of Tylophora......................................................................................... 1
1.2 Chemical Spectrum of Tylophora....................................................................... 2
1.3 Total Synthesis of Tylophorine-related Alkaloids.............................................. 3
1.4 SAR of Tylophorine-related Alkaloids............................................................... 3
1.5 Antitumor Activity of Tylophora........................................................................ 6
1.6 Mechanism of Antitumor Activity...................................................................... 7
1.6.2 Inhibition of DNA, RNA and Protein Synthesis......................................... 7
1.6.3 Apoptosis Induction.................................................................................... 8
1.6.4 Inhibition of Thymidylate Synthase (TS) and Dihydrofolate Reductase (DHFR) ....................................................................................................... 8
1.6.5 Inhibition of Activator Protein-1, CRE, and NF-kB................................... 9
1.6.6 Selective Interaction between Tylophorine B and Bulged DNA.............. 10
1.7 Conclusions....................................................................................................... 11
1.8 References......................................................................................................... 12
vi

CHAPTER II. Research Design....................................................................................... 15
2.1 Introduction....................................................................................................... 15
2.2 Significance....................................................................................................... 16
2.3 Specific Aims.................................................................................................... 17
2.3.1 Specific Aim 1: ......................................................................................... 17
2.3.2 Specific Aim 2: ......................................................................................... 17
2.3.3 Specific Aim 3: ......................................................................................... 18
2.3.4 Specific Aim 4: ......................................................................................... 18
2.4 References......................................................................................................... 19
CHAPTER III. Design, Synthesis and Biological Evaluation of New Phenanthrene- Based Tylophorine Derivatives (Part I) .................................................. 20
3.1 Introduction....................................................................................................... 20
3.2 Design of Synthesis........................................................................................... 23
3.3 Chemistry.......................................................................................................... 24
3.4 Results and Discussion ..................................................................................... 25
3.4.1 Structure-Activity Relationship (SAR) Analysis...................................... 25
3.5 Conclusions....................................................................................................... 27
3.6 Experimental Section ........................................................................................ 27
3.6.1 Instruments and Chemicals ....................................................................... 27
3.6.2 General Preparation .................................................................................. 28
3.6.3 Chemistry.................................................................................................. 31
3.6.4 Cell Growth Inhibition Assay ................................................................... 40
vii

3.7 References......................................................................................................... 47
CHAPTER IV. Design, Synthesis and Cytotoxic Evaluation of 9-Substituted Phenanthrene-Based Tylophorine Derivatives (PBTs) (Part II) ............. 48
4.1 Introduction....................................................................................................... 48
4.2 Design and Synthesis ........................................................................................ 49
4.3 Chemistry.......................................................................................................... 50
4.4 Results and Discussion ..................................................................................... 50
4.4.1 Structure-Activity Relationship (SAR) Studies ........................................ 51
4.4.2 Drug-Resistance Study.............................................................................. 52
4.5 Conclusions....................................................................................................... 54
4.6 Experimental Section ........................................................................................ 54
4.6.1 Instruments and Chemicals ....................................................................... 54
4.6.2 Chemistry.................................................................................................. 55
4.6.3 General Procedures ................................................................................... 56
4.6.4 Chemistry.................................................................................................. 59
4.6.5 Cell Growth Inhibition Assay ................................................................... 65
4.7 References......................................................................................................... 70
CHAPTER V. Quantitative Structure-Activity Relationship Analysis of Phenanthrine -based Tylophorine Derivatives Using k-Nearest Neighbor (kNN) and
Database Mining ....................................................................................... 71
5.1 Introduction....................................................................................................... 71
5.2 Dataset and Biological Activity ........................................................................ 73
5.3 Computational Methods.................................................................................... 74
viii

5.3.1 Generation of Molecular Descriptors........................................................ 74
5.3.2 Dataset Division into Training and Test Sets ........................................... 74
5.3.3 κNN QSAR Method ................................................................................. 76
5.3.4 Robustness and Predictive Power of QSAR Models (Y-Randomization Test) .......................................................................................................... 78
5.3.5 Applicability Domain of kNN QSAR Models.......................................... 80
5.3.6 Database Mining ....................................................................................... 81
5.4 Results and Discussion ..................................................................................... 82
5.4.1 QSAR Models and Their Robustness ....................................................... 82
5.4.2 kNN QSAR Model Validation.................................................................. 83
5.4.3 Interpreting Predictive QSAR Models...................................................... 86
5.4.4 Database Mining with Predictive QSAR Models ..................................... 87
5.4.5 Prediction of Anticancer Activity for an External Data Set ..................... 88
5.5 Conclusions....................................................................................................... 90
5.6 References....................................................................................................... 103
CHAPTER VI. ADME Evaluation and Mode of Action Study .................................... 107
ADME Evaluation
6.1 Introduction..................................................................................................... 107
6.2 Methodology................................................................................................... 108
6.2.1 Prediction of CNS Toxicity .................................................................... 108
6.2.2 Prediction of Human Intestinal Absorption and Plasma Protein Binding.................................................................................................... 108
6.2.3 Results and Discusion............................................................................. 108
ix

Mode of Action Study
6.3 Introduction..................................................................................................... 110
6.4 NCI-DTP Human Tumor Cell Lines Screening ............................................. 111
6.4.1 Methodology of the In Vitro Cancer Screen........................................... 112
6.4.2 Results and Discussion ........................................................................... 114
6.5 MD Anderson Cancer Center: ........................................................................ 114
6.5.1 Method of MTT Assay............................................................................ 114
6.5.2 Results and Discussion ........................................................................... 115
6.6 Anti-Telomerase Assay................................................................................... 120
6.6.1 Methods................................................................................................... 121
6.6.2 Results..................................................................................................... 123
6.7 In Vivo Study................................................................................................... 125
6.7.1 Objective ................................................................................................. 125
6.7.2 Methods................................................................................................... 126
6.7.3 Results and Discussion ........................................................................... 127
6.8 References....................................................................................................... 130
CHAPTER VII. Conclusions and Future Studies .......................................................... 133
7.1 Structure Activity Relationships ..................................................................... 133
7.2 Future Studies ................................................................................................. 137
7.2.1 Short Synthesis of Phenanthroindolizidine Alkaloids. ........................... 137
7.2.2 Parallel Synthesis of PBTs...................................................................... 138
7.2.3 Making Organic/inorganic Salt............................................................... 140
x

7.2.4 Design of Bioisosteric Skeleton Modification........................................ 141
7.2.5 Mechanism of Action Study ................................................................... 142
7.2.6 QSAR Study and Database Mining ........................................................ 142
7.3 References....................................................................................................... 144
xi

LIST OF TABLES
Table 3-1. Cytotoxicity of 2,3-methylenedioxy-6-alkyloxy-9-substituted PBT analogs . 42
Table 3-2. Cytotoxicity of 2,3,6-trimethyoxy-9-substituted PBT analogs ....................... 45
Table 3-3. Cytotoxicity of seco-PBT analogs................................................................... 46
Table 4-1. Cytotoxicity of 6-methoxy-9-substituted PBTs............................................... 66
Table 4-2. Cytotoxicity of 6-benzyloxy-9-substituted PBTs............................................ 67
Table 4-3. Cytotoxicity of PBTs in different cancer cell lines. ........................................ 68
Table 5-1. Structure and cytotoxic activity of PBTs (3-40) used in model building....... 92
Table 5-2. Structure and cytotoxic activity of PBTs (41-48) used in model building..... 96
Table 5-3. Structure and cytotoxic activity of PBTs (49-54) used in model building..... 97
Table 5-4. Ten best model kNN QSAR models. .............................................................. 99
Table 5-5. Structure and cytotoxic activity for compounds (59-68) from ChemDiv ..... 100
Table 5-6. Structure and cytotoxic activity for PBTs (55-58) in external set................. 102
Table 6-1. ADME predictions of PBT compounds vs tylophora alkaloids.................... 109
Table 7-1. SAR of PBTs. ................................................................................................ 135
xii

LIST OF FIGURES
Figure 1-1. Tylophora (Asclepiadaceae)............................................................................. 1
Figure 1-2. Chemical structures of tylophorine, tylocrebrine, antofine and tylophorinine. 2
Figure 1-3. Tylophorine B benzene solvate........................................................................ 2
Figure 1-4. Triangulation of N-O-O in nonalkylating antileukemic agents. ...................... 3
Figure 1-5. A model for the binding of emetine-type agonist to the hypothetical receptor site. .................................................................................................................... 4
Figure 1-6. Chemical structures of phenanthroindolizidine alkaloids ................................ 5
Figure 1-7. Structures of 6,7-diphenylindolizidinone analogs............................................ 6
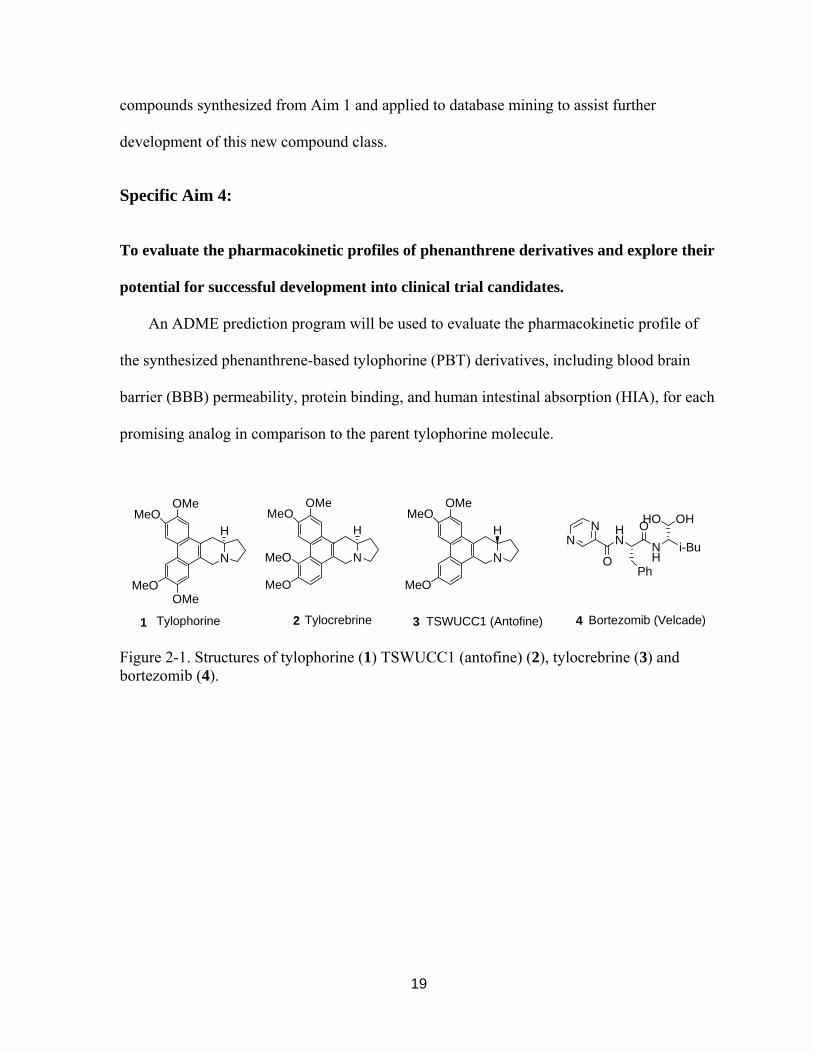
Figure 2-1. Structures of tylophorine (1), tylocrebrine (2), TSWUCC1 (antofine) (3) and bortezomib (4). ......................................................................................... 18
Figure 3-1. Structures of TSWUCC-1 (antofine) and tylocrebine.................................... 20
Figure 5-1. Flowchart of the kNN method........................................................................ 78
Figure 5-2. Plots of q2 versus the number of descriptors selected for the best kNN QSAR models for 52 PBTs............................................................................. 83
Figure 5-3. R2 versus q2 for all selected models with q2>0.5. .......................................... 85
Figure 5-4. Plot of Actual versus Predicted activity for one of the best 10 models. ........ 85
Figure 5-5. Plot of Actual versus Predicted activity for the screened and the designed compounds. ................................................................................................... 90
Figure 6-1. Structure of tylophora alkloids and PBTs (1-4). .......................................... 109
Figure 6-2. Structure of WLY-series .............................................................................. 116
Figure 6-3. MD Anderson Screening Data - Inhibition of compound WP6COOH........ 116
Figure 6-4. MD Anderson Screening Data - Inhibition of compound WaispOH........... 117
Figure 6-5. MD Anderson Screening Data - Inhibition of WP5OH............................... 117
Figure 6-6. MD Anderson Screening Data -Inhibition of WHP6COOH........................ 118
xiii

Figure 6-7. MD Anderson Screening Data – Inhibition of compounds WaC6OH, WaispOH, Wa4OH and WaLP6OH at 0, 0.5, 2 µM..................................... 118
Figure 6-8. MD Anderson Screening Data – Inhibition of compounds WaC6OH, WaispOH, Wa4OH and WaLP6OH at 0, 0.5, 2 µM..................................... 119
Figure 6-9. Structures of compounds 40-45 ................................................................... 124
Figure 6-10. Telomerase assemblage assay .................................................................... 124
Figure 6-11. Telomerase activity inhibition by compounds 40-45................................. 125
Figure 6-12. Structures of WLY-WaispOH, WLY-WaLP6OH, WLY-Wa4OH and WLY-WaC6OH .......................................................................................... 125
Figure 6-13. The tumor growth curves in SCID mice treated with WLY-WaispOH..... 128
Figure 6-14. The body weight curves in SCID mice treated with WLY-WaispOH, WLY-Wac6OH, WLY-WaLP6OH and WLY-Wa4OH............................. 129
Figure 7-1. SAR Study of PBTs ..................................................................................... 133
Figure 7-2. Structures of promising PBTs developed in the NPL .................................. 134
Figure 7-3. Structure formulas of new PBTs ................................................................. 140
xiv

LIST OF SCHEMES
Scheme 3-1. Attempted total synthesis of TSWUCC1..................................................... 21
Scheme 3-2. Total synthesis of new phenanthrene-based tylophorine derivatives .......... 23
Scheme 4-1. Synthesis of 6-methoxy-9-substituted PBTs................................................ 49
Scheme 7-1. Short total synthesis of antofine................................................................. 137
Scheme 7-2. Lewis acid mediated Friedel-Crafts type cyclization................................. 137
Scheme 7-3. Parallel synthesis of PBTs ......................................................................... 138
xv

LIST OF SYMBOLS AND ABBREVIATIONS
ADME Absorption, Distribution, Metabolism, and Excretion
BBB Blood Brain Barrier
BMS Borane-Methyl Sulfide complex
CDCl3 Deuterated chloroform
CNS Central Nervous System
d Doublet
dd Double doublet
DCM Dichloromethane
DIC 1,3-Diisopropylcarbodiimide
DHFR Dihydrofolate reductase
DIEA N,N`-Diisopropylethylamine
DMAP 4-(Dimethylamino) pyridine
DMF Dimethyl formamide
DMSO Dimethyl sulfoxide
The concentration that reduced the cell number by 50% EC50
N-(3-Dimethylaminopropyl)-N'-ethylcarbodiimide hydrochloride EDC
FDA Food and Drug Administration
HDP Hypothetical Descriptor Pharmacophore
N-2-Hydroxyethylpiperazine-N'-2-ethanesulfonic acid HEPES
HIA Human Intestinal Absorption
HOBt 1-Hydroxybenzotriazole
xvi

IP Intraperitoneal
IVCLSP In Vitro Cell Line Screening Project
J Coupling constant
kNN k Nearest Neighbor
LOO Leave-One-Out
m Multiplet
MDR Multi-Drug Resistant
MML Molecular Modeling Laboratory
MS Mass Spectrum
MTT [3, (4,5-Dimethylthiazol-2-yl) 2,5-diphenyl tetrazolium bromide]
MZ MolConnZ
NCE New Chemical Entities
NF-kB Nuclear Factor κB
NMR Nuclear Magnetic Resonance
N-Methylmorpholine NMM
NPL Natural Products Laboratory
PBTs Phenanthrene-Based Tylophorine derivatives
PPA Polyphosphoric Acid
PPB Plasma Protein Binding
q Quartet
QSAR Quantitative Structure-Activity Relationship
RRL Rabbit Reticulocyte Lysates
s Singlet
xvii
SAR Structure-Activity Relationship
SCID Severe Combined Immune Deficiency
SRB Sulforhodamine B
t Triplet
TCM Traditional Chinese Medicine
THF Tetrahydrofuran
TLC Thin-Layer Chromatography
TMS Tetramethyl Silane
TS Thymidylate Synthase
Chemical Shift δ
xviii

4
1 CHAPTER I. TYLOPHORINE AND ITS ANALOGS
1.1 ISOLATION OF TYLOPHORA
Figure 1-1. Tylophora (Asclepiadaceae)
Tylophorine (1) (Figure 1-2) and its analogs, phenanthroindolizidine alkaloids also
referred to as tylophora alkaloids, have been isolated primarily from plants of the family
Asclepiadaceae1-4 (Figure 1-1), including members of the genus Tylophora, Vincetoxicum,
Pergularia, Cynanchum, but also from Hypoestes verticillaris (Acanthaceae),5 Cryptocarya
phyllostemmon (Lauraceae),6 Ficus hispida,7 and F. septica (Moraceae).8 The most
important phenanthroindolizidine alkaloids are tylophorine (1), tylocrebrine (2), antofine (3)
and tylophorinine (4) (Figure 1-2).

OMeMeO
MeOR2
R1 N
H
1. Tylophorine: R1=H, R2= OMe2. Tylocrebrine: R1=OMe, R2= H3. Antofine: R1=H, R2= H
MeO
MeO
OMe
N
HOH
4. Tylophorinine
Figure 1-2. Chemical structures of tylophorine, tylocrebrine, antofine, and tylophorinine.
1.2 CHEMICAL SPECTRUM OF TYLOPHORA
AB
C
D
EN
O
O O
C6H6
Figure 1-3. Tylophorine B benzene solvate.
Pure dried tylophorine is a yellow powder and crystallization in common solvents is
difficult. Tylophorine B’s (Figure 1-3) structure has conjoined phenanthrene and
indolizidine moieties. The aromatic rings lie almost in the same plane with dihedral angles
of 1.7o (A/B), 2.8o (B/C), 2.2o (A/C), and 7.3o (B/D). The E ring adopts an envelope
conformation and makes a dihedral angle of 6.7(3)° with the D ring.9
2

1.3 TOTAL SYNTHESIS OF TYLOPHORINE-RELATED ALKALOIDS
The tylophorine (phenanthroindolizidine alkaloid) nucleus was first synthesized by
Govindachari et al. in 195810 followed by the synthesis of cryptopleurine
(phenanthroquinolizidine alkaloid) by Bradsher and Berger11 as well as Marchini and
Belleau.12 Most naturally occurring tylophorine alkaloids (e.g., tylophorine, tylophorinine,
and tylocrebine) have been synthesized, and the earlier routes before 1985 were well
summarized in a comprehensive review by Suffness and Cordell.13 The more recently
reported synthetic approaches have been reviewed by Li et al.14and Michael.15,16
1.4 SAR OF TYLOPHORINE-RELATED ALKALOIDS
N
MeO
MeO
OMe
MeO
Figure 1-4. Triangulation of N-O-O in nonalkylating antileukemic agents.
In 1970, Zee-Cheng and Cheng17 proposed a common structural feature among non-
alkylating antileukemic agents, including emetine, camptothecin, tylocrebrine, tylophorine,
vinblastine, and vincristine. This commonality involves a triangulation composed of one
nitrogen and two oxygen atoms with relatively definite interatomic distances (Figure 1-4).
N N
3

Figure 1-5. A model for the binding of emetine-type agonist to the hypothetical receptor site.
An extensive structure-activity by Gupta et al.18, 19 regarding cross-resistance in two
emetine-resistant CHO cell variants showed that phenanthroindolizidine alkaloids,
phenanthroquinolizidines, and the emetine-related benzoquinolizidines may have the same
site of action. The conformation of emetine was suggested to have a close spatial
relationship to the other three compounds classes, and thus, they could bind to the same
hypothetical binding site (Figure 1-5). Alkaloids that did not fit into this spatial hypothesis,
including benzylisoquinilines and protoberberines, were not resistant to emetine-resistant cell
lines. Therefore, the authors suggested that phenanthroindolizidine alkaloids,
phenanthroquinolizidines, and emetine-related benzoquinolizidines possess common
structural determinants responsible for their protein synthesis inhibitory activity. Similar
results have been reported from studies on yeast.20 Based on structural-activity comparisons,
the required features are a planar molecule with two aromatic rings rendered slightly
electronegative by methoxy or hydroxy groups and a free electron pair on nitrogen at a
central distance from the aromatic rings.
Staerk et al.21 assessed the cytotoxic activity of seven phenanthroindolizidine alkaloids,
(-)-(R)-13aα-antofine (5), (-)-(R)-13aα-6-O-desmethylantofine (6), (-)-(R)-13aα-
secoantofine (7), (-)-(R)-13aα-6-O-desmethylsecoantofine (8), (-)-(R)-13aα-tylophorine (9),
(-)-(R)-13aα-7-O-desmethyltylophorine (10), and (+)-(S)-13aβ-isotylocrebrine (11) (Figure
1-6) against drug sensitive KB-3-1 and multidrug-resistant KB-V1 cancer cell lines.
Compounds 7 and 8 showed remarkably decreased cytotoxicity compared with the five
remaining compounds, suggesting that a rigid phenanthrene structure is a prerequisite for
high cytotoxicity. In addition, compounds belonging to the 13aR series and having a free
4

phenolic function at C-6 or C-7 showed greater cytotoxic activity against the KB cancer cell
lines. Although the S-configured 11 was less cytotoxic than the R series in this study, it still
had quite high cytotoxicity against both cell lines (IC50=50 nM). In contrast, previous studies
showed equal or higher cytotoxicity with the 13aS series.22
N
H
OMeMeO
RO
N
H
OMeMeO
RO
N
H
OMeMeO
MeO
N
HMeO
MeO
MeO
OMeOR5. R= Me6. R= H
7. R= Me8. R= H
9. R= Me10. R= H
11.
Figure 1-6. Chemical structures of phenanthroindolizidine alkaloids
Moreover, by using secophenanthroindolizidine septicine (12) as a template, a novel
series of 6,7-diphenylindolizidinones (Figure 1-7) was synthesized and tested for in vitro
anticancer activity against various human cancer cell lines.23 Compounds with R = 3,4-
difluoro, 3,4-dimethoxy, 4-methyl, 4-fluoro, 4-trifluoromethyl, and 4-methylthio (13) showed
significant potency with GI50 values in the range 2.1–8.1 µM. However, the reduced
compound 14 and septicine (12) were inactive in this assay; thus, proving the importance of
the lactam carbonyl in the central indolizidine ring to the cytotoxic activity. Substantial
growth inhibitory activity was found when the 4-methylthio substituent was present in ring A,
but substituents in ring B were less critical. Among all analogs, two compounds (R = 3, 4-
dimethoxy and 4-methyl) exhibited encouraging pharmacokinetic properties in mice.
However, further evaluation of in vivo efficacy in a modified hollow fiber assay (HFA) was
disappointing, probably due to poor solubility.
5

N
OMeMeO
MeOOMe
A
B
N
MeS
Septicine (12) 13 14
N
MeS
OR R
Figure 1-7. Structures of 6, 7-diphenylindolizidinones analogs.
1.5 ANTITUMOR ACTIVITY OF TYLOPHORA
Much of the current work on tylophorine alkloids was prompted by their profound
antitumor activity. Evaluation of tylophorine (1) and its analogs in the National Cancer
Institute’s antitumor screen showed a uniform and potent growth inhibitory effect (GI50 ≅ 10-8
M) against all 60 cell lines, with notable selectivity toward several refractory cell lines,
including melanoma and lung tumor cell lines.24
In 1964, Gellert and Rudzats25 reported that administration of tylocrebrine (2), a
phenanthrene alkaloid and positional isomer of tylophorine, caused approximately 50%
increase in life span (ILS) in L1210 leukemia-bearing mice. Similarly to 2, tylophorine (1)
was active against L1210 leukemia but with lower efficacy (ILS ca. 30%). Based on the
novel structure and superior antitumor activity against L1210 leukemia, tylocrebrine was
selected as a drug candidate and successfully proceeded to Phase I clinical trials in the early
1960s. However, the trials were eventually terminated in 1966 due to central nervous system
(CNS) toxicity, primarily ataxia and disorientation. Too few patients were treated to
establish the efficacy of tylocrebrine.
6

1.6 MECHANISM OF ANTITUMOR ACTIVITY
A comprehensive evaluation of tylophorine’s antitumor activities has not been reported,
and its inhibition mechanisms on cell growth are largely unknown. However, significant
advances in the field of molecular biology over the past decade have led to a new era in
cancer therapeutics and should facilitate our understanding of the mode of actions (MOA) of
this compound class.
1.6.1 Inhibition of DNA, RNA and Protein Synthesis
Early mechanistic studies in the 1960s demonstrated that tylophorine alkaloids
irreversibly inhibit DNA synthesis and protein synthesis at the elongation stage of the
translation cycle.26 In HeLa cells, tylophorine reversibly inhibits RNA synthesis and
irreversibly inhibits DNA synthesis, but its predominant effect is exerted on protein synthesis
and elongation of peptide chains by preventing breakdown of polyribosomes and release of
nascent peptides. Tylophorine and tylocrebrine were also found to inhibit protein synthesis
in Ehrlich ascites cells and yeast cytoplasmic ribosomes but had no effect on Escherichia coli
(E. coli) ribosomes even at high concentrations.27
Tylophorine, tylocrebrine, and cryptopleurine inhibit protein synthesis in eukaryotic
cells. Cryptopleurine at low concentration blocks translocation of peptidyl tRNA from the
40S ribosomal A site to the P site, dependent on elongation factor EF-2 and GTP,28-30 and
inhibits peptide bond formation in the 60S ribosomal unit at higher concentration. In
addition, tylophorine, tylocrebrine, tubulosine, and emetine compete with [14a-3H]
cryptopleurine for a binding site on 80-, 60-, and 40-S ribosomal units and also inhibit the
peptide-bond formation at high concentrations, implying that these compounds have a similar
mechanism of action on protein synthesis inhibition.31
7

1.6.2 Apoptosis Induction
Ganguly et al.32 demonstrated that unspecified tylophora alkaloids could induce
apoptosis in a human erythroleukemic cell line (K562) with characteristic apoptotic features,
such as nuclear condensation apoptotic body formation, flipping of membrane
phosphatidylserine, activation of caspase 3 and release of mitochondrial cytochrome c.
These findings suggest that tylophora alkaloids, in addition to their antiproliferative activity,
also induce apoptosis in tumor cells.
1.6.3 Inhibition of Thymidylate Synthase (TS) and Dihydrofolate Reductase (DHFR)
In the 1990s, it was found that tylophorine alkaloids target several key targets for cancer
chemotherapy, including the metabolic enzymes thymidylate synthase (TS) and dihydrofolate
reductase.33 TS catalyzes the reductive methylation of the substrate dUMP (2’-deoxyuridine
5’-monophosphate) to dTMP (2’-deoxythymidine 5’-monophosphate; thymidylate) with
concomitant conversion of the cofactor CH2THF (5,10-methylenetetra-hydrofolate) to DHF
(7,8-dihydrofolate) (see Equation 1).
dUMP + CH2THF → dTMP + DHF Equation 1
Thymidylate synthase (TS) and dihydrofolate reductase (DHFR) play a pivotal role in
the provision of precursors (thymidylate) for DNA biosynthesis through a de novo pathway.
In vitro studies of thymidylate synthase inhibition in human leukemic leukocytes showed that
pergularinine (PGL) and tylophorinidine (TPD) from the Indian medicinal plant Pergularia
pallida potently inhibited both chronic myelocytic leukemia (CML) and acute lymphocytic
leukemia (ALL) (IC50 = 50 µM). The authors indicated that 2 mol of PGL and TPD each
bound irreversibly and covalently to one mole of L. leichmannii TS (Narasimha Rao et al.,
8

unpublished data). In contrast, binding to DHFR was slow and reversible. Inhibition
kinetics showed that the Ki values for PGL and TDP were 9 × 10⁻⁶ and 7 × 10⁻⁶ M,
respectively.33 TS is highly elevated in human leukemia and it is also a good tumor marker to
predict the progression of malignancy in leukemia and solid tumors such as breast and lung
cancers. Understanding of cancer biochemistry thus provides a good viewpoint for the
design of enzyme targeted anticancer chemotherapy with this compound class.
1.6.4 Inhibition of Activator Protein-1, CRE, and NF-kB
Activator protein-1, CRE, and NF-κB signaling pathways have been well studied and are
important players in the control of cell growth, differentiation, and survival.34-36 Gao et al.37
found that NSC-717335, a stereoisomer of tylophorine, significantly inhibits activator
protein-1, CRE, and nuclear factor κB (NF-κB) mediated transcription. NSC-717335 and
NSC-716802 had significant inhibitory effects on NF-κB mediated transcription with IC50
values of 30 nM and 100 nM, respectively. This result implied that tylophorine analogs may
alter the activity of the above transcription factors, subsequently modulating the expression
of their target genes involved in the control of cell growth, differentiation, and survival.
In addition, Gao et al demonstrated that tylophorine analogs are active against HepG2
tumor cells both in vitro and in vivo (HCC is refractory to chemotherapy because of tumor
heterogeneity, the development of multidrug resistance phenotypes, and recently reported
constitutive expression of NF-κB38). One of the major problems with current cancer
chemotherapy is drug resistance. Recently, NF-kB has been suggested as one mechanism of
drug resistance, because of its antiapoptotic role.39,40 Tumors that have constitutive NF-kB
activity usually show increased resistance to chemotherapy.41 Another explanation might be
that NF-kB is involved in regulation of p-glycoprotein, overexpression, which is a well
9

known mechanism of multidrug resistance to chemotherapy. Consistent with Gao’s studies,
Staerk et al.21 also showed that phenanthroindolizidine alkaloids were cytotoxic to both drug
sensitive KB-3-1 and multidrug-resistant KB-Vin-1 cell lines, with low IC50 values
comparable to those of modern cytostatic drugs. This profile contrasts with those of many
front-line antitumor drugs such as Catharanthus alkaloids and taxol, which are prone to
multidrug-resistance based on glycoprotein transporter (MDR1) expressed in KB-Vin-1 cells.
1.6.5 Selective Interaction between Tylophorine B and Bulged DNA
Xi et al.42 studied the interaction between tylophorine B and bulged DNA using
fluorescence spectroscopy and thermal melting methods. Fluorescence quenched upon
addition of the DNA, and the fluorescence intensity of tylophorine B tended to be constant at
a high concentration of DNA, which suggests that the binding reaches saturation. The
binding stoichiometry of the tylophorine B-DNA complex is ca. 1:1. The results indicate that
oligonucleotides interact with tylophorine B at a submicromolar concentration, and the
affinity for DNA bulge is optimal with Kd of 0.018 µM. In addition, as a planar molecule as
mentioned previously, tylophorine interacts with DNA through an intercalative association in
which a planar, heteroaromatic moiety slides between the DNA A-T and T-A base pairs.
1.7 CONCLUSION
Over the years, natural products have contributed enormously to the treatment of various
human diseases. Recent findings demonstrate that tylophorines are cytotoxic to both drug
sensitive and multidrug resistant cancer cells with a unique mode of action different from
those of current known anticancer drugs. Therefore, although the phenanthroindolizidine
alkaloid tylocrebrine previously failed in clinical trials due to CNS toxicity, tylophorine has a
10

high potential to be developed into a new anticancer drug class, based on the profound
cytotoxicity of these alkaloids, particularly to multidrug resistant cancer cells, and
emphasized by recent findings of tylophorine’s mode of action in biological systems.
11

1.8 REFERENCES
1) Gellert, E. In Alkaloids: Chemical and Biological Perspectives. Pelletier, S. W., Ed; Academic Press: New York, 1987; pp 55-132.
2) Govindachari, T. R. In The Alkaloids, Chemistry and Pharmacology. Manske, R. H. F., Ed; Academic Press: New York, 1976; pp 517-528.
3) Bick, I. R. C.; Sinchai, W. In The Alkaloids, Chemistry and Pharmacology. Rodrigo, R. G. A., Ed; Academic Press: New York, 1981; pp 193-220.
4) Gellert, E. The indolizidine alkaloids. J. Nat. Prod. 1982, 45, 50-73.
5) Pettit, G. R.; Goswami, A.; Cragg, G. M.; Schmidt, J. M.; Zou, J.-C. Antineoplastic agents. 103. The isolation and structure of hypoestestatins 1 and 2 from the East African Hypoestes verticillaris. J. Nat. Prod. 1984, 47, 913-919.
6) a) Cave, A.; Leboeuf, M.; Moskowitz, H.; Ranaivo, A.; Bick, I. R. C.; Sinchai, W.; Nieto, M.; Sevenet, T.; Cabalion, P. Alkaloids of Cryptocarya phyllostemon. Aust. J. Chem. 1989, 42, 2243-2263. b) Mitra, S. N.; Rajan, S.; Govindachari, T.; Subramanian, E. Crystal structure of tylophorine methiodide monohydrate, C25H30NO4+I-.H2O. J. Chem. Crystallogr. 1996, 26, 223-226.
7) Venkatachalam, S. R.; Mulchandani, N. B. Isolation of phenathroindolizidine alkaloids and a novel biphenylhexahydroindolizine alkaloid from Ficus hispida. Naturwissenschaften 1982, 69, 287-288.
8) Baumgartner, B.; Erdelmeier, C. A. J.; Wright, A. D.; Rali, T.; Sticher, O. An antimicrobial alkaloid from Ficus septica. Phytochemistry 1990, 29, 3327-3330.
9) Wang, Q.; Xie, L.; Zhai, J. Tylophorine B benzene solvate. Acta. Cryst. 2000, C56, 197-198.
10) Govindachari, T.; Lakshmikantham, M. V.; Nagarajan, K.; Pai, B. R. Chemical examination of Tylophora asthmatica. II. Tetrahedron 1958, 4, 311-324.
11) Bradsher, C. K.; Berger, H. Synthesis of dl-cryptopleurine. J. Am. Chem. Soc. 1957, 79, 3287-3288.
12) Marchini, P.; Belleau, B. Synthesis of cryptopleurine and related phenanthroquinolizidines. Can. J. Chem. 1958, 36, 581-588.
13) Suffness, M.; Cordell, G. A. In The Alkaloids, Chemistry and Pharmacology; Brossi, A., Ed.; Academic Press: New York, 1985; Vol. 25, pp 156-163.
12

14) Li, Z., Jin, Z., Huang, R. Isolation, total synthesis and biological activity of phenanthroindolizidine and phenanthroquinolizidine alkaloids. Synthesis 2001, 16, 2365-2378
15) Michael, J. Indolizidine and quinolizidine alkaloids Nat. Prod. Rep., 2004, 21, 625-649.
16) Michael, J, Indolizidine and quinolizidine alkaloids Nat. Prod. Rep., 2005, 22, 603-626.
17) Zee-Cheng, K. Y.; Cheng, C. C. Common receptor-complement feature among some antileukemic compounds. J. Pharm. Sc. 1970, 59, 1630-1634.
18) Gupta, R. S.; Siminovitch, L. Mutants of CHO cells resistant to the protein synthesis inhibitors, cryptopleurine and tylocrebrine: genetic and biochemical evidence for common sit of action of emetine, cryptopleurine, tylocrebrine, and tubulosine. Biochemistry 1977, 16, 3209-3214.
19) Gupta, R. S.; Krepinsky, J. J.; Siminovitch, L. Structural determinants responsible of the biological activity of (-)-emetine, (-)-cryptopleurine, and (-)-tylocrebrine: structure-activity relationship among related compounds. Mol. Pharmacol 1980, 18, 136-143.
20) Sanchez, L.; Vazquez, D.; Jimenez, A. Genetics and biochemistry of cryptopleurine resistance in the yeast Saccharomyces cerevisiae. Mol. Gen. Genet. 1977, 156, 319-326.
21) Staerk, D.; Lykkeberg, A. K.; Christensen, J.; Budnik, B. A.; Abe, F.; Jaroszewski, J. W. In vitro cytotoxic activity of phenanthroindolizidine alkaloids from Cynanchum vincetoxicum and Tylophora tanakae against drug-sensitive and multidrug-resistant cancer cells. J. Nat. Prod. 2002, 65, 1299-1302.
22) Abe, F.; Hirokawa, M.; Yamauchi, T.; Honda, K.; Hayashi, N.; Ishii, M.; Imagawa, S.; Iwahana, M. Further investigation of phenanthroindolizidine alkaloids from Tylophora tanakae. Chem. Pharm. Bull. 1998, 46, 767-769.
23) Sharma, V. M.; Adi Seshu, K. V.; Vamsee Krishna, C.; Prasanna, P.; Chandra Sekhar, V.; Venkateswarlu, A.; Rajagopal, S.; Ajaykumar, R.; Deevi, D. S.; Rao Mamidi, N. V. S.; Rajagopalan, R. Novel 6,7-diphenyl-2,3,8,8a-tetrahydro-1H-indolizin-5-one analogues as cytotoxic agents. Bioorg. Med. Chem. Lett. 2003, 13, 1679-1682.
24) The 60-cell line NCI test data along with in vivo data can be accessed from the NSC numbers at the following Web site: http://dtp.nci.nih.gov/dtpstandard/dwindex/index.jsp
25) Gellert, E.; Rudzats, R. Antileukemia activity of tylocrebrine. J. Med. Chem 1964, 7, 361-362.
13

26) Huang, M.-T.; Grollman, A. P. Mode of action of tylocrebrine. Effects on protein and nucleic acid synthesis. Mol. Pharmacol 1972, 8, 538-550.
27) Donaldson, G. R.; Atkinson, M. R.; Murray, A. W. Inhibition of protein synthesis in Ehrlich ascites-tumour cells by the phenathrene alkaloids tylophorine, tylocrebrine and cryptopleurine. Biochem. Biophys. Res. Commun. 1968, 31, 104-109.
28) Barbacid, M.; Fresno, M.; Vazquez, D. Inhibitors of polypeptide elongation on yeast polysomes. J. Antibiot 1975, 28, 453-463.
29) Bucher, K.; Skogerson, L. Cryptopleurine – an inhibitor of translocation. Biochemistry 1976, 15, 4755-4759.
30) Carrasco, L.; Fernandez-Puente, C.; Vazquez, D. Antibiotics and compounds affecting translation by eukaryotic ribosomes. Specific enhancement of aminoacyl-tRNA binding by methylxanthines. Mol. Cell Biochem. 1976, 10, 97-122.
31) Dolz, H.; Vazquez, D.; Jimenez, A. Quantitation of the specific interaction of [14a-3H] cryptopleurine with 80S and 40S ribosomal species from the yeast Saccharomyces cerevisiae. Biochemistry 1982, 21, 3181-3187.
32) Ganguly, T.; Khar, A. Induction of apoptosis in a human erytholeukemic cell line K562 by Tylophora alkaloids involves release of cytochrome c and activation of caspase 3. Phytomedicine 2002, 9, 288-295.
33) Rao, K. N.; Bhattacharya, R. K.; Venkatachalam, S. R. Inhibition of thymidylate synthase and cell growth by the phenanthroindolizidine alkaloids pergularinine and tylophorinidine. Chem. Biol. Interact 1997, 106, 201-212.
34) Darnell, J. E., Jr. Transcription factors as targets for cancer therapy. Nat. Rev. Cancer 2002, 2, 740-749.
35) Shaulian, E.; Karin, M. AP-1 as a regulator of cell life and death. Nature Cell Biol. 2002, 4, E131-136.
36) Lin, A.; Karin, M. NF-κB in cancer: a marked target. Seminars in Cancer Biology 2003, 13, 107-114.
37) Gao, W.; Lam, W.; Zhong, S.; Kaczmarek, C.; Baker, D. C.; Chang, Y. C. Novel mode of action of tylophorine analogs as antitumor compounds.Cancer Res. 2004, 64, 678-688.
38) Tai, D. I.; Tsai, S. L.; Chang, Y. H.; Huang, S. N.; Chen, T. C.; Chang, K. S.S.; Liaw, Y. F. Constitutive activation of nuclear factor κB in hepatocellular carcinoma. Cancer 2000, 89, 2274-2281.
14
39) Wang, C. Y.; Cusack, J. C., Jr.; Liu, R.; Baldwin, A. S., Jr. Control of inducible chemoresistance: enhanced anti-tumor therapy through increased apoptosis by inhibition of NF-κB. Nature Med. 1999, 5, 412-417.
40) Cusack, J. C., Jr.; Liu, R.; Baldwin, A. S., Jr. Inducible chemoresistance to 7-ethyl-10-[4-(1-piperidino)-1-piperidino]-carbonyloxycamptothecin (CPT-11) in colorectal cancer cells and a xenograft model is overcome by inhibition of nuclear factor-κB. Cancer Res. 2000, 60, 2323-2330.
41) Bharti, A. C.; Aggarwal, B. B. Nuclear factor-kappa B: its role in prevention and therapy. Biochemical Pharmacology 2002, 64, 883-888.
42) Xi, Z.; Zhang, R.; Yu, Z.; Ouyang, D.; Huang, R. Selective interaction between tylophorine B and bulged DNA.. Bioorg. Med. Chem. Lett. 2005, 15, 2673-2677.
15

2 CHAPTER II. RESEARCH DESIGN
2.1 INTRODUCTION
Cancer is a group of more than 100 different diseases, characterized by uncontrolled
cellular growth, local tissue invasion, and distant metastases. Cancer claims approximately
560,000 lives in the United States each year. It is second only to cardiovascular disease as a
cause of mortality. The clinical use of chemotherapeutic agents against malignant tumors is
successful in many cases but suffers from major drawbacks. One drawback is lack of
selectivity, which leads to severe systemic side effects and limited efficacy. Another major
problem is the emergence / selection of drug-resistance.
Natural products have been the major source of currently available anticancer drugs.
According to a review of New Chemical Entities (NCE) from 1981 to 2002,1 approximately
74% of anticancer drugs were either natural products, natural product-based, or mimicked
them in one form or another. Therefore, as part of our studies in plant-derived antitumor
agents, we have initiated the synthesis of new tylophorine (1) analogs. Our design template
is TSWUCC1 (Antofine) (2), a tylophorine analog isolated from Asclepiadaceae by Dr. K.H.
Lee’s collaborator, Dr. T. S. Wu2 in Taiwan. This compound showed both remarkable
activity (EC50 10 ng/ml) and differential toxicity against different human cancer cell lines.
The goal of this study is to generate and optimize phenanthrene derivatives as promising
clinical trial candidates for treatment of cancer.

2.2 SIGNIFICANCE
Over the years, natural products have contributed enormously to the treatment of human
diseases. Recent findings have demonstrated that tylophorine alkaloids are cytotoxic to both
drug sensitive and mutidrug resistant cell lines with unique mode(s) of action different from
those of other known antitumor drugs. These alkaloids possibly show an inhibitory effect on
cyclic AMP response elements, activator protein-1 sites, or NF-κB binding site-mediated
transcription, as well as potentiate retinoic acid differentiation to cause cancer cell apoptosis.
Therefore, although the phenanthroindolizidine alkaloid tylocrebrine (3) previously failed in
anticancer clinical trials due to CNS toxicity, this compound class merits further study in
light of its profound cytotoxicity, particularly against multidrug resistant cancer cells. A
better understanding of mode(s) of action, formulation of structural-activity relationships in
targeting specific tissue receptors, and synthesis of more polar analogs that are unable to pass
the blood-brain barrier should help to generate optimal clinical trial candidates and develop
this new class of anticancer drugs that may overcome the current issue of chemotherapy
resistance. [To date, bortezomib (4) (Figure 2-1), a proteasome inhibitor, is the only drug
designed to target chemotherapy resistance by overcoming the anti-apoptosis mechanism of
cancer cells through indirect inhibition of the NFκB pathway.]
2.3 SPECIFIC AIMS
Specific Aim 1:
To design and synthesize novel phenanthrene alkaloid derivatives structurally related
to tylophorine as a new class of potent antitumor agents.
17

TSWUCC1 (Antofine) (1) (Figure 2-1), a tylophorine analog isolated from Ficus septica
by Dr. T. S. Wu in Taiwan, will be used as the template to design and synthesize new
antitumor phenanthrene-based tylophorine (PBT) derivatives:
1) Design and synthesis of phenanthroindolizidine alkaloid antofine.
2) Design and synthesis of water soluble phenanthrene-based tylophorine derivatives
(PBTs).
3) Design and synthesis of 9-substituted PBTs.
Specific Aim 2:
To investigate the mode of action of this compound class.
Compounds synthesized from specific aim 1 will be evaluated for their inhibitory effects
on cancer cell growth, as well as in other biological assays both in-house (Dr. K.F. Bastow’s
Laboratory, UNC) and at the National Cancer Institute (NCI), MD Anderson Cancer Center,
as well as National Science and Techology Program for Bio- and Pharmaceuticals in Taiwan
for in vivo activity. All compounds will also be tested for anti-telomerase related antitumor
activity in Dr. M. Jasfer’s laboratory, UNC. The results from these biological assays will
facilitate our understanding of the specific targets for this new compound class.
Specific Aim 3:
To generate QSAR models and use the resulting database for new lead identification.
Based on the assumption that differences in structural properties account for differences
in biological activities of compounds, validated predictive quantitative structure-activity
relationship (QSAR) models will be generated using the chemical structures/activities of
18
compounds synthesized from Aim 1 and applied to database mining to assist further
development of this new compound class.
Specific Aim 4:
To evaluate the pharmacokinetic profiles of phenanthrene derivatives and explore their
potential for successful development into clinical trial candidates.
An ADME prediction program will be used to evaluate the pharmacokinetic profile of
the synthesized phenanthrene-based tylophorine (PBT) derivatives, including blood brain
barrier (BBB) permeability, protein binding, and human intestinal absorption (HIA), for each
promising analog in comparison to the parent tylophorine molecule.
Tylophorine
MeO
OMeMeO
N
MeO
OMeMeO
N
OMe
H H
MeO
OMeMeO
N
H
MeO
TSWUCC1 (Antofine)Tylocrebrine
NN H
N NH
i-BuO
O OHHO
Ph
Bortezomib (Velcade)1 2 3 4 Figure 2-1. Structures of tylophorine (1) TSWUCC1 (antofine) (2), tylocrebrine (3) and bortezomib (4).
19

2.4 REFERENCES
1) Newman, D. J.; Cragg, G. M.; Snader, K. M. Natural products as sources of new drugs over the period 1981-2002. J. Nat. Prod. 2003, 66, 1022-1037.
2) Wu, P. L.; Rao K. V.; Su, C.-H.; Kuoh, C.-S.; Wu, T.-S. Phenanthroindolizidine alkaloids and their cytotoxicity from the leaves of Ficus septica. Heterocycles 2002, 57, 2401-2048.
20

3 CHAPTER III. DESIGN, SYNTHESIS AND BIOLOGICAL EVALUATION OF NEW PHENANTHRENE-BASED
TYLOPHORINE DERIVATIVES (PBTS) (PART I)
3.1 INTRODUCTION
N
OMeMeO
MeO
N
H
OMeMeO
MeO
TSWUCC-1 (Antofine) (1) Tylocrebrine (2)
H
MeO
12
34
5
67
89 10 11
12
1314
13a
Figure 3-1. Structures of TSWUCC-1 (antofine) and tylocrebrine
The total synthesis of TSWUCC-1 (Antofine 1) has been achieved by various groups.1-4
We designed the following alternate synthetic route based on high reported yields for each
step. Initially, two commercially available appropriately substituted phenyl acetic acid (A)
and o-nitrobenzaldehyde (B) compounds (Scheme 3-1) were condensed using a general
Perkin condensation procedure. After reduction of the nitro group to an amine, the key step
in the synthesis involves formation of the phenanthrene unit by an improved, reported free-
radical Pschorr cyclization5 of the appropriately substituted stilbenic acid (D). The synthesis
of this highly condensed pentacyclic natural product should be completed in three addition
steps: amidation with proline methyl ester, carbonyl redution and a final polyphosphoric acid
(PPA)-catalyzed ring closure. However, the PPA catalyzed cyclisation (f) gave the unstable

ketone intermediate H, which is very sensitive to moisture and acid, and resulted in extensive
decomposition. The relative low yield (10%) could not be improved by conventional
Friedel-Crsfts acylation catalysis (acid chloride hydrochloride) or other dehydrogenation
reagent, such as Eaton’s reagent, sulfuric acid and trifluoroacetic anhydride/acid. The
relative low yield of this ring closure halted the further development of this synthetic route to
the natural product or its derivatives.
OMeMeO
MeO
N
H
TSWUCC1 (Antofine)
OO
CHONO2
COOH
PhH2CO
OO
NO2
PhH2CO
OO
NH2
PhH2CO
COOH COOH
OO
PhH2CO
COOH
OO
PhH2CO
N
O
a b c d
e
a: Ac2O/Et3N b: FeSO4/NH4OH c: NaNO2/Fluoroboric acid; Ferrocene/acetone d; EDC/DMF e: BMS/THF f: PPA
H
OO
PhH2CO
N
COOHH f
OO
PhH2CO
N
HO
A
B
C D E
F G H
91% 93% 90% 95%
85%
COOMe
OO
PhH2CO
N
H
1) Tosyl Hydrazide/Digol
2) NaBH4/THF
Scheme 3-1. Attempted total synthesis of TSWUCC1
However, in a preliminary screen on all reaction intermediates, compound G, [N-(6-
benzyloxy-2,3-methylenedioxyphenanthr-9-ylmethyl)-L-proline] (Scheme 3-1), was
22

discovered serendipitously as a potent cytotoxic amino acid precursor of tylophorine. It
presents an unprecedented antitumor scaffold that led to our exploration of more polar
(water-soluble) tylophorine-related derivatives. Such phenanthrene-based tylophorine
derivative or PBTs could circumvent this prior obstacle learned from the drug development
failure of tylocrebrine (2) in the early 1960s due to its significant CNS toxicity, manifested as
disorientation and ataxia.6 Increased polarity should diminish the CNS toxicity by
preventing compounds from penetrating across the blood brain barrier. Tylophorine
alkaloids are composed of a phenanthrene ring system and an indolizidine moiety – and the
rigid phenanthrene structure is a prerequisite for the antitumor activity.7 However, by
opening the indolizidine ring, polar chemical moieties can easily be introduced into the
compound skeleton.
In addition, successful application of the Pschorr cyclization5 and coupling reaction in
the presence of N-(3-dimethylaminopropyl)-N'-ethylcarbodiimide hydrochloride (EDC)
enabled efficient and concise access to these more polar and water soluble PBTs with overall
yields greater than 50% (Scheme 3-1). In comparison to the above reported total synthesis of
tylophorine, our PBT synthesis avoids the cyclization step (limiting synthetic factor) and
makes the parallel and large scale synthesis of PBTs feasible, which could potentially
enhance the development of these compounds into drugs.
Therefore, as part of our studies in plant-derived antitumor agents, this discovery led us
to explore a new series of novel PBTs. We have initiated the design, synthesis and structure-
activity relationship (SAR) study of this new anticancer compound class. The goal of this
study is to generate and optimize PBTs as promising clinical trial candidates for treating
cancer.
23

3.2 DESIGN OF SYNTHESIS
Compound G was used as the template to design and synthesize PBT derivatives. These
compounds contain a core phenanthrene structure and can be synthesized efficiently in
excellent yield as shown in Scheme3-2. The newly synthesized PBTs were evaluated for
cytotoxic activity against the A549 human cancer cell line and both structures and activities
are listed in Tables 3-1, -2 and -3.
COOH
OR3
OR1R2O
NO2
R3O
OR1R2O
NH2
R3O
COOH COOH
OR1R2O
R3O
COOH
OR1R2O
R3O
a b c
d e
Reagents and conditions: a: Ac2O/Et3N b: FeSO4/NH4OH c: NaNO2/fluoroboric acid; ferrocene/acetone d: EDC, DMAP, HOBt/DMF e: BMS/THF f: H2, Pd/C/MeOH g: LiAlH4/THF h: NaOH/MeOH (1:1)
OR1R2O
R3O
N-alkyl-R4N-alkyl-R4
O
R4 = -COOCH3
R4 = -COOH
R3 = -CH2C6H5
R4 = -CH2OH
R3 = -Hf
g
h
+
7a, b, c 8 9
NO2
CHO
OR1
R2O
3a: R1,R2 = -CH2-3b: R1=CH3, R2=CH3
4a: R3= -CH2Ph4b: R3=CH3
5a: R1,R2 = -CH2-; R3=-CH2Ph
5b: R1=CH3, R2=CH3; R3=CH35c: R1,R2 = -CH2
-; R3=CH3
6a, b, c
12
34
56
78
910
For general structure 8 with R4 = COOMe:
For general structure 8 with R4 = COOH:
For general structure 10 with R4 = COOMe:
For general structure 10 with R4 = COOH:
For general structure 10 with R4 = CH2OH:
For R3 = OH, R4 = COOH:
For seco PBT analogs:
Structures of target compounds 10-42, including R1, R2, R3 and N-alkyl, are found in Tables 1-3.
5c 39d+h
7a/b 11, 16, 25, 29d+h
7a/b 14, 17, 26, 30d+e
7a/b/c 12, 15, 18, 20, 27, 31, 33, 35, 37d+e+h
7a/b/c 13, 19, 21, 28, 32, 34, 36, 38d+e+h+g
16, 18, 20 22, 23, 24f
40e 41g
7a 10d
Scheme 3-2. Total synthesis of new phenanthrene-based tylophorine derivatives
24

3.3 CHEMISTRY
Compounds 10-49 were synthesized following the efficient reported procedure5 outlined
in Scheme 3-2. A commercially available substituted O-nitrobenzaldehyde (3a,b) was
treated with 4-methoxy or -benzyloxyphenyl acetic acid (4a,b) in the presence of Ac2O
(Perkin condensation) to yield an intermediate nitro-substituted cinnamic acid (5a-c). The
nitro group of 5 was converted to an amine using ammoniacal ferrous sulfate (FeSO4) to
provide the amino-substituted cinnamic acid (6a-c). Phenanthrenes 7a-c, which are the key
intermediates in our method, were formed by an improved free-radical Pschorr cyclization5 in
high yield. Compound 6 was treated with sodium nitrite in 48% fluoroboric acid, and the
resulting diazonium tetrafluoroborate was then efficiently cyclized to the phenanthrene-9-
carboxylic acid (7) using catalytic ferrocene. Intermediates 7a-c were then condensed with
the appropriate protected cyclic or acylic amino acid in the presence of N-(3-
dimethylaminopropyl)-N'-ethylcarbodiimide hydrochloride (EDC), 4-
(dimethylamino)pyridine (DMAP) and 1-hydroxybenzotriazole (HOBT) to give the amido-
substituted phenanthrene (8). These mild conditions avoid the production of degradation
products resulting from the acidic instability of the methylenedioxy group. Selective
reduction of the amide carbonyl group to a methylene was achieved by using borane-methyl
sulfide complex (BMS, 2.0M solution in THF) to provide 9. The C-9 side chain methyl ester
was converted to carboxylic acid and hydroxymethyl groups by basic hydrolysis and lithium
aluminum hydride reduction, respectively. The 6-phenolic analogs were prepared by
hydrogenolysis (H2, Pd/C) of the benzyloxy protecting group.
25

3.4 RESULTS AND DISCUSSION
Tables 3-1 – 3-3 summarize the structures of newly synthesized PBTs (7a-c, 10–42) and
their cytotoxic activity (EC50) against the A549 lung cancer cell line. Etoposide (VP-16) was
used as the reference compound.
Structure-Activity Relationship (SAR) Analysis
All three intermediate phenanthrene-9-carboxylic acids 7a-c were inactive. Thus, the
rigid, planar phenanthrene system is not sufficient for cytotoxic activity, and an appropriate
C-9 side chain is crucial. However, the phenanthrene system is required for cytotoxic
activity, as the seco analogues 39-42, which contain an active proline side chain (see
discussion below) but only a stilbene skeleton, were also inactive.
Active analogs contained both cyclic (pyrrole/proline, piperidine/pipecolinic acid) and
acylic (aminopentanoic, aminohexanoic acids) nitrogen-containing side chains at the C-9
position of phenanthrene. However, the linkage between the nitrogen and the phenanthrene
was very critical. Reduction of the amide carbonyl to methylene could dramatically increase
the cytotoxic activity as shown in the comparison of 16 (L-proline amide, carbonyl linkage,
EC50 42.6 µM) and 18 (methylene linkage, EC50 4.4 µM). This observation (carbonyl,
unfavorable or less favorable; methylene, favorable) also could be seen in comparison of
11/12 and 25/27. A simple explanation for this observation could possibly be the difference
in configurational constraint. The carbonyl is conjugated with the phenanthrene ring and,
thus, extends the coplanarity, while the methylene substituent can rotate freely around the C-
C bond. The former geometric restriction appears to disfavor cytotoxic activity and may
prevent the molecule from attaining the optimal conformation for binding to an assumed
biological target.
26

On the phenanthrene skeleton, changing the benzyloxy moiety at the C-6 position to a
hydroxy group was extremely detrimental to activity (cf. 18/23 and 20/24). In addition,
active compounds with a 6-benzyloxy moiety (15 and 18-21, EC50 1.3 – 4.4 µM) were
generally slightly less potent than corresponding analogs with a 6-methoxy group (27 and 31-
34, EC50 0.16 − 2.1 µM). Thus, the rank order of potency at the phenanthrene C-6 position
was methoxy > benzyloxy >> hydroxyl, suggesting that this position cannot tolerate the
introduction of a polar moiety. A hydrophilic moiety may be disfavored because a
hydrophobic interaction occurs at this position between the compound and biological target
that is essential for cytotoxic activity.
Interestingly, active compounds with a 2,3-methylenedioxy group (33 and 34, EC50 0.5
and 0.16 µM) were up to 40 times more potent than the corresponding compounds with a
2,3-dimethoxy moiety (37 and 38, EC50 9.7 and 6.3 µM). Thus, the five-membered
methylenedioxy ring extension at the phenanthrene C2-C3 is quite favorable for cytotoxic
activity.
In the amino side chain, when the terminal carboxylic acid group was masked as the
methyl ester, the cytotoxic activity was diminished drastically or abolished (e.g., 14/15,
17/18, 26/27, 30/31). However, reduction of the carboxylic acid to the hydroxymethyl
generally increased activity, both in cyclic (18/19, 20/21, 31/32, 33/34, 37/38) and acylic
(12/13, 27/28, 35/36) analogs. Thus, the rank order of potency of the terminal polar
substituent was hydroxy > carboxylic acid >> methyl ester.
In summary, the favorable modification for these novel PBTs are as follows. 1) A planar
phenanthrene system is required, but not sufficient for cytotoxic activity. 2) A N-hydrophilic
substituent at the C-9 position is essential for the enhanced cytotoxicity and should be linked
27

through a methylene rather than a carbonyl group. 3) This C-9 N-hydrophilic substituent is
ideal for the introduction of a polar moiety. Analogs containing terminal carboxylic acid or
hydroxymethyl groups are more favorable than those with methyl esters. 4) On the
phenanthrene skeleton, a methoxy substituent best fits both the steric and electronic
requirements at the C-6 position and is preferred over benzyloxy and hydroxy groups. 5)
Adding a methylenedioxy ring at the 2,3 position of the planar phenanthrene system can
dramatically enhance the cytotoxic activity and led to the most potent derivatives.
3.5 CONCLUSION
In this study, a total of 33 novel phenanthrene-based tylophorine derivatives (PBTs)
were synthesized and evaluated for cytotoxic activity against human A549 lung cancer cells.
Among these compounds, N-(2,3-methylenedioxy-6-methoxy-phenanthr-9-ylmethyl)-L-2-
piperidinemethanol (34) and N-(2,3-methylenedioxy-6-methoxy-phenanthr-9-ylmethyl)-5-
aminopentanol (28) were the most potent compounds designed and synthesized to date with
EC50 values of 0.16 and 0.27 µM, respectively. These two compounds incorporated all of the
favorable modifications identified to date. They possess a novel structure and showed
remarkable EC50 values in the sub-micromolar range, comparable with front-line
antineoplastic drugs such as etoposide, suggesting that this new compound class is worthy of
further development as potential antitumor clinical trials candidates
3.6 EXPERIMENTAL SECTION
3.6.1 Instruments and Chemicals
Melting points were measured using a Fisher Johns melting apparatus without correction.
Proton nuclear magnetic resonance (1H NMR) spectra were measured on a 300 MHz Varian
28

Gemini 2000 spectrometer using TMS as internal standard. The solvent used was CDCl3
unless indicated. Mass spectra were recorded on a PE-Sciex API-3000 LC/MS/MS
instrument equipped with a Turbo IonsSpray ion source. Elemental analyses were performed
by Atlantic Microlab, Inc., Norcross, GA. All active target compounds were analyzed for C,
H, N and gave values within +0.4% of the theoretical values. The purity of inactive target
compounds was verified by HPLC using three different solvent systems Thin-layer
chromatography (TLC) was performed on PLC silica gel 60 F254 plates (0.5 mm, Merck).
Biotage Flash+ and Isco Companion systems were used as medium-pressure column
chromatography. Silica gel (200-400 mesh) from Aldrich, Inc. was used for column
chromatography. 4-Benzyloxyphenylacetic acid and 3, 4-methylenedioxy-6-
nitrobenzaldehyde were purchased from TCI. L-Pipecolinic acid and isonipecotic acid were
commercially available from Lancaster. All other chemicals were obtained from Aldrich, Inc.
and Fisher, Inc.
3.6.2 General Preparation
General procedure for the preparation of phenanthrene-9-carboxylic acids (a,b,c):
Phenanthrene-9-carboxylic acids 7a and 7b were synthesized following a reported
procedure.4
A solution of 3, 4-methylenedioxy-6-nitrobenzaldehyde (12 mmol), triethyl amine (12
mmol), and 4-benzyloxy- or 4-methoxy-phenylacetic acid (17 mmol) was refluxed with
stirring under Ar for 40 min. Water (30 ml) was added to the reaction mixture and the
temperature was maintained between 90 °C and 100 °C during the addition. The reaction
mixture was cooled to rt and the solid was collected by filtration and recrystallized from
EtOH.
29

To a solution of the nitrocinnamic acid (7 mmol) in 10% aqueous NH4OH (100 ml) was
added ferrous sulfate heptahydrate (15 g) dissolved in distilled water (100 mL) and
concentrated aqueous NH4OH (100 mL). The reaction mixture was refluxed for 1.5 h, cooled
to 40 °C, filtered through Celite, and acidified with HOAc (100 mL). The resulting solid was
collected by filtration and recrystallized from EtOH to yield the aminocinnamic acid.
A solution composed of the aminocinnamic acid (3 mmol), NaOH (33 mmol) and
NaNO2 in water (10 mL) was added dropwise over 30 min with stirring to 48% fluoroboric
acid (43 mmol) at 0-5 °C. The mixture was stirred for 1 h, after which sulfamic acid was
added until the mixture tested negative to starch-iodide paper. The crude solid was collected
by filtration, dissolved in anhydrous acetone (10 mL) and then added dropwise with stirring
over a 15 min period to ferrocene (0.056 g, 0.3 mmol) in acetone at rt. After an additional 15
min of stirring, the green reaction mixture was added to water (100 mL). A light-yellow
precipitate was collected and the trace amount of ferrocene was removed in vacuo to afford
the phenanthrene-9-carboxylic acid.
General procedure for the protection of cycloalkylamino acid:
To a solution of cycloalkylamino acid (4 mmol) in dry MeOH (4 mL) was added
dropwise SOCl2 (0.4 mL) at –30 °C. The reaction mixture was warmed to rt and refluxed for
1 h. Then the solvent was removed in vacuo and the product was used in the next reaction
without further purification.
General procedure for the protection of acyclic alkylamino acid:
To a solution of dry MeOH (3 mL) was added dropwise acetyl chloride (0.45 mL) at 0
°C. After 10 min stirring, the amino acid was added to the solution in portions. The mixture
30

was warmed to rt and refluxed for 2 h, then the solvent was removed in vacuo and the
product was used in the next reaction without further purification.
General procedure for the peptide bond condensation reaction (d):
To a solution of phenanthrene-9-carboxylic acid (4 mmol), 4-(dimethylamino) pyridine
(DMAP) (2 mmol), 1-hydroxybenzotriazole (HOBT) (4 mmol) in 20 mL DMF was added
NMM (1.028 mL). After the mixture was stirred at 0 °C for 15 min, N-(3-
dimethylaminopropyl)-N'-ethylcarbodiimide hydrochloride (EDC) (4.4 mmol) was added in
portions, then methyl protected amino acid (4.4 mmol) was added after 30 min stirring. The
reaction mixture was stirred overnight at rt and partitioned between EtOAc and water. The
organic layer was washed with brine, saturated NaHCO3 and 1N HCl, dried over Na2SO4,
and concentrated in vacuo. The crude product was chromatographed using Biotage Flash+
and Isco Companion systems using a 40g silica cartridge and EtOAc/hexane as eluant.
General Procedure for the carbonyl reduction reaction (e):
To a stirred solution of 9-amido-substituted phenanthrene (8 in Scheme 3-2, 2 mmol) in
THF (20 mL) was added dropwise borane-methyl sulfide (BMS) (4 mL, 2.0M solution in
THF). The reaction mixture was stirred at rt overnight and quenched with 1N HCL. THF was
removed in vacuo, and the residue was partitioned between CH2Cl2 and water. The organic
layer was dried, filtered, and evaporated to afford the target product (9 in Scheme 3-2). The
crude product was chromatographed using Biotage Flash+ and Isco Companion systems
using MeOH/CH2Cl2 as eluant.
General Procedure for the catalytic cleavage (f):
A solution of benzyoxy derivative (1mmol) and Pd/C (10%) was hydrogenated in a Parr
apparatus (30 psi) for 2 h. The reaction mixture was filtrated through Celite, and filtrate was
31

concentrated in vacuo and was chromatographed using Biotage Flash+ and Isco Companion
systems using MeOH/CH2Cl2 as eluant.
General Procedure for the LiAlH4 reduction (g):
To a suspension of methyl ester (1mmol) in 15 ml dry THF was added LiAlH4 (1g) in
portions at 0 °C. After addition, the reaction mixture was refluxed for 4 h, and then cooled to
0 °C. The reaction mixture was quenched with methnol, and then 10% Rochelle salt was
added. The reaction mixture was extracted with water and 10% MeOH/CH2Cl2. The organic
layer was dried over Na2SO4, and the crude product was chromatographed using Biotage
Flash+ and Isco Companion systems using MeOH/CH2Cl2 as eluant.
General Procedure for the basic hydrolysis reaction (h):
A solution of ester in a 1:1 mixture of 4N NaOH and MeOH was refluxed for 4 h. The
reaction mixture was acidified and partitioned between 10% MeOH/CH2Cl2 and 1N HCl.
The organic layer was dried over Na2SO4, filtered, and evaporated. The crude product was
chromatographed using Biotage Flash+ and Isco Companion systems using MeOH/CH2Cl2
as eluant.
3.6.3 Chemistry
2,3-Methylenedioxy-6-benzyloxy-phenanthrene-9-carboxylic acid (7a)
75% yield over two steps; mp 263-265 oC; 1H NMR (400.13 MHz) δ 8.40 (d, J=4Hz, 1H),
7.92 (d, J=2Hz, 1H), 7.88 (s, 1H), 7.52 (m, 2H), 7.38 (m, 5H), 7.26 (dd, J=4Hz, 2Hz, 1H),
6.14 (d, J= 4Hz, 2H), 5.35 (d, J=7Hz, 2H); MS (DCI/NH3) m/e: 373 (M + H)+.
2,3-Methylenedioxy-6-methoxy-phenanthrene-9-carboxylic acid (7b)
32

78% yield; white powder; mp 293-295 oC; 1H NMR (400.13 MHz) δ 7.67 (s, 1H), 7.60 (d, J=
4Hz, 1H), 7.22 (dd, J= 4Hz, 2Hz, 1H), 6.92 (s, 1H), 6.89 (d, J=2Hz, 1H), 6.70 (s, 1H), 5.98
(s, 2H), 3.79 (s,3H); MS (DCI/NH3) m/e: 297 (M + H)+.
2,3,6-Trimethoxyphenanthrene-9-carboxylic acid (7c)
79% yield; white powder; mp 241-243 oC; 1H NMR (400.13 MHz) δ 8.93 (d, J=4Hz, 1H),
8.33 (s, 1H), 7.84 (d, J=2Hz, 1H), 7.82 (s, 1H), 7.23 (s, 1H), 7.22 (dd, J=4Hz, 2Hz, 1H), 4.07
(s, 3H), 3.98 (s,3H), 3.97 (s, 3H); MS (DCI/NH3) m/e: 314 (M + H)+.
Methyl N-(2,3-methylenedioxy-6-benzyloxy-phenanthr-9-ylcarbonyl)-6-aminohexanoate
(10)
General procedure d from 7a (92%); cololess syrup; 1H NMR (400.13 MHz) δ 8.09 (d,
J=4Hz, 1H), 7.81 (d, J=2Hz, 1H), 7.82 (s, 1H), 7.74 (d, J=4Hz , 2H), 7.45 (s, 1H), 7.33 (t,
J=4Hz, 2H), 7.26 (m, 1H), 7.20 (dd, J= 4Hz, 2Hz, 1H), 7.09 (s, 1H), 6.03 (s, 2H), 5.18 (s,
2H), 3.41(s, 3H), 3.28 (m, 2H), 2.28 (t, J = 6Hz, 2H), 1.61 (m, 2H), 1.56 (m, 2H), 1.38 (m,
2H); MS (DCI/NH3) m/e: 500 (M + H)+.
N-(2,3-methylenedioxy-6-benzyloxy-phenanthr-9-ylcarbonyl)-6-aminohexanoic acid
(11)
General procedure h from 10 (100%); white needles; mp 198-200 oC; 1H NMR (400.13
MHz) δ 8.06 (d, J=4Hz, 1H), 7.79 (d, J=2Hz, 1H), 7.75 (s, 1H), 7.48 (s, 1H), 7.40 (d, J=4Hz,
2H), 7.30 (t, J=4Hz, 2H), 7.23 (m, 1H), 7.16 (dd, J=4Hz, 2Hz, 1H), 7.09 (s, 1H), 6.00 (s, 2H),
5.15 (s, 2H), 3.23 (m, 2H), 2.23 (t, J = 6Hz, 2H), 1.58 (m, 4H), 1.36 (m, 2H); MS (DCI/NH3)
m/e: 486 (M + H)+.
N-(2,3-Methylenedioxy-6-benzyloxy-phenanthr-9-ylmethyl)-6-aminohexanoic acid (12)
33

General procedure e from 11 (90%); white powder, recrytallized from EtOH to give white
needles; mp 184-186 oC; 1H NMR (400.13 MHz) δ 7.90 (d, J=4Hz, 1H), 7.87 (d, J=2Hz, 1H),
7.77 (s, 1H), 7.60 (s, 1H), 7.44 (d, J=4Hz, 2H), 7.34 (t, J=4Hz, 2H), 7.30 (dd, J=4Hz, 2Hz,
1H), 7.28 (m, 1H), 7.16 (s, 1H), 6.03 (s, 2H), 5.19 (s, 2H), 4.46 (s, 2H), 2.83 (m, 2H), 2.26 (t,
J = 6Hz, 2H), 1.90 (m,2H), 1.68 (m, 2H), 1.28 (m, 2H); MS (DCI/NH3) m/e: 472 (M + H)+.
N-(2,3-Methylenedioxy-6-benzyloxy-phenanthr-9-ylmethyl)-5-aminohexanol (13)
General procedure g from 10 (95%); white powder; mp 175-177 oC; 1H NMR (400.13 MHz)
δ 7.90 (d, J=4Hz, 1H), 7.86 (d, J=2Hz, 1H), 7.76 (s, 1H), 7.45 (s, 1H), 7.44 (d, J=4Hz, 2H),
7.32 (t, J=4Hz, 2H), 7.26 (m, 1H), 7.24 (dd, J=4Hz, 2Hz, 1H), 7.14 (s, 1H), 6.03 (s, 2H),
5.22 (s, 2H), 4.24 (s, 2H), 3.53 (t, J=6Hz, 2H), 2.72 (t, J=6Hz, 2H), 1.58 (m, 2H), 1.47 (m,
2H), 1.29 (m, 4H); MS (DCI/NH3) m/e: 458 (M + H)+.
Methyl N-(2,3-methylenedioxy-6-benzyloxy-phenanthr-9-ylmethyl)-5-aminopentanoate
(14)
General procedures d and e from 7a (93%); colorless syrup; 1H NMR (400.13 MHz) δ 7.97
(d, J=4Hz, 1H), 7.83 (d, J=2Hz, 1H), 7.77 (s, 1H), 7.46 (s, 1H), 7.45 (d, J=4Hz, 2H), 7.35 (t,
J=4Hz, 2H), 7.27 (m, 1H), 7.20 (dd, J=4Hz, 2Hz, 1H),7.07 (s, 1H), 6.01 (s, 2H), 5.17 (s, 2H),
4.95 (s, 2H), 3.50(s, 3H), 3.01 (m, 2H), 2.42 (t, J=6Hz, 2H), 1.67 (m, 2H), 1.59 (m, 2H); MS
(DCI/NH3) m/e: 472 (M + H)+.
N-(2,3-Methylenedioxy-6-benzyloxy-phenanthr-9-ylmethyl)-5-aminopentanoic acid (15)
General procedure h from 14 (93%); white powder, recrystallized from EtOH to give white
needles; mp 197-199 oC; 1H NMR (400.13 MHz) δ 7.89 (d, J=4Hz, 1H), 7.88 (d, J=2Hz, 1H),
7.77 (s, 1H), 7.46 (s, 1H), 7.45 (d, J=4Hz , 2H), 7.34 (t, J=4Hz, 2H), 7.29 (dd, J= 4Hz, 2Hz,
34

1H), 7.27 (m, 1H), 7.16 (s, 1H), 6.05 (s, 2H), 5.21 (s, 2H), 4.42 (s, 2H), 2.89 (m, 2H), 2.27 (t,
J=6Hz, 2H), 1.89 (m, 2H), 1.68 (m, 2H); MS (DCI/NH3) m/e: 458 (M + H)+.
N-(2,3-Methylenedioxy-6-benzyloxy-phenanthr-9-ylcarbonyl)-L-proline (16)
General procedures d & h from 7a (95%); white powder; mp 221-223 oC; 1H NMR (400.13
MHz) δ 8.00 (d, J=4Hz, 1H), 7.85 (d, J=2Hz, 1H), 7.81 (s, 1H), 7.46 (s, 1H), 7.45 (d, J=4Hz ,
2H), 7.36 (t, J=4Hz, 2H), 7.30 (m, 1H), 7.23 (dd, J= 4Hz, 2Hz, 1H), 7.13 (s, 1H), 6.04 (s,
2H), 5.19 (s, 2H), 4.71 (t, J=7Hz, 1H), 3.62 (m, 2H), 2.21 (m, 2H), 1.83 (m, 2H); MS
(DCI/NH3) m/e: 470 (M + H)+.
N-(2,3-Methylenedioxy-6-benzyloxy-phenanthr-9-ylmethyl)-L-proline methyl ester (17)
General procedures d & e from 7a (85%); brown syrup; 1H NMR (400.13 MHz) δ 7.97 (d,
J=4Hz, 1H), 7.83 (d, J=2Hz, 1H), 7.80 (s, 1H), 7.71 (s, 1H), 7.59 (d, J=4Hz, 2H), 7.47 (t,
J=4Hz, 2H), 7.36 (m, 1H), 7.22 (dd, J= 4Hz, 2Hz, 1H), 7.11 (s, 1H), 6.06 (s, 2H), 5.20 (s,
2H), 4.75 (s, 2H), 3.67 (s, 3H), 3.26 (d, J=17Hz, 1H), 2.45 (m, 2H), 1.96 (m, 2H), 1.68 (m,
2H); MS (DCI/NH3) m/e: 470 (M + H)+.
N-(2,3-Methylenedioxy-6-benzyloxy-phenanthr-9-ylmethyl)-L-proline (18)
General procedure h from 17 (100%); white powder; mp 147-149 oC; 1H NMR (400.13
MHz) δ 8.11 (d, J=4Hz, 1H), 7.84 (d, J=2Hz, 1H), 7.75 (s, 1H), 7.42 (s, 1H), 7.40 (d, J=4Hz ,
2H), 7.30 (t, J=4Hz, 2H), 7.27 (m, 1H), 7.23 (dd, J= 4Hz, 2Hz, 1H), 7.14 (s, 1H), 6.01 (s,
2H), 5.16 (s, 2H), 4.30 (s, 2H), 3.24 (m, 1H), 2.48 (m, 2H), 2.0 (m, 2H), 1.68 (m, 2H); MS
(DCI/NH3) m/e: 456 (M + H)+. Anal. (C28H25O5N·1.0H2O) C, H, N.
N-(2,3-Methylenedioxy-6-benzyloxy-phenanthr-9-ylmethyl)-L-prolinol (19)
General procedure g from 17 (95%); colorless oil, recrystallization from EtOH gave white
powder; mp 122-124 oC; 1H NMR (400.13 MHz) δ 8.13 (d, J=4Hz, 1H), 7.90 (d, J=2Hz, 1H),
35

7.84 (s, 1H), 7.51 (d, J=4Hz , 2H), 7.42 (s, 1H), 7.41 (t, J=4Hz, 2H), 7.34 (m, 1H), 7.29 (dd,
J=4Hz, 2Hz, 1H), 7.14 (s, 1H), 6.06 (s, 2H), 5.24 (s, 2H), 4.36 (d, J=7Hz, 2H), 3.78 (d,
J=17Hz, 2H), 3.41 (m, 1H), 2.42 (m, 2H), 1.83 (m, 2H), 1.66 (m, 6H); MS (DCI/NH3) m/e:
442 (M + H)+.
N-(2,3-Methylenedioxy-6-benzyloxy-phenanthr-9-ylmethyl)-L-2-piperidinecarboxylic
acid (20)
General procedures d, e & h from 7a (83%); white powder; mp 168-170 oC; 1H NMR
(400.13 MHz) δ 8.26 (d, J=4Hz, 1H), 7.85 (d, J=2Hz, 1H), 7.77 (s, 1H), 7.56 (s, 1H), 7.45 (d,
J=4Hz, 2H), 7.35 (t, J=4Hz, 2H), 7.30 (m, 1H), 7.26 (dd, J= 4Hz, 2Hz, 1H), 7.12 (s, 1H),
6.05 (s, 2H), 5.20 (s, 2H), 4.24 (s, 2H), 3.16 (m, 1H), 2.26 (m, 2H), 1.80 (m, 2H), 1.64 (m,
4H); MS (DCI/NH3) m/e: 470 (M + H)+.
N-(2,3-Methylenedioxy-6-benzyloxy-phenanthr-9-ylmethyl)-L-piperidinemethanol (21)
General procedure g from 20 (95%); light brown oil, recrystallization from EtOH to gave
white powder; mp 151-152 oC ; 1H NMR (400.13 MHz) δ 8.17 (d, J=4Hz, 1H), 7.89 (d,
J=2Hz, 1H), 7.83 (s, 1H), 7.51 (d, J=4Hz, 2H), 7.43 (s, 1H), 7.40 (t, J=4Hz, 2H), 7.34 (m,
1H), 7.27 (dd, J=4Hz, 2Hz, 1H), 7.14 (s, 1H), 6.06 (s, 2H), 5.23 (s, 2H), 4.45 (d, J=7Hz, 2H),
3.46 (d, J=17Hz, 2H), 2.85 (m, 1H), 2.37 (m, 2H), 1.69 (m, 6H); MS (DCI/NH3) m/e: 456 (M
+ H)+.
N-(2,3-Methylenedioxy-6-hydroxy-phenanthr-9-ylcarbonyl)-L-proline (22)
General procedure f from 16 (92%); white powder; mp 230-231 oC; 1H NMR (400.13 MHz)
δ 7.73 (d, J=4Hz, 1H), 7.67 (s, 1H), 7.50 (d, J=2Hz, 1H), 7.35 (s, 1H), 7.21 (dd, J=4Hz, 2Hz,
1H), 7.06 (m, 1H), 6.01 (s, 2H), 4.67 (t, J=7Hz, 1H), 3.22 (m, 2H), 2.38 (m, 2H), 2.18 (m,
2H), 1.86 (m, 2H); MS (DCI/NH3) m/e: 380 (M + H)+.
36
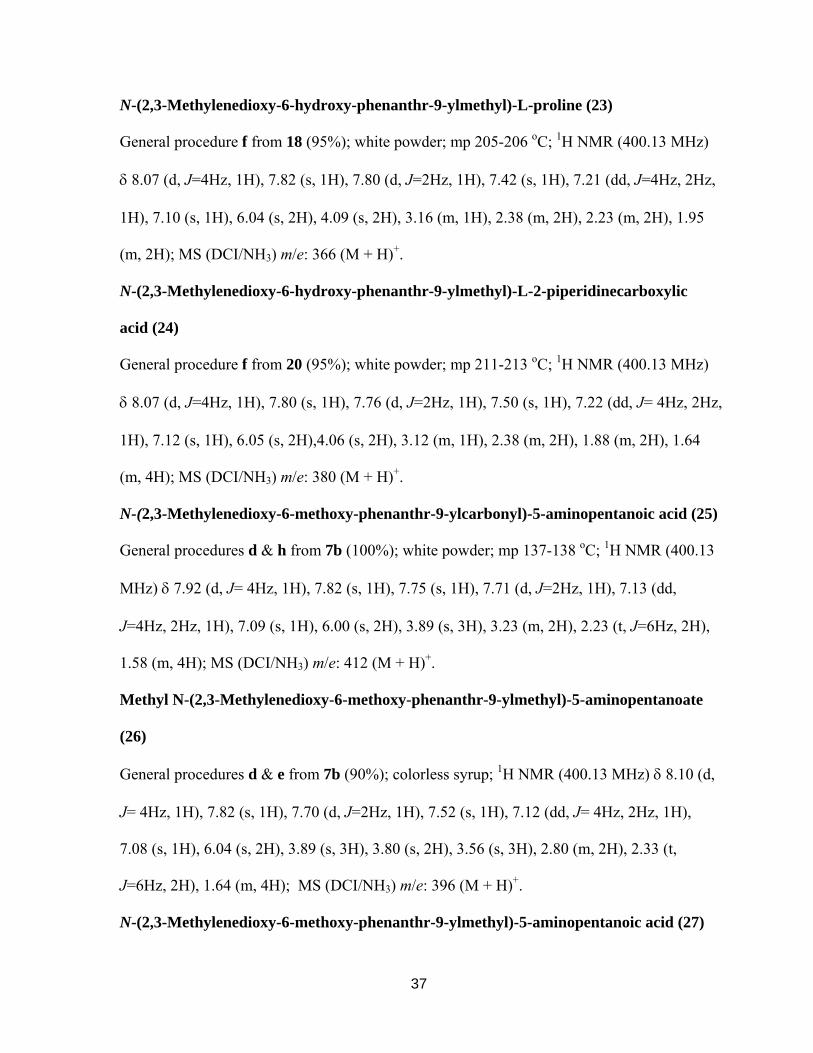
N-(2,3-Methylenedioxy-6-hydroxy-phenanthr-9-ylmethyl)-L-proline (23)
General procedure f from 18 (95%); white powder; mp 205-206 oC; 1H NMR (400.13 MHz)
δ 8.07 (d, J=4Hz, 1H), 7.82 (s, 1H), 7.80 (d, J=2Hz, 1H), 7.42 (s, 1H), 7.21 (dd, J=4Hz, 2Hz,
1H), 7.10 (s, 1H), 6.04 (s, 2H), 4.09 (s, 2H), 3.16 (m, 1H), 2.38 (m, 2H), 2.23 (m, 2H), 1.95
(m, 2H); MS (DCI/NH3) m/e: 366 (M + H)+.
N-(2,3-Methylenedioxy-6-hydroxy-phenanthr-9-ylmethyl)-L-2-piperidinecarboxylic
acid (24)
General procedure f from 20 (95%); white powder; mp 211-213 oC; 1H NMR (400.13 MHz)
δ 8.07 (d, J=4Hz, 1H), 7.80 (s, 1H), 7.76 (d, J=2Hz, 1H), 7.50 (s, 1H), 7.22 (dd, J= 4Hz, 2Hz,
1H), 7.12 (s, 1H), 6.05 (s, 2H),4.06 (s, 2H), 3.12 (m, 1H), 2.38 (m, 2H), 1.88 (m, 2H), 1.64
(m, 4H); MS (DCI/NH3) m/e: 380 (M + H)+.
N-(2,3-Methylenedioxy-6-methoxy-phenanthr-9-ylcarbonyl)-5-aminopentanoic acid (25)
General procedures d & h from 7b (100%); white powder; mp 137-138 oC; 1H NMR (400.13
MHz) δ 7.92 (d, J= 4Hz, 1H), 7.82 (s, 1H), 7.75 (s, 1H), 7.71 (d, J=2Hz, 1H), 7.13 (dd,
J=4Hz, 2Hz, 1H), 7.09 (s, 1H), 6.00 (s, 2H), 3.89 (s, 3H), 3.23 (m, 2H), 2.23 (t, J=6Hz, 2H),
1.58 (m, 4H); MS (DCI/NH3) m/e: 412 (M + H)+.
Methyl N-(2,3-Methylenedioxy-6-methoxy-phenanthr-9-ylmethyl)-5-aminopentanoate
(26)
General procedures d & e from 7b (90%); colorless syrup; 1H NMR (400.13 MHz) δ 8.10 (d,
J= 4Hz, 1H), 7.82 (s, 1H), 7.70 (d, J=2Hz, 1H), 7.52 (s, 1H), 7.12 (dd, J= 4Hz, 2Hz, 1H),
7.08 (s, 1H), 6.04 (s, 2H), 3.89 (s, 3H), 3.80 (s, 2H), 3.56 (s, 3H), 2.80 (m, 2H), 2.33 (t,
J=6Hz, 2H), 1.64 (m, 4H); MS (DCI/NH3) m/e: 396 (M + H)+.
N-(2,3-Methylenedioxy-6-methoxy-phenanthr-9-ylmethyl)-5-aminopentanoic acid (27)
37
General procedure h from 26 (99%); white powder; mp 145-146 oC; 1H NMR (400.13 MHz)
δ 8.06 (d, J=4Hz, 1H), 7.79 (s, 1H), 7.75 (d, J=2Hz, 1H), 7.48 (s, 1H), 7.22 (dd, J=4Hz, 2Hz,
1H), 7.10 (s, 1H), 6.03 (s, 2H), 4.02 (s, 2H), 3.82 (s, 3H), 2.75 (m, 2H), 2.23 (t, J=6Hz, 2H),
1.53 (m, 2H), 1.44 (m, 2H); MS (DCI/NH3) m/e: 382 (M + H)+.
N-(2,3-Methylenedioxy-6-methoxy-phenanthr-9-ylmethyl)-5-aminopentanol (28)
General procedure g from 27 (97%); colorless oil, recrystallization from EtOH gave white
powder; mp 125-126oC; 1H NMR (400.13 MHz) δ 8.00 (d, J=4Hz, 1H), 7.76 (s, 1H), 7.72 (d,
J=2Hz, 1H), 7.44 (s, 1H), 7.13 (dd, J= 4Hz, 2Hz, 1H), 7.05 (s, 1H), 6.04 (s, 2H), 3.95 (s, 2H),
3.93 (s, 3H), 3.58 (t, J=6Hz, 2H), 2.75 (m, 2H), 1.55 (m, 2H), 1.44 (m, 2H), 1.30 (m, 2H);
MS (DCI/NH3) m/e: 368(M + H)+.
N-(2,3-Methylenedioxy-6-methoxy-phenanthr-9-ylcarbonyl)-L-proline (29)
General procedures d & h from 7b (93%); white powder; mp 207-208 oC; 1H NMR (400.13
MHz) δ 7.78(d, J= 4Hz, 1H), 7.70 (s, 1H), 7.54 (d, J=2Hz, 1H), 7.35 (s, 1H), 7.20 (dd,
J=4Hz, 2Hz, 1H), 7.14 (m, 1H), 6.01 (s, 2H), 4.67 (m, 1H), 3.90 (s, 3H), 3.22 (m, 2H), 2.38
(m, 2H), 1.86 (m, 2H); MS (DCI/NH3) m/e: 394 (M + H)+.
N-(2,3-Methylenedioxy-6-methoxy-phenanthr-9-ylmethyl)-L-proline methyl ester (30)
General procedures d & e from 7a (85%); white syrup; 1H NMR (400.13 MHz) δ 8.20(d,
J=4Hz, 1H), 7.80(s, 1H), 7.70 (d, J=2Hz, 1H), 7.52 (s, 1H), 7.21 (dd, J=4Hz, 2Hz, 1H), 7.13
(s, 1H), 6.05 (s, 2H), 4.02 (s, 2H), 3.89 (s, 3H), 3.67 (s, 3H), 3.14 (m, 1H), 2.32 (m, 2H), 2.14
(m, 2H), 1.86 (m, 2H); MS (DCI/NH3) m/e: 394 (M + H)+.
N-(2,3-Methylenedioxy-6-methoxy-phenanthr-9-ylmethyl)-L-proline (31)
General procedure h from 30 (100%); white powder; mp 145-146 oC; 1H NMR (400.13
MHz) δ 8.21 (d, J=4Hz, 1H), 7.77 (s, 1H), 7.72 (d, J=2Hz, 1H), 7.56 (s, 1H), 7.23 (dd,
38

J=4Hz, 2Hz, 1H), 7.10 (s, 1H), 6.04 (s, 2H), 4.05 (s, 2H), 3.96 (s, 3H), 3.16 (m, 1H), 2.36 (m,
2H), 2.14 (m, 2H), 1.81 (m, 2H); MS (DCI/NH3) m/e: 380 (M + H)+.
N-(2,3-Methylenedioxy-6-methoxy-phenanthr-9-ylmethyl)-L-prolinol (32)
General procedure g from 31 (95%); white powder; mp 138-139 oC; 1H NMR (400.13 MHz)
δ 8.16 (d, J=4Hz, 1H), 7.88(s, 1H), 7.80 (d, J=2Hz, 1H), 7.46 (s, 1H), 7.23 (dd, J=4Hz, 2Hz,
1H), 7.14 (s, 1H), 6.07 (s, 2H), 4.03 (s, 2H), 3.94 (s, 3H), 3.70 (d, J=17Hz, 2H), 3.16 (m, 1H),
2.38 (m, 2H), 2.23 (m, 2H), 1.95 (m, 2H); MS (DCI/NH3) m/e: 366 (M + H)+.
N-(2,3-Methylenedioxy-6-methoxy-phenanthr-9-ylmethyl)-L-2-piperidinecarboxylic
acid (33)
General procedures d, e & h from 7b (80%); white powder; mp 171-172 oC; 1H NMR
(400.13 MHz) δ 8.21 (d, J=4Hz, 1H), 7.77 (s, 1H), 7.72 (d, J=2Hz, 1H), 7.56 (s, 1H), 7.23
(dd, J=4Hz, 2Hz, 1H), 7.10 (s, 1H), 6.04 (s, 2H), 4.08 (s, 2H), 3.96 (s, 3H), 3.08 (m, 1H),
2.38 (m, 2H), 1.84 (m, 2H), 1.60 (m, 4H); MS (DCI/NH3) m/e: 394 (M + H)+. Anal.
(C23H23O5N·2.0H2O) C, H, N
N-(2,3-Methylenedioxy-6-methoxy-phenanthr-9-ylmethyl)-L-2-piperidinemethanol (34)
General procedure g from 33 (98%); white powder; mp 155-157 oC; 1H NMR (400.13 MHz)
δ 8.16 (d, J = 4Hz, 1H), 7.88 (s, 1H), 7.80 (d, J=2Hz, 1H), 7.47 (s, 1H), 7.22 (dd, J=4Hz,
2Hz, 1H), 7.15 (s, 1H), 6.07 (s, 2H), 4.06 (s, 2H), 3.98 (s, 3H), 3.68 (d, J=7Hz, 2H), 2.87 (m,
1H), 2.40 (m, 2H), 1.64 (m, 6H); MS (DCI/NH3) m/e: 380 (M + H)+.
N-(2,3,6-Trimethoxyphenanthr-9-ylmethyl)-6-aminohexanoic acid (35)
General procedures d, e & h from 7b (77%); brown powder; mp 133-134 oC; 1H NMR
(400.13 MHz) δ 7.90 (d, J=4Hz, 1H), 7.78 (s, 1H), 7.72 (d, J=2Hz, 1H), 7.52 (s, 1H), 7.20
39

(dd, J=4Hz, 2Hz, 1H), 7.08 (s, 1H), 3.92 (s, 9H), 3.71 (s, 2H), 2.87 (m, 2H), 2.23 (m, 2H),
1.55 (m, 2H), 1.46 (m, 2H), 1.28 (m, 2H); MS (DCI/NH3) m/e: 412 (M + H)+.
N-(2,3,6-Trimethoxyphenanthr-9-ylmethyl)-5-aminohexanol (36)
General procedure g from 35 (92%); yellow oil; 1H NMR (400.13 MHz) δ 7.88 (d, J=4Hz,
1H), 7.76 (s, 1H), 7.71 (d, J=2Hz, 1H), 7.44 (s, 1H), 7.13 (dd, J=4Hz, 2Hz, 1H), 7.05 (s, 1H),
5.99 (s, 2H), 3.94 (s, 9H), 3.80 (s, 2H), 3.73 (t, J=6Hz, 2H), 2.75 (m, 2H), 1.50 (m, 4H), 1.28
(m, 4H); MS (DCI/NH3) m/e: 398 (M + H)+.
N-(2,3,6-Trimethoxyphenanthr-9-ylmethyl)-L-2-piperidinecarboxylic acid (37)
General procedures d, e & h from 7c (75%); light yellow powder; mp 187-188 oC; 1H NMR
(400.13 MHz) δ 8.21 (d, J=4Hz, 1H), 7.78 (s, 1H), 7.71 (d, J=2Hz, 1H), 7.56 (s, 1H), 7.23
(dd, J=4Hz, 2Hz, 1H), 7.10 (s, 1H), 4.10 (s, 2H), 3.98 (s, 9H), 3.12 (m, 1H), 2.42 (m, 2H),
1.80 (m, 2H), 1.60 (m, 4H); MS (DCI/NH3) m/e: 410 (M + H)+.
N-(2,3,6-Trimethoxyphenanthr-9-ylmethyl)-L-2-piperidinemethanol (38)
General procedure g from 37 (95%); brown oil, recrystallization from EtOH gave yellow
powder; mp135-137 oC; 1H NMR (400.13 MHz) δ 8.21 (d, J=4Hz, 1H), 7.78 (s, 1H), 7.72 (d,
J=2Hz, 1H), 7.50 (s, 1H), 7.20 (dd, J=4Hz, 2Hz, 1H), 7.14 (s, 1H), 6.07 (s, 2H), 4.10 (s, 2H),
3.96 (s, 9H), 3.74 (d, J=17Hz, 2H), 2.87 (m, 1H), 2.41 (m, 2H), 1.66 (m, 6H); MS
(DCI/NH3) m/e: 396 (M + H)+.
1-[3-(4,5-Dimethoxy-2-nitrophenyl)-2-(4-methoxyphenyl)-acryloyl]-pyrrolidine-2-
carboxylic acid (39)
General procedures d & h from 5b (90%); brown powder; mp 120-122 oC; 1H NMR (400.13
MHz) δ7.67 (s, 1H), 7.26(d, J=4Hz, 2H), 7.08 (s, 1H), 6.73 (d, J=4Hz, 2H), 6.44 (s, 1H),
40

4.63 (t, J=7Hz, 1H), 3.92 (s, 6H), 3.73 (s, 3H), 3.41(t, J=7Hz, 2H), 2.22 (m, 2H), 1.92 (m,
2H); MS (DCI/NH3) m/e: 443 (M + H)+.
1-[3-(4,5-Dimethoxy-2-nitrophenyl)-2-(4-methoxyphenyl)-allyl]-pyrrolidine-2-
carboxylic acid (40)
General procedure e from 39 (90%); brown syrup; 1H NMR (400.13 MHz) δ 7.61 (s, 1H),
7.24 (d, J=4Hz, 2H), 7.01(s, 1H), 6.77 (d, J=4Hz, 2H), 6.64 (s, 1H), 4.36 (d, J=7Hz, 2H),
3.89 (s, 3H), 3.72 (t, J=7Hz, 1H), 3.69 (s, 3H), 3.42 (s, 3H), 3.24 (m, 2H), 2.18 (m, 2H), 1.84
(m, 2H); MS (DCI/NH3) m/e: 429 (M + H)+.
{1-[3-(4,5-Dimethoxy-2-nitrophenyl)-2-(4-methoxyphenyl)-allyl]-pyrrolidin-2-yl}-
methanol (41)
General procedure g from 40 (90%); dark oil; 1H NMR (400.13 MHz) δ 7.59 (s, 1H), 7.23 (d,
J=4Hz, 2H), 7.00 (s, 1H), 6.71 (d, J=4Hz, 2H), 6.23 (s, 1H), 4.17 (d, J=7Hz, 2H), 3.89 (s,
3H), 3.78 (d, J=7Hz, 2H), 3.69 (s, 3H), 3.58 (m, 1H), 3.41 (s, 3H), 3.16 (m, 2H), 1.91 (m,
2H), 1.80 (m, 2H); MS (DCI/NH3) m/e: 415 (M + H)+.
{1-[3-(3,4-Dimethoxyphenyl)-2-(4-methoxyphenyl)allyl]-pyrrolidin-2-yl}-methanol (42)
Silmilar procedure as 40 (77% for two steps); yellow syrup; 1H NMR (400.13 MHz) δ 7.11
(d, J=5Hz, 2H), 6.89 (d, J=5Hz, 2H), 6.63 (s, 1H), 6.58 (d, J=3Hz, 2H), 6.39 (s, 1H), 4.06 (d,
J=7Hz, 2H), 3.90 (d, J=6Hz, 2H), 3.71 (s, 3H), 3.69 (s, 3H), 3.65 (m, 1H), 3.39 (s, 3H), 3.27
(m, 2H), 1.84 (m, 2H), 1.70 (m, 2H); MS (DCI/NH3) m/e: 370 (M + H)+.
3.6.4 Cell Growth Inhibition Assay
The human A549 lung cancer cell line was used for the cytotoxicity screening of PBT
derivatives using the cell-based sulforhodamine B (SRB) microtitre plate assay.8 Compound
stock solutions were prepared in DMSO with the final solvent concentration ≤2% DMSO
41

(v/v), a concentration without effect on cell replication. The cells were cultured at 37 oC in
RPMI-1640 supplemented with 25 mM N-2-hydroxyethylpiperazine-N'-2-ethanesulfonic acid
(HEPES), 2% (w/v) sodium bicarbonate, 10% (v/v) fetal bovine serum, and 100 µg/mL
kanamycin in a humidified atmosphere containing 5% CO2. Duration of compound exposure
was 3 days. The ED50 value (the concentration that reduced the cell number by 50%) was
interpolated from dose-response data. Each test was performed in triplicate with variation
less than 5%. The EC50 values determined in each independent test varied less than 10%.
42

Table 3-1. Cytotoxicity of 2,3-Methylenedioxy-6-alkyloxy-9-substituted PBT Analogs
R2
R1O
OO 2
3
6
9
Compound R1 R2 EC50 (µM)a,b
7a -CH2C6H5 -COOH NA
7b -CH3 -COOH NA
10 -CH2C6H5 -CONH(CH2)5COOMe 41.2
11 -CH2C6H5 -CONH(CH2)5COOH 41.2
12 -CH2C6H5 -CH2NH(CH2)5COOH 1.6
13 -CH2C6H5 -CH2NH(CH2)5CH2OH 1.1
14 -CH2C6H5 -CH2NH(CH2)4COOMe 17.0
15 -CH2C6H5 -CH2NH(CH2)4COOH 2.2
16 -CH2C6H5 N
O
HOOC
42.6
17 -CH2C6H5 N
MeOOC
32.1
18 -CH2C6H5 N
HOOC
4.4
43

19 -CH2C6H5 N
HO
1.8
20 -CH2C6H5 N
HOOC
3.2
21 -CH2C6H5 N
HO
1.3
22 -H N
O
HOOC
39.7
23 -H N
HOOC
41.2
24 -H N
HOOC
39.7
25 CH3 -CONH(CH2)4COOH 73.3
26 CH3 -CH2NH(CH2)4COOMe 25.3
27 CH3 -CH2NH(CH2)4COOH 1.3
28 CH3 -CH2NH(CH2)4CH2OH 0.27
29 CH3 N
O
HOOC
5.3
30 CH3 N
MeOOC
73.8
44
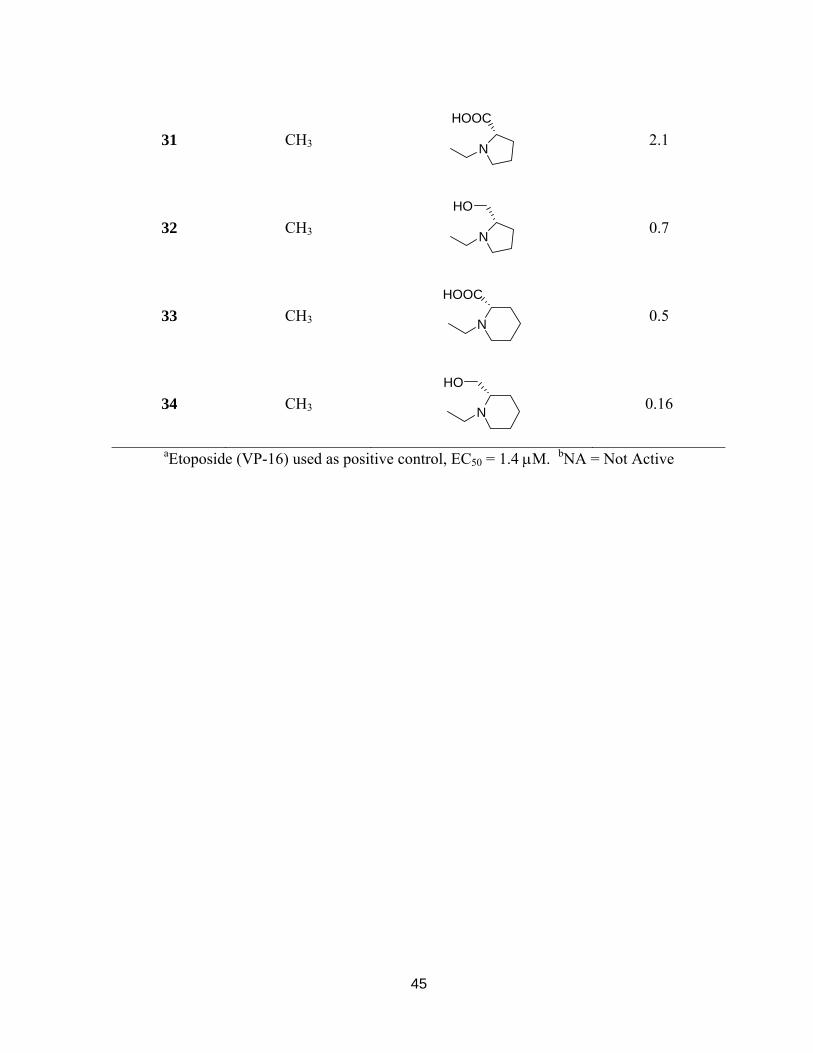
31 CH3 N
HOOC
2.1
32 CH3 N
HO
0.7
33 CH3 N
HOOC
0.5
34 CH3 N
HO
0.16
aEtoposide (VP-16) used as positive control, EC50 = 1.4 µM. bNA = Not Active
45

Table 3-2. Cytotoxicity of 2,3,6-Trimethyoxy-9-substituted PBT Analogs
R
H3CO
OCH3H3CO 2
3
6
9
Compound R EC50 (µM)
7c -COOH NA
35 -CH2NH(CH2)5COOH 9.7
36 -CH2NH(CH2)5CH2OH 2.7
37 N
HOOC
9.7
38 N
HO
6.3
aEtoposide (VP-16) used as positive control, EC50 = 1.4 µM. bNA = Not Active
46

Table 3-3. Cytotoxicity of seco-PBT Analogs Compound Structure EC50 (µM)
39
MeO
MeO OMe
N
NO2
OHOOC
80
40
MeO
MeO OMe
N
NO2
HOOC
45.2
41
MeO
MeO OMe
N
NO2
HO
11.7
42
MeO
MeO OMe
NHO
52.2
Etoposide (VP-16) used as positive control, EC50 = 1.4 µM
47

3.7 REFERENCES
1) Ciufolini, M. A.; Roschangar, F. A unified strategy for the synthesis of phenanthroizidine alkaloids: preparation of sterically congested pyridines. J. Am. Chem. Soc. 1996, 118, 12082-12089.
2) Lebrun, S.; Couture, A.; Deniau, E.; Grandclaudon, P. Total synthesis of (+)-cryptopleurine, (+)-antofine and (+)-deoxypergularinine. Tetrahedron 1999, 55, 2659-2670.
3) Kim, S.; Lee, J.; Lee, T.; Park, H.; Kim, D. First asymmetric total synthesis of (-)-antofine by using an enantioselective catalytic phase transfer alkylation. Org. Lett. 2003, 5, 2703-2706.
4) Kim, S.; Lee, T.; Lee, E.; Lee, J.; Fan, G. J.; Lee, S. K.; Kim, D. Asymmetric total syntheses of (-)-antofine and (-)-cryptopleurine using (R)-(E)-4-(tributylstannyl)but-3-en-2-ol. J. Org. Chem. 2004, 69, 3144-3149.
5) Wassmundt, F. W.; Kiesman, W. F.; Soluble catalysts for improved Pschorr cyclizations. J Org. Chem. 1995, 60, 196-201
6) Suffness, M.; Cordell, G. A. In The Alkaloids, Chemistry and Pharmacology, Brossi, A., Ed.; Academic Press: New York, 1985; Vol. 25, pp 3-355.
7) Stark, D.; Lykkeberg, A. K.; Christensen, J.; Budnik, B. A.; Abe, F.; Jaroszewski, J. W. In vitro cytotoxic activity of phenanthroindolizidine alkaloids from Cynanchum vincetoxicum and Tylophora tanakae against drug-sensitive and multidrug-resistant cancer cells. J. Nat. Prod. 2002, 65, 1299-1302.
8) Rubinstein, L. V.; Shoemaker, R. H.; Paull, K. D.; Simon, R. M.; Tosini, S.; Skehan, P.; Scudiero, D. A.; Monks, M. R. Comparison of in vitro anticancer-drug-screening data generated with a tetrazolium assay versus a protein assay against a diverse panel of human tumor cell lines. J. Natl. Cancer Inst. 1990, 82, 1113-1118.
48

4 CHAPTER IV. DESIGN, SYNTHESIS AND CYTOTOXIC EVALUATION OF 9-SUBSTITUTED PHENANTHRENE-
BASED TYLOPHORINE DERIVATIVES (PBTS) (PART II)
4.1 INTRODUCTION
Chapter III reported the design, synthesis and cytotoxicity evaluation of a series of novel
polar water-soluble phenanthrene-based tylophorine derivatives (PBTs) with EC50 ≅10-7 M
against the A549 human lung cancer cell line. These compounds could possibly have lower
or no CNS toxicity because the increased polarity should prevent them from penetrating the
blood-brain barrier. Preliminary structure-activity relationship (SAR) studies revealed that
2,3-methylenedioxy-6-methoxyphenanthrene was an optimized core structural unit that
incorporated all of the favorable modifications identified at the C-2, C-3 and C-6 positions.
A N-containing substituent at the C-9 position is also required for cytotoxic activity, and this
site presents an ideal position for introducing more polar, water-solubility-enhancing
moieties, such as a terminal hydroxyl or carboxylic acid. These critical SAR clues prompted
us to explore additional C-9 substituents to better understand the SAR of the PBT compound
class. Most importantly, we wanted to extend the in vitro anticancer spectra to include
additional significant tumor types as well as investigate whether target PBTs exhibit cross-
resistance in a multi-drug resistant cancer cell subline.
In this Chapter, we describe new developments toward the design and synthesis of novel
C-9 substituted PBTs. Several N-containing cyclic and acyclic terminal-hydoxyl moieties

were introduced at the C9 position in order to explore and optimize the activity profiles of
novel C-9 substituted PBTs. All compounds were evaluated as in vitro anticancer agents
against the human A549 lung cancer cell line. Several C9-substituted PBTs showed superior
cytotoxic activity profiles with EC50 values in the sub-micromolar range, indicating that
rational C-9 modification was an effective approach to optimize the activity profile of this
compound class. The active compounds were further examined against DU-145 (prostate),
ZR-751 (breast), KB (nasopharyngeal), and KB-Vin (multi-drug resistant KB subline) human
cancer cell lines. Finally, the SAR is discussed relative to the current issues of
chemotherapy-induced toxicity and resistance.
4.2 DESIGN AND SYNTHESIS
MeO
COOH
OO
MeOOO
OO
MeO
COOH
COOH
CHONO2
a b c
Reagents and conditions: a: Ac2O/Et3N b: FeSO4/NH4OH c: NaNO2/Fluoroboric acid; Ferrocene/acetone d; EDC,DMAP,HOBt/DMF e: BMS/THF f: NaOH/MeOH (1:1) g: LiAlH4/THF
II.
IV. V.
NO2
OO
MeO
COOHNH2
MeO
OO
R
O
MeO
OO
R
d e or f or g
VII.VI.
I.III.
Scheme 4-1. Synthesis of 6-methoxy-9-substituted PBTs.
50
4.3 CHEMISTRY
Compounds 43-56 were synthesized from commercially available 3,4-methylenedioxy-
6-nitrobenzaldehyde and 4-methoxyphenylacetic acid according to the methods we described
in Chapter III (compounds 57 and 58 were synthesized using similar procedures). Briefly,
2,3-methylenedioxy-6-methoxy-phenanthrene-9-carboxylic acid (V) was obtained through a
Perkin reaction and an improved free-radical Pschorr cyclization (Scheme 4-1)1-2 in a
satisfactory overall yield of 78%. Compound V was then condensed with the appropriate
amines in the presence of N-(3-dimethylaminopropyl)-N'-ethylcarbodiimide hydrochloride
(EDC), 4-(dimethylamino) pyridine (DMAP) and 1-hydroxybenzotriazole (HOBT) (Scheme
4-1). The carbonyl bond of the amide was reduced with borane-methyl sulfide complex
(BMS) to give the methylene amines and then the target carboxylic acid and hydroxymethyl
analogs were produced by basic hydrolysis and lithium aluminum hydride (LiAlH4)
reduction, respectively.
4.4 RESULTS AND DISCUSSION
The new target compounds (43-58), together with 20, 21, 27, 28, 31-34 from the
previous chapter, were first evaluated for in vitro anticancer activity against the human A549
lung cancer cell line using the cell-based sulforhodamine B (SRB) microtitre plate assay.3
Compound structures and cytotoxic activity data are shown in Tables 4-1 and -2. Twelve
active compounds were further evaluated against three additional cancer cell lines (KB,
DU145 and ZR-751) and one resistant subline (KB-Vin) (Table 4-3). Antofine, emetine,
doxorubicin and etoposide (VP-16) were used as reference compounds.
51

4.4.1 Structure-Activity Relationship (SAR) Studies
Interestingly, changing the stereochemistry of the 2’-substituent on the pyrrole ring
altered the potency. Compounds 31 and 32 were more potent that their stereoisomers 43 and
44. These findings are consistent with those from earlier studies of tylophorine alkaloids that
showed equal or higher cytotoxicity of the 13aS series as compared with the 13aR series,4
suggesting a well-defined regioselective interaction of these compounds with the putative
biological target.
For target compounds with varied acyclic N-containing side chains, the distance between
the nitrogen and terminal substituent affected the potency. The aminoundecanoic acid analog
was significantly less active than the corresponding aminopentanoic acid, which in turn was
slightly less active than the aminohexanoic acid (49 < 27 < 45). A similar rank order of
potency was found when the terminal carboxylic acid was reduced to a hydroxymethyl group
(50 < 28 < 46). The shorter spacing was definitely preferable to the longer spacing.
Based on the significant biological activity of the acylic amines, the position of the
piperidine substituent was changed from 2’ (ortho) to 4’ (para), which resulted in increased
potency (33 vs 47; 34 vs 48), demonstrating that a terminal hydroxyl/carboxylic acid in a
para position could favorably affect the activity. This conclusion was confirmed for
compounds where the C-6 methoxy group was replaced with a benzyloxy ether (Table 4-2;
57 > 20 and 58 > 21).
To investigate the relationship between activity and nitrogen content in the C-9 side
chain, both piperidine (one nitrogen) and piperazine (two nitrogens) analogs were prepared
and tested. Although the second nitrogen was tolerated, its presence slightly decreased
52

activity [compare the EC50 values between the piperazine-ethanol (54) and piperidine-ethanol
(56) analogs].
Additional SAR observations relative to the C-9 N-containing side chain were also noted
in the course of our study. 4’-Hydroxymethyl and 4’hydroxyethylpiperidine analogs (48 and
56, respectively) were both quite potent, but the former was more active than the latter.
While the piperazine-ethanol analog (54) was quite active, the piperazine-ethoxyethanol
analog (55) lost all activity. In contrast, potency was increased when the hydroxylethyl of 54
was replaced with a phenol in 53. These results corroborate the conclusion that an
appropriate side chain length is important for maximal activity.
Since compound 53 was quite potent, while both ortho- and para-chlorophenyl
substituted piperazine analogs (51, 52) were inactive, the presence of a hydrogen bond
acceptor/donor group at C-9 chain terminus appears essential for cytotoxic activity. It could
be that a hydrogen bonding interaction between the terminal group and a biological target
plays an important role in binding the hypothetical target, and the spacing between this group
and the remainder of the molecule needs to be well optimized.
4.4.2 Drug-Resistance Study
Twelve active compounds [including four hydrochloride salts (34-HCl, 46-HCl, 48-HCl,
56-HCl) of corresponding active free bases (34, 46, 48, 56)] were further screened against an
extended panel of human tumor cell lines including DU-145 (prostate), ZR-751 (breast), KB
(nasopharyngeal), and KB-VIN (multidug-resistant KB subline) in order to explore their
antitumor spectra and drug-resistance profiles. Four compounds were used as reference
compounds. Antofine is a positional isomer of tylophorine isolated from Asclepiadaceae by
Dr. T. S. Wu5 in Taiwan. Emetine is a protein synthesis inhibitor, which exhibits cross-
53

resistance with tylocrebine in mutant CHO cells.3 Doxorubicin (adriamycin), vincristine, and
etoposide (VP-16, Vepesid®) are widely used anticancer agents for treating a range of solid
tumors. The results are illustrated in Table 4-3. In general, all new compounds exhibited
potent activity against KB (EC50: 0.07-0.50 µM), DU-145 (EC50: 0.03-0.67 µM), and ZR-751
(EC50: 0.02-0.54 µM) cell lines, as well as KB-Vin (EC50: 0.09-0.38 µM) cells. The
corresponding salts showed similar selectivity pattern and slightly better potency than the
free bases, possibly due to improved water solubility. Compared to the reference compounds
emetine, doxorubicin, etoposide and vincristine, neither the C-9 substituted PBTs nor
antofine showed any cross-resistance with the KB-Vin resistant cell line, suggesting that their
mode may be distinctly different from that of other cancer chemotherapeutic compounds. All
PBTs exhibited cytotoxic activity in the sub-micromolar range against the limited set of
representative human cancer cell lines. Compound 46-HCl was most active against DU-145
(prostate) and ZR-751 (breast) cancer cell lines, and compound 48-HCl exhibited a fairly
uniform and potent cytotoxic activity with ED50 values less than 100 nM against the tumor
cell line panel. Compound 56 and its HCl salt (56-HCl) were most active against ZR-751
breast cancer cell replication, suggesting that further exploration of this compound as a
selective breast cancer drug lead will be worthwhile.
In summary, a series of novel 9-substituted 2, 3-methylenedioxy-6-methoxy-PBTs were
synthesized and exhibited potent cytotoxic activity against a limited but diverse panel of
human tumor cell lines, including a multidrug-resistant variant. The EC50 values were in the
sub-micromolar range, comparable with the activity of the two front-line antineoplastic drugs
used as positive controls, and the new compounds had a superior drug-resistance profile.
Combination of a 2, 3-methylenedioxy-6-methoxyphenanthrene skeleton with a C-9 cyclic
54

piperidine ring and para terminal hydroxyl side chain generated the most potent PBTs. N-
(2,3-Methylenedioxy-6-methoxy-phenanthr-9-ylmethyl)-L-4-piperidinemethanol (48)
exhibited a fairly uniform and potent cytotoxic activity with EC50 values less than 100 nM
against the cell line panel. The activity was maintained and the water solubility increased by
formation of the hydrochloride salt. These PBT salts are the first reported water soluble
tylophorine derivatives with significant cytotoxic activity, in particular to multidrug-resistant
cells. They represent well-qualified and promising clinical trial candidates for cancer
(especially refractory cancer) treatment.
4.5 CONCLUSIONS
More than 70 PBTs were designed and synthesized. All compounds were screened
against human cancer cell lines. The most active compounds which incorporated all of the
favorable modifications identified to date possess novel structures and showed remarkable
EC50 values in the sub-micromolar range, and displayed notable selectivity. These
derivatives are the first reported water soluble tylophorine derivatives with remarkable
cytotoxic activity, in particular to multidrug-resistant cells. They represent well-qualified
and promising clinical trial candidates for cancer (especially refractory cancer) treatment.
4.6 EXPERIMENTAL SECTION
4.6.1 Instruments and Chemicals
Melting points were measured using Fisher Johns melting apparatus without correction.
The proton nuclear magnetic resonance (1H NMR) spectra were measured on a 300 MHz
Varian Gemini 2000 spectrometer using TMS as internal standard. Mass spectra were
recorded on a PE-Sciex API-3000 LC/MS/MS instrument equipped with a Turbo IonsSpray
55

ion source. The solvent used was CDCl3 unless indicated. Elemental analyses were
performed by Atlantic Microlab, Inc., Norcross, GA. All active target compounds were
analyzed for C, H, N and gave values within +0.4% of the theoretical values. The purity of
inactive target compounds was verified by HPLC using three different solvent systems. Thin-
layer chromatography (TLC) was performed on PLC silica gel 60 F254 plates (0.5 mm,
Merck). Biotage Flash+ and Isco Companion systems were used as medium-pressure column
chromatography. Silica gel (200-400 mesh) from Aldrich, Inc., was used for column
chromatography. 4-benzyloxyphenylacetic acid and 3,4-Methylenedioxy-6-
nitrobenzaldehyde were purchased from TCI. Isonipecotic acid and L-pipecolinic acid were
commercially available from Lancaster. All other chemicals were obtained from Aldrich, Inc.
and Fisher, Inc.
4.6.2 Chemistry
4,5-Methylenedioxy-(4-methoxyphenyl)-2-nitrocinnamic acid (III in Scheme 4-1)
A solution of 3,4-methylenedioxy-6-nitrobenzaldehyde (12 mmol), NEt3 (12 mmol), 4-
methoxyphenylacetic acid (17 mmol) was refluxed with stirring under Ar for 40 min. 20
Water (30 ml) was added to the reaction mixture and during the addition the temperature was
maintained between 90 °C and 100 °C. The reaction mixture was cooled to ambient
temperature and solid was collected by filtration and recrystallized from EtOH.
91% yield; yellow powder; mp 184-185 °C; 1H NMR (400.13 MHz) δ 7.92 (s, 1H), 7.53 (s,
1H), 7.01 (d, J = 2Hz, 2H), 6.73 (d, J = 2 Hz, 2H), 6.22 (s, 1H), 5.96 (s, 2H), 3.74 (s, 3H);
MS (DCI/NH3) m/e: 344 (M + H)+.
4,5-Methylenedioxy-(4-methoxyphenyl)-2-aminocinnamic acid (IV in Schem 4-1)
56

To a solution of the acid (III) (7 mmol) in 10% aqueous NH4OH (100 ml) was added ferrous
sulfate heptahydrate (15 g) dissolved in distilled water (100 ml) and concentrated aqueous
NH4OH (100 ml). The reaction mixture was refluxed for 1.5 h, cool to 40 °C and filtrate on
Celite and acidified with acetic acid (100 ml), the solid was collected by filtration and
recrystallization from EtOH yielded the aminostilbenic acid.
95% yield; yellow powder; mp 165-166 °C; 1H NMR (400.13 MHz) δ 7.74(s, 1H), 7.08 (d, J
= 2Hz, 2H), 6.80 (d, J = 2 Hz, 2H), 6.17 (s, 1H), 6.06 (s, 1H), 5.70 (s, 2H), 3.80 (s, 2H), 3.73
(s, 3H); MS (DCI/NH3) m/e: 314 (M + H)+.
2,3-Methylenedioxy-6-methoxy-phenanthrene-9-carboxylic acid (V in Scheme 4-1)
A solution composed of the aminostilbenic acid (IV) (3 mmol), NaOH (33 mmol) and
NaNO2 in water (10 ml) was added dropwise over 30 min with stirring to 48% fluoroboric
acid (43 mmol) at 0-5 °C. The mixture was stirred for 1 h after which sulfamic acid was
added until the mixture tested negative to starch-iodide paper. The crude solid was collected
by filtration, dissolved in anhydrous acetone (10 ml) and then added dropwise with stirring
over a 15 min period to ferrocene (0.056 g, 0.3 mmol) in acetone at ambient temperature.
After an additional 15 min of stirring the green reaction mixture was added to water (100 ml).
A light-yellow precipitate was collected and the trace amount of ferrocene was removed in
vacuo to afford the phenanthroic acid.
92% yield; white powder; mp 293-295 oC; 1H NMR (400.13 MHz) δ 7.67 (s, 1H), 7.60 (d, J=
4Hz, 1H), 7.22 (dd, J= 4Hz, 2Hz, 1H), 6.92 (s, 1H), 6.89 (d, J=2Hz, 1H), 6.70 (s, 1H), 5.98
(s, 2H), 3.79 (s,3H); MS (DCI/NH3) m/e: 297 (M + H)+.
57

4.6.3 General Procedures
General Procedure for the protection of cycloalkylamino acid:
To a solution of cycloalkylamino acid (4 mmol) in dry MeOH (4 ml) was added
dropwise SOCl2 (0.4 ml) at -30 °C. The reaction mixture was warmed to room temperature
and refluxed for 1 h. Then the solvent was removed in vacuo and the product was used in the
next reaction without any further purification.
General Procedure for the protection of acyclic alkylamino acid:
To a solution of dry MeOH (3 ml) was added dropwise AcCl (0.45 ml) at 0 °C. After 10
min stirring, the amino acid was added to the solution in portions. The mixture was warmed
to room temperature and refluxed for 2 h, then the solvent was removed in vacuo and the
product was used in the next reaction without any further purification.
General Procedure for the peptide bond condensation reaction (d):
To a solution of phenanthroic acid (4 mmol), 4-(dimethylamino) pyridine (DMAP) (2
mmol), 1-hydroxybenzotriazole (HOBT) (4 mmol) and methyl protected amino acid (4.4
mmol) in 20 ml DMF was added NMM (1.03 ml). The mixture was stirring at 0 °C for 15
min, N-(3-dimethylaminopropyl)-N'- ethylcarbodiimide hydrochloride (EDC) (4.4 mmol)
was added by portion. The reaction mixture was stirred overnight at room temperature and
partitioned between EtOAc and water. The organic layer was washed with brine, saturated
NaHCO3 and1N HCl, dried over Na2SO4, and concentrated in vacuo. The crude product was
chromatographed using Biotage Flash+ and Isco Companion systems using a 40g silica
cartridge and EtOAc/hexane as eluant.
General Procedure for the carbonyl reduction reaction (e):
58

To a stirred solution of 9-ylcarbonyl compound (2 mmol) in THF (20 ml) was added
dropwise borane-methyl sulfide (BMS)(4 ml, 2.0M solution in THF), the reaction was stirred
at room temperature overnight and quenched with 1N HCl. THF was removed in vacuo. The
residue was partitioned between CH2Cl2 and water. The organic layer was dried, filtered and
evaporated to afford 9-ylmethyl ester. The crude product was chromatographed using
Biotage Flash+ and Isco Companion systems using MeOH/CH2Cl2 as eluant.
General Procedure for the basic hydrolysis reaction (f):
A solution of ester, 4N NaOH and MeOH (1:1) was refluxed for 4 h. The reaction
mixture was acidified and partitioned between 10% MeOH/CH2Cl2 and 1N HCl, The organic
layer was dried over Na2SO4, filtered and evaporated. The crude product was
chromatographed using Biotage Flash+ and Isco Companion systems using MeOH/CH2Cl2
as eluant.
General Procedure for the LiAlH4 reduction (g):
To a suspension of methyl ester (1 mmol) in 15 ml dry THF was added LiAlH4 (1 g) in
portions at 0 °C. After addition, the reaction mixture was refluxed for 4 h, and then cooled to
0 °C. The reaction mixture was quenched with MeOH, and then 10% Rochelle salt was
added. The reaction mixture was extracted with water and 10% MeOH/CH2Cl2. The organic
layer was dried over Na2SO4, and the crude product was chromatographed using Biotage
Flash+ and Isco Companion systems using MeOH/CH2Cl2 as eluant. The product was
partitioned between water and 10% MeOH/CH2Cl2. Organic layer was dried over Na2SO4,
and the crude product was chromatographed using Biotage Flash+ and Isco Companion
systems using MeOH/CH2Cl2 as eluant.
General Procedure for making hydrochloride salts:
59

To a suspension of the free base (3 mmol) in EtOH (15 ml) was added dropwise an
equivalent of 6N HCl. After the free base was well dissolved, the solvent was removed in
vacuo and the remaining hydrochloride salt was dried over phosphorus pentoxide.
The physical and spectral data for 20, 21, 27, 28, and 31-34 were reported in Chapter III.
4.6.4 Chemistry
N-(2,3-Methylenedioxy-6-methoxy-phenanthr-9-ylmethyl)-L-2-piperidinemethanol
hydrochloride (34-HCl)
mp 193-194 °C; 1H NMR (400.13 MHz) δ 8.14 (d, J=4Hz, 1H), 8.00 (s, 1H), 7.78 (d, J=2Hz,
1H), 7.49 (s, 1H), 7.20 (dd, J=4Hz, 2Hz, 1H), 7.15 (s, 1H), 6.04 (s, 2H), 4.20 (s, 2H), 3.90 (s,
3H), 3.72 (d, J=17Hz, 2H), 3.04 (m, 1H), 2.68 (m, 2H), 1.83 (m, 6H); MS (DCI/NH3) m/e:
380 (M + H)+. Anal. (C23H25O4N·1.0HCl·2.0H2O) C, H, N,
N-(2,3-Methylenedioxy-6-methoxy-phenanthr-9-ylmethyl)-D-proline (43)
General procedures d, e & f from V (81%); white powder; p 152-153 °C; 1H NMR (400.13
MHz) δ 8.21 (d, J=4Hz, 1H), 7.77 (s, 1H), 7.72 (d, J=2Hz, 1H), 7.56 (s, 1H), 7.23 (dd,
J=4Hz, 2Hz, 1H), 7.10 (s, 1H), 6.04 (s, 2H), 4.05 (s, 2H), 3.96 (s, 3H), 3.16 (m, 1H), 2.36 (m,
2H), 2.14 (m, 2H), 1.81 (m, 2H); MS (DCI/NH3) m/e: 380 (M + H)+.
N-(2,3-Methylenedioxy-6-methoxy-phenanthr-9-ylmethyl)-D-prolinol (44)
General procedure g from 43 (95%); yellow syrup, recrystalization from EtOH gave white
powder; mp 130-132 °C; 1H NMR (400.13 MHz) δ 8.16 (d, J=4Hz, 1H), 7.88(s, 1H), 7.80 (d,
J=2Hz, 1H), 7.46 (s, 1H), 7.23 (dd, J=4Hz, 2Hz, 1H), 7.14 (s, 1H), 6.07 (s, 2H), 4.03 (s, 2H),
3.94 (s, 3H), 3.70 (d, J= 17Hz, 2H), 3.16 (m, 1H), 2.38 (m, 2H), 2.23 (m, 2H), 1.95 (m, 2H);
MS (DCI/NH3) m/e: 366 (M + H)+.
60

N-(2,3-Methylenedioxy-6-methoxy-phenanthr-9-ylmethyl)-6-aminohexanoic acid (45)
General procedures d, e & f from V (78%); white powder; mp 167-169 °C; 1H NMR (400.13
MHz) δ 7.88 (d, J=4Hz, 1H), 7.76 (s, 1H), 7.71 (d, J=2Hz, 1H), 7.44 (s, 1H), 7.13 (dd,
J=4Hz, 2Hz, 1H), 7.05 (s, 1H), 5.99 (s, 2H), 3.87 (s, 2H), 3.82 (s, 3H), 2.75 (m, 2H), 2.23 (t,
J=6Hz, 2H), 1.53 (m, 2H), 1.44 (m, 2H), 1.28 (m, 2H); MS (DCI/NH3) m/e: 396 (M + H)+.
N-(2,3-Methylenedioxy-6-methoxy-phenanthr-9-ylmethyl)-6-aminohexanol (46)
General procedure g from 45 (90%); light green syrup, recrystalization from EtOH gave pale
green powder; mp 145-147 °C; 1H NMR (400.13 MHz) δ 7.90 (d, J =4Hz, 1H), 7.84 (s, 1H),
7.78 (d, J=2Hz, 1H), 7.51 (s, 1H), 7.21 (dd, J=4Hz, 2Hz, 1H), 7.14 (s, 1H), 6.03 (s, 2H), 4.34
(s, 2H), 3.94 (s, 3H), 3.48 (t, J=6Hz, 2H), 2.76 (m, 2H), 1.58 (m, 2H), 1.45 (m, 2H, 1.26 (m,
2H), 1.20(m, 2H); MS (DCI/NH3) m/e: 382 (M + H)+.
N-(2,3-Methylenedioxy-6-methoxy-phenanthr-9-ylmethyl)-6-aminohexanol
hydrochloride (46-HCl)
White powder; mp 187-188°C; 1H NMR (400.13 MHz) δ δ 8.14 (d, J=4Hz, 1H), 7.82 (s, 1H),
7.76 (d, J=2Hz, 1H), 7.50 (s, 1H), 7.18 (dd, J=4Hz, 2Hz, 1H), 7.13 (s, 1H), 6.08 (s, 2H), 4.67
(s, 2H), 3.98 (s, 3H), 3.60 (t, J=6Hz, 2H), 3.44 (m, 2H), 1.66(m, 2H), 1.59 (m, 2H), 1.40 (m,
2H), 1.33 (m, 2H), ; MS (DCI/NH3) m/e: 382 (M + H)+. Anal. (C23H27O4N·1.0HCl·1.5H2O)
C, H, N.
N-(2,3-Methylenedioxy-6-methoxy-phenanthr-9-ylmethyl)-L-4-piperidinecarboxylic
acid (47)
General procedures d, e & f from V (85%); light yellow powder; mp 238-240 °C; 1H NMR
(400.13 MHz) δ 8.30 (d, J=4Hz, 1H), 7.92 (s, 1H), 7.83 (d, J=1Hz, 1H), 7.42 (s, 1H), 7.22
61

(dd, J=4Hz, 2,4Hz, 1H), 7.17 (s, 1H), 6.09 (s, 2H), 4.04 (s, 2H), 3.66 (s, 3H), 2.98 (m, 1H),
2.58 (m, 4H), 1.75 (m, 4H); MS (DCI/NH3) m/e: 394 (M + H)+.
N-(2,3-Methylenedioxy-6-methoxy-phenanthr-9-ylmethyl)-L-4-piperidinemethanol (48)
General procedure g from 47 (92%); light green syrup, recrystallization from EtOH gave
white powder; mp 130-132 °C; 1H NMR (400.13 MHz) δ 8.26 (d, J=4Hz, 1H), 7.87 (s, 1H),
7.78 (d, J=2Hz, 1H), 7.38 (s, 1H), 7.19 (dd, J=4Hz, 2Hz, 1H), 7.14 (s, 1H), 6.05 (s, 2H), 3.97
(s, 3H), 3.81(s, 2H), 3.43 (d, J=7Hz, 2H), 2.97 (m, 2H), 2.02 (m, 2H), 1.65 (m, 2H), 1.48 (m,
1H), 1.26 (m, 2H); MS (DCI/NH3) m/e: 380 (M + H)+.
N-(2,3-Methylenedioxy-6-methoxy-phenanthr-9-ylmethyl)-L-4-piperidinemethanol
hydrochloride (48-HCl)
White powder; mp 256-258 °C; 1H NMR (400.13 MHz) δ 8.00 (d, J=4Hz, 1H), 7.85 (s, 1H),
7.82 (s, 1H), 7.77 (d, J=2Hz, 1H), 7.22 (dd, J=4Hz, 2Hz, 1H), 7.20 (s, 1H), 6.03 (d, J=4Hz,
2H), 4.59 (s, 2H), 3.92 (s, 3H), 3.46 (d, J=4Hz, 2H), 3.31 (m, 2H), 2.77 (m, 2H), 1.76 (m,
4H), 1.68 (m, 1H); MS (DCI/NH3) m/e:380 (M + H)+. Anal. (C23H25O4N·1.0HCl·1.0H2O) C,
H, N.
N-(2,3-Methylenedioxy-6-methoxy-phenanthr-9-ylmethyl)-11-aminoundecanoic acid
(49)
General procedures d, e & f from V (75%); white powder; mp 146-148 °C; 1H NMR (400.13
MHz) δ 7.98 (d, J=4Hz, 1H), 7.80 (s, 1H), 7.72 (d, J=2Hz, 1H), 7.50 (s, 1H), 7.11 (dd,
J=4Hz, 2Hz, 1H), 7.06 (s, 1H), 6.05 (s, 2H), 4.02 (s, 3H), 3.86 (s, 2H), 2.93 (m, 2H), 2.2 (m,
2H), 1.67 (m, 2H), 1.53 (m, 2H), 1.21 (m, 12H); MS (DCI/NH3) m/e: 466 (M + H)+.
N-(2,3-Methylenedioxy-6-methoxy-phenanthr-9-ylmethyl)-6-aminoundecanol (50)
62

General procedure g from 49 (90%); light green syrup, recrystalization from EtOH gave pale
green powder; mp 122-124 °C; 1H NMR (400.13 MHz) δ 7.86 (d, J=4Hz, 1H), 7.67 (s, 1H),
7.40 (d, J=2Hz, 1H), 7.43 (s, 1H), 7.18 (dd, J=4Hz, 2Hz, 1H), 7.08 (s, 1H), 6.01 (s, 2H), 4.32
(s, 2H), 3.88 (s, 3H), 3.68 (t, J=6Hz, 2H), 2.86 (m, 2H), 1.68 (m, 2H), 1.58 (m, 2H), 1.26 (m,
14H); MS (DCI/NH3) m/e: 452 (M + H)+.
N-(2,3-Methylenedioxy-6-methoxy-phenanthr-9-ylmethyl)-(2-chlorophenyl)-piperazine
(51)
General procedures d & e from V (87%); white powder; mp 196-198 °C; 1H NMR (400.13
MHz) δ 8.32 (d, J=4Hz, 1H), 7.91 (s, 1H), 7.81 (d, J=2Hz, 1H), 7.44 (s, 1H), 7.32 (dd,
J=4Hz, 2 Hz, 1H), 7.22 (d, J=9Hz, 1H), 7.18 (s, 1H), 7.16 (d, J=9Hz, 1H), 7.00 (m, 1H), 6.93
(m, 1H), 6.08 (s, 2H), 4.30 (s, 2H), 3.94 (s, 3H), 3.68 (t, J=6Hz, 4H), 3.05 (m, 4H); MS
(DCI/NH3) m/e: 461.5 (M + H)+.
N-(2,3-Methylenedioxy-6-methoxy-phenanthr-9-ylmethyl)-(4-chlorophenyl)-piperazine
(52)
General procedures d & e from V (80%); white powder; mp 222-223 °C; 1H NMR (400.13
MHz) δ 8.30 (d, J=4Hz, 1H), 7.90 (s, 1H), 7.81 (d, J=2Hz, 1H), 7.50 (s, 1H), 7.22 (dd,
J=4Hz, 2Hz, 1H), 7.19 (s, 1H), 7.17 (d, J=9Hz, 2H), 6.89 (d, J=9Hz, 2H), 6.09 (s, 2H), 4.68
(s, 2H), 3.90 (s, 3H), 3.65 (t, J=8Hz, 4H), 3.14 (m, 4H); MS (DCI/NH3) m/e: 461.5 (M + H)+.
N-(2,3-Methylenedioxy-6-methoxy-phenanthr-9-ylmethyl)-(4-hydroxyphenyl)-
piperazine (53)
General procedures d & e from V (82%); white powder; mp 225-227 °C; 1H NMR (400.13
MHz) δ 8.10 (d, J=4Hz, 1H), 7.90 (s, 1H), 7.82 (d, J= 2Hz, 1H), 7.49 (s, 1H), 7.22 (dd,
63

J=4Hz, 2Hz, 1H), 7.14 (s, 1H), 6.76 (d, J=9Hz, 2H), 6.61 (d, J=9Hz, 2H), 6.12 (s, 2H), 4.43
(s, 2H), 3.85 (s, 3H), 3.21 (t, J=8Hz, 4H), 2.83 (m, 4H); MS (DCI/NH3) m/e: 443 (M + H)+.
N-(2,3-Methylenedioxy-6-methoxy-phenanthr-9-ylmethyl)-N-(2-hydroxyethyl)-
piperazine (54)
General procedures d & e from V (86%); white powder; mp 142-144 °C; 1H NMR (400.13
MHz) δ 8.18 (d, J=4Hz, 1H), 7.85 (s, 1H), 7.76 (d, J=2Hz, 1H), 7.32(s, 1H), 7.16 (dd, J=4Hz,
2Hz, 1H), 7.10 (s, 1H), 6.05 (s, 2H), 3.96 (s, 3H), 3.82 (s,2H), 3.70 (t, J=6Hz, 2H), 2.70 (m,
8H), 2.61 (m, 2H); MS (DCI/NH3) m/e: 395 (M + H)+.
N-(2,3-Methylenedioxy-6-methoxy-phenanthr-9-ylmethyl)-(2-hydroxyethylethoxy)-
piperazine (55)
General procedures d & e from V (78%); white powder; mp 145-147 °C; 1H NMR (400.13
MHz) δ 8.10 (d, J=4Hz, 1H), 7.80 (s, 1H), 7.75 (d, J=2Hz, 1H), 7.46(s, 1H), 7.14 (dd, J=4Hz,
2Hz, 1H), 7.09 (s, 1H), 6.05 (s, 2H), 3.96 (s, 3H), 3.89 (s,2H), 3.79 (t, J=6Hz, 2H), 3.61 (t,
J=6Hz, 2H), 3.49 (t, J=6Hz, 2H), 3.12 (m, 8H), 2.87 (m, 2H); MS (DCI/NH3) m/e: 439 (M +
H)+.
N-(2,3-Methylenedioxy-6-methoxy-phenanthr-9-ylmethyl)-4-piperidineethanol (56)
General procedures d & e from V (88%); white powder; mp 148-149 °C; 1H NMR (400.13
MHz) δ 8.08 (d, J=4Hz, 1H), 7.90 (s, 1H), 7.81 (d, J=2Hz, 1H), 7.45 (s, 1H), 7.22 (dd,
J=4Hz, 2Hz, 1H), 7.17 (s, 1H), 6.09 (s, 2H), 4.14 (s, 2H), 3.98 (s, 3H), 3.52 (t, J=6Hz, 2H),
3.00 (m, 2H), 2.58 (m, 2H), 1.65 (m, 4H), 1.55 (m, 1H), 1.43 (m, 2H); MS (DCI/NH3) m/e:
394 (M + H)+.
64

N-(2,3-Methylenedioxy-6-methoxy-phenanthr-9-ylmethyl)-4-piperidineethanol
hydrochloride (56-HCl)
White powder; mp 153-155 °C; 1H NMR (400.13 MHz) δ δ 8.07 (d, J=4Hz, 1H), 7.94 (s,
1H), 7.83 (d, J=2Hz, 1H), 7.50 (s, 1H), 7.22 (dd, J= 4Hz, 2Hz, 1H), 7.15 (s, 1H), 6.10 (s, 2H),
4.56 (s,2H), 3.98 (s, 3H), 3.56 (t, J=6Hz, 2H), 3.44 (m, 2H), 2.84 (m, 2H), 1.85 (m, 4H), 1.73
(m, 1H), 1.45 (m, 2H); MS (DCI/NH3) m/e: 394 (M + H)+. Anal.
(C24H27O4N·1.0HCl·2.0H2O) C, H, N,
N-(2,3-Methylenedioxy-6-benzyloxy-phenanthr-9-ylmethyl)-L-4-piperidinecarboxylic
acid (57)
Similar procedure as 47 (77% for d, e & f); white powder; mp 183-185 °C; 1H NMR (400.13
MHz) δ 8.05 (d, J=4Hz, 1H), 7.89 (d, J=2Hz, 1H), 7.81 (s, 1H), 7.52 (d, J=4Hz , 2H), 7.43 (s,
1H), 7.40 (t, J=4Hz, 2H), 7.33 (m, 1H), 7.26 (dd, J=4Hz, 2Hz, 1H), 7.15 (s, 1H), 6.08 (s, 2H),
5.26 (s, 2H), 3.92 (s, 2H), 2.89 (m, 1H), 2.36 (m, 4H), 1.83 (m, 4H); MS (DCI/NH3) m/e: 470
(M + H)+.
N-(2,3-Methylenedioxy-6-benzyloxy-phenanthr-9-ylmethyl)-L-4-piperidinemethanol
(58)
General procedure g from 57 (93%); white powder; mp 120-122 °C; 1H NMR (400.13 MHz)
δ 8.25 (d, J=4Hz, 1H), 7.89 (d, J=2Hz, 1H), 7.84 (s, 1H), 7.51 (d, J=4Hz, 2H), 7.44 (t, J=4Hz,
2H), 7.33 (m, 1H), 7.26 (dd, J=4Hz, 2Hz, 1H), 7.15 (s, 1H), 6.07 (s, 2H), 5.28 (s, 2H), 3.95
(s, 2H), 3.47 (d, J=3Hz, 2H), 2.12 (m, 4H), 1.69 (m, 1H), 1.48 (m, 4H); MS (DCI/NH3) m/e:
456 (M + H)+.
65

4.6.5 Cell Growth Inhibition Assay
The sulforhodamine B assay was used according to the procedures developed and validated
at NCI.6 The in vitro anticancer activities are expressed as EC50 values, which is the test
compound concentration (µM) that reduced the cell number by 50% after 72-h of continuous
treatment. The values were interpolated from dose-response data. Each test was performed
in triplicate with variation less than 5%. The ED50 values determined in each of independent
tests varied less than 10%. Compound stock solutions were prepared in DMSO with the final
solvent concentration ≤1% DMSO (v/v), a concentration without effect on cell replication.
The cells were cultured at 37 °C in RPMI-1640 supplemented with 25 mM N-2-
hydroxyethylpiperazine-N'-2-ethanesulfonic acid (HEPES), 2% (w/v) sodium bicarbonate,
10% (v/v) fetal bovine serum, and 100 µg/mL kanamycin in a humidified atmosphere
containing 5% CO2.
66

Table 4-1. Cytotoxicity of 6-Methoxy-9-Substituted PTBs.
OO
MeO
23
6
9R
Compound R EC50 (µM)
A549
27* -NH(CH2)4COOH 1.3
28* -NH(CH2)4CH2OH 0.27
31* N
HOOC
2.1
32* N
HOH2C
0.7
33* N
HOOC
0.5
34* N
HOH2C
0.16
43 N
HOOC
5.2
44 N
HOH2C
1.1
45 -NH(CH2)5COOH 0.8
46 -NH(CH2)5CH2OH 0.2
67

47 N COOH
0.23
48 N CH2OH
0.08
49 -NH(CH2)10COOH 3.2
50 -NH(CH2)10CH2OH 2.6
51 N N
Cl
NA
52 N N Cl
65.2
53 N N OH
0.22
54 N NOH
0.63
55 N NO
OH
57.1
56 NOH
0.15
Emetine 0.04
Doxorubicin 0.18
Etoposide(VP-16) 1.4
Antofine 0.008
Vincristine 0.04
* From Chapter III.
68

Table 4-2. Cytotoxicity of 6-Benzyloxy-9-Substituted PBTs.
OO
C6H5H2CO
23
6
9R
Compound R EC50 (µM)
A549
20* N
HOOC
3.2
21* N
HOH2C
1.3
57 N COOH
2.1
58 N CH2OH
0.7
* From Chapter III.
69
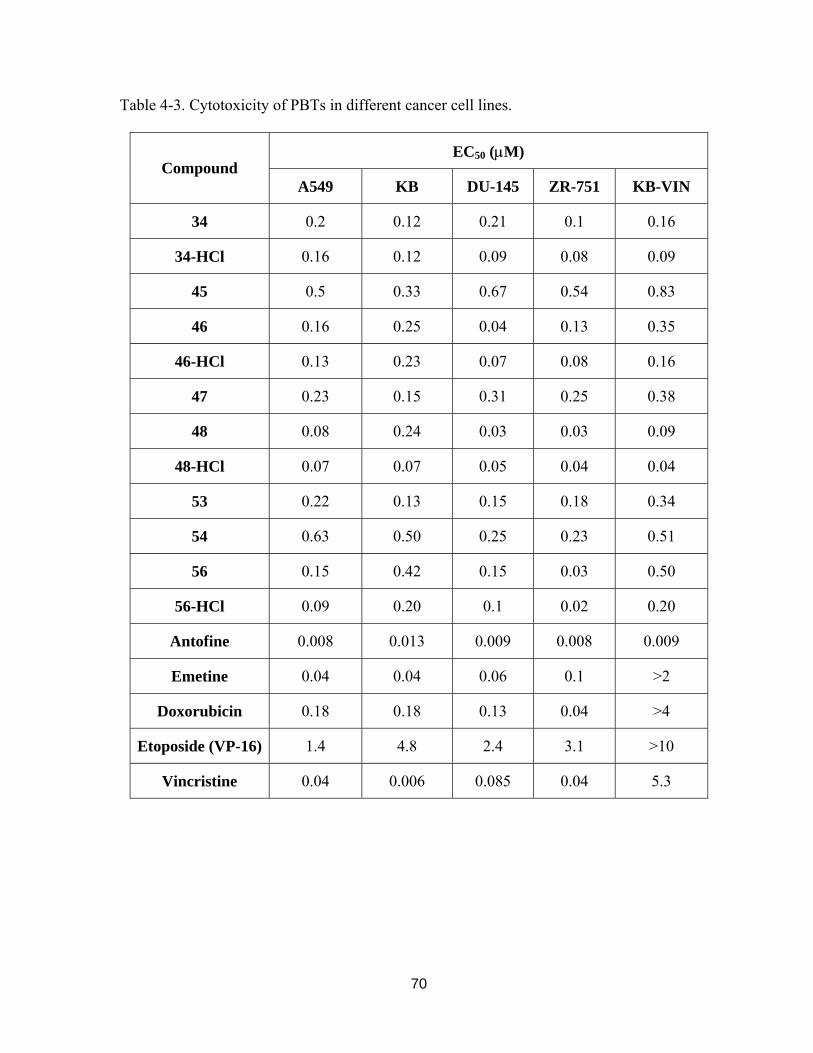
Table 4-3. Cytotoxicity of PBTs in different cancer cell lines.
EC50 (µM) Compound
A549 KB DU-145 ZR-751 KB-VIN
34 0.2 0.12 0.21 0.1 0.16
34-HCl 0.16 0.12 0.09 0.08 0.09
45 0.5 0.33 0.67 0.54 0.83
46 0.16 0.25 0.04 0.13 0.35
46-HCl 0.13 0.23 0.07 0.08 0.16
47 0.23 0.15 0.31 0.25 0.38
48 0.08 0.24 0.03 0.03 0.09
48-HCl 0.07 0.07 0.05 0.04 0.04
53 0.22 0.13 0.15 0.18 0.34
54 0.63 0.50 0.25 0.23 0.51
56 0.15 0.42 0.15 0.03 0.50
56-HCl 0.09 0.20 0.1 0.02 0.20
Antofine 0.008 0.013 0.009 0.008 0.009
Emetine 0.04 0.04 0.06 0.1 >2
Doxorubicin 0.18 0.18 0.13 0.04 >4
Etoposide (VP-16) 1.4 4.8 2.4 3.1 >10
Vincristine 0.04 0.006 0.085 0.04 5.3
70

4.7 REFERENCES
1) Wassmundt, F. W.; Kiesman, W. F. Soluble catalysts for improved Pschorr cyclizations. J Org. Chem. 1995, 60, 196-201.
2) Lebrun, S.; Couture, A.; Deniau, E.; Grandclaudon, P. Total syntheses of (±)-cryptopleurine, (±)-antofine and (±)-deoxypergularinine. Tetrahedron 1999, 55, 2659-2670.
3) Rubinstein, L. V.; Shoemaker, R. H.; Paull, K. D.; Simon, R. M.; Tosini, S.; Skehan, P.; Scudiero, D. A.; Monks, M. R. Comparison of in vitro anticancer-drug-screening data generated with a tetrazolium assay versus a protein assay against a diverse panel of human tumor cell lines. J. Natl. Cancer Inst. 1990, 82, 1113-1118.
4) Abe, F.; Hirokawa, M.; Yamauchi, T.; Honda, K.; Hayashi, N.; Ishii, M.; Imagawa, S.; Iwahana, M. Further investigation of phenanthroindolizidine alkaloids from Tylophora tanakae. Chem. Pharm. Bull. 1998, 46, 767-769.
5) Wu, P. L.; Rao K. V.; Su, C.-H.; Kuoh, C.-S.; Wu, T.-S. Phenanthroindolizidine alkaloids and their cytotoxicity from the leaves of Ficus septica. Heterocycles 2002, 57, 2401-2408.
6) Rubinstein, L. V.; Shoemaker, R. H.; Paull, K. D.; Simon, R. M.; Tosini, S.; Skehan, P.; Scudiero, D. A.; Monks, M. R. Comparison of in vitro anticancer-drug-screening data generated with a tetrazolium assay versus a protein assay against a diverse panel of human tumor cell lines. J. Natl. Cancer Inst. 1990, 82, 1113-1118.
71

5 CHAPTER V. QUANTITATIVE STRUCTURE-ACTIVITY RELATIONSHIP ANALYSIS OF PHENANTHRINE-BASED
TYLOPHORINE DERIVATIVES (PBTS) USING K-NEAREST NEIGHBOR AND DATABASE MINING
5.1 INTRODUCTION
In Chapters III and IV, we described a novel series of polar water-soluble phenanthrene-
based tylophorine derivatives (PBTs) with EC50 ≅10-7 M against the A549 human lung cancer
cell line. These compounds could possibly have lower or no CNS toxicity because the
increased polarity should prevent them from penetrating the blood-brain barrier. The target(s)
of PBTs function has not been identified; however, several structure-activity trends have
been observed: 1) A planar phenanthrene system is required, but not sufficient for cytotoxic
activity. 2) A N-hydrophilic substituent at the C-9 position is essential for the enhanced
cytotoxicity and should be linked through a methylene rather than a carbonyl group. 3) This
C-9 N-hydrophilic substituent is ideal for the introduction of a polar moiety. Analogs
containing terminal carboxylic acid or hydroxymethyl groups are more favorable than those
with methyl esters. 4) On the phenanthrene skeleton, a methoxy substituent best fits both the
steric and electronic requirements at the C-6 position and is preferred over benzyloxy and
hydroxy groups. 5) Adding a methylenedioxy ring at the 2, 3 position of the planar
phenanthrene system can dramatically enhance the cytotoxic activity and led to the most
potent derivatives. The new PBT derivatives possess a novel structure and showed
remarkable EC50 values in the sub-micromolar range, comparable those of with front-line

antineoplastic drugs, suggesting that this new compound class is of great potential to be
developed into antitumor drugs. Useful and powerful quantitative structure-activity
relationship (SAR) would greatly facilitate such further development.
Many different QSAR approaches, including both two-dimensional (2D) and three-
dimensional (3D) methods, have been developed during the past few decades.1-9 The major
differences among these methods can be analyzed from two viewpoints: (i) structural
parameters (descriptors) that are used to characterize molecules; (ii) the mathematical
approach used to establish a correlation between biological activity and descriptor values. In
recent years, we have been motivated to explore possible alternatives that would use
alignment-free descriptors derived from 2D molecular topology, which can alleviate the
frequent ambiguity of structural alignment typical for 3D QSAR methods. Consequently, our
molecular modeling laboratory has developed a variable selection approach, k nearest
neighbor (kNN) QSAR10, which employs topological descriptors of chemical structures.
Variable selection techniques choose the most informative variables and eliminate irrelevant
variables to improve the signal-to-noise ratio in the resulting models. Additionally, these
techniques are not computationally intensive and are practically automated. The validated
2D_kNN models with high predictive power can be easily adapted to conduct a database
search or virtual screening.11 This strategy was recently applied successfully to the discovery
of novel anticonvulsant agents12-13 and D1 dopaminergic antagonists.14
In this chapter, we discuss the application of a kNN method on an experimental dataset
including 52 PBTs with known EC50 values (Tables 5-1, 5-2, and 5-3). Their structures were
characterized with MolConnZ15 (MZ) descriptors. The models developed herein have been
extensively validated using several criteria of robustness and accuracy.16 The robustness of
73

the models was evaluated from the values of the internal leave-one-out cross-validated R2
(q2) for the training sets and external R2 (predictive R2) for the test sets, as well as other
criteria. The developed models with high predictive power were adapted to mining the
publicly available commercial ChemDiv17 database, and resulted in 34 consensus hits with
moderate to high activities. Ten structurally diverse hits were experimentally tested and
eight compounds were confirmed active, with the most potent compound having an EC50
value of 1.8 µM. The predictive power of the models was further confirmed by the high
correlation coefficient between the predicted and actual cytotoxic activity for an external set
including four new PBTs and the eight active ChemDiv hits, which not included in the
original 52 PBTs dataset. The correlation coefficient (R2) was as high as 0.52. This result
demonstrated a successful application of modern QSAR to traditional medicinal chemistry
research.
5.2 DATASET AND BIOLOGICAL ACTIVITY
All PBTs used in this study were synthesized and evaluated (Tables 5-1, 5-2, 5-3) as
described in Chapters III and IV. The general synthetic procedures and the biological,
physical and spectral data were reported therein. The identified hits via database mining hits
were purchased from Chem.Div, Inc with physical and spectral data. The human A549 lung
cancer cell line was used for the cytotoxicity screening of PBTs and ChemDiv consensus hits
using the cell-based sulforhodamine B (SRB) microtitre plate assay18,which has been
reported in detail elsewhere.
74

5.3 COMPUTATIONAL METHODS
5.3.1 Generation of Molecular Descriptors
All chemical structures were generated using SYBYL 7.0.19 Molecular descriptors20
were calculated for each compound with the MolConnZ (MZ) software version 4.05.15
Overall, MolConnZ produces over 400 descriptors. In our study, only 244 chemically
relevant descriptors were used after removing those with zero values or zero variance prior to
model generation. MZ descriptors were range-scaled prior to distance calculations because
the absolute scales for MZ descriptors can differ by orders of magnitude. Using range
scaling could avoid disproportional weightings upon distance calculations in
multidimensional MZ descriptor space.
5.3.2 Dataset Division into Training and Test Sets
It is generally accepted that the internal validation of the QSAR models built for the training
set is sufficient to establish their predictive power.21-30 However, our previous studies as well
as those conducted by other groups have demonstrated that no correlation exists between
leave-one-out (LOO) cross-validated R2 (q2) for the training set and the correlation
coefficient R2 between the predicted and observed activities for the test set.16,31 We have
developed a rational approach to dividing the dataset into multiple training and test sets for
internal and external validations.32
The dataset of 52 compounds was divided into multiple chemically diverse training and test
sets with the algorithm based on Sphere Exclusion (SE) developed in our group.32 SE is a
general procedure that is typically applied to databases of organic molecules characterized by
75

multiple descriptors of their chemical structure such that each compound is represented as a
point (or vector) in multidimensional descriptor space. The goal of the SE method is to
divide a dataset (i.e., a collection of points in multidimensional chemometric space) into two
subsets (training and test set) using a diversity sampling procedure as follows. SE starts with
the calculation of the distance matrix D between representative points in the descriptor space.
Let Dmin and Dmax be the minimum and maximum elements of D, respectively. N probe
sphere radii are defined by the following formulas. Rmin=R1=Dmin, Rmax=RN=Dmax/4,
Ri=R1+(i-1)*(RN-R1)/(N-1), where i=2,…,N-1. Each probe sphere radius corresponds to
one division into the training and test set.
In this study, each compound was characterized with multiple MolConnZ descriptors.
The entire dataset was then treated as a collection of points (each corresponding to an
individual compound) in the MolConnZ descriptor space. Thus, the SE algorithm used in
this study consisted of the following steps. (i) Select randomly a point in the MolConnZ
descriptor space. (ii) Include it in the training set. (iii) Construct a probe sphere around this
point. (iv) Select points from this sphere and include them alternatively into test and training
sets. (v) Exclude all points within this sphere from further consideration. (vi) If no more
compounds left, stop. Otherwise let m be the number of probe spheres constructed and n be
the number of remaining points. Let dij (i=1,…,m; j=1,…,n) be the distances between the
remaining points and probe sphere centers. Select a point corresponding to the lowest dij
value and go to step (ii). The training sets were used to build models and the test sets were
used for validation.
76
5.3.3 kNN QSAR Method
Our kNN QSAR method10 employs the kNN pattern recognition principle33 and a
variable selection procedure. Briefly, a subset of nvar (number of selected variables)
descriptors between 1 and the total number of the original descriptors is selected randomly as
a hypothetical descriptor pharmacophore (HDP). The model is built using this random
descriptor selection with leave-one-out (LOO) cross-validation, where each compound is
eliminated from the training set and its biological activity is predicted as the average activity
of k most similar molecules (k = 1-5). The value k is optimized during the model building
process to give the best prediction of the training set. The similarity is characterized by the
Euclidean distance between compounds in multidimensional descriptor space. A method of
simulated annealing with the Metropolis-like acceptance criterion is used to sample the entire
descriptor space to converge on the subset of the same size that affords the highest value of
LOO R2 (q2). The descriptor subsets of different sizes are optimized using this procedure to
arrive at a variety of models with acceptable q2 greater than a certain threshold (we chose 0.6
as the default threshold). The training set models with acceptable q2 are then validated on
external test sets to select predictive models as discussed above. Further details of the kNN
method implementation, including the description of the simulated annealing procedure used
for stochastic sampling of the descriptor space, are given elsewhere.10
The original kNN method10 was enhanced in this study by using weighted molecular
similarity. Estimated activities ŷi of compounds excluded by LOO procedure are calculated
using the following formulas.
77

,ˆ
1
1
∑
∑
=
== k
jij
k
jijj
i
w
way (1)
where weights wij are defined as
⎟⎟⎟⎟⎟
⎠
⎞
⎜⎜⎜⎜⎜
⎝
⎛
−=
∑=
k
jij
ijij
d
dw
1''
1 , (2)
and dij are the distances between compound i and its k nearest neighbors. After each run,
cross-validated R2 (q2) is calculated.
∑∑
−
−−= 2
22
)()ˆ(
1yyyy
qi
ii , (3)
where yi, and y are the actual and average values of activity. The summation in (3) is
performed over all compounds.
In summary, the kNN QSAR algorithm generates both an optimum k value and an
optimal nvar subset of descriptors, which afford a QSAR model with the highest value of q2.
Figure 5-1 shows the overall flowchart of the current implementation of the kNN method.
78

Training set with original descriptors and activity
Randomly select a subset of descriptors (a hypothetical descriptor pharmacophore)
Leave out a compound
Find k nearest neighbors in the training set
Predict the activity of the eliminated compound as the weighted average affinity of its k nearest neighbors.
Calculate the cross-validated q2 of the model
N tim
es
Simulate A
nnealing
Select acceptable models with q2 > 0.6
Figure 5-1. Flowchart of the kNN method.
5.3.4 Robustness and predictive power of QSAR Models (Y-Randomization Test)
The robustness of the models was examined by comparing them to those obtained when
using randomized activity of the training set (this procedure is commonly referred to as the
Y-randomization test). Briefly, we repeated the QSAR calculations with the randomized
activities of the training sets. We also compared the q2 values in the process of the iteration
procedure of the simulating annealing for actual and random activities of training sets to see
if there was any significant difference. This randomization was repeated five times for each
splitting. This technique is widely used to ensure the robustness of a QSAR model.34 It is
79

expected that the resulting QSAR models should generally have low training set fitness q2
and low test set R2. It is likely that sometimes, though infrequently, high training set
statistics may be obtained due to a chance correlation or structural redundancy of the training
set.35 If all QSAR models obtained in the Y-randomization test exhibit relatively high
training set statistics and test set R2 values, it implies that an acceptable QSAR model cannot
be obtained for the given dataset by the current modeling method. This test was applied to
all data splits considered in this study.
To estimate the predictive power of a QSAR model, the following criteria were used:16
(i) correlation coefficient R between the predicted and observed activities; (ii) coefficients of
determination (predicted versus observed activities , and observed versus predicted
activities ); (iii) slopes k and k' of regression lines (predicted versus observed activities,
and observed versus predicted activities) through the origin. We conclude that a QSAR
model has an acceptable predictive power if the following conditions are satisfied:
20R
20'R
16
q2>0.5; (4)
R2>0.6; (5)
0.1)'(
or 1.0)(
2
20
2
2
20
2
<−
<−
RRR
RRR
; (6)
15.185.0 ≤≤ k or 15.1'85.0 ≤≤ k . (7)
Earlier, we suggested16 that preferably both values of and must satisfy condition
(6). This condition appears to be too strong; thus, herein we employed a less stringent
condition: we have required that the difference between and should not be too high as
follows:
20R 2
0'R
20R 2
0'R
0.3. |'| 20
20 <− RR (8)
80

5.3.5 Applicability Domain of kNN QSAR Models.
Formally, a QSAR model can predict the target property for any compound for which
chemical descriptors can be calculated. Since the training set models are developed in the
kNN QSAR approach by interpolating activities of the nearest neighbor compounds,10 a
special applicability domain (i.e., similarity threshold) should be introduced to avoid making
predictions for compounds that differ substantially from the training set molecules.35
To measure similarity, each compound is represented by a point in the M-dimensional
descriptor space (where M is the total number of descriptors in the descriptor pharmacophore)
with the coordinates Xi1, Xi2, ..., XiM, where Xis are the values of individual descriptors. The
molecular similarity between any two molecules is characterized by the Euclidean distance
between their representative points. Compounds with the smallest distance between one
another are considered to have the highest similarity. The distances (similarity) of
compounds in our training set are compiled to produce an applicability domain threshold, DT,
calculated as follows:
D=<d>+Zσ (9)
where <d> is the average of Euclidean distances between k nearest neighbors of all points of
the training set used in model derivation, σ is the standard deviation of these distances, and Z
is the empirical parameter to control the significance level.
Based on successful results from previous studies, we set the default value of this
parameter to 0.5, which formally places the boundary for which compounds will be predicted
at one-half of the standard deviation (assuming a Boltzmann distribution of distances
between k nearest neighbor compounds in the training set). Thus, if the distance of the
81

external compound from at least one of its nearest neighbors in the training set exceeds this
threshold, the prediction is considered unreliable.
5.3.6 Database Mining
A commercially available chemical database, Chemical Diversity (ChemDiv17), which is
a small compound collection database containing ca. 500,000 compounds, was screened. MZ
descriptors were generated for each compound in the database and linearly normalized based
on the maximum and minimum values of each descriptor in the training set.14
The ten best kNN models were then used to predict activity for the database compounds
that were within the applicability domain for that model. The results for each individual
prediction exercise were then combined, and the mean predicted activity was calculated for
each compound that was within the applicability domain of multiple models. The percentage
of models that predicted each compound in the database and the standard deviation of those
predictions were also recorded for each compound. We hypothesized that the higher the
percentage of models with a stringent applicability domain that predict a compound's activity,
the more likely the compound actually possesses the predicted activity. This postulate may
also apply to the standard deviation of the predictions made for a single compound. The
smaller the prediction variance across all models, the more confidence we have that the
predicted biological activity for that compound is accurate. For these reasons, we selected a
subset of compounds as hits that were predicted by at least 50% of the models and exhibited
a small standard deviation across all models. We also performed an additional estimate as to
whether the hits resulting from database mining using variable selection models possessed
the features essential (i.e., common) for all PBTs. This additional precaution was considered
82

essential because variable selection procedure by default eliminates features (descriptors) that
have the same values for all modeled compounds.
5.4 RESULTS AND DISCUSSION
5.4.1 QSAR models and Their Robustness
In the kNN QSAR method, nvar can be set to any value that is less than the total number
of descriptors. Since the optimal number for nvar is not known a priori, multiple models
must be generated to examine the relationship between q2 and nvar. As previously discussed,
the robustness of a QSAR model should be established by comparing results for the actual
data set with those for data sets with randomized activity values. Thus, 10, 20, 30, 40 and 50
descriptor models were generated. Figure 5-2 shows a plot of q2 vs nvar for the actual and
random data sets obtained with kNN calculations. Every q2 value is the average of 10
independent computations. Overall, we obtained consistently much higher q2 values for the
actual data set compared to those from Y-randomization. The q2 values for the real data set
were in the range 0.60 to 0.70 compared to -0.10 to 0.10 for the random data sets.
83

.
-0.1
0
0.1
0.2
0.3
0.4
0.5
0.6
0.7
0 10 20 30 40 50 60
Number of Descriptors
q2
Figure 5-2. Plots of q2 versus the number of descriptors selected for the best kNN QSAR models for 52 PBTs. The results for both actual and random (with shuffled activity values) data sets are shown. Every q2 value is the average of 10 independent calculations. Circles represent the actual data set, and triangles represent the random data set.
5.4.2 kNN QSAR Model Validation
Generally, we accept models with q2 values for the training set greater than 0.5 and R2
values for predicted vs actual activities of the test set compounds greater than 0.6.16 Table 5-
4 presents the ten best models obtained from multiple kNN analyses. In order to obtain
statistical significance, the original 52-compound dataset was divided into 50 training and
test sets. Multiple variable selection models with the highest q2 values (greater than 0.5)
were collected. However, as indicated in one of our earlier studies,16 no correlation was
found between q2 and R2, also shown in Figure 5-3, demonstrating that q2 alone does not
serve as an estimate of the predictive power of kNN models. On the basis of our criteria,
acceptable models with both high statistical significance (q2 > 0.5) and predictive power (R2
> 0.6) represented only a fraction of all models with q2 > 0.5 (Figure 3). So the
84

aforementioned conditions (Equations 4–8) become very important. Based on all of these
criteria, the best models were obtained for the test sets including 14 and 18 compounds, with
the optimal number of descriptors as 15 and 20, respectively (Table 5-4). Figure 5-4 shows
actual vs. calculated activity correlations for the training and test sets with q2 = 0.59 and R2 =
0.81 respectively. Two outlying points {compound 20 and 54 antofine)] were poorly
predicted. The latter point represents antofine, a positional isomer of tylophorine isolated
from Asclepiadaceae by Dr. T. S. Wu36 in Taiwan; its structure is shown in Table 5-3. It was
used as a reference compound when we screened PBTs. A possible explanation for this
observation is that this compound lacks the chemical structure descriptors that are most
meaningful and statistically significant in terms of correlation with biological activity: a N-
hydrophilic substituent and free rotating C-9 methylene bond, which were proven to be
required for PBT analog activity in our preliminary study. Mechanism of action studies for
antofine and PBTs are still ongoing and it remains possible that they have different modes of
action. In regard to compound 20, its terminal Cl group may cause some solubility or cell
membrane transportation problem that would result in diminished activity in our cell-based
assay.
85

0.4
0.5
0.6
0.7
0.8
0.45 0.55 0.65 0.75q2
R2
Figure 5-3. R2 versus q2 for all selected models with q2>0.5. Triangles for models with R2<0.6 and open circles for models with R2>0.6
3.5
4.5
5.5
6.5
7.5
8.5
9.5
3.5 4.5 5.5 6.5 7.5 8.5 9.5
Actual
Pred
icte
d
Compd. 20
Antofine 54
Figure 5-4. Plot of Actual versus Predicted activity for one of the best 10 models. This model has 18 compounds in the test set, and correspondingly, 34 in the training set. Twenty descriptors have been selected for the calculation. q2=0.59 and R2=0.81
86

.4.3 Interpreting predictive QSAR models
ptors, a number of MolConnZ descriptors
w
5
Upon the frequency analysis of selected descri
ere identified suggesting that they played critical roles in relating chemical structures to
their antitumor activity. These descriptors include molecular connectivity descriptors such as
Chi indices, hydrogen bond counts and E-state descriptors, atom type E-state descriptors,
shape indices, etc. These results are consistent with our preliminary SAR observations, as
described in the Introduction to this chapter. Based on the MolConnZ manual and personal
communication with Dr. Lowell Hall, one of the principle MolConnZ developers, these
selected descriptors have been grouped into the following classes: 1) The high frequency of
the Chi indices, including dXvp7, dXvp10, nXp6, Xvp7, etc., suggests the importance of
those structure features such as size, branching, and cyclicity. Our previous SAR study
showed that both para-positioned functional groups and three intra-atomic distances are very
important to the antitumor activity. These features define the relative spatial dispositions of
three significant atoms: the oxygen of C-9 chain terminal, the nitrogen atom, and a methoxy
oxygen on the phenanthrene ring. 2) Hydrogen bond donors/acceptors counts and E-states
descriptors, such as nHBint9, SHBd, Hmax, Hmin, indicate the importance of polar hydrogen
atoms and hydrogen bond interactions during binding. This observation agrees with the
finding that the presence of a hydrogen bond acceptor/donor group at the C-9 chain terminus
appears essential for cytotoxic activity and analogs containing terminal carboxylic acid or
hydroxymethyl groups are more favorable than those with methyl esters. 3) The appearance
of atom type counts and E-states descriptors (SssCH2, nsssCH, and SsOH) demonstrated a
high importance of electron accessibility for those atoms. Our studies indeed found that an
87

N-hydrophilic substituent at the C-9 position is essential for enhanced cytotoxicity and
should be linked through a methylene rather than a carbonyl group. 4) Several steric
crowding related descriptors (n2Pag12 and Tm) occurred many times in our models. This
point is reflected in our finding that a methoxy substituent best fits both the steric and
electronic requirements at the C-6 position. 5) Several Kappa and complexity indices (ka1,
ka2, tets1, tets2, graphcomplexity, etc.) were found in many models, suggesting that shape
related features are important for the cytotoxicity in our PBTs. It was noted that a planar
phenanthrene system is required, although not sufficient, for the cytotoxic activity. Also
adding a methylenedioxy ring at the 2, 3 positions of the planar phenanthrene system can
dramatically enhance the cytotoxic activity and leads to the most potent derivatives. 6) Last,
not least, descriptors such as nCl and SsCl indicate the importance of a Cl atom to the
activity. Several structures with Cl (e.g., compounds 64 and 68) showed high activity (EC50
as low as 1.8 µM) when their activities were not hindered by solubility in the biological
assay.
5.4.4 Database mining with predictive QSAR models
compounds, was screened with
our
se
ChemDiv., a small compound collection of ca. 500,000
ten best QSAR models within a defined applicability domain, and predicted activities
were averaged to yield consensus values. Thirty-four consensus hits were identified with
moderate to high predicted activities. Among them, some compounds shared very similar
core chemical structures, while some were very different. Eventually, ten structurally diver
hits (59-68, Table 5-5) with moderate to high predicted activity were chosen, purchased and
screened using the same cell line and assay method as for the PBT screening. The chemical
structures and experimental biological data are shown in Table 5-5. Eight (59, 61-62, 64-68)
88

of the ten compounds were confirmed to be active against the A549 lung cancer cell line, and
compound 68 (ChemDiv #: K915-0700) showed the best activity with an EC50 of 1.8 µM,
comparable to the active PBTs. This hit (68) has similar activity, but a novel core structure
different from either known PBTs or anticancer drugs. Since all compounds in the ChemDiv
database were synthesized automatically by combinatorial chemistry and no biological data
were annotated, our screening provides the first associated anticancer activity for these novel
structures.
Althoug
h the prediction accuracy for the screening hits was lower than for the original
cong
5.4.5 Prediction of Anticancer Activity for an External Data Set
demonstrate that the
train
d activity that ranged
betw
eneric (core structure similar) compound set (see explanation in the next paragraph), the
high experimental hit rate and capability of detecting novel active structures from a large
chemical database confirm this method as a very useful and powerful tool in drug lead
identification.
As a reliable and truly predictive QSAR model, it is necessary to
ing set models can accurately predict activities of new compounds in external test sets.
To this end, the kNN QSAR models validated with the test sets were used to predict the
activity of four new compounds (Table 5-5), which were not available prior to our QSAR
studies of the 52-compound PBT dataset. Concurrently, the eight active hits (Table 5-6)
from ChemDiv, which had moderate to high predicted activities, were also used to evaluate
the accuracy of prediction using our models in a quantitative manner.
All of the external compounds displayed moderate to high predicte
een 0.15 and 72.4 µM (Tables 5-5 & -6), while the original training set compounds
(Tables 5-1, -2 & -3) featured EC50 activity values that ranged between 0.08 and 80 µM log
89

EC50 units. Tables 5-5 & -6 list the averaged predicted activity values for the external data
set obtained from the best kNN models. We intentionally selected a series of compounds that
have a wide range of predicted activity, paralleling those used in the training and test sets
during the model building. This choice will help us to confirm the predictive power of our
models in a wider applicability domain. The obtained correlation coefficient R2 was as high
as 0.57 (Figure 5-5). It was interesting to analyze the performance of QSAR models with
respect to the congeneric (core structure similar) compounds and novel (core structure
different) compounds. With the four congeneric PBTs, the difference in absolute value
between the predicted activity and experimental was less than 0.2 for compounds 55, 56 and
58 and 0.6 for compound 57. For the eight structurally diverse hits set (Table 5-6), the
models performed slightly worse than for the congeneric compounds. Two reasons can be
suggested and discussed as follows. 1) The congeneric and the novel hit compounds have
high structural dissimilarity. The models are based on the structure-activity data of the
training set (congeneric), so the selected descriptors are not sufficient to reliably and
accurately predict the activity of external diverse (novel) structures. This problem always
exists in statistical modeling, and the final result could be improved by using more
descriptors. 2) Since this is a whole cell based assay, activity may be hindered by poor
physicochemical properties (solubility, cell membrane transportation, stability, etc.) or
metabolic problems, which lead to lower actual activity than predicted in most of the cases.
(Compound 68 was an exception; the actual activity was higher than the predicted activity.)
Fortunately, the high correlation coefficient (R2=0.57) demonstrates that our QSAR models
are still very robust and predictive for most of both congeneric and novel compound
structures and could be used to diversify the chemical repertoire of anticancer agents.
90
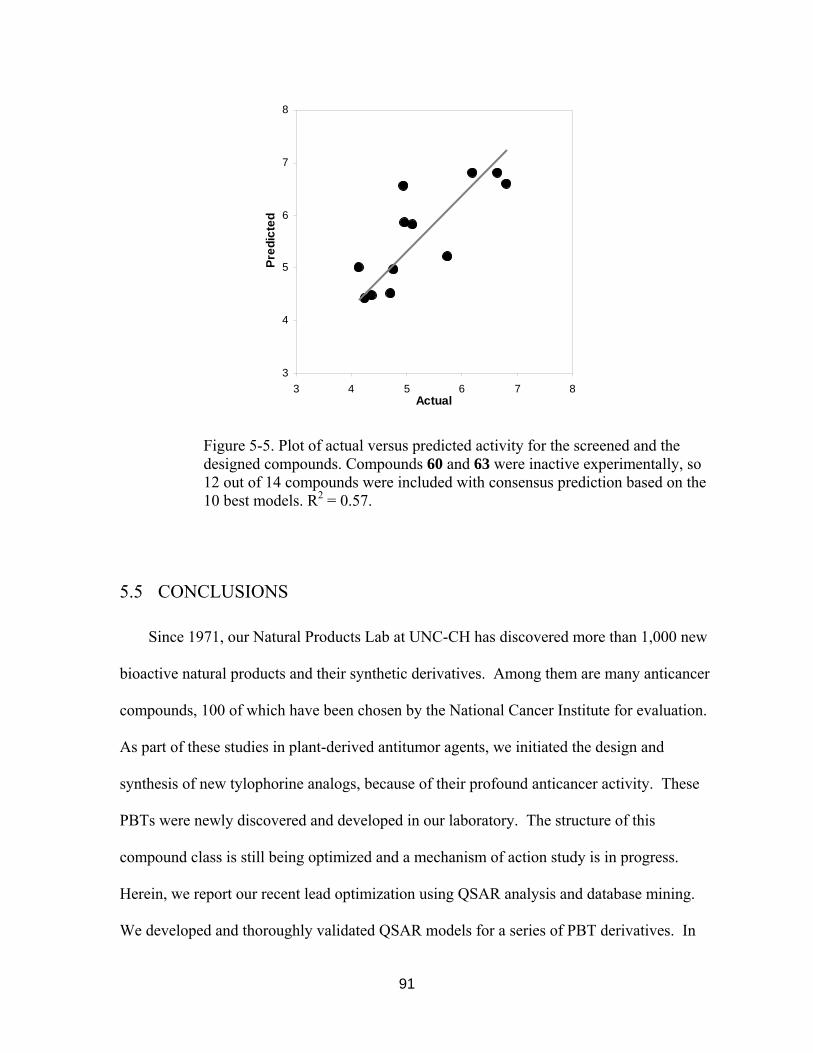
3
4
5
6
7
8
3 4 5 6 7 8Actual
Pred
icte
d
Figure 5-5. Plot of actual versus predicted activity for the screened and the designed compounds. Compounds 60 and 63 were inactive experimentally, so 12 out of 14 compounds were included with consensus prediction based on the 10 best models. R2 = 0.57.
.5 CONCLUSIONS
Since 1971, our Natural Products Lab at UNC-CH has discovered more than 1,000 new
nd their synthetic derivatives. Among them are many anticancer
com
ning.
5
bioactive natural products a
pounds, 100 of which have been chosen by the National Cancer Institute for evaluation.
As part of these studies in plant-derived antitumor agents, we initiated the design and
synthesis of new tylophorine analogs, because of their profound anticancer activity. These
PBTs were newly discovered and developed in our laboratory. The structure of this
compound class is still being optimized and a mechanism of action study is in progress.
Herein, we report our recent lead optimization using QSAR analysis and database mi
We developed and thoroughly validated QSAR models for a series of PBT derivatives. In
91

agreement with our expectation, the result showed that this approach could efficiently and
successfully generate multiple models with high internal and external accuracy, and these
models have been further exploited in database mining for new lead structures. Their high
predictive ability allowed the successful virtual screening of a large chemical database with
an exceptional high hit rate (80%). Those hits (68) lacking a phenanthrine ring but having
high activity (EC
50=1.8 uM) may in fact lead to a novel structural class of anticancer agents.
We believe that this approach should facilitate the design of new natural product analogs as
well as the search for new structures with anticancer activity from large chemical databases.
On the basis of the current QSAR results and earlier practical SAR trend analysis, a more
detailed “pharmacophore” model may be constructed for guiding the further design of new
analogs in the future.
92
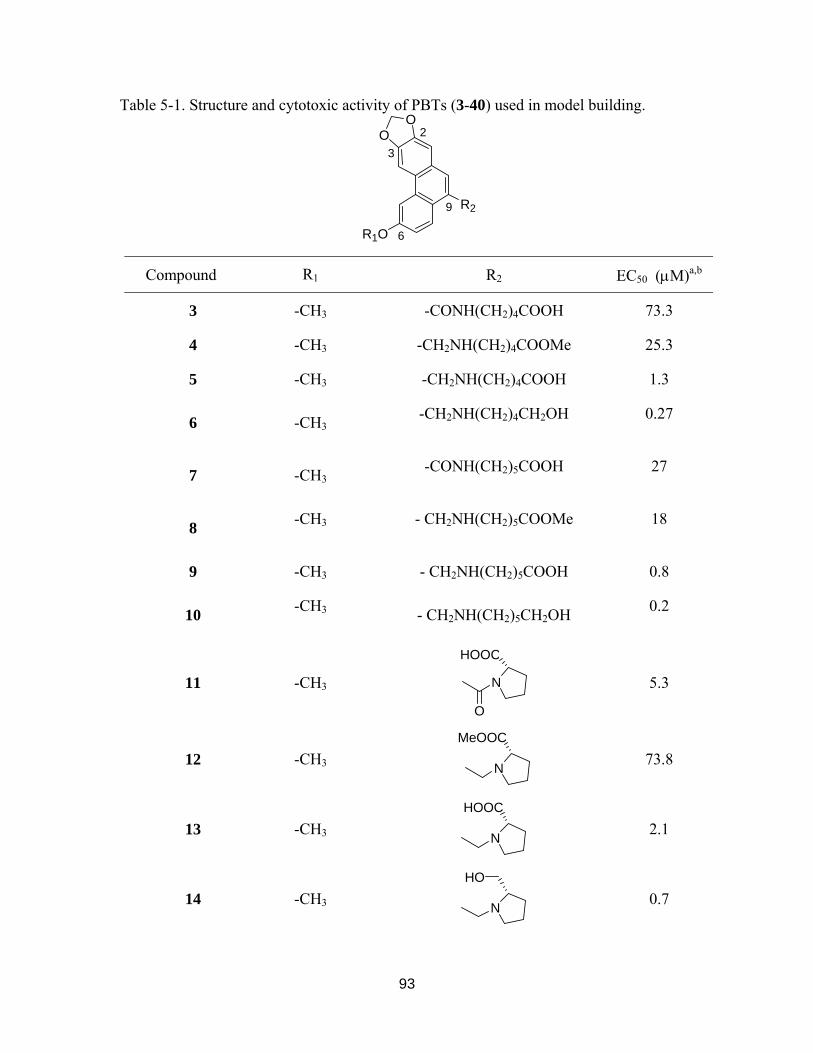
Table 5-1. Structure and cytotoxic activity of PBTs (3-40) used in model building.
R2
R1O
OO 2
3
6
9
Compound R1 R2 EC50 (µM)a,b
3 -CH3 -CONH(CH2)4COOH 73.3
4 -CH3 -CH2NH(CH2)4COOMe 25.3
5 -CH3 -CH2NH(CH2)4COOH 1.3
6 -CH3-CH2NH(CH2)4CH2OH 0.27
7 -CH3-CONH(CH2)5COOH 27
8 -CH3 - CH2NH(CH2)5COOMe 18
9 -CH3 - CH2NH(CH2)5COOH 0.8
10 -CH3 - CH2NH(CH2)5CH2OH 0.2
11 -CH3 N
O
HOOC
5.3
12 -CH3 N
MeOOC
73.8
13 -CH3 N
HOOC
2.1
14 -CH3 N
HO
0.7
93
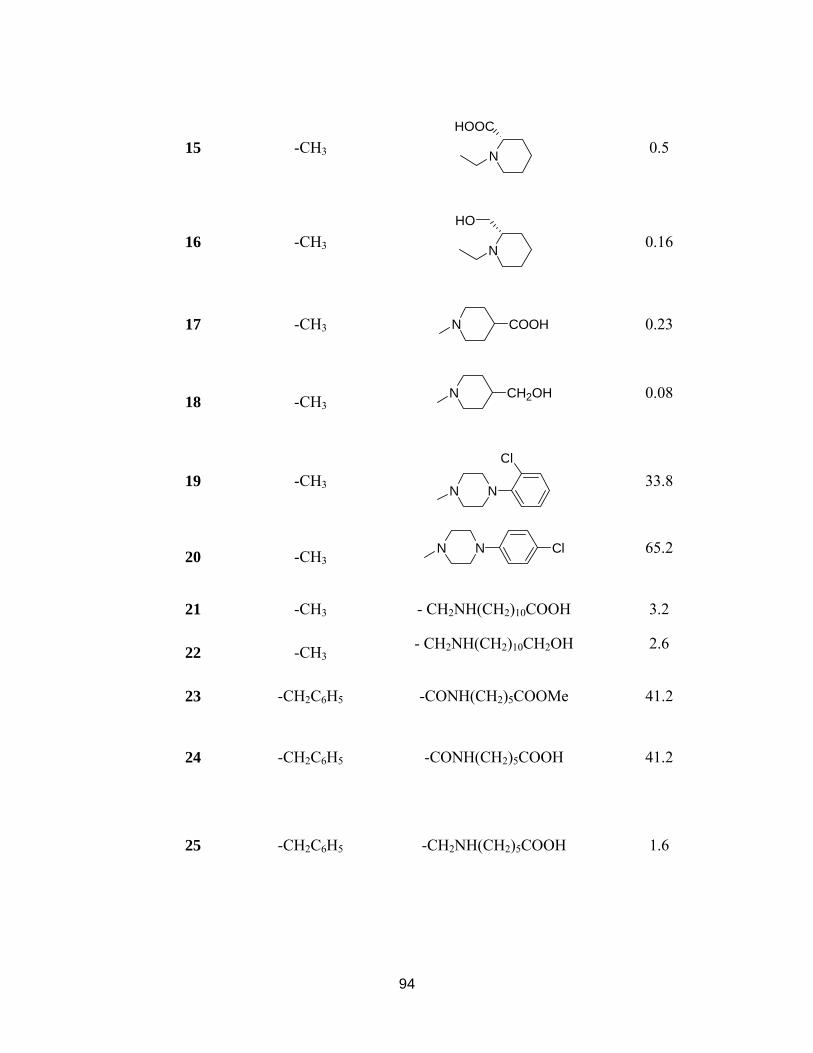
15 -CH3 N
HOOC
0.5
16 -CH3 N
HO
0.16
17 -CH3 N COOH
0.23
18 -CH3N CH2OH
0.08
19 -CH3 N N
Cl
33.8
20 -CH3N N Cl
65.2
21 -CH3 - CH2NH(CH2)10COOH 3.2
22 -CH3- CH2NH(CH2)10CH2OH 2.6
23 -CH2C6H5 -CONH(CH2)5COOMe 41.2
24 -CH2C6H5 -CONH(CH2)5COOH 41.2
25 -CH2C6H5 -CH2NH(CH2)5COOH 1.6
94

26 -CH2C6H5 -CH2NH(CH2)5CH2OH 1.1
27 -CH2C6H5 -CH2NH(CH2)4COOMe 17.0
28 -CH2C6H5 -CH2NH(CH2)4COOH 2.2
29 -CH2C6H5 N
O
HOOC
42.6
30 -CH2C6H5 N
MeOOC
32.1
31 -CH2C6H5 N
HOOC
4.4
32 -CH2C6H5 N
HO
1.8
33 -CH2C6H5 N
HOOC
3.2
34 -CH2C6H5 N
HO
1.3
95
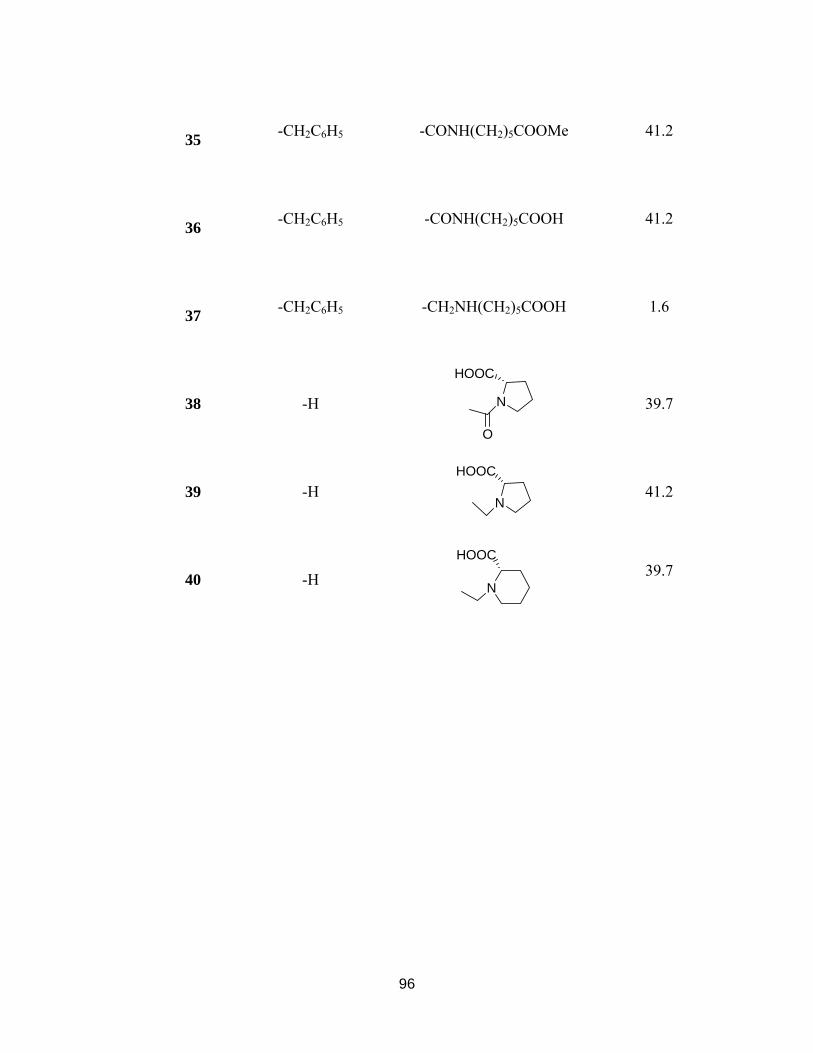
35 -CH2C6H5 -CONH(CH2)5COOMe 41.2
36 -CH2C6H5 -CONH(CH2)5COOH 41.2
37 -CH2C6H5 -CH2NH(CH2)5COOH 1.6
38 -H N
O
HOOC
39.7
39 -H N
HOOC
41.2
40 -H N
HOOC
39.7
96

Table 5-2. Structure and cytotoxic activity of PBTs (41-48) used in model building.
R
H3CO
OCH3H3CO 2
3
6
9
Compound R EC50 (µM)
41 -NH(CH2)10COOH 13.0
42 -NH(CH2)10CH2OH 3.6
43 -CH2NH(CH2)5COOH 9.7
44 -CH2NH(CH2)5CH2OH 2.7
45 N
HOOC
9.7
46 N
HO
6.3
47 N COOH
19.2
48 N CH2OH 2.4
97

Table 5-3. Structure and cytotoxic activity of PBTs (49-54) used in model building. Compound Structure EC50 (µM)
49
MeO
MeO OMe
N
NO2
OHOOC
80
50
MeO
MeO OMe
N
NO2
HOOC
45.2
51
MeO
MeO OMe
N
NO2
HO
11.7
52 MeO
MeO OMe
NHO
52.2
53
H3CO
OCH3
H3CO
OCH3
N
HN
H
H
H
H
0.02
98

54 N
OMeMeO
MeO
0.008
99

Table 5-4. Ten best kNN QSAR models.
Models Test Sets Training Sets Number of Descriptors q2 R2
1 8 44 15 0.52 0.75
2 11 41 20 0.53 0.8
3 12 40 10 0.72 0.71
4 12 40 15 0.72 0.72
5 14 38 10 0.56 0.77
6 14 38 20 0.51 0.81
7 14 38 15 0.58 0.81
8 14 38 15 0.54 0.79
9 18 34 20 0.59 0.81
10 20 32 15 0.55 0.73
100
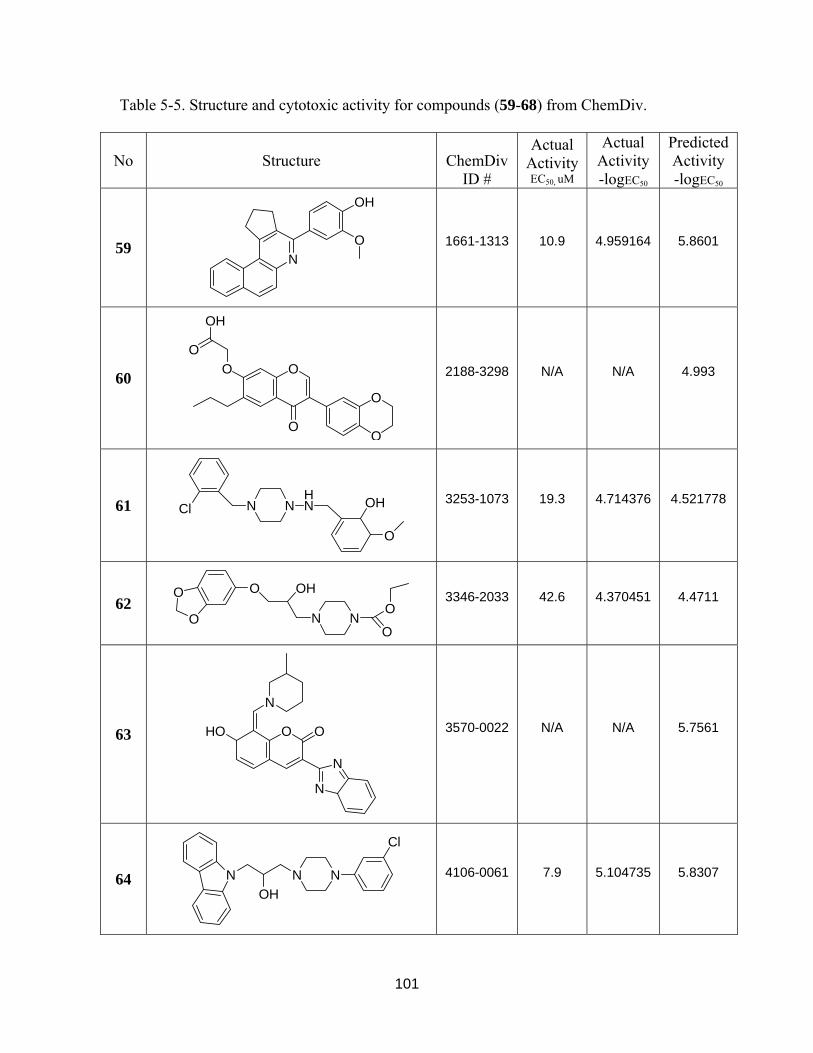
Table 5-5. Structure and cytotoxic activity for compounds (59-68) from ChemDiv.
No Structure
ChemDiv ID #
Actual Activity EC50, uM
Actual Activity -logEC50
Predicted Activity -logEC50
59 N
OH
O
1661-1313 10.9 4.959164 5.8601
60 O
O
O
O
OH
O
O
2188-3298 N/A N/A 4.993
61 Cl N NHN OH
O
3253-1073 19.3 4.714376 4.521778
62 O
O
O
N
OH
NO
O
3346-2033 42.6 4.370451 4.4711
63 O
N
N
N
HO O
3570-0022 N/A N/A 5.7561
64 N N N
Cl
OH
4106-0061 7.9 5.104735 5.8307
101

65 N
HN
OH
6658-0014 11.1 4.955545 6.5566
66 N NNHO
OMeOMe
OMe
C614-0150 17.3 4.763018 4.969401
67 N N NO2
NO
N
OO
NH
OH
K901-0689 72.4 4.140272 5.0105
68
OO
N
NH
O
OH
Cl
K915-0700 1.8 5.737391 5.210599
102
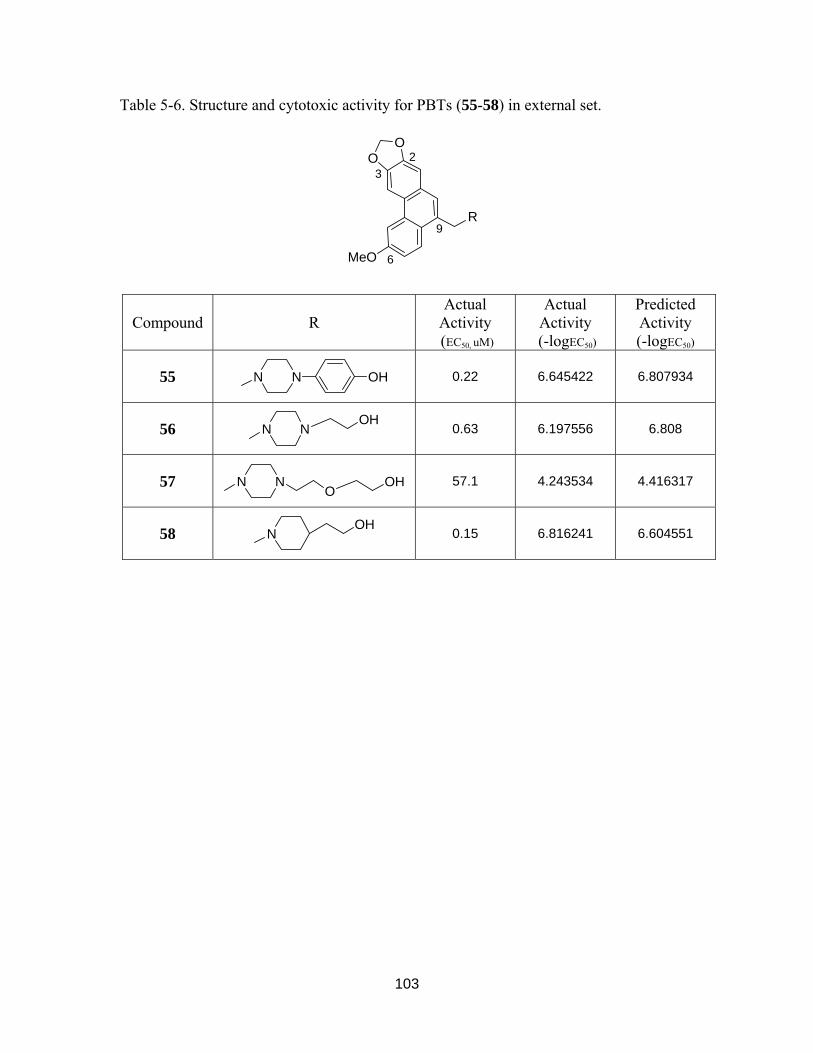
Table 5-6. Structure and cytotoxic activity for PBTs (55-58) in external set.
OO
MeO
23
6
9R
Compound R Actual
Activity (EC50, uM)
Actual Activity
(-logEC50)
Predicted Activity (-logEC50)
55 N N OH
0.22 6.645422 6.807934
56 N NOH
0.63 6.197556 6.808
57 N NO
OH
57.1 4.243534 4.416317
58 NOH
0.15 6.816241 6.604551
103

5.6 REFERENCES
1) Dietrich, S. W.; Dreyer, N. D.; Hansch, C.; Bentley, D. L. Confidence-interval
estimators for parameters associated with quantitative structure-activity-relationships.
J. Med. Chem. 1980, 23, 1201-1205.
2) Hadjipavloulitina, D.; Hansch, C. Quantitative structure-activity-relationships of the
benzodiazepines - A review and reevaluation. Chem. Rev. 1994, 94, 1483-1505.
3) Hansch, C.; Muir, R. M.; Fujita, T.; Maloney, P. P.; Geiger, E.; Streich, M. The
correlation of biological activity of plant growth regulators and chloromycetin
derivatives with Hammett constants and partition coefficients. J. Am. Chem. Soc.
1963, 85, 2817-2824.
4) Hansch, C.; Kurup, A.; Garg, R.; Gao, H. Chem-bioinformatics and QSAR: a review
of QSAR lacking positive hydrophobic terms. Chem. Rev. 2001, 101, 619-672.
5) Hansch, C.; Leo, A.; Mekapati, S. B.; Kurup, A. Qsar and Adme. Bioorg. Med. Chem.
2004, 12, 3391-3400.
6) Klein, T. E.; Huang, C.; Ferrin, T. E.; Langridge, R.; Hansch, C. Computer-assisted
drug receptor mapping analysis. ACS Symposium Series 1986, 306, 147-158.
7) Kubinyi, H. Quantitative relationships between chemical-structure and biological-
cctivity. Chemie in Unserer Zeit 1986, 20, 191-202.
8) Kubinyi, H. QSAR and 3D QSAR in drug design .1. Methodology. Drug Discovery
Today 1997, 2, 457
9) Kurup, A.; Mekapati, S. B.; Garg, R.; Hansch, C. HIV-1 protease inhibitors: a
comparative QSAR analysis. Curr. Med. Chem. 2003, 10, 1679-1688.
10) Zheng, W.; Tropsha, A. A novel variable selection QSAR approach based on the K-
nearest neighbor principle. J. Chem. Inf. Comput. Sci. 2000, 40, 185-194.
11) Tropsha, A.; Cho, S. J.; Zheng, W. "New tricks for an old dog": development and
application of novel QSAR methods for rational design of combinatorial chemical
libraries and database mining. In Rational Drug Design: Novel Methodology and
Practical Applications; ACS Symposium Series 719; Parrill, A. L., Reddy, M. R.,
Eds.; American Chemical Society: Washington, DC, 1999. 198-211
104

12) Shen, M.; LeTiran, A.; Xiao, Y.; Golbraikh, A.; Kohn, H.; Tropsha, A. Quantitative
structure-activity relationship analysis of functionalized amino acid anticonvulsant
agents using k nearest neighbor and simulated annealing PLS methods. J. Med. Chem.
2002, 45, 2811-2823
13) Shen, M.; Beguin, C.; Golbraikh, A.; Stables, J; Kohn, H.; Tropsha, A. Application of
predictive QSAR models to database mining: identification and experimental
validation of novel anticonvulsant compounds. J. Med. Chem. 2004, 47, 2356-2364
14) Oloff, S.; Mailman, R; Tropsha, A. Application of validated QSAR Models of D1
dopaminergic antagonists for database mining. J. Med. Chem. 2005, 48, 7322-7332
15) EduSoft, LLC. MolconnZ, version 4.05; http://www.eslc.vabiotech.com/ [4.05],
2003.
16) Golbraikh, A.; Tropsha, A. Beware of q2! J. Mol. Graphics Modell. 2002, 20, 269-
276.
17) ChemDiv. http://www.chemdiv.com . 2005.
18) Rubinstein, L. V.; Shoemaker, R. H.; Paull, K. D.; Simon, R. M.; Tosini, S.; Skehan,
P.; Scudiero, D. A.; Monks, M. R. Comparison of in vitro anticancer-drug-screening
data generated with a tetrazolium assay versus a protein assay against a diverse panel
of human tumor cell lines. J. Natl. Cancer Inst. 1990, 82, 1113-1118.
19) Available from Tripos Inc. Sybyl User's Manual, version 7.8; Tripos, Inc.: St. Louis,
MO, 2002.
20) Kier, L. B.; Hall, L. H. Molecular Connectivity in Chemistry and Drug Research;
Academic Press: New York, 1976.
21) Basak, S. C.; Mills, D. Prediction of mutagenicity utilizing a hierarchical QSAR
approach. SAR QSAR Environ. Res. 2001, 12, 481-496.
22) Benigni, R.; Giuliani, A.; Franke, R.; Gruska, A. Quantitative structure-activity
relationships of mutagenic and carcinogenic aromatic amines. Chem. Rev. 2000, 100,
3697-3714.
23) Cronin, M. T.; Dearden, J. C.; Duffy, J. C.; Edwards, R.; Manga, N.; Worth, A. P.;
Worgan, A. D. The importance of hydrophobicity and electrophilicity descriptors in
mechanistically-based QSARs for toxicological endpoints. SAR QSAR Environ. Res.
2002, 13, 167-176.
105

24) Fan, Y.; Shi, L. M.; Kohn, K. W.; Pommier, Y.; Weinstein, J. N. Quantitative
structure-antitumor activity relationships of camptothecin analogues: cluster analysis
and genetic algorithm-based studies. J. Med. Chem. 2001, 44, 3254-3263.
25) Girones, X.; Gallegos, A.; Carbo-Dorca, R. Modeling antimalarial activity:
application of kinetic energy density quantum similarity measures as descriptors in
QSAR. J. Chem. Inf. Comput. Sci. 2000, 40, 1400-1407.
26) Moss, G. P.; Dearden, J. C.; Patel, H.; Cronin, M. T. Quantitative structure-
permeability relationships (QSPRs) for percutaneous absorption. Toxicol. In Vitro.
2002, 16, 299-317.
27) Randic, M.; Basak, S. C. Construction of high-quality structure-property-activity
regressions: the boiling points of sulfides. J. Chem. Inf. Comput. Sci. 2000, 40, 899-
905.
28) Suzuki, T.; Ide, K.; Ishida, M.; Shapiro, S. Classification of environmental estrogens
by physicochemical properties using principal component analysis and hierarchical
cluster analysis. J. Chem. Inf. Comput. Sci. 2001, 41, 718-726.
29) Trohalaki, S.; Gifford, E.; Pachter, R. Improved QSARs for predictive toxicology of
halogenated hydrocarbons. Comput. Chem. 2000, 24, 421-427.
30) Wang, X.; Yin, C.; Wang, L. Structure-activity relationships and response-surface
analysis of nitroaromatics toxicity to the yeast (Saccharomyces cerevisiae).
Chemosphere. 2002, 46, 1045-1051.
31) Kubinyi, H.; Hamprecht, F. A.; Mietzner, T. Three-dimensional quantitative
similarity-activity relationships (3D QSiAR) from SEAL similarity matrices. J. Med.
Chem. 1998, 41, 2553-2564.
32) Golbraikh, A.; Tropsha, A. Predictive QSAR modeling based on diversity sampling
of experimental datasets for the training and test set selection. J. Comput. Aided Mol.
Des. 2002, 16, 357-369.
33) Sharaf, M. A.; Illman, D. L.; Kowalski, B. R. Chemometrics; John Wiley & Sons:
New York, 1986.
34) Wold, S. a. E. L. Statistical Validation of QSAR Results. In Chemometrics Methods
in Molecular Design; van de Waterbeemd, H., Ed.; VCH: Weinheim, Germany, 1995;
pp 309-318.
106

35) Tropsha, A.; Gramatica, P.; Gombar, V. K. The importance of being earnest:
validation is the absolute essential for successful application and interpretation of
QSPR models. QSAR Comb. Sci. 2003, 22, 69-77.
36) Wu, P. L.; Rao K. V.; Su, C.-H.; Kuoh, C.-S.; Wu, T.-S. Phenanthroindolizidine
alkaloids and their cytotoxicity from the leaves of Ficus septica. Heterocycles 2002,
57, 2401-2408.
107
6 CHAPTER VI. ADME EVALUATION AND MODE OF ACTION STUDY
ADME EVALUATION
6.1 INTRODUCTION
Compound toxicity plays a key role in determining success in drug development,* and
50% of drug failures are attributed to ADME-Tox issues. Thus, it is critical to accurately
predict these properties earlier in the investigation of a lead to assure appropriate selection in
the drug development process. New prediction techniques and technologies are making it
possible to more quickly eliminate compounds that are most likely to exhibit ADME or
toxicity problems, and provide ways for researchers to still arrive at correct conclusions, but
in less time. The more attractive compounds can then be put on the development fast track,
saving time and money. Therefore, an ADME prediction program
(http://preadme.bmdrc.org), which uses an artificial neural network with back-propagation
method, was used to predict blood brain barrier (BBB) permeability, human intestinal
absorption (HIA) and protein binding percentage of PBTs that hold promise for improving
the selection of potent, on-target leads with fewer negative side-effects.
* As we mentioned earlier, in the early 1960s drug development of tylocrebrine was terminated due to its significant CNS toxicity manifested as disorientation and ataxia1.

6.2 METHODOLOGY
6.2.1 Prediction of CNS Toxicity
An ADME prediction model (http://preadme.bmdrc.org), which uses an artificial neural
network with back-propagation method, was used to predict the BBB permeability of
selected compounds in comparison with their parent tylophora alkaloids. This model
contains over 15,000 CNS active compounds and 50,000 CNS inactive compounds, and each
molecule is describable by 7 1D descriptors and 166 2D descriptors. This model was
validated by a database of 275 known CNS active compounds. The accuracy of the
prediction was 92%. Therefore, it is a reliable filter to screen potential candidate compounds
for CNS toxicity.2
6.2.2 Prediction of Human Intestinal Absorption3-4 and Plasma Protein Binding5
An ADME prediction model (the same as above) was also used to predict the human
intestinal absorption and plasma protein binding of selected compounds in comparison with
their parent tylophora alkaloids.
6.2.3 Results and Discussion
The predicted ADME values of four PBTs (1-4) and three parent tylophora alkloids are
shown in Table 6-1. Preliminary data indicated that all PBT compounds should be well
absorbed in the human intestine (HIA ≥92.5%). In addition, the four PBTs showed lower
predicted brain/blood concentration ratios (Cbrain/Cblood = 1) than the tylophora alkloids,
indicating that less PBT compound would penetrate the blood brain barrier (BBB) and, thus,
the probability of CNS toxicity would be low. In contrast, the high predicted ratio (8.3) of
tylocrebrine indicated a high probability of compound BBB entry, which would readily
109

explain its clinical CNS toxicity. In addition, the PBTs were predicted to have higher protein
bound constants (76%-90%) than the tylophora alkaloids (74%-78%). This parameter is a
favorable pharmacokinetic property for drug development. In summary, PBTs have better
predicted ADME profiles than tylophora alkaloids in our preADME screen.
OO
PhH2CO
NH(CH2)4COOH
1.
OO
MeO
NH(CH2)6OH
3.
OO
MeO
NH(CH2)5COOH
2.
OO
MeO
N
4.
COOH
TSWUCC-1 (Antofine)
Tyloindicine FTylocrebrine
OMeMeO
MeO
N
H
OMeMeO
MeO
N
H
MeO
MeO
MeO
N
OMe
OH
Figure 6-1. Structure of tylophora alkloids and PBTs (1-4) selected for ADME prediction. Table 6-1. ADME predictions of human intestinal absorption, blood brain barrier penetration, and protein binding of PBT compounds vs tylophora alkaloids.
Compound BBB permeability (Cbrain/Cblood)
HIA (%) Plasma Protein Binding (%)
Tylophora Alkaloids Antofine 11.7 94.2 74.9
Tyloindicine F 4.5 91.7 77.9 Tylocrebrine 8.3 93.9 74.0
PBTs 1. 0.61 93.6 85.7 2. 1.0 93.8 89.8 3. 2.7 92.5 84.4 4. 1.6 93.5 75.7
110

MODE OF ACTION STUDY
6.3 INTRODUCTION
Prior evaluation of (+)-(S)-tylophorine and its analogs in the antitumor screen at the
National Cancer Institute showed a uniform and potent inhibitory effect on cancer cell
growth (GI50 ≈ 10-8 M) in all 60 cell lines with notable selectivity toward several refractory
cell lines including melanoma and lung tumor cell lines.6 Earlier studies in the 1960s
demonstrated that the mechanism of antitumor activity of tylophorine alkaloids was to
irreversibly inhibit protein synthesis at the elongation stage of translation.7-11 However,
comprehensive evaluation of antitumor potential has not been reported, and the mechanisms
of cell growth inhibition are largely unknown. In the 1990s, several key regulators of
signaling transduction were reported as the biological targets of tylophorine alkaloids
including thymidylate synthase (TS)12,13 and dihydrofolate reductase.14 In addition, these
compounds were also found to induce cell apoptosis.15 Most recently, Gao et al.16
demonstrated that the tylophorine analogs have significant inhibitory effects on NF-kB
mediated transcription. These recent discoveries emphasize the great potential of developing
tylophorine derivatives into a new antitumor drug class with a unique mode of action. In this
study, we have reported the discovery of novel phenanthrene-based tylophorine (PBT)
derivatives with profound inhibition against several human cancer cell lines. However, the
biological target of this class of novel compounds has not been identified. Further screening
against more cancer-related cell lines will facilitate our understanding of the specific targets
of this new compound class and provide insight into definitive structure-activity relationships.
111

Selected interesting compounds were sent for additional screening at collaborative
laboratories, including NCI-DTP, MD Anderson Cancer Center, Dr. M. Jarstfer’s Laboratory
at UNC-CH, and MDS Pharma Services -Taiwan Ltd. The major findings of these screens
are given below.
6.4 NCI-DTP HUMAN TUMOR CELL LINES SCREENING (17-19):
The In Vitro Cell Line Screening Project (IVCLSP) is a dedicated service providing
direct support to the DTP anticancer drug discovery program. This project utilizes 59
different human tumor cell lines, representing leukemia, melanoma and cancers of the lung,
colon, brain, ovary, breast, prostate, and kidney. The aim is to prioritize synthetic
compounds or natural product samples, which show selective growth inhibition or cell killing
of particular tumor cell lines, for further evaluation. This screen is unique in that the
complexity of a 59 cell line dose response produced by a given compound results in a
biological response pattern that can be utilized in pattern recognition algorithms. Using these
algorithms, it is possible to assign a putative mechanism of action to a test compound, or to
determine that the response pattern is unique and not similar to that of any of the standard
prototype compounds included in the NCI database. In addition, following characterization
of various cellular molecular targets in the 59 cell lines, it may be possible to select
compounds most likely to interact with a specific molecular target.
6.4.1 Methodology of the In Vitro Cancer Screen
The human tumor cell lines of the cancer screening panel are grown in RPMI 1640
medium containing 5% fetal bovine serum and 2 mM L-glutamine. For a typical screening
experiment, cells are inoculated into 96 well microtiter plates in 100 µL at plating densities
112

ranging from 5,000 to 40,000 cells/well depending on the doubling time of individual cell
lines. After cell inoculation, the microtiter plates are incubated at 37° C, 5 % CO2, 95 % air
and 100 % relative humidity for 24 h prior to addition of experimental drugs.
After 24 h, two plates of each cell line are fixed in situ with TCA, to represent a
measurement of the cell population for each cell line at the time of drug addition (Tz).
Experimental drugs are solubilized in dimethyl sulfoxide at 400-fold the desired final
maximum test concentration and stored frozen prior to use. At the time of drug addition, an
aliquot of frozen concentrate is thawed and diluted to twice the desired final maximum test
concentration with complete medium containing 50 µg/ml gentamicin. Four additional 10-
fold or ½ log serial dilutions are made to provide a total of five drug concentrations plus
control. Aliquots of 100 µl of these different drug dilutions are added to the appropriate
microtiter wells already containing 100 µl of medium, resulting in the required final drug
concentrations.
Following drug addition, the plates are incubated for an additional 48 h at 37°C, 5%
CO2, 95% air, and 100% relative humidity. For adherent cells, the assay is terminated by the
addition of cold TCA. Cells are fixed in situ by the gentle addition of 50 µl of cold 50%
(w/v) TCA (final concentration, 10% TCA) and incubated for 60 minutes at 4°C. The
supernatant is discarded, and the plates are washed five times with tap water and air dried.
Sulforhodamine B (SRB) solution (100 µl) at 0.4 % (w/v) in 1 % acetic acid is added to each
well, and plates are incubated for 10 minutes at room temperature. After staining, unbound
dye is removed by washing five times with 1% acetic acid and the plates are air dried.
Bound stain is subsequently solubilized with 10 mM trizma base, and the absorbance is read
on an automated plate reader at a wavelength of 515 nm. For suspension cells, the
113

methodology is the same except that the assay is terminated by fixing settled cells at the
bottom of the wells by gently adding 50 µl of 80 % TCA (final concentration, 16 % TCA).
Using the seven absorbance measurements [time zero, (Tz), control growth, (C), and test
growth in the presence of drug at the five concentration levels (Ti)], the percentage growth is
calculated at each of the drug concentrations levels. Percentage growth inhibition is
calculated as:
[(Ti-Tz)/(C-Tz)] x 100 for concentrations for which Ti>/=Tz
[(Ti-Tz)/Tz] x 100 for concentrations for which Ti<Tz.
Three dose response parameters are calculated for each experimental agent. Growth
inhibition of 50% (GI50) is calculated from [(Ti-Tz)/(C-Tz)] × 100 = 50, which is the drug
concentration resulting in a 50% reduction in the net protein increase (as measured by SRB
staining) in control cells during the drug incubation. The drug concentration resulting in total
growth inhibition (TGI) is calculated from Ti = Tz. The LC50 (concentration of drug
resulting in a 50% reduction in the measured protein at the end of the drug treatment as
compared to that at the beginning) indicating a net loss of cells following treatment is
calculated from [(Ti-Tz)/Tz] × 100 = -50. Values are calculated for each of these three
parameters if the level of activity is reached; however, if the effect is not reached or is
exceeded, the value for that parameter is expressed as greater or less than the maximum or
minimum concentration tested.
6.4.2 Results and Discussion
Totally, 22 active compounds were sent to NCI-DTP and all were identified as new
chemical entities with anticancer activity. The biological study is still ongoing.
114

6.5 MD ANDERSON CANCER CENTER:
As a primary assay to examine the effect of the compounds on cell growth, the metabolic
activity of living cells treated with eight selected compounds (Figure 6.2) was measured by
the MTT assay (see section 6.5.1). A panel of pancreatic cancer cells, namely BXPC-3,
Panc-1, and Capan-2, as well as an immortalized cell line derived from normal pancreatic
epithelium, E6E7, were tested in the assay. Among these cell lines, BXPC-3 was the most
sensitive cell line to most compounds tested, while Capan-2 was the most resistant. The data
are summarized in section 6.5.2 and Figures 6.3 – 6.8.
6.5.1 Methodology of MTT Assay
The MTT assay20 was used to access the killing effect of the drugs. Cells were seeded
into 96 well plates at a density of 6000 cells in 50 µl of media per well. The drug was
dissolved in DMSO at a stock concentration of 0.01 M and then diluted in culture media to
give different drug concentrations for testing in duplicates. The amount of DMSO was
equalized for all of the wells and the total volume of media containing the drug was 50µl.
After 72 hours of incubation at 37 °C in 5% CO2, 25µl of MTT [3-(4,5-dimethylthiazol-2-
yl)-2,5-diphenyl tetrazolium bromide] reagent was added to each well and incubated for two
hours. Then 100 µl of cell lysis buffer was added and incubation was continued overnight.
The plates were then read on a plate reader at OD 570. The cell killing efficiency was
determined by plotting the percent of survival cells with different concentrations of the
compounds in the same family, which were tested side-by-side. The MTT reading derived
from the cells treated by DMSO only was set as 100%.
115

6.5.2 Results and Discussion
The following observations are of particular interest from the screening results. WLY-
WP 5COOH displayed better killing in the pancreatic cancer cell line (panc-1) compared
with the "normal" pancreatic line (E6E7), specifically at 10-20 µM (Figure 6.3). WLY-
Waisp-OH showed a similar difference between pancreatic cancer and “normal” cells (Figure
6.4). These observations will be confirmed by using more pancreatic cancer cell lines and
fine-tuning the doses used. WLY-WP5OH had outstanding general cytotoxicity (Figure 6.5),
which will be useful information for future SAR study of this series. WLY-WHP-6COOH
had a stronger cytotoxic effect against MCF-7 cells compared with MCF-10A, "normal"
breast cells (Figure 6.6). This observation will also be confirmed later.
Compounds WLY-Wa4, WLY-WaispOH, WLY-WaLP6OH, and WLY-Wac6OH
strongly inhibited cell survival and showed similar activity trends against four cell lines,
E6E7, Panc-1, Capan-2, and CxPC-3 (Figures 6.7 and 6.8). While most cell lines exhibited
significant sensitivity to these compounds, the Capan-2 cancer cell line was relatively
resistant, with WaispOH having the strongest toxicity (Figure 6.8). However, lack of
specificity is a major concern as the "normal cell" control E6E7 was quite sensitive to
compound treatment (Figure 6.7). It remains possible that E6E7 does not represent the real
situation in normal pancreas tissue and, therefore, is not the ideal control.
116

OO
MeO
N OH
OO
MeO
N
OH
OO
MeO
HN (CH2)5OH
OO
MeO
NOH
WLY-WaispOH WLY-WaLP6OH WLY-WaC6OHWLY-Wa4OH
OO
PhO
N
OO
PhO
N
OO
HO
N
HOOCOH
HOOC
OO
PhO
N
HOOC
WLY-Wp5OH WLY-Wp5COOH WLY-Wp6COOH WLY-WHp6COOH
Figure 6-2. Structure of WLY-series tested at MD Anderson Cancer Center
WLY-WP-5COOH 72h
0
20
4060
80
100
120
0 10 20 40 80
uM
% S
urvi
val
SKHepChang Liv.2774IOSEPanc-1E6E7H1299WI 38MCF-7MCF-10A
Figure 6-3. MD Anderson Screening Data – Inhibition of Compound WP6COOH
117

WLY-Waisp-OH 72h
0
20
4060
80
100
120
0 10 20 40 80
uM
% S
urvi
val
SKHepChang Liv.2774IOSEPanc-1E6E7H 1299WI 38MCF-7MCF-10A
Figure 6-4. MD Anderson Screening Data – Inhibition of Compound WaispOH
WLY-WP-5OH 72h
0
20
4060
80
100
120
0 10 20 40 80
uM
% S
urvi
val
SKHepChang Liv.2774IOSEPanc-1E6E7H1299WI 38MCF-7MCF-10A
Figure 6-5. MD Anderson Screening Data – Inhibition of WP5OH
WLY-WHP-6COOH 72h
0
20
4060
80
100
120
0 10 20 40 80
uM
% S
urvi
val
SKHepChang Liv.2774IOSEPanc-1E6E7H1299WI 38MCF-7MCF-10A
Figure 6-6. MD Anderson Screening Data – Inhibition of WHP6COOH
118

E6E7
0
20
40
60
80
100
120
Wac-60H0909 WLY-WaispOH WLY-Wa4 WLY-WaLP6OH
0µm
0.5µm
2µm
Figure 6-7. MD Anderson Screening Data – Inhibition of Compounds WaC6OH, WaispOH, Wa4OH and WaLP6OH at 0, 0.5, and 2 µM
119

Panc-1
0
20
40
60
80
100
120
Wac-60H0909 WLY-WaispOH WLY-Wa4 WLY-WaLP6OH
0µm
0.5µm
2µm
Capan-2
0
20
40
60
80
100
120
Wac-60H0909 WLY-WaispOH WLY-Wa4 WLY-WaLP6OH
0µm
0.5µm
2µm
BxPC-3
0
20
40
60
80
100
120
Wac-60H0909 WLY-WaispOH WLY-Wa4 WLY-WaLP6OH
0µm
0.5µm
2µm
Figure 6-8. MD Anderson Screening Data – Inhibition of Compounds WaC6OH, WaispOH, Wa4OH and WaLP6OH at 0, 0.5, and 2 µM
120

6.6 ANTI-TELOMERASE ASSAY
Eukaryotic chromosomes end in DNA-protein complexes called telomeres, which
function as protective caps that prevent nucleolytic degradation, end-to-end fusions, and
aberrant recombination. In the absence of properly capped telomeres, cells are not able to
divide thus either becoming senescent or undergoing apoptosis. Human telomeric DNA is
composed of G-rich repeated sequences, (TTAGGG), which are not replicated efficiently by
the normal DNA replication machinery because of the end-replication problem.21 Instead,
the G-rich strand of telomeric DNA is maintained by a RNA-dependent DNA polymerase
called telomerase. Telomerase is a ribonucleoprotein complex that acts as a reverse
transcriptase in the maintenance of chromosome ends, therefore preventing cell programmed
death.22 The minimally active human telomerase complex is composed of hTERT, a catalytic
protein subunit, and hTR, a RNA subunit, which supply the template for telomeric DNA
synthesis.23-26 Telomerase activity is usually not present in most normal cells, but it is seen in
cancerous and some precancerous cells. The maintenance of telomeric DNA is vital for
tumor growth, and telomerase-mediated telomere extension is required for the growth of
>90% of all cancers.27 When telomerase is inhibited in positive cancer cell lines, telomere
extension is disrupted leading to senescence or apoptosis.
Telomerase requires the proper association of hTERT and hTR to form an active
complex. Dr. M. Jarstfer (UNC-CH) uses a telomerase assemblage assay to test if small
molecules affect telomerase activity by preventing telomerase assemblage. Recombinant
telomerase is assembled in rabbit reticulocyte lysates (RRL), followed by a direct assay for
telomerase activity that follows extension of a telomeric primer using [α-32P]-dGTP as one of
the substrates.
121

6.6.1 Methods
In Vitro Transcription and Purification of hTR.28 A total of 15 µg of phTR+HH was
linearized by digestion with Fok-1 followed by extraction with phenol/chloroform/isoamyl
alcohol, precipitation with ethanol, and resuspension in a suitable volume of TE (10 mM
Tris-HCl, pH 7.5, and 1 mM EDTA). In vitro transcription was carried out at 37 C for 18 h
using the linearized DNA, 0.32 units/µL T7 RNA polymerase (Promega), 1× transcription-
optimized buffer (Promega), 10 mM DTT, 0.8 units/µL RNasin (Fisher Scientific), 5 mM
MgCl2, and 1 mM each NTP. After transcription, the magnesium-inorganic diphosphate
complexes were removed by centrifugation for 2 min at 22000g. Cleavage by the
hammerhead ribozyme was initiated by the addition of MgCl2 to a final concentration of 12
mM followed by incubation at 45 C for 1 h. The entire reaction was then treated with 15
units of RQ1-DNase (Promega) for 20 min at 37 C followed by extraction with
phenol/chloroform/isoamyl alcohol and ethanol precipitation. The RNA was resuspended in
a suitable volume of denaturing loading buffer (7 M urea/10% glycerol/1× TBE) and purified
on a 4% denaturing polyacrylamide gel. The RNA was recovered using a modified version
of the "crush and soak" method.28 Briefly, the RNA was located in the gel by UV shadowing,
cut out, crushed by passing through a sterile plastic syringe, and extracted into 2 vol of 1×
TEN (10 mM Tris-HCl, pH 7.5, 1 mM EDTA, and 200 mM NaCl) at 4 C for 16 h. After
centrifugation, the supernatant was collected and a second extraction was performed with 2
vol of 1× TEN at room temperature for 1 h. The combined supernatants were filtered
through a Whatman GF/C filter, precipitated with ethanol, and resuspended in a suitable
volume of TE.
122

Synthesis of hTERT. hTERT was transcribed and translated using the TNT Coupled
Reticulocyte Lysate Systems kit (Promega). A 400 L reaction contained 8 µg of pET-28c-
hTERT, and other components provided in the kit as described by the manufacturer. The
reaction was incubated at 30 C for 90 min, flash-frozen in a dry ice/ethanol bath, and stored
at -80 C.
Telomerase assemblage assay. Recombinant hTERT was transcribed and translated
from pET28c-hTERT using the TNT® Coupled Reticulocyte Lysate Systems Kit (Promega)
following the manufacture’s instructions. Telomerase assemblage assays were performed by
first combining 10 µL (~ 50 fmol) of hTERT from reticulocyte lysate reaction, 3.5 µL of 61
ng/µL of in vitro transcribed hTR, 0.6 µL of DMSO or different inhibitors diluted in DMSO
and 0.9 µL of water. The reaction was allowed to incubate for 30 ºC for 90 min. It was then
added to the 15 µL reaction, 0.4 µL of different inhibitors or DMSO and 0.6 µL of water,
followed by 50 mM Tris-HCl, pH 8.0, 50 mM KCl, 1 mM MgCl2, 5 mM β-mercaptoethanol,
1 mM spermidine, 1 µM human telomere primer (5'-TTAGGGTTAGGGTTAGGG), 0.5 mM
dATP, 0.5 mM dTTP, 2.9 µM dGTP, 0.33 µM [χ-32P]-dGTP (3000 Ci/mmol, 10 µCi/µL;
Perkin-Elmer) to reach a total volume of 25 µL. Inhibition studies were done using 50 µM
final concentration of different inhibitors. Primer extension was carried out at 30º C for 90
min. After the addition of a 32P-labeled loading control (114 nucleotide, 5'-end labeled
DNA oligonucleotide, 1000 cpm per reaction), the primer extension products were extracted
with phenol/chloroform/isoamyl alcohol and ethanol precipitated in the presence of 0.6 M
NH4OAc and 35 ng /µL glycogen. Products were precipitated at -80 oC in 2.5 vol of
absolute ethanol for 30 min followed by centrifugation at 22 000g at 4 oC for 25 min and
washing with 2 vol of 70% ethanol. Pellets were resuspended in a suitable volume of TE,
123

and ethanol precipitation was repeated to ensure the removal of all unincorporated [α-32P]-
dGTP. The final pellets were dissolved in a formamide loading buffer containing 40%
formamide, 10 mM Tris-HCl, pH 8.0, 10 mM EDTA, 0.05% xylene cyanol, and 0.05%
bromophenol blue. The products were heated at 95 C for 5 min and resolved on a
prewarmed, 0.4 mm thick, 20 × 20 cm, 10% polyacrylamide/7 M urea/1× TBE gel. The gel
was run at 800 V for 1 h in 1× TBE. After drying the gel and exposing it to a
phosphorimager screen (Molecular Dynamics) overnight, telomerase activity was imaged
using a phosphorimager (Molecular Dynamics Storm 860) and quantified with ImageQuant
(version 5.2). The intensities of each band in each sample were summed and normalized to
the loading control.
6.6.2 Results
We used the above-described telomerase assemblage assay to test if selected PBT
compounds (40-45, Figure 6-9) could affect direct inhibition of the telomerase enzymatic
activity. We used 50 µM of the selected compounds to get the percent activity in the
telomerase assay as shown in Figure 6-10 and the results are illustrated graphically in Figure
6-11. Compounds 42, 43, 44, and 45 showed almost complete inhibition. Further testing
should be done using a post-assemblage assay to see if the compounds inhibit the assemblage
of hTERT and hTR or if they inhibit telomerase by another mechanism.
124

OO
MeO
N OH
OO
MeO
N
OH
OO
MeO
HN (CH2)5OH
OO
MeO
NOH
N N OH N NOH
OO
MeO
OO
MeO40 41 42
43 44 45
Figure 6-9. Structures of compounds 40-45 screened in telomerase assay
L.C.
+16
+10
+4
+22
DMSO 40 41 42 43 44 45
Figure 6-10. Telomerase Assemblage Assay [Telomerase inhibition was caused by different compounds. The 32P-labeled loading control (L.C.) and the human telomere primer extension products (+4, +10, +16, +22, etc. nucleotides added) are indicated.]
125
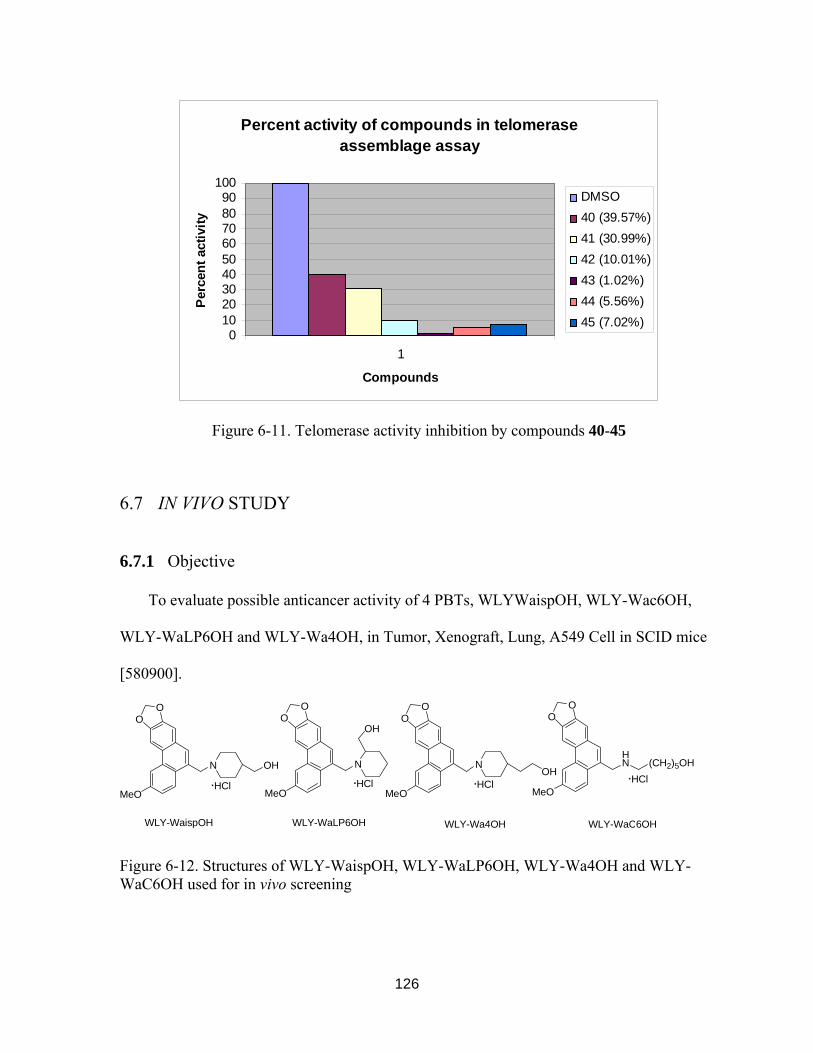
Percent activity of compounds in telomerase assemblage assay
0102030405060708090
100
1
Compounds
Perc
ent a
ctiv
ityDMSO40 (39.57%)41 (30.99%)42 (10.01%)43 (1.02%)44 (5.56%)45 (7.02%)
Figure 6-11. Telomerase activity inhibition by compounds 40-45
6.7 IN VIVO STUDY
6.7.1 Objective
To evaluate possible anticancer activity of 4 PBTs, WLYWaispOH, WLY-Wac6OH,
WLY-WaLP6OH and WLY-Wa4OH, in Tumor, Xenograft, Lung, A549 Cell in SCID mice
[580900].
OO
MeO
N OH
·HCl
OO
MeO
N
OH
·HCl
OO
MeO
HN (CH2)5OH·HCl
OO
MeO
NOH
·HCl
WLY-WaispOH WLY-WaLP6OH WLY-WaC6OHWLY-Wa4OH
Figure 6-12. Structures of WLY-WaispOH, WLY-WaLP6OH, WLY-Wa4OH and WLY-WaC6OH used for in vivo screening
126
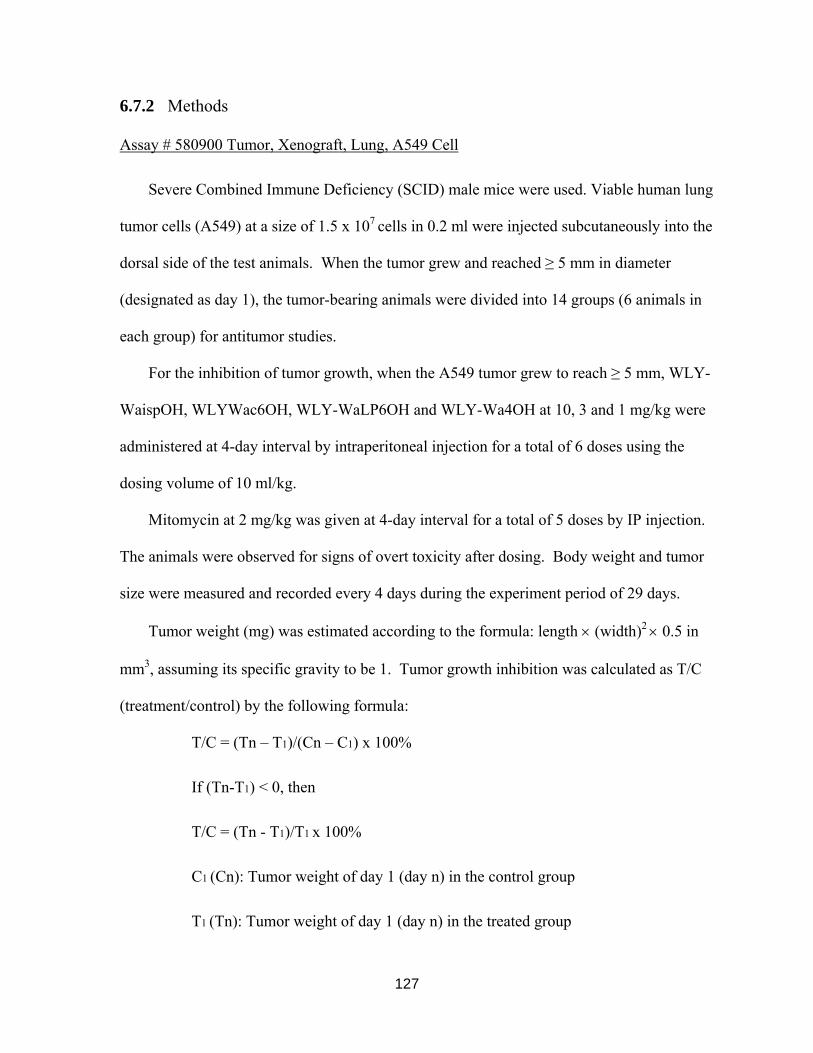
6.7.2 Methods
Assay # 580900 Tumor, Xenograft, Lung, A549 Cell
Severe Combined Immune Deficiency (SCID) male mice were used. Viable human lung
tumor cells (A549) at a size of 1.5 x 10⁷ cells in 0.2 ml were injected subcutaneously into the
dorsal side of the test animals. When the tumor grew and reached ≥ 5 mm in diameter
(designated as day 1), the tumor-bearing animals were divided into 14 groups (6 animals in
each group) for antitumor studies.
For the inhibition of tumor growth, when the A549 tumor grew to reach ≥ 5 mm, WLY-
WaispOH, WLYWac6OH, WLY-WaLP6OH and WLY-Wa4OH at 10, 3 and 1 mg/kg were
administered at 4-day interval by intraperitoneal injection for a total of 6 doses using the
dosing volume of 10 ml/kg.
Mitomycin at 2 mg/kg was given at 4-day interval for a total of 5 doses by IP injection.
The animals were observed for signs of overt toxicity after dosing. Body weight and tumor
size were measured and recorded every 4 days during the experiment period of 29 days.
Tumor weight (mg) was estimated according to the formula: length × (width)2 × 0.5 in
mm3, assuming its specific gravity to be 1. Tumor growth inhibition was calculated as T/C
(treatment/control) by the following formula:
T/C = (Tn – T1)/(Cn – C1) x 100%
If (Tn-T1) < 0, then
T/C = (Tn - T1)/T1 x 100%
C1 (Cn): Tumor weight of day 1 (day n) in the control group
T1 (Tn): Tumor weight of day 1 (day n) in the treated group
127

The result of T/C value ≤ 42% is considered significant antitumor activity.
6.7.3 Results and Discussion
In the xenograft model of human lung tumor cells (A549, ATCC CCL-185) in male
SCID mice, WLY-WaispOH, WLY-Wac6OH, WLY-WaLP6OH and WLY-Wa4OH at 10, 3
and 1 mg/kg were administered by intraperitoneal (IP) injection at 4-day interval (q4d) for a
total of 6 doses. The tumor size, body weight and signs of overt toxicity following test
compound dosing were monitored and recorded for the duration of the experiment (29 days).
Tumor growth inhibition was calculated as T/C (treatment/control) × 100%.
It appears that intraperitoneal administration of WLY-Wac6OH, WLY-WaLP6OH and
WLY-Wa4OH at 10, 3 and 1 mg/kg q4d for a total of 6 doses did not cause any significant
inhibition of tumor weight relative to the vehicle control during the experiment period of 29
days; WLY-WaispOH at 10 mg/kg, however, caused significant tumor inhibition on day 5
and moderate growth inhibition from day 9 to day 29 (the tumor growth data in terms of
percent tumor weight relative to the vehicle control group are shown Figure 6-13).
128

Figure 6-13. The tumor growth curves in SCID mice treated with WLY-WaispOH
Body weight and overt toxicity were monitored during the study. In comparison with
the vehicle-treated control group, WLY-WaispOH, WLY-Wac6OH, WLY-WaLP6OH and
WLY-Wa4OH at 10, 3 and 1 mg/kg were not associated with any changes in body weight
and overt toxicity (Figure 6-14).
129

Figure 6-14. The body weight curves in SCID mice treated with WLY-WaispOH, WLY-Wac6OH, WLY-WaLP6OH and WLY-Wa4OH
130

6.8 REFERENCES
1) The 60-cell line NCI test data, along with in vivo data can be accessed from the NSC numbers at the following Web site: http://dtp.nci.nih.gov/dtpstandard/dwindex/index.jsp
2) Ajay; Bemis, G. W.; Murcko, M. A. Designing libraries with CNS activity. J. Med. Chem. 1999, 42, 4942-4951.
3) Yazdanian, M.; Glynn, S. L.; Wright, J. L.; Hawi, A. Correlating partitioning and Caco-2 cell permeability of structurally diverse small molecular weight compounds. Pharm. Res. 1998, 9, 1490-1494.
4) Irvine, J. D.; Takahashi, L.; Lockhart, K. MDCK (Madin-Darby canine kidney) cells: a tool for membrane permeability screening. J. Pharm. Sci. 1999, 88, 28-33.
5) Saiakhov, R. D.; Stefan, L. R.; Klopman, G. Multiple computer-automated structure evaluation model of the plasma protein binding affinity of diverse drugs. Perspect. Drug Discov. Des. 2000, 19, 133-155
6) Bick, I. R. C.; Sinchai, W. In The Alkaloids, Chemistry and Pharmacology, Manske, R. H. F., Rodrigo, R. G. A, Eds.; Academic Press: New York, 1981; Vol 19, pp 193-220.
7) Donaldson, G. R.; Atkinson, M. R.; Murray, A. W. Inhibition of protein synthesis in Ehrlich ascites-tumour cells by the phenanthrene alkaloids tylophorine, tylocrebrine and cryptopleurine. Biochem. Biophys. Res. Commun. 1968, 31, 104-109.
8) Huang, M-T; Grollman, A. P. Mode of action of tylocrebrine: effects on protein and nucleic acid synthesis. Mol. Pharmacol. 1972, 8, 538-550.
9) Grant, P.; Sanchez, L.; Jimenez, A. Cryptopleurine resistance: genetic locus for a 40S ribosomal component in Saccharomyces cerevisiae. J. Bacteriol. 1974, 10, 1308-1314.
10) Gupta, R. S.; Krepensky, J. J.; Siminovitch, L. Structural determinants responsible for the biological activity of (-)-emetine, (-)-cryptopleurine, and (-)-tylocrebrine: structure-activity relationship among related compounds. Mol. Pharmacol. 1980, 18, 136-143.
11) Gupta R. S.; Siminovitch, L. Mutants of CHO cells resistant to the protein synthesis inhibitors, cryptopleurine and tylocrebrine: genetic and biochemical evidence for common site of action of emetine, cryptopleurine, tylocrebine, and tubulosine. Biochemistry 1997, 16, 3209-3214.
131

12) Rao, K. N.; Bhattachyarya, R. K.; Venkatachalam, S. R. Thymidylate synthase activity in leukocytes from patients with chronic myelocytic leukemia and acute lymphocytic leukemia and its inhibition by phenanthroindolizidine alkaloids pergularinine and tylophorinidine. Cancer Lett. 1998, 128, 183-188.
13) Rao, K. N.; Bhattachyarya, R. K.; Venkatachalam, S. R. Inhibition of thymidylate synthase and cell growth by the phenanthroindolizidine alkaloids pergularinine and tylophorinidine. Chem. Biol. Interact. 1997, 106, 201-212.
14) Rao, K. N.; Venkatachalam, S. R. Inhibition of dihydrofolate reductase and cell growth activity by the phenanthroindolizidine alkaloids pergularinine and tylophorinidine: the in vitro cytotoxicity of these plant alkaloids and their potential as antimicrobial and anticancer agents. Toxicol. In Vitro 2000, 14, 53-59.
15) Ganguly, T.; Khar, A. Induction of apoptosis in a human erythroleukemic cell line K562 by tylophora alkaloids involves release of cytochrome c and activation of caspase 3. Phytomedicine 2002, 9, 288-295.
16) Gao, W.; Lam, W.; Zhong, S.; Kaczmarek, C.; Baker, D. C.; Cheng, Y.-C. Novel mode of action of tylophorine analogs as antitumor compounds. Cancer Res. 2004, 64, 678-688.
17) Alley, M. C.; Scudiero, D. A.; Monks, P. A.; Hursey, M. L.; Czerwinski, M. J.; Fine, D. L.; Abbott, B. J.; Mayo, J. G.; Shoemaker, R. H.; Boyd, M. R. Feasibility of drug screening with panels of human tumor cell lines using a microculture tetrazolium assay. Cancer Res. 1988, 48, 589-601.
18) Grever, M. R.; Schepartz, S. A.; Chabner, B.A. The National Cancer Institute: Cancer Drug Discovery and Development Program. Seminars in Oncology, Vol. 19, No. 6, pp 622-638, 1992.
19) Boyd, M. R.; Paull, K. D. Some practical considerations and applications of the National Cancer Institute in vitro anticancer drug discovery screen. Drug Develop. Res. 1995, 34, 91-109.
20) Hansen, M. B.; Nielsen, S. E.; Berg, K. Re-examination and further development of a precise and rapid dye method for measuring cell growth/cell kill. J. Immunol. Methods 1989, 119, 203-210
21) Harrington, L. Biochemical aspects of telomerase function. Cancer Lett. 2003, 194, 139-154.
22) Keppler, B. R.; Jarstfer, M. B. Inhibition of telomerase activity by preventing proper assemblage. Biochemistry 2004, 43, 334-343.
23) Meyerson, M.; Counter, C. M.; Eaton, E. N.; Ellisen, L. W.; Steiner, P.; Caddle, S. D.; Ziaugra, L.; Beijersbergen, R. L.; Davidoff, M. J.; Liu, Q.; Bacchetti, S.; Haber, D. A.; Weinberg, R. A. HEST2, the putative human telomerase catalytic subunit
132
gene, is up-regulated in tumor cells and during immortalization. Cell 1997, 90, 785-795
24) Nakamura, T. M.; Morin, G. B.; Chapman, K. B.; Weinrich, S. L.; Andrews, W. H.; Lingner, J.; Harley, C. B.; Cech, T. R. Telomerase catalytic subunit homologs from fission yeast and human. Science 1997, 277, 955-959.
25) Feng, J.; Funk, W. D.; Wang, S. S.; Weinrich, S. L.; Avilion, A. A.; Chiu, C. P.; Adams, R. R.; Chang, E.; Allsopp, R. C.; Yu, J.; et al. The RNA component of human telomerase. Science 1995, 269, 1236-1241.
26) Kelleher, C.; Teixeira, M.T.; Forstemann, K.; Lingner, J. Telomerase: biochemical considerations for enzyme and substrate. Trends Biochem Sci 2002, 27, 572-579.
27) Cong, Y. S.; Wright, W. E.; Shay, J. W. Human telomerase and its regulation. Microbiol. Mol. Biol. Rev. 2002, 66, 407-425.
28) Maxam, A.M.; Gilbert, W. A new method for sequencing DNA. Proc. Natl. Acad. Sci. U.S.A. 1977, 74, 560-564.
133

7 CHAPTER VII. CONCLUSIONS AND FUTURE STUDIES
7.1 STRUCTURE ACTIVITY RELATIONSHIP
In this study, we have designed and synthesized new water-soluble phenanthrene-based
tylophorine derivatives (PBTs) as potential antitumor agents. These compounds contain a
core phenanthrene structure and can be synthesized efficiently in excellent yield. To obtain
structure-activity relationship (SAR) information, we carried out chemical modification on
nine different positions of the compound skeleton (Figure 7-1).
O
N
R4
OR1R2O
R36
9
3. C-6 Substituent
4. C-9 Linkage
5. C-9 Terminal substitutent
8. C-9 Side chain orientation
7. Stereochemistry of the 2’-substituent2. C-2, C-3 Substituent
1. Phenanthrene Skeleton
9. Nitrogen content
23
6. Length of C-9 side chain
Figure 7-1. SAR Study of PBTs
A total of more than 70 PBTs were synthesized and evaluated for cytotoxic activity
against the A549 human cancer cell line. Among them, N-(2,3-methylenedioxy-6-methoxy-
phenanthr-9-ylmethyl)-L-4-piperidinemethanol (1), N-(2,3-methylenedioxy-6-methoxy-

phenanthr-9-ylmethyl)-L-2-piperidinemethanol (2), N-(2,3-methylenedioxy-6-methoxy-
phenanthr-9-ylmethyl)-4-piperidineethanol (3) and N-(2,3-methylenedioxy-6-methoxy-
phenanthr-9-ylmethyl)-6-aminohexanol (4) (Figure 7-2) showed the highest potency with
EC50 values of 0.08, 0.16, 0.15 and 0.2 µM, respectively, which are comparable to those of
currently used antitumor drugs.
1 2
OO
MeO
N OH
OO
MeO
N
OH
OO
MeO
HN (CH2)5OH
OO
MeO
NOH
3 4
Figure 7-2. Structures of promising PBTs developed in the NPL
These four compounds incorporated all of the favorable modifications identified to date
in the preliminary SAR study. The favorable modifications for these novel PBTs are as
follows (Table 7-1). 1) A planar phenanthrene system is required, but not sufficient for
cytotoxic activity. 2) An N-hydrophilic substituent at the C-9 position is essential for
enhanced cytotoxicity and should be linked through a methylene rather than a carbonyl group.
3) This C-9 N-hydrophilic substituent is ideal for the introduction of a polar moiety. Analogs
containing terminal carboxylic acid or hydroxymethyl groups are more favorable than those
with methyl esters. 4) On the phenanthrene skeleton, a methoxy substituent best fits both the
steric and electronic requirements at the C-6 position and is preferred over benzyloxy and
hydroxy groups. 5) Adding a methylenedioxy ring at the 2, 3 position of the planar
phenanthrene system can dramatically enhance the cytotoxic activity and led to the most
potent derivatives.
135

Table 7-1. SAR of PBTs.
7.1.1 Position Number 7.1.2 SAR Result
1. Phenanthrene Skeleton A planar phenanthrene system is required, but not
sufficient for cytotoxic activity.
2. C-2, C-3 Substituent
Adding a methylenedioxy ring at the 2,3 position of
the planar phenanthrene system enhanced the
cytotoxic activity and led to the most potent
derivatives.
3. C-6 Substituent
A methoxy substituent best fits both the steric and
electronic requirements at the C-6 position and is
preferred over benzyloxy and hydroxy groups.
4. C-9 Linkage
An N-hydrophilic substituent at the C-9 position is
essential for the enhanced cytotoxicity and should be
linked through a methylene rather than a carbonyl
group.
5. C-9 Terminal Substitutent
C-9 N-hydrophilic substituent is ideal for the
introduction of a polar moiety. Analogs containing
terminal carboxylic acid or hydroxymethyl groups are
more favorable than those with methyl esters.
6. Length of C-9 Side Chain The distance between the nitrogen and terminal
substituent affected the potency; 6 carbon length is
136

the most favorable for the activity.
7. Stereochemistry of the 2’-
Substituent
2’S–substituted compounds showed equal or higher
cytotoxicity than R isomers.
8. C-9 Side Chain Orientation
The terminal hydroxyl/carboxylic acid in a para
position could favorably affect the activity compared
with other orientations.
9. Nitrogen Content The second nitrogen was tolerated; its presence
slightly decreased activity.
In summary, the new PBT derivatives possess a novel structure and showed remarkable
EC50 values in the sub-micromolar range, comparable with current front-line antineoplastic
drugs such as etoposide. These derivatives are the first reported water soluble tylophorine
derivatives with remarkable cytotoxic activity, in particular against multidrug-resistant
cancer cell lines, suggesting a great potential of developing this compound class into
antitumor agents to treat cancer (particularly for refractory cancer).
137

7.2 FUTURE STUDIES
7.2.1 Short total synthesis of phenanthroindolizidine alkaloids.
OR1R2O
CHO
COOH
R3O
OR1R2O
R3O
COOH
OR1R2O
R3O
N
O
a b c d
ea: Ac2O/Et3N b: EDC, HoBt /DMF c: LAH/THF d: CH3SO2Cl; NaH e: VOF3, TFA / DCM
MeOOC
OR1R2O
R3O
N
OR1R2O
R3O
N
OH
OR1R2O
R3O
N
1
2
3 4 5 6
7
Scheme 7-1. Short total synthesis of antofine
OO
OMe
N
OH
OO
OMe
N
O MsO
O
O+
Me
N
HMsCl
NaH OO
OMe
N
OO
O+
Me
N
H NaH
pyridine DMF
Scheme 7-2. Base-induced cyclization Russel and Hunziker proposed a base-promoted ring closure in the total synthesis of
septicine.1 Using this methodology in step d of Scheme 7-1 allows a modified total synthesis
of the phenanthroindolizidine ring. The target compound will be accessed in five steps,
which should be the shortest synthetic route reported to date. This synthetic route avoids an
unstable ketone intermediate by using an intramolecular based-induced cyclization of amino
alcohols. In addition to the base-induced cyclization, a Lewis acid mediated Friedel-Crafts
type cyclization was also reported (Scheme 7-2).2 Several bases or Lewis acid will be
examined for this step.
138

7.2.2 Parallel Synthesis of PBTs
A general method of rapidly preparing PBT analogs would be advantageous and merits
investigation for drug discovery. Meanwhile, parallel synthesis of small organic molecules
has emerged as an important technology, enabling chemists to synthesize numerous
pharmaceutically interesting compounds.3 The relative ease of automation, along with a
multiple parallel synthesis strategy, has greatly supported the growing needs for identifying
novel biologically active lead compounds and accelerated structure-activity relationship
studies in drug discovery.
We will apply parallel synthesis of new PBTs using an active ester resin4 procedure.
The synthetic route is described in Scheme 7-3.
OO
MeO
COOHPS-HOBt(HL)+
DMAP
OO
MeO
O
O
Active Ester Resin
Parallel Reaction Formate
Discrete Amide Products
BMS/ THF
OO
MeO
R
R1NH2
R2NH2
R3NH2
Scheme 7-3. Parallel synthesis of PBTs General Procedure
Formation of active ester:
1.5 equiv of carboxylic acid, 4.5 equiv of DIC, 0.6 equiv of DMAP, and a 4:1
DCM/DMF solvent mixture at room temperature for 2–3 h. Order of addition proved to be
an important variable: DMAP and the carboxylic acid were mixed with PS-HOBt(HL),
139

followed by addition of DIC. The purpose of including DMF as a cosolvent is to improve the
solubility of the carboxylic acid component. It is preferable to keep the DMF composition in
the reaction mixture to a minimum (< 20%), since it compromises the level of active ester
formation. If more DMF is required to dissolve the carboxylic acid, up to 50% DMF can be
used; however, the loading level will be reduced.
Amide synthesis
To 1.5 equiv of PS-HOBt(HL) active ester resin was added a mixture of 0.7 equiv of
amine and 1.0 equiv of DIEA in DCM or THF and the mixture was stirred at 25 °C for 3 h.
The solution was filtered, and the resin rinsed with DCM or THF (3 ×). The combined
filtrate was concentrated to afford the desired amide.
7.2.3 Making Organic/inorganic Salt
In the multi-cancer cell assay study, the corresponding HCl salt of the active free base
showed better water solubility, while still retaining similar cytotoxic activity. Making
organic/inorganic salt is a very useful way to improve a compound’s pharmacological
properties. Thus, we continue to prepare the pharmaceutically acceptable salts of active
compounds. Pharmaceutically acceptable salts are salts that retain the desired biological
activity of the parent compound and do not impart undesired toxicological effects. Examples
of such salts are (a) acid addition salts formed with inorganic acids, such as hydrochloric acid,
hydrobromic acid, sulfuric acid, phosphoric acid, nitric acid and the like; and salts formed
with organic acids, such as acetic acid, oxalic acid, tartaric acid, succinic acid, maleic acid,
fumaric acid, gluconic acid, citric acid, malic acid, ascorbic acid, benzoic acid, tannic acid,
palmitic acid, alginic acid, polyglutamic acid, naphthalenesulfonic acid, methanesulfonic
140

acid, p-toluenesulfonic acid, naphthalenedisulfonic acid, polygalacturonic acid, and the like;
and (b) salts formed from elemental anions such as chlorine, bromine, and iodine.
7.2.4 Design of Bioisosteric Skeleton Modification
Bioisosteric modification may profoundly affect pharmacological action, metabolism
activity, and toxicity. This basic principle of analog design has been successfully applied in
many natural product modifications. Therefore, we will apply this approach in new PBTs
development. The general molecular formulas of new PBTs are shown in Figure 7-3 and
these compounds should be efficiently synthesized by our general procedure in chapter III or
parallel synthesis mentioned in section 7.2.2.
R2
NX
Y
N ∗
∗
X
Y
N
∗
N
X Y
N
∗
R5
XR4NH
∗XR4
R5
N
R5
XR4
OO
R1
R1= 6-methoxyl; 5,6-ethylenedioxyl; 6,7-methylenedioxy
O
O
R2
R1
R1= 2,3-dimethoxyl; 3-methoxyl
R2
XR4
X= N,O; Y= O, S;n= 1-7;R4= H, Alkyl, Substituted alkyl;R5= H, Hydroxy, Alkyloxy, Amino group, Aminoalkyls;* : Chiral Center, R,S, or RS mix
nn nn
NX
YN ∗
∗
X
Y
N ∗
∗X
Y
N ∗
∗X
Y
NX
Y
Figure 7-3. Structure Formulas of New PBTs
141

7.2.5 Mechanism of Action Study
The biological target of PBTs is still unknown and the mechanism of action of PBTs has
not been elucidated. The preliminary results have shown that PBTs are a unique class of
antitumor compounds that may have a mode of action different from known antitumor drugs.
The active PBTs will be screened against several interesting cancer-related targets, such as
NFҝB, topoisomerase, etc. It would be helpful to assign a putative mechanism of action and
identify a specific molecular target with which PBTs are most likely to interact. More cancer
cell lines will be used to characterize selective growth inhibition or cell killing of particular
tumor cell lines. The further screening of PBTs will facilitate the understanding of SAR and
provide more rationale to design a more potent compound targeting wild/resistant cancer
cells.
7.2.6 QSAR study and Database Mining
The approach applied herein to QSAR modeling of PBTs does not stop since more new
PBTs will come into the database and more pharmacological datasets will be available for
screening. Our approach places the emphasis of the entire QSAR modeling study on making
reliable predictions of chemical structures expected to have the desired biological activity,
rather than on respectable statistical characteristics of (training set) models. These predicted
structures either are already available in existing chemical databases or are synthetically
feasible (i.e., included in virtual combinatorial chemical libraries, which can also be mined
with QSAR models). The focus of the modeling will be brought closer to the needs of
medicinal chemists who both supply computational chemists with experimental structure-
activity data and expect novel structures rather than equations and statistical parameters in
142

return. We believe that this approach will bring QSAR modeling in tune with the ultimate
needs of our interest in new plant-derived anti tumor agents.
143

7.3 REFERENCES
1) Russel, J. H.; Hunziker, H. Synthesis of septicine. Tetrahedron Lett. 1969, 10, 4035-4036.
2) Chandrasekhar, S.; Reddy, N. R.; Reddy, M. V.; Jagannadh, B.; Nagaraju, A.; Ravi Sankar, A.; Kunwar, A. C. Highly efficient synthesis of 3-alkyl/aryl-4-aryl-1,2,3,4-tetrahydroisoquinolines from N,N-dibenzylaminols. Tetrahedron Lett. 2002, 43, 1885-1888.
3) Balkenhohl, F.; Bussche-Hunnefeld, C.; Lansky, A.; Zechel, C. Combinatorial synthesis of small organic molecules. Angew. Chem., Int. Ed. Engl. 1996, 35, 2288-2337. (b) Baldwin, J. J.; Henderson, I. Recent advances in the generation of small-molecule combinatorial libraries: encoded split synthesis and solid-phase synthetic methodology Med. Res. Rev. 1996, 16, 391-405. (c) Thompson, L. A.; Ellman, J. A. Synthesis and applications of small molecule libraries. Chem. Rev. 1996, 96, 555-600. (d) Creswell, M. W.; Bolton, G. L.; Hodges, J. C.; Meppen, M. Combinatorial synthesis of dihydropyridone libraries and their derivatives. Tetrahedron 1998, 54, 3983-3998.
4) For the Resin Selection: www.argotech.com.
144