Segmentation of 4D Echocardiography Using Stochastic Online Dictionary Learning

Molecules 2012, 17, 7415-7439; doi:10.3390/molecules17067415
molecules ISSN 1420-3049
www.mdpi.com/journal/molecules
Article
Application of 4D-QSAR Studies to a Series of Raloxifene Analogs and Design of Potential Selective Estrogen Receptor Modulators
Ana Carolina Rennó Sodero 1,2,*, Nelilma Correia Romeiro 1,3, Elaine Fontes Ferreira da Cunha 4,
Uiaran de Oliveira Magalhães 2,5, Ricardo Bicca de Alencastro 1, Carlos Rangel Rodrigues 2,
Lúcio Mendes Cabral 5, Helena Carla Castro 6 and Magaly Girão Albuquerque 1,*
1 Laboratory of Molecular Modeling (LabMMol), Program of Post-Graduation in Chemistry (PPGQu),
Institute of Chemistry, Federal University of Rio de Janeiro (Universidade Federal do Rio de
Janeiro, UFRJ), Rio de Janeiro 21949-900, RJ, Brazil 2 Laboratory of Molecular Modeling & QSAR-3D (ModMolQSAR), Faculty of Pharmacy, UFRJ,
Rio de Janeiro 21941-599, RJ, Brazil 3 UFRJ, Campus UFRJ-Macaé, Macaé 27901-000, RJ, Brazil 4 Department of Chemistry, Federal University of Lavras (Universidade Federal de Lavras, UFLA),
University Campus, Lavras 37200-000, MG, Brazil 5 Laboratory of Industrial Pharmaceutical Technology (LabTIF), Faculty of Pharmacy, UFRJ,
Rio de Janeiro 21941-590, RJ, Brazil 6 Laboratory of Antibiotics, Biochemistry, Education and Molecular Modeling (LABiEMol),
Institute of Biology (IB), Fluminense Federal University (Universidade Federal Fluminense, UFF),
Campus of Valonguinho, Niterói 24210-130, RJ, Brazil
* Authors to whom correspondence should be addressed; E-Mails: [email protected] (A.C.R.S.);
[email protected] (M.G.A.); Tel.: +55-21-2562-7132 (M.G.A.).
Received: 12 April 2012; in revised form: 4 June 2012 / Accepted: 5 June 2012 /
Published: 15 June 2012
Abstract: Four-dimensional quantitative structure-activity relationship (4D-QSAR)
analysis was applied on a series of 54 2-arylbenzothiophene derivatives, synthesized by
Grese and coworkers, based on raloxifene (an estrogen receptor-alpha antagonist), and
evaluated as ER ligands and as inhibitors of estrogen-stimulated proliferation of MCF-7
breast cancer cells. The conformations of each analogue, sampled from a molecular
dynamics simulation, were placed in a grid cell lattice according to three trial alignments,
considering two grid cell sizes (1.0 and 2.0 Å). The QSAR equations, generated by a
combined scheme of genetic algorithms (GA) and partial least squares (PLS) regression,
OPEN ACCESS
Molecules 2012, 17 7416
were evaluated by “leave-one-out” cross-validation, using a training set of 41 compounds.
External validation was performed using a test set of 13 compounds. The obtained
4D-QSAR models are in agreement with the proposed mechanism of action for raloxifene.
This study allowed a quantitative prediction of compounds’ potency and supported the
design of new raloxifene analogs.
Keywords: four dimensional quantitative structure-activity relationship (4D-QSAR);
ligand based drug design (LBDD); molecular modeling; estrogen receptor alpha (ER);
estrogen receptor beta (ER); selective estrogen receptor modulator (SERM); raloxifene;
ligand binding domain (LBD)
1. Introduction
Estrogens (e.g., 17β-estradiol, I, Figure 1) are steroid hormones, synthesized from cholesterol [1],
that play a major role in female reproductive function and in cardiovascular and central nervous
systems [2]. Estrogenic responses are mediated by specific nuclear receptors named Estrogen
Receptors (ERs), which exist in two subtypes: Estrogen Receptor alpha (ER) and Estrogen Receptor
beta (ERβ). Hormone binding to ERs induces the activation or repression of genes [3].
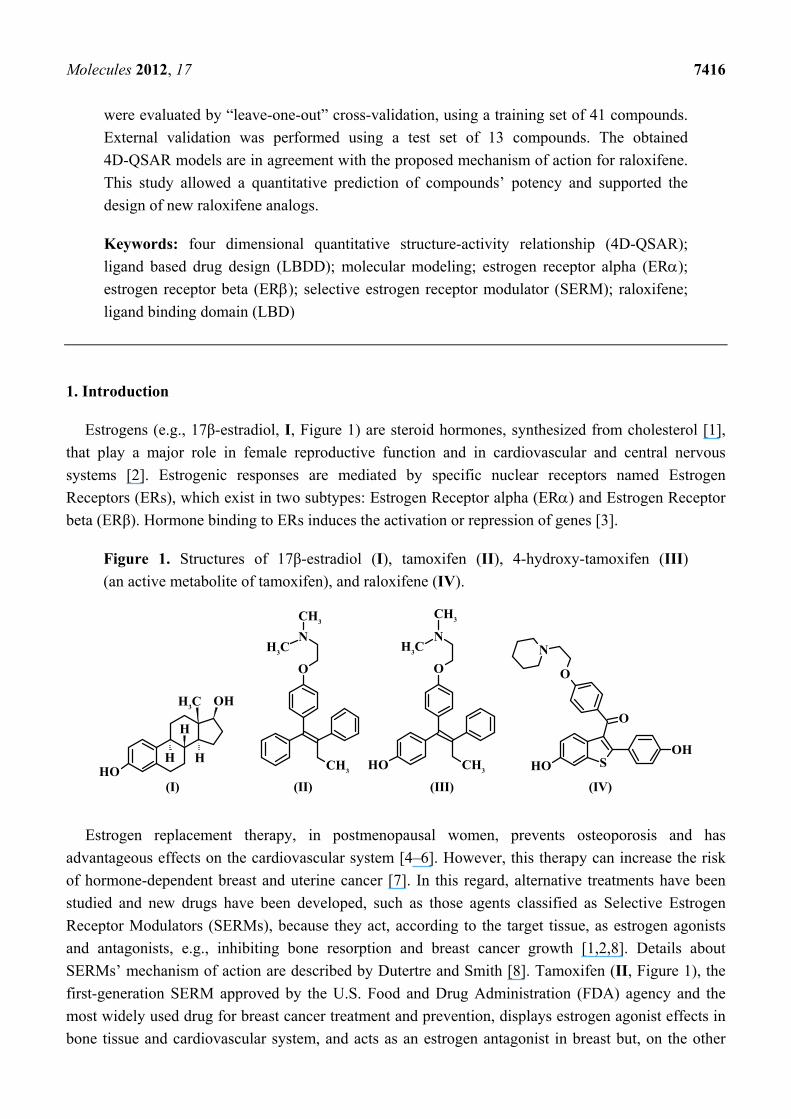
Figure 1. Structures of 17β-estradiol (I), tamoxifen (II), 4-hydroxy-tamoxifen (III)
(an active metabolite of tamoxifen), and raloxifene (IV).
CH3OH
H
HHOH CH3
O
N
CH3
CH3
CH3
O
N
CH3
CH3
OH S
O
O
N
OHOH
(I) (II) (III) (IV)
Estrogen replacement therapy, in postmenopausal women, prevents osteoporosis and has
advantageous effects on the cardiovascular system [4–6]. However, this therapy can increase the risk
of hormone-dependent breast and uterine cancer [7]. In this regard, alternative treatments have been
studied and new drugs have been developed, such as those agents classified as Selective Estrogen
Receptor Modulators (SERMs), because they act, according to the target tissue, as estrogen agonists
and antagonists, e.g., inhibiting bone resorption and breast cancer growth [1,2,8]. Details about
SERMs’ mechanism of action are described by Dutertre and Smith [8]. Tamoxifen (II, Figure 1), the
first-generation SERM approved by the U.S. Food and Drug Administration (FDA) agency and the
most widely used drug for breast cancer treatment and prevention, displays estrogen agonist effects in
bone tissue and cardiovascular system, and acts as an estrogen antagonist in breast but, on the other

Molecules 2012, 17 7417
hand, it manifests partial estrogen agonist activity in the uterus [1,9,10]. Tamoxifen is mainly
metabolized to 4-hydroxytamoxifen (III, Figure 1), an active metabolite, which has greater ER affinity
than the parent drug [4]. Raloxifene (IV, Figure 1), a second-generation SERM approved by the FDA
agency for prevention of osteoporosis in postmenopausal women, is distinguished from tamoxifen by
its lack of proliferative effects in uterine tissue [11,12] and is being evaluated to treat and prevent
breast cancer, osteoporosis, and cardiovascular diseases [13,14].
Grese and co-workers [11] described four important structural features of raloxifene when
compared to tamoxifen and 4-hydroxytamoxifen (Figure 1): (i) the two phenolic hydroxyl groups;
(ii) different substituents on the basic aliphatic amine group; (iii) incorporation of the stilbene moiety
into the 2-phenyl-1-benzothiophene framework; and (iv) the carbonyl “hinge” between the side chain
containing the basic aliphatic amine and the benzothiophene aromatic ring. These structural elements
give raloxifene a distinct molecular conformation, which may affect the conformation of the raloxifene-ER
complex, probably being responsible for the unique tissue selectivity observed for this compound.
The crystal structures of ER in complex with 17-estradiol (the endogenous estrogen) and
raloxifene [3] are available in the Protein Data Bank (PDB) [15]. These crystallographic structures
show that raloxifene (PDB code: 1ERR) binds at the ligand binding domain (LBD), i.e., the same
binding site of estradiol (PDB code: 1ERE) (Figure 2) [3]. Raloxifene is anchored to the LBD of ER
by a direct hydrogen-bonding network comprising (Figure 2): the nitrogen atom (feature II, Figure 1)
of the piperidine ring with Asp351; the phenolic hydroxyl group (feature Ia) with Glu353 and Arg394;
and the phenolic hydroxyl group (feature Ib) with the imidazole nitrogen atom of His524 [3].
Figure 2. Schematic representation of the X-ray complex formed by the LBD of ER
with: (a) estradiol (PDB code: 1ERE) and (b) raloxifene (PDB code: 1ERR).
The side chain of raloxifene makes extensive hydrophobic interactions, but it is too long (over 11 Å)
to be contained within the confines of the binding cavity. Therefore, the piperidine moiety displaces
helix H12 and protrudes out of the pocket between helices H3 and H11 (Figure 2). Brzozowski and
co-workers [3] argue that the antagonistic response of raloxifene is based on its ability to prevent the
formation of an active conformation of the raloxifene-ER complex, which is dependent on H12.
Based on the structure of raloxifene, Grese and coworkers [16] synthesized and evaluated a series
of 2-arylbenzothiophene derivatives as ligands of the ER and as inhibitors of the MCF-7 breast
Molecules 2012, 17 7418
cancer cell proliferation in vitro. In the current work, we developed four-dimensional quantitative
structure-activity relationship (4D-QSAR) [17–21] models for this series of 2-arylbenzothiophene
derivatives, in order to better understand the mechanism of action of this class of compounds and to
design new raloxifene analogs as potential selective estrogen receptor modulators.
2. Results and Discussion
2.1. Grid Cell Size and Alignment Evaluation
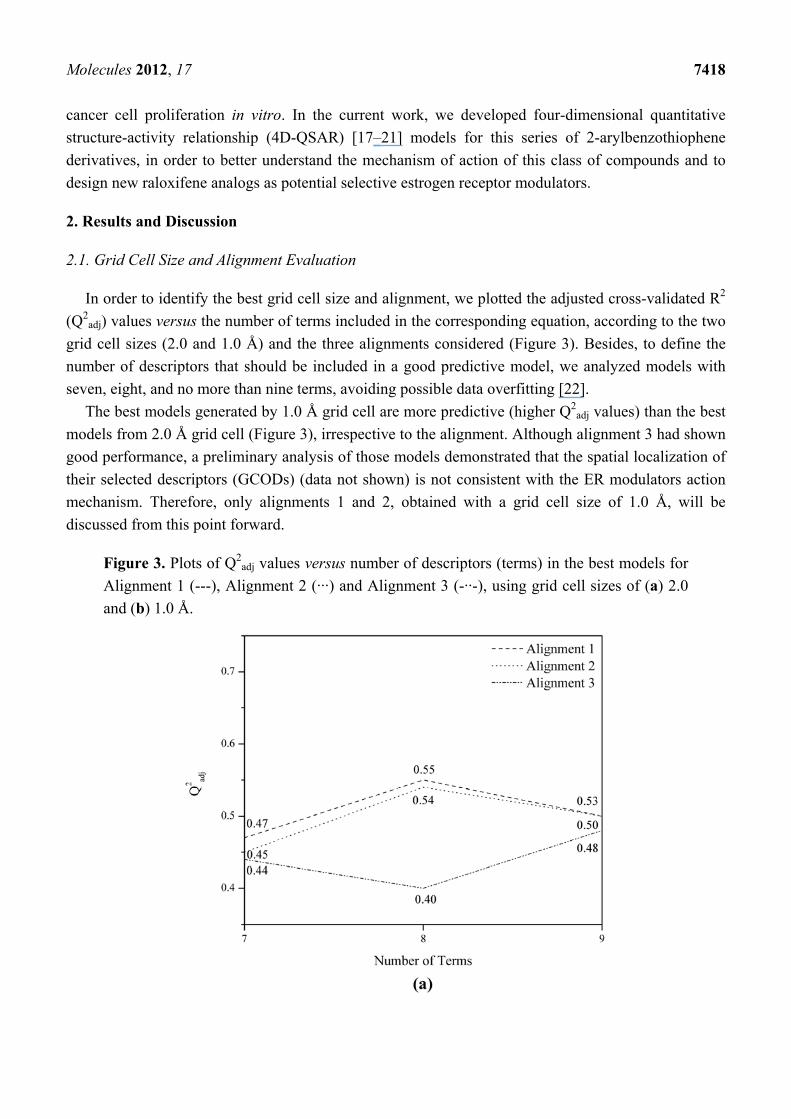
In order to identify the best grid cell size and alignment, we plotted the adjusted cross-validated R2
(Q2adj) values versus the number of terms included in the corresponding equation, according to the two
grid cell sizes (2.0 and 1.0 Å) and the three alignments considered (Figure 3). Besides, to define the
number of descriptors that should be included in a good predictive model, we analyzed models with
seven, eight, and no more than nine terms, avoiding possible data overfitting [22].
The best models generated by 1.0 Å grid cell are more predictive (higher Q2adj values) than the best
models from 2.0 Å grid cell (Figure 3), irrespective to the alignment. Although alignment 3 had shown
good performance, a preliminary analysis of those models demonstrated that the spatial localization of
their selected descriptors (GCODs) (data not shown) is not consistent with the ER modulators action
mechanism. Therefore, only alignments 1 and 2, obtained with a grid cell size of 1.0 Å, will be
discussed from this point forward.
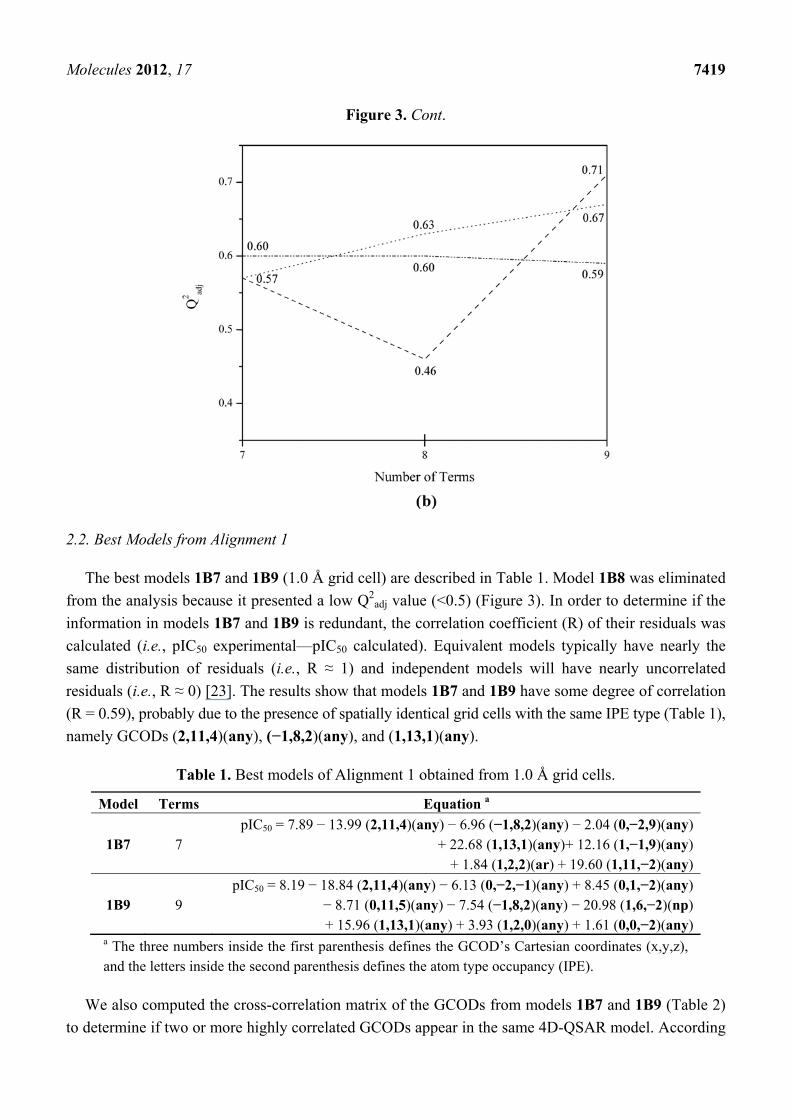
Figure 3. Plots of Q2adj values versus number of descriptors (terms) in the best models for
Alignment 1 (---), Alignment 2 (···) and Alignment 3 (-··-), using grid cell sizes of (a) 2.0
and (b) 1.0 Å.
Molecules 2012, 17 7419
Figure 3. Cont.
2.2. Best Models from Alignment 1
The best models 1B7 and 1B9 (1.0 Å grid cell) are described in Table 1. Model 1B8 was eliminated
from the analysis because it presented a low Q2adj value (<0.5) (Figure 3). In order to determine if the
information in models 1B7 and 1B9 is redundant, the correlation coefficient (R) of their residuals was
calculated (i.e., pIC50 experimental—pIC50 calculated). Equivalent models typically have nearly the
same distribution of residuals (i.e., R ≈ 1) and independent models will have nearly uncorrelated
residuals (i.e., R ≈ 0) [23]. The results show that models 1B7 and 1B9 have some degree of correlation
(R = 0.59), probably due to the presence of spatially identical grid cells with the same IPE type (Table 1),
namely GCODs (2,11,4)(any), (−1,8,2)(any), and (1,13,1)(any).
Table 1. Best models of Alignment 1 obtained from 1.0 Å grid cells.
Model Terms Equation a
1B7 7 pIC50 = 7.89 − 13.99 (2,11,4)(any) − 6.96 (−1,8,2)(any) − 2.04 (0,−2,9)(any)
+ 22.68 (1,13,1)(any)+ 12.16 (1,−1,9)(any) + 1.84 (1,2,2)(ar) + 19.60 (1,11,−2)(any)
1B9 9 pIC50 = 8.19 − 18.84 (2,11,4)(any) − 6.13 (0,−2,−1)(any) + 8.45 (0,1,−2)(any)
− 8.71 (0,11,5)(any) − 7.54 (−1,8,2)(any) − 20.98 (1,6,−2)(np) + 15.96 (1,13,1)(any) + 3.93 (1,2,0)(any) + 1.61 (0,0,−2)(any)
a The three numbers inside the first parenthesis defines the GCOD’s Cartesian coordinates (x,y,z), and the letters inside the second parenthesis defines the atom type occupancy (IPE).
We also computed the cross-correlation matrix of the GCODs from models 1B7 and 1B9 (Table 2)
to determine if two or more highly correlated GCODs appear in the same 4D-QSAR model. According

Molecules 2012, 17 7420
to Table 2, except only for two pairs of cells, the other pairs of descriptors are poorly correlated
(R < 0.5). This means that each of these descriptors contributes in different ways to the 4D-QSAR
models [22]. The highest correlations occur between the pair of GCODs (−1,8,2)(any) and
(1,13,1)(any) (R = 0.52) and also between the pair of GCODs (0,−2,−1)(any) and (0,1,−2)(any)
(R = 0.47). The first pair of GCODs may be found in both models (1B7 and 1B9), while the second
pair is found only in model 1B9.
Table 2. Cross-correlation matrix of the GCODs and the experimental pIC50 values of
models 1B7 and 1B9.
Potency (2,11,4) (any)
(0,−2,−1) (any)
(0,1,−2) (any)
(0,11,5) (any)
(−1,8,2) (any)
(1,6,−2) (np)
Potency 1.00 (2,11,4) (any)
−0.46 1.00
(0,−2,−1) (any)
−0.31 0.13 1.00
(0,1,−2) (any)
−0.26 0.36 0.47 1.00
(0,11,5) (any)
−0.35 0.30 0.01 0.13 1.00
(−1,8,2) (any)
−0.27 0.20 0.10 0.12 −0.17 1.00
(1,6,−2) (np)
−0.21 −0.21 −0.07 −0.13 −0.21 0.06 1.00
(1,13,1) (any)
0.12 0.13 0.00 −0.07 −0.37 0.52 0.01
(1,2,0) (any)
0.36 −0.01 0.18 0.18 −0.16 0.22 0.11
(0,0,−2) (any)
0.43 −0.31 0.26 −0.19 0.01 −0.11 0.07
(0,−2,9) (any)
−0.30 0.05 0.20 0.16 −0.29 0.18 −0.05
(1,−1,9) (any)
0.36 −0.26 −0.11 −0.08 −0.11 −0.09 0.06
(1,2,2) (ar)
0.33 −0.18 -0.27 0.21 0.14 −0.16 −0.09
(1,11,−2) (any)
0.60 −0.24 −0.10 −0.17 −0.41 −0.06 −0.27
(1,13,1) (any)
(1,2,0) (any)
(0,0,−2) (any)
(0,−2,9) (any)
(1,−1,9) (any)
(1,2,2) (ar)
(1,11,−2) (any)
(1,13,1) (any)
1.00
(1,2,0) (any)
0.10 1.00
(0,0,−2) (any)
−0.13 0.28 1.00
Molecules 2012, 17 7421
Table 2. Cont.
(1,13,1) (any)
(1,2,0) (any)
(0,0,−2) (any)
(0,−2,9) (any)
(1,−1,9) (any)
(1,2,2) (ar)
(1,11,−2) (any)
(0,−2,9) (any)
0.12 −0.11 −0.35 1.00
(1,−1,9) (any)
−0.27 0.41 0.35 −0.23 1.00
(1,2,2) (ar)
−0.17 0.34 0.06 −0.18 0.35 1.00
(1,11,−2) (any)
0.06 0.08 0.31 0.07 0.02 −0.08 1.00
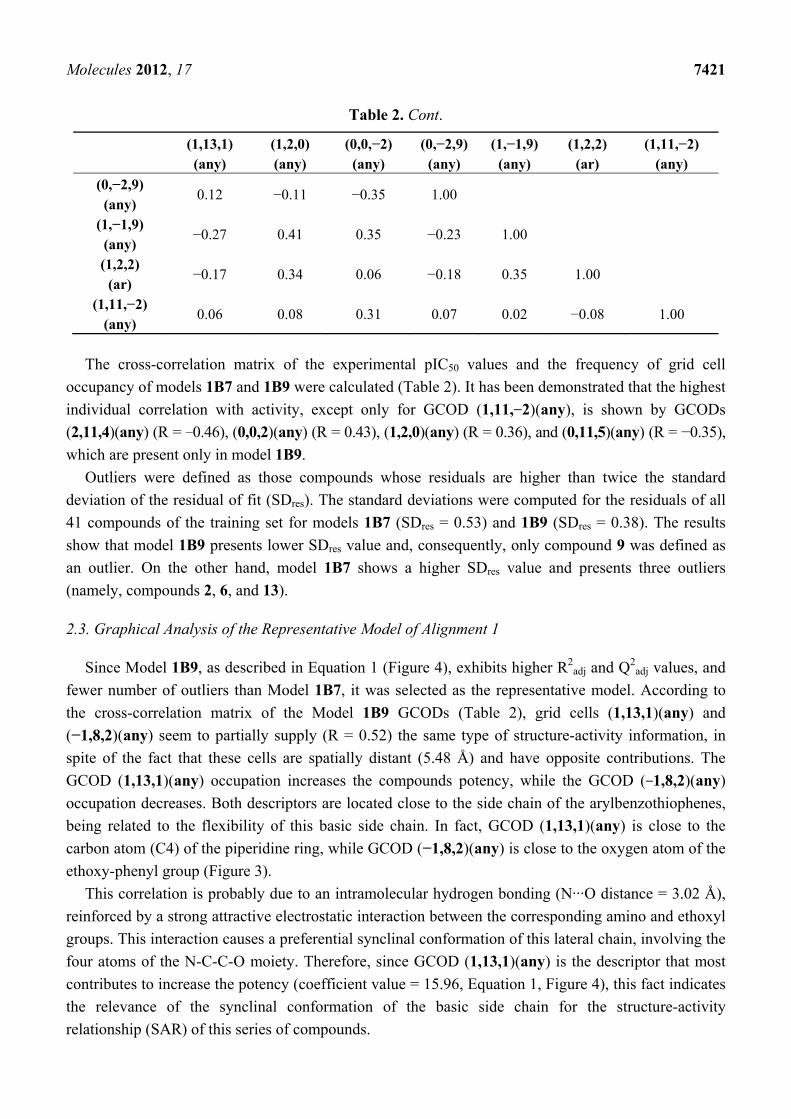
The cross-correlation matrix of the experimental pIC50 values and the frequency of grid cell
occupancy of models 1B7 and 1B9 were calculated (Table 2). It has been demonstrated that the highest
individual correlation with activity, except only for GCOD (1,11,−2)(any), is shown by GCODs
(2,11,4)(any) (R = −0.46), (0,0,2)(any) (R = 0.43), (1,2,0)(any) (R = 0.36), and (0,11,5)(any) (R = −0.35),
which are present only in model 1B9.
Outliers were defined as those compounds whose residuals are higher than twice the standard
deviation of the residual of fit (SDres). The standard deviations were computed for the residuals of all
41 compounds of the training set for models 1B7 (SDres = 0.53) and 1B9 (SDres = 0.38). The results
show that model 1B9 presents lower SDres value and, consequently, only compound 9 was defined as
an outlier. On the other hand, model 1B7 shows a higher SDres value and presents three outliers
(namely, compounds 2, 6, and 13).
2.3. Graphical Analysis of the Representative Model of Alignment 1
Since Model 1B9, as described in Equation 1 (Figure 4), exhibits higher R2adj and Q2
adj values, and
fewer number of outliers than Model 1B7, it was selected as the representative model. According to
the cross-correlation matrix of the Model 1B9 GCODs (Table 2), grid cells (1,13,1)(any) and
(−1,8,2)(any) seem to partially supply (R = 0.52) the same type of structure-activity information, in
spite of the fact that these cells are spatially distant (5.48 Å) and have opposite contributions. The
GCOD (1,13,1)(any) occupation increases the compounds potency, while the GCOD (−1,8,2)(any)
occupation decreases. Both descriptors are located close to the side chain of the arylbenzothiophenes,
being related to the flexibility of this basic side chain. In fact, GCOD (1,13,1)(any) is close to the
carbon atom (C4) of the piperidine ring, while GCOD (−1,8,2)(any) is close to the oxygen atom of the
ethoxy-phenyl group (Figure 3).
This correlation is probably due to an intramolecular hydrogen bonding (N···O distance = 3.02 Å),
reinforced by a strong attractive electrostatic interaction between the corresponding amino and ethoxyl
groups. This interaction causes a preferential synclinal conformation of this lateral chain, involving the
four atoms of the N-C-C-O moiety. Therefore, since GCOD (1,13,1)(any) is the descriptor that most
contributes to increase the potency (coefficient value = 15.96, Equation 1, Figure 4), this fact indicates
the relevance of the synclinal conformation of the basic side chain for the structure-activity
relationship (SAR) of this series of compounds.
Molecules 2012, 17 7422
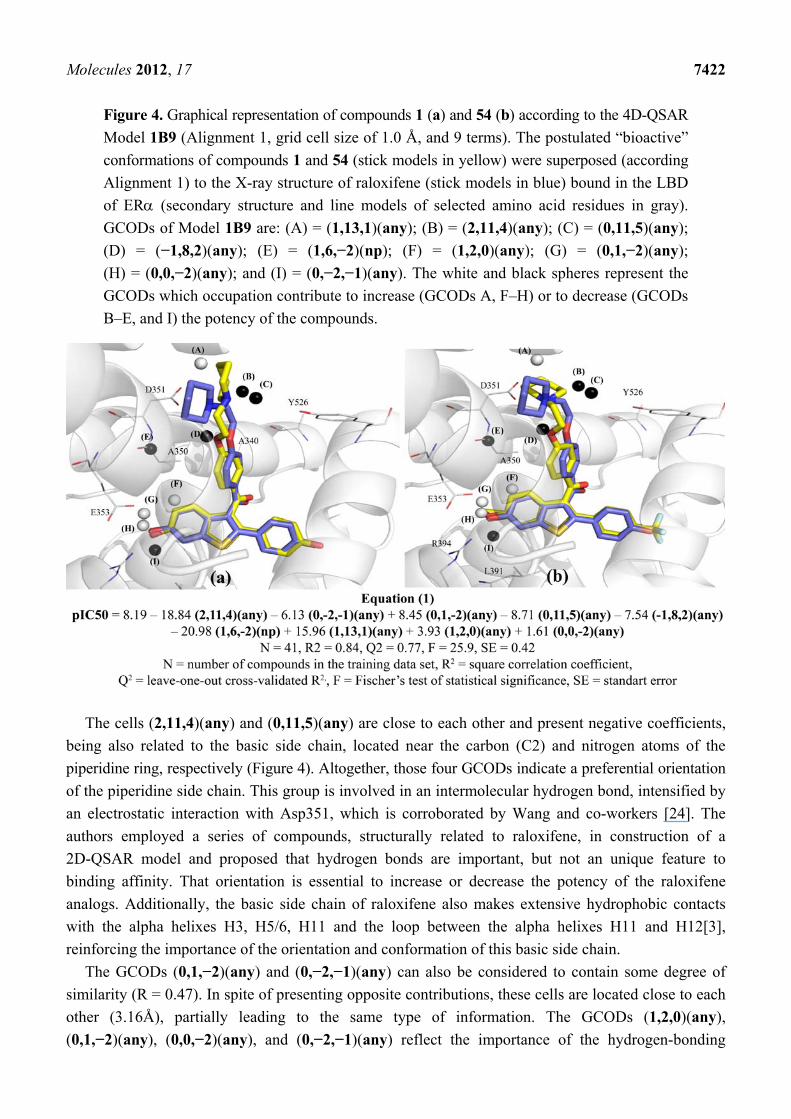
Figure 4. Graphical representation of compounds 1 (a) and 54 (b) according to the 4D-QSAR
Model 1B9 (Alignment 1, grid cell size of 1.0 Å, and 9 terms). The postulated “bioactive”
conformations of compounds 1 and 54 (stick models in yellow) were superposed (according
Alignment 1) to the X-ray structure of raloxifene (stick models in blue) bound in the LBD
of ER (secondary structure and line models of selected amino acid residues in gray).
GCODs of Model 1B9 are: (A) = (1,13,1)(any); (B) = (2,11,4)(any); (C) = (0,11,5)(any);
(D) = (−1,8,2)(any); (E) = (1,6,−2)(np); (F) = (1,2,0)(any); (G) = (0,1,−2)(any);
(H) = (0,0,−2)(any); and (I) = (0,−2,−1)(any). The white and black spheres represent the
GCODs which occupation contribute to increase (GCODs A, F–H) or to decrease (GCODs
B–E, and I) the potency of the compounds.
The cells (2,11,4)(any) and (0,11,5)(any) are close to each other and present negative coefficients,
being also related to the basic side chain, located near the carbon (C2) and nitrogen atoms of the
piperidine ring, respectively (Figure 4). Altogether, those four GCODs indicate a preferential orientation
of the piperidine side chain. This group is involved in an intermolecular hydrogen bond, intensified by
an electrostatic interaction with Asp351, which is corroborated by Wang and co-workers [24]. The
authors employed a series of compounds, structurally related to raloxifene, in construction of a
2D-QSAR model and proposed that hydrogen bonds are important, but not an unique feature to
binding affinity. That orientation is essential to increase or decrease the potency of the raloxifene
analogs. Additionally, the basic side chain of raloxifene also makes extensive hydrophobic contacts
with the alpha helixes H3, H5/6, H11 and the loop between the alpha helixes H11 and H12[3],
reinforcing the importance of the orientation and conformation of this basic side chain.
The GCODs (0,1,−2)(any) and (0,−2,−1)(any) can also be considered to contain some degree of
similarity (R = 0.47). In spite of presenting opposite contributions, these cells are located close to each
other (3.16Å), partially leading to the same type of information. The GCODs (1,2,0)(any),
(0,1,−2)(any), (0,0,−2)(any), and (0,−2,−1)(any) reflect the importance of the hydrogen-bonding
Molecules 2012, 17 7423
network close to the benzothiophenyl moiety for the antagonist activity of the ER ligands. In fact, the
cell (0,0,−2)(any) is directly related to the hydrogen bonding interactions of the 6-OH group of the
benzothiophene ring with Glu353 and Arg394, as described in previous SAR studies [3,11,16,25]. The
occupation of this cell is drastically reduced when this position is non-substituted, or the substituents
are unable to perform those hydrogen bond interactions (e.g., 23, 30, 31, 35, 38, and 41). The same
happens with GCOD (0,1,−2)(any), since compounds with hydrogen bond acceptor substituents at
C6-position have a high frequency of occupation (e.g., 37, 49, and 50).
The X-ray crystal structure of the raloxifene-ER complex shows the benzothiophene ring of raloxifene
surrounded by hydrophobic residues, such as Leu349, Ala350, Leu387, Leu391 and Phe404 [3].
Therefore, the occupation by any atom types in grid cell (0,−2,−1) decreases the potency of the
compounds due to steric factors. This can be explained by the fact that compounds with bulky
substituents, such as methoxyl or acetyl groups (e.g., 21, 28, 37, 39, 43, 47, 49, and 52), have a greater
occupation frequency than compounds with less bulky substituents (e.g., 19, 23, 30, and 38). In
addition, these substituents are not able to perform hydrogen bonding interactions with Glu353 and
Arg394 or they can sterically impair these interactions.
Finally, the GCOD (1,6,−2)(np) (Figure 4) is located in a 3D-box area that corresponds to the
Ala350 residue. The negative coefficient of this GCOD (Figure 4) indicates that the occupation of this
cell by non-polar atoms reduces the compound potency, probably due to steric factors. Although
Figure 4 does not show clearly any atom of the ligands around this cell, some conformations and
orientations adopted by the compounds during the MDS (data not shown) enable the carbon and
hydrogen atoms of the piperidine ring to occupy this grid cell. It is important to notice that Figure 4
shows only one conformation, selected as the “bioactive” one, among the 2,000 conformers from the
MDS of each compound, which leads to maximum potency according to Model 1B9. In fact
compounds with substituents at position 2' of the phenyl ring have low occupation frequency (e.g., 3,
7, 8, and 16), as well as compounds with substituents at positions 4 and 5 of the benzothiophene ring
(e.g., 13, 29, 31, 35, 43, 44, 45, 47, and 49). This fact indicates that such substituents try to maintain a
favorable conformation of the basic side chain of the compounds to the antagonism towards ER. This
additional characteristic has not been revealed by the LIV-3D-QSAR Model developed by Cunha and
co-workers using this series of compounds [18].
The absence of any descriptors around the phenyl ring, specifically related to the 4'-OH group,
which is responsible for the hydrogen bond interaction with the backbone atoms of His524,
corroborates what previous SAR studies already demonstrated [11,16], i.e., the 6-OH group of the
benzothiophenyl ring is more important for the biological activity than the 4'-OH group. However, the
absence of any descriptors related to the 4'-position of the phenyl ring suggests some limitation of the
model. Additionally, unlike observed in the LIV-3D-QSAR Model [18], the postulated “bioactive”
conformation obtained in the 4D-QSAR Model 1B9 (Figure 4) is very similar to the one adopted by
raloxifene in the X-ray co-crystal structure [3]. Comparing the compounds conformations from Model
1B9 with the raloxifene-ER X-ray structure, the nitrogen atom of the piperidine ring is in a very close
position to that one observed in the crystal, being the distance among them of 1.33Å for 1 (the most
potent), and of 0.29Å for 54 (the least potent). These distances were calculated after RMS
superposition of these compounds conformations over the X-ray structure of raloxifene bound in the
LBD of ER, according Alignment 1.
Molecules 2012, 17 7424
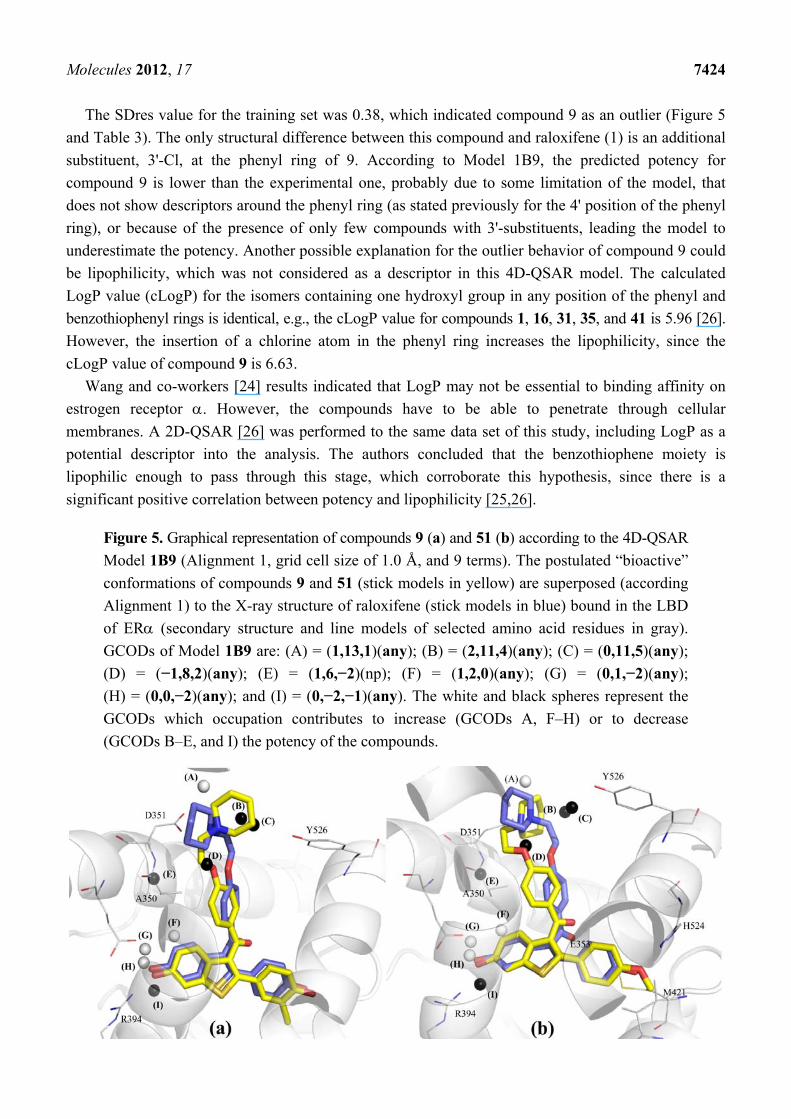
The SDres value for the training set was 0.38, which indicated compound 9 as an outlier (Figure 5
and Table 3). The only structural difference between this compound and raloxifene (1) is an additional
substituent, 3'-Cl, at the phenyl ring of 9. According to Model 1B9, the predicted potency for
compound 9 is lower than the experimental one, probably due to some limitation of the model, that
does not show descriptors around the phenyl ring (as stated previously for the 4' position of the phenyl
ring), or because of the presence of only few compounds with 3'-substituents, leading the model to
underestimate the potency. Another possible explanation for the outlier behavior of compound 9 could
be lipophilicity, which was not considered as a descriptor in this 4D-QSAR model. The calculated
LogP value (cLogP) for the isomers containing one hydroxyl group in any position of the phenyl and
benzothiophenyl rings is identical, e.g., the cLogP value for compounds 1, 16, 31, 35, and 41 is 5.96 [26].
However, the insertion of a chlorine atom in the phenyl ring increases the lipophilicity, since the
cLogP value of compound 9 is 6.63.
Wang and co-workers [24] results indicated that LogP may not be essential to binding affinity on
estrogen receptor . However, the compounds have to be able to penetrate through cellular
membranes. A 2D-QSAR [26] was performed to the same data set of this study, including LogP as a
potential descriptor into the analysis. The authors concluded that the benzothiophene moiety is
lipophilic enough to pass through this stage, which corroborate this hypothesis, since there is a
significant positive correlation between potency and lipophilicity [25,26].
Figure 5. Graphical representation of compounds 9 (a) and 51 (b) according to the 4D-QSAR
Model 1B9 (Alignment 1, grid cell size of 1.0 Å, and 9 terms). The postulated “bioactive”
conformations of compounds 9 and 51 (stick models in yellow) are superposed (according
Alignment 1) to the X-ray structure of raloxifene (stick models in blue) bound in the LBD
of ER (secondary structure and line models of selected amino acid residues in gray).
GCODs of Model 1B9 are: (A) = (1,13,1)(any); (B) = (2,11,4)(any); (C) = (0,11,5)(any);
(D) = (−1,8,2)(any); (E) = (1,6,−2)(np); (F) = (1,2,0)(any); (G) = (0,1,−2)(any);
(H) = (0,0,−2)(any); and (I) = (0,−2,−1)(any). The white and black spheres represent the
GCODs which occupation contributes to increase (GCODs A, F–H) or to decrease
(GCODs B–E, and I) the potency of the compounds.

Molecules 2012, 17 7425
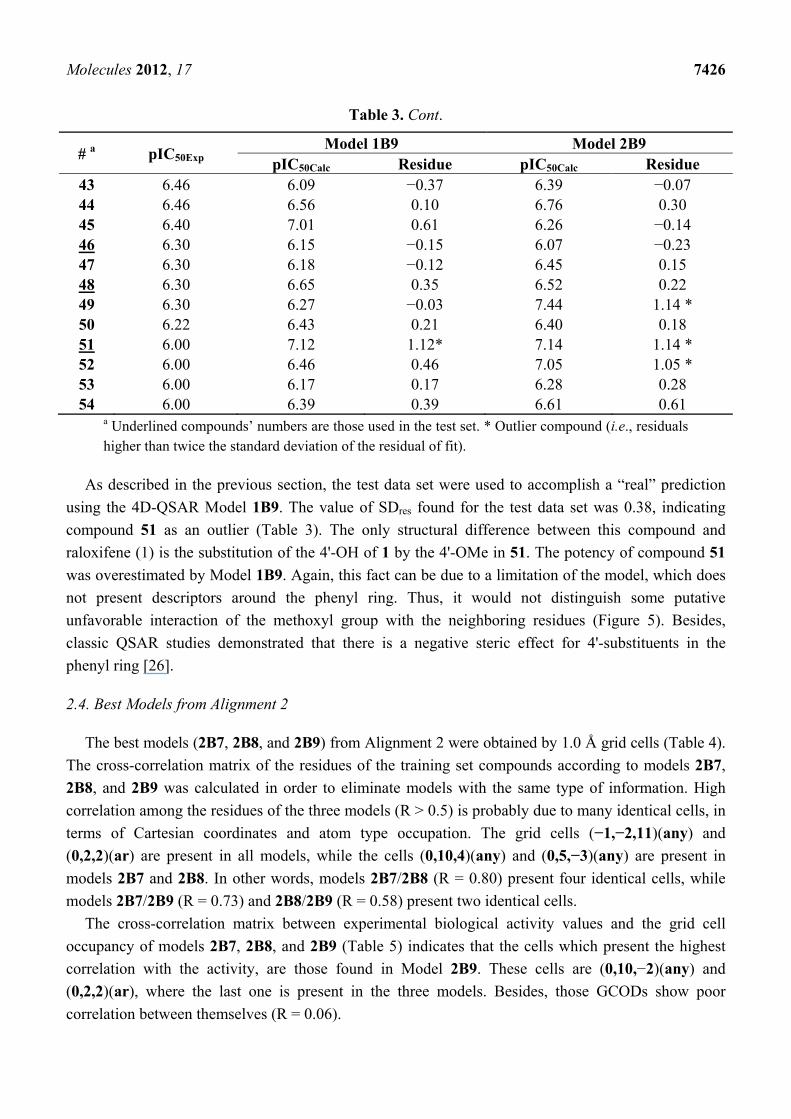
Table 3. Experimental (pIC50Exp) and calculated (pIC50Calc) potencies and residuals values
(pIC50Calc—pIC50Exp) of Models 1B9 and 2B9 of 4D-QSAR.
# a pIC50Exp Model 1B9 Model 2B9
pIC50Calc Residue pIC50Calc Residue 1 9.70 9.84 0.14 9.27 −0.43 2 9.52 9.09 −0.43 8.11 −1.41 * 3 9.15 9.30 0.15 9.48 0.33 4 9.10 8.77 −0.33 9.04 −0.06 5 9.00 9.16 0.16 8.97 −0.03 6 9.00 8.49 −0.51 8.81 −0.19 7 8.70 8.57 −0.13 8.89 0.19 8 8.70 8.24 −0.46 8.32 −0.38 9 8.64 7.83 −0.81 * 8.83 0.19 10 8.64 8.45 −0.19 8.97 0.33 11 8.60 8.01 −0.59 8.32 −0.28 12 8.60 8.08 −0.52 8.59 −0.01 13 8.52 7.86 −0.66 8.47 −0.05 14 8.30 8.38 0.08 7.88 −0.42 15 8.15 8.09 −0.06 7.97 −0.18 16 8.00 8.39 0.39 7.86 −0.14 17 8.00 8.25 0.25 7.45 −0.55 18 7.70 7.85 0.15 7.76 0.06 19 7.70 7.41 −0.29 6.92 −0.78 20 7.52 7.81 0.29 7.58 0.06 21 7.52 7.62 0.10 7.41 −0.11 22 7.49 7.73 0.24 7.14 −0.35 23 7.46 7.10 −0.36 6.87 −0.59 24 7.40 7.46 0.06 7.86 0.46 25 7.30 7.89 0.59 7.28 −0.02 26 7.30 7.68 0.38 7.11 −0.19 27 7.30 6.93 −0.37 7.19 −0.11 28 7.22 6.76 −0.46 7.01 −0.21 29 7.00 7.08 0.08 6.45 −0.55 30 7.00 6.73 −0.27 6.59 −0.41 31 7.00 7.31 0.31 7.46 0.46 32 7.00 7.64 0.64 7.47 0.47 33 7.00 7.71 0.71 7.60 0.60 34 7.00 6.37 −0.63 6.86 −0.14 35 6.72 6.08 −0.64 6.27 −0.45 36 6.70 6.84 0.14 6.33 −0.37 37 6.60 6.53 −0.07 7.01 0.41 38 6.52 6.39 −0.13 6.91 0.39 39 6.52 6.02 −0.50 6.40 −0.12 40 6.52 6.63 0.11 6.32 −0.20 41 6.52 6.97 0.45 6.57 0.05 42 6.49 6.77 0.28 6.58 0.09
Molecules 2012, 17 7426
Table 3. Cont.
# a pIC50Exp Model 1B9 Model 2B9
pIC50Calc Residue pIC50Calc Residue 43 6.46 6.09 −0.37 6.39 −0.07 44 6.46 6.56 0.10 6.76 0.30 45 6.40 7.01 0.61 6.26 −0.14 46 6.30 6.15 −0.15 6.07 −0.23 47 6.30 6.18 −0.12 6.45 0.15 48 6.30 6.65 0.35 6.52 0.22 49 6.30 6.27 −0.03 7.44 1.14 * 50 6.22 6.43 0.21 6.40 0.18 51 6.00 7.12 1.12* 7.14 1.14 * 52 6.00 6.46 0.46 7.05 1.05 * 53 6.00 6.17 0.17 6.28 0.28 54 6.00 6.39 0.39 6.61 0.61
a Underlined compounds’ numbers are those used in the test set. * Outlier compound (i.e., residuals higher than twice the standard deviation of the residual of fit).
As described in the previous section, the test data set were used to accomplish a “real” prediction
using the 4D-QSAR Model 1B9. The value of SDres found for the test data set was 0.38, indicating
compound 51 as an outlier (Table 3). The only structural difference between this compound and
raloxifene (1) is the substitution of the 4'-OH of 1 by the 4'-OMe in 51. The potency of compound 51
was overestimated by Model 1B9. Again, this fact can be due to a limitation of the model, which does
not present descriptors around the phenyl ring. Thus, it would not distinguish some putative
unfavorable interaction of the methoxyl group with the neighboring residues (Figure 5). Besides,
classic QSAR studies demonstrated that there is a negative steric effect for 4'-substituents in the
phenyl ring [26].
2.4. Best Models from Alignment 2
The best models (2B7, 2B8, and 2B9) from Alignment 2 were obtained by 1.0 Å grid cells (Table 4).
The cross-correlation matrix of the residues of the training set compounds according to models 2B7,
2B8, and 2B9 was calculated in order to eliminate models with the same type of information. High
correlation among the residues of the three models (R > 0.5) is probably due to many identical cells, in
terms of Cartesian coordinates and atom type occupation. The grid cells (−1,−2,11)(any) and
(0,2,2)(ar) are present in all models, while the cells (0,10,4)(any) and (0,5,−3)(any) are present in
models 2B7 and 2B8. In other words, models 2B7/2B8 (R = 0.80) present four identical cells, while
models 2B7/2B9 (R = 0.73) and 2B8/2B9 (R = 0.58) present two identical cells.
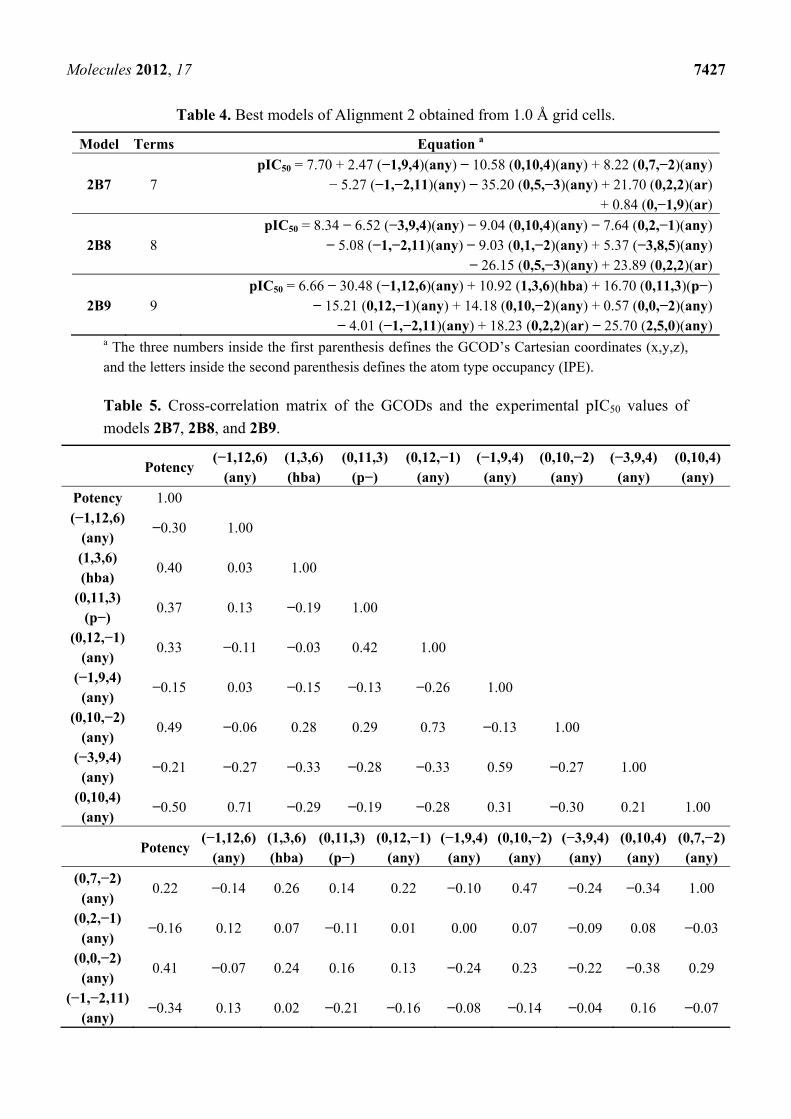
The cross-correlation matrix between experimental biological activity values and the grid cell
occupancy of models 2B7, 2B8, and 2B9 (Table 5) indicates that the cells which present the highest
correlation with the activity, are those found in Model 2B9. These cells are (0,10,−2)(any) and
(0,2,2)(ar), where the last one is present in the three models. Besides, those GCODs show poor
correlation between themselves (R = 0.06).
Molecules 2012, 17 7427
Table 4. Best models of Alignment 2 obtained from 1.0 Å grid cells.
Model Terms Equation a
2B7 7 pIC50 = 7.70 + 2.47 (−1,9,4)(any) − 10.58 (0,10,4)(any) + 8.22 (0,7,−2)(any)
− 5.27 (−1,−2,11)(any) − 35.20 (0,5,−3)(any) + 21.70 (0,2,2)(ar) + 0.84 (0,−1,9)(ar)
2B8 8 pIC50 = 8.34 − 6.52 (−3,9,4)(any) − 9.04 (0,10,4)(any) − 7.64 (0,2,−1)(any)
− 5.08 (−1,−2,11)(any) − 9.03 (0,1,−2)(any) + 5.37 (−3,8,5)(any) − 26.15 (0,5,−3)(any) + 23.89 (0,2,2)(ar)
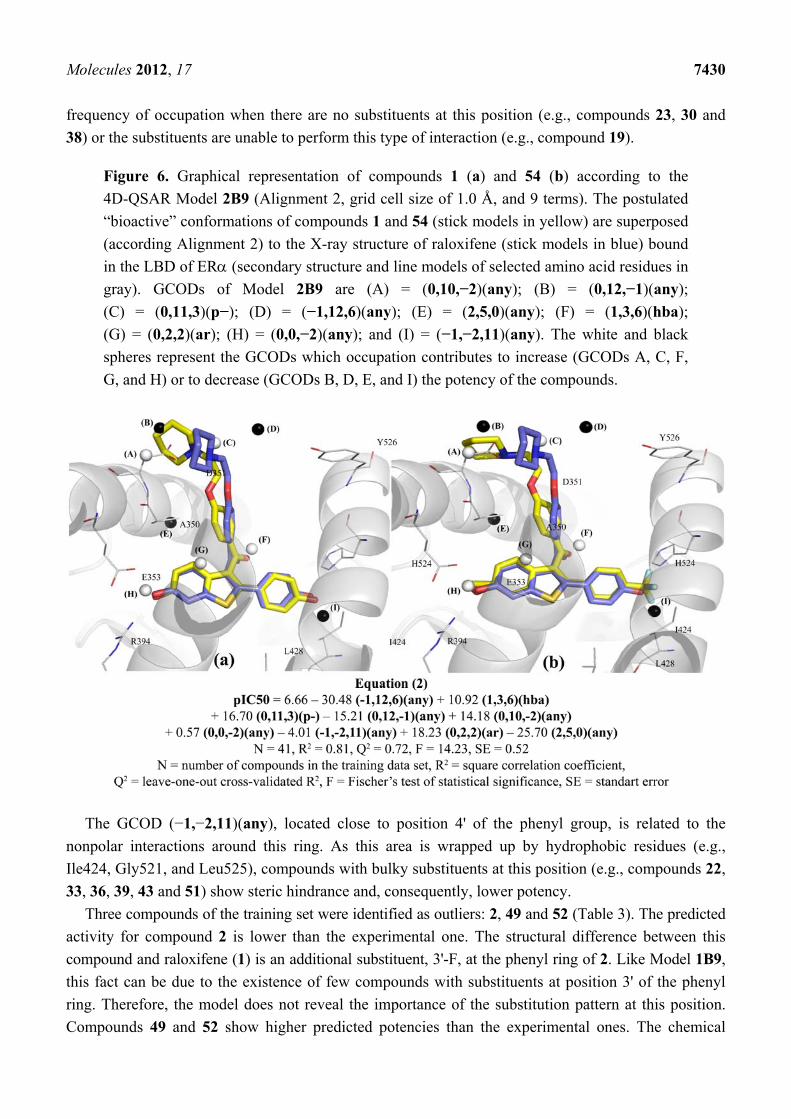
2B9 9 pIC50 = 6.66 − 30.48 (−1,12,6)(any) + 10.92 (1,3,6)(hba) + 16.70 (0,11,3)(p−)
− 15.21 (0,12,−1)(any) + 14.18 (0,10,−2)(any) + 0.57 (0,0,−2)(any) − 4.01 (−1,−2,11)(any) + 18.23 (0,2,2)(ar) − 25.70 (2,5,0)(any)
a The three numbers inside the first parenthesis defines the GCOD’s Cartesian coordinates (x,y,z), and the letters inside the second parenthesis defines the atom type occupancy (IPE).
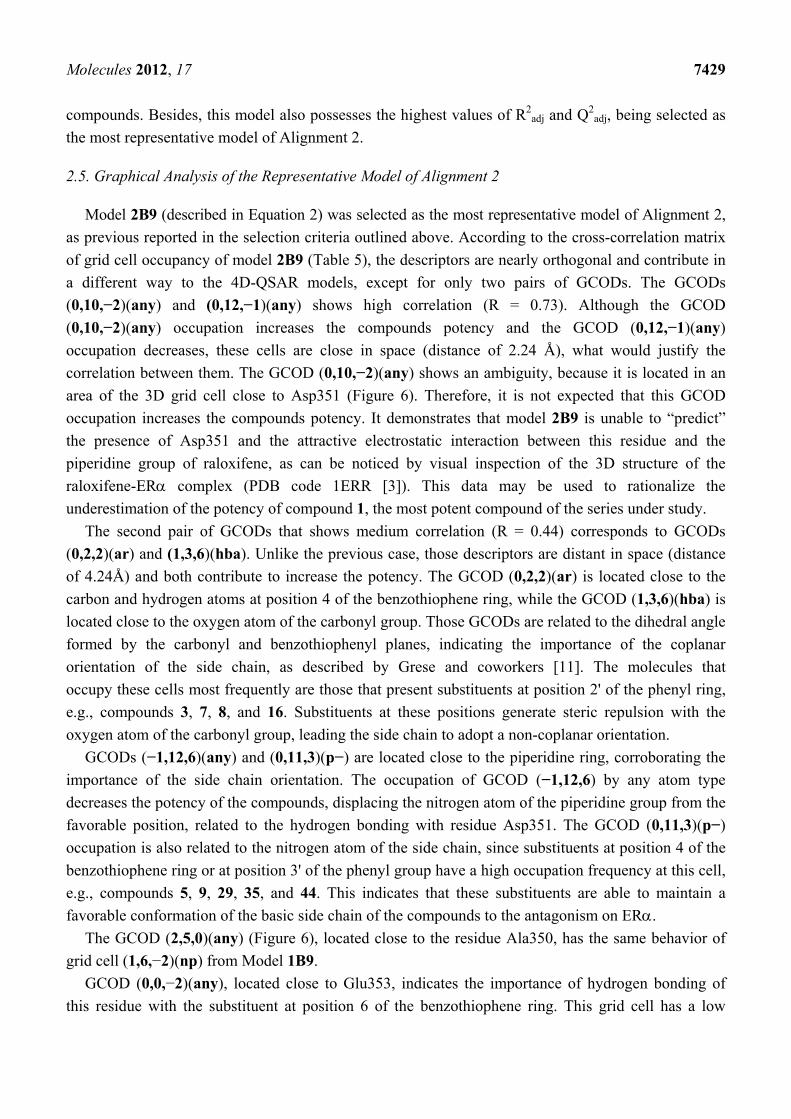
Table 5. Cross-correlation matrix of the GCODs and the experimental pIC50 values of
models 2B7, 2B8, and 2B9.
Potency (−1,12,6)
(any) (1,3,6) (hba)
(0,11,3) (p−)
(0,12,−1) (any)
(−1,9,4)(any)
(0,10,−2) (any)
(−3,9,4)(any)
(0,10,4) (any)
Potency 1.00 (−1,12,6)
(any) −0.30 1.00
(1,3,6) (hba)
0.40 0.03 1.00
(0,11,3) (p−)
0.37 0.13 −0.19 1.00
(0,12,−1) (any)
0.33 −0.11 −0.03 0.42 1.00
(−1,9,4) (any)
−0.15 0.03 −0.15 −0.13 −0.26 1.00
(0,10,−2) (any)
0.49 −0.06 0.28 0.29 0.73 −0.13 1.00
(−3,9,4) (any)
−0.21 −0.27 −0.33 −0.28 −0.33 0.59 −0.27 1.00
(0,10,4) (any)
−0.50 0.71 −0.29 −0.19 −0.28 0.31 −0.30 0.21 1.00
Potency (−1,12,6)
(any) (1,3,6) (hba)
(0,11,3)(p−)
(0,12,−1)(any)
(−1,9,4)(any)
(0,10,−2)(any)
(−3,9,4) (any)
(0,10,4)(any)
(0,7,−2)(any)
(0,7,−2) (any)
0.22 −0.14 0.26 0.14 0.22 −0.10 0.47 −0.24 −0.34 1.00
(0,2,−1) (any)
−0.16 0.12 0.07 −0.11 0.01 0.00 0.07 −0.09 0.08 −0.03
(0,0,−2) (any)
0.41 −0.07 0.24 0.16 0.13 −0.24 0.23 −0.22 −0.38 0.29
(−1,−2,11) (any)
−0.34 0.13 0.02 −0.21 −0.16 −0.08 −0.14 −0.04 0.16 −0.07

Molecules 2012, 17 7428
Table 5. Cont.
Potency (−1,12,6)
(any) (1,3,6) (hba)
(0,11,3)(p−)
(0,12,−1)(any)
(−1,9,4)(any)
(0,10,−2)(any)
(−3,9,4) (any)
(0,10,4)(any)
(0,7,−2)(any)
(0,1,−2) (any)
−0.28 0.46 −0.03 -0.05 0.06 −0.19 −0.02 −0.14 0.24 −0.14
(−3,8,5) (any)
−0.21 −0.29 −0.33 −0.26 −0.29 0.69 −0.15 0.92 0.16 −0.15
(0,5,−3) (any)
−0.22 −0.12 0.06 0.01 −0.25 −0.05 −0.18 −0.11 −0.21 0.59
(0,2,2) (ar)
0.45 0.10 0.44 0.06 0.03 −0.16 0.06 −0.16 −0.04 0.09
(2,5,0) (any)
−0.30 −0.10 −0.01 −0.05 −0.30 0.06 −0.26 0.01 −0.09 0.47
(0,−1,9) (ar)
0.15 −0.09 0.02 −0.02 −0.25 −0.18 −0.24 −0.05 −0.01 0.08
(0,2,−1)
(any) (0,0,−2)
(any) (−1,−2,11)
(any) (0,1,−2)
(any) (−3,8,5)
(any) (0,5,−3)
(any) (0,2,2)
(ar) (2,5,0) (any)
(0,−1,9) (ar)
(0,7,−2) (any)
(0,2,−1) (any)
1.00
(0,0,−2) (any)
−0.04 1.00
(−1,−2,11) (any)
−0.08 −0.30 1.00
(0,1,−2) (any)
−0.09 −0.16 0.22 1.00
(−3,8,5) (any)
−0.05 −0.26 −0.01 −0.15 1.00
(0,5,−3) (any)
−0.05 0.16 0.00 −0.12 −0.06 1.00
(0,2,2) (ar)
0.04 0.12 0.30 0.11 −0.20 −0.01 1.00
(2,5,0) (any)
−0.01 0.08 0.00 −0.14 0.07 0.94 −0.07 1.00
(0,−1,9) (ar)
−0.01 0.08 0.20 −0.11 −0.05 0.22 0.44 0.22 1.00
Model 2B7 presents a higher correlation with the other models, especially with model 2B8
(R = 0.80). In a first analysis, Model 2B7 incorporates the other models quantitatively, because it
presents more identical cells as compared to the other models. However, models 2B8 and 2B9 are less
correlated between themselves (R = 0.58) and, at the same time, highly correlated to model 2B7.
Therefore, an additional criteria was taken into account in order to select the representative Model of
Alignment 2, i.e., the SDres value and the number of outliers. We observed that model 2B9 presents a
lower value of SDres, in spite of presenting the same number of outliers considering the training set
Molecules 2012, 17 7429
compounds. Besides, this model also possesses the highest values of R2adj and Q2
adj, being selected as
the most representative model of Alignment 2.
2.5. Graphical Analysis of the Representative Model of Alignment 2
Model 2B9 (described in Equation 2) was selected as the most representative model of Alignment 2,
as previous reported in the selection criteria outlined above. According to the cross-correlation matrix
of grid cell occupancy of model 2B9 (Table 5), the descriptors are nearly orthogonal and contribute in
a different way to the 4D-QSAR models, except for only two pairs of GCODs. The GCODs
(0,10,−2)(any) and (0,12,−1)(any) shows high correlation (R = 0.73). Although the GCOD
(0,10,−2)(any) occupation increases the compounds potency and the GCOD (0,12,−1)(any)
occupation decreases, these cells are close in space (distance of 2.24 Å), what would justify the
correlation between them. The GCOD (0,10,−2)(any) shows an ambiguity, because it is located in an
area of the 3D grid cell close to Asp351 (Figure 6). Therefore, it is not expected that this GCOD
occupation increases the compounds potency. It demonstrates that model 2B9 is unable to “predict”
the presence of Asp351 and the attractive electrostatic interaction between this residue and the
piperidine group of raloxifene, as can be noticed by visual inspection of the 3D structure of the
raloxifene-ER complex (PDB code 1ERR [3]). This data may be used to rationalize the
underestimation of the potency of compound 1, the most potent compound of the series under study.
The second pair of GCODs that shows medium correlation (R = 0.44) corresponds to GCODs
(0,2,2)(ar) and (1,3,6)(hba). Unlike the previous case, those descriptors are distant in space (distance
of 4.24Å) and both contribute to increase the potency. The GCOD (0,2,2)(ar) is located close to the
carbon and hydrogen atoms at position 4 of the benzothiophene ring, while the GCOD (1,3,6)(hba) is
located close to the oxygen atom of the carbonyl group. Those GCODs are related to the dihedral angle
formed by the carbonyl and benzothiophenyl planes, indicating the importance of the coplanar
orientation of the side chain, as described by Grese and coworkers [11]. The molecules that
occupy these cells most frequently are those that present substituents at position 2' of the phenyl ring,
e.g., compounds 3, 7, 8, and 16. Substituents at these positions generate steric repulsion with the
oxygen atom of the carbonyl group, leading the side chain to adopt a non-coplanar orientation.
GCODs (−1,12,6)(any) and (0,11,3)(p−) are located close to the piperidine ring, corroborating the
importance of the side chain orientation. The occupation of GCOD (−1,12,6) by any atom type
decreases the potency of the compounds, displacing the nitrogen atom of the piperidine group from the
favorable position, related to the hydrogen bonding with residue Asp351. The GCOD (0,11,3)(p−)
occupation is also related to the nitrogen atom of the side chain, since substituents at position 4 of the
benzothiophene ring or at position 3' of the phenyl group have a high occupation frequency at this cell,
e.g., compounds 5, 9, 29, 35, and 44. This indicates that these substituents are able to maintain a
favorable conformation of the basic side chain of the compounds to the antagonism on ER.
The GCOD (2,5,0)(any) (Figure 6), located close to the residue Ala350, has the same behavior of
grid cell (1,6,−2)(np) from Model 1B9.
GCOD (0,0,−2)(any), located close to Glu353, indicates the importance of hydrogen bonding of
this residue with the substituent at position 6 of the benzothiophene ring. This grid cell has a low
Molecules 2012, 17 7430
frequency of occupation when there are no substituents at this position (e.g., compounds 23, 30 and
38) or the substituents are unable to perform this type of interaction (e.g., compound 19).
Figure 6. Graphical representation of compounds 1 (a) and 54 (b) according to the
4D-QSAR Model 2B9 (Alignment 2, grid cell size of 1.0 Å, and 9 terms). The postulated
“bioactive” conformations of compounds 1 and 54 (stick models in yellow) are superposed
(according Alignment 2) to the X-ray structure of raloxifene (stick models in blue) bound
in the LBD of ER (secondary structure and line models of selected amino acid residues in
gray). GCODs of Model 2B9 are (A) = (0,10,−2)(any); (B) = (0,12,−1)(any);
(C) = (0,11,3)(p−); (D) = (−1,12,6)(any); (E) = (2,5,0)(any); (F) = (1,3,6)(hba);
(G) = (0,2,2)(ar); (H) = (0,0,−2)(any); and (I) = (−1,−2,11)(any). The white and black
spheres represent the GCODs which occupation contributes to increase (GCODs A, C, F,
G, and H) or to decrease (GCODs B, D, E, and I) the potency of the compounds.
The GCOD (−1,−2,11)(any), located close to position 4' of the phenyl group, is related to the
nonpolar interactions around this ring. As this area is wrapped up by hydrophobic residues (e.g.,
Ile424, Gly521, and Leu525), compounds with bulky substituents at this position (e.g., compounds 22,
33, 36, 39, 43 and 51) show steric hindrance and, consequently, lower potency.
Three compounds of the training set were identified as outliers: 2, 49 and 52 (Table 3). The predicted
activity for compound 2 is lower than the experimental one. The structural difference between this
compound and raloxifene (1) is an additional substituent, 3'-F, at the phenyl ring of 2. Like Model 1B9,
this fact can be due to the existence of few compounds with substituents at position 3' of the phenyl
ring. Therefore, the model does not reveal the importance of the substitution pattern at this position.
Compounds 49 and 52 show higher predicted potencies than the experimental ones. The chemical
Molecules 2012, 17 7431
difference between raloxifene (1) and 49 is the presence of two additional substituents, 5,7-Me, at the
phenyl ring. Model 2B9 does not show any descriptors around those substituents, which turns the
model unable to recognize how they may influence the conformation of the side chain, leading to an
unfavorable orientation for potency (Figure 7). Compound 52 has an amide substituent at position 6 of
the benzothiophene ring that has a high frequency of occupation of GCOD (0,0,−2)(any). However,
this cell presents a low coefficient (Equation 2), which tends to have a small contribution to Model 2B9.
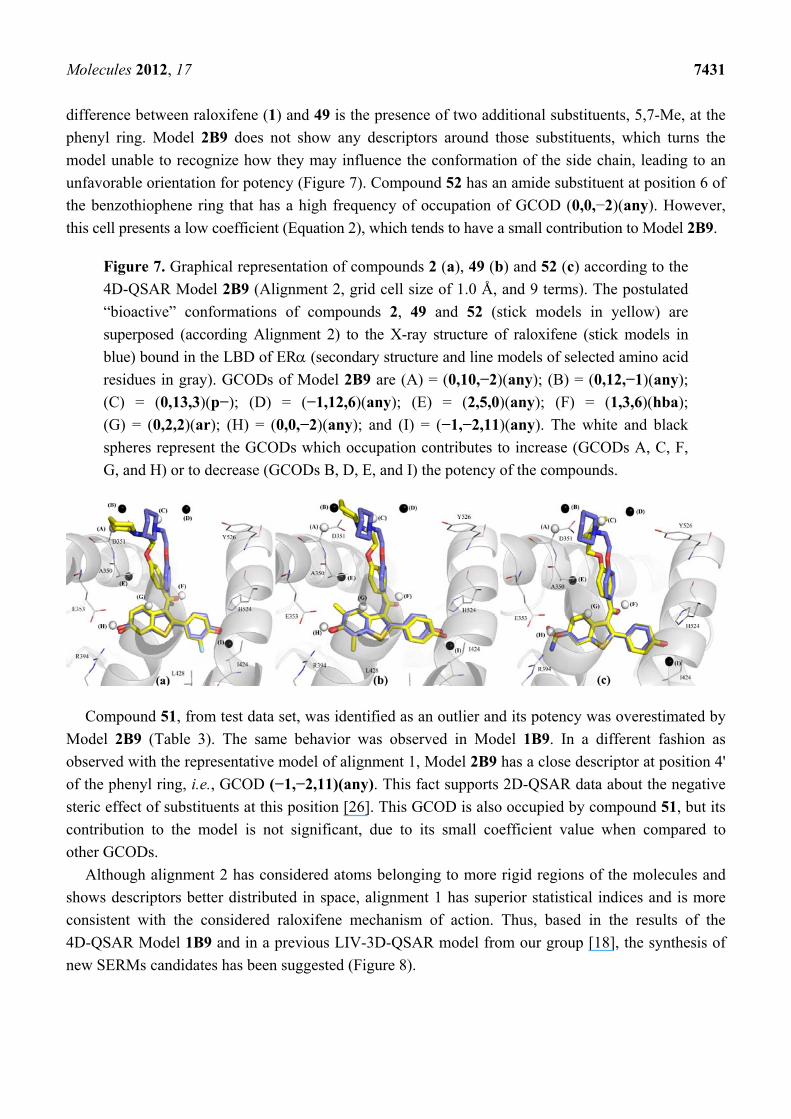
Figure 7. Graphical representation of compounds 2 (a), 49 (b) and 52 (c) according to the
4D-QSAR Model 2B9 (Alignment 2, grid cell size of 1.0 Å, and 9 terms). The postulated
“bioactive” conformations of compounds 2, 49 and 52 (stick models in yellow) are
superposed (according Alignment 2) to the X-ray structure of raloxifene (stick models in
blue) bound in the LBD of ER (secondary structure and line models of selected amino acid
residues in gray). GCODs of Model 2B9 are (A) = (0,10,−2)(any); (B) = (0,12,−1)(any);
(C) = (0,13,3)(p−); (D) = (−1,12,6)(any); (E) = (2,5,0)(any); (F) = (1,3,6)(hba);
(G) = (0,2,2)(ar); (H) = (0,0,−2)(any); and (I) = (−1,−2,11)(any). The white and black
spheres represent the GCODs which occupation contributes to increase (GCODs A, C, F,
G, and H) or to decrease (GCODs B, D, E, and I) the potency of the compounds.
Compound 51, from test data set, was identified as an outlier and its potency was overestimated by
Model 2B9 (Table 3). The same behavior was observed in Model 1B9. In a different fashion as
observed with the representative model of alignment 1, Model 2B9 has a close descriptor at position 4'
of the phenyl ring, i.e., GCOD (−1,−2,11)(any). This fact supports 2D-QSAR data about the negative
steric effect of substituents at this position [26]. This GCOD is also occupied by compound 51, but its
contribution to the model is not significant, due to its small coefficient value when compared to
other GCODs.
Although alignment 2 has considered atoms belonging to more rigid regions of the molecules and
shows descriptors better distributed in space, alignment 1 has superior statistical indices and is more
consistent with the considered raloxifene mechanism of action. Thus, based in the results of the
4D-QSAR Model 1B9 and in a previous LIV-3D-QSAR model from our group [18], the synthesis of
new SERMs candidates has been suggested (Figure 8).

Molecules 2012, 17 7432
Figure 8. Structures of the raloxifene IV (pIC50Exp = 9.70 M) and the proposed compounds
V and VI (and calculated potencies based on the 4D-QSAR Model 1B9).
S
O
O
N
OHOH
S
O
OHOH
N
N
CH3
SOH
O
N
N
CH3
H
OH
(IV) (V) (VI)
2.6. New Compounds Based on 4D-QSAR Analysis
In medicinal chemistry, the optimization of lead compounds proceeds along two main methods [27].
The first one is based on chemical modifications of the molecular structure (changing the chemical
properties of the molecule), which have been exhaustively explored by Grese and co-workers [16] in
this series of raloxifene analogs. The second one is the application of conformational constraints that
change the molecular flexibility. Therefore, based on the results obtained by Model 1B9 of the current
4D-QSAR analysis and in the previous LIV-3D-QSAR study [18], we suggest two modifications on
the raloxifene structure in order to reduce side chain flexibility. (i) The piperidinyl-ethoxy moiety was
replaced by a piperazine group (proposed compounds V and VI), which is able to maintain the
electrostatic and the hydrogen bonding interactions with Asp351, since this group has a basic nitrogen
atom at the same position in relation to raloxifene. (ii) The carbonyl “hinge” and the phenolic group
were replaced by a naphthyl group (proposed compound VI).
According to the 4D-QSAR Model 1B9, compound V showed the poorest calculated potency
(pIC50 = 6.60), while compound VI has shown the highest calculated potency (pIC50 = 10.48) (Figure 8).
Replacing the basic side chain and maintaining the carbonyl “hinge” (V) may lead to side chain
orientations, which are not favorable to biological activity, since the basic side chain follows the
carbonyl “hinge” orientation. Therefore, GCODs that contributes negatively to the potency have a high
frequency of occupation.
A SAR study from 1997[11], indicated that nearly orthogonal orientations of the basic side chain in
raloxifene might be responsible for its unique biological activity profile. However, it is interesting to
note that the most potent proposed compound (VI) shows a coplanar orientation of the basic side
chain. This result may be due to its similarity to the bioactive conformation of raloxifene, since the
RMS deviation value (0.28 Å) between VI and the raloxifene X-ray crystallographic structure is low.
Moreover, this result shows that the simultaneously replacement of both the basic side chain and the
carbonyl “hinge” (VI) leads to a rigid conformation of the lateral chain, which does not allow
unfavorable orientations. Therefore, GCODs that contributes positively to the potency have a high
frequency of occupation. It is interesting to note that, benzothiophene [28] and tetrahydrolsoquinoline [29]
derivatives containing a constrained piperazine side chain were reported as high-affinity ligands of the
ER, being potent agonists in bone tissue.
Molecules 2012, 17 7433
3. Experimental
3.1. Computational Methods
3.1.1. Biological Data
The 4D-QSAR analysis[20] was applied to a series of 54 raloxifene analogs[16], using a training
data set of 41 compounds (1–7, 9–13, 15, 16, 19, 21–25, 27–30, 32, 34–39, 42–45, 47, 49, 50 and 52–54),
randomly selected from the original 54 compounds, which were used for model construction and
internal validation (cross-validation). The model was also externally validated using a test data set of
13 compounds (8, 14, 17, 18, 20, 26, 31, 33, 40, 41, 46, 48 and 51). Table 3 reports the 54 compounds’
structures and the related potencies, defined as IC50 (nM), where C is the compound effective
inhibitory concentration required to achieve 50% (IC50) inhibition of MCF-7 cell proliferation[16]. The
IC50 values (nM) were transformed into pIC50 (M) values (−LogIC50).
3.1.2. Structures Building
The three-dimensional (3D) models of the 54 compounds (Table 6) were based on the structure of
compound 1 (raloxifene) co-crystallized with ER, retrieved from the Protein Data Bank (PDB code:
1ERR) [15], corresponding to the putative “bioactive” conformation. The 3D model for each compound
was built with the nitrogen atom of the piperidine group protonated, using HyperChem 7.0 software [30].
Each structure, including raloxifene (1), was geometry-optimized in vacuum, without any restriction,
using the MM+ molecular mechanics force field (HyperChem) [31], and subsequently using the
semi-empirical AM1 Hamiltonian (HyperChem) [32], in order to assign the partial atomic charges.
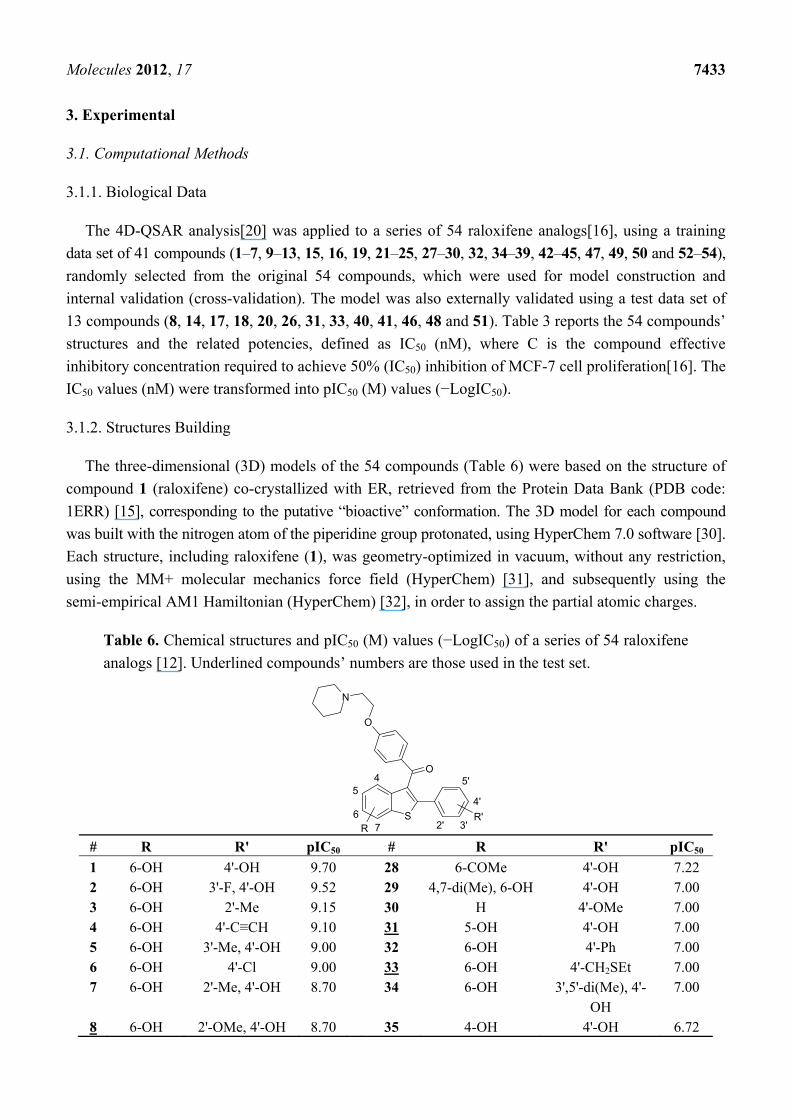
Table 6. Chemical structures and pIC50 (M) values (−LogIC50) of a series of 54 raloxifene
analogs [12]. Underlined compounds’ numbers are those used in the test set.
S
O
O
N
45
67 2' 3'
4'
5'
RR'
# R R' pIC50 # R R' pIC50
1 6-OH 4'-OH 9.70 28 6-COMe 4'-OH 7.22 2 6-OH 3'-F, 4'-OH 9.52 29 4,7-di(Me), 6-OH 4'-OH 7.00 3 6-OH 2'-Me 9.15 30 H 4'-OMe 7.00 4 6-OH 4'-C≡CH 9.10 31 5-OH 4'-OH 7.00 5 6-OH 3'-Me, 4'-OH 9.00 32 6-OH 4'-Ph 7.00 6 6-OH 4'-Cl 9.00 33 6-OH 4'-CH2SEt 7.00 7 6-OH 2'-Me, 4'-OH 8.70 34 6-OH 3',5'-di(Me), 4'-
OH 7.00
8 6-OH 2'-OMe, 4'-OH 8.70 35 4-OH 4'-OH 6.72
Molecules 2012, 17 7434
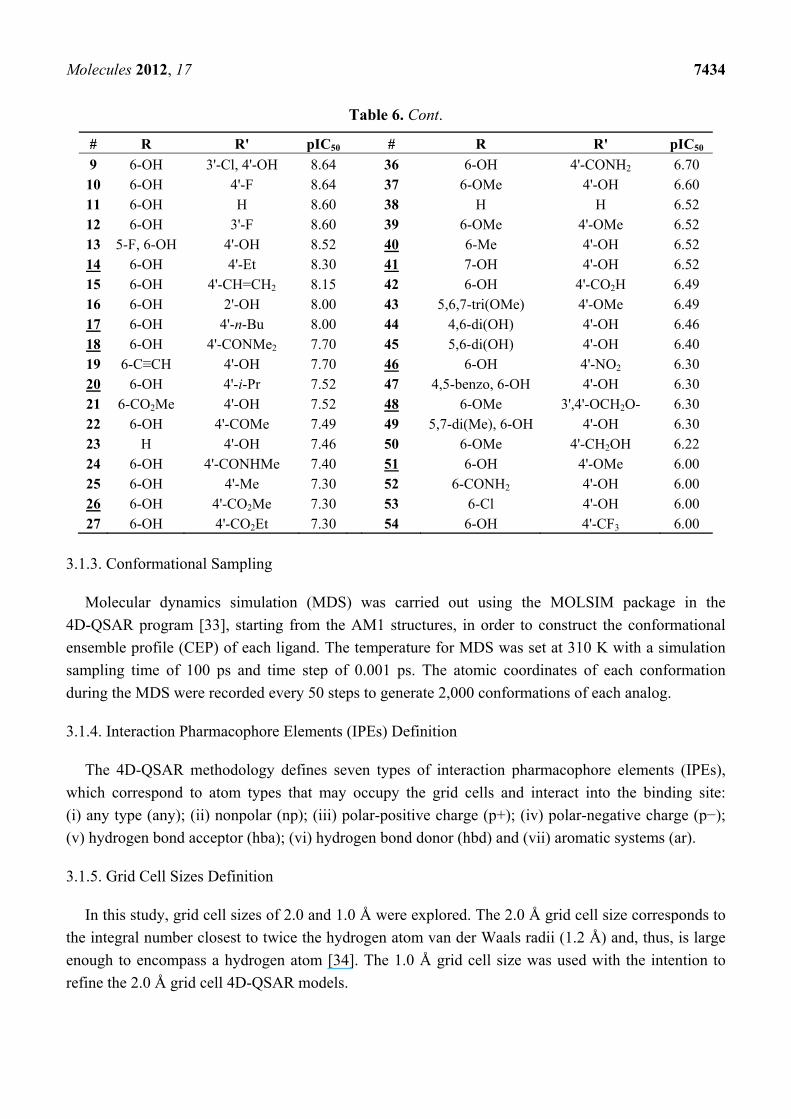
Table 6. Cont.
# R R' pIC50 # R R' pIC50
9 6-OH 3'-Cl, 4'-OH 8.64 36 6-OH 4'-CONH2 6.70 10 6-OH 4'-F 8.64 37 6-OMe 4'-OH 6.60 11 6-OH H 8.60 38 H H 6.52 12 6-OH 3'-F 8.60 39 6-OMe 4'-OMe 6.52 13 5-F, 6-OH 4'-OH 8.52 40 6-Me 4'-OH 6.52 14 6-OH 4'-Et 8.30 41 7-OH 4'-OH 6.52 15 6-OH 4'-CH=CH2 8.15 42 6-OH 4'-CO2H 6.49 16 6-OH 2'-OH 8.00 43 5,6,7-tri(OMe) 4'-OMe 6.49 17 6-OH 4'-n-Bu 8.00 44 4,6-di(OH) 4'-OH 6.46 18 6-OH 4'-CONMe2 7.70 45 5,6-di(OH) 4'-OH 6.40 19 6-C≡CH 4'-OH 7.70 46 6-OH 4'-NO2 6.30 20 6-OH 4'-i-Pr 7.52 47 4,5-benzo, 6-OH 4'-OH 6.30 21 6-CO2Me 4'-OH 7.52 48 6-OMe 3',4'-OCH2O- 6.30 22 6-OH 4'-COMe 7.49 49 5,7-di(Me), 6-OH 4'-OH 6.30 23 H 4'-OH 7.46 50 6-OMe 4'-CH2OH 6.22 24 6-OH 4'-CONHMe 7.40 51 6-OH 4'-OMe 6.00 25 6-OH 4'-Me 7.30 52 6-CONH2 4'-OH 6.00 26 6-OH 4'-CO2Me 7.30 53 6-Cl 4'-OH 6.00 27 6-OH 4'-CO2Et 7.30 54 6-OH 4'-CF3 6.00
3.1.3. Conformational Sampling
Molecular dynamics simulation (MDS) was carried out using the MOLSIM package in the
4D-QSAR program [33], starting from the AM1 structures, in order to construct the conformational
ensemble profile (CEP) of each ligand. The temperature for MDS was set at 310 K with a simulation
sampling time of 100 ps and time step of 0.001 ps. The atomic coordinates of each conformation
during the MDS were recorded every 50 steps to generate 2,000 conformations of each analog.
3.1.4. Interaction Pharmacophore Elements (IPEs) Definition
The 4D-QSAR methodology defines seven types of interaction pharmacophore elements (IPEs),
which correspond to atom types that may occupy the grid cells and interact into the binding site:
(i) any type (any); (ii) nonpolar (np); (iii) polar-positive charge (p+); (iv) polar-negative charge (p−);
(v) hydrogen bond acceptor (hba); (vi) hydrogen bond donor (hbd) and (vii) aromatic systems (ar).
3.1.5. Grid Cell Sizes Definition
In this study, grid cell sizes of 2.0 and 1.0 Å were explored. The 2.0 Å grid cell size corresponds to
the integral number closest to twice the hydrogen atom van der Waals radii (1.2 Å) and, thus, is large
enough to encompass a hydrogen atom [34]. The 1.0 Å grid cell size was used with the intention to
refine the 2.0 Å grid cell 4D-QSAR models.

Molecules 2012, 17 7435
3.1.6. Alignment Definition
Three alignments were used to define the lattice overlay of the CEP of each compound. In
alignments 1 and 2, the atoms were selected based on previous SAR studies from the literature [3,11,16],
while in alignment 3, we used non-pharmacophoric atoms to observe if the 4D-QSAR program is able
to select the most important IPEs. The atom numbers and corresponding sequences for each alignment
are listed in Table 7, using the raloxifene structure (compound 1) as a template.
Table 7. Atom numbering of the tested alignments used in 4D-QSAR models’ construction.
S
O
O
N
OH
OH 39 12
20
23
16
19
27
Alignment 1st Atom a 2nd Atom a 3rd Atom a
1 C3 C12 N27
2 C3 C9 C23
3 C16 O19 C20
a The atom numbers of raloxifene (compound 1) were automatically obtained from HyperChem numbering [17] and not by IUPAC rules.
3.1.7. Independent Variable Generation
The CEP for each compound was overlaid onto a cubic lattice of a selected grid cell size (2.0 and
1.0 Å), according to each alignment. The grid cell occupancy profile for each IPE was computed and
used as the 4D-QSAR descriptors, which are named Grid Cell Occupancy Descriptors (GCODs). Thus,
the normalized grid cell absolute occupancy [20,23], defined as the number of times a cell was
occupied by an atom type over the MDS, divided by the size of the CEP (2,000 conformations), was
used to define the GCODs.
3.1.8. Data Reduction
The 4D-QSAR analysis, like other 3D-QSAR methods, generates an great number of QSAR
variables (GCODs) because of the large number of grid cells and the number of IPEs [20,34]. Thus,
three serial levels of data reduction were considered, in order to eliminate spurious variables [34]. The
first level eliminated GCODs that have an individual correlation coefficient, R, with the activity values
less than 0.1; the second level eliminated GCODs whose variance (self-variance) over a set of analogs
was less than a prechosen fraction; and the third level eliminated GCODs with a prechosen number of
empty grid cells (Table 8).
Table 8. Data reduction before the 4D-QSAR analyses according to the alignment and grid cell size.
Alignment Grid Cell Size (Å) Self-variance Empty Grid Cells 1 2.0 <0.00800 >37 1 1.0 <0.00400 >37 2 2.0 <0.00500 >37 2 1.0 <0.00015 >36 3 2.0 <0.00500 >38 3 1.0 <0.00018 >36
Molecules 2012, 17 7436
3.1.9. 4D-QSAR Model Construction
The 4D-QSAR models building and optimization process employed the Genetic Function
Approximation (GFA) [35] coupled with Partial Least Squares (PLS) regression [36]. Improved
models are constructed by performing crossover operations to recombine the descriptors of the
better-scored models, according to the Friedman’s “lack-of-fit” (LOF) measure, which penalizes the
Least Square Error (LSE) measure [34,35]. The number of crossover operations was set from 6,000 to
20,000. In addition, mutation probability was set at 100% and a smoothing factor (the variable that
controls the number of independent variables in the models) ranged from 0.5 to 3.0.
3.1.10. Internal and External 4D-QSAR Model Validation
The best-scored GA-PLS equations were submitted to internal validation by “leave-one-out”
cross-validation (LOO-cv) technique in the 4D-QSAR program. LOO-cv correlation coefficient (Q2),
squared correlation coefficient (R2), standard error (SE), and Fischer’s test (F) were used as parameters
to select the best models. The test data set (13 compounds) was used to test the best 4D-QSAR models
for their ability to predict biological activity values of compounds not included in the training data set.
3.1.11. Bioactive Conformation Selection
The final step in the 4D-QSAR methodology is to hypothesize the bioactive conformation of each
compound in the training set. The lowest-energy conformer state (up to 10.0 kcal/mol from the
minimum energy conformation), which predicted the maximum potency, using the optimum
4D-QSAR model, was defined as the “bioactive” conformation.
4. Conclusions
A series of 54 raloxifene analogs, evaluated as estrogen receptor- ligands, was selected from the
literature for a 4D-QSAR study, applying three tentative alignments and grid cells of 2.0 and 1.0 Å.
The best models were obtained from alignments 1 and 2, using grid cell size of 1.0 Å, from a training
set of 41 compounds. In addition, a test set of 13 compounds were used in the external validation
process. The best models were also validated based on the biological system and mechanism of action
of the compounds under study.
The models generated by 1.0 Å grid cell are more predictive, since they showed higher Q2adj values
than the best models from 2.0 Å grid cell, irrespective to the alignment. The models from both
alignments 1 and 2 were also consistent with the ER modulators action mechanism. A representative
model was selected for each one of alignments 1 (Model 1B9) and 2 (Model 2B9), revealing the
degree in which the lateral chain flexibility of the raloxifene analogs influences the potency.
Although there are any descriptors associated to the 4'-position of the phenyl ring, it is the most
coherent with the X-ray crystallography data. The model 2B9 was incapable to preview the presence of
Asp351, which has an important contribution to binding activity of raloxifeno derivatives on estrogen
receptor . Both models do not consider cLogP as a descriptor and this limitation can explain the
outlier compounds behavior.

Molecules 2012, 17 7437
In order to evaluate the influence of the reduction of the side chain flexibility on the potency and
based on the results from the 4D-QSAR analysis, we proposed two new raloxifene analogs based on
the model 1B9. The results indicated that the highest degree of rigidity imposed to the lateral side
chain increases the calculated potency, since it does not allow unfavorable orientations, maintaining
most of the time the favorable electrostatic and hydrogen bond interactions with Asp351. Therefore,
the drastic reduction of the side chain flexibility and, consequently, the generation of more favorable
conformations of compounds to achieve better interactions with the receptor may be a successful strategy.
Acknowledgments
We are grateful to “Conselho Nacional de Desenvolvimento Científico e Tecnológico” (CNPq,
Brazil) and to “Fundação Carlos Chagas Filho de Amparo à Pesquisa do Estado do Rio De Janeiro”
(FAPERJ, Brazil) for fellowship support. We thank to A. J. Hopfinger who kindly supplied the
4D-QSAR program for academic use.
References and Notes
1. Lewis, J.S.; Jordan, V.C. Selective estrogen receptor modulators (serms): Mechanisms of
anticarcinogenesis and drug resistance. Mutat. Res. Fund. Mol. Mech. Mutagen. 2005, 591,
247–263.
2. McDonnell, D.P. Selective estrogen receptor modulators (serms): A first step in the development
of perfect hormone replacement therapy regimen. J. Soc. Gynecol. Investig. 2000, 7, S10–S15.
3. Brzozowski, A.M.; Pike, A.C.W.; Dauter, Z.; Hubbard, R.E.; Bonn, T.; Engstrom, O.; Ohman, L.;
Greene, G.L.; Gustafsson, J.A.; Carlquist, M. Molecular basis of agonism and antagonism in the
oestrogen receptor. Nature 1997, 389, 753–758.
4. Loose-Mitchell, D.S.; Stancel, G.M. Estrogens and progestins. In The Pharmacological Basis of
Therapeutics; Hardman, J.G., Limbird, L.E., Eds.; Mc Graw-Hill: New York, NY, USA, 2001;
pp. 1597–1634.
5. Palacios, S.; Brincat, M.; Erel, C.T.; Gambacciani, M.; Lambrinoudaki, I.; Moen, M.H.;
Schenck-Gustafsson, K.; Tremollieres, F.; Vujovic, S.; Rees, M.; et al. Emas clinical guide:
Selective estrogen receptor modulators for postmenopausal osteoporosis. Maturitas 2012, 71,
194–198.
6. Knowlton, A.A.; Lee, A.R. Estrogen and the cardiovascular system. Pharmacol. Ther. 2012, 135,
54–70.
7. Brueggemeier, R.W.; Miller, D.D.; Witiak, D.T. Cholesterol, adrenocorticoids, and sex hormones.
In Principles of Medicinal Chemistry; Foye, W.O., Lemke, D.A.W., Willians, D.A., Eds.;
Williams & Wilkins and Meier: Philadelphia, PA, USA, 1995; pp. 444–498.
8. Dutertre, M.; Smith, C.L. Molecular mechanisms of selective estrogen receptor modulator (serm)
action. J. Pharmacol. Exp. Ther. 2000, 295, 431–437.
9. Jordan, V.C. The past, present, and future of selective estrogen receptor modulation. In Selective
Estrogen Receptor Modulators; New York Acad Sciences: New York, NY, USA, 2001;
Volume 949, pp. 72–79.

Molecules 2012, 17 7438
10. Park, W.C.; Jordan, V.C. Selective estrogen receptor modulators (serms) and their roles in breast
cancer prevention. Trends Mol. Med. 2002, 8, 82–88.
11. Grese, T.A.; Sluka, J.P.; Bryant, H.U.; Cullinan, G.J.; Glasebrook, A.L.; Jones, C.D.; Matsumoto, K.;
Palkowitz, A.D.; Sato, M.; Termine, J.D.; et al. Molecular determinants of tissue selectivity in
estrogen receptor modulators. Proc. Natl. Acad. Sci. USA 1997, 94, 14105–14110.
12. Dai, X.; Wu, J. Selective estrogen receptor modulator: Raloxifene. J. Reprod. Contracept. 2011,
22, 51–60.
13. Jordan, V.C. Targeted antiestrogens to prevent breast cancer. Trends Endocrinol. Metab. 1999,
10, 312–317.
14. Pappas, S.G.; Jordan, V.C. Chemoprevention of breast cancer: Current and future prospects.
Cancer Metastasis Rev. 2002, 21, 311–321.
15. Berman, H.M.; Westbrook, J.; Feng, Z.; Gilliland, G.; Bhat, T.N.; Weissig, H.; Shindyalov, I.N.;
Bourne, P.E. The protein data bank. Nucleic Acids Res. 2000, 28, 235–242.
16. Grese, T.A.; Cho, S.; Finley, D.R.; Godfrey, A.G.; Jones, C.D.; Lugar, C.W.; Martin, M.J.;
Matsumoto, K.; Pennington, L.D.; Winter, M.A.; et al. Structure-activity relationships of selective
estrogen receptor modulators: Modifications to the 2-arylbenzothiophene core of raloxifene.
J. Med. Chem. 1997, 40, 146–167.
17. Albuquerque, M.G.; Brito, M.A.; da Cunha, E.F.F.; de Alencastro, R.B.; Antunes, O.A.C.;
Castro, H.C.; Rodrigues, C.R. Multidimensional-qsar: Beyond the third-dimension in drug design.
In Current Methods in Medicinal Chemistry and Biological Physics; Taft, C.A., Silva, C.H.T.P.,
Eds.; Research Signpost: Trivandrum, Kerala, 2007; pp. 91–101.
18. da Cunha, E.F.F.; Martins, R.C.A.; Albuquerque, M.G.; de Alencastro, R.B. Liv-3d-qsar model
for estrogen receptor ligands. J. Mol. Model. 2004, 10, 297–304.
19. Hong, X.; Hopfinger, A.J. 3D-Pharmacophores of flavonoid binding at the benzodiazepine
GABAA receptor site using 4D-QSAR analysis. J. Chem. Inf. Comput. Sci. 2003, 43, 324–336.
20. Hopfinger, A.J.; Wang, S.; Tokarski, J.S.; Jin, B.Q.; Albuquerque, M.; Madhav, P.J.; Duraiswami, C.
Construction of 3D-QSAR models using the 4D-QSAR analysis formalism. J. Am. Chem. Soc.
1997, 119, 10509–10524.
21. Andrade, C.H.; Pasqualoto, K.F.; Ferreira, E.I.; Hopfinger, A.J. 4D-QSAR: Perspectives in drug
design. Molecules 2010, 15, 3281–3294.
22. Kubinyi, H. QSAR: Hansch analysis and related approaches. 1st ed.; VCH Publishers: New York,
NY, USA, 1993; p. 240.
23. Albuquerque, M.G.; Hopfinger, A.J.; Barreiro, E.J.; de Alencastro, R.B. Four-dimensional
quantitative structure-activity relationship analysis of a series of interphenylene
7-oxabicycloheptane oxazole thromboxane a(2) receptor antagonists. J. Chem. Inf. Comput. Sci.
1998, 38, 925–938.
24. Wang, Y.; Li, Y.; Ding, J.; Chang, Y. Prediction of binding affinity for estrogen receptor alpha
modulators using statistical learning approaches. Mol. Divers. 2008, 12, 93–102.
25. Wang, Z.; Li, Y.; Ai, C.; Wang, Y. In silico prediction of estrogen receptor subtype binding
affinity and selectivity using statistical methods and molecular docking with 2-arylnaphthalenes
and 2-arylquinolines. Int. J. Mol. Sci. 2010, 11, 3434–3458.
Molecules 2012, 17 7439
26. Gao, H.; Katzenellenbogen, J.A.; Garg, R.; Hansch, C. Comparative QSAR analysis of estrogen
receptor ligands. Chem. Rev. 1999, 99, 723–744.
27. Becker, O.M.; Levy, Y.; Ravitz, O. Flexibility, conformation spaces, and bioactivity. J. Phys.
Chem. B 2000, 104, 2123–2135.
28. Yang, C.H.; Xu, G.Y.; Li, J.; Wu, X.H.; Liu, B.; Yan, X.M.; Wang, M.W.; Xie, Y.Y.
Benzothiophenes containing a piperazine side chain as selective ligands for the estrogen receptor
alpha and their bioactivities in vivo. Bioorg. Med. Chem. Lett. 2005, 15, 1505–1507.
29. Renaud, J.; Bischoff, S.F.; Buhl, T.; Floersheim, P.; Fournier, B.; Geiser, M.; Halleux, C.;
Kallen, J.; Keller, H.; Ramage, P. Selective estrogen receptor modulators with conformationally
restricted side chains. Synthesis and structure-activity relationship of ERalpha-selective
tetrahydroisoquinoline ligands. J. Med. Chem. 2005, 48, 364–379.
30. Hypercube Inc. Hyperchem; Hypercube Inc.: Gainesville, FL, USA, 2002.
31. Allinger, N.L. Conformational-analysis .130. MM2—Hydrocarbon force-field utilizing v1 and v2
torsional terms. J. Am. Chem. Soc. 1977, 99, 8127–8134.
32. Dewar, M.J.S.; Zoebisch, E.G.; Healy, E.F.; Stewart, J.J.P. The development and use of
quantum-mechanical molecular-models .76. AM1—A new general-purpose quantum-mechanical
molecular-model. J. Am. Chem. Soc. 1985, 107, 3902–3909.
33. The Chem21 Group Inc. 4D-QSAR User’s Manual (v.3.00); The Chem21 Group Inc.: 1780
Wilson Dr., Lake Forest, IL, USA, 1997.
34. Romeiro, N.C.; Albuquerque, M.G.; de Alencastro, R.B.; Ravi, M.; Hopfinger, A.J. Construction
of 4D-QSAR models for use in the design of novel p38-mapk inhibitors. J. Comput. Aided Mol.
Des. 2005, 19, 385–400.
35. Rogers, D.; Hopfinger, A.J. Application of genetic function approximation to quantitative
structure-activity-relationships and quantitative structure-property relationships. J. Chem. Inf.
Comput. Sci. 1994, 34, 854–866.
36. Glenn, W.G.; Dunn, W.J.; Scott, D.R. Principal components analysis and partial least squares
regression. Tetrahedron Comput. Meth. 1989, 2, 349–376.
Sample Availability: Not Available.
© 2012 by the authors; licensee MDPI, Basel, Switzerland. This article is an open access article
distributed under the terms and conditions of the Creative Commons Attribution license
(http://creativecommons.org/licenses/by/3.0/).
Copyright © 2022 FDOKUMEN