New Trends and Issues Proceedings on Advances in Pure ...
11
Classification of brain tumours using radiomic features on MRI Gokalp Cinarer*, Department of Computer Technologies, Bozok University, 66200 Yozgat, Turkey https://orcid.org/0000-0003-0818-6746 Bulent Gursel Emiroglu, Department of Computer Engineering, Kirikkale University, 71450 Kirikkale, Turkey https://orcid.org/0000-0002-1656-6450 Suggested Citation: Cinarer, G. & Emiroglu, B. G. (2020). Classification of brain tumours using radiomic features on MRI. New Trends and Issues Proceedings on Advances in Pure and Applied Sciences. (12), 80–90. Received date January 20, 2020; revised date February 20, 2020; accepted date April 22, 2020. Selection and peer review under responsibility of Prof. Dr. Dogan Ibrahim, Near East University, Cyprus. © 2020 Birlesik Dunya Yenilik Arastirmave Yayincilik Merkezi. All rights reserved. Abstract Glioma is one of the most common brain tumours among the diagnoses of existing brain tumours. Glioma grades are important factors that should be known in the treatment of brain tumours. In this study, the radiomic features of gliomas were analysed and glioma grades were classified by Gaussian Naive Bayes algorithm. Glioma tumours of 121 patients of Grade II and Grade III were examined. The glioma tumours were segmented with the Grow Cut Algorithm and the 3D feature of tumour magnetic resonance imaging images were obtained with the 3D Slicer programme. The obtained quantitative values were statistically analysed with Spearman and Mann–Whitney U tests and 21 features with statistically significant properties were selected from 107 features. The results showed that the best performing among the algorithms was Gaussian Naive Bayes algorithm with 80% accuracy. Machine learning and feature selection techniques can be used in the analysis of gliomas as well as pathological evaluations in glioma grading processes. Keywords: Radiomics, glioma, naive bayes. * ADDRESS FOR CORRESPONDENCE: Gokalp Cinarer, Department of Computer Technologies, Bozok University, 66200 Yozgat, Turkey. E-mail address: [email protected] / Tel.: +0-506-533-5299 New Trends and Issues Proceedings on Advances in Pure and Applied Sciences No 12 (2020) 80-90 www.propaas.eu
-
Upload
khangminh22 -
Category
Documents
-
view
2 -
download
0
Transcript of New Trends and Issues Proceedings on Advances in Pure ...

Classification of brain tumours using radiomic features on MRI
Gokalp Cinarer*, Department of Computer Technologies, Bozok University, 66200 Yozgat, Turkey https://orcid.org/0000-0003-0818-6746
Bulent Gursel Emiroglu, Department of Computer Engineering, Kirikkale University, 71450 Kirikkale, Turkey https://orcid.org/0000-0002-1656-6450
Suggested Citation: Cinarer, G. & Emiroglu, B. G. (2020). Classification of brain tumours using radiomic features on MRI. New Trends and Issues Proceedings on Advances in Pure and Applied Sciences. (12), 80–90.
Received date January 20, 2020; revised date February 20, 2020; accepted date April 22, 2020. Selection and peer review under responsibility of Prof. Dr. Dogan Ibrahim, Near East University, Cyprus. ©2020 Birlesik Dunya Yenilik Arastirmave Yayincilik Merkezi. All rights reserved.
Abstract
Glioma is one of the most common brain tumours among the diagnoses of existing brain tumours. Glioma grades are important factors that should be known in the treatment of brain tumours. In this study, the radiomic features of gliomas were analysed and glioma grades were classified by Gaussian Naive Bayes algorithm. Glioma tumours of 121 patients of Grade II and Grade III were examined. The glioma tumours were segmented with the Grow Cut Algorithm and the 3D feature of tumour magnetic resonance imaging images were obtained with the 3D Slicer programme. The obtained quantitative values were statistically analysed with Spearman and Mann–Whitney U tests and 21 features with statistically significant properties were selected from 107 features. The results showed that the best performing among the algorithms was Gaussian Naive Bayes algorithm with 80% accuracy. Machine learning and feature selection techniques can be used in the analysis of gliomas as well as pathological evaluations in glioma grading processes.
Keywords: Radiomics, glioma, naive bayes.
* ADDRESS FOR CORRESPONDENCE: Gokalp Cinarer, Department of Computer Technologies, Bozok University, 66200 Yozgat, Turkey. E-mail address: [email protected] / Tel.: +0-506-533-5299
New Trends and Issues Proceedings on Advances in Pure and Applied Sciences
No 12 (2020) 80-90 www.propaas.eu

Cinarer, G. & Emiroglu, B. G. (2020). Classification of brain tumours using radiomic features on MRI. New Trends and Issues Proceedings on Advances in Pure and Applied Sciences. (12), 80–90.
81
1. Introduction
Gliomas are the general names for brain tumours that arise as a result of involuntary proliferation of brain images other than normal appearance. When the causes of death of male and female patients are examined, brain tumours are among the most common factors (Siegel, Miller, & Jemal, 2015). The World Health Organisation has classified brain tumours as follows: Grade II is a low grade tumour and Grade III is high grade tumour with gliomas malignancies (Louis et al., 2016). The survival rate of Grade IV high-level patients, such as glioblastoma, is 18.5% at the end of 4years, while the survival rate of a lower grade (Grade II) gliomas is 57% at the end of a decade [28]. Therefore, rapid and accurate determination of grade levels of brain tumours further increases the survival rate.
Among the medical imaging techniques, magnetic resonance imaging (MRI) is the most used imaging method with its high contrast. There are many MRI methods, such as T1, T2-weighted and Flair which are used in MRI imaging, and there are different types of MRI as well, such as functional MRI, diffusion–perfusion-weighted MRI and MRI Spectroscopy. All these prolong the process of analysis of radiologists and lead to the emergence of differences of opinion in diagnostics. Therefore, the importance of computer-aided tumour detection and artificial intelligence algorithms in medical imaging has increased. Classification of medical images can be presented using visual features [29] or using quantitative features.
In recent years, a technology had been developed that investigates the quantitative properties of the image and examines in depth the medical images called radiomics. With this method, the invisible features of medical images were detected by automatic algorithms, and a new perspective on medical imaging was introduced. Hsieh et al. developed a computer-based method that distinguished glioblastomas from low-grade gliomas and achieved high success [17].
Recently, two different types of information have been combined with radiomics and genomics to better examine various tumour types [33]. When a brain tumour is suspected clinically, radiological research is necessary when revealing its features, such as its location, shape, type and grade. Dena Nadir George et al. examined normal and abnormal brain tumours with C4.5 decision tree (DT) and multi-layer perceptron machine-learning algorithms according to their shape features [14] Nilesh Bhaskar rao [5]. examined the accuracy, sensitivity and specificity values using the wavelet transform segmentation method, feature extraction method and support vector machine classifier from brain MRI images [5]. In another study, the success of DT, Naive Bayes (NB) and linear discriminant analysis algorithms in the classification of breast MRI images were compared [30].
Liu et al. extracted the properties of HV microscopic images usage the grey-level co-occurrence matrix (GLCM). Among these features, entropy realised image recognition with energy, inertia moment and correlation features [22]. In order to differentiate glioblastomas from malignant tumours, first and second level statistics, including GLCM and RLM (run length matrix) methods, were found [7].
Radiomic image features are used for many different analyses today. Tumour histology [20] of image features, 3D features of the images [25], tumour grade [26] metastasis [10], glioblastoma [4] or gene signatures [11] are detected by using the images. Due to the difficulty of surgical resection and histopathological analysis of the tumour sample obtained from biopsies, MRI examinations with different imaging techniques provide convenience in the medical field.
In this study, automatic segmentation and radiomic features are combined to determine tumour grades using computer-aided classification algorithms. With the 3D Slicer programme, the tumour regions of the images are detected and divided into sections. Numerous radiomic features, such as first degree, morphological, histological features and textural features of tumour areas, are excluded from the segmented tumour sites. Various algorithms are tested for classification. The obtained results seem to be very effective in determining whether the gliomas are Grade II or Grade III.

Cinarer, G. & Emiroglu, B. G. (2020). Classification of brain tumours using radiomic features on MRI. New Trends and Issues Proceedings on Advances in Pure and Applied Sciences. (12), 80–90.
82
2. Material and methods
The classification process is an advanced image analysis process. It basically consists of two steps, which include feature extraction and classification. Figure 1 shows the implementation scheme of the proposed model. When the diagram is examined, in the first step of the proposed model, the images obtained from the dataset as Grade II and Grade III are separated according to the sequences: T1, T2 and Flair MRI. In the third step, the tumour is segmented using the 3D Slicer programme.
Radiomic features of the tumour are divided into three categories and the feature selection process is carried out in the fourth step with the statistical analysis programme Statistical Package for the Social Sciences.
The resulting radiomic features are classified with the open source Python programme with the NBalgorithms.
Figure 1. Block diagram of the proposed method
2.1. Patient information
The Cancer Imaging Archive (TCIA) is a popular portal in the world, allowing fully open access to medical images for cancer research. The MRI data of the patients in this study were obtained from TCIA (http://cancerimagingarchive.net/) of the National Cancer Institute, an institution responsible for cancer research affiliated with the National Institutes of Health [13]. TCIA is a data store that allows the use of medical images of various cancer cells in academic studies and research. It is an important source of open source information that supports studies in this field and contributes to science [8].
Mrı Brain Data Grade II (n=44) Grade III (n=77)
First Order n=18
Choice of Imaging T1, T2, Flair
Feature Selection n=21
Radiomic Feature Extraction
Tumor Segmentation 3D Slicer
Texture n=75
Classification Navie Bayes Algorithms
Shape n=14
Cinarer, G. & Emiroglu, B. G. (2020). Classification of brain tumours using radiomic features on MRI. New Trends and Issues Proceedings on Advances in Pure and Applied Sciences. (12), 80–90.
83
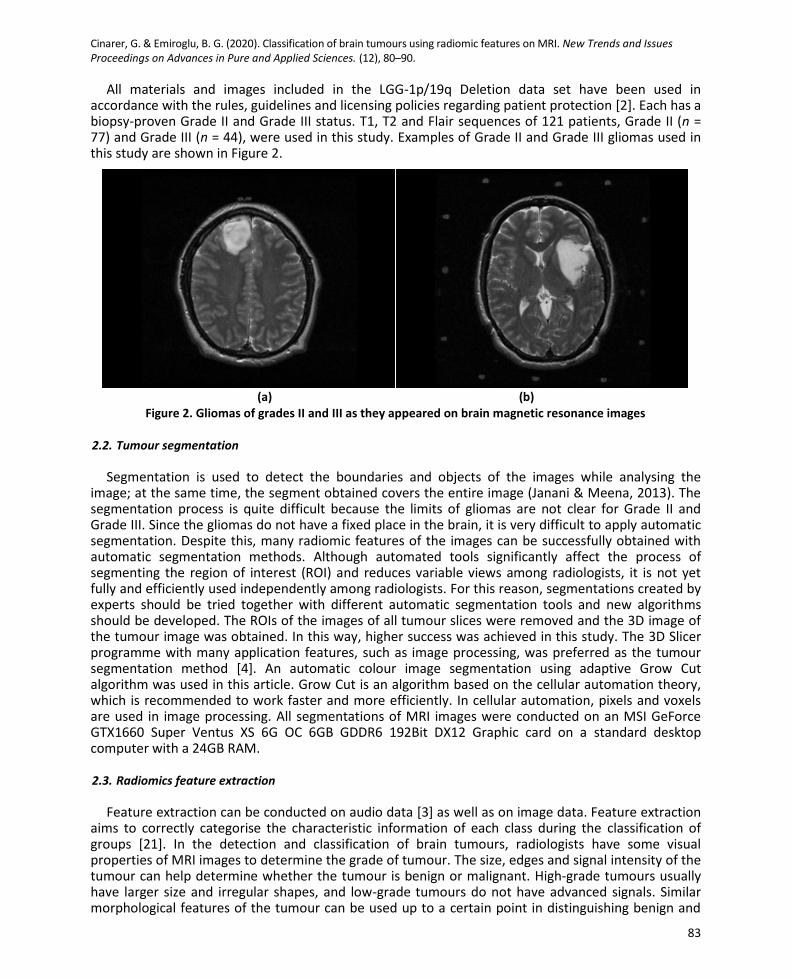
All materials and images included in the LGG-1p/19q Deletion data set have been used in accordance with the rules, guidelines and licensing policies regarding patient protection [2]. Each has a biopsy-proven Grade II and Grade III status. T1, T2 and Flair sequences of 121 patients, Grade II (n = 77) and Grade III (n = 44), were used in this study. Examples of Grade II and Grade III gliomas used in this study are shown in Figure 2.
(a) (b)
Figure 2. Gliomas of grades II and III as they appeared on brain magnetic resonance images
2.2. Tumour segmentation
Segmentation is used to detect the boundaries and objects of the images while analysing the image; at the same time, the segment obtained covers the entire image (Janani & Meena, 2013). The segmentation process is quite difficult because the limits of gliomas are not clear for Grade II and Grade III. Since the gliomas do not have a fixed place in the brain, it is very difficult to apply automatic segmentation. Despite this, many radiomic features of the images can be successfully obtained with automatic segmentation methods. Although automated tools significantly affect the process of segmenting the region of interest (ROI) and reduces variable views among radiologists, it is not yet fully and efficiently used independently among radiologists. For this reason, segmentations created by experts should be tried together with different automatic segmentation tools and new algorithms should be developed. The ROIs of the images of all tumour slices were removed and the 3D image of the tumour image was obtained. In this way, higher success was achieved in this study. The 3D Slicer programme with many application features, such as image processing, was preferred as the tumour segmentation method [4]. An automatic colour image segmentation using adaptive Grow Cut algorithm was used in this article. Grow Cut is an algorithm based on the cellular automation theory, which is recommended to work faster and more efficiently. In cellular automation, pixels and voxels are used in image processing. All segmentations of MRI images were conducted on an MSI GeForce GTX1660 Super Ventus XS 6G OC 6GB GDDR6 192Bit DX12 Graphic card on a standard desktop computer with a 24GB RAM.
2.3. Radiomics feature extraction
Feature extraction can be conducted on audio data [3] as well as on image data. Feature extraction aims to correctly categorise the characteristic information of each class during the classification of groups [21]. In the detection and classification of brain tumours, radiologists have some visual properties of MRI images to determine the grade of tumour. The size, edges and signal intensity of the tumour can help determine whether the tumour is benign or malignant. High-grade tumours usually have larger size and irregular shapes, and low-grade tumours do not have advanced signals. Similar morphological features of the tumour can be used up to a certain point in distinguishing benign and

Cinarer, G. & Emiroglu, B. G. (2020). Classification of brain tumours using radiomic features on MRI. New Trends and Issues Proceedings on Advances in Pure and Applied Sciences. (12), 80–90.
84
malignant tumours. Biopsy is inevitable when it cannot be determined. Biopsy is a very difficult and long process in brain tumours.
A large number of radiological features have been used to estimate grade levels and these features have been divided in to the categories as first-order, shape and textural. A total of 107 features, namely first-order feature (n = 18), shape feature (n = 14) and texture feature (n = 75), have been extracted with the 3D Slicer radiomic feature extraction module.
[12] explain the application of volumetric tumour execution with the 3D Slicer. As shown in Table 1, we extracted in an open-ended area the radiomic features and numbers. Morphological features, such as tumours’ shapes, geometric properties, margins, growth patterns, sphericity and surface area, are the main components used to determine tumour grade. Fourteen global shape features were extracted from the enhancing lesion. The first-order features reflect the brightness, density and colour distribution of the tissues of the MRI images with tumours. Eighteen first-order intensity features were extracted from the enhancing lesion and no statistical significance was found between the first-order features and glioma grades.
Textural features are a group of features commonly used to differentiate tumour types. Seventy-five textural features were removed from five different groups: the GLCM proposed by Haralick is referred to as the concurrency matrix [15]. The beginning of Thibault’s matrices is the grey-level size region matrix (GLSZM). The grey-level run length matrix (GLRLM) is the matrix used to extract different properties.
NGTDM, which is a neighbouring grey tone difference matrix, is a GLDM feature extraction matrices called GLDM. The structural conditions of the tissues in the tumour area can be determined from features, such as grey level, variance and emphasis. Table 1 shows the number of selected radiomic features from the groups and how many of these features will be used in classification.
Table 1. Radiomic feature numbers and distribution to groups
Class Feature type Selected feature Total radiomic features
GLCM Texture 1 24 GLSZM Texture 4 16 GLRLM Texture 1 16 NGTDM Texture 1 5 GLDM Texture 4 14 First order First order – 18 Shape Morphological 10 14 n=21 n=107
2.4. Statistical analysis and feature selection
The fact that there are too many features in the study extends the calculation time and the absence of a semantic relationship between the features, which reduces the classification accuracy. For this reason, feature selection was applied. Statistical analysis of data on radiomic features was conducted with SPSS, a statistical computer programme. These features were made by algorithms using the SPSS software. SPSS is a useful software that is widely preferred in medical studies as well as social sciences. Using the Mann–WhitneyU test included in the programme, we detected radiomic features that created significant semantics between Grade II and Grade III.
Relationships between the characteristics of each group were tested by Spearman’s correlation analysis. According to the Holm–Bonferroni method, the correlation value of 0.3–0.4 means medium correlation and p<0.05 is considered significant. In addition, properties with p<0.01 are considered statistically significant [16].
For all statistical tests, p<0.05 was considered statistically significant and 21 radiomic features were selected. Radiomic features and semantic levels selected from the groups are shown in Table 2.

Cinarer, G. & Emiroglu, B. G. (2020). Classification of brain tumours using radiomic features on MRI. New Trends and Issues Proceedings on Advances in Pure and Applied Sciences. (12), 80–90.
85
Table 2. Results of radiomic features analysis
Number Class Selected feature Mann whitney-U Test results
1 Shape Major axis length p = 0.000 p<0.001 2 Shape Maximum2D diameter column p = 0.000 p<0.001 3 Shape Maximum2D diameter row p = 0.000 p<0.001 4 Shape Maximum2D diameter slice p = 0.000 p<0.001 5 Shape Maximum3D diameter p = 0.000 p<0.001 6 Shape Mesh volume p = 0.000 p<0.001 7 Shape Minor axis length p = 0.000 p<0.001 8 Shape Sphericity p = 0.000 p<0.001 9 Shape Surface area p = 0.000 p<0.001
10 Shape Voxel volume p = 0.000 p<0.001 11 GLCM Variance p = 0.014 p<0.005 12 GLSZM Grey level non uniformity p = 0.000 p<0.001 13 GLSZM Size zone non uniformity p = 0.008 p<0.005 14 GLSZM Small area low grey level emphasis p = 0.010 p< 0.001 15 GLSZM Zone entropy p = 0.008 p<0.005 16 GLRLM Grey level non uniformity p = 0.007 p<0.005 17 NGTDM Coarseness p = 0.000 p<0.001 18 GLDM Dependence entropy p = 0.002 p<0.005 19 GLDM Dependence non uniformity p = 0.000 p<0.001 20 GLDM Large dependence high grey level emphasis p = 0.014 p<0.005 21 GLDM Small dependence low grey level emphasis p = 0.000 p<0.001
2.5. Classification
Classification is an important criterion for differentiating brain tumours as in all medical imagers. Differentiation of tumour grade is determined as high, low or Grades I, II, III and IV. Classification with the logic of computer algorithms is a data mining application used to categorise similar features within a certain group. The purpose of the classification is to accurately correct each tumour is to predict and assign to the appropriate class. NB classification algorithm has been applied to the data set using Python. For each NB machine learning classifier the criterion was applied ten times of cross-validation and the results were evaluated. NB is a set of supervised learning algorithms that are implemented with the assumption of naive independence between each feature [23].Gaussian Naive Bayes (GNB) is a convenient, easy and uncomplicated machine learning method [27]. In addition, having a fast algorithm structure has been effective in selecting NB algorithms; so, in this study, it has used to classify the grades of gliomas. GNB performed better than the Bernoulli Naive Bayes (BNB) classifier.
3. Results
All radiomic feature values for different sequences in regions containing glioma were carried out using the Mann–WhitneyU test since the data set did not have a normal distribution. Since the data set was in the 95% confidence interval, it was observed that the data set was suitable for the analysis. The significance level (p<0.005) between Grade II and Grade III tumours and the properties of the shape, first-order and texture groups was examined. It was observed that there were semantic differences between Grade II and III, with 11 of the 14 features of the shape group (p<0.001).
It was seen that there was a semantic difference between 7 features of the 11 features (p<0.005) from texture group. It was observed that 7 out of 11 features belonging to the texture group had p<0.005.In texture group, 4 features had p<0.001. The first-order group 18 especially between Grade II and III no significant difference was observed. Totally, there was a statistically significant difference between 21 out of 107 radiomic features and grade group. Figure 3 shows the correlation between the 21 selected radiomic features.

Cinarer, G. & Emiroglu, B. G. (2020). Classification of brain tumours using radiomic features on MRI. New Trends and Issues Proceedings on Advances in Pure and Applied Sciences. (12), 80–90.
86
Figure 3. Spearman’s correlation analysis of radiomic features
Correlations were evaluated by using Spearman’s correlation analysis between radiomic features.
There is a very strong positive statistically significant relationship between contrast and difference entropy features (r = 0.994 and p<0.001).In addition, there are positive correlations with difference average and difference entropy (r = 0.996, p = 0.008).It was also seen that the semantic relationship between Idmn features and other features was low. Most of the 21 features selected according to Spearman’s analysis were found to have a semantic relationship with each other.
GNB and BNB classifiers were used to distinguish between Grade II and Grade III images. The basic logic of the NB algorithm is the probability classifier that separates the values associated with each class according to the Gauss distribution in a certain algorithm [19]. The actual property values of classification algorithms were calculated from the test group.
GNB classifier had the best performance with accuracy 0.80%, recall 0.889% and f1-score 0.762%. Figure 4 shows the confusion matrices for the two classifiers in the test cohort for all 10-folds. The average accuracy of the two classifiers was 0.78%. Figure 5 shows the ROCs for the two classifiers in the test cohort for all 10-folds.

Cinarer, G. & Emiroglu, B. G. (2020). Classification of brain tumours using radiomic features on MRI. New Trends and Issues Proceedings on Advances in Pure and Applied Sciences. (12), 80–90.
87
(a) (b)
Figure 4.Confusion matrices. (a) GNB classifier. (b) BNB classifier
(a) (b)
Figure 5. Performance curves of the 10-fold cross-validation; (a) ROC for GNB classifier, (b) ROC for BNB classifier
4. Discussion
Radiologists function based on their personal experience in the detection of many tumours. However, in some cases, it is quite difficult and complex to distinguish tumours from image features. For example, the signal characteristics of tumours may sometimes be too similar to be distinguished by radiologists. Detailed quantitative features are extracted from MRI images by radiomic calculations and machine learning algorithms. This increases the interest in the developing radiomics field. It was determined that knowing the quantitative properties of gliomas is important in the diagnosis of tumour degrees. It was determined that the shape features can be used in tumour classification. GLCM variance value, GLDM dependency uniformity feature, NGTDM thickness feature were found to be statistically effective in distinguishing glioma degrees. In this study, the entropy feature of GLDM dependence was used to determine tumour levels. Similarly, entropy is an important radiomics feature in many studies [24]. [20] in their study analysed that mean ADC value for Grades II and III are lower than grade IV gliomas [20]. This shows that the 80% accuracy we obtain from radiomics features is a very high success for Grade (II and III) gliomas. In a study based on neural networks, they classified normal and malignant tumours with wavelet transform properties, and they achieved 0.83% accuracy [31].

Cinarer, G. & Emiroglu, B. G. (2020). Classification of brain tumours using radiomic features on MRI. New Trends and Issues Proceedings on Advances in Pure and Applied Sciences. (12), 80–90.
88
In another study, the authors used neural network to differentiate between metastatic tumours and meningiomas by their textural features, and they achieved 81% accuracy. In another brain tumour study examining the images of metastasis with glioblastoma, 71% classification performance was obtained with the Adaboost ensemble classifier [1]. [32] achieved 0.85% accuracy by selecting features in determining the grade of brain cancer. Cui et al. achieved 0.92% accuracy in their machine learning study with 50 patients assigned to high-grade glioma (HGG) and low-grade glioma (LGG) brain tumours [9]. It is normal to find higher results in distinguishing high grade and low grade tumours. In the classification of LGG and HGG, Xu Bi stated that the correlation of GLCM has the highest discrimination in texture features [6].
As can be seen, it is quite difficult to predict brain tumours completely with machine learning algorithms. Detecting a tumour that is not in the data set, especially among tens of tumours with similar images, is the most challenging part of machine learning algorithms. In addition, the importance of the radiomic features and correct segmentation procedure selected for correct classification should not be forgotten.
5. Conclusion
The radiomic features obtained in this research will guide researchers in the classification of brain tumours. In recent years, the use of radiomic features in machine and deep learning algorithms has provided considerable convenience in medical image processing. Facilitating systems can be developed for the treatment of diseases by using radiomic features in different datasets or medical imaging areas.
As a result, glioma grades can achieve successful results when imaging techniques, radiomic features, data mining algorithms and feature selection methods are presented in the right combination. We believe that the method presented in this study will contribute to distinguish between Grade II and Grade III brain tumours in future studies.
In addition, the importance of the radiomic features and correct segmentation procedure selected for correct classification should not be forgotten. References [1] Abidin, A. Z., Dar, I., D’Souza, A. M., Lin, E. P. & Wismuller, A. (2019). Investigating a quantitative
radiomics approach for brain tumor classification. Paper presented at the Medical Imaging 2019: Biomedical Applications in Molecular, Structural, and Functional Imaging.
[2] Akkus, Z., Ali, I., Sedlar, J., Agrawal, J. P., Parney, I. F., Giannini, C. & Erickson, B. J. (2017). Predicting deletion of chromosomal arms 1p/19q in low-grade gliomas from MR images using machine intelligence. Journal of Digital Imaging, 30(4), 469–476.
[3] Arslan, R. S. & Barisci, N. (2019). Development of output correction methodology for long short term memory-based speech recognition. Sustainability, 11(15), 4250.
[4] Artzi, M., Bressler, I. & Ben Bashat, D. (2019). Differentiation between glioblastoma, brain metastasis and subtypes using radiomics analysis. Journal of Magnetic Resonance Imaging, 50(2), 519–528.
[5] Bahadure, N. B., Ray, A. K. & Thethi, H. P. (2017). Image analysis for MRI based brain tumor detection and feature extraction using biologically inspired BWT and SVM. International Journal of Biomedical Imaging, 2017, 12.
[6] Bi, X., Liu, J. G. & Cao, Y. S. (2019). Classification of low-grade and high-grade glioma using multiparametric radiomics model. In IEEE 3rd Information Technology, Networking, Electronic and Automation Control Conference (ITNEC)(pp. 574–577). Piscataway, NJ: IEEE.

Cinarer, G. & Emiroglu, B. G. (2020). Classification of brain tumours using radiomic features on MRI. New Trends and Issues Proceedings on Advances in Pure and Applied Sciences. (12), 80–90.
89
[7] Chaddad, A., Desrosiers, C. & Toews, M. (2016). Radiomic analysis of multi-contrast brain MRI for the prediction of survival in patients with glioblastoma multiforme. Paper presented at the 2016 38th Annual International Conference of the IEEE Engineering in Medicine and Biology Society (EMBC).
[8] Clark, K., Vendt, B., Smith, K., Freymann, J., Kirby, J., Koppel, P., … Pringle, M. (2013). The cancer imaging archive (TCIA): maintaining and operating a public information repository. Journal of digital imaging, 26(6), 1045–1057.
[9] Cui, G., Jeong, J. J., Lei, Y., Wang, T., Liu, T., Curran, W. J., … Yang, X. (2019). Machine-learning-based classification of glioblastoma using MRI-based radiomic features. Paper presented at the Medical Imaging 2019: Computer-Aided Diagnosis.
[10] Dong, F., Li, Q., Jiang, B., Zhu, X., Zeng, Q., Huang, P., … Zhang, M. (2020). Differentiation of supratentorial single brain metastasis and glioblastoma by using peri-enhancing oedema region–derived radiomic features and multiple classifiers. European Radiology, 1–8.
[11] Duran, R. C.-D., Wang, C.-Y., Zheng, H., Deneen, B. & Wu, J. Q. (2019). Brain region-specific gene signatures revealed by distinct astrocyte subpopulations unveil links to glioma and neurodegenerative diseases. eneuro, 6(2).
[12] Egger, J., Kapur, T., Fedorov, A., Pieper, S., Miller, J. V., Veeraraghavan, H., …Kikinis, R. (2013). GBM volumetry using the 3D Slicer medical image computing platform. Scientific Reports, 3(1), 1–7.
[13] Erickson, B., Akkus, Z., Sedlar, J. & Kofiatis, P. (2017). Data from LGG-1p19qdeletion. The Cancer Imaging Archive.
[14] George, D. N., Jehlol, H. B. & Oleiwi, A. S. A. (2015). Brain tumor detection using shape features and machine learning algorithms. International Journal of Advanced Research in Computer Science and Software Engineering, 5(10), 454–459.
[15] Haralick, R. M., Shanmugam, K. & Dinstein, I. H. (1973). Textural features for image classification. IEEE Transactions on Systems, Man, and Cybernetics, SMC-3(6), 610–621.
[16] Holm, S. (1979). A simple sequentially rejective multiple test procedure. Scandinavian Journal of Statistics, 6(2), 65–70.
[17] Hsieh, K. L.-C., Lo, C.-M., & Hsiao, C.-J. (2017). Computer-aided grading of gliomas based on local and global MRI features. Computer Methods and Programs in Biomedicine, 139, 31–38.
[18] Hu, J., Zhao, Y., Liu, Y., Wang, F., Weng, Q. & You, R. (2020). Machine-learning-based computed tomography radiomic analysis for histologic subtype classification of thymic epithelial tumours. European Journal of Radiology, 126, 108929.
[19] Jiang, L., Wang, S., Li, C. & Zhang, L. (2016). Structure extended multinomial naive Bayes. Information Sciences, 329, 346–356.
[20] Kang, Y., Choi, S. H., Kim, Y.-J., Kim, K. G., Sohn, C.-H., Kim, J.-H., … Chang, K.-H. (2011). Gliomas: histogram analysis of apparent diffusion coefficient maps with standard-or high-b-value diffusion-weighted MR imaging—correlation with tumor grade. Radiology, 261(3), 882–890.
[21] Kumar, G. & Bhatia, P. K. (2014). A detailed review of feature extraction in image processing systems. Paper presented at the 2014 Fourth international conference on advanced computing & communication technologies.
[22] Liu, Q. & Liu, X. (2013). Feature extraction of human viruses microscopic images using gray level co-occurrence matrix. Paper presented at the 2013 International Conference on Computer Sciences and Applications.
[23] Mitchell, T. M. (1999). Machine learning and data mining. Communications of the ACM, 42(11), 30–36. [24] Ng, F., Ganeshan, B., Kozarski, R., Miles, K. A. & Goh, V. (2013). Assessment of primary colorectal cancer
heterogeneity by using whole-tumor texture analysis: contrast-enhanced CT texture as a biomarker of 5-year survival. Radiology, 266(1), 177–184.
[25] Nie, D., Lu, J., Zhang, H., Adeli, E., Wang, J., Yu, Z., … Shen, D. (2019). Multi-channel 3D deep feature learning for survival time prediction of brain tumor patients using multi-modal neuroimages. Scientific Reports, 9(1), 1–14.
[26] Qian, Z., Li, Y., Wang, Y., Li, L., Li, R., Wang, K., … Fan, X. (2019). Differentiation of glioblastoma from solitary brain metastases using radiomic machine-learning classifiers. Cancer Letters, 451, 128–135.

Cinarer, G. & Emiroglu, B. G. (2020). Classification of brain tumours using radiomic features on MRI. New Trends and Issues Proceedings on Advances in Pure and Applied Sciences. (12), 80–90.
90
[27] Raizada, R. D. & Lee, Y.-S. (2013). Smoothness without smoothing: why Gaussian naive Bayes is not naive for multi-subject searchlight studies. PloSOne, 8(7), e69566.
[28] Ramakrishna, R., Hebb, A., Barber, J., Rostomily, R. & Silbergeld, D. (2015). Outcomes in reoperated low-grade gliomas. Neurosurgery, 77(2), 175–184.
[29] Yurttakal, A. H., Erbay, H., Ikizceli, T. & Karacavus, S. (2019). Detection of breast cancer via deep convolution neural networks using MRI images. Multimedia Tools and Applications, 1–19.
[30] Yurttakal, A. H., Erbay, H., Ikizceli, T., Karacavus, S. & Cinarer, G. (2018). A comparative study on segmentation and classification in breast mri imaging. Institute of Integrative Omics and Applied Biotechnology Journal,9(5), 23–33.
[31] Zahran, B. M. (2014). Classification of brain tumor using neural network. International Review on Computers and Software, 9(4), 673–678.
[32] Zia, R., Akhtar, P. & Aziz, A. (2018). A new rectangular window based image cropping method for generalization of brain neoplasm classification systems. International Journal of Imaging Systems and Technology, 28(3), 153–162.
[33] Zinn, P. O., Singh, S. K., Kotrotsou, A., Hassan, I., Thomas, G., Luedi, M. M., … Mosley, J. (2018). A coclinical radiogenomic validation study: conserved magnetic resonance radiomic appearance of periostin-expressing glioblastoma in patients and xenograft models. Clinical Cancer Research, 24(24), 6288–6299.