Hydrological and Speleological Investigations in the Central & Western Taurus
Upload
independentCategory
view
0download
0
arX
iv:a
stro
-ph/
0304
414v
1 2
3 A
pr 2
003
New Low-Mass Members of the Taurus Star-Forming Region 1
K. L. Luhman2, Cesar Briceno3, John R. Stauffer4, Lee Hartmann5, D. Barrado y Navascues6, and Nelson
Caldwell7
ABSTRACT
Briceno et al. recently used optical imaging, data from the Two-Micron All-Sky Survey
(2MASS), and follow-up spectroscopy to search for young low-mass stars and brown dwarfs
in 8 deg2 of the Taurus star-forming region. By the end of that study, there remained candidate
members of Taurus that lacked the spectroscopic observations needed to measure spectral types
and determine membership. In this work, we have obtained spectroscopy of the 22 candidates
that have AV ≤ 8, from which we find six new Taurus members with spectral types of M2.75
through M9. The new M9 source has the second latest spectral type of the known members of
Taurus (∼ 0.02 M⊙). Its spectrum contains extremely strong emission in Hα (Wλ ∼ 950 A) as
well as emission in He I 6678 A and the Ca II IR triplet. This is the least massive object known
to exhibit emission in He I and Ca II, which together with the strong Hα are suggestive of intense
accretion.
Subject headings: infrared: stars — stars: evolution — stars: formation — stars: low-mass,
brown dwarfs — stars: luminosity function, mass function — stars: pre-main sequence
1. Introduction
Magnitude-limited searches for members of nearby star-forming regions are an important basis for
a variety of studies of young stars and brown dwarfs. For instance, such surveys provide well-defined
membership samples from which unbiased initial mass functions (IMFs) can be derived. In addition, newly
discovered young brown dwarfs are valuable targets for detailed studies of the formation of objects at the
bottom of the mass function.
The Taurus dark cloud complex has proven to be amenable to a census of its low-mass stars and brown
dwarfs. The members of this region are nearby (140 pc) and young (1 Myr), and thus can be detected
down to very low masses. In addition, because a majority of the members of Taurus (excluding protostars)
1Based on observations obtained at the Kitt Peak National Observatory, Keck Observatory, Fred Lawrence Whipple Obser-
vatory, and the MMT Observatory. This publication makes use of data products from the Two Micron All Sky Survey, which
is a joint project of the University of Massachusetts and the Infrared Processing and Analysis Center/California Institute of
Technology, funded by the National Aeronautics and Space Administration and the National Science Foundation.
2Harvard-Smithsonian Center for Astrophysics, 60 Garden St., Cambridge, MA 02138, USA; [email protected].
3Centro de Investigaciones de Astronomıa, Apartado Postal 264, Merida 5101-A, Venezuela; [email protected].
4SIRTF Science Center, Caltech MS 314-6, Pasadena, CA 91125, USA; [email protected].
5Harvard-Smithsonian Center for Astrophysics, 60 Garden St., Cambridge, MA 02138, USA; [email protected].
6Laboratorio de Astrofısica Espacial y Fısica Fundamental, INTA, PO Box 50727, 28080 Madrid, Spain; [email protected].
7Harvard-Smithsonian Center for Astrophysics, 60 Garden St., Cambridge, MA 02138, USA; [email protected].
– 2 –
exhibit relatively low extinction (AV . 5), they are accessible to measurements at both optical and infrared
(IR) wavelengths. Over time, surveys for new members in this low-density, dispersed population (n ∼ 1-
10 pc−3) have steadily expanded in areal coverage (Strom & Strom 1994; Briceno et al. 1998; Luhman &
Rieke 1998; Luhman 2000; Martın et al. 2001). Most recently, Briceno et al. (2002) used wide-field optical
imaging, 2MASS data, and followup spectroscopy to search for low-mass stars and brown dwarfs in 8 deg2
that encompassed half of the known pre-main sequence population in Taurus. They discovered nine new
members with spectral types of M5.75-M9.5, corresponding to masses of 0.1-0.015 M⊙ by the theoretical
evolutionary models of Baraffe et al. (1998).
At the conclusion of the study by Briceno et al. (2002), there remained candidate members of Taurus that
had not been observed spectroscopically. In this paper, we identify the most promising of those candidates
(§ 2), describe spectroscopic observations of them (§ 3), measure spectral types and determine whether they
are Taurus members (§ 4), and discuss the physical properties of the six new members and update the IMF
from Briceno et al. (2002) (§ 5).
2. Selection of Candidate Members of Taurus
Briceno et al. (2002) used optical and near-IR photometry to select potential young stars and brown
dwarfs in 8 deg2 of Taurus. In this section, we examine the photometry from that survey to identify the
remaining candidates that lack the spectroscopy needed to confirm membership in Taurus and to measure
spectral types. To do this, we could simply use the observed color-magnitude and color-color diagrams (e.g.,
I vs. I − Z, J − H vs. I − Ks) in the manner described by Briceno et al. (2002). Instead, we revise those
methods in a way that more clearly separates Taurus members from field stars.
We wish to identify the stars in the fields surveyed by Briceno et al. (2002) that have both the colors and
the absolute photometry expected of members of the Taurus population. Optical color-magnitude diagrams
(CMDs) are widely used for selecting candidate members of clusters on this basis. However, in star-forming
clouds, the presence of highly variable extinction (AV = 0-20 in Taurus) increases the contamination of
background stars in the region of the CMD inhabited by members and prevents reliable mass estimates
for candidate members (i.e., reddened high-mass members and unreddened low-mass members can have the
same optical color and magnitude). The photometry in such diagrams cannot be corrected for extinction
when only two bands are available. In the case of the Taurus fields, in addition to I and Z photometry, we
have near-IR data from 2MASS. As a result, we have been able to estimate the extinction toward each star
by dereddening its position in J −H versus I − Ks until it intersects the sequence of colors for dwarfs later
than K6 (Leggett 1992), which is the range of spectral types occupied by most known members of Taurus.
If a star has a spectral type earlier than K6, the extinction will be underestimated in this method, but that
is acceptable. The dereddening process tends to remove background stars from the area of the CMD where
members reside, and if a star’s extinction is underestimated, then at worst it remains in that area and is
selected as a candidate. In other words, an underestimate of extinction will not result in the rejection of a
bonafide member. After correcting the photometry for extinction in this way, we plot the results on CMDs
of I − Ks versus H and I − Z versus H in Figure 1. We choose H as the magnitude because it correlates
closely with bolometric luminosity, requires only a small correction for extinction, and is not susceptible
to significant contamination from excess emission from circumstellar material. Meanwhile, the I − Ks and
I − Z colors are used because they increase rapidly with decreasing mass, producing a member sequence
that is distinct from the location of most field stars in the CMDs. In Figure 1, we omit the stars appearing
below the reddening vector in the diagram of I versus I − Z in Briceno et al. (2002) because they are well
– 3 –
below the member sequence and thus are likely to be field stars. From the ∼ 250 stars that remain, we
plot only those that exhibit extinctions of AV ≤ 8. We are primarily interested in identifying candidate
members at lower extinctions that might fall within the limit of AV ≤ 4 that defined the IMF from Briceno
et al. (2002) so that we can approach 100% completeness for that sample. The extinctions derived for the
construction of Figure 1 are only rough estimates since they are based on photometry alone without any
information on the spectral types. Therefore, to be certain that members at AV ≤ 4 were not missed, we
considered a threshold of AV ≤ 8 in selecting candidates. In Figure 1, we include all objects that have been
spectroscopically confirmed as members in this work and in previous studies for the Taurus fields in question.
We also indicate the field stars identified through our new spectroscopy, while omitting the field stars found
in previous work.
We now describe the regions in Figure 1 that are inhabited by Taurus members and examine the
photometry to identify any potential members that lack previous spectra. When the known members of
Taurus are placed on a Hertzsprung-Russell (H-R) diagram, they exhibit median and maximum ages of ∼ 1
and 10 Myr, respectively, on the model isochrones of Baraffe et al. (1998), except at the latest spectral types,
where some of the members appear between the isochrones for 10 and 30 Myr (Briceno et al. (2002), § 5.2).
We plot the 10 Myr isochrone from 0.015 to 1 M⊙ in the diagram of I−Ks versus H in Figure 1 by combining
the predicted effective temperatures and bolometric luminosities (Baraffe et al. 1998), a temperature scale this
is compatible with the adopted models (Luhman 1999; Luhman et al. 2003), dwarf colors and bolometric
corrections (Leggett 1992; Luhman 1999), and a distance modulus of 5.76 (Wichmann et al. 1998). The
plateau near H = 13.5 in the resulting isochrone in Figure 1, which does not appear in a plot of the
isochrone in Teff versus Lbol, reflects the rapid increase in I − Ks between M5 and M9. Because standard
values of intrinsic I−Z as a function of spectral type are not available, we cannot plot the isochrone in I−Z
versus H . However, the lower envelope of the sequence of known members in I − Z versus H effectively
delineates the location of the 10 Myr isochrone (except at late types, or I − Z > 1.7) and the line above
which we should search for new members. Approximately 23 stars lack spectra and fall near the member
sequences in both of the CMDs in Figure 1. In the next section, we describe spectroscopy of 22 of these stars,
which are listed in Tables 1 and 2. The remaining source is 2MASSs 0435283+241000, which has dereddened
photometry of H = 15.75, I − Z = 2.33, and I − Ks = 4.89. We did not observe this star because it is at
the detection limits of both the optical and 2MASSs data and therefore its positions in the CMDs are highly
uncertain.
3. Spectroscopic Observations of Candidates
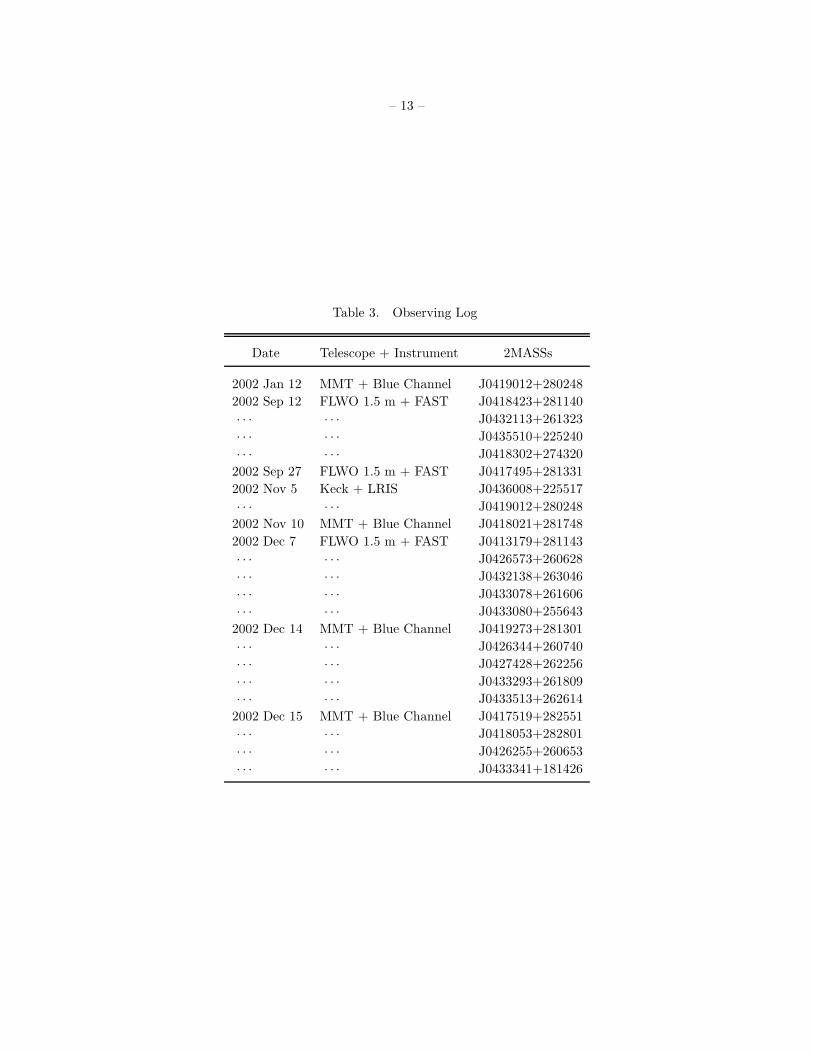
Table 3 summarizes our observations of the 22 candidate members of Taurus identified in the previ-
ous section. One of these objects, 2MASSs J0419012+280248, was observed on two occasions. The FAST
spectrometer (Fabricant et al. 1998) on the 1.5 m Tillinghast reflector at the Fred Lawrence Whipple Obser-
vatory was operated with the 300 l mm−1 grating (λblaze = 4800 A) and 2.′′0 slit, providing a resolution of
FWHM= 5 A. The Keck I low-resolution imaging spectrometer (LRIS; Oke et al. 1995) was configured with
the 400 l mm−1 grating (λblaze = 8500 A), GG495 blocking filter, and 1.′′0 slit (FWHM= 6 A). With the
Blue Channel spectrometer at the MMT Observatory, we used the 600 l mm−1 grating (λblaze = 9630 A),
LP495 blocking filter, and 1.′′0 slit (FWHM= 2.7 A). Each spectrum was collected with the slit rotated to the
parallactic angle. The exposure times ranged from 300 to 2700 s. After bias subtraction and flat-fielding, the
spectra were extracted and calibrated in wavelength with arc lamp data. The spectra were then corrected
for the sensitivity functions of the detectors, which were measured from observations of spectrophotometric
– 4 –
standard stars.
4. Spectral Classification of Candidates
We measure spectral types and assess membership for the 22 candidate Taurus members that were
observed spectroscopically by applying the methods of classification described in our previous studies of
Taurus and other young populations (Luhman 1999; Briceno et al. 2002).
We classify 13 candidates as background giants and one candidate as a background early-type star.
Strong absorption in the Ca II triplet is the most distinguishing feature of the giants, as illustrated for two
of these stars in Figure 2. The data for the other eight candidates are displayed in Figure 2. Two of these
stars, 2MASSs J0418021+281748 and J0436008+225517, are below the main sequence when placed on the
H-R diagram with the distance of Taurus, which indicates that they are probably field dwarfs behind the
star-forming region. Although young stars that are observed in scattered light can appear at comparable
positions on the H-R diagram (Briceno et al. (2002), § 5.2), such stars usually exhibit emission in Hα or
some other evidence of youth. However, no such signatures are found in the data for these two stars. In
addition, the strength of the K I and Na I absorption in the spectrum of 2MASSs J0436008+225517 provides
conclusive evidence that it is a field dwarf.
The spectra for the six remaining sources in Figure 2 exhibit evidence of youth, and thus membership in
Taurus, in the form of the weak K I and Na I absorption features that are characteristic of pre-main-sequence
objects (Martın et al. 1996; Luhman et al. 1998a,b; Luhman 1999). The membership of five of these sources
is independently established by the presence of reddening in their spectra and their positions above the main
sequence for the distance of Taurus, which indicate that they cannot be field dwarfs in the foreground or
the background of the cloud, respectively. The equivalent widths of Hα emission in KPNO-Tau 11, 13, and
15 are consistent with those of both active field dwarfs and young objects. Meanwhile, the much stronger
emission in KPNO-Tau 10, 12, and 14 is common among the latter but rare in the former (Gizis et al.
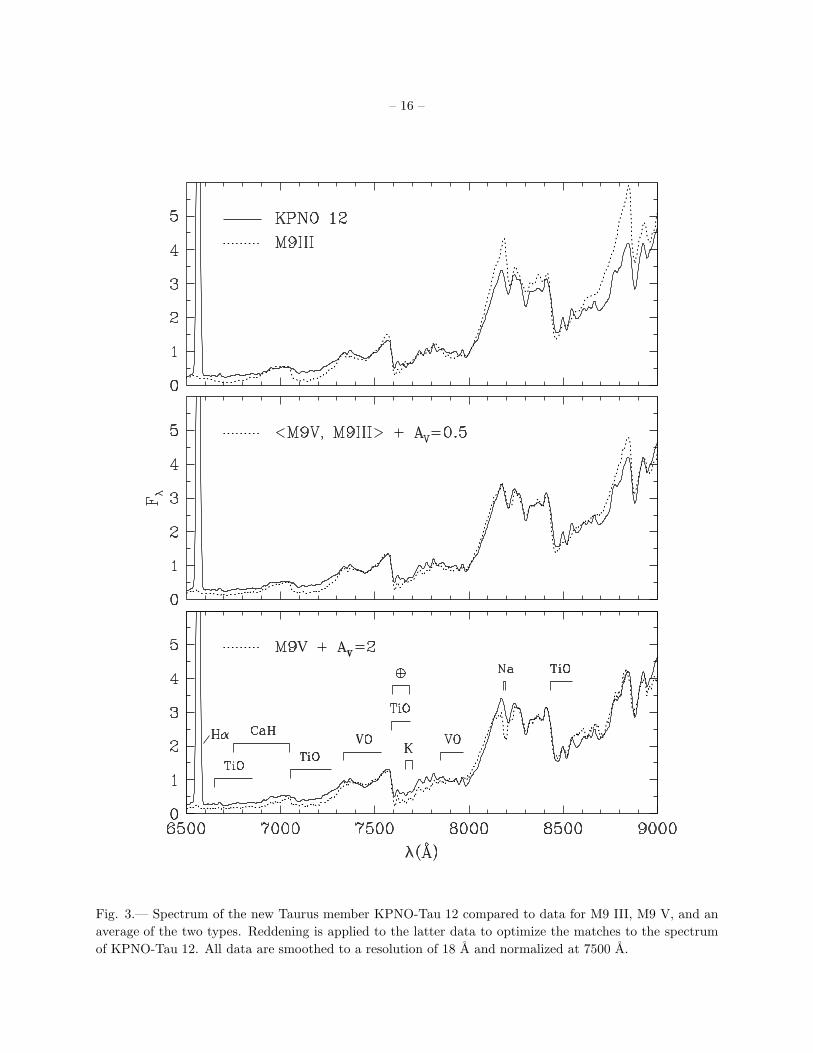
2000). For the coolest new member, KPNO-Tau 12, we find that the best match to the optical spectrum is
provided with an average of dwarf and giant spectra (normalized at 7500 A), as shown in Figure 3, which
is consistent with the results of our previous classifications of young objects later than M6 (Luhman 1999;
Briceno et al. 2002). The spectrum for KPNO-Tau 12 in Figure 3 is from the November observations with
Keck. We did not use the January data from the MMT in measuring the spectral type of this object because
the signal-to-noise was too low.
The classifications and other measurements for the 16 background field stars and the six new Taurus
members are listed in Tables 1 and 2, respectively. The photometric errors are ∼ 0.1 mag for KPNO-Tau 12
and ∼ 0.03 mag for the remaining sources.
5. Properties of New Members
In this section, we use the photometry, spectroscopy, and theoretical evolutionary models to examine
the physical properties of the six new Taurus members.
– 5 –
5.1. Disk and Accretion Signatures
Excess continuum emission and optical emission lines are signatures of circumstellar disks and accretion
that could appear in the available data for the new Taurus members. The near-IR colors of the six new
members match those of reddened dwarfs and have no significant excess emission in the K-band. This
is consistent with the observation that only half of the known members of Taurus exhibit K-band excess
emission, while a much larger fraction show evidence for disks in photometry at longer bandpasses such
as L (Kenyon & Hartmann 1995; Haisch et al. 2000). Five of the new members show moderate to strong
emission in Hα (Wλ = 6-36 A) that is typical of young stars in Taurus, while the M9 object KPNO-Tau 12
exhibits a far larger equivalent width. A given value of LHα/Lbol corresponds to larger equivalent widths at
later spectral types as the stellar continuum surrounding Hα becomes weaker. In addition, when this faint
continuum is detected at low signal-to-noise, it is possible to erroneously measure arbitrarily large values of
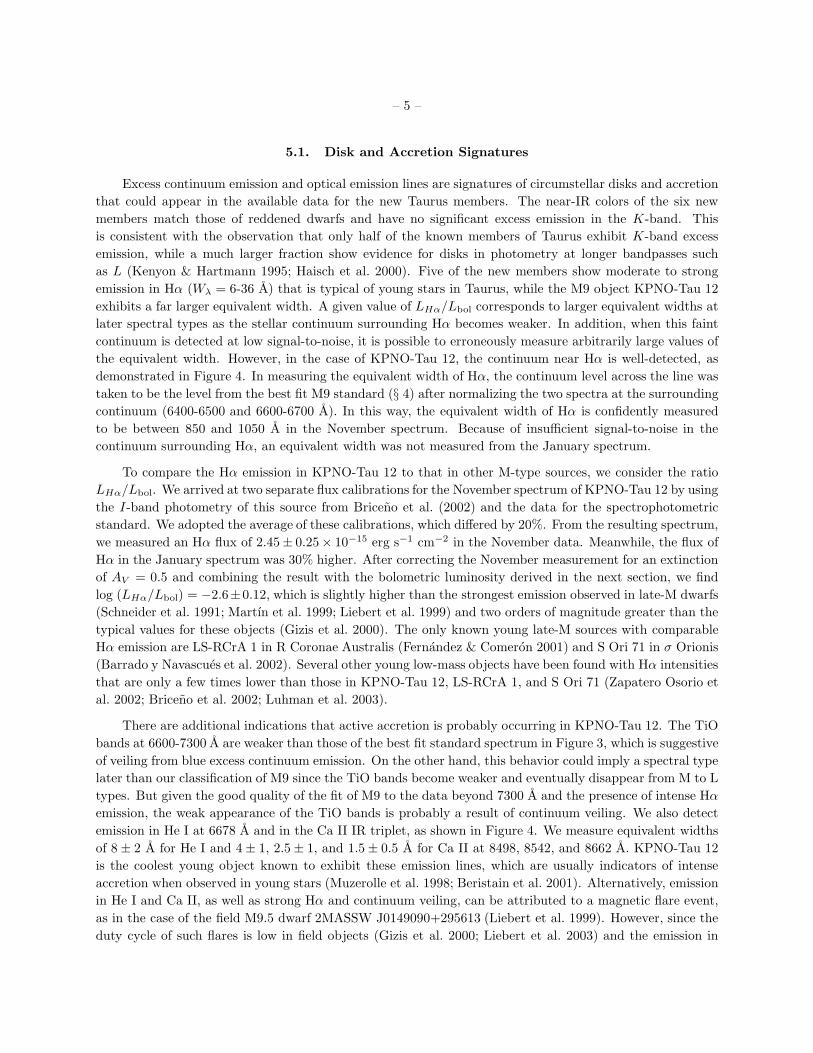
the equivalent width. However, in the case of KPNO-Tau 12, the continuum near Hα is well-detected, as
demonstrated in Figure 4. In measuring the equivalent width of Hα, the continuum level across the line was
taken to be the level from the best fit M9 standard (§ 4) after normalizing the two spectra at the surrounding
continuum (6400-6500 and 6600-6700 A). In this way, the equivalent width of Hα is confidently measured
to be between 850 and 1050 A in the November spectrum. Because of insufficient signal-to-noise in the
continuum surrounding Hα, an equivalent width was not measured from the January spectrum.
To compare the Hα emission in KPNO-Tau 12 to that in other M-type sources, we consider the ratio
LHα/Lbol. We arrived at two separate flux calibrations for the November spectrum of KPNO-Tau 12 by using
the I-band photometry of this source from Briceno et al. (2002) and the data for the spectrophotometric
standard. We adopted the average of these calibrations, which differed by 20%. From the resulting spectrum,
we measured an Hα flux of 2.45± 0.25× 10⁻¹⁵ erg s−1 cm−2 in the November data. Meanwhile, the flux of
Hα in the January spectrum was 30% higher. After correcting the November measurement for an extinction
of AV = 0.5 and combining the result with the bolometric luminosity derived in the next section, we find
log (LHα/Lbol) = −2.6±0.12, which is slightly higher than the strongest emission observed in late-M dwarfs
(Schneider et al. 1991; Martın et al. 1999; Liebert et al. 1999) and two orders of magnitude greater than the
typical values for these objects (Gizis et al. 2000). The only known young late-M sources with comparable
Hα emission are LS-RCrA 1 in R Coronae Australis (Fernandez & Comeron 2001) and S Ori 71 in σ Orionis
(Barrado y Navascues et al. 2002). Several other young low-mass objects have been found with Hα intensities
that are only a few times lower than those in KPNO-Tau 12, LS-RCrA 1, and S Ori 71 (Zapatero Osorio et
al. 2002; Briceno et al. 2002; Luhman et al. 2003).
There are additional indications that active accretion is probably occurring in KPNO-Tau 12. The TiO
bands at 6600-7300 A are weaker than those of the best fit standard spectrum in Figure 3, which is suggestive
of veiling from blue excess continuum emission. On the other hand, this behavior could imply a spectral type
later than our classification of M9 since the TiO bands become weaker and eventually disappear from M to L
types. But given the good quality of the fit of M9 to the data beyond 7300 A and the presence of intense Hα
emission, the weak appearance of the TiO bands is probably a result of continuum veiling. We also detect
emission in He I at 6678 A and in the Ca II IR triplet, as shown in Figure 4. We measure equivalent widths
of 8 ± 2 A for He I and 4 ± 1, 2.5 ± 1, and 1.5 ± 0.5 A for Ca II at 8498, 8542, and 8662 A. KPNO-Tau 12
is the coolest young object known to exhibit these emission lines, which are usually indicators of intense
accretion when observed in young stars (Muzerolle et al. 1998; Beristain et al. 2001). Alternatively, emission
in He I and Ca II, as well as strong Hα and continuum veiling, can be attributed to a magnetic flare event,
as in the case of the field M9.5 dwarf 2MASSW J0149090+295613 (Liebert et al. 1999). However, since the
duty cycle of such flares is low in field objects (Gizis et al. 2000; Liebert et al. 2003) and the emission in
– 6 –
KPNO-Tau 12 was strong at both epochs of our observations, the emission in KPNO-Tau 12 is probably
not from a flare event. Given that KPNO-Tau 12 is member of a star-forming region, it is much more likely
that the emission in Hα, He I, Ca II, and the blue continuum are the result of active accretion.
5.2. Extinctions, Temperatures, and Luminosities
Following the procedures described by Briceno et al. (2002), we estimate extinctions, effective tempera-
tures, and bolometric luminosities from the spectral types and photometry for the six new Taurus members.
The values for these parameters are listed in Table 2. The combined uncertainties in AJ , J , and BCJ
(σ ∼ 0.14, 0.03, 0.1) correspond to errors of ±0.07 in the relative values of log Lbol. When an uncertainty in
the distance modulus is included (σ ∼ 0.2), the total uncertainties are ±0.11. We use the temperatures and
luminosities in Table 2 to place the six sources on the H-R diagram in Figure 5. For reference, we also show
the previously known Taurus members that have AV ≤ 4 and are within the 8.4 deg2 surveyed by Briceno
et al. (1998), Luhman (2000), and Briceno et al. (2002), which comprise the IMF sample from Briceno et al.
(2002). The five new members at M3-M6 fall within this sequence of members, which is spread between < 1
and 10 Myr for most masses. Meanwhile, the new M9 source KPNO-Tau 12 appears near the 30 Myr model
isochrone of Baraffe et al. (1998), as does one of the previously known M8.5 members. An age of 30 Myr
is much larger than expected given the median age of 1 Myr for the Taurus population and the apparent
presence of active accretion in KPNO-Tau 12. Interestingly, the one other young late-M source known to
exhibit accretion signatures in the form of He I and Ca II emission, LS-RCrA 1, also falls much lower on the
H-R diagram than expected (Fernandez & Comeron 2001).
We consider three possible explanations for the anomalously old ages implied by the H-R diagrams of
some late-M sources, particularly KPNO-Tau 12 and LS-RCrA 1. First, there could be deficiencies in either
the models or the conversion of spectral types to temperatures. In this work, we use a temperature scale that
has been adjusted at late spectral types so that the low-mass members of Taurus and IC 348 have median
ages comparable to the ones of the higher mass sources (Luhman et al. 2003). As a result, the adopted
combination of models and temperature scale should produce the most reliable age and mass estimates that
are currently possible. However, as suggested by Fernandez & Comeron (2001) in the case of LS-RCrA 1,
intense accretion could produce an evolutionary path on the H-R diagram that differs from that predicted
by models of non-accreting objects. Indeed, both of the known late-M objects with evidence for accretion
in the form of He I and Ca II emission are subluminous on the H-R diagram. Fernandez & Comeron (2001)
proposed a second explanation for the low luminosity of LS-RCrA 1 in which this object is seen in scattered
light. For a young star that is occulted by an optically thick structure such as an edge-on disk, the observed
photometry measures only the scattered light. As a result, the luminosity implied by the photometry is
an underestimate, and the star appears subluminous for its temperature on the H-R diagram. For a low-
mass source undergoing intense accretion, it is possible that a significant fraction of the object is blocked
by accreting circumstellar material, which could account for the correlation between accretion activity and
low luminosity for KPNO-Tau 12 and LS-RCrA 1. However, this occulting mechanism would need to be
more efficient for brown dwarfs than for stars since young stars in Taurus with He I emission do not have
systematically lower luminosities than other stellar members. As a third possibility, the old ages inferred
from the model isochrones could result from errors in the luminosity estimates of young sources. The finite
width of the Taurus sequence on the H-R diagram could arise not from a spread in ages but from various
sources such as extinction uncertainties, unresolved binaries, variability from accretion and from rotation of
spotted surfaces, and differences in distances to individual members (Kenyon & Hartmann 1990; Hartmann
– 7 –
2001). If so, then the width of the sequence in log L should remain roughly constant at all masses, and thus
correspond to an increasing apparent spread of ages as the separation between model isochrones in log L
decreases from stellar to substellar masses. This phenomenon probably produces erroneously old ages on the
model isochrones for at least some low-mass members of young clusters, but would not explain the fact that
both late-type objects showing He I emission are subluminous.
5.3. Masses
We now consider the masses of the new Taurus members. By combining the positions on the H-R
diagram with the evolutionary models of Baraffe et al. (1998), we infer masses of 0.10, 0.13, 0.15, 0.16, and
0.4 M⊙ for KPNO-Tau 14, 11, 13, 10, and 15. These mass estimates are not sensitive to uncertainties in
the luminosities since the predicted evolution of a star is mostly vertical on the H-R diagram for ages of
< 10 Myr. However, this is not true at substellar masses, where the mass tracks have significant components
in both temperature and luminosity. The models imply a mass of 0.03 M⊙ for the M9 object KPNO-Tau 12
based on its position on the H-R diagram. Under two of the three explanations for the low luminosity of this
source (§ 5.2), the luminosity estimate is uncertain. In these cases, a more reliable mass is derived by placing
the object on the 1 Myr isochrone for the adopted temperature, which would imply a mass of 0.015 M⊙
from the models of Baraffe et al. (1998). For the third explanation in which the temperature and luminosity
are significantly affected by accretion, KPNO-Tau 12 could have an even lower mass (Fernandez & Comeron
2001). If this object does have a mass below 0.015 M⊙, one might be tempted to refer to it as an accreting
free-floating planetary mass object. However, the various properties of low-mass brown dwarfs – such as the
evidence of intense accretion in objects like KPNO-Tau 12 – indicate that they probably form in a star-like
fashion rather than in circumstellar disks (Briceno et al. 2002). Therefore, the term “planetary” has little
or no applicability. For the purposes of this work, we adopt a mass of 0.02 M⊙ for this object.
As mentioned previously, the IMF presented by Briceno et al. (2002) included the 86 known Taurus
members that fell within the 8.4 deg2 surveyed by Briceno et al. (1998), Luhman (2000), and Briceno et
al. (2002) and that had extinctions of AV ≤ 4. There remained a few potential members that lacked
spectroscopy within these defining parameters, so the IMF sample was not 100% complete. However, because
the candidates were not concentrated at a particular magnitude range, Briceno et al. (2002) concluded that
the sample of confirmed members was unbiased in mass down to the completeness limit of the photometry,
which corresponded to 0.02 M⊙ for AV = 4. Through spectroscopy of those candidates, we have found six
new members, all of which have A ≤ 4. After adding these sources to the extinction-limited sample from
Briceno et al. (2002), we arrive at the IMF in Figure 6, which should be virtually 100% complete for AV ≤ 4
and masses above 0.02 M⊙ in the 8.4 deg2 survey fields. Because of the small number of new members that
are added to the IMF from Briceno et al. (2002) and the wide range of masses of these new sources, the
shapes of the IMFs here and in Briceno et al. (2002) do not differ significantly. Thus, the conclusions from
Briceno et al. (2002) regarding the observed variations in the IMFs of Taurus and the Trapezium remain
unchanged.
6. Conclusions
We have obtained spectroscopy for candidate young stars and brown dwarfs that appeared in an optical
and IR photometric survey of 8 deg2 of the Taurus star-forming region by Briceno et al. (2002). We
– 8 –
have estimated individual extinctions for the stars detected in the survey and have plotted the dereddened
photometry on color-magnitude diagrams. Within an extinction limit of AV ≤ 8, we identified 22 sources that
were potential members of Taurus and that lacked previous spectroscopy. Through optical spectroscopy of
these candidates, we have discovered six new members with spectral types ranging from M2.75 to M9. From
the spectral types and photometry of these objects, we have estimated extinctions, effective temperatures,
and bolometric luminosities, and have combined these results with the evolutionary models of Baraffe et
al. (1998) to infer individual masses that range from 0.4 to 0.02 M⊙. These new members fall within
the extinction limit of AV ≤ 4 that defined the sample from which Briceno et al. (2002) derived an IMF.
Therefore, we have added them to that extinction-limited sample and have presented the updated IMF,
which applies to the 8.4 deg2 in Taurus surveyed by Briceno et al. (1998), Luhman (2000), and Briceno et
al. (2002). The new M9 source is a particularly interesting discovery from this work. It has the second latest
spectral type of the known members of Taurus. In addition, it exhibits the strongest Hα emission observed
to date for a late-M source (Wλ ∼ 950 A, log (LHα/Lbol) = −2.6) and is the least massive object found with
emission in He I 6678 A and the Ca II IR triplet, which are suggestive of active accretion. High-resolution
spectroscopy of the emission lines in this object would provide valuable insight into the formation of low-mass
brown dwarfs.
We thank Perry Berlind and Mike Calkins for performing the FAST observations. K. L. was supported
by grant NAG5-11627 from the NASA Longterm Space Astrophysics program. C. B. received partial support
from grant S1-2001001144 of the Fondo Nacional de Ciencia y Tecnologıa (FONACYT) of Venezuela. We are
grateful to France Allard and Isabelle Baraffe for access to their most recent calculations. This research has
made use of the NASA/IPAC Infrared Science Archive, which is operated by the Jet Propulsion Laboratory,
California Institute of Technology, under contract with the National Aeronautics and Space Administration.
Some of the data presented herein were obtained at the W. M. Keck Observatory, which is operated as a
scientific partnership among the California Institute of Technology, the University of California, and the
National Aeronautics and Space Administration. The Observatory was made possible by the generous
financial support of the W. M. Keck Foundation. We wish to extend special thanks to those of Hawaiian
ancestry on whose sacred mountain we are privileged to be guests. Without their generous hospitality, some
of the observations presented herein would not have been possible. Some of the data in this work were
obtained at the MMT Observatory, a joint facility of the Smithsonian Institution and the University of
Arizona.
– 9 –
REFERENCES
Baraffe, I., Chabrier, G., Allard, F., & Hauschildt, P. H. 1998, A&A, 337, 403
Barrado y Navascues, D., Zapatero Osorio, M. R., Martın, E. L., Bejar, V. J. S., Rebolo, R., & Mundt, R.
2002, A&A, 393, L85
Beristain, G., Edwards, S., & Kwan, J. 2001, ApJ, 551, 1037
Briceno, C., Hartmann, L., Stauffer, J., & Martın, E. L., 1998, AJ, 115, 2074
Briceno, C., Luhman, K. L., Hartmann, L., Stauffer, J. R., & Kirkpatrick, J. D. 2002, ApJ, 580, 317
Fabricant, D., Cheimets, P., Caldwell, N., & Geary, J. 1998, PASP, 110, 79
Fernandez, M., & Comeron, F. 2001, A&A, 380, 264
Gizis, J. E., Monet, D. G., Reid, I. N., Kirkpatrick, J. D., Liebert, J., & Williams, R. J. 2000, AJ, 120, 1085
Haisch, K. E., Lada, E. A., & Lada, C. J. 2000, AJ, 120, 1396
Hartmann, L. 2001, AJ, 121, 1030
Kenyon, S. J., & Hartmann, L. 1990, ApJ, 349, 197
Kenyon, S. J., & Hartmann, L. 1995, ApJS, 101, 117
Kirkpatrick, J. D., Henry, T. J., & Irwin, M. J. 1997, AJ, 113, 1421
Leggett, S. K. 1992, ApJS, 82, 351
Liebert, J., Kirkpatrick, J. D., Cruz, K. L., Reid, I. N., Burgasser, A., Tinney, C. G., & Gizis, J. E. 2003,
AJ, 125, 343
Liebert, J., Kirkpatrick, J. D., Reid, I. N., & Fisher, M. 1999, ApJ, 519, 345
Luhman, K. L. 1999, ApJ, 525, 466
Luhman, K. L. 2000, ApJ, 544, 1044
Luhman, K. L., Briceno, C., Rieke, G. H., & Hartmann, L. W. 1998a, ApJ, 493, 909
Luhman, K. L., & Rieke, G. H. 1998, ApJ, 497, 354
Luhman, K. L., Rieke, G. H., Lada, C. J., & Lada, E. A. 1998b, ApJ, 508, 347
Luhman, K. L., et al. 2003, ApJ, submitted
Martın, E. L., Basri, G., & Zapatero Osorio, M. R. 1999, AJ, 118, 1005
Martın, E. L., Dougados, C., Magnier, E., Menard, F., Magazzu, A., Cuilandre, J.-C., & Delfosse, X. 2001,
ApJ, 561, L195
Martın, E. L., Rebolo, R., & Zapatero Osorio, M. R. 1996, ApJ, 469, 706
Muzerolle, J., Hartmann, L., & Calvet, N. 1998, AJ, 116, 455
– 10 –
Oke, J.B., et al. 1995, PASP, 107, 375
Schneider, D. P., Greenstein, J. L., Schmidt, M., & Gunn, J. E. 1991, AJ, 102, 1180
Strom, K. M., & Strom, S. E. 1994, ApJ, 424, 237
Wichmann, R., Bastian, U., Krautter, J., Jankovics, I., & Rucinski, S. M. 1998, MNRAS, 301, L39
Zapatero Osorio, M. R., Bejar, V. J. S., Martın, E. L., Barrado y Navascues, D., & Rebolo, R. 2002, ApJ,
569, L99
This preprint was prepared with the AAS LATEX macros v5.0.
– 11 –
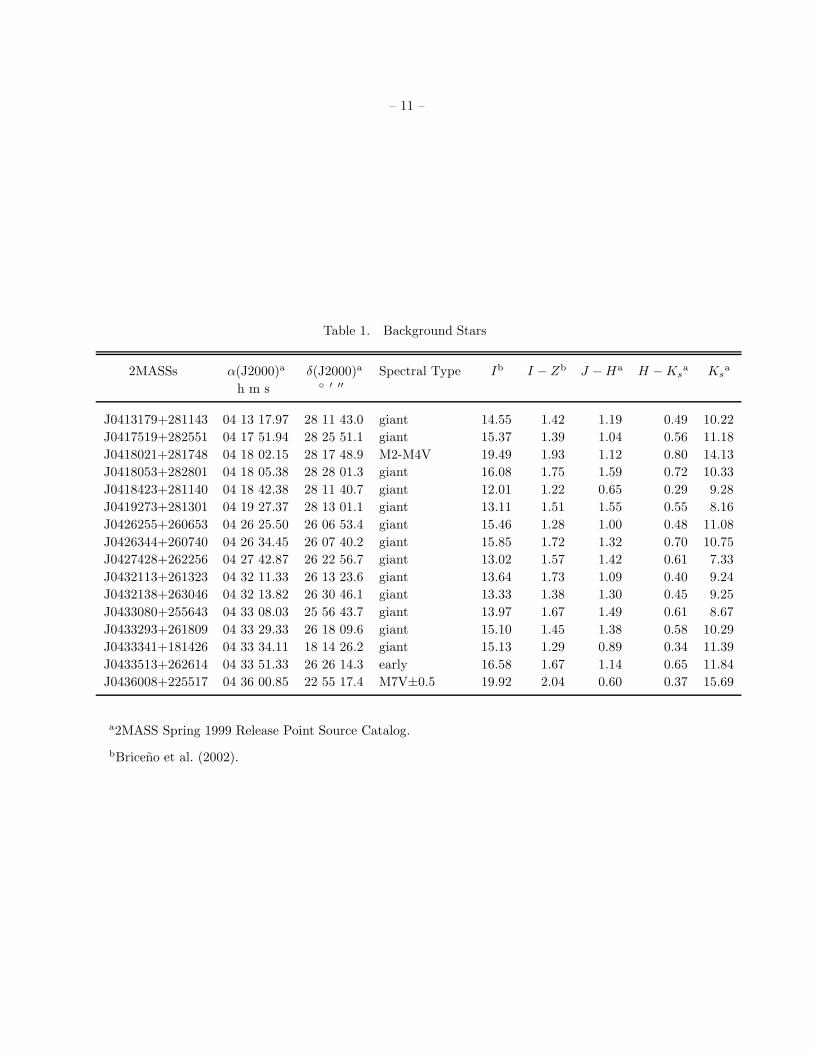
Table 1. Background Stars
2MASSs α(J2000)a δ(J2000)a Spectral Type Ib I − Zb J − Ha H − Ksa Ks
a
h m s ◦ ′ ′′
J0413179+281143 04 13 17.97 28 11 43.0 giant 14.55 1.42 1.19 0.49 10.22
J0417519+282551 04 17 51.94 28 25 51.1 giant 15.37 1.39 1.04 0.56 11.18
J0418021+281748 04 18 02.15 28 17 48.9 M2-M4V 19.49 1.93 1.12 0.80 14.13
J0418053+282801 04 18 05.38 28 28 01.3 giant 16.08 1.75 1.59 0.72 10.33
J0418423+281140 04 18 42.38 28 11 40.7 giant 12.01 1.22 0.65 0.29 9.28
J0419273+281301 04 19 27.37 28 13 01.1 giant 13.11 1.51 1.55 0.55 8.16
J0426255+260653 04 26 25.50 26 06 53.4 giant 15.46 1.28 1.00 0.48 11.08
J0426344+260740 04 26 34.45 26 07 40.2 giant 15.85 1.72 1.32 0.70 10.75
J0427428+262256 04 27 42.87 26 22 56.7 giant 13.02 1.57 1.42 0.61 7.33
J0432113+261323 04 32 11.33 26 13 23.6 giant 13.64 1.73 1.09 0.40 9.24
J0432138+263046 04 32 13.82 26 30 46.1 giant 13.33 1.38 1.30 0.45 9.25
J0433080+255643 04 33 08.03 25 56 43.7 giant 13.97 1.67 1.49 0.61 8.67
J0433293+261809 04 33 29.33 26 18 09.6 giant 15.10 1.45 1.38 0.58 10.29
J0433341+181426 04 33 34.11 18 14 26.2 giant 15.13 1.29 0.89 0.34 11.39
J0433513+262614 04 33 51.33 26 26 14.3 early 16.58 1.67 1.14 0.65 11.84
J0436008+225517 04 36 00.85 22 55 17.4 M7V±0.5 19.92 2.04 0.60 0.37 15.69
a2MASS Spring 1999 Release Point Source Catalog.
bBriceno et al. (2002).
–12
–
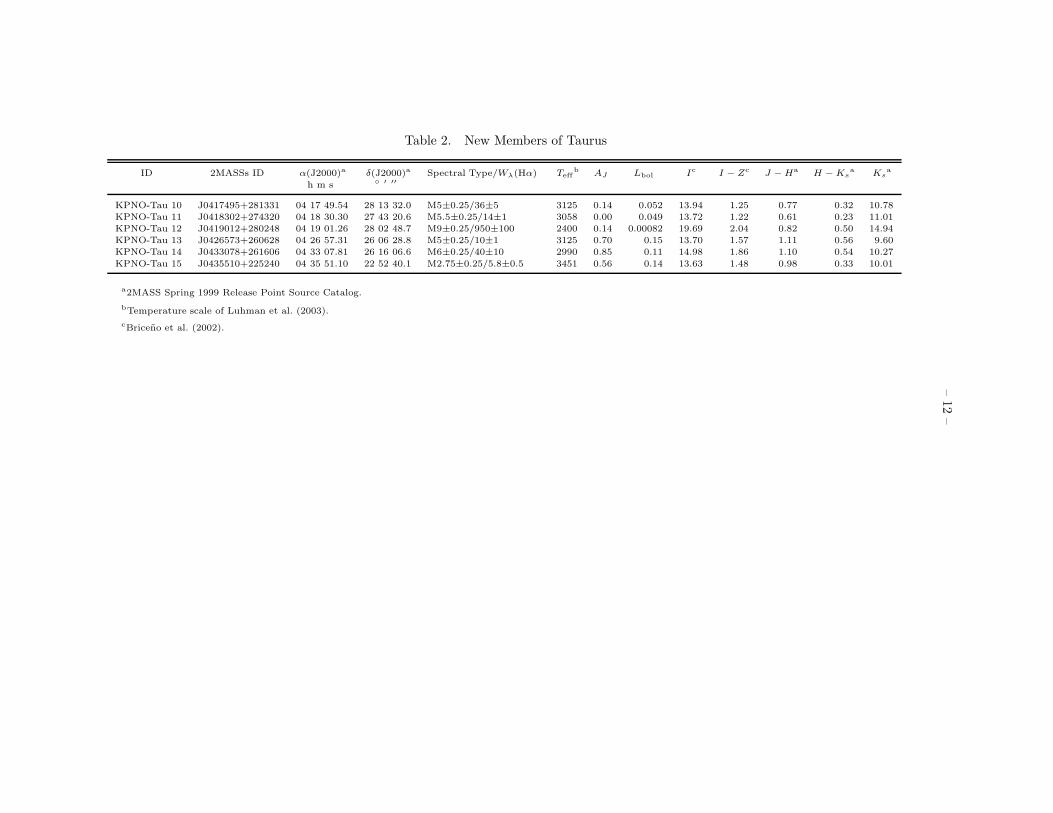
Table 2. New Members of Taurus
ID 2MASSs ID α(J2000)a δ(J2000)a Spectral Type/Wλ(Hα) Teffb
AJ Lbol Ic
I − Zc
J − Ha
H − Ksa
Ksa
h m s ◦ ′ ′′
KPNO-Tau 10 J0417495+281331 04 17 49.54 28 13 32.0 M5±0.25/36±5 3125 0.14 0.052 13.94 1.25 0.77 0.32 10.78
KPNO-Tau 11 J0418302+274320 04 18 30.30 27 43 20.6 M5.5±0.25/14±1 3058 0.00 0.049 13.72 1.22 0.61 0.23 11.01
KPNO-Tau 12 J0419012+280248 04 19 01.26 28 02 48.7 M9±0.25/950±100 2400 0.14 0.00082 19.69 2.04 0.82 0.50 14.94
KPNO-Tau 13 J0426573+260628 04 26 57.31 26 06 28.8 M5±0.25/10±1 3125 0.70 0.15 13.70 1.57 1.11 0.56 9.60
KPNO-Tau 14 J0433078+261606 04 33 07.81 26 16 06.6 M6±0.25/40±10 2990 0.85 0.11 14.98 1.86 1.10 0.54 10.27
KPNO-Tau 15 J0435510+225240 04 35 51.10 22 52 40.1 M2.75±0.25/5.8±0.5 3451 0.56 0.14 13.63 1.48 0.98 0.33 10.01
a2MASS Spring 1999 Release Point Source Catalog.
bTemperature scale of Luhman et al. (2003).
cBriceno et al. (2002).
– 13 –
Table 3. Observing Log
Date Telescope + Instrument 2MASSs
2002 Jan 12 MMT + Blue Channel J0419012+280248
2002 Sep 12 FLWO 1.5 m + FAST J0418423+281140
· · · · · · J0432113+261323
· · · · · · J0435510+225240
· · · · · · J0418302+274320
2002 Sep 27 FLWO 1.5 m + FAST J0417495+281331
2002 Nov 5 Keck + LRIS J0436008+225517
· · · · · · J0419012+280248
2002 Nov 10 MMT + Blue Channel J0418021+281748
2002 Dec 7 FLWO 1.5 m + FAST J0413179+281143
· · · · · · J0426573+260628
· · · · · · J0432138+263046
· · · · · · J0433078+261606
· · · · · · J0433080+255643
2002 Dec 14 MMT + Blue Channel J0419273+281301
· · · · · · J0426344+260740
· · · · · · J0427428+262256
· · · · · · J0433293+261809
· · · · · · J0433513+262614
2002 Dec 15 MMT + Blue Channel J0417519+282551
· · · · · · J0418053+282801
· · · · · · J0426255+260653
· · · · · · J0433341+181426
– 14 –
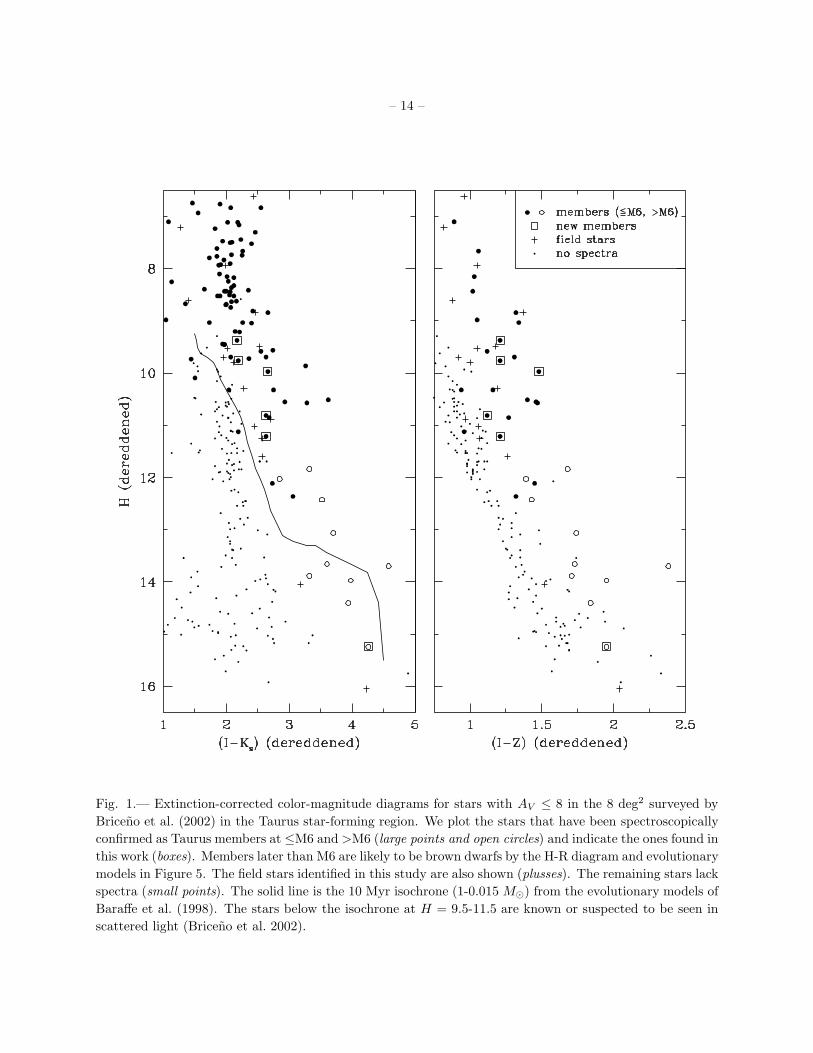
Fig. 1.— Extinction-corrected color-magnitude diagrams for stars with AV ≤ 8 in the 8 deg2 surveyed by
Briceno et al. (2002) in the Taurus star-forming region. We plot the stars that have been spectroscopically
confirmed as Taurus members at ≤M6 and >M6 (large points and open circles) and indicate the ones found in
this work (boxes). Members later than M6 are likely to be brown dwarfs by the H-R diagram and evolutionary
models in Figure 5. The field stars identified in this study are also shown (plusses). The remaining stars lack
spectra (small points). The solid line is the 10 Myr isochrone (1-0.015 M⊙) from the evolutionary models of
Baraffe et al. (1998). The stars below the isochrone at H = 9.5-11.5 are known or suspected to be seen in
scattered light (Briceno et al. 2002).
– 15 –
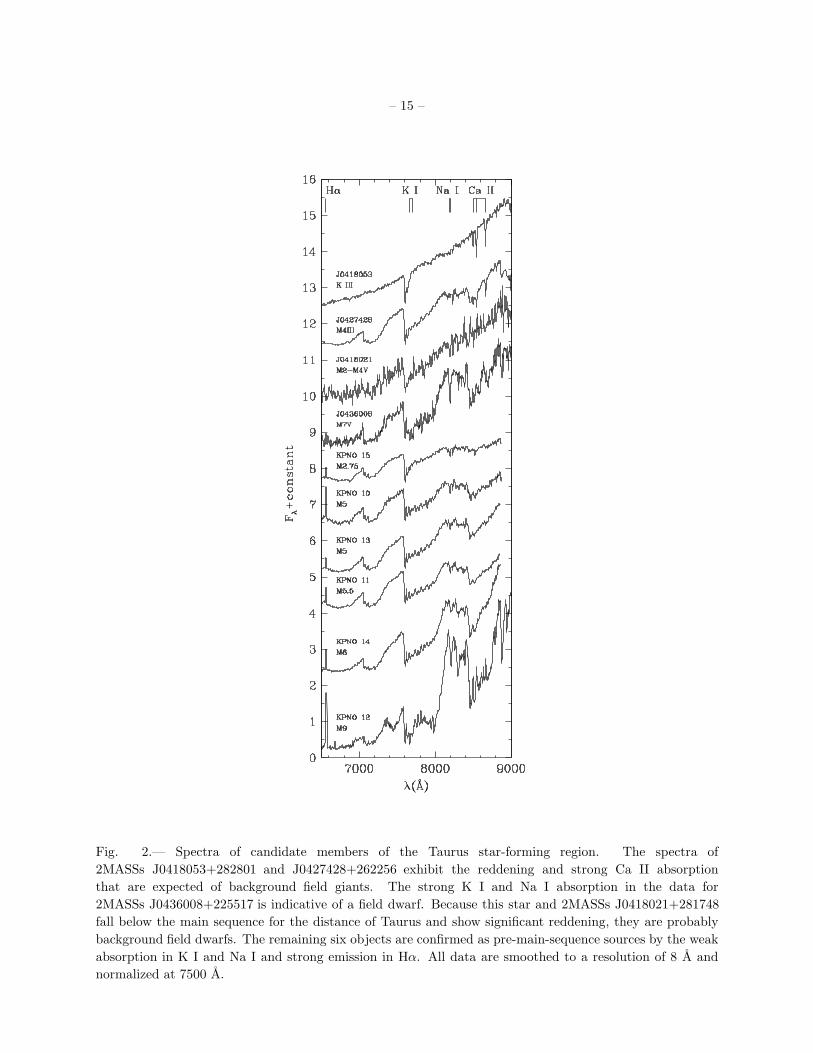
Fig. 2.— Spectra of candidate members of the Taurus star-forming region. The spectra of
2MASSs J0418053+282801 and J0427428+262256 exhibit the reddening and strong Ca II absorption
that are expected of background field giants. The strong K I and Na I absorption in the data for
2MASSs J0436008+225517 is indicative of a field dwarf. Because this star and 2MASSs J0418021+281748
fall below the main sequence for the distance of Taurus and show significant reddening, they are probably
background field dwarfs. The remaining six objects are confirmed as pre-main-sequence sources by the weak
absorption in K I and Na I and strong emission in Hα. All data are smoothed to a resolution of 8 A and
normalized at 7500 A.
– 16 –
Fig. 3.— Spectrum of the new Taurus member KPNO-Tau 12 compared to data for M9 III, M9 V, and an
average of the two types. Reddening is applied to the latter data to optimize the matches to the spectrum
of KPNO-Tau 12. All data are smoothed to a resolution of 18 A and normalized at 7500 A.

– 17 –
Fig. 4.— Emission lines in the spectrum of the new Taurus member KPNO-Tau 12. At a mass of ∼ 0.02 M⊙,
this is the least massive object observed to date with He I and Ca II emission lines, which are typically found
in stars undergoing intense accretion. These data have a resolution of 6 A.
– 18 –
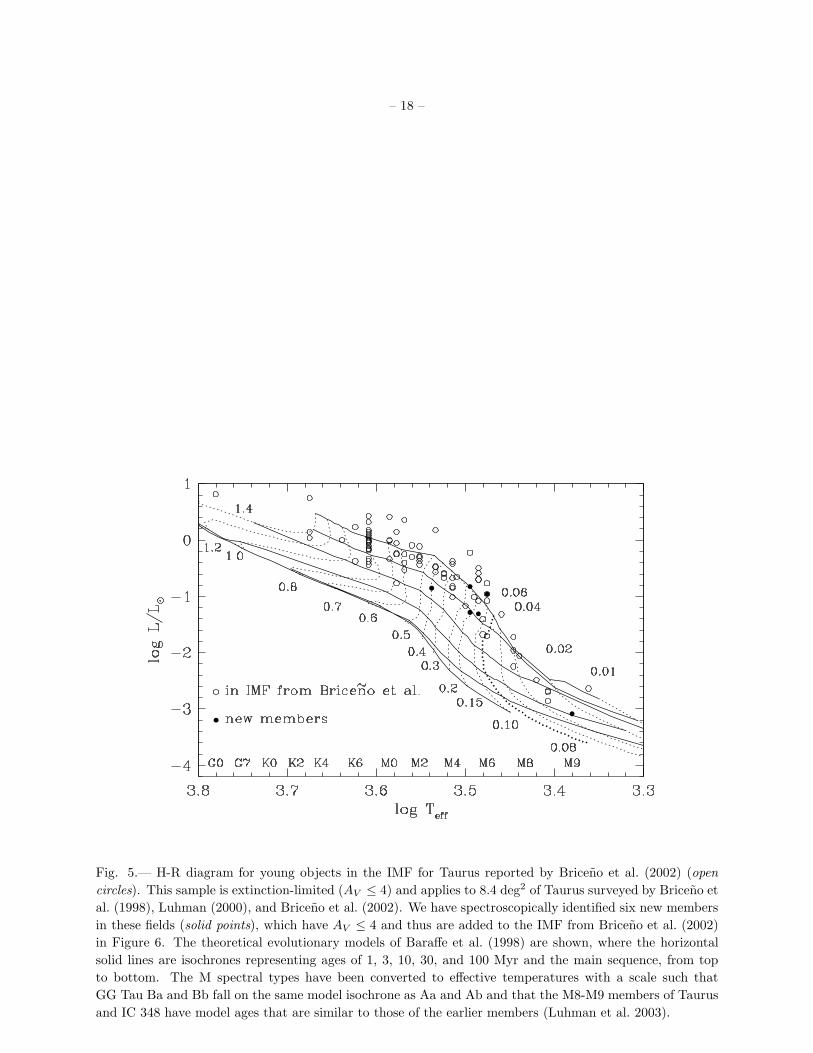
Fig. 5.— H-R diagram for young objects in the IMF for Taurus reported by Briceno et al. (2002) (open
circles). This sample is extinction-limited (AV ≤ 4) and applies to 8.4 deg2 of Taurus surveyed by Briceno et
al. (1998), Luhman (2000), and Briceno et al. (2002). We have spectroscopically identified six new members
in these fields (solid points), which have AV ≤ 4 and thus are added to the IMF from Briceno et al. (2002)
in Figure 6. The theoretical evolutionary models of Baraffe et al. (1998) are shown, where the horizontal
solid lines are isochrones representing ages of 1, 3, 10, 30, and 100 Myr and the main sequence, from top
to bottom. The M spectral types have been converted to effective temperatures with a scale such that
GG Tau Ba and Bb fall on the same model isochrone as Aa and Ab and that the M8-M9 members of Taurus
and IC 348 have model ages that are similar to those of the earlier members (Luhman et al. 2003).
– 19 –
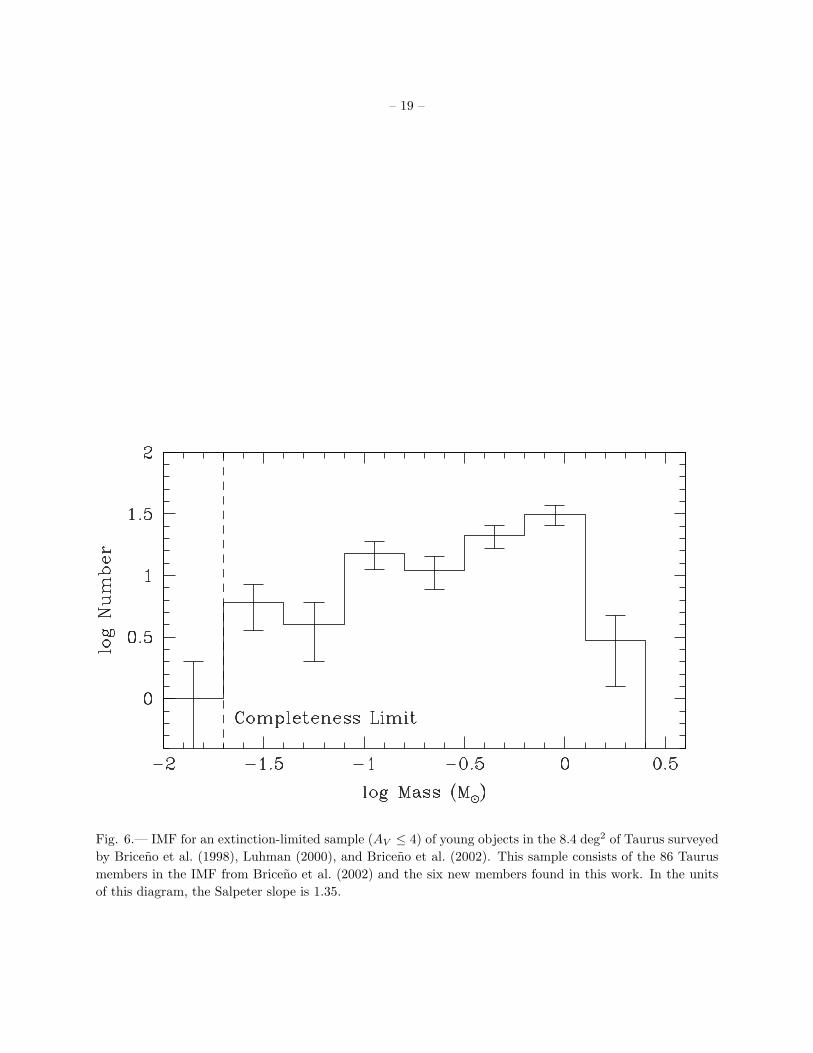
Fig. 6.— IMF for an extinction-limited sample (AV ≤ 4) of young objects in the 8.4 deg2 of Taurus surveyed
by Briceno et al. (1998), Luhman (2000), and Briceno et al. (2002). This sample consists of the 86 Taurus
members in the IMF from Briceno et al. (2002) and the six new members found in this work. In the units
of this diagram, the Salpeter slope is 1.35.
Copyright © 2022 FDOKUMEN