
NEW DRUGS IN ROMANIA - a multi-indicator analysis-
24
NEW DRUGS IN ROMANIA - a multi-indicator analysis- LISBON 25-26 OCTOBER 2012 Psychologist Carmelia MATACHE Psycho-sociologist Lavinus SAVA
-
Upload
khangminh22 -
Category
Documents
-
view
0 -
download
0
Transcript of NEW DRUGS IN ROMANIA - a multi-indicator analysis-
NEW DRUGS IN ROMANIA- a multi-indicator analysis-
LISBON
25-26 OCTOBER 2012
Psychologist Carmelia MATACHE
Psycho-sociologist Lavinus SAVA
Romania, 2010 - a different structure of PDU considering the main drug used:
� A decrease in number of the IDU who reported heroin as main
drug used from about 90% to 67,3%
� New substances( NPS) appear in use and are reported by
30,6% of the PDU.
� ROMANIAN NATIONAL REPORT 2011
NPS use
= PDU ?
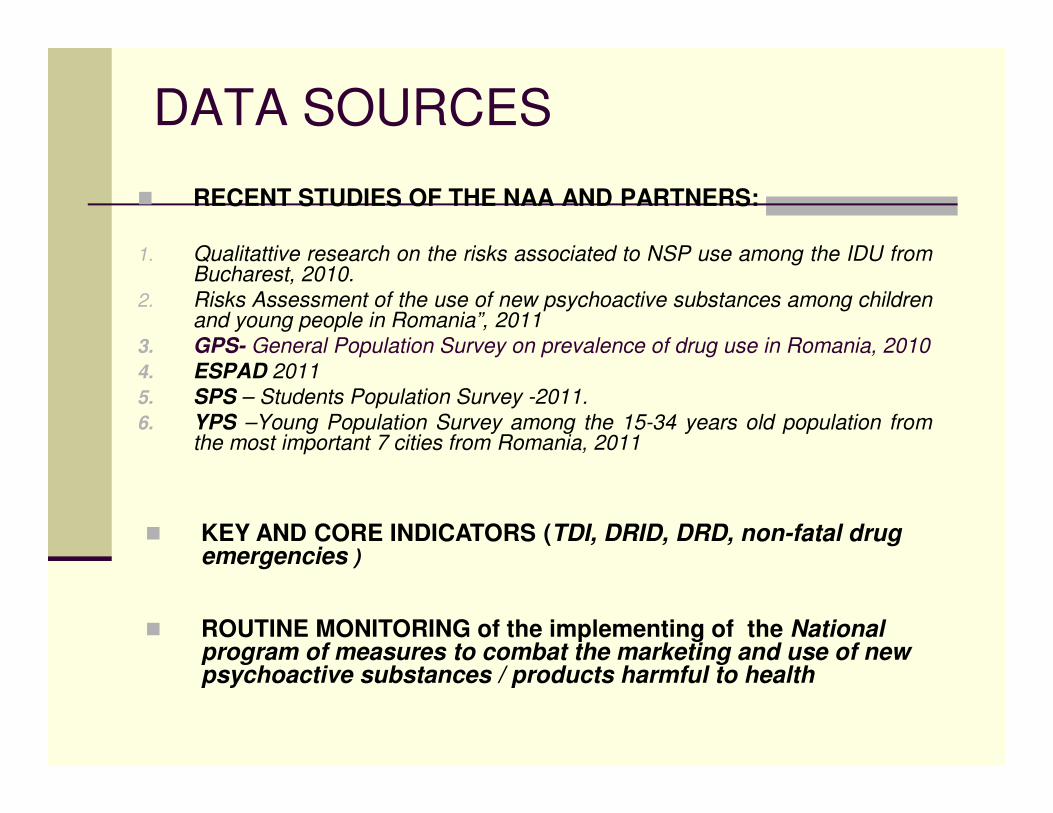
DATA SOURCES
� RECENT STUDIES OF THE NAA AND PARTNERS:
1. Qualitattive research on the risks associated to NSP use among the IDU fromBucharest, 2010.
2. Risks Assessment of the use of new psychoactive substances among childrenand young people in Romania”, 2011
3. GPS- General Population Survey on prevalence of drug use in Romania, 2010
4. ESPAD 2011
5. SPS – Students Population Survey -2011.
6. YPS –Young Population Survey among the 15-34 years old population fromthe most important 7 cities from Romania, 2011
� KEY AND CORE INDICATORS (TDI, DRID, DRD, non-fatal drug emergencies )
� ROUTINE MONITORING of the implementing of the National program of measures to combat the marketing and use of new psychoactive substances / products harmful to health
WHY IS NSP USE A PROBLEM?
� All studies and indicators reveal a PROBLEM
� High prevalence and increasing dynamic, geographically widespreaded
� Specific pattern of use (injecting drugs)
� Harmful for IDU’s
� Public health risk
� Difficulties in knowledge and low possibilities of specific treatment
� Insufficient impact of public policies’ controlling measures
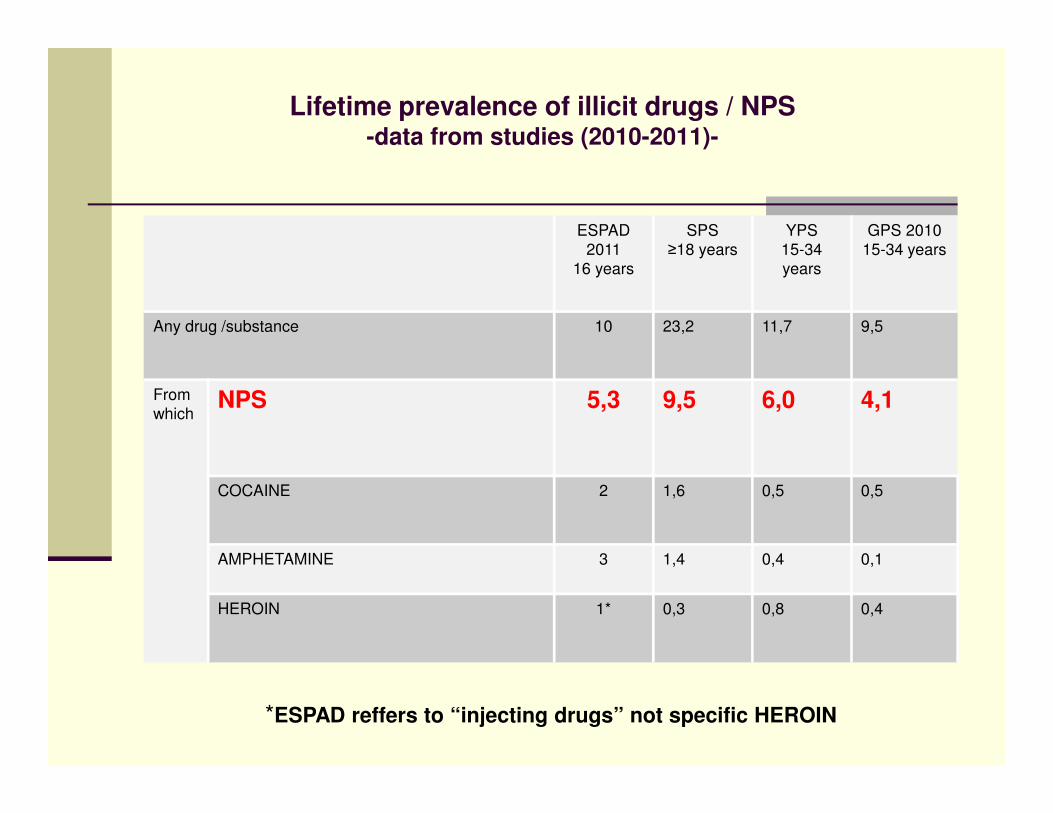
Lifetime prevalence of illicit drugs / NPS-data from studies (2010-2011)-
ESPAD
2011
16 years
SPS
≥18 years
YPS
15-34
years
GPS 2010
15-34 years
Any drug /substance 10 23,2 11,7 9,5
From
whichNPS 5,3 9,5 6,0 4,1
COCAINE 2 1,6 0,5 0,5
AMPHETAMINE 3 1,4 0,4 0,1
HEROIN 1* 0,3 0,8 0,4
*ESPAD reffers to “injecting drugs” not specific HEROIN
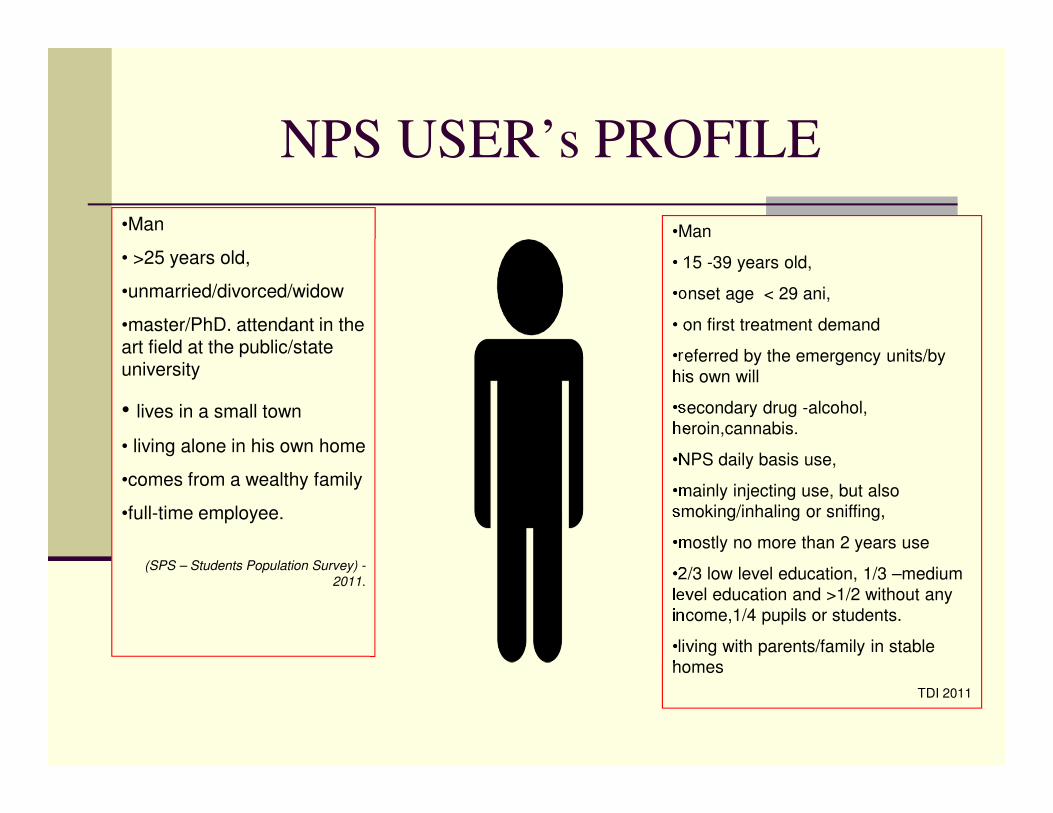
NPS USER’s PROFILE
•Man
• 15 -39 years old,
•onset age < 29 ani,
• on first treatment demand
•referred by the emergency units/by
his own will
•secondary drug -alcohol,
heroin,cannabis.
•NPS daily basis use,
•mainly injecting use, but also
smoking/inhaling or sniffing,
•mostly no more than 2 years use
•2/3 low level education, 1/3 –medium
level education and >1/2 without any
income,1/4 pupils or students.
•living with parents/family in stable
homes
TDI 2011
•Man
• >25 years old,
•unmarried/divorced/widow
•master/PhD. attendant in the art field at the public/state university
• lives in a small town
• living alone in his own home
•comes from a wealthy family
•full-time employee.
(SPS – Students Population Survey) -
2011.
7
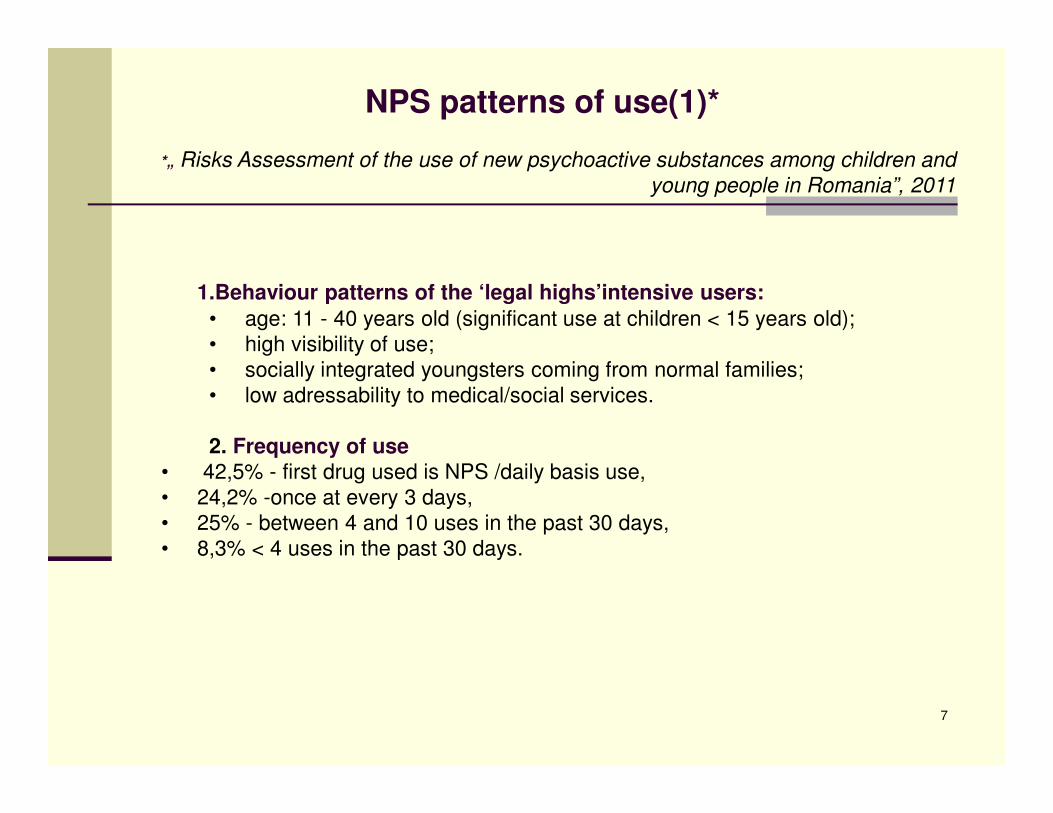
*„ Risks Assessment of the use of new psychoactive substances among children and
young people in Romania”, 2011
1.Behaviour patterns of the ‘legal highs’intensive users:
• age: 11 - 40 years old (significant use at children < 15 years old);
• high visibility of use;
• socially integrated youngsters coming from normal families;
• low adressability to medical/social services.
2. Frequency of use• 42,5% - first drug used is NPS /daily basis use,
• 24,2% -once at every 3 days,
• 25% - between 4 and 10 uses in the past 30 days,
• 8,3% < 4 uses in the past 30 days.
NPS patterns of use(1)*

3.Poly-drug use� 55,9% - have used some other “legal products” in the past 30 days. (1
of 10 respondents declares frequent use of illicit drugs either). They also use : alcohol, heroin, amphetamine, cocaine, diazepam, valium, rofedex, marijuana, “prenadez”, tusin.
4. History of use� Varies between 1 and 31 months, with an average of 13 months, most
frequent answer recorded is 24 months, or 2 years.
5.Administration routeSmoking, followed by injecting and sniffing.
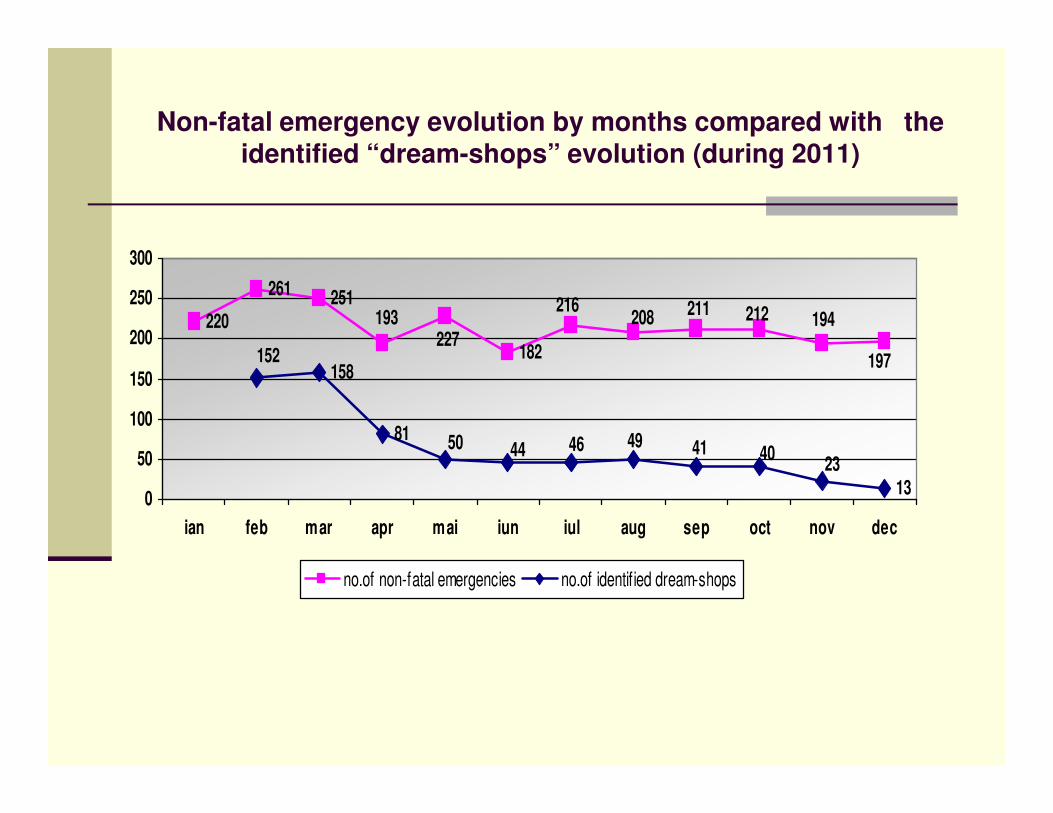
Non-fatal emergency evolution by months compared with the identified “dream-shops” evolution (during 2011)
220
261 251
182158
81
13
193227
208 211 212216194
197152
4450 46 49 41 4023
0
50
100
150
200
250
300
ian feb mar apr mai iun iul aug sep oct nov dec
no.of non-fatal emergencies no.of identified dream-shops
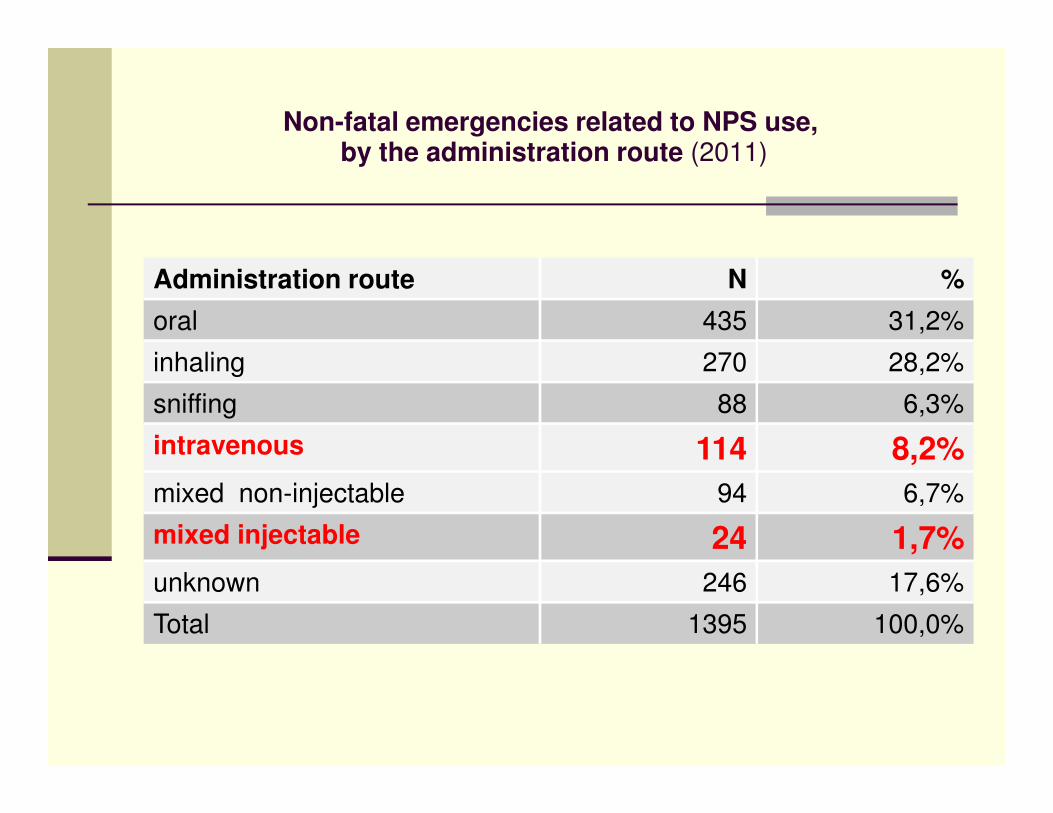
Non-fatal emergencies related to NPS use,by the administration route (2011)
Administration route N %
oral 435 31,2%
inhaling 270 28,2%
sniffing 88 6,3%
intravenous 114 8,2%
mixed non-injectable 94 6,7%
mixed injectable 24 1,7%
unknown 246 17,6%
Total 1395 100,0%
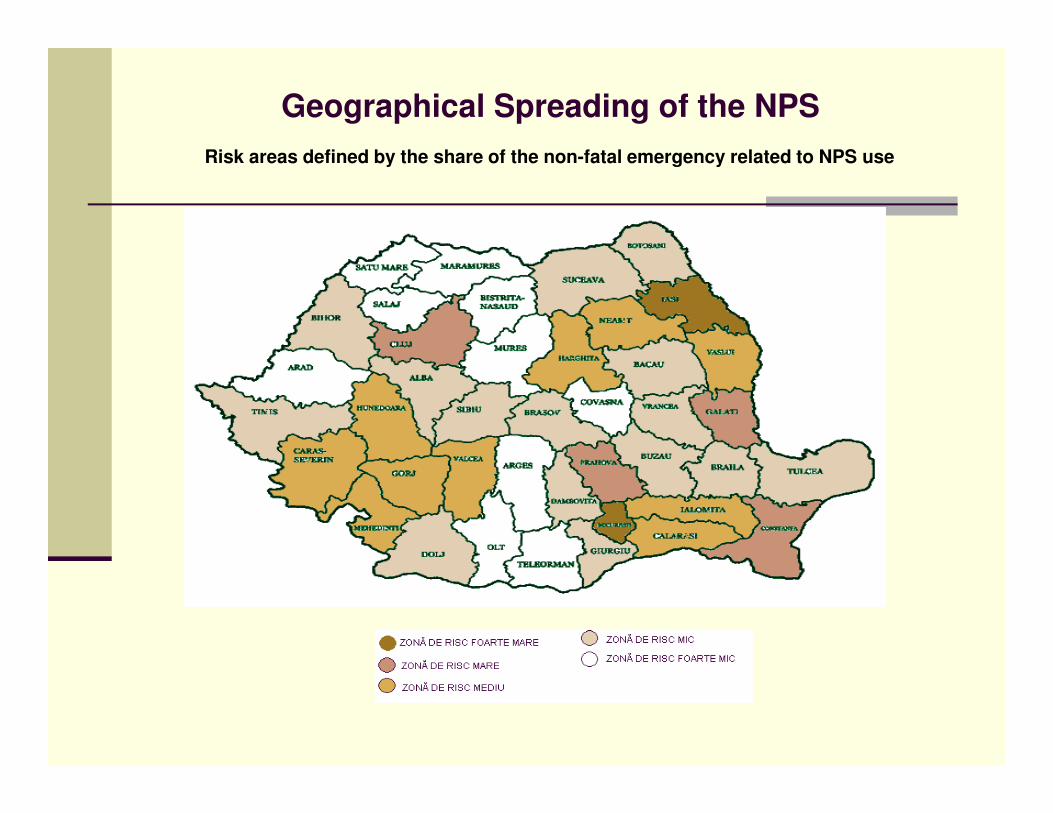
Geographical Spreading of the NPS
Risk areas defined by the share of the non-fatal emergency related to NPS use
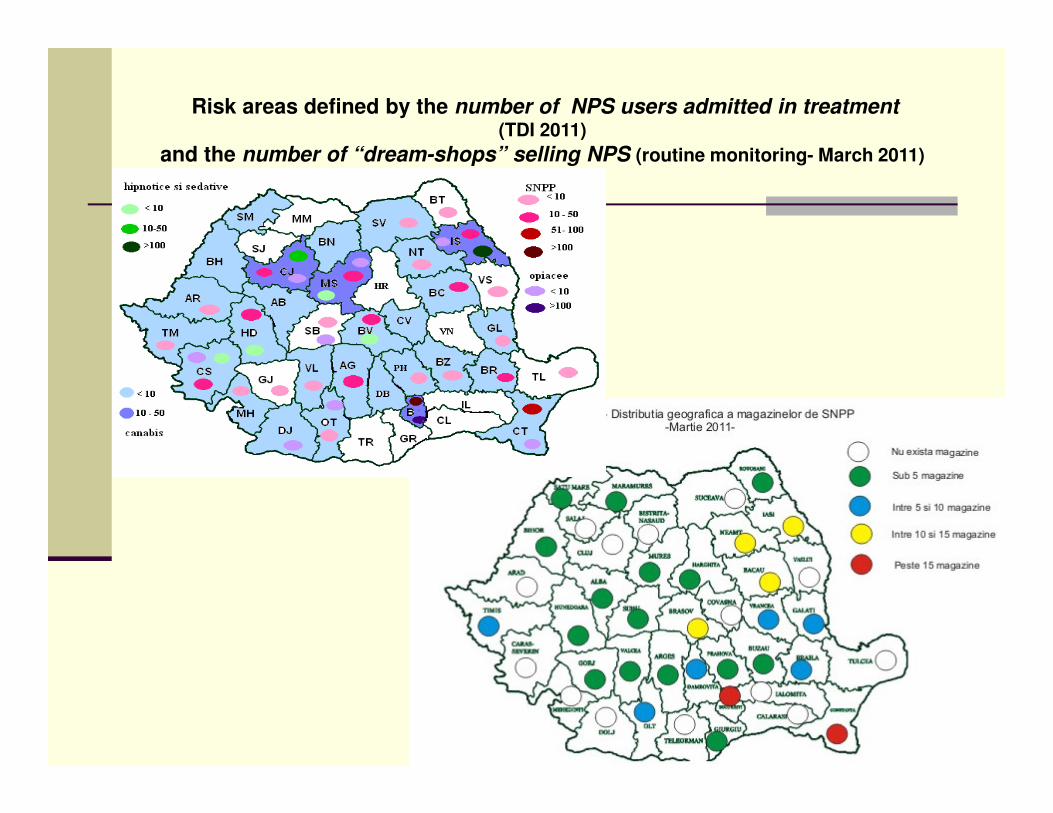
Risk areas defined by the number of NPS users admitted in treatment(TDI 2011)
and the number of “dream-shops” selling NPS (routine monitoring- March 2011)
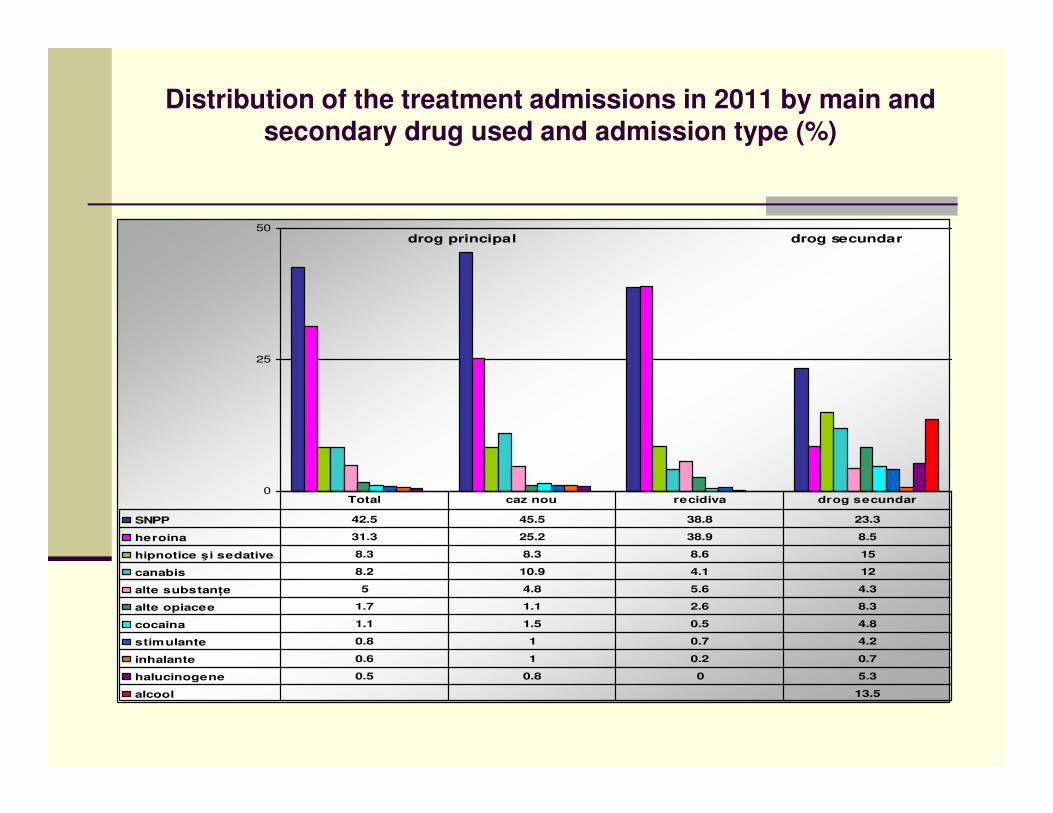
Distribution of the treatment admissions in 2011 by main and secondary drug used and admission type (%)
drog principal drog secundar
0
25
50
SNPP 42.5 45.5 38.8 23.3
heroina 31.3 25.2 38.9 8.5
hipnotice şi sedative 8.3 8.3 8.6 15
canabis 8.2 10.9 4.1 12
alte substanţe 5 4.8 5.6 4.3
alte opiacee 1.7 1.1 2.6 8.3
cocaina 1.1 1.5 0.5 4.8
stimulante 0.8 1 0.7 4.2
inhalante 0.6 1 0.2 0.7
halucinogene 0.5 0.8 0 5.3
alcool 13.5
Total caz nou recidiva drog secundar
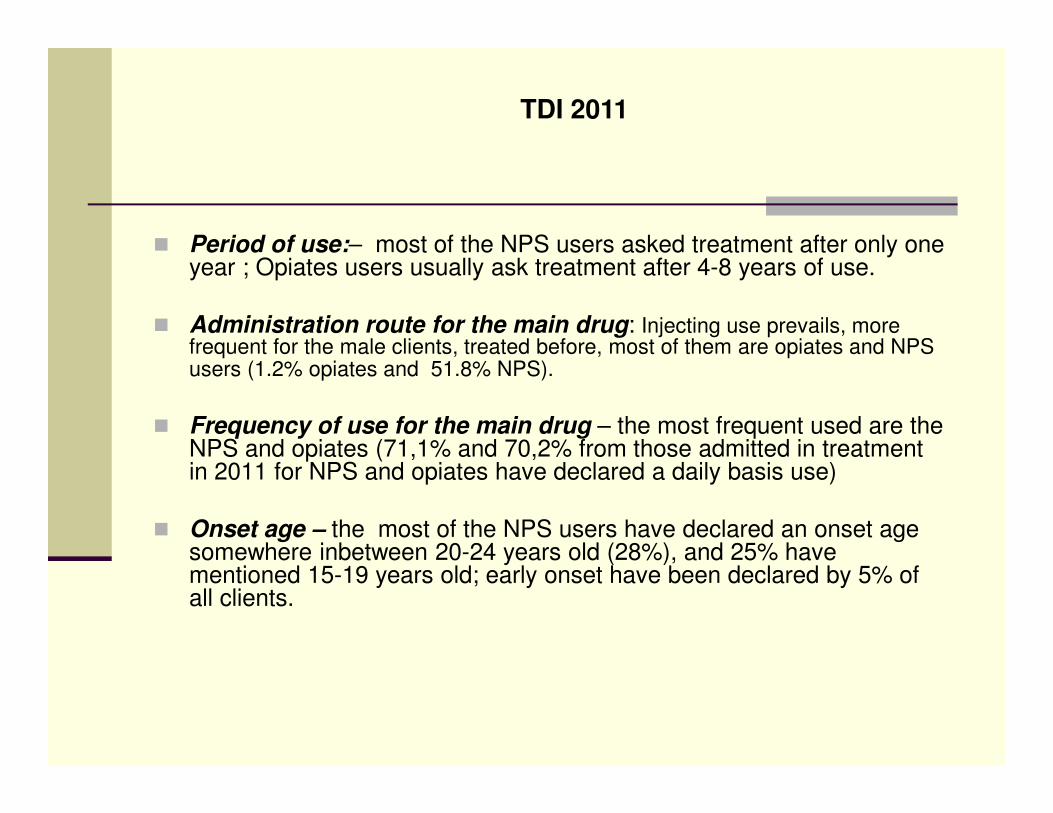
� Period of use:– most of the NPS users asked treatment after only one year ; Opiates users usually ask treatment after 4-8 years of use.
� Administration route for the main drug: Injecting use prevails, more frequent for the male clients, treated before, most of them are opiates and NPS users (1.2% opiates and 51.8% NPS).
� Frequency of use for the main drug – the most frequent used are the NPS and opiates (71,1% and 70,2% from those admitted in treatment in 2011 for NPS and opiates have declared a daily basis use)
� Onset age – the most of the NPS users have declared an onset age somewhere inbetween 20-24 years old (28%), and 25% have mentioned 15-19 years old; early onset have been declared by 5% of all clients.
TDI 2011
15
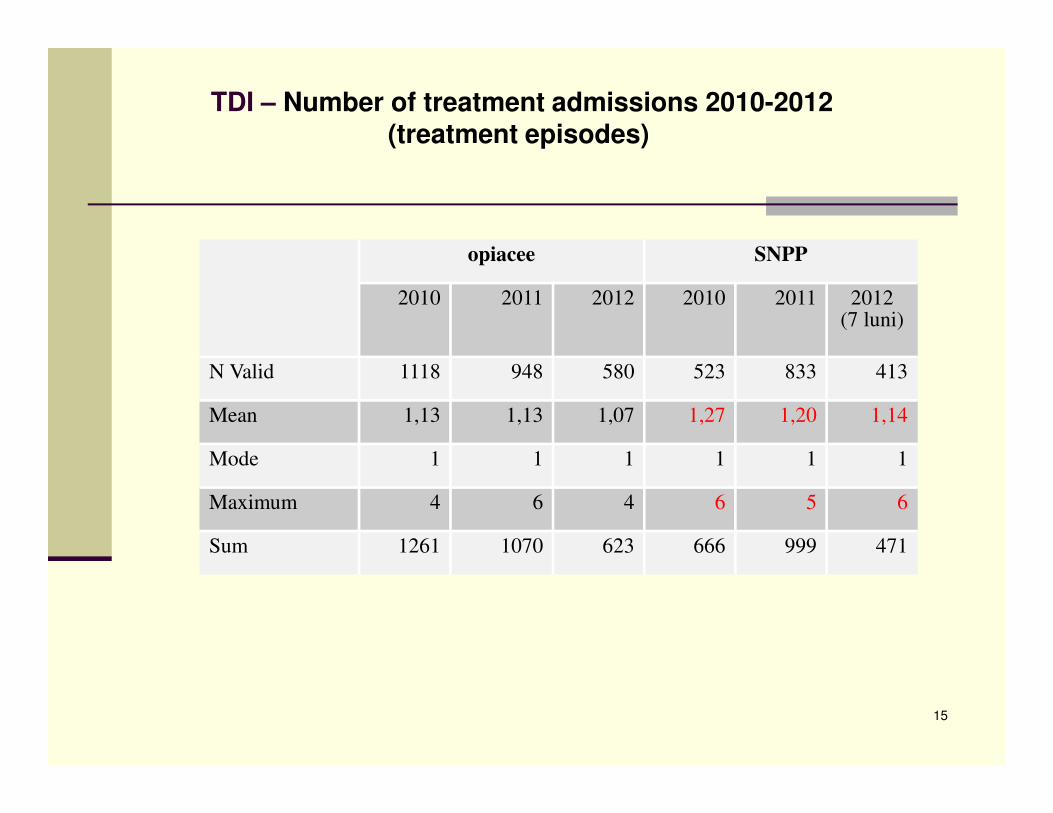
TDI – Number of treatment admissions 2010-2012(treatment episodes)
opiacee SNPP
2010 2011 2012 2010 2011 2012(7 luni)
N Valid 1118 948 580 523 833 413
Mean 1,13 1,13 1,07 1,27 1,20 1,14
Mode 1 1 1 1 1 1
Maximum 4 6 4 6 5 6
Sum 1261 1070 623 666 999 471
16
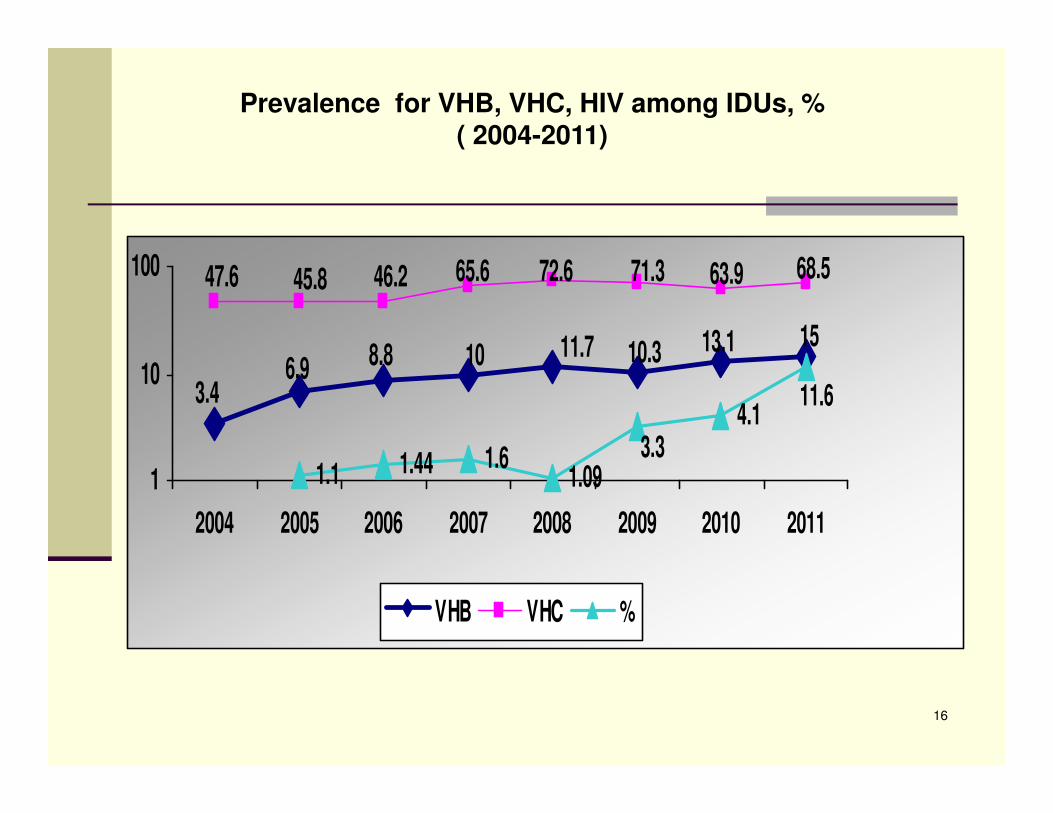
Prevalence for VHB, VHC, HIV among IDUs, % ( 2004-2011)
1.1 1.44 1.61.09
4.13.4
6.9 8.8 10 11.7 10.3 13.1 15
47.6 45.8 46.2 68.563.971.372.665.6
3.3
11.6
1
10
100
2004 2005 2006 2007 2008 2009 2010 2011
VHB VHC %
HIV prevalence among risk population cathegories
2011:
� The highest growth of HIV infections was reported
for:
� drug users – from 1,03% to 6,12% (5,9 times higher prevalence),
� sex workers – from 0% to 6,49%
� persons who have sex with the same gender partners– from 7,84% to
14,08% (1,8 times higher prevalence).
�
� 15% (62 from 405) from the new HIV infections were
recorded among IDUs. 29 of them suggest recent
infections.
18
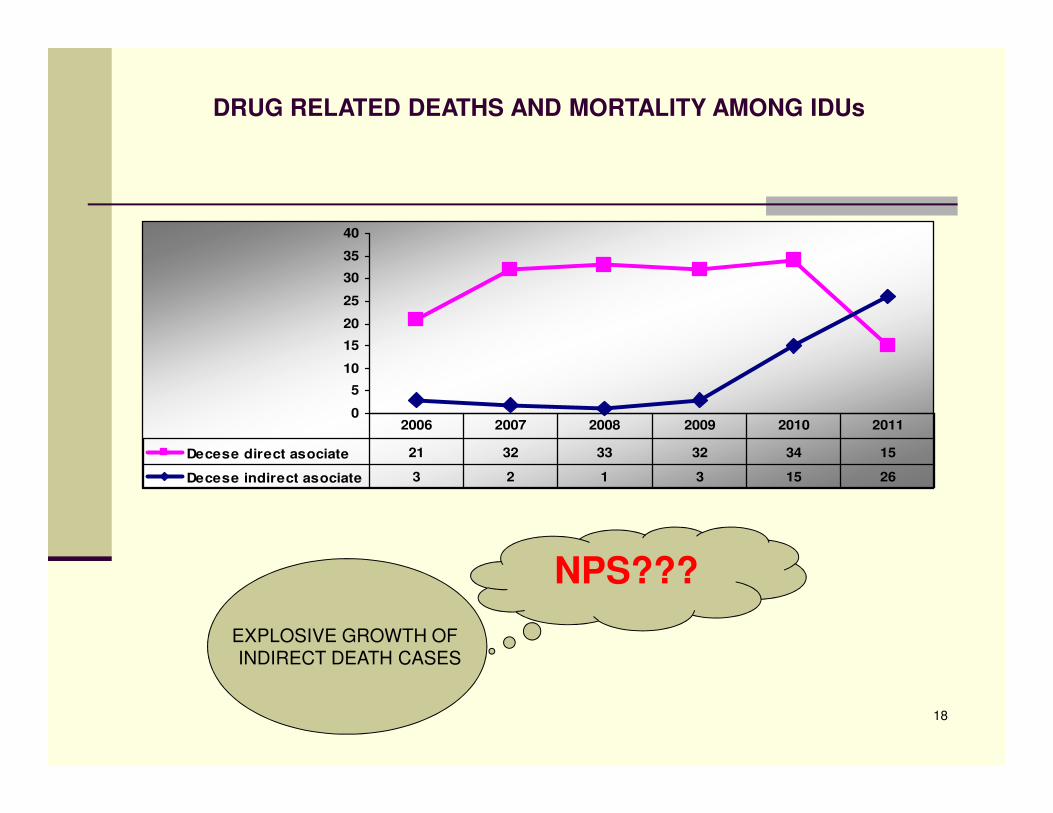
DRUG RELATED DEATHS AND MORTALITY AMONG IDUs
0
5
10
15
20
25
30
35
40
Decese direct asociate 21 32 33 32 34 15
Decese indirect asociate 3 2 1 3 15 26
2006 2007 2008 2009 2010 2011
EXPLOSIVE GROWTH OF INDIRECT DEATH CASES
NPS???
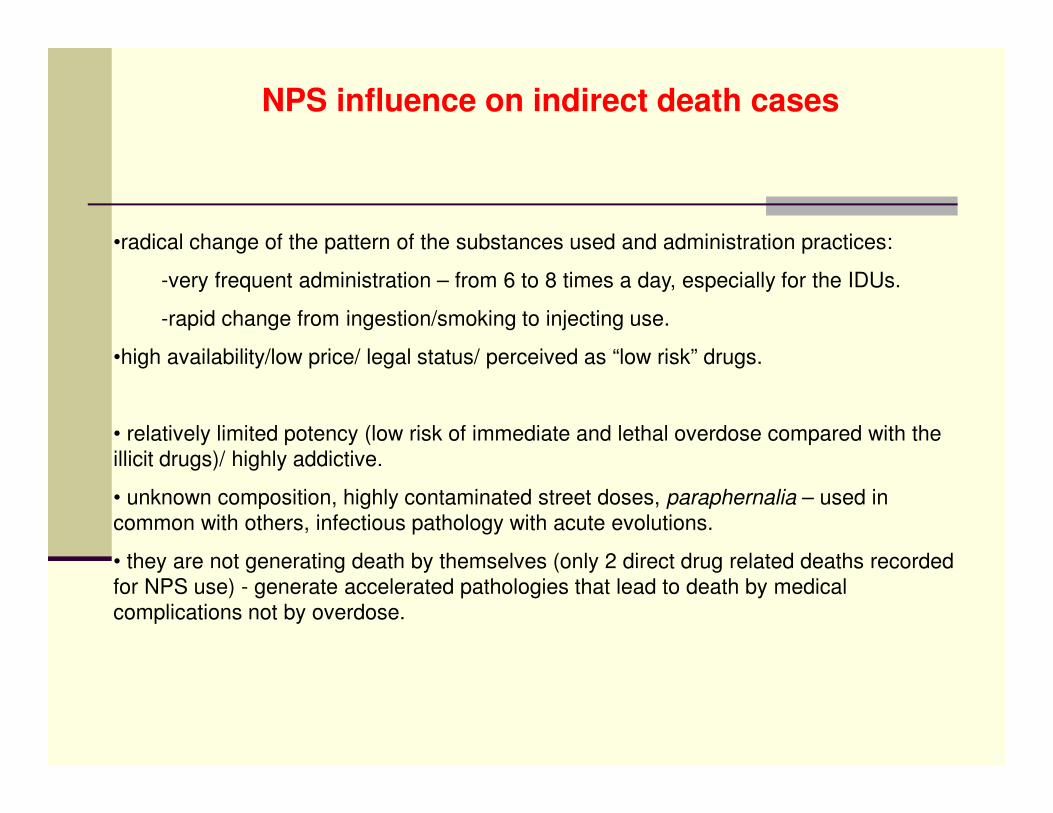
NPS influence on indirect death cases
•radical change of the pattern of the substances used and administration practices:
-very frequent administration – from 6 to 8 times a day, especially for the IDUs.
-rapid change from ingestion/smoking to injecting use.
•high availability/low price/ legal status/ perceived as “low risk” drugs.
• relatively limited potency (low risk of immediate and lethal overdose compared with the
illicit drugs)/ highly addictive.
• unknown composition, highly contaminated street doses, paraphernalia – used in
common with others, infectious pathology with acute evolutions.
• they are not generating death by themselves (only 2 direct drug related deaths recorded
for NPS use) - generate accelerated pathologies that lead to death by medical
complications not by overdose.
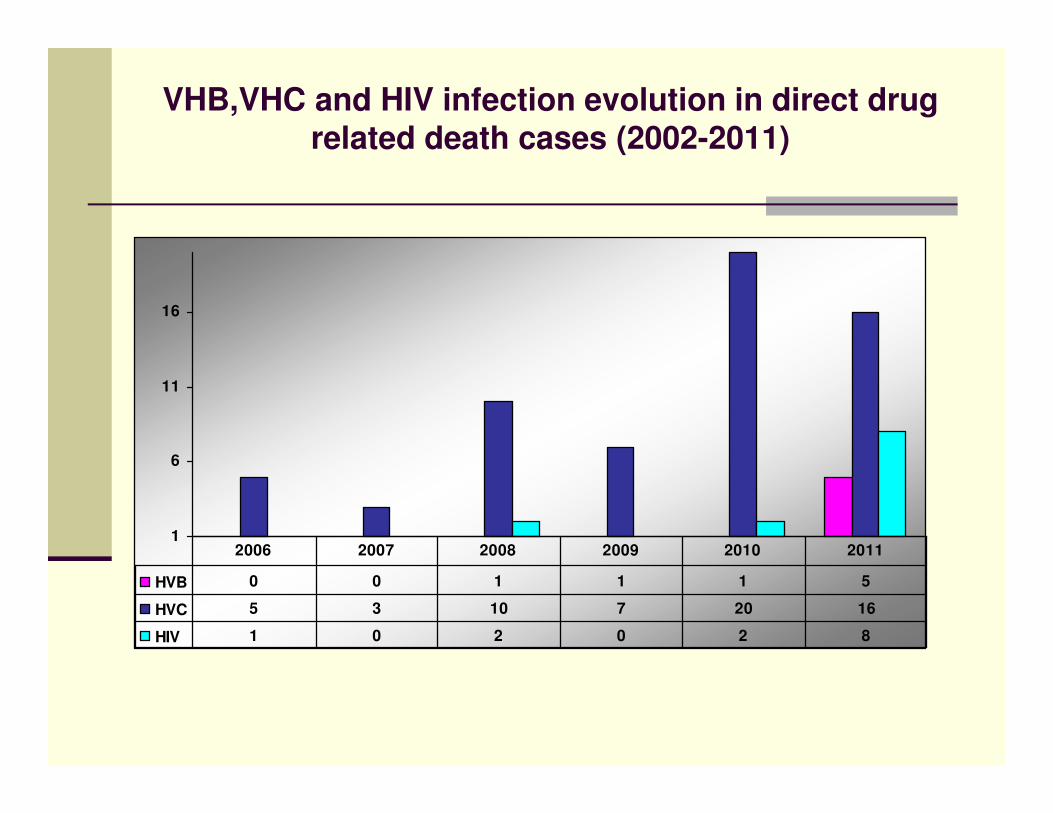
VHB,VHC and HIV infection evolution in direct drug related death cases (2002-2011)
1
6
11
16
HVB 0 0 1 1 1 5
HVC 5 3 10 7 20 16
HIV 1 0 2 0 2 8
2006 2007 2008 2009 2010 2011
RESPONSES -impact of public policies’ controlling measures
� Several government decisions were adopted in order to put under national legal control the marketing and use of some NPS (43 of them were enlisted) but the most important in terms of impact is the Law 194/November 2011(to combat any operation with new substances susceptible of having psychoactive effects).
� The main government’s public policy tool in this respect wasThe National program of measures to combat the marketing and use of new psychoactive substances / products harmful to health adopted in february 2011. The mixed inter-institutions controlling teams were set at local level, and their work within the framework of this program have led to some visible results*.
� The NAA and partner NGOs have implemented some national and local NPS use prevention campaigns (The most important in 2011 was the one called THE ABSENT. In 2012 is in progress another national campaign targeted to NPS, called TOO REBEL TO BE LED (by drugs)!)
� The NAA has bought 142 500 syringes and distributed to the partner NGOs from the RHRN specialised in harm-reduction interventions, and will buy another 800000 syringes by the end of 2012 to be distributed to the NSP programmes for opiates and NPS IDUs.
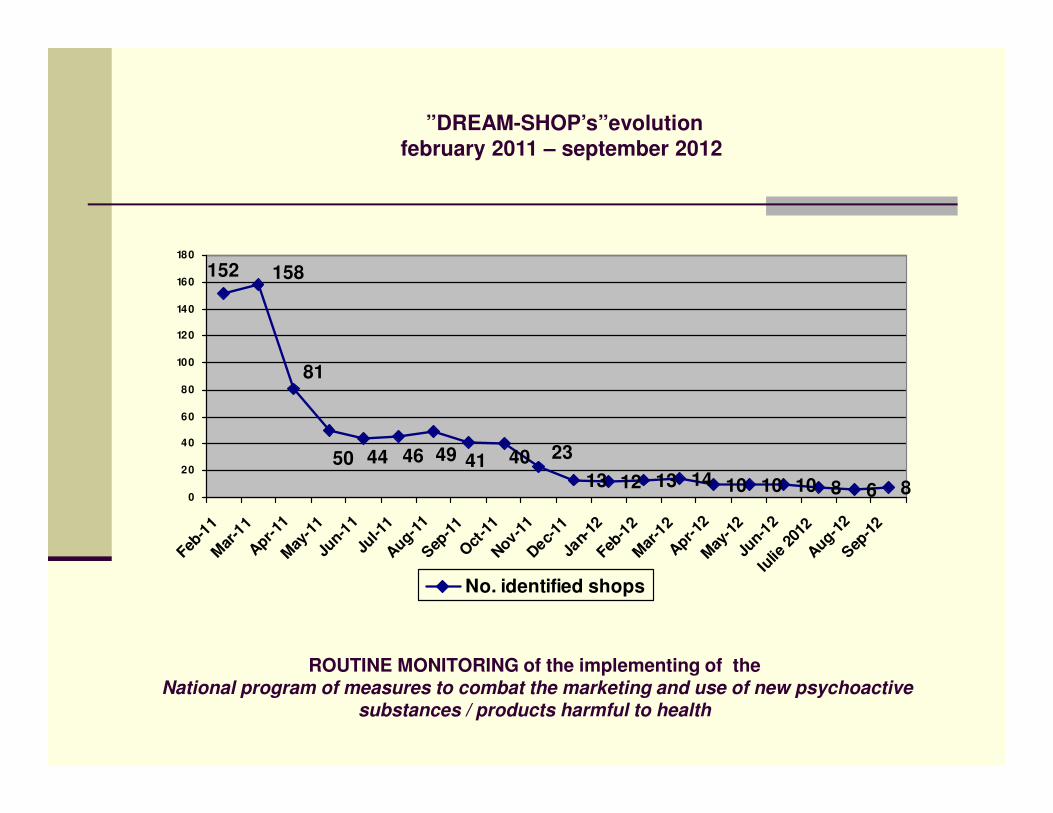
ROUTINE MONITORING of the implementing of theNational program of measures to combat the marketing and use of new psychoactive
substances / products harmful to health
13 12 13 14 10 10 10 8 6 8
23404149464450
81
158152
0
20
40
60
80
100
120
140
160
180
Feb-1
1M
ar-1
1A
pr-11
May
-11
Jun-1
1Ju
l-11
Aug-1
1S
ep-1
1O
ct-1
1N
ov-11
Dec-
11Ja
n-12
Feb-1
2M
ar-1
2A
pr-12
May
-12
Jun-1
2Iu
lie 2
012
Aug-1
2S
ep-1
2
No. identified shops
”DREAM-SHOP’s”evolution february 2011 – september 2012
Thank You for your kind attention!