New Concept for Assessment of Tidal Current Energy in Jiangsu Coast, China
10
Hindawi Publishing Corporation Advances in Mechanical Engineering Volume 2013, Article ID 340501, 9 pages http://dx.doi.org/10.1155/2013/340501 Research Article New Concept for Assessment of Tidal Current Energy in Jiangsu Coast, China Ji-Sheng Zhang, 1 Jun Wang, 2 Ai-Feng Tao, 1 Jin-Hai Zheng, 1 and Hui Li 2 1 State Key Laboratory of Hydrology-Water Resources and Hydraulic Engineering, Hohai University, Nanjing 210098, China 2 College of Harbor, Coastal and Offshore Engineering, Hohai University, Nanjing 210098, China Correspondence should be addressed to Ai-Feng Tao; aſt[email protected] Received 29 June 2013; Revised 10 October 2013; Accepted 14 October 2013 Academic Editor: Luigi Cappelli Copyright © 2013 Ji-Sheng Zhang et al. is is an open access article distributed under the Creative Commons Attribution License, which permits unrestricted use, distribution, and reproduction in any medium, provided the original work is properly cited. Tidal current energy has attracted more and more attentions of coastal engineers in recent years, mainly due to its advantages of low environmental impact, long-term predictability, and large energy potential. In this study, a two-dimensional hydrodynamic model is applied to predict the distribution of mean density of tidal current energy and to determine a suitable site for energy exploitation in Jiangsu Coast. e simulation results including water elevation and tidal current (speed and direction) were validated with measured data, showing a reasonable agreement. en, the model was used to evaluate the distribution of mean density of tidal current energy during springtide and neap tide in Jiangsu Coast. Considering the discontinuous performance of tidal current turbine, a new concept for assessing tidal current energy is introduced with three parameters: total operating time, dispersion of operating time, and mean operating time of tidal current turbine. e operating efficiency of tidal current turbine at three locations around radial submarine sand ridges was taken as examples for comparison, determining suitable sites for development of tidal current farm. 1. Introduction e rapid development of economics and science technology has caused an enormous consumption of fossil fuel energy and environmental pollution. As marine renewable energies are clean and sustainable, they can offer a solution to relieve energy crisis and to reduce environmental impacts. It is well known that ocean covers nearly 71% of the earth’s surface and holds a large amount of energy more than 2 × 10 3 TW [1]. Ocean energies can be exploited in many different forms, including tide, wave, tidal current, thermal, salinity gradients, and biomass [2]. Tidal current energy differs from tidal energy. Application of tidal current energy is to transform kinetic energy of tidal current to electricity, while application of tidal energy is about the usage of potential energy due to sea level variation [3]. Among all forms of ocean energies, tidal current energy is preferable mainly due to its advantages of the high energy density (approximately 832 times greater than wind) [2], long-time predictability, and potentially large resource [4]. For these reasons, tidal current energy draws more and more attentions from the public in recent years. China has an excellent resource of tidal current energy with a huge capacity of approximate 13950 MW [5]. Exploita- tion of tidal current energy will be an important supply as a clean and reliable power in the near future. Jiangsu is a province on the eastern coast of China with a coastline of 954 Km. A radial submarine sand ridge was formed in the northern part of Jiangsu Coast due to strong tidal current and, undoubtedly, tidal current energy mainly concentrated in this area. Maximal current speeds in Huangshayang channel and Xiyang channel are over 2.5 m/s and 2.0 m/s, respectively. erefore, assessment of tidal current energy in Jiangsu Coast is of great practical significance. Assessment of tidal current energy is usually applied to identify location of greatest potential and to estimate level of energy production that can be achieved [6]. In the past ten years, some studies regarding assessment of tidal current energy in China have been conducted. For example, Li et al. investigated the distribution of tidal current energy and rec- ommended some possible location for exploitation in China [7]. Liu et al. summarized distribution of tidal current energy in some several water channels around China and calculated
Transcript of New Concept for Assessment of Tidal Current Energy in Jiangsu Coast, China
Hindawi Publishing CorporationAdvances in Mechanical EngineeringVolume 2013 Article ID 340501 9 pageshttpdxdoiorg1011552013340501
Research ArticleNew Concept for Assessment of Tidal Current Energy inJiangsu Coast China
Ji-Sheng Zhang1 Jun Wang2 Ai-Feng Tao1 Jin-Hai Zheng1 and Hui Li2
1 State Key Laboratory of Hydrology-Water Resources and Hydraulic Engineering Hohai University Nanjing 210098 China2 College of Harbor Coastal and Offshore Engineering Hohai University Nanjing 210098 China
Correspondence should be addressed to Ai-Feng Tao aftaohhueducn
Received 29 June 2013 Revised 10 October 2013 Accepted 14 October 2013
Academic Editor Luigi Cappelli
Copyright copy 2013 Ji-Sheng Zhang et alThis is an open access article distributed under the Creative Commons Attribution Licensewhich permits unrestricted use distribution and reproduction in any medium provided the original work is properly cited
Tidal current energy has attractedmore andmore attentions of coastal engineers in recent years mainly due to its advantages of lowenvironmental impact long-term predictability and large energy potential In this study a two-dimensional hydrodynamic modelis applied to predict the distribution of mean density of tidal current energy and to determine a suitable site for energy exploitationin Jiangsu Coast The simulation results including water elevation and tidal current (speed and direction) were validated withmeasured data showing a reasonable agreement Then the model was used to evaluate the distribution of mean density of tidalcurrent energy during springtide and neap tide in Jiangsu Coast Considering the discontinuous performance of tidal currentturbine a new concept for assessing tidal current energy is introduced with three parameters total operating time dispersion ofoperating time andmean operating time of tidal current turbineThe operating efficiency of tidal current turbine at three locationsaround radial submarine sand ridges was taken as examples for comparison determining suitable sites for development of tidalcurrent farm
1 Introduction
The rapid development of economics and science technologyhas caused an enormous consumption of fossil fuel energyand environmental pollution As marine renewable energiesare clean and sustainable they can offer a solution to relieveenergy crisis and to reduce environmental impacts It is wellknown that ocean covers nearly 71 of the earthrsquos surfaceand holds a large amount of energy more than 2 times 103 TW[1] Ocean energies can be exploited in many different formsincluding tide wave tidal current thermal salinity gradientsand biomass [2] Tidal current energy differs from tidalenergy Application of tidal current energy is to transformkinetic energy of tidal current to electricity while applicationof tidal energy is about the usage of potential energy due tosea level variation [3] Among all forms of ocean energiestidal current energy is preferable mainly due to its advantagesof the high energy density (approximately 832 times greaterthan wind) [2] long-time predictability and potentially largeresource [4] For these reasons tidal current energy drawsmore and more attentions from the public in recent years
China has an excellent resource of tidal current energywith a huge capacity of approximate 13950MW [5] Exploita-tion of tidal current energy will be an important supply asa clean and reliable power in the near future Jiangsu is aprovince on the eastern coast of China with a coastline of954Km A radial submarine sand ridge was formed in thenorthern part of JiangsuCoast due to strong tidal current andundoubtedly tidal current energymainly concentrated in thisarea Maximal current speeds in Huangshayang channel andXiyang channel are over 25ms and 20ms respectivelyTherefore assessment of tidal current energy in JiangsuCoastis of great practical significance
Assessment of tidal current energy is usually applied toidentify location of greatest potential and to estimate levelof energy production that can be achieved [6] In the pastten years some studies regarding assessment of tidal currentenergy in China have been conducted For example Li et alinvestigated the distribution of tidal current energy and rec-ommended some possible location for exploitation in China[7] Liu et al summarized distribution of tidal current energyin some several water channels around China and calculated
2 Advances in Mechanical Engineering
the theoretical value of tidal current power [8] After review-ing previous two-dimensional model for evaluation of tidalcurrents energy Chen implemented a three-dimensionalsemi-implicit Euler-Lagrange finite element model (SELFE)to assess the potential tidal current energy of three locationsaroundKinmen Island in Taiwan and analyzed the impacts ofenergy extraction on hydrodynamics in Taiwan Strait [3 6]
Previous assessment of tidal current energy mainlyfocused on simulation of specific coast distribution of energyand potential channel for future exploitation Operating timeof current turbine is acknowledged as an influencing factoron energy extraction because frequently interruptedworkingcondition will reduce efficiency of current turbine Time-dependent magnitude of current velocity shows a process ofperiodic variation and a current turbine has an upper limitand a lower limit to current speed within which it cantransform energy properly Therefore operating time ofcurrent turbine is discontinuous and periodic Period andinterruption interval of current turbine during operationare mainly dependent on tidal cycle Consequently a waterchannel with more steady and consecutive tidal current ismore suitable for transformation from tidal current energyto electricity
Main objective of this study is to propose a new conceptfor assessment of tidal current energy in terms of totaloperating time dispersion of operating time and meanoperating time A two-dimensional hydrodynamic model isdeveloped in JiangsuCoast which is based on the commercialsoftware MIKE 21 FM package and the simulated results(water elevation and current velocity) are validated with themeasurement data Then numerical results from validatedmodel are used for assessment of tidal current energyDensityof tidal current energy total operating time dispersion ofoperating time and mean operating time at three locationsare compared to identify themost suitable site for deploymentof tide current turbine
2 Numerical Model
21 Governing Equations of Hydrodynamic Model A two-dimensional model is built within the commercial MIKE21 FM package to simulate tidal hydrodynamics in JiangsuCoast The two-dimensional incompressible Reynolds-Aver-aged Navier-Stokes (RANS) equations for describing tidalhydrodynamics can be written as
120597ℎ
120597119905
+
120597ℎ119906
120597119909
+
120597ℎV
120597119910
= ℎ119878
120597ℎ119906
120597119905
+
120597ℎ1199062
120597119909
+
120597ℎ119906V
120597119910
= 119891Vℎ minus 119892ℎ120597120578
120597119909
minus
ℎ
1205880
120597119901119886
120597119909
minus
119892ℎ2
21205880
120597120588
120597119909
+
120591119904119909
1205880
minus
120591119887119909
1205880
minus
1
1205880
(
120597119904119909119909
120597119909
+
120597119904119909119910
120597119910
) +
120597
120597119909
(ℎ119879119909119909) +
120597
120597119910
(ℎ119879119909119910) + ℎ119906
119904119878
120597ℎV
120597119905
+
120597ℎV2
120597119910
+
120597ℎ119906V
120597119909
= minus119891119906ℎ minus 119892ℎ
120597120578
120597119910
minus
ℎ
1205880
120597119901119886
120597119910
minus
119892ℎ2
21205880
120597120588
120597119910
+
120591119904119910
1205880
minus
120591119887119910
1205880
minus
1
1205880
(
120597119904119910119909
120597119909
+
120597119904119910119910
120597119910
) +
120597
120597119909
(ℎ119879119909119910) +
120597
120597119910
(ℎ119879119910119910) + ℎV
119904119878
(1)
where (119909 119910) are horizontal Cartesian coordinates 119905 is time 120578is surface elevation 119889 is still water depth ℎ = 120578 + 119889 is totalwater depth 119906 and V are velocity components in 119909 and 119910
directions 119891 = 2Ω sin120601 is Coriolis parameter (in which Ωis angular rate of revolution and 120601 is geographic latitude) 119892 isgravitational acceleration 120588 is density of water 119878
119909119909 119878119909119910 119878119910119909
and 119878119910119910
are components of radiation stress tensor 119875119886is
atmospheric pressure 1205880is reference density of water 119878 is
magnitude of discharge due to point sources (119906119904 V119904) is
velocity by which water is discharged into the ambient water119879119894119895are lateral stresses including viscous friction turbulent
friction and differential advection and overbar indicates adepth-averaged value
22 Calculation Formulation of Tidal Current Energy Whentidal flow passes through a vertical cross-section of unitarea perpendicular to the flow direction per unit time thecurrent energy extracted can be calculated by the method ofkineticenergy density [9]
119875 =
1
2
1198621199011205881198813 (2)
where119875 is density of tidal current energy within unit area119862119901
is turbine efficiency coefficient and 119881 is magnitude of flowvelocity averaged over cross-section Mean density of tidalcurrent energy 119875
119898 over an arbitrary period 119879 can be calcul-
ated by
119875119898=
1
119879
int
119879
0
1
2
1198621199011205881198813(119905) 119889119905 (3)
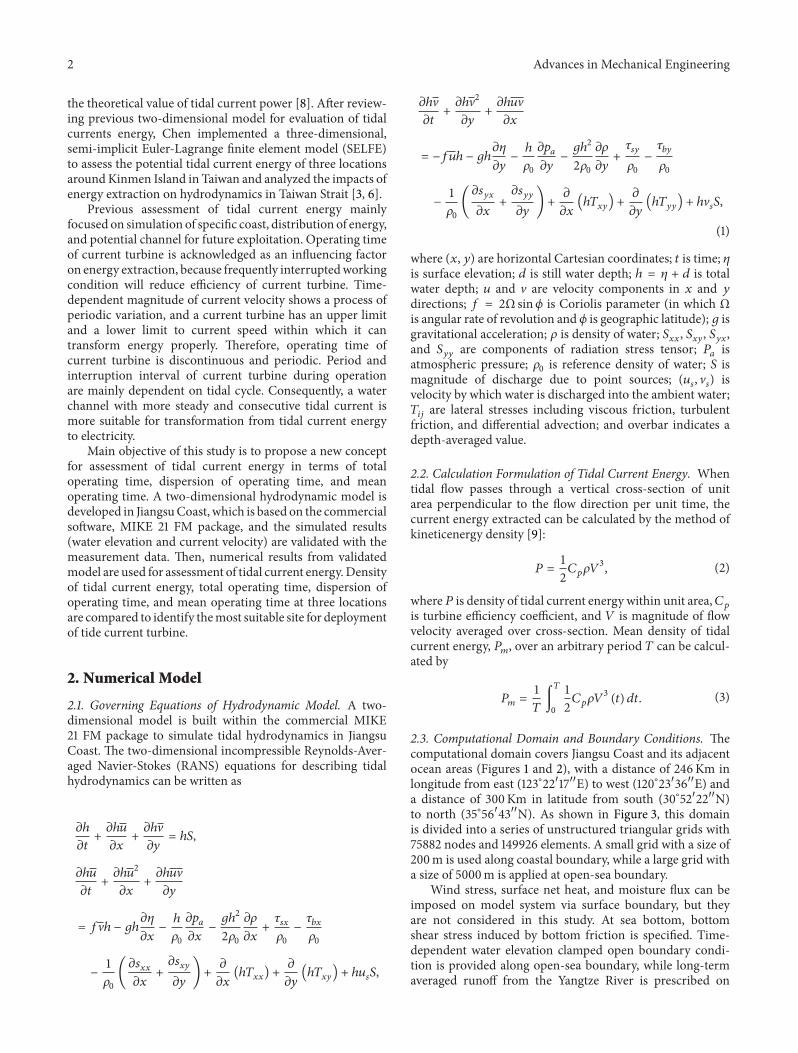
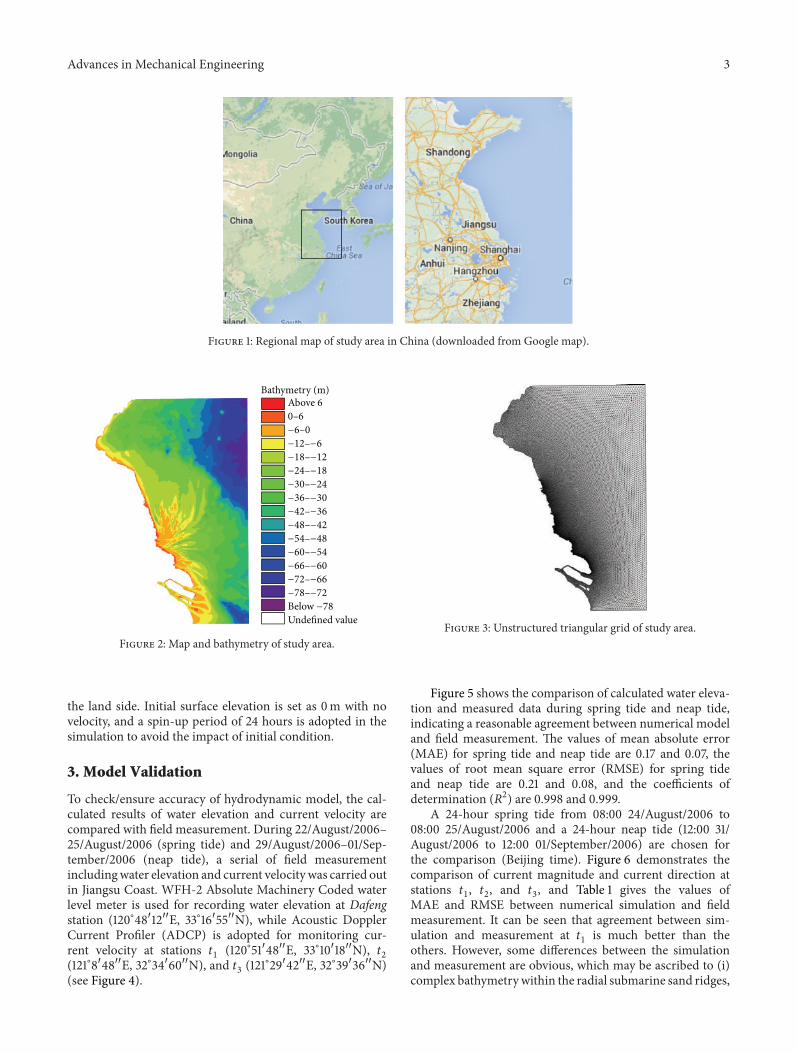
23 Computational Domain and Boundary Conditions Thecomputational domain covers Jiangsu Coast and its adjacentocean areas (Figures 1 and 2) with a distance of 246Km inlongitude from east (123∘2210158401710158401015840E) to west (120∘2310158403610158401015840E) anda distance of 300Km in latitude from south (30∘5210158402210158401015840N)to north (35∘5610158404310158401015840N) As shown in Figure 3 this domainis divided into a series of unstructured triangular grids with75882 nodes and 149926 elements A small grid with a size of200m is used along coastal boundary while a large grid witha size of 5000m is applied at open-sea boundary
Wind stress surface net heat and moisture flux can beimposed on model system via surface boundary but theyare not considered in this study At sea bottom bottomshear stress induced by bottom friction is specified Time-dependent water elevation clamped open boundary condi-tion is provided along open-sea boundary while long-termaveraged runoff from the Yangtze River is prescribed on
Advances in Mechanical Engineering 3
Figure 1 Regional map of study area in China (downloaded from Google map)
Bathymetry (m)Above 60ndash6minus6ndash0minus12ndashminus6minus18ndashminus12minus24ndashminus18minus30ndashminus24minus36ndashminus30minus42ndashminus36minus48ndashminus42minus54ndashminus48minus60ndashminus54minus66ndashminus60minus72ndashminus66minus78ndashminus72Below minus78
Undefined value
Figure 2 Map and bathymetry of study area
the land side Initial surface elevation is set as 0m with novelocity and a spin-up period of 24 hours is adopted in thesimulation to avoid the impact of initial condition
3 Model Validation
To checkensure accuracy of hydrodynamic model the cal-culated results of water elevation and current velocity arecompared with field measurement During 22August2006ndash25August2006 (spring tide) and 29August2006ndash01Sep-tember2006 (neap tide) a serial of field measurementincludingwater elevation and current velocitywas carried outin Jiangsu Coast WFH-2 Absolute Machinery Coded waterlevel meter is used for recording water elevation at Dafengstation (120∘4810158401210158401015840E 33∘1610158405510158401015840N) while Acoustic DopplerCurrent Profiler (ADCP) is adopted for monitoring cur-rent velocity at stations 119905
1(120∘5110158404810158401015840E 33∘1010158401810158401015840N) 119905
2
(121∘810158404810158401015840E 32∘3410158406010158401015840N) and 1199053(121∘2910158404210158401015840E 32∘3910158403610158401015840N)
(see Figure 4)
Figure 3 Unstructured triangular grid of study area
Figure 5 shows the comparison of calculated water eleva-tion and measured data during spring tide and neap tideindicating a reasonable agreement between numerical modeland field measurement The values of mean absolute error(MAE) for spring tide and neap tide are 017 and 007 thevalues of root mean square error (RMSE) for spring tideand neap tide are 021 and 008 and the coefficients ofdetermination (1198772) are 0998 and 0999
A 24-hour spring tide from 0800 24August2006 to0800 25August2006 and a 24-hour neap tide (1200 31August2006 to 1200 01September2006) are chosen forthe comparison (Beijing time) Figure 6 demonstrates thecomparison of current magnitude and current direction atstations 119905
1 1199052 and 119905
3 and Table 1 gives the values of
MAE and RMSE between numerical simulation and fieldmeasurement It can be seen that agreement between sim-ulation and measurement at 119905
1is much better than the
others However some differences between the simulationand measurement are obvious which may be ascribed to (i)complex bathymetrywithin the radial submarine sand ridges
4 Advances in Mechanical Engineering
3950000
3900000
3850000
3800000
3750000
3700000
3650000
3600000
3500000
3450000
3550000
3760000
3740000
3720000
3700000
3680000
3660000
3640000
3620000
3580000
3560000
3600000
200000 300000 400000350000400000300000 500000
Bathymetry (m)
Above 0
minus10ndash0
minus20ndashminus10
minus30ndashminus20
minus40ndashminus30
minus50ndashminus40
minus60ndashminus50
minus70ndashminus60
minus80ndashminus70
Below minus80
Undefined value
Dafengt1
t2
t3
Dafeng
t1
t2
t3
Figure 4 Locations of stations Dafeng 1199051 1199052 and 119905
3
822 823 824 825 826
0
1
2
3
4
Surfa
ce el
evat
ion
(m)
Time (day)
Spring tide
minus3
minus2
minus1
MeasurementSimulation
(a)
829 830 831 91 92
0
1
2
3
4Su
rface
elev
atio
n (m
)
Time (day)
Neap tide
minus3
minus2
minus1
MeasurementSimulation
(b)
Figure 5 Comparison of calculated water elevation and measured data at Dafeng station
(ii) various roughness coefficients during tidal cycle and (iii)unsteady surface wind
4 Assessment of Tidal Current Energy
Numerical results from validated model are used to evaluatedistribution of tidal current energy in Jiangsu Coast Inaddition to conventional method calculating mean densityof tidal current energy within the domain a new conceptwith three parameters total operating time dispersion ofoperating time and mean operating time of tidal currentturbine is introduced to describe the total working conditionof current turbine With these three new indicators threewater channels are taken as examples to identify the mostsuitable site for exploitation of tidal current energy
41 Mean Density of Tidal Current Energy Mean density oftidal current energy is a concept indicating the ability ofenergy production over a given period Density of currentenergy density is calculated by (2) and average of these valuesis taken asmean density of tidal current energy (3) It is notedthat a typical value of 03 is adopted for the parameter 119862
119901
(the percentage of power that can be extracted from the tidalstream taking into account the losses due to Betzrsquo law andthose assigned to internal mechanisms within the turbine)[6 10] Figure 7 shows the distribution of mean density oftidal current energy in spring tide and neap tide It can beseen that tidal current energy concentrates around the radialsubmarine sand ridges with a highest value of 094Kwm2during spring tide and a highest value of 060Kwm2 duringneap tide
Advances in Mechanical Engineering 5
0 5 10 15 20 25
00
05
10
15
20
MeasurementSimulation
Curr
ent s
peed
(ms
)
Time (h)
Spring tide t1
(a)
100
200
300
400
Curr
ent d
irect
ion
(deg
)
00
5 10 15 20 25
MeasurementSimulation
Time (h)
Spring tide t1
(b)
00
03
06
09
12
15
18
Curr
ent s
peed
(ms
)
0 5 10 15 20 25
MeasurementSimulation
Time (h)
Spring tide t2
(c)
50
100
150
200
250
300Cu
rren
t dire
ctio
n (d
eg)
0 5 10 15 20 25
MeasurementSimulation
Time (h)
Spring tide t2
(d)
00
03
06
09
12
15
18
Curr
ent s
peed
(ms
)
0 5 10 15 20 25
MeasurementSimulation
Time (h)
Spring tide t3
(e)
0
50
100
150
200
250
300
Curr
ent d
irect
ion
(deg
)
0 5 10 15 20 25
MeasurementSimulation
Time (h)
Spring tide t3
(f)Figure 6 Continued
6 Advances in Mechanical Engineering
00
04
08
12
16Cu
rren
t spe
ed (m
s)
0 5 10 15 20 25
MeasurementSimulation
Time (h)
Neap tide t1
(g)
0
100
200
300
400
Curr
ent d
irect
ion
(deg
)
Neap tide t1
0 5 10 15 20 25
MeasurementSimulation
Time (h)
(h)
00
02
04
06
08
10
12
Curr
ent s
peed
(ms
)
0 5 10 15 20 25
MeasurementSimulation
Time (h)
Neap tide t2
(i)
0
100
200
300Cu
rren
t dire
ctio
n (d
eg)
0 5 10 15 20 25
MeasurementSimulation
Time (h)
Neap tide t2
(j)
00
04
08
12
Curr
ent s
peed
(ms
)
0 5 10 15 20 25
MeasurementSimulation
Time (h)
Neap tide t3
(k)
0
50
100
150
200
250
300
350
Curr
ent d
irect
ion
(deg
)
0 5 10 15 20 25
MeasurementSimulation
Time (h)
Neap tide t3
(l)
Figure 6 Comparisons of depth-averaged tidal current between numerical simulation and field measurement for ((a)ndash(f)) spring tide and((g)ndash(l)) neap tide at stations 119905
1 1199052 and 119905
3
Advances in Mechanical Engineering 7
Table 1 Values of MAE and RMSE between calculated and observed tidal current
1199051
1199052
1199053
Speed (ms) Direction (degree) Speed (ms) Direction (degree) Speed (ms) Direction (degree)Spring tide
MAE 029 23 020 14 022 21RMSE 040 51 026 23 029 341198772 089 091 079 098 074 093
Neap tideMAE 016 17 022 27 012 21RMSE 022 38 027 52 016 401198772 095 093 051 087 082 090
Note MAE mean absolute error RMSE root mean square error 1198772 coefficient of determination
Above 7065ndash7060ndash6555ndash6050ndash5545ndash5040ndash4535ndash4030ndash3525ndash3020ndash2515ndash2010ndash1505ndash1000ndash05Below 00Undefined value
Above 8478ndash7072ndash6566ndash7260ndash6654ndash6048ndash5442ndash4036ndash4230ndash3624ndash3018ndash2412ndash1806ndash1200ndash06Below 00Undefined value
Density (100 Wm2) Density (100 Wm2)
(a) Spring tide
Above 4239ndash4236ndash3933ndash3630ndash3327ndash3024ndash2721ndash2418ndash2115ndash1812ndash1509ndash1206ndash0903ndash0600ndash03Below 00Undefined value
Above 4239ndash4236ndash3933ndash3630ndash3327ndash3024ndash2721ndash2418ndash2115ndash1812ndash1509ndash1206ndash0903ndash0600ndash03Below 00Undefined value
Density (100 Wm2) Density (100 Wm2)
(b) Neap tide
Figure 7 Distribution of mean density of tidal current energy during (a) spring tide and (b) neap tide (unit 100Wm2)
The radial submarine sand ridges consist of many waterchannels that are ideal locations for exploitation of tidalcurrent energy According to long-term tidal measurementthree water channels (Xiyang Huangshayang and Lan-shayang) with wide width and rapid current are consid-ered in this study After calculation of the potential meandensity of energy one representative point in each waterchannel is chosen for the comparison of tidal currentenergy to find a suitable site for tidal turbines As dis-played in Figure 8 locations 119905
4(121∘0010158405810158401015840E 33∘0010158400610158401015840N) in
Xiyang 1199055(121∘2610158405110158401015840E 32∘3910158400110158401015840N) in Huangshayang and
1199056(121∘3910158403210158401015840E 32∘3410158400410158401015840N) in Lanshayang are around the
radial submarine sand ridges Table 2 gives values of meandensity of tidal current energy at these three positionsshowing that 119905
4has a maximal value of mean density of tidal
current energy among these three locations
42 New Concept for Assessment of Tidal Current EnergyIt is well known that tidal current turbine has a low limitof tidal current velocity for power generation In 2010
8 Advances in Mechanical Engineering
3900000
3800000
3700000
3600000
3500000
200000 400000
Bathymetry (m)
Above 0
minus10ndash0
minus20ndashminus10
minus30ndashminus20
minus40ndashminus30
minus50ndashminus40
minus60ndashminus50
minus70ndashminus60
minus80ndashminus70
Below minus80
Undefined value
Figure 8 Locations of 1199054 1199055 and 119905
6
Table 2 Mean density of tidal current energy at 1199054 1199055 and 119905
6
Mean density of tidal current energy (100wm2)1199054
1199055
1199056
Spring tide 39 25 35Neap tide 26 12 17
Benelghali et al compared Doubly-Fed Induction Generator(DFIG) and Permanent Magnet Synchronous Generator(PMSG) for marine current turbine applications and theyfound that DFIG is with a lower limit of 13ms [11] In thisstudy the velocity of 13ms is taken as the lower limit of tidalcurrent turbine Due to the existence of the lower limit tidalcurrent turbine is with discontinuous operating in practicalapplication Total operating time dispersion of operatingtime and mean operating time consequently become threenew important parameters in assessment of tidal currentenergy and evaluation of operating efficiency of tidal currentturbine
Total operating time is defined as the sum of operatingtimes over a given period indicating the duration of effectiveoperation of tidal current turbine
Total Operating Time = int119879
0
119875 (V119905) 119889119905
119875 (V119905) =
0 V lt 13ms1 V ge 13ms
(4)
where V119905is current velocity and 119879 is a given period
According to the low limit of 13ms of tidal currentturbine all the durations with a tidal current speed over13ms are accumulated and their sum is considered as totaloperating time As listed in Table 3 during 72-hour springtide and neap tide total operating time at locations 119905
4and 1199056
is longer than that at location 1199055 For example total operation
time at location 1199054is 318 hours and 183 hours for spring
tide and neap tide respectively indicating that tidal current
Table 3 Total operating time during spring tide and neap tide at 1199054
1199055 and 119905
6
Total operating time (h) and proportion of 72 hours1199054
1199055
1199056
Spring tide 318 44 265 37 315 44Neap tide 183 25 6 8 133 18
Table 4 Dispersion of operating time and mean operating timeduring spring tide and neap tide at 119905
4 1199055 and 119905
6
Spring tide Neap tide1199054
1199055
1199056
1199054
1199055
1199056
Dispersion of operatingtime (no unit) 12 11 12 7 3 6
Mean operating time (h) 265 241 263 261 200 222
turbine works in 44 of time in spring tide and 25 of timein neap tide
Dispersion of operating time is defined as interruptionnumber of turbine performance during a given period whichis calculated by counting the status shift from power-off (witha current velocity below 13ms) to power-on (with a currentvelocity over 13ms) of tidal current turbine
Dispersion of Operating Time = sum119876(V119905 119905) (0 le 119905 le 119879)
119876 (V 119905) = 1 lim120575rarr0
119875 (V119905minus120575) lt lim120575rarr0
119875 (V119905+120575)
0 others(5)
Values of dispersion of operating time during spring tideand neap tide at 119905
4 1199055 and 119905
6are given inTable 4 showing that
interruption number of turbine performance is the largest Itis reasonable to have a larger interruption number when totaloperating time of tidal current turbine is longer It is necessaryto point out that in these two indicators total operating timeof tidal current turbine is the main indicator for assessmentof tidal current energy In the case of similar amount of totaloperating time a smaller value of dispersion of operatingtime is preferred
It is also useful to define mean operation time of tidalcurrent turbine as the ratio of total operating time to dis-persion of operation time
Mean Operating Time =Total Operating Time
Dispersion of Operating Time
(6)
As listed in Table 4 mean operating time at stations 1199054
and 1199055is obviously larger than that at 119905
6 It can be seen that
a higher efficiency of turbine operation can be achieved at 1199054
and 1199055(due to a higher value of total operating time) although
interruption number of turbine operation is largerThereforestations 119905
4(Xiyang) and 119905
5(Lanshayang) are more suitable
sites for deployment of tidal current turbines among thesethree locations However the final decision on site selectionfor tidal current farm is also dependent on the large-scaleocean space-use plan along Jiangsu Coast
Advances in Mechanical Engineering 9
5 Conclusion
A two-dimensional hydrodynamic model was developedwith Mike 21 FM package to assess tidal current energy andseek for suitable sites for deployment of tidal current turbineFor model validation calculated water elevation and currentvelocity are compared with field measurement indicatinga generally reasonable agreement Then simulation resultswere used to evaluate tidal current energy resources inJiangsu Coast In addition to traditional method calculatingmean density of tidal current energy a new concept in termsof total operating time dispersion of operating time andmean operating time of tidal current turbine was proposedfor assessmentThese three indicatorswerewell defined in thestudy and they were found to be very useful in determiningsuitable sites for deployment of tidal current turbine It isnoted that total operating time of tidal current turbine isthe most important indicator for assessment of tidal currentenergy in this new concept In the case of similar amount oftotal operating time a smaller value of dispersion of operatingtime or a larger value of mean operating time is preferredBased on this new concept Xiyang and Lanshayang are themore suitable sites for deployment of tidal current turbine inJiangsuCoast However the final decision on site selection fortidal current farm is also dependent on the large-scale oceanspace-use plan along Jiangsu Coast
Conflict of Interests
The authors declare that there is no conflict of interestsregarding the publication of this paper
Acknowledgments
This work was financially supported by the National NaturalScience Foundation of China (51137002) Natural ScienceFoundation Project of Jiangsu Province (BK2011026) and the111 project (B12032)
References
[1] K Toshiaki ldquoDream of marine-topia new technologies to uti-lize effectivelyrenewable energies at offshorerdquo Current AppliedPhysics vol 10 supplement 2 pp S4ndashS8 2010
[2] C W Finkl and R Charlier ldquoElectrical power generation fromocean currents in the Straits of Florida some environmentalconsiderationsrdquoRenewable and Sustainable Energy Reviews vol13 no 9 pp 2597ndash2604 2009
[3] W B Chen W C Liu and M H Hsu ldquoModeling evaluationof tidal stream energy and the impacts ofenergy extraction onhydrodynamics in the Taiwan Straitrdquo Energies vol 6 no 4 pp2191ndash2203 2013
[4] F L Ponta and P M Jacovkis ldquoMarine-current power genera-tion by diffuser-augmented floating hydro-turbinesrdquoRenewableEnergy vol 33 no 4 pp 665ndash673 2008
[5] C K Wang and W Y Shi ldquoThe ocean resources and reservesevaluation in Chinardquo in Proceedings of the 1st National Sympo-sium on Ocean Energy in Hangzhou pp 169ndash179 2008
[6] W B Chen W C Liu and M H Hsu ldquoModeling assessmentof tidal current energy at Kinmen Island Taiwanrdquo RenewableEnergy vol 50 pp 1073ndash1082 2013
[7] D Li S Wang and P Yuan ldquoAn overview of development oftidal current in China energy resource conversion technologyand opportunitiesrdquo Renewable and Sustainable Energy Reviewsvol 14 no 9 pp 2896ndash2905 2010
[8] H W Liu S Ma W Li H G Gu Y Lin and X Sun ldquoAreview on the development of tidal current energy in ChinardquoRenewable and Sustainable Energy Reviews vol 15 no 2 pp1141ndash1146 2011
[9] P Michel L Veronique and L Denis Marine RenewableEnergies Prospective Foresight Study for 2030 QUAE editionParis France 2007
[10] A N Gorbanrsquo A M Gorlov and V M Silantyev ldquoLimits of theturbine efficiency for free fluid flowrdquo Journal of Energy ResourcesTechnology vol 123 no 2ndash4 pp 311ndash317 2001
[11] S Benelghali M E H Benbouzid and J F CharpentierldquoComparison of PMSG and DFIG for marine current turbineapplicationsrdquo in Proceedings of the 19th International Conferenceon Electrical Machines (ICEM rsquo10) Roma Italy September 2010
Submit your manuscripts athttpwwwhindawicom
VLSI Design
Hindawi Publishing Corporationhttpwwwhindawicom Volume 2014
International Journal of
RotatingMachinery
Hindawi Publishing Corporationhttpwwwhindawicom Volume 2014
Hindawi Publishing Corporation httpwwwhindawicom
Journal ofEngineeringVolume 2014
Hindawi Publishing Corporationhttpwwwhindawicom Volume 2014
Shock and Vibration
Hindawi Publishing Corporationhttpwwwhindawicom Volume 2014
Mechanical Engineering
Advances in
Hindawi Publishing Corporationhttpwwwhindawicom Volume 2014
Civil EngineeringAdvances in
Acoustics and VibrationAdvances in
Hindawi Publishing Corporationhttpwwwhindawicom Volume 2014
Hindawi Publishing Corporationhttpwwwhindawicom Volume 2014
Electrical and Computer Engineering
Journal of
Hindawi Publishing Corporationhttpwwwhindawicom Volume 2014
Distributed Sensor Networks
International Journal of
The Scientific World JournalHindawi Publishing Corporation httpwwwhindawicom Volume 2014
SensorsJournal of
Hindawi Publishing Corporationhttpwwwhindawicom Volume 2014
Modelling amp Simulation in EngineeringHindawi Publishing Corporation httpwwwhindawicom Volume 2014
Hindawi Publishing Corporationhttpwwwhindawicom Volume 2014
Active and Passive Electronic Components
Hindawi Publishing Corporationhttpwwwhindawicom Volume 2014
Chemical EngineeringInternational Journal of
Control Scienceand Engineering
Journal of
Hindawi Publishing Corporationhttpwwwhindawicom Volume 2014
Antennas andPropagation
International Journal of
Hindawi Publishing Corporationhttpwwwhindawicom Volume 2014
Hindawi Publishing Corporationhttpwwwhindawicom Volume 2014
Navigation and Observation
International Journal of
Advances inOptoElectronics
Hindawi Publishing Corporation httpwwwhindawicom
Volume 2014
RoboticsJournal of
Hindawi Publishing Corporationhttpwwwhindawicom Volume 2014
2 Advances in Mechanical Engineering
the theoretical value of tidal current power [8] After review-ing previous two-dimensional model for evaluation of tidalcurrents energy Chen implemented a three-dimensionalsemi-implicit Euler-Lagrange finite element model (SELFE)to assess the potential tidal current energy of three locationsaroundKinmen Island in Taiwan and analyzed the impacts ofenergy extraction on hydrodynamics in Taiwan Strait [3 6]
Previous assessment of tidal current energy mainlyfocused on simulation of specific coast distribution of energyand potential channel for future exploitation Operating timeof current turbine is acknowledged as an influencing factoron energy extraction because frequently interruptedworkingcondition will reduce efficiency of current turbine Time-dependent magnitude of current velocity shows a process ofperiodic variation and a current turbine has an upper limitand a lower limit to current speed within which it cantransform energy properly Therefore operating time ofcurrent turbine is discontinuous and periodic Period andinterruption interval of current turbine during operationare mainly dependent on tidal cycle Consequently a waterchannel with more steady and consecutive tidal current ismore suitable for transformation from tidal current energyto electricity
Main objective of this study is to propose a new conceptfor assessment of tidal current energy in terms of totaloperating time dispersion of operating time and meanoperating time A two-dimensional hydrodynamic model isdeveloped in JiangsuCoast which is based on the commercialsoftware MIKE 21 FM package and the simulated results(water elevation and current velocity) are validated with themeasurement data Then numerical results from validatedmodel are used for assessment of tidal current energyDensityof tidal current energy total operating time dispersion ofoperating time and mean operating time at three locationsare compared to identify themost suitable site for deploymentof tide current turbine
2 Numerical Model
21 Governing Equations of Hydrodynamic Model A two-dimensional model is built within the commercial MIKE21 FM package to simulate tidal hydrodynamics in JiangsuCoast The two-dimensional incompressible Reynolds-Aver-aged Navier-Stokes (RANS) equations for describing tidalhydrodynamics can be written as
120597ℎ
120597119905
+
120597ℎ119906
120597119909
+
120597ℎV
120597119910
= ℎ119878
120597ℎ119906
120597119905
+
120597ℎ1199062
120597119909
+
120597ℎ119906V
120597119910
= 119891Vℎ minus 119892ℎ120597120578
120597119909
minus
ℎ
1205880
120597119901119886
120597119909
minus
119892ℎ2
21205880
120597120588
120597119909
+
120591119904119909
1205880
minus
120591119887119909
1205880
minus
1
1205880
(
120597119904119909119909
120597119909
+
120597119904119909119910
120597119910
) +
120597
120597119909
(ℎ119879119909119909) +
120597
120597119910
(ℎ119879119909119910) + ℎ119906
119904119878
120597ℎV
120597119905
+
120597ℎV2
120597119910
+
120597ℎ119906V
120597119909
= minus119891119906ℎ minus 119892ℎ
120597120578
120597119910
minus
ℎ
1205880
120597119901119886
120597119910
minus
119892ℎ2
21205880
120597120588
120597119910
+
120591119904119910
1205880
minus
120591119887119910
1205880
minus
1
1205880
(
120597119904119910119909
120597119909
+
120597119904119910119910
120597119910
) +
120597
120597119909
(ℎ119879119909119910) +
120597
120597119910
(ℎ119879119910119910) + ℎV
119904119878
(1)
where (119909 119910) are horizontal Cartesian coordinates 119905 is time 120578is surface elevation 119889 is still water depth ℎ = 120578 + 119889 is totalwater depth 119906 and V are velocity components in 119909 and 119910
directions 119891 = 2Ω sin120601 is Coriolis parameter (in which Ωis angular rate of revolution and 120601 is geographic latitude) 119892 isgravitational acceleration 120588 is density of water 119878
119909119909 119878119909119910 119878119910119909
and 119878119910119910
are components of radiation stress tensor 119875119886is
atmospheric pressure 1205880is reference density of water 119878 is
magnitude of discharge due to point sources (119906119904 V119904) is
velocity by which water is discharged into the ambient water119879119894119895are lateral stresses including viscous friction turbulent
friction and differential advection and overbar indicates adepth-averaged value
22 Calculation Formulation of Tidal Current Energy Whentidal flow passes through a vertical cross-section of unitarea perpendicular to the flow direction per unit time thecurrent energy extracted can be calculated by the method ofkineticenergy density [9]
119875 =
1
2
1198621199011205881198813 (2)
where119875 is density of tidal current energy within unit area119862119901
is turbine efficiency coefficient and 119881 is magnitude of flowvelocity averaged over cross-section Mean density of tidalcurrent energy 119875
119898 over an arbitrary period 119879 can be calcul-
ated by
119875119898=
1
119879
int
119879
0
1
2
1198621199011205881198813(119905) 119889119905 (3)
23 Computational Domain and Boundary Conditions Thecomputational domain covers Jiangsu Coast and its adjacentocean areas (Figures 1 and 2) with a distance of 246Km inlongitude from east (123∘2210158401710158401015840E) to west (120∘2310158403610158401015840E) anda distance of 300Km in latitude from south (30∘5210158402210158401015840N)to north (35∘5610158404310158401015840N) As shown in Figure 3 this domainis divided into a series of unstructured triangular grids with75882 nodes and 149926 elements A small grid with a size of200m is used along coastal boundary while a large grid witha size of 5000m is applied at open-sea boundary
Wind stress surface net heat and moisture flux can beimposed on model system via surface boundary but theyare not considered in this study At sea bottom bottomshear stress induced by bottom friction is specified Time-dependent water elevation clamped open boundary condi-tion is provided along open-sea boundary while long-termaveraged runoff from the Yangtze River is prescribed on
Advances in Mechanical Engineering 3
Figure 1 Regional map of study area in China (downloaded from Google map)
Bathymetry (m)Above 60ndash6minus6ndash0minus12ndashminus6minus18ndashminus12minus24ndashminus18minus30ndashminus24minus36ndashminus30minus42ndashminus36minus48ndashminus42minus54ndashminus48minus60ndashminus54minus66ndashminus60minus72ndashminus66minus78ndashminus72Below minus78
Undefined value
Figure 2 Map and bathymetry of study area
the land side Initial surface elevation is set as 0m with novelocity and a spin-up period of 24 hours is adopted in thesimulation to avoid the impact of initial condition
3 Model Validation
To checkensure accuracy of hydrodynamic model the cal-culated results of water elevation and current velocity arecompared with field measurement During 22August2006ndash25August2006 (spring tide) and 29August2006ndash01Sep-tember2006 (neap tide) a serial of field measurementincludingwater elevation and current velocitywas carried outin Jiangsu Coast WFH-2 Absolute Machinery Coded waterlevel meter is used for recording water elevation at Dafengstation (120∘4810158401210158401015840E 33∘1610158405510158401015840N) while Acoustic DopplerCurrent Profiler (ADCP) is adopted for monitoring cur-rent velocity at stations 119905
1(120∘5110158404810158401015840E 33∘1010158401810158401015840N) 119905
2
(121∘810158404810158401015840E 32∘3410158406010158401015840N) and 1199053(121∘2910158404210158401015840E 32∘3910158403610158401015840N)
(see Figure 4)
Figure 3 Unstructured triangular grid of study area
Figure 5 shows the comparison of calculated water eleva-tion and measured data during spring tide and neap tideindicating a reasonable agreement between numerical modeland field measurement The values of mean absolute error(MAE) for spring tide and neap tide are 017 and 007 thevalues of root mean square error (RMSE) for spring tideand neap tide are 021 and 008 and the coefficients ofdetermination (1198772) are 0998 and 0999
A 24-hour spring tide from 0800 24August2006 to0800 25August2006 and a 24-hour neap tide (1200 31August2006 to 1200 01September2006) are chosen forthe comparison (Beijing time) Figure 6 demonstrates thecomparison of current magnitude and current direction atstations 119905
1 1199052 and 119905
3 and Table 1 gives the values of
MAE and RMSE between numerical simulation and fieldmeasurement It can be seen that agreement between sim-ulation and measurement at 119905
1is much better than the
others However some differences between the simulationand measurement are obvious which may be ascribed to (i)complex bathymetrywithin the radial submarine sand ridges
4 Advances in Mechanical Engineering
3950000
3900000
3850000
3800000
3750000
3700000
3650000
3600000
3500000
3450000
3550000
3760000
3740000
3720000
3700000
3680000
3660000
3640000
3620000
3580000
3560000
3600000
200000 300000 400000350000400000300000 500000
Bathymetry (m)
Above 0
minus10ndash0
minus20ndashminus10
minus30ndashminus20
minus40ndashminus30
minus50ndashminus40
minus60ndashminus50
minus70ndashminus60
minus80ndashminus70
Below minus80
Undefined value
Dafengt1
t2
t3
Dafeng
t1
t2
t3
Figure 4 Locations of stations Dafeng 1199051 1199052 and 119905
3
822 823 824 825 826
0
1
2
3
4
Surfa
ce el
evat
ion
(m)
Time (day)
Spring tide
minus3
minus2
minus1
MeasurementSimulation
(a)
829 830 831 91 92
0
1
2
3
4Su
rface
elev
atio
n (m
)
Time (day)
Neap tide
minus3
minus2
minus1
MeasurementSimulation
(b)
Figure 5 Comparison of calculated water elevation and measured data at Dafeng station
(ii) various roughness coefficients during tidal cycle and (iii)unsteady surface wind
4 Assessment of Tidal Current Energy
Numerical results from validated model are used to evaluatedistribution of tidal current energy in Jiangsu Coast Inaddition to conventional method calculating mean densityof tidal current energy within the domain a new conceptwith three parameters total operating time dispersion ofoperating time and mean operating time of tidal currentturbine is introduced to describe the total working conditionof current turbine With these three new indicators threewater channels are taken as examples to identify the mostsuitable site for exploitation of tidal current energy
41 Mean Density of Tidal Current Energy Mean density oftidal current energy is a concept indicating the ability ofenergy production over a given period Density of currentenergy density is calculated by (2) and average of these valuesis taken asmean density of tidal current energy (3) It is notedthat a typical value of 03 is adopted for the parameter 119862
119901
(the percentage of power that can be extracted from the tidalstream taking into account the losses due to Betzrsquo law andthose assigned to internal mechanisms within the turbine)[6 10] Figure 7 shows the distribution of mean density oftidal current energy in spring tide and neap tide It can beseen that tidal current energy concentrates around the radialsubmarine sand ridges with a highest value of 094Kwm2during spring tide and a highest value of 060Kwm2 duringneap tide
Advances in Mechanical Engineering 5
0 5 10 15 20 25
00
05
10
15
20
MeasurementSimulation
Curr
ent s
peed
(ms
)
Time (h)
Spring tide t1
(a)
100
200
300
400
Curr
ent d
irect
ion
(deg
)
00
5 10 15 20 25
MeasurementSimulation
Time (h)
Spring tide t1
(b)
00
03
06
09
12
15
18
Curr
ent s
peed
(ms
)
0 5 10 15 20 25
MeasurementSimulation
Time (h)
Spring tide t2
(c)
50
100
150
200
250
300Cu
rren
t dire
ctio
n (d
eg)
0 5 10 15 20 25
MeasurementSimulation
Time (h)
Spring tide t2
(d)
00
03
06
09
12
15
18
Curr
ent s
peed
(ms
)
0 5 10 15 20 25
MeasurementSimulation
Time (h)
Spring tide t3
(e)
0
50
100
150
200
250
300
Curr
ent d
irect
ion
(deg
)
0 5 10 15 20 25
MeasurementSimulation
Time (h)
Spring tide t3
(f)Figure 6 Continued
6 Advances in Mechanical Engineering
00
04
08
12
16Cu
rren
t spe
ed (m
s)
0 5 10 15 20 25
MeasurementSimulation
Time (h)
Neap tide t1
(g)
0
100
200
300
400
Curr
ent d
irect
ion
(deg
)
Neap tide t1
0 5 10 15 20 25
MeasurementSimulation
Time (h)
(h)
00
02
04
06
08
10
12
Curr
ent s
peed
(ms
)
0 5 10 15 20 25
MeasurementSimulation
Time (h)
Neap tide t2
(i)
0
100
200
300Cu
rren
t dire
ctio
n (d
eg)
0 5 10 15 20 25
MeasurementSimulation
Time (h)
Neap tide t2
(j)
00
04
08
12
Curr
ent s
peed
(ms
)
0 5 10 15 20 25
MeasurementSimulation
Time (h)
Neap tide t3
(k)
0
50
100
150
200
250
300
350
Curr
ent d
irect
ion
(deg
)
0 5 10 15 20 25
MeasurementSimulation
Time (h)
Neap tide t3
(l)
Figure 6 Comparisons of depth-averaged tidal current between numerical simulation and field measurement for ((a)ndash(f)) spring tide and((g)ndash(l)) neap tide at stations 119905
1 1199052 and 119905
3
Advances in Mechanical Engineering 7
Table 1 Values of MAE and RMSE between calculated and observed tidal current
1199051
1199052
1199053
Speed (ms) Direction (degree) Speed (ms) Direction (degree) Speed (ms) Direction (degree)Spring tide
MAE 029 23 020 14 022 21RMSE 040 51 026 23 029 341198772 089 091 079 098 074 093
Neap tideMAE 016 17 022 27 012 21RMSE 022 38 027 52 016 401198772 095 093 051 087 082 090
Note MAE mean absolute error RMSE root mean square error 1198772 coefficient of determination
Above 7065ndash7060ndash6555ndash6050ndash5545ndash5040ndash4535ndash4030ndash3525ndash3020ndash2515ndash2010ndash1505ndash1000ndash05Below 00Undefined value
Above 8478ndash7072ndash6566ndash7260ndash6654ndash6048ndash5442ndash4036ndash4230ndash3624ndash3018ndash2412ndash1806ndash1200ndash06Below 00Undefined value
Density (100 Wm2) Density (100 Wm2)
(a) Spring tide
Above 4239ndash4236ndash3933ndash3630ndash3327ndash3024ndash2721ndash2418ndash2115ndash1812ndash1509ndash1206ndash0903ndash0600ndash03Below 00Undefined value
Above 4239ndash4236ndash3933ndash3630ndash3327ndash3024ndash2721ndash2418ndash2115ndash1812ndash1509ndash1206ndash0903ndash0600ndash03Below 00Undefined value
Density (100 Wm2) Density (100 Wm2)
(b) Neap tide
Figure 7 Distribution of mean density of tidal current energy during (a) spring tide and (b) neap tide (unit 100Wm2)
The radial submarine sand ridges consist of many waterchannels that are ideal locations for exploitation of tidalcurrent energy According to long-term tidal measurementthree water channels (Xiyang Huangshayang and Lan-shayang) with wide width and rapid current are consid-ered in this study After calculation of the potential meandensity of energy one representative point in each waterchannel is chosen for the comparison of tidal currentenergy to find a suitable site for tidal turbines As dis-played in Figure 8 locations 119905
4(121∘0010158405810158401015840E 33∘0010158400610158401015840N) in
Xiyang 1199055(121∘2610158405110158401015840E 32∘3910158400110158401015840N) in Huangshayang and
1199056(121∘3910158403210158401015840E 32∘3410158400410158401015840N) in Lanshayang are around the
radial submarine sand ridges Table 2 gives values of meandensity of tidal current energy at these three positionsshowing that 119905
4has a maximal value of mean density of tidal
current energy among these three locations
42 New Concept for Assessment of Tidal Current EnergyIt is well known that tidal current turbine has a low limitof tidal current velocity for power generation In 2010
8 Advances in Mechanical Engineering
3900000
3800000
3700000
3600000
3500000
200000 400000
Bathymetry (m)
Above 0
minus10ndash0
minus20ndashminus10
minus30ndashminus20
minus40ndashminus30
minus50ndashminus40
minus60ndashminus50
minus70ndashminus60
minus80ndashminus70
Below minus80
Undefined value
Figure 8 Locations of 1199054 1199055 and 119905
6
Table 2 Mean density of tidal current energy at 1199054 1199055 and 119905
6
Mean density of tidal current energy (100wm2)1199054
1199055
1199056
Spring tide 39 25 35Neap tide 26 12 17
Benelghali et al compared Doubly-Fed Induction Generator(DFIG) and Permanent Magnet Synchronous Generator(PMSG) for marine current turbine applications and theyfound that DFIG is with a lower limit of 13ms [11] In thisstudy the velocity of 13ms is taken as the lower limit of tidalcurrent turbine Due to the existence of the lower limit tidalcurrent turbine is with discontinuous operating in practicalapplication Total operating time dispersion of operatingtime and mean operating time consequently become threenew important parameters in assessment of tidal currentenergy and evaluation of operating efficiency of tidal currentturbine
Total operating time is defined as the sum of operatingtimes over a given period indicating the duration of effectiveoperation of tidal current turbine
Total Operating Time = int119879
0
119875 (V119905) 119889119905
119875 (V119905) =
0 V lt 13ms1 V ge 13ms
(4)
where V119905is current velocity and 119879 is a given period
According to the low limit of 13ms of tidal currentturbine all the durations with a tidal current speed over13ms are accumulated and their sum is considered as totaloperating time As listed in Table 3 during 72-hour springtide and neap tide total operating time at locations 119905
4and 1199056
is longer than that at location 1199055 For example total operation
time at location 1199054is 318 hours and 183 hours for spring
tide and neap tide respectively indicating that tidal current
Table 3 Total operating time during spring tide and neap tide at 1199054
1199055 and 119905
6
Total operating time (h) and proportion of 72 hours1199054
1199055
1199056
Spring tide 318 44 265 37 315 44Neap tide 183 25 6 8 133 18
Table 4 Dispersion of operating time and mean operating timeduring spring tide and neap tide at 119905
4 1199055 and 119905
6
Spring tide Neap tide1199054
1199055
1199056
1199054
1199055
1199056
Dispersion of operatingtime (no unit) 12 11 12 7 3 6
Mean operating time (h) 265 241 263 261 200 222
turbine works in 44 of time in spring tide and 25 of timein neap tide
Dispersion of operating time is defined as interruptionnumber of turbine performance during a given period whichis calculated by counting the status shift from power-off (witha current velocity below 13ms) to power-on (with a currentvelocity over 13ms) of tidal current turbine
Dispersion of Operating Time = sum119876(V119905 119905) (0 le 119905 le 119879)
119876 (V 119905) = 1 lim120575rarr0
119875 (V119905minus120575) lt lim120575rarr0
119875 (V119905+120575)
0 others(5)
Values of dispersion of operating time during spring tideand neap tide at 119905
4 1199055 and 119905
6are given inTable 4 showing that
interruption number of turbine performance is the largest Itis reasonable to have a larger interruption number when totaloperating time of tidal current turbine is longer It is necessaryto point out that in these two indicators total operating timeof tidal current turbine is the main indicator for assessmentof tidal current energy In the case of similar amount of totaloperating time a smaller value of dispersion of operatingtime is preferred
It is also useful to define mean operation time of tidalcurrent turbine as the ratio of total operating time to dis-persion of operation time
Mean Operating Time =Total Operating Time
Dispersion of Operating Time
(6)
As listed in Table 4 mean operating time at stations 1199054
and 1199055is obviously larger than that at 119905
6 It can be seen that
a higher efficiency of turbine operation can be achieved at 1199054
and 1199055(due to a higher value of total operating time) although
interruption number of turbine operation is largerThereforestations 119905
4(Xiyang) and 119905
5(Lanshayang) are more suitable
sites for deployment of tidal current turbines among thesethree locations However the final decision on site selectionfor tidal current farm is also dependent on the large-scaleocean space-use plan along Jiangsu Coast
Advances in Mechanical Engineering 9
5 Conclusion
A two-dimensional hydrodynamic model was developedwith Mike 21 FM package to assess tidal current energy andseek for suitable sites for deployment of tidal current turbineFor model validation calculated water elevation and currentvelocity are compared with field measurement indicatinga generally reasonable agreement Then simulation resultswere used to evaluate tidal current energy resources inJiangsu Coast In addition to traditional method calculatingmean density of tidal current energy a new concept in termsof total operating time dispersion of operating time andmean operating time of tidal current turbine was proposedfor assessmentThese three indicatorswerewell defined in thestudy and they were found to be very useful in determiningsuitable sites for deployment of tidal current turbine It isnoted that total operating time of tidal current turbine isthe most important indicator for assessment of tidal currentenergy in this new concept In the case of similar amount oftotal operating time a smaller value of dispersion of operatingtime or a larger value of mean operating time is preferredBased on this new concept Xiyang and Lanshayang are themore suitable sites for deployment of tidal current turbine inJiangsuCoast However the final decision on site selection fortidal current farm is also dependent on the large-scale oceanspace-use plan along Jiangsu Coast
Conflict of Interests
The authors declare that there is no conflict of interestsregarding the publication of this paper
Acknowledgments
This work was financially supported by the National NaturalScience Foundation of China (51137002) Natural ScienceFoundation Project of Jiangsu Province (BK2011026) and the111 project (B12032)
References
[1] K Toshiaki ldquoDream of marine-topia new technologies to uti-lize effectivelyrenewable energies at offshorerdquo Current AppliedPhysics vol 10 supplement 2 pp S4ndashS8 2010
[2] C W Finkl and R Charlier ldquoElectrical power generation fromocean currents in the Straits of Florida some environmentalconsiderationsrdquoRenewable and Sustainable Energy Reviews vol13 no 9 pp 2597ndash2604 2009
[3] W B Chen W C Liu and M H Hsu ldquoModeling evaluationof tidal stream energy and the impacts ofenergy extraction onhydrodynamics in the Taiwan Straitrdquo Energies vol 6 no 4 pp2191ndash2203 2013
[4] F L Ponta and P M Jacovkis ldquoMarine-current power genera-tion by diffuser-augmented floating hydro-turbinesrdquoRenewableEnergy vol 33 no 4 pp 665ndash673 2008
[5] C K Wang and W Y Shi ldquoThe ocean resources and reservesevaluation in Chinardquo in Proceedings of the 1st National Sympo-sium on Ocean Energy in Hangzhou pp 169ndash179 2008
[6] W B Chen W C Liu and M H Hsu ldquoModeling assessmentof tidal current energy at Kinmen Island Taiwanrdquo RenewableEnergy vol 50 pp 1073ndash1082 2013
[7] D Li S Wang and P Yuan ldquoAn overview of development oftidal current in China energy resource conversion technologyand opportunitiesrdquo Renewable and Sustainable Energy Reviewsvol 14 no 9 pp 2896ndash2905 2010
[8] H W Liu S Ma W Li H G Gu Y Lin and X Sun ldquoAreview on the development of tidal current energy in ChinardquoRenewable and Sustainable Energy Reviews vol 15 no 2 pp1141ndash1146 2011
[9] P Michel L Veronique and L Denis Marine RenewableEnergies Prospective Foresight Study for 2030 QUAE editionParis France 2007
[10] A N Gorbanrsquo A M Gorlov and V M Silantyev ldquoLimits of theturbine efficiency for free fluid flowrdquo Journal of Energy ResourcesTechnology vol 123 no 2ndash4 pp 311ndash317 2001
[11] S Benelghali M E H Benbouzid and J F CharpentierldquoComparison of PMSG and DFIG for marine current turbineapplicationsrdquo in Proceedings of the 19th International Conferenceon Electrical Machines (ICEM rsquo10) Roma Italy September 2010
Submit your manuscripts athttpwwwhindawicom
VLSI Design
Hindawi Publishing Corporationhttpwwwhindawicom Volume 2014
International Journal of
RotatingMachinery
Hindawi Publishing Corporationhttpwwwhindawicom Volume 2014
Hindawi Publishing Corporation httpwwwhindawicom
Journal ofEngineeringVolume 2014
Hindawi Publishing Corporationhttpwwwhindawicom Volume 2014
Shock and Vibration
Hindawi Publishing Corporationhttpwwwhindawicom Volume 2014
Mechanical Engineering
Advances in
Hindawi Publishing Corporationhttpwwwhindawicom Volume 2014
Civil EngineeringAdvances in
Acoustics and VibrationAdvances in
Hindawi Publishing Corporationhttpwwwhindawicom Volume 2014
Hindawi Publishing Corporationhttpwwwhindawicom Volume 2014
Electrical and Computer Engineering
Journal of
Hindawi Publishing Corporationhttpwwwhindawicom Volume 2014
Distributed Sensor Networks
International Journal of
The Scientific World JournalHindawi Publishing Corporation httpwwwhindawicom Volume 2014
SensorsJournal of
Hindawi Publishing Corporationhttpwwwhindawicom Volume 2014
Modelling amp Simulation in EngineeringHindawi Publishing Corporation httpwwwhindawicom Volume 2014
Hindawi Publishing Corporationhttpwwwhindawicom Volume 2014
Active and Passive Electronic Components
Hindawi Publishing Corporationhttpwwwhindawicom Volume 2014
Chemical EngineeringInternational Journal of
Control Scienceand Engineering
Journal of
Hindawi Publishing Corporationhttpwwwhindawicom Volume 2014
Antennas andPropagation
International Journal of
Hindawi Publishing Corporationhttpwwwhindawicom Volume 2014
Hindawi Publishing Corporationhttpwwwhindawicom Volume 2014
Navigation and Observation
International Journal of
Advances inOptoElectronics
Hindawi Publishing Corporation httpwwwhindawicom
Volume 2014
RoboticsJournal of
Hindawi Publishing Corporationhttpwwwhindawicom Volume 2014
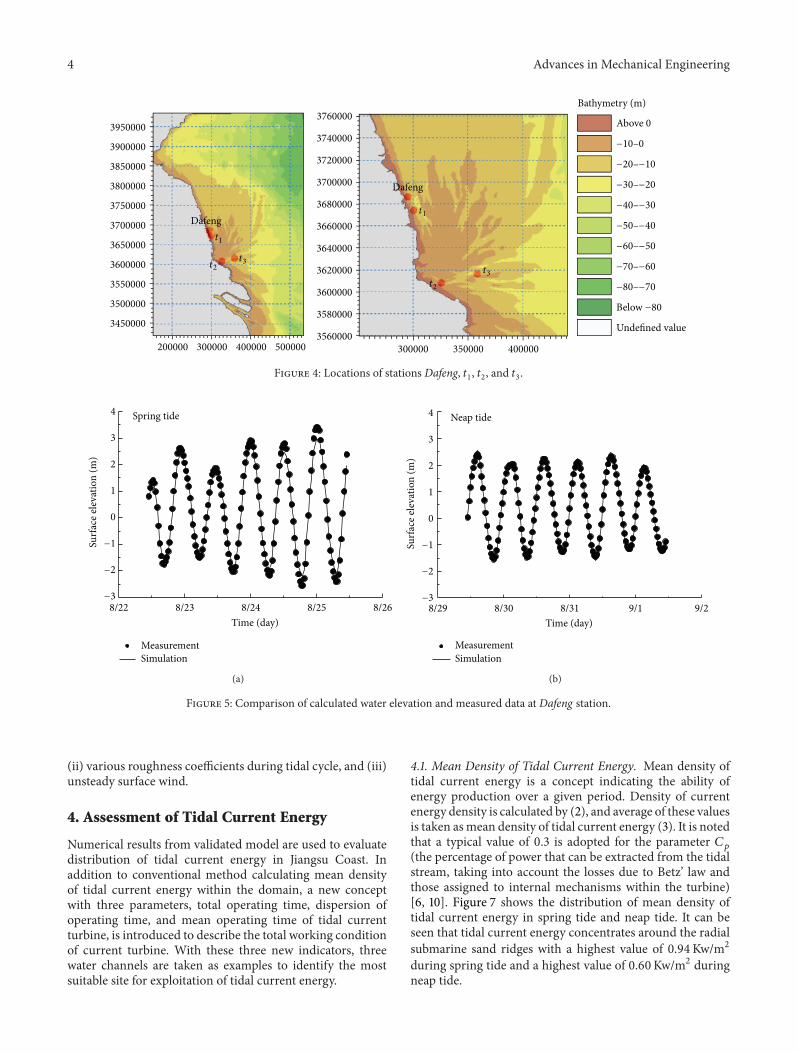
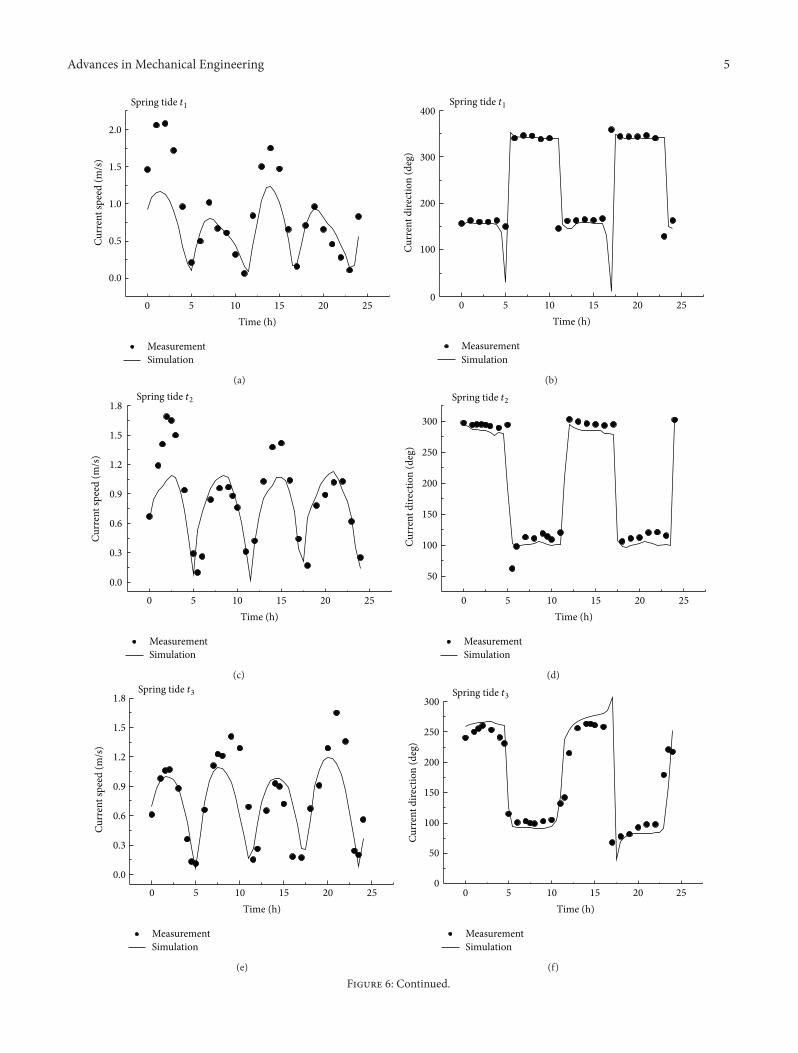
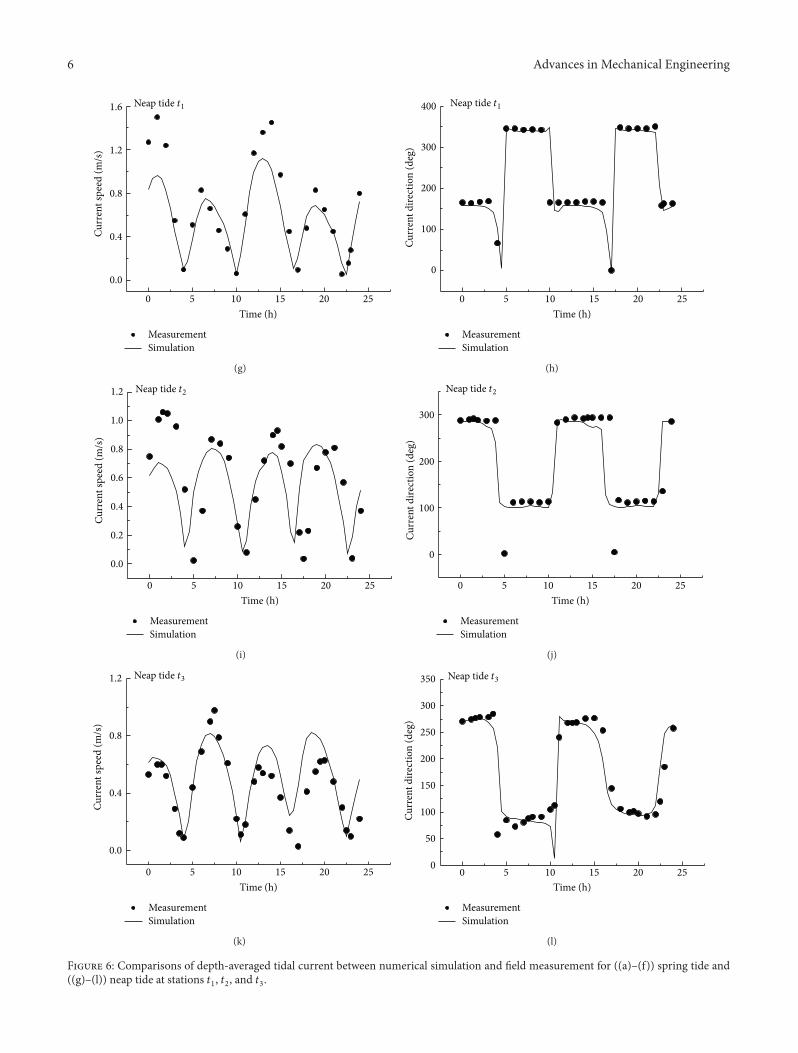
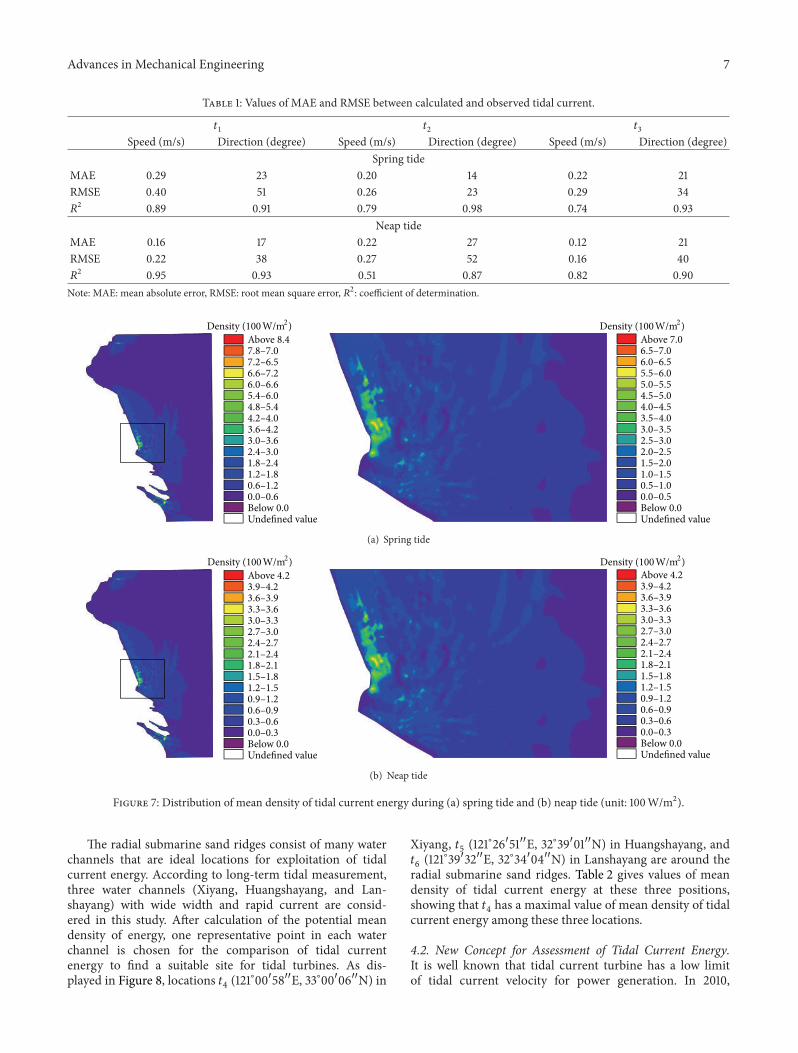
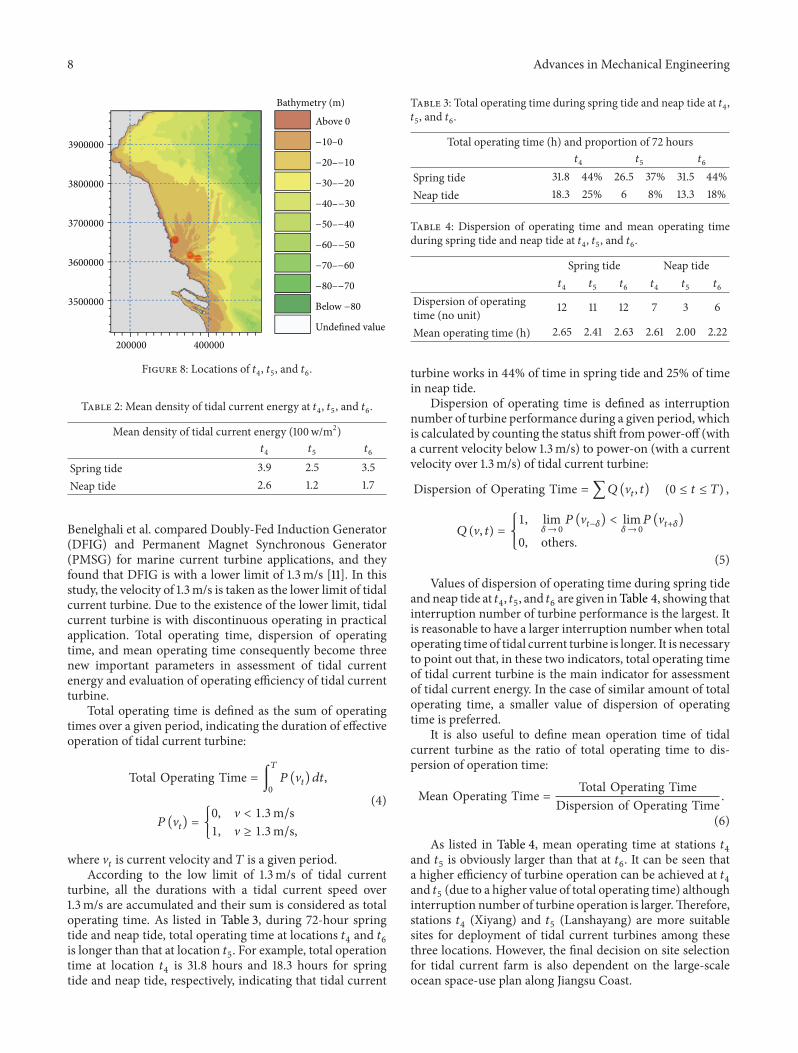