Neuropsychological Functioning in Bipolar Disorder and Schizophrenia
8
Neuropsychological Functioning in Bipolar Disorder and Schizophrenia David J. Schretlen, Nicola G. Cascella, Stephen M. Meyer, Lisle R. Kingery, S. Marc Testa, Cynthia A. Munro, Ann E. Pulver, Paul Rivkin, Vani A. Rao, Catherine M. Diaz-Asper, Faith B. Dickerson, Robert H. Yolken, and Godfrey D. Pearlson Background: Some patients with bipolar disorder (BD) demonstrate neuropsychological deficits even when stable. However, it remains unclear whether these differ qualitatively from those seen in schizophrenia (SZ). Methods: We compared the nature and severity of cognitive deficits shown by 106 patients with SZ and 66 patients with BD to 316 healthy adults (NC). All participants completed a cognitive battery with 19 individual measures. After adjusting their test performance for age, sex, race, education, and estimated premorbid IQ, we derived regression-based T-scores for each measure and the six cognitive domains. Results: Both patient groups performed significantly worse than NCs on most (BD) or all (SZ) cognitive tests and domains. The resulting effect sizes ranged from .37 to 1.32 (mean .97) across tests for SZ patients and from .23 to .87 (mean .59) for BD patients. The Pearson correlation of these effect sizes was .71 (p .001). Conclusions: Patients with bipolar disorder suffer from cognitive deficits that are milder but qualitatively similar to those of patients with schizophrenia. These findings support the notion that schizophrenia and bipolar disorder show greater phenotypic similarity in terms of the nature than severity of their neuropsychological deficits. Key Words: Biomarker, bipolar disorder, cognitive testing, neu- ropsychology, schizophrenia D espite the historical and current nosological distinction between bipolar disorder (BD) and schizophrenia (SZ), there is emerging evidence that these conditions might share some genetic susceptibility (Craddock et al. 2006; Potash 2006). Not only do BD and SZ share certain phenomenological characteristics, they also have similar ages of onset, sex distribu- tions, and prevalence (Bramon and Sham 2001). Family studies suggest partial disease overlap, possibly related to the presence of psychosis, brain imaging studies reveal similarities (Pearlson et al. 1989, 1997), and molecular studies have identified genomic regions that might represent shared genetic susceptibility (Ber- rettini 2004). Indeed, Crow (1997) argued that SZ does not reflect a natural category, and that we ought to conceptualize psychoses on a continuum. Conversely, Goldberg (1999) pointed out some obvious distinctions between SZ and BD, including differences in their clinical course, associated levels of functional impairment, and response to medications (Goldberg et al. 1993; Gourovitch et al. 1999). One obstacle to elucidating susceptibility genes in BD and SZ is the difficulty defining heritable phenotypes (Leboyer et al. 1998), as phenotypic misclassification reduces the power of linkage studies. Consequently, determining whether SZ and BD are characterized by similar or different neuropsychological profiles could be useful, especially if they are distinct enough to serve as illness markers (Glahn et al. 2003, 2006). Previous research has shown that individuals with SZ dem- onstrate impaired performance across a broad range of neuro- psychological tests. Although no cognitive profile is recognized as a “signature” of SZ, patients typically demonstrate especially severe impairments of complex attention, psychomotor speed, new learning/memory, and abstraction or executive functioning (Bilder et al. 2000; Bowie and Harvey 2005; Censits et al. 1997; Flashman and Green 2004; Heinrichs 2005; Hill et al. 2002). Milder impairments of these abilities have been found in SZ patients who appear cognitively normal (Kremen et al. 2000). Yet while their presence and persistence are well-documented, the specificity of these cognitive deficits remains unclear. Some patients with acute BD have cognitive deficits that can be as severe as those seen in SZ (Albus et al. 1996; McGrath et al. 1997; Verdoux and Liraud 2000). Even when stable, BD patients have been shown to demonstrate mild, selective impairments of verbal learning and memory and sustained attention (Dickerson et al. 2001; Gourovitch et al. 1999; Martinez-Aran et al. 2004; Rubinsztein et al. 2000; Seidman et al. 2002; van Gorp et al. 1999; Zubieta et al. 2001). In a few studies, stable BD patients have shown impairments of psychomotor speed, card sorting, verbal fluency, and visual memory (Quraishi and Frangou 2002), but they rarely show impaired general intelligence, motor function, praxis, selective attention, or language. Comparisons of cognitive functioning in SZ and BD have been reported (Daban et al. 2006). Seidman et al. (2002) compared 15 patients with BD, 87 with SZ, and 94 healthy controls (NC) using cognitive tests assigned to eight domains. The SZ patients performed significantly worse than NCs in all but one domain, with effect sizes (Cohen’s d) ranging from .26 to 1.68 (mean d 1.09) across domains. The BD patients scored significantly lower than NCs in four domains, with effect sizes of .04 to .96 (mean d .56). Dickerson et al. (2004) compared 229 patients with SZ, 117 with BD, and 100 NCs using the From the Department of Psychiatry and Behavioral Sciences (DJS, NGC, SMM, LRK, SMT, CAM, AEP, PR, VAR, CMD-A, FBD, GDP), Department of Radiology and Radiological Science (DJS), Department of Epidemiology Genetics (AEP), Department of Pediatrics (RHY), Johns Hopkins Univer- sity School of Medicine; and the Department of Psychiatry (FBD), Shep- pard Enoch Pratt Hospital, Baltimore, Maryland; Olin Neuropsychiatric Research Center (GDP), Hartford Hospital Institute of Living, Hartford; and the Department of Psychiatry (GDP), Yale University, New Haven, Connecticut. Address reprint requests to David J. Schretlen, Ph.D., Johns Hopkins Hospi- tal, 600 N. Wolfe Street, Meyer 218, Baltimore, MD 21287-7218; E-mail: [email protected]. Received July 22, 2006; revised September 20, 2006; accepted September 21, 2006. BIOL PSYCHIATRY 2007;62:179 –186 0006-3223/07/$32.00 doi:10.1016/j.biopsych.2006.09.025 © 2007 Society of Biological Psychiatry
-
Upload
independent -
Category
Documents
-
view
1 -
download
0
Transcript of Neuropsychological Functioning in Bipolar Disorder and Schizophrenia
NaDCR
Bu
Mar
Rec
Csn
Kr
Ds2ctsoerraootaa
i1
F
A
R
0d
europsychological Functioning in Bipolar Disordernd Schizophrenia
avid J. Schretlen, Nicola G. Cascella, Stephen M. Meyer, Lisle R. Kingery, S. Marc Testa,ynthia A. Munro, Ann E. Pulver, Paul Rivkin, Vani A. Rao, Catherine M. Diaz-Asper, Faith B. Dickerson,obert H. Yolken, and Godfrey D. Pearlson
ackground: Some patients with bipolar disorder (BD) demonstrate neuropsychological deficits even when stable. However, it remainsnclear whether these differ qualitatively from those seen in schizophrenia (SZ).
ethods: We compared the nature and severity of cognitive deficits shown by 106 patients with SZ and 66 patients with BD to 316 healthydults (NC). All participants completed a cognitive battery with 19 individual measures. After adjusting their test performance for age, sex,ace, education, and estimated premorbid IQ, we derived regression-based T-scores for each measure and the six cognitive domains.
esults: Both patient groups performed significantly worse than NCs on most (BD) or all (SZ) cognitive tests and domains. The resultingffect sizes ranged from .37 to 1.32 (mean � .97) across tests for SZ patients and from .23 to .87 (mean � .59) for BD patients. The Pearsonorrelation of these effect sizes was .71 (p � .001).
onclusions: Patients with bipolar disorder suffer from cognitive deficits that are milder but qualitatively similar to those of patients withchizophrenia. These findings support the notion that schizophrenia and bipolar disorder show greater phenotypic similarity in terms of the
ature than severity of their neuropsychological deficits.ey Words: Biomarker, bipolar disorder, cognitive testing, neu-opsychology, schizophrenia
espite the historical and current nosological distinctionbetween bipolar disorder (BD) and schizophrenia (SZ),there is emerging evidence that these conditions might
hare some genetic susceptibility (Craddock et al. 2006; Potash006). Not only do BD and SZ share certain phenomenologicalharacteristics, they also have similar ages of onset, sex distribu-ions, and prevalence (Bramon and Sham 2001). Family studiesuggest partial disease overlap, possibly related to the presencef psychosis, brain imaging studies reveal similarities (Pearlsont al. 1989, 1997), and molecular studies have identified genomicegions that might represent shared genetic susceptibility (Ber-ettini 2004). Indeed, Crow (1997) argued that SZ does not reflectnatural category, and that we ought to conceptualize psychosesn a continuum. Conversely, Goldberg (1999) pointed out somebvious distinctions between SZ and BD, including differences inheir clinical course, associated levels of functional impairment,nd response to medications (Goldberg et al. 1993; Gourovitch etl. 1999).
One obstacle to elucidating susceptibility genes in BD and SZs the difficulty defining heritable phenotypes (Leboyer et al.998), as phenotypic misclassification reduces the power of
rom the Department of Psychiatry and Behavioral Sciences (DJS, NGC,SMM, LRK, SMT, CAM, AEP, PR, VAR, CMD-A, FBD, GDP), Department ofRadiology and Radiological Science (DJS), Department of EpidemiologyGenetics (AEP), Department of Pediatrics (RHY), Johns Hopkins Univer-sity School of Medicine; and the Department of Psychiatry (FBD), Shep-pard Enoch Pratt Hospital, Baltimore, Maryland; Olin NeuropsychiatricResearch Center (GDP), Hartford Hospital Institute of Living, Hartford;and the Department of Psychiatry (GDP), Yale University, New Haven,Connecticut.
ddress reprint requests to David J. Schretlen, Ph.D., Johns Hopkins Hospi-tal, 600 N. Wolfe Street, Meyer 218, Baltimore, MD 21287-7218; E-mail:[email protected].
eceived July 22, 2006; revised September 20, 2006; accepted September
21, 2006.006-3223/07/$32.00oi:10.1016/j.biopsych.2006.09.025
linkage studies. Consequently, determining whether SZ and BDare characterized by similar or different neuropsychologicalprofiles could be useful, especially if they are distinct enough toserve as illness markers (Glahn et al. 2003, 2006).
Previous research has shown that individuals with SZ dem-onstrate impaired performance across a broad range of neuro-psychological tests. Although no cognitive profile is recognizedas a “signature” of SZ, patients typically demonstrate especiallysevere impairments of complex attention, psychomotor speed,new learning/memory, and abstraction or executive functioning(Bilder et al. 2000; Bowie and Harvey 2005; Censits et al. 1997;Flashman and Green 2004; Heinrichs 2005; Hill et al. 2002).Milder impairments of these abilities have been found in SZpatients who appear cognitively normal (Kremen et al. 2000). Yetwhile their presence and persistence are well-documented, thespecificity of these cognitive deficits remains unclear.
Some patients with acute BD have cognitive deficits that canbe as severe as those seen in SZ (Albus et al. 1996; McGrath et al.1997; Verdoux and Liraud 2000). Even when stable, BD patientshave been shown to demonstrate mild, selective impairments ofverbal learning and memory and sustained attention (Dickersonet al. 2001; Gourovitch et al. 1999; Martinez-Aran et al. 2004;Rubinsztein et al. 2000; Seidman et al. 2002; van Gorp et al. 1999;Zubieta et al. 2001). In a few studies, stable BD patients haveshown impairments of psychomotor speed, card sorting, verbalfluency, and visual memory (Quraishi and Frangou 2002), butthey rarely show impaired general intelligence, motor function,praxis, selective attention, or language.
Comparisons of cognitive functioning in SZ and BD havebeen reported (Daban et al. 2006). Seidman et al. (2002)compared 15 patients with BD, 87 with SZ, and 94 healthycontrols (NC) using cognitive tests assigned to eight domains.The SZ patients performed significantly worse than NCs in all butone domain, with effect sizes (Cohen’s d) ranging from .26 to1.68 (mean d � 1.09) across domains. The BD patients scoredsignificantly lower than NCs in four domains, with effect sizes of�.04 to .96 (mean d � .56). Dickerson et al. (2004) compared
229 patients with SZ, 117 with BD, and 100 NCs using theBIOL PSYCHIATRY 2007;62:179–186© 2007 Society of Biological Psychiatry

RSsesf(
ogdstsesbidt
obddldapddtSqseioe
M
P
ooattsbhwacbppddph
180 BIOL PSYCHIATRY 2007;62:179–186 D.J. Schretlen et al.
w
epeatable Battery for the Assessment of Neuropsychologicaltatus (RBANS; Randolph 1998). Patients with SZ performedignificantly worse than NCs on every RBANS subscale, withffect sizes of .61 to 1.27 (mean d � 1.09). Patients with BDcored significantly lower than NCs on the RBANS total score andour of five subscales, with effect sizes ranging from .12 to .79mean d � .52).
Both Seidman et al. (2002) and Dickerson et al. (2004)bserved that the cognitive profiles produced by their SZ and BDroups were qualitatively similar, but neither measured theegree of similarity. When we correlated cognitive domain effectizes shown by patients with SZ and BD in Seidman et al’s study,he Pearson r was .81 (p � .015). When we correlated the effectizes shown by SZ and BD patients on the RBANS in Dickersont al. (2004), the Pearson r was .93 (p � .007). These findingsuggest that the cognitive deficits in SZ and BD differ in severityut are qualitatively similar. However, because neither group ofnvestigators adjusted their effect size estimates for demographicifferences between patient and control groups, estimates ofheir correlation could be grossly inaccurate.
The present study aimed to compare the nature and severityf cognitive deficits shown by adults with schizophrenia oripolar I disorder relative to healthy adults. Because our groupsiffered demographically, we used multiple regression to deriveemographically-adjusted T-scores for all 19 test variables. Theatter were then assigned to one of six cognitive domains. Theseemographically-adjusted test and domain scores were used tossess the similarity of neuropsychological profiles produced byatients with SZ or BD. We reasoned that if their cognitiveeficits differ in both nature and severity, then their cognitiveeficit effect sizes should be uncorrelated. This would supporthe goal of elucidating cognitive illness markers that distinguishZ from BD. If their cognitive profiles differ in severity but areualitatively similar, then the correlation of their effect sizeshould correlate highly. This would decrease the likelihood oflucidating distinct cognitive illness markers. A correlation ofntermediate magnitude would suggest that the cognitive profilesf patients with SZ and BD differ substantially but perhaps notnough to serve as useful illness markers.
ethods and Materials
articipantsAltogether, 172 patients were recruited for one of four studies
f cognitive functioning in BD or SZ. Most were recruited fromutpatient clinics, inpatient services, or a psychiatric day hospitalffiliated with the Johns Hopkins University and Hospital, al-hough 49 were recruited via flyers or newspaper/radio adver-ising. The patient samples included 106 adults with SZ (notchizoaffective or schizophreniform disorder) and 66 adults withipolar I disorder. Most (75%) of the BD patients reported aistory of psychotic symptoms (i.e., hallucinations or delusions)hen acutely manic or depressed. Patients were diagnosedccording to criteria of the DSM-IV (American Psychiatric Asso-iation 1994). In order to minimize the effects of illness acuity onoth clinician ratings and cognitive test performance, mostatients were recruited and tested as outpatients. However, 3atients with BD and 11 with SZ were tested immediately prior toischarge from the hospital, when their attending physiciansetermined that they were stable. Potential BD and SZ studyarticipants were excluded from the analysis if they had any
istory of mental retardation, dementia, stroke, traumatic brainww.sobp.org/journal
injury with more than 1 hour loss of consciousness, or any typeof substance dependence within the preceding 12 months.
In addition, 394 adults (NC) were recruited from the Balti-more, Maryland and Hartford, Connecticut metropolitan areas viarandom digit dialing or calling randomly selected listings fromresidential telephone directories for participation in the Aging,Brain Imaging, and Cognition (ABC) study. Excluded from theABC sample were 78 participants who had a history of substancedependence within the preceding 12 months or any history ofdementia, stroke, mental retardation, traumatic brain injury withgreater than 1 hour loss of consciousness, other medical orneurological conditions commonly associated with cognitiveimpairment (e.g., multiple sclerosis, Parkinson’s disease), SZ,BD, or current major depression, or who scored below 24/30 onthe Mini-Mental State Exam (MMSE; Folstein et al. 1975). This lefta final sample of 316 healthy participants. The Johns HopkinsMedicine Institutional Review Board approved all the studiesfrom which subjects were drawn, and each person gave writteninformed consent to participate.
ProceduresClinical diagnoses of patients were based on the Diagnostic
Interview for Genetic Studies (DIGS; Nurnberger et al. 1994),Structured Clinical Interview for DSM-IV Axis I Disorders-Clini-cian Version (SCID-CV; First et al. 1997), or Mini InternationalNeuropsychiatric Interview (MINI; Sheehan et al. 1998), whichwere administered by a board-certified psychiatrist or licensedclinical psychologist. Current symptom severity also was rated bythe clinician based on the Scales for the Assessment of Positive andNegative Symptoms (SAPS and SANS, respectively) (Andreasen andOlsen 1982) for most patients. Prior to making a diagnosis, the studyclinician reviewed all available psychiatric records. Healthy controlsalso underwent a diagnostic and clinical assessment by a studypsychiatrist or psychologist. This included a structured psychiatricinterview, the Schedule for Clinical Assessment in Neuropsychiatry(SCAN; Wing 1996), review of medical history, and physical andneurological examinations.
The neuropsychological assessment of all participants con-sisted of nine tests that assessed a broad spectrum of cognitiveabilities and required about two hours to administer. The testsyielded 19 measures. Each measure was assigned to one of sixcognitive domains following Heinrichs & Zakzanis (1998) andothers (Seidman et al. 2002; Zubieta et al. 2001). Four of ourindividual tests also are included in the Measurement andTreatment Research to Improve Cognition in Schizophrenia(MATRICS) cognitive test battery (Nuechterlein and Green 2006).The individual tests, specific variables drawn from each, andinternal consistency (coefficients alpha) for the cognitive do-mains to which variables were assigned are shown in Table 1.
Data analysis began with the derivation of demographically-adjusted T-scores for all study participants. The general proce-dure for these adjustments has been described elsewhere(Heaton et al. 2004; Ivnik et al. 1992). Briefly, we first convertedthe NC group’s raw scores on all 19 cognitive measures to scaledscores (M � 10; SD � 3) using the cumulative frequencydistribution of each measure. We then regressed these scaledscores on age, age-squared, sex, race (white vs. black), years ofeducation, and estimated premorbid IQ based on the revisedNational Adult Reading Test (NART-R; Blair and Spreen 1989).For these analyses we entered the predictor variables en bloc,saved the standardized residuals, and converted the latter toT-scores (M � 50; SD � 10). We next converted the BD and SZ
patients’ raw test scores to scaled scores based on the NC
ddsfdeTctbhiics
1
T
C
ASREEAI#SSTAALA
SR
T
CD
P
A
EF
V
V
D.J. Schretlen et al. BIOL PSYCHIATRY 2007;62:179–186 181
istributions, and applied the multiple regression equationserived from the NC data to compute demographically-predictedcores for the patients. These predicted scores were subtractedrom each patient’s actual scaled scores, and the differences wereivided by the standard deviation of the NC group’s residuals forach measure. Finally, the resulting values were converted to-scores for direct comparison with those produced by healthyontrols. An advantage of these procedures is that they allow forhe direct comparison of cognitive test performances producedy patient groups that differ from each other and from theealthy controls on any demographic characteristic. The reasons that the demographically-adjusted T-score distribution approx-mates a mean of 50 and standard deviation of 10 for everyognitive test in any NC subgroup selected on the basis of age,ex, race, years of education, or estimated premorbid IQ1.
To verify this, we divided the NC sample into five pairs of subgroupsbased on median splits for age, education, and estimated premorbidIQ, and by sex (male vs. female), and race (white vs. black). We thencompared the demographically-adjusted T-scores produced by eachsubgroup. All 190 means (19 tests X 5 demographic characteristics X2 subgroups for each characteristic) ranged from 48.0 to 50.7, andnone of the 95 Student t-tests reached statistical significance (p � .05).Indeed, all but one of the obtained p values exceeded .12.
able 2. Demographic Characteristicsa of the Patient and Healthy Control
haracteristic NC (n � 316) SZ (n �
ge (years) 54.5 � 18.6a 40.0 �ex (male:female %) 44:56a 69:3ace (w:b:o %)b 81:17:2a 40:5ducation (years) 14.3 � 3.0a 12.0 �st. premorbid IQ 105.2 � 10.1a 96.5 �ge at onset (years) — 22.9 �
llness duration (years) — 17.1 �Hospitalizations — 5.4 �
ANS (sum) — 10.0 �APS (sum) — 5.1 �ypical Antipsychotic (%) — 3typical Antipsychotic (%) — 7ny Antidepressant (%) — 2ithium (%) —ny Anticonvulsant (%) — 1
For three-group analyses, different subscripts denote significant (p � .0cale for the Assessment of Negative Symptoms; SAPS, Scale for the Assessmeading Test Revised (NART-R) (Blair and Spreen 1989).
aShown as mean � standard deviation unless otherwise indicated.
able 1. Neuropsychological Test Variables Together with the Cognitive D
ognitiveomain Neuropsychological T
sychomotorSpeed
Grooved Pegboard (GPT); times for each hand (Klove 19Trail Making (TMT); times for parts A and B (Reitan 1958
ttention Brief Test of Attention (BTA); total correct (Schretlen 199Conners’ Continuous Performance Test (CPT); hit RT, hit
xecutive Nelson modified Wisconsin Card Sorting Test (mWCST; luency Letter Word Fluency (letters S and P); Category Word Flu
(novel drawings) (Kingery et al. 2006)erbal Memory Hopkins Verbal Learning Test-Revised (HVLT-R); words r
discrimination (Brandt and Benedict 2001)isual Memory Brief Visuospatial Memory Test-Revised (BVMT-R); desig
recognition discrimination) (Benedict 1997)
bFor race, w � white, b � black, o � “other.”
Hypothesized differences between patients and healthy con-trols were tested using two multivariate analyses of variance(MANOVAs) in which diagnostic group (NC vs. SZ vs. BD) servedas the between-groups factor. In one MANOVA, demographically-adjusted T-scores for all 19 cognitive measures served as thedependent variables. In the other, the six cognitive domainscores, defined by the mean of the demographically-adjustedT-scores that comprised each, served as the dependent variables.Planned contrasts compared each patient group to the healthycontrols, and post hoc comparisons with Bonferroni correctionswere used to compare differences between the two patientgroups on the individual tests and six cognitive domains. Finally,we computed Cohen’s d effect sizes (Cohen 1988) of thedifferences between each patient group’s mean scores (acrosscognitive domains and individual tests) compared to healthycontrols, and correlated these in order to assess the similarity oftheir cognitive profiles. If SZ and BD are characterized byqualitatively distinct cognitive deficits, we reasoned that theireffect sizes would be uncorrelated, as shown by small Pearsonrs. Conversely, if SZ and BD involve cognitive deficits that differin severity but are qualitatively similar, then correlation of theireffect sizes should yield large rs. Finally, if SZ and BD patientssuffer from both common and distinct cognitive deficits, then
s
) BD (n � 66) Statistic p �
41.5 � 11.5b F(2,483) � 39.6 .00138:62a �2
(2) � 23.2 .00167:29:5c �2
(4) � 64.4 .00114.8 � 3.0a F(2,483) � 27.6 .001
103.7 � 10.9a F(2,483) � 28.3 .00124.9 � 9.0 t(98.5) � �1.5 .16316.3 � 11.1 t(143) � .5 .647
4.2 � 4.4 t(143) � 1.2 .2442.5 � 2.9 t(83.6) � 7.8 .0011.8 � 2.6 t(90.6) � 4.3 .001
4 �2(1) � 15.0 .001
47 �2(1) � 13.1 .001
48 �2(1) � 11.3 .001
50 �2(1) � 42.3 .001
42 �2(1) � 18.4 .001
erences. SZ, schizophrenia; BD, bipolar disorder; NC, normal control; SANS,f Positive Symptoms. Estimated premorbid IQ based on the National Adult
s they Comprise and Cronbach’s Alpha for Each Domain
nd Measures Used Cronbach’s Alpha
.833
andard error, and d= (Conners 1995).703
ories completed, perseverative errors) (Nelson 1976) .829(animals, supermarket items); Design Fluency .693
d on trials 1–3, delayed recall, delayed recognition .824
alled on trials 1–3, delayed recall, delayed .817
Group
106
11.1b
1b
5:6b
2.4b
10.5b
7.510.56.56.44.1
45343
5) diffent o
omain
ests a
63))7)
RT stcateg
ency
ecalle
ns rec
www.sobp.org/journal

ti
R
ropycmjppgssn
cdpp(spiSv
TD
D
P
A
E
F
V
V
bTc
182 BIOL PSYCHIATRY 2007;62:179–186 D.J. Schretlen et al.
w
heir effect sizes should be characterized by correlations ofntermediate magnitude.
esults
As shown in Table 2, MANOVA and chi-square analysesevealed that the three groups differed significantly in age, yearsf education, and NART-R estimated premorbid IQ. Based onlanned comparisons, both patient groups were significantlyounger than healthy controls. The SZ, but not BD, patients alsoompleted fewer years of schooling and produced lower esti-ates of premorbid IQ than healthy controls. Bonferroni-ad-
usted post hoc comparisons revealed that BD patients com-leted significantly more years of schooling and produced higherremorbid IQ estimates than SZ patients, but that the tworoups did not differ in age. Chi-square analyses revealedignificant associations between diagnostic group and bothex and race, with one exception: the BD and NC groups didot differ in sex.
As also shown in Table 2, independent sample t-tests andhi-square analyses revealed that the SZ and BD patients did notiffer significantly in age at illness onset, number of priorsychiatric hospital admissions, or illness duration. The SZatients manifested more severe negative (SANS) and positiveSAPS) symptoms than BD patients, and the groups differedignificantly in the proportions being treated with five classes ofsychotropic medication. More SZ than BD patients were receiv-
ng typical and atypical antipsychotic medications. More BD thanZ patients were receiving lithium, antidepressants, and anticon-ulsants.
able 3. Means (� Standard Deviation) of Raw Neuropsychological Test Scomains by Group, with Univariate F Statisticsa
omain/Variable NC SZ
sychomotor Speed 50.0 � 7.5a 36.5 � 8GPT dominant hand 80.4 � 27.6a 89.9 � 2GPT non-dom. hand 90.0 � 32.6a 102.1 � 2Trail Making, Part A 34.2 � 16.2a 47.0 � 2Trail Making, Part B 89.6 � 56.9a 146.1 � 9
ttention 50.4 � 7.4a 40.6 � 9BTA total 15.5 � 3.7a 11.9 � 4CPT hit RT 428.8 � 68.0a 439.6 � 8CPT hit RTSE 6.6 � 2.8a 9.3 � 4CPT d= 3.2 � 1.1a 2.6 � 1
xecutive Function 50.0 � 9.0a 40.1 � 1mWCST categories 5.4 � 1.2a 3.9 � 1mWCST persev. 2.4 � 3.8a 6.6 � 7
luency 50.0 � 7.6a 40.6 � 9Letters S & P 28.5 � 9.1a 21.9 � 9Categories 45.1 � 11.4a 34.4 � 1Designs 14.4 � 7.1a 8.3 � 4
erbal Memory 50.0 � 8.2a 38.9 � 9HVLT-R trials 1–3 24.7 � 4.7a 18.7 � 4HVLT-R delay 8.8 � 2.6a 5.7 � 2HVLT-R recognition 10.4 � 1.6a 9.1 � 2
isual Memory 50.0 � 8.2a 39.5 � 1BVMT-R trials 1–3 22.6 � 7.2a 17.3 � 7BVMT-R delay 8.8 � 2.6a 6.8 � 3BVMT-R recognition 5.6 � 0.7a 5.3 � 1
See Table 1 for descriptions of neuropsychological test measures thatipolar disorder; GPT, grooved pegboard test; BTA, Brief Test of Attention; CPest; HVLT-R, Hopkins Verbal Learning Test; BVMT, Brief Visuospatial Memoromparisons were used to evaluate pairwise group differences (denoted by
aNote that demographically-adjusted scores for both individual test and mea
ww.sobp.org/journal
Multivariate analyses of variance revealed significant overalldifferences among the three groups for the demographically-adjusted individual test (Wilks’ � � .525; F(38,934) � 9.23; p �.0001; partial �2 � .275) and cognitive domain (Wilks’ � � .572;F(12,960) � 25.76; p � .0001; partial �2 � .244) scores. As shownin Table 3, planned contrasts confirmed that the SZ groupperformed significantly (p � .001) worse than NCs on everycognitive measure and in every cognitive domain. The BD groupperformed significantly (p � .01) worse than NCs on everycognitive domain and on all but one (Conners’ CPT hit reactiontime; p � .068) of the individual cognitive test scores. Bonferroni-adjusted post hoc comparisons showed that SZ patients per-formed significantly (p � .05) worse than BD patients on 11 ofthe 19 individual tests and 5 of the 6 cognitive domains. The BDpatients did not perform worse than SZ patients on any measure,but they performed as poorly as SZ patients on tests of attention(Brief Test of Attention [BTA], Continuous Performance Test[CPT]), word and design fluency (Verbal Fluency Test [VFT],Design Fluency Test [DFT]) and recognition discrimination (Hop-kins Verbal Learning Test Revised [HVLT-R], Brief VisuospatialMemory Test Revised [BVMT-R]).
We next computed Cohen’s (1988) d effect size estimates ofthe performance difference between each patient group and thehealthy controls for the 19 cognitive test variables and six domainscores. This involved subtracting the mean score for eachmeasure/domain from the NC group’s mean score on the samemeasure/domain, and dividing the difference by the pooledstandard deviations (Rosnow and Rosenthal 1996), separately foreach patient group. For SZ patients, the resulting effect sizes
and Demographically-Adjusted T-score Means for the Six Cognitive
BD F(df) p �
41.7 � 9.8c F(2,485) � 122.7 .000180.3 � 24.5c F(2,485) � 74.8 .000193.2 � 34.0c F(2,485) � 68.6 .000137.1 � 18.3c F(2,485) � 62.1 .0001
104.3 � 72.7c F(2,485) � 77.0 .000143.1 � 9.1b F(2,485) � 68.2 .000114.0 � 4.0b F(2,485) � 61.5 .0001
442.2 � 89.5b F(2,485) � 6.2 .00310.2 � 10.6b F(2,485) � 27.1 .0001
3.0 � 1.1b F(2,485) � 37.3 .000145.3 � 11.0c F(2,485) � 38.7 .0001
5.0 � 1.7c F(2,485) � 40.6 .00012.6 � 3.0c F(2,485) � 25.0 .0001
44.0 � 8.2c F(2,485) � 61.3 .000126.3 � 7.8b F(2,485) � 18.6 .000142.3 � 11.7c F(2,485) � 39.2 .000111.3 � 6.1b F(2,485) � 47.5 .000144.7 � 10.9c F(2,485) � 65.7 .000123.8 � 6.1c F(2,485) � 61.1 .0001
7.8 � 3.2c F(2,485) � 66.5 .000110.0 � 2.1b F(2,485) � 21.2 .000143.9 � 10.4c F(2,485) � 55.2 .000122.0 � 6.7c F(2,485) � 56.5 .0001
8.3 � 2.7c F(2,485) � 55.1 .00015.4 � .9b F(2,485) � 15.0 .0001
rised each cognitive domain. NC, healthy control; SZ, schizophrenia; BD,ntinuous Performance Test; RT, reaction time; WCST, Wisconsin Card Sorting; MANOVA, multivariate analysis of variance. Bonferroni-corrected post hoccripts).
ores
.2b
3.1b
9.6b
0.2b
1.7b
.0b
.0b
2.9b
.4b
.1b
2.7b
.9b
.1b
.0b
.4b
0.5b
.7b
.1b
.9b
.6b
.2b
1.4b
.4b
.0b
.1b
compT, Coy Test
subs
n domain scores were used for all MANOVAs.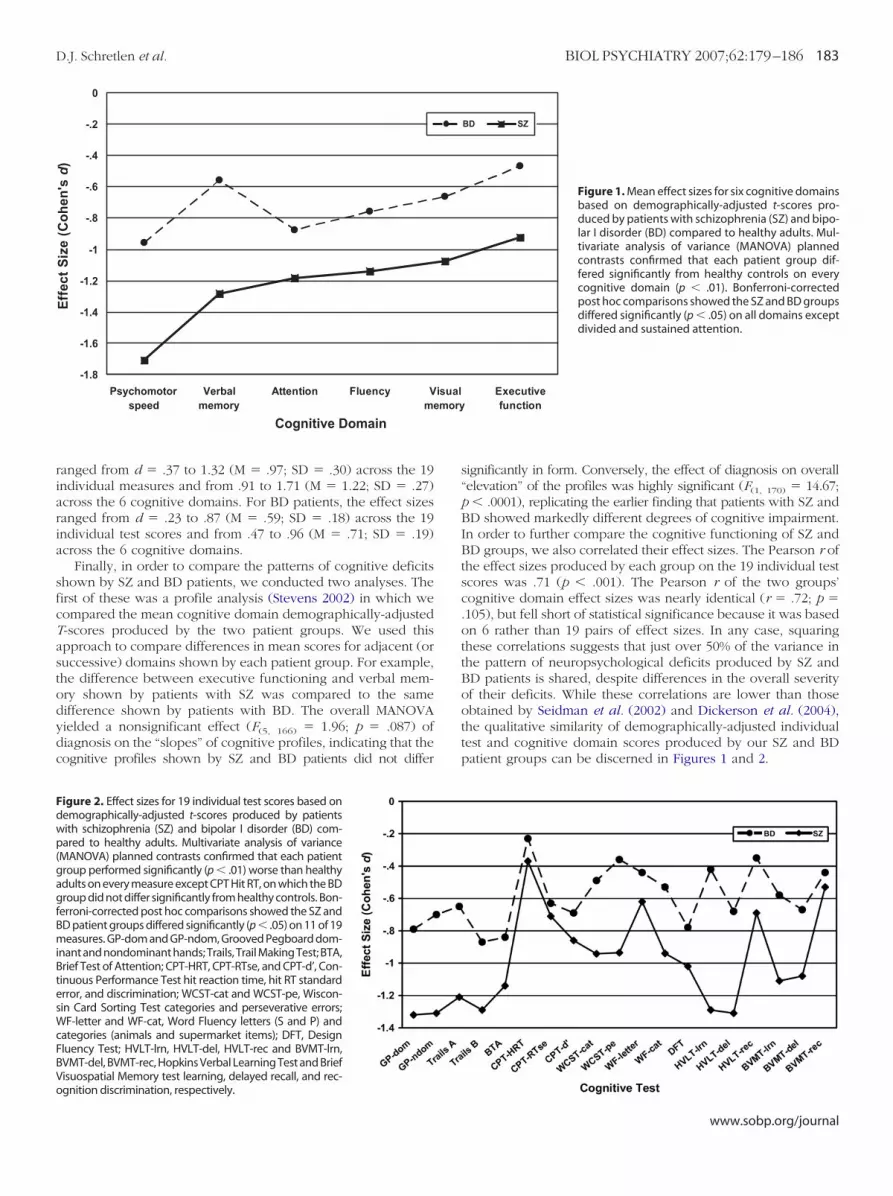
riaria
sfcTastodydc
Fdwp(gagfBmiBtesWcFBVo
D.J. Schretlen et al. BIOL PSYCHIATRY 2007;62:179–186 183
anged from d � .37 to 1.32 (M � .97; SD � .30) across the 19ndividual measures and from .91 to 1.71 (M � 1.22; SD � .27)cross the 6 cognitive domains. For BD patients, the effect sizesanged from d � .23 to .87 (M � .59; SD � .18) across the 19ndividual test scores and from .47 to .96 (M � .71; SD � .19)cross the 6 cognitive domains.
Finally, in order to compare the patterns of cognitive deficitshown by SZ and BD patients, we conducted two analyses. Theirst of these was a profile analysis (Stevens 2002) in which weompared the mean cognitive domain demographically-adjusted-scores produced by the two patient groups. We used thispproach to compare differences in mean scores for adjacent (oruccessive) domains shown by each patient group. For example,he difference between executive functioning and verbal mem-ry shown by patients with SZ was compared to the sameifference shown by patients with BD. The overall MANOVAielded a nonsignificant effect (F(5, 166) � 1.96; p � .087) ofiagnosis on the “slopes” of cognitive profiles, indicating that theognitive profiles shown by SZ and BD patients did not differ
-1.8
-1.6
-1.4
-1.2
-1
-.8
-.6
-.4
-.2
0
Psychomotorspeed
Verbalmemory
Attention Fluency Vme
Cognitive Domain
Eff
ect
Siz
e (C
oh
en's
d)
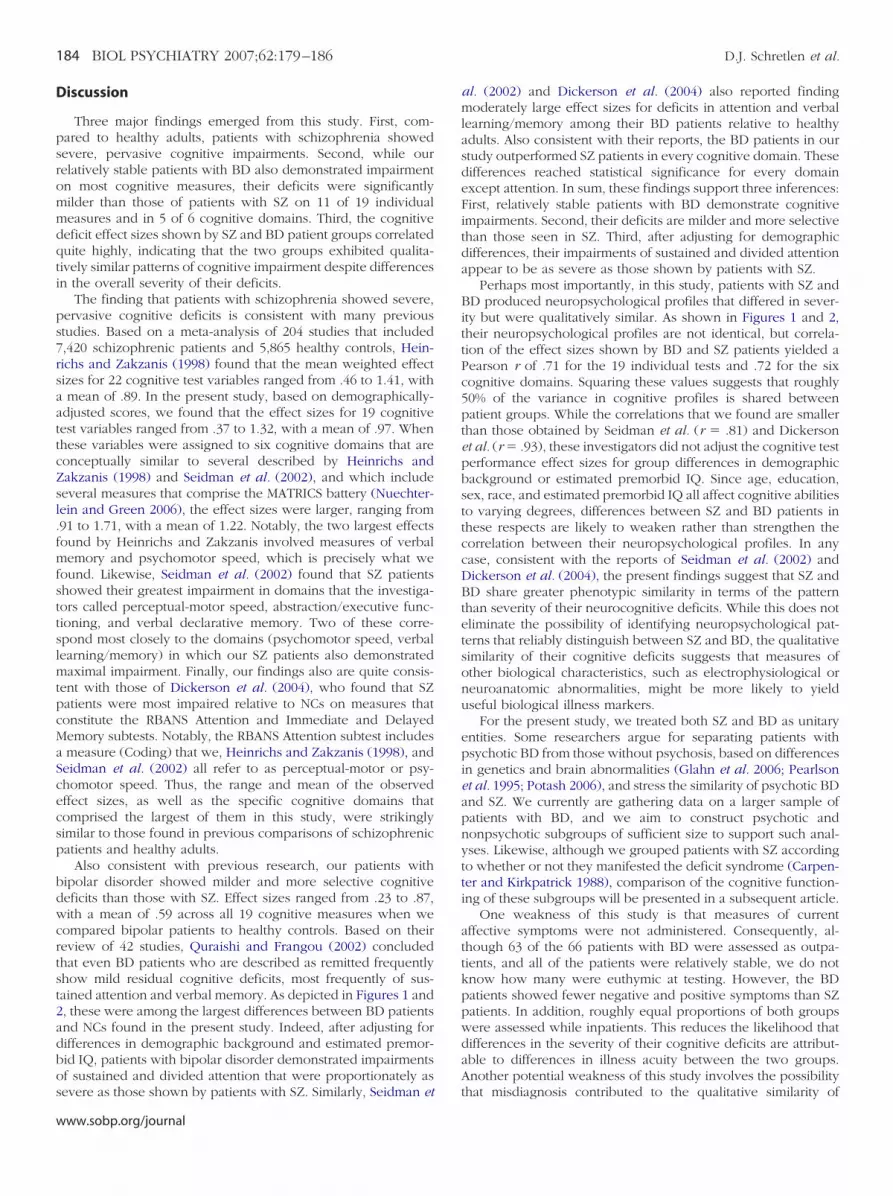
igure 2. Effect sizes for 19 individual test scores based onemographically-adjusted t-scores produced by patientsith schizophrenia (SZ) and bipolar I disorder (BD) com-ared to healthy adults. Multivariate analysis of variance
MANOVA) planned contrasts confirmed that each patientroup performed significantly (p � .01) worse than healthydults on every measure except CPT Hit RT, on which the BDroup did not differ significantly from healthy controls. Bon-
erroni-corrected post hoc comparisons showed the SZ andD patient groups differed significantly (p � .05) on 11 of 19easures. GP-dom and GP-ndom, Grooved Pegboard dom-
nant and nondominant hands; Trails, Trail Making Test; BTA,rief Test of Attention; CPT-HRT, CPT-RTse, and CPT-d’, Con-inuous Performance Test hit reaction time, hit RT standardrror, and discrimination; WCST-cat and WCST-pe, Wiscon-in Card Sorting Test categories and perseverative errors;
F-letter and WF-cat, Word Fluency letters (S and P) andategories (animals and supermarket items); DFT, Designluency Test; HVLT-lrn, HVLT-del, HVLT-rec and BVMT-lrn,VMT-del, BVMT-rec, Hopkins Verbal Learning Test and Briefisuospatial Memory test learning, delayed recall, and rec-
gnition discrimination, respectively.significantly in form. Conversely, the effect of diagnosis on overall“elevation” of the profiles was highly significant (F(1, 170) � 14.67;p � .0001), replicating the earlier finding that patients with SZ andBD showed markedly different degrees of cognitive impairment.In order to further compare the cognitive functioning of SZ andBD groups, we also correlated their effect sizes. The Pearson r ofthe effect sizes produced by each group on the 19 individual testscores was .71 (p � .001). The Pearson r of the two groups’cognitive domain effect sizes was nearly identical (r � .72; p �.105), but fell short of statistical significance because it was basedon 6 rather than 19 pairs of effect sizes. In any case, squaringthese correlations suggests that just over 50% of the variance inthe pattern of neuropsychological deficits produced by SZ andBD patients is shared, despite differences in the overall severityof their deficits. While these correlations are lower than thoseobtained by Seidman et al. (2002) and Dickerson et al. (2004),the qualitative similarity of demographically-adjusted individualtest and cognitive domain scores produced by our SZ and BDpatient groups can be discerned in Figures 1 and 2.
Executivefunction
BD SZ
Figure 1. Mean effect sizes for six cognitive domainsbased on demographically-adjusted t-scores pro-duced by patients with schizophrenia (SZ) and bipo-lar I disorder (BD) compared to healthy adults. Mul-tivariate analysis of variance (MANOVA) plannedcontrasts confirmed that each patient group dif-fered significantly from healthy controls on everycognitive domain (p � .01). Bonferroni-correctedpost hoc comparisons showed the SZ and BD groupsdiffered significantly (p � .05) on all domains exceptdivided and sustained attention.
isualmory
www.sobp.org/journal
D
psrommdqti
ps7rsaattcZsl.fmfsttslmtpcMaScecsp
bdwcrtst2adbos
184 BIOL PSYCHIATRY 2007;62:179–186 D.J. Schretlen et al.
w
iscussion
Three major findings emerged from this study. First, com-ared to healthy adults, patients with schizophrenia showedevere, pervasive cognitive impairments. Second, while ourelatively stable patients with BD also demonstrated impairmentn most cognitive measures, their deficits were significantlyilder than those of patients with SZ on 11 of 19 individualeasures and in 5 of 6 cognitive domains. Third, the cognitiveeficit effect sizes shown by SZ and BD patient groups correlateduite highly, indicating that the two groups exhibited qualita-ively similar patterns of cognitive impairment despite differencesn the overall severity of their deficits.
The finding that patients with schizophrenia showed severe,ervasive cognitive deficits is consistent with many previoustudies. Based on a meta-analysis of 204 studies that included,420 schizophrenic patients and 5,865 healthy controls, Hein-ichs and Zakzanis (1998) found that the mean weighted effectizes for 22 cognitive test variables ranged from .46 to 1.41, withmean of .89. In the present study, based on demographically-
djusted scores, we found that the effect sizes for 19 cognitiveest variables ranged from .37 to 1.32, with a mean of .97. Whenhese variables were assigned to six cognitive domains that areonceptually similar to several described by Heinrichs andakzanis (1998) and Seidman et al. (2002), and which includeeveral measures that comprise the MATRICS battery (Nuechter-ein and Green 2006), the effect sizes were larger, ranging from91 to 1.71, with a mean of 1.22. Notably, the two largest effectsound by Heinrichs and Zakzanis involved measures of verbalemory and psychomotor speed, which is precisely what we
ound. Likewise, Seidman et al. (2002) found that SZ patientshowed their greatest impairment in domains that the investiga-ors called perceptual-motor speed, abstraction/executive func-ioning, and verbal declarative memory. Two of these corre-pond most closely to the domains (psychomotor speed, verbalearning/memory) in which our SZ patients also demonstratedaximal impairment. Finally, our findings also are quite consis-
ent with those of Dickerson et al. (2004), who found that SZatients were most impaired relative to NCs on measures thatonstitute the RBANS Attention and Immediate and Delayedemory subtests. Notably, the RBANS Attention subtest includes
measure (Coding) that we, Heinrichs and Zakzanis (1998), andeidman et al. (2002) all refer to as perceptual-motor or psy-homotor speed. Thus, the range and mean of the observedffect sizes, as well as the specific cognitive domains thatomprised the largest of them in this study, were strikinglyimilar to those found in previous comparisons of schizophrenicatients and healthy adults.
Also consistent with previous research, our patients withipolar disorder showed milder and more selective cognitiveeficits than those with SZ. Effect sizes ranged from .23 to .87,ith a mean of .59 across all 19 cognitive measures when we
ompared bipolar patients to healthy controls. Based on theireview of 42 studies, Quraishi and Frangou (2002) concludedhat even BD patients who are described as remitted frequentlyhow mild residual cognitive deficits, most frequently of sus-ained attention and verbal memory. As depicted in Figures 1 and, these were among the largest differences between BD patientsnd NCs found in the present study. Indeed, after adjusting forifferences in demographic background and estimated premor-id IQ, patients with bipolar disorder demonstrated impairmentsf sustained and divided attention that were proportionately as
evere as those shown by patients with SZ. Similarly, Seidman etww.sobp.org/journal
al. (2002) and Dickerson et al. (2004) also reported findingmoderately large effect sizes for deficits in attention and verballearning/memory among their BD patients relative to healthyadults. Also consistent with their reports, the BD patients in ourstudy outperformed SZ patients in every cognitive domain. Thesedifferences reached statistical significance for every domainexcept attention. In sum, these findings support three inferences:First, relatively stable patients with BD demonstrate cognitiveimpairments. Second, their deficits are milder and more selectivethan those seen in SZ. Third, after adjusting for demographicdifferences, their impairments of sustained and divided attentionappear to be as severe as those shown by patients with SZ.
Perhaps most importantly, in this study, patients with SZ andBD produced neuropsychological profiles that differed in sever-ity but were qualitatively similar. As shown in Figures 1 and 2,their neuropsychological profiles are not identical, but correla-tion of the effect sizes shown by BD and SZ patients yielded aPearson r of .71 for the 19 individual tests and .72 for the sixcognitive domains. Squaring these values suggests that roughly50% of the variance in cognitive profiles is shared betweenpatient groups. While the correlations that we found are smallerthan those obtained by Seidman et al. (r � .81) and Dickersonet al. (r � .93), these investigators did not adjust the cognitive testperformance effect sizes for group differences in demographicbackground or estimated premorbid IQ. Since age, education,sex, race, and estimated premorbid IQ all affect cognitive abilitiesto varying degrees, differences between SZ and BD patients inthese respects are likely to weaken rather than strengthen thecorrelation between their neuropsychological profiles. In anycase, consistent with the reports of Seidman et al. (2002) andDickerson et al. (2004), the present findings suggest that SZ andBD share greater phenotypic similarity in terms of the patternthan severity of their neurocognitive deficits. While this does noteliminate the possibility of identifying neuropsychological pat-terns that reliably distinguish between SZ and BD, the qualitativesimilarity of their cognitive deficits suggests that measures ofother biological characteristics, such as electrophysiological orneuroanatomic abnormalities, might be more likely to yielduseful biological illness markers.
For the present study, we treated both SZ and BD as unitaryentities. Some researchers argue for separating patients withpsychotic BD from those without psychosis, based on differencesin genetics and brain abnormalities (Glahn et al. 2006; Pearlsonet al. 1995; Potash 2006), and stress the similarity of psychotic BDand SZ. We currently are gathering data on a larger sample ofpatients with BD, and we aim to construct psychotic andnonpsychotic subgroups of sufficient size to support such anal-yses. Likewise, although we grouped patients with SZ accordingto whether or not they manifested the deficit syndrome (Carpen-ter and Kirkpatrick 1988), comparison of the cognitive function-ing of these subgroups will be presented in a subsequent article.
One weakness of this study is that measures of currentaffective symptoms were not administered. Consequently, al-though 63 of the 66 patients with BD were assessed as outpa-tients, and all of the patients were relatively stable, we do notknow how many were euthymic at testing. However, the BDpatients showed fewer negative and positive symptoms than SZpatients. In addition, roughly equal proportions of both groupswere assessed while inpatients. This reduces the likelihood thatdifferences in the severity of their cognitive deficits are attribut-able to differences in illness acuity between the two groups.Another potential weakness of this study involves the possibility
that misdiagnosis contributed to the qualitative similarity of
ccoafg
oadacdod“osy9Tsaslcauepitpmrtttracctuk
fdrgtBaffs
(fa
D.J. Schretlen et al. BIOL PSYCHIATRY 2007;62:179–186 185
ognitive profiles shown by our BD and SZ groups. While weannot exclude this possibility, the systematic differences in theverall severity of cognitive deficits shown by BD and SZ patientsrgues against this, as does the fact that other investigators haveound even greater qualitative similarities between these patientroups.
An important and novel strength of this study involves the usef regression-based adjustments for demographic characteristicsnd estimated premorbid IQ. This approach standardizes theifference between an individual’s actual obtained test scoresnd those predicted on the basis of his or her demographicharacteristics and estimated premorbid IQ. Regression-basedemographic adjustments of test scores (Heaton et al. 2004)bviate the need to match patient and control groups onemographic variables because their influence is statisticallyremoved” from each individual’s test scores. The effectivenessf this approach is demonstrated by the fact that nonoverlappingubgroups of healthy controls (e.g., those with � 12 vs. � 12ears of education) did not differ significantly on a single t-test in5 statistical comparisons (see footnote). In fact, the adjusted-scores of every NC subgroup approximated a mean of 50 andtandard deviation of 10. When applied to patient groups, thispproach improves diagnostic classification by increasing theensitivity, without decreasing the specificity, of neuropsycho-ogical measures (Testa and Schretlen 2006). In effect, theognitive deficits and corresponding effect sizes shown by SZnd BD patients in this study reflect impairments that arenrelated to group differences in age, sex, race, education, andstimated premorbid IQ. Meehl (1970) noted that matchingatients with SZ and healthy controls might “correct” out genuine
llness-related variance. The same could be said of including aerm for education in regression formulas used to residualize testerformance for demographic characteristics and estimated pre-orbid IQ. However, when all predictors were entered into the
egression models, education accounted for very little incremen-al variance (as shown by its relatively small beta weight) in anyest score. In addition, the cognitive test effect sizes obtained inhis study were remarkably similar to those reported for compa-able measures in previous research. This suggests that includingterm for education did not greatly reduce group differences in
ognitive test performance, which is the principal risk of “over-orrecting” scores. In any case, this is the first study to comparehe cognitive impairments shown by patients with BD and SZsing regression-based demographic adjustment, as far as wenow.
Qualitative similarities between the neuropsychological pro-iles produced by our patients with schizophrenia and bipolarisorder are consistent with the view that these disorders mightepresent a “continuum of psychosis” (Crow 1997) or share someenetic biological overlap (Berrettini 2004). They support con-inuing research on the traditional distinction between SZ andD. For example, pooling patients without regard to diagnosis,nd then defining clusters by clinical symptoms, neurocognitiveunctioning, and other putative biomarkers might prove usefulor linkage and gene expression analyses of homogeneousubgroups that cross diagnostic boundaries.
The research was supported by the National Institute of HealthMH60504 and MH43775 to GDP and DJS), National Allianceor Research on Schizophrenia and Depression (to NGC, VARnd DJS), and Stanley Foundation (to NGC).
Dr. Schretlen receives royalties for the Brief Test of Attention.
None of the other authors has a conflict of interest related to theresearch reported in this article.
Albus M, Hubmann W, Wahlheim C, Sobizack N, Franz U, Mohr F (1996):Contrasts in neuropsychological test profile between patients with first-episode schizophrenia and first-episode affective disorders. Acta Psychi-atr Scand 94:87–93.
American Psychiatric Association (1994): Diagnostic and statistical manual ofmental disorders DSM-IV, 4th ed. Washington, DC: American PsychiatricAssociation.
Andreasen NC, Olsen S (1982): Negative v positive schizophrenia. Definitionand validation. Arch Gen Psychiatry 39:789 –794.
Benedict HRB (1997): Brief Visuospatial Memory Test-revised professionalmanual. Odessa, FL: Psychological Assessment Resources, Inc.
Berrettini W (2004): Bipolar disorder and schizophrenia: Convergent molec-ular data. Neuromolecular Medicine 5:109 –117.
Bilder RM, Goldman RS, Robinson D, Reiter G, Bell L, Bates JA, et al. (2000):Neuropsychology of first-episode schizophrenia: Initial characterizationand clinical correlates. Am J Psychiatry 157:549 –559.
Blair JR, Spreen O (1989): Predicting premorbid IQ: A revision of the NationalAdult Reading Test. Clin Neuropsychologist 3:129 –136.
Bowie CR, Harvey PD (2005): Cognition in schizophrenia: Impairments, de-terminants, and functional importance. Psychiatr Clin North Am 28:613–633, 626.
Bramon E, Sham PC (2001): The common genetic liability between schizo-phrenia and bipolar disorder: A review. Current Psychiatry Reports 3:332–337.
Brandt J, Benedict HRB (2001): Hopkins Verbal Learning Test-revised profes-sional manual. Odessa, FL: Psychological Assessment Resources, Inc.
Carpenter WT Jr, Kirkpatrick B (1988): The heterogeneity of the long-termcourse of schizophrenia. Schizophr Bull 14:645– 652.
Censits DM, Ragland JD, Gur RC, Gur RE (1997): Neuropsychological evi-dence supporting a neurodevelopmental model of schizophrenia: Alongitudinal study. Schizophr Res 24:289 –298.
Cohen J (1988): Statistical power analysis for the behavioral sciences, 2nd ed.Hillsdale, NJ: Lawrence Earlbaum Associates.
Conners CK (1995): Connors’ Continuous Performance Test. Canada: Multi-Health Systems, Inc.
Craddock N, O’Donovan MC, Owen MJ (2006): Genes for schizophrenia andbipolar disorder? Implications for psychiatric nosology. Schizophr Bull32:9 –16.
Crow TJ (1997): Is schizophrenia the price that Homo sapiens pays for lan-guage? Schizophr Res 28:127–141.
Daban C, Martinez-Aran A, Torrent C, Tabares-Seisdedos R, Balanza-MartinezV, Salazar-Fraile J, et al. (2006): Specificity of cognitive deficits in bipolardisorder versus schizophrenia. A systematic review. Psychother Psycho-som 75:72– 84.
Dickerson F, Boronow JJ, Stallings C, Origoni AE, Cole SK, Yolken RH (2004):Cognitive functioning in schizophrenia and bipolar disorder: Compari-son of performance on the Repeatable Battery for the Assessment ofNeuropsychological Status. Psychiatry Res 129:45–53.
Dickerson FB, Sommerville J, Origoni AE, Ringel NB, Parente F (2001): Outpa-tients with schizophrenia and bipolar I disorder: Do they differ in theircognitive and social functioning? Psychiatry Res 102:21–27.
First MB, Spitzer RL, Gibbon M, Williams JBW (1997): Structured Clinical Inter-view for DSM-IV Axis I Disorders - Clinical Version (SCID-CV). Washington,DC: American Psychiatric Press.
Flashman LA, Green MF (2004): Review of cognition and brain structure inschizophrenia: Profiles, longitudinal course, and effects of treatment.Psychiatr Clin North Am 27:1–18, vii.
Folstein MF, Folstein SE, McHugh PR (1975): “Mini-mental state”. A practicalmethod for grading the cognitive state of patients for the clinician.J Psychiatr Res 12:189 –198.
Glahn DC, Bearden CE, Cakir S, Barrett JA, Najt P, Serap Monkul E, et al. (2006):Differential working memory impairment in bipolar disorder and schizo-phrenia: Effects of lifetime history of psychosis. Bipolar Disord 8:117–123.
Glahn DC, Therman S, Manninen M, Huttunen M, Kaprio J, Lonnqvist J,Cannon TD (2003): Spatial working memory as an endophenotype forschizophrenia. Biol Psychiatry 53:624 – 626.
Goldberg TE (1999): Some fairly obvious distinctions between schizophre-nia and bipolar disorder. Schizophr Res 39:127–132; discussion 161–122.
Goldberg TE, Gold JM, Greenberg R, Griffin S, Schulz SC, Pickar D, et al. (1993):
Contrasts between patients with affective disorders and patients withwww.sobp.org/journal
G
H
H
H
H
I
K
K
K
L
M
M
M
N
N
N
P
186 BIOL PSYCHIATRY 2007;62:179–186 D.J. Schretlen et al.
w
schizophrenia on a neuropsychological test battery. Am J Psychiatry150:1355–1362.
ourovitch ML, Torrey EF, Gold JM, Randolph C, Weinberger DR, GoldbergTE (1999): Neuropsychological performance of monozygotic twins dis-cordant for bipolar disorder. Biol Psychiatry 45:639 – 646.
eaton RK, Miller SW, Taylor MJ, Grant I (2004): Revised comprehensive normsfor an expanded Halstead-Reitan Battery: Demographically adjusted neu-ropsychological norms for African American and Caucasian adults. Lutz,FL: Psychological Assessment Resources, Inc.
einrichs RW (2005): The primacy of cognition in schizophrenia. Am Psychol60:229 –242.
einrichs RW, Zakzanis KK (1998): Neurocognitive deficit in schizophrenia: Aquantitative review of the evidence. Neuropsychology 12:426 – 445.
ill SK, Ragland JD, Gur RC, Gur RE (2002): Neuropsychological profilesdelineate distinct profiles of schizophrenia, an interaction betweenmemory and executive function, and uneven distribution of clinicalsubtypes. J Clin Exp Neuropsychol 24:765–780.
vnik RJ, Malec JF, Smith GE, Tangalos EG (1992): Mayo’s Older AmericansNormative Studies: WAIS--R norms for ages 56 to 97. The Clinical Neuro-psychologist 6:1–30.
ingery LR, Schretlen DJ, Sateri S, Langley LK, Marano NC, Meyer SM (2006):Interrater and test-retest reliability of a fixed condition design fluencytest. Clin Neuropsychol 20:729-740.
love H (1963): Clinical neuropsychology. In: Forster FM, editor. Med ClinNorth Am. New York: Saunders.
remen WS, Seidman LJ, Faraone SV, Toomey R, Tsuang MT (2000): Theparadox of normal neuropsychological function in schizophrenia. J Ab-norm Psychol 109:743–752.
eboyer M, Bellivier F, Nosten-Bertrand M, Jouvent R, Pauls D, Mallet J (1998):Psychiatric genetics: Search for phenotypes. Trends Neurosci 21:102–105.
artinez-Aran A, Vieta E, Reinares M, Colom F, Torrent C, Sanchez-Moreno J,et al. (2004): Cognitive function across manic or hypomanic, depressed,and euthymic states in bipolar disorder. Am J Psychiatry 161:262–270.
cGrath J, Scheldt S, Welham J, Clair A (1997): Performance on tests sensi-tive to impaired executive ability in schizophrenia, mania and well con-trols: Acute and subacute phases. Schizophr Res 26:127–137.
eehl PE (1970): Nuisance variables and the ex post facto design. In: RadnerM, Winokur S, editors. Minnesota studies in the philosophy of science.Minneapolis: University of Minnesota Press.
elson HE (1976): A modified card sorting test sensitive to frontal lobedefects. Cortex 11:918-932.
uechterlein KH, Green MF (2006): MATRICS Consensus Cognitive Battery.Lutz, FL: Psychological Assessment Resources, Inc.
urnberger JI, Jr., Blehar MC, Kaufmann CA, York-Cooler C, Simpson SG,Harkavy-Friedman J, et al. (1994): Diagnostic interview for genetic stud-ies. Rationale, unique features, and training. NIMH Genetics Initiative.Arch Gen Psychiatry 51:849 – 859; discussion 863– 844.
earlson GD, Barta PE, Powers RE, Menon RR, Richards SS, Aylward EH, etal. (1997): Medial and superior temporal gyral volumes and cerebral
ww.sobp.org/journal
asymmetry in schizophrenia versus bipolar disorder. Biol Psychiatry41:1–14.
Pearlson GD, Kreger L, Rabins PV, Chase GA, Cohen B, Wirth JB, et al. (1989): Achart review study of late-onset and early-onset schizophrenia. Am JPsychiatry 146:1568 –1574.
Pearlson GD, Wong DF, Tune LE, Ross CA, Chase GA, Links JM, et al. (1995): Invivo D2 dopamine receptor density in psychotic and nonpsychotic pa-tients with bipolar disorder. Arch Gen Psychiatry 52:471– 477.
Potash JB (2006): Carving chaos: Genetics and the classification of mood andpsychotic syndromes. Harv Rev Psychiatry 14:47– 63.
Quraishi S, Frangou S (2002): Neuropsychology of bipolar disorder: A review.J Affect Disord 72:209 –226.
Randolph C (1998): RBANS Manual, Repeatable Battery for the Assessment ofNeuropsychological Status. San Antonio, TX: The Psychological Corpora-tion (Harcourt).
Reitan RM (1958): Validity of the trail making test as an indicator of organicbrain damage. Perceptual and Motor Skills 8:271-276.
Rosnow RL, Rosenthal R (1996): Computing contrasts, effect sizes, and coun-ternulls on other people’s published data: General procedures for re-search consumers. Psychol Method 1:331–340.
Rubinsztein JS, Michael A, Paykel ES, Sahakian BJ (2000): Cognitive impair-ment in remission in bipolar affective disorder. Psychol Med 30:1025–1036.
Schretlen D (1997): Brief Test of Attention profession manual. Odessa, FL:Psychological Assessment Resources, Inc.
Seidman LJ, Kremen WS, Koren D, Faraone SV, Goldstein JM, Tsuang MT(2002): A comparative profile analysis of neuropsychological function-ing in patients with schizophrenia and bipolar psychoses. Schizophr Res53:31– 44.
Sheehan DV, Lecrubier Y, Sheehan KH, Amorim P, Janavs J, Weiller E, et al.(1998): The Mini-International Neuropsychiatric Interview (M.I.N.I.): Thedevelopment and validation of a structured diagnostic psychiatric inter-view for DSM-IV and ICD-10. J Clin Psychiatry 59 Suppl 20:22–33; quiz34 –57.
Stevens JP (2002): Applied multivariate statistics for the social sciences (4thed.): Lawrence Erlbaum Associates, Publishers.
Testa SM, Schretlen DJ (2006): Diagnostic utility of regression based normsin schizophrenia. The Clinical Neuropsychologist 20:206.
van Gorp WG, Altshuler L, Theberge DC, Mintz J (1999): Declarative andprocedural memory in bipolar disorder. Biol Psychiatry 46:525–531.
Verdoux H, Liraud F (2000): Neuropsychological function in subjects withpsychotic and affective disorders. Relationship to diagnostic categoryand duration of illness. E Psychiatry 15:236 –243.
Wing J (1996): SCAN and the PSE tradition. Soc Psychiatry Psychiatr Epidemiol31:50 –54.
Zubieta JK, Huguelet P, O’Neil RL, Giordani BJ (2001): Cognitive function in
euthymic bipolar I disorder. Psychiatry Res 102:9 –20.