NEUROBIOCHEMICAL AND PEPTIDOMIC APPROACHES TO ...
250
NEUROBIOCHEMICAL AND PEPTIDOMIC APPROACHES TO SCREEN FOR TAU KINASE INHIBITORS AND ELUCIDATE POST-TRANSLATIONAL MODIFICATIONS FOLLOWING TRAUMATIC BRAIN INJURY BY HAMAD YADIKAR A DISSERTATION PRESENTED TO THE GRADUATE SCHOOL OF THE UNIVERSITY OF FLORIDA IN PARTIAL FULFILLMENT OF THE REQUIREMENTS FOR THE DEGREE OF DOCTOR OF PHILOSOPHY UNIVERSITY OF FLORIDA 2018
-
Upload
khangminh22 -
Category
Documents
-
view
4 -
download
0
Transcript of NEUROBIOCHEMICAL AND PEPTIDOMIC APPROACHES TO ...
NEUROBIOCHEMICAL AND PEPTIDOMIC APPROACHES TO SCREEN FOR TAU KINASE INHIBITORS AND ELUCIDATE POST-TRANSLATIONAL MODIFICATIONS
FOLLOWING TRAUMATIC BRAIN INJURY
BY
HAMAD YADIKAR
A DISSERTATION PRESENTED TO THE GRADUATE SCHOOL OF THE UNIVERSITY OF FLORIDA IN PARTIAL FULFILLMENT
OF THE REQUIREMENTS FOR THE DEGREE OF DOCTOR OF PHILOSOPHY
UNIVERSITY OF FLORIDA
2018

© 2018 Hamad Yadikar

To my Family and Friends

4
ACKNOWLEDGMENTS
I thank Allah for all his blessings without which nothing of my work would have
been done. The body of this work would not have been completed without the patience,
guidance, scientific discussions, and encouragement from Dr. Kevin K Wang, Dr.
Richard A. Yost, Dr. Kari Basso, and Dr. Gail Fanucci. I will be forever indebted for the
experiences and the knowledge I gained as well as the extensive training obtained in
mass spectrometry. I would like to take the opportunity to give my sincere appreciation
to my research advisor, Professor Kevin Wang. He not only taught me how to be an
independent scientist, but also gave me the will to keep going on this exciting research
field. I will always admire and respect him as a research mentor; under his supervision, I
have learned many scientific skills in research, and this will be an excellent guideline for
my future career.
I would like to thank our lab research team as well, Dr. Sunny and Lab Manager
Fan Lin, they have been quite helpful to me in sample preparation for my Ph.D. project.
Wholeheartedly, I would like to thank the Yost Research Group for fostering my
scientific skills in mass spectrometry as well as solving instrumental problems I faced as
I evolved into the biochemist I am today. The weekly meeting has been very insightful
for me to solve many problems. The meetings gave me several methodological ideas to
apply to my research. I would also like to thank our undergraduate students whom I
enjoyed working with and gained experience in teaching and managing their sub-
projects, a skill I will use in my future career.
I would like to express my gratitude to my chair, Dr. Richard A. Yost, for his
interest in this work and his generous support for my research. I also would like to thank
Dr. Kari Basso, who has been truly kind and welcoming in helping me in my proteomics

5
research and gave me valuable suggestions to improve my data for publication. I would
like to thank Dr. Gail Fanucci for her valuable points she made for my research project. I
express my sincere gratitude to Kuwait University Fund Doctoral Scholarship for
providing me the academic, professional, financial, and personal support through my
doctoral study at the University of Florida. I am grateful for ICBR-proteomics core at the
University of Florida for aiding me in analyzing my samples using the innovative mass
spectrometric technology, especially Dr. Jin Koh and Dr. Sixue Chen.
Lastly, I cannot end without thanking my family for their constant encouragement
and love, that I have relied on throughout my time at the UF. My parents educated me
to love science and believed in me. They were never afraid to express faith in my ability
to obtain success. The knowledge I have gained with Dr. Wang and Dr. Yost research
teams will be an invaluable asset as I move forward in my career and use my expertise
professionally to aid in bettering humanity and leaving a legacy for others to follow.
6
TABLE OF CONTENTS
Page
ACKNOWLEDGMENTS .................................................................................................. 4
LIST OF TABLES ............................................................................................................ 9
LIST OF FIGURES ........................................................................................................ 10
LIST OF ABBREVIATIONS ........................................................................................... 14
ABSTRACT ................................................................................................................... 19
CHAPTER
1 LITERATURE REVIEW .......................................................................................... 21
Traumatic Brain Injury (TBI) .................................................................................... 21
Chronic Traumatic Encephalopathy (CTE) ............................................................. 22 The Role of Tau Protein in Cellular Functions and Dysfunctions ............................ 24 Tau Structure .......................................................................................................... 25
Tau Post-Translational Modification ........................................................................ 27 Tau Proteolysis ....................................................................................................... 30
Tau Calpain-Mediated Proteolysis .......................................................................... 31 The Function of Tau proteolytic fragments in Disease ............................................ 32 Tau Fragments in Biofluids as Biomarkers ............................................................. 33
Serum Tau ........................................................................................................ 33
CSF Tau ........................................................................................................... 34 Plasma Tau ...................................................................................................... 34 Conclusions ...................................................................................................... 35
Peptidomics-Based Discovery of Novel Neuropeptides .......................................... 35 Current Mass Spectrometric Peptidomic Technologies .......................................... 37 The Scope of the Dissertation ................................................................................. 38
2 SCREENING OF TAU PROTEIN KINASE INHIBITORS IN A TAUOPATHY-RELEVANT CELL-BASED MODEL OF TAU HYPERPHOSPHORYLATION AND OLIGOMERIZATION ...................................................................................... 46
Introduction ............................................................................................................. 46
Materials and Methods............................................................................................ 48 Inhibitors ........................................................................................................... 48 Antibodies ......................................................................................................... 49
Cell Line ........................................................................................................... 49 Primary Cerebrocortical Neuronal Cultures ...................................................... 49 Cell Treatments ................................................................................................ 50 Cell Lysate Collection and Preparation ............................................................ 50 SDS–PAGE and Western Blots ........................................................................ 51

7
Statistical Analysis ............................................................................................ 51 Ethical Statement ............................................................................................. 52
Results .................................................................................................................... 52 Okadaic Acid (OA) Induces Tau Hyperphosphorylation and Oligomerization
at Different Time Points in Mouse Neuroblastoma N2a Cells........................ 52 Testing Tau Kinase Inhibitors on OA-Induced Tau Hyperphosphorylation
and Oligomerization in N2a Cells. ................................................................. 53
Casein kinase II (CKII) inhibitor: 4, 5, 6, 7-tetrabromobenzotriazole (TBB) ...................................................................................................... 54
Calcineurin inhibitor: cyclosporine A (CsA) ................................................ 55 Calcium chelator: EGTA ............................................................................ 55 GSK3 inhibitors: LiCl, A-1070722, and AR-1014418 ................................. 56
Src/Fyn kinase inhibitor: Saracatinib .......................................................... 57
CDK5 inhibitor: Roscovitine ....................................................................... 58 Baseline and OA-Induced Tau Hyperphosphorylation and Oligomerization:
Effects of Various Kinase Inhibitors Treatment in Rat Primary Cerebrocortical Neuronal (CTX) Culture. ...................................................... 58
Pan kinase inhibitor: K252a and STS ........................................................ 61 Discussion .............................................................................................................. 62
Limitations and Future Directions ........................................................................... 67 Conclusions ............................................................................................................ 67
3 IDENTIFICATION OF LOW AND HIGH MOLECULAR WEIGHT TAU FRAGMENTS FOLLOWING IN VITRO CALPAIN DIGESTION AND CELL-BASED NEUROTOXIC CHALLENGES BY BIOCHEMICAL AND PEPTIDOMIC APPROACHES ....................................................................................................... 85
Introduction ............................................................................................................. 85 Material and Methods ............................................................................................. 88
Ethics Statement .............................................................................................. 88
Mouse Brain Collection and Samples Preparation ........................................... 89 In Vitro Calpain-1 Digestion of Purified Tau and Naïve Mouse Brain Lysate .... 89
Rat Primary Cerebrocortical Neuronal (CTX) Culture ....................................... 90
Neurotoxic Challenges ..................................................................................... 90 Preparation and Collection of Cell Lysate and Conditioned Media ................... 91 Sample Preparation and Ultrafiltration .............................................................. 91 Gel Electrophoresis and Western Blotting ........................................................ 92 Nano-LC-ESI-MS/MS ....................................................................................... 93
Thermo Orbitrap Fusion Tribrid Mass Spectrometer Analysis .......................... 94
Data Analysis ................................................................................................... 95
Statistical Analysis ............................................................................................ 96 Results and Discussion........................................................................................... 96
Immunoblot Analysis ........................................................................................ 98 Recombinant purified human tau/p-tau protein .......................................... 98 Transgenic mouse brain lysate .................................................................. 98
Primary Rat Cerebrocortical Neuronal (CTX) culture Subjected to Neurotoxic and Neurodegenerative Conditions ............................................. 99
8
nLC-ESI-MS/MS Analysis of Purified Tau and Mouse Brain Lysate ............... 101 Conditioned Media of CTX Culture Analysis by nLC-ESI-MS/MS .................. 106
Phosphorylation Sites Analysis ...................................................................... 108 Conclusions .......................................................................................................... 109
4 ANALYSIS OF TEMPORAL PROFILE OF TBI-INDUCED TAU HYPERPHOSPHORYLATION AND PROTEOLYSIS IN MOUSE BRAIN BY IMMUNOBLOTTING AND MASS SPECTROMETRY........................................... 148
Introduction ........................................................................................................... 148 Cortical Impact Injury (CCI) ................................................................................... 150 Materials and Methods.......................................................................................... 152
Ethical Statement ........................................................................................... 152
Mouse Brain Samples Preparation ................................................................. 152 Ultrafiltration Method and Ultrafiltrate Processing for Mass Spectrometry ..... 153 Immunoblot Analysis ...................................................................................... 153
Reversed-Phase Nano-UPLC-MS/MS ........................................................... 154 Results and Discussion......................................................................................... 155
Immunoblot Analysis of Tau in Transgenic Mouse Brain after Experimental CCI .............................................................................................................. 157
Identification of Tau Proteolytic Fragments from Mouse Brain after CCI using nLC-nESI-MS/MS .............................................................................. 160
Conclusions .......................................................................................................... 167
5 CHARACTERIZATION OF TAU POST-TRANSLATIONAL MODIFICATION LEVELS AND TEMPORAL PROFILE IN HUMAN CEREBROSPINAL FLUID FROM SEVERE TBI AND CONTROL SUBJECTS. ............................................. 197
Introduction ........................................................................................................... 197
Materials and Methods.......................................................................................... 199 Human TBI and Control Cerebrospinal Fluid Procurement ............................ 199 Total-Tau-ELISA Kit ....................................................................................... 200
SDS-PAGE and Immunoblotting .................................................................... 200 Isolation of CSF LMW peptides ...................................................................... 200 nLC-ESI-MS/MS ............................................................................................. 200
Results and Discussion......................................................................................... 201 Conclusion ............................................................................................................ 204
6 CONCLUSIONS AND FUTURE DIRECTIONS .................................................... 222
LIST OF REFERENCES ............................................................................................. 229
BIOGRAPHICAL SKETCH .......................................................................................... 250
9
LIST OF TABLES
Table page 2-1 Antibodies used in this study .............................................................................. 69
2-2 Phosphatases, kinase inhibitors, and pharmacological agents used in the study. .................................................................................................................. 70
2-3 Composite effects of tau kinase inhibitors on OA-induced tau hyperphosphorylation in N2a cells. ..................................................................... 71
2-4 Composite effects of tau kinase inhibitors on basal and OA-induced tau hyperphosphorylation in rat primary cerebrocortical neuronal cells. ................... 72
3-1 Selected human tau-441 calpain-mediated proteolytic peptides from purified protein digestion identified by nLC-MS/MS. ...................................................... 111
3-2 Selected human calpain-mediated proteolytic peptides from purified p-tau protein digestion identified by nLC-MS/MS. ...................................................... 112
3-3 Selected tau-441 calpain-mediated proteolytic peptides from mouse htau transgenic brain lysate digestion identified by nLC-MS/MS. ............................. 113
3-4 Selected rat Tau-776 peptides identified from conditioned primary CTX culture media by nLC-MS/MS. .......................................................................... 114
3-5 Global Homo sapiens database search using in vitro calpain-mediated tau-441 digested sample. ....................................................................................... 115
4-1 Identification of TBI-induced proteolytic peptides from mouse CCI cortex sample ultrafiltrate by nLC-MS/MS. .................................................................. 170
4-2 Identification of TBI-induced phosphorylated peptides from mouse CCI cortex sample ultrafiltrate by nLC-MS/MS. Adjacent amino acid are shown in brackets ............................................................................................................ 171
5-1 Brain proteins identified exclusively from human TBI-CSF ultrafiltrate samples by high resolution nLC-MS/MS. .......................................................... 205
5-2 Tau-441 proteolytic peptides identified from human TBI-CSF patients ultrafiltrate fractions by nLC-MS/MS. ................................................................ 206

10
LIST OF FIGURES
Figure page
1-1 Human brain tau protein isoforms ....................................................................... 40
1-2 Phosphorylation sites on tau protein and specific epitopes for tau antibodies .... 41
1-3 Tau phosphorylation events are sequential in the development of tau pathology ............................................................................................................ 42
1-4 Schematic of tau proteolysis and its role in tauopathies ..................................... 43
1-5 TBI-relevant pathways associated with neuronal death ...................................... 44
1-6 Workflow for peptidomics platforms, which are divided into five main steps compromising different types of methods. .......................................................... 45
2-1 OA induced tau hyperphosphorylation and oligomerization at different time points in mouse neuroblastoma N2a cells .......................................................... 73
2-2 Screening of protein kinase inhibitors on OA-induced tau hyperphosphorylation and oligomerization in N2a cells (with or without cell-death linked protease inhibitors (calpain/caspase inhibitors) .............................. 74
2-3 Dose-response of TBB on OA-induced tau hyperphosphorylation and oligomerization in N2a cells ................................................................................ 76
2-4 Screening of protein kinase inhibitors on basal tau phosphorylation in rat primary cortical neuronal culture (CTX) .............................................................. 77
2-5 Screening of protein kinase inhibitors on OA-induced tau hyperphosphorylation in rat primary cortical neuronal culture ............................ 79
2-6 Effect of combining protein kinase inhibitors on OA-induced tau hyperphosphorylation and oligomerization in N2a cells. ..................................... 81
2-7 Different effects of cyclosporine A on basal and OA-induced tau hyperphosphorylation in mouse N2a vs. rat CTX culture .................................... 83
3-1 Peptidomic sample preparation workflow for the nLC-ESI-MS/MS for the analysis of purified Tau protein, conditioned cell media, and mouse brain lysate ................................................................................................................ 116
3-2 Identification of calpain-mediated tau peptides by immunoblotting and mass spectrometry. .................................................................................................... 117
3-3 Identification of calpain-mediated phosphorylated tau peptides by immunoblotting and mass spectrometry ........................................................... 119
11
3-4 Identification of calpain-mediated tau peptides from transgenic htau mouse brain lysate by immunoblotting and mass spectrometry ................................... 121
3-5 Composite summary of calpain-mediated tau proteolytic peptides and phosphorylation sites. ....................................................................................... 123
3-6 View of a customized Peptigram peptide alignment map compiled from tau, p-tau, and mouse brain lysate. ......................................................................... 125
3-7 Basal and OA-induced tau proteolysis following neurotoxin challenges in rat cerebrocortical neurons .................................................................................... 126
3-8 Identification of tau neuropeptides from conditioned media following neurotoxin challenges in rat cerebrocortical neurons. ...................................... 128
3-9 Composite summary of tau proteolytic peptides and phosphorylation sites from CTX conditioned cell media ...................................................................... 130
3-10 Tau protein sequence alignments of rat and human ......................................... 131
3-11 Representative tau-441 sequences coverage of the human protein (P10636-8) detected........................................................................................................ 132
3-12 Representative tau-776 sequences coverage of the human protein (P10636-9) detected........................................................................................................ 133
3-13 Product ion spectrum of the tau peptide AEPRQEFEVMEDHAGTYG released from calpain-1 digestion ..................................................................... 134
3-14 Product ion spectrum of the tau peptide SPRHLSNVSSTGSIDMVDSPQLA released from calpain-1 digestion ..................................................................... 136
3-15 Product ion spectrum of the rat tau peptide PRHLSNVSSTGSIDMVDSPQLA released from conditioned cell media of primary cerebrocortical cultures ........ 138
3-16 Product ion spectrum of the phosphorylated tau peptide STGSIDMVDSPQLA released from calpain-1 digestion ..................................................................... 140
3-17 Human tau-441 and tau-776 isoforms amino acid sequence alignments. Human tau-441 is in the top lane while tau-776 is on the bottom lane ............. 142
3-18 Comparison between targeted database search against Human tau-441 versus Homo sapiens proteome ....................................................................... 143
4-1 Peptidomic sample preparation workflow for the nano-LC-ESI-MS/MS for the analysis after CCI treatment to htau mouse brain ............................................. 172
4-2 Characterization of tau phosphorylation, oligomerization, and fragments formation in ipsilateral and contralateral mouse cortical mouse lysate ............. 173
12
4-3 Additional characterization of tau phosphorylation, oligomerization, and fragments formation in ipsilateral and contralateral mouse cortical mouse lysate after TBI ................................................................................................. 176
4-4 Assessment of cell injury using α-spectrin antibody in ipsilateral and contralateral mouse cortical mouse lysate after TBI ......................................... 178
4-5 Representative TIC-LC chromatogram for peptides isolated from ipsilateral (IC) and contralateral (CC) mouse brain cortex lysate using peptidomic workflow. .......................................................................................................... 179
4-6 Representative TIC-LC chromatogram for peptides isolated from ipsilateral (IC) mouse brain cortex lysate using peptidomic workflow ............................... 180
4-7 Tau-441 sequences coverage (P10636-8) highlighting the peptides and phosphorylation sites detected ......................................................................... 181
4-8 Tau-758 sequences coverage (P10636-1) highlighting the peptides and phosphorylation sites detected ......................................................................... 182
4-9 Top PSM TBI-induced tau peptides from mouse brain lysate ........................... 183
4-10 Schematic representation for the TBI-generated tau peptides recovered from ultrafiltrate fractions .......................................................................................... 184
4-11 Selected TBI-induced tau peptides from mouse brain lysate based on Intensity ............................................................................................................ 185
4-12 Product ion spectrum of the tau peptide EIPEGTTAEEAGIGDTPSLEDEAAGHVTQA released from TBI-induced mouse brain ...................................................................................................... 186
4-13 Product ion spectrum of the tau peptide NVSSTGSIDMVDSPQLATLADEVSASLAKQGL released from TBI-induced mouse brain ...................................................................................................... 188
4-14 Product ion spectrum of the tau peptide SPQLATLADEVSASLAKQGL released from TBI-induced mouse brain. .......................................................... 190
4-15 Product ion spectrum of the tau peptide NVSSTGSIDMVDSPQLATLADEVSASLAKQGL released from TBI-induced mouse brain ...................................................................................................... 192
4-16 Venn diagrams comparing TBI-induced tau peptides with naive and phosphorylated versus non-phosphorylated peptides ...................................... 193
4-17 Composite summary of tau proteolytic peptides from TBI mouse brain samples ............................................................................................................ 194

13
4-18 View of a customized peptigram peptide alignment map from tau, p-tau, mouse brain lysate, and CCI mouse peptides .................................................. 195
5-1 The plot for the concentration of CSF total tau in control patients (n=10) and the clinically diagnosed patients with TBI (n=12) .............................................. 207
5-2 Human CSF profile of tau phosphorylation (intact and oligomeric) for TBI and control patients ................................................................................................ 208
5-3 Schematic representation for TBI-generated tau proteolytic peptides recovered from CSF ultrafiltrate fractions ......................................................... 210
5-4 Tau-441 sequences coverage (P10636-8) highlighting the peptides and phosphorylation sites detected from TBI-CSF patients. .................................... 211
5-5 Product ion spectrum of the tau peptide AEPRQEFEVMEDHAGTYGLGDRKDQGGYT released in CSF samples in TBI subjects. ..................................................................................................... 212
5-6 Product ion spectrum of the tau peptide AGTYGLGDRKDQGGYTMHQD released in CSF samples in TBI subjects. ........................................................ 214
5-7 Product ion spectrum of the tau peptide TREPKKVAVVRT released in CSF samples in TBI subjects. ................................................................................... 216
5-8 Product ion spectrum of the tau peptide KNVKSKIGSTENL released in CSF samples in TBI subjects. ................................................................................... 218
5-9 Product ion spectrum of the tau peptide MVDSPQLATLA released from TBI-induced mouse brain. ....................................................................................... 220
14
LIST OF ABBREVIATIONS
3R Three Tau Domain Binding Regions
4R Four Tau Domain Binding Regions
a.a. Amino Acid
abl Abelson Murine Leukemia Protein
AD Alzheimer’s Disease
AKT Serine/Threonine-Specific Protein Kinase B
AP Alkaline phosphatase
ATP Adenosine Triphosphate
Aβ Amyloid Β
BBB Blood-Brain Barrier
BCIP 5-Bromo-4-Chloro-3-Indolyl Phosphate
BDP Breakdown Product
BEH Ethylene Bridged Hybrid
BME Beta-Mercaptoethanol
CaM Calcium-Modulated Protein
CaMKII Ca2+/Calmodulin-Dependent Protein Kinase II
cAMP 3’,5’- Cyclic Adenosine Monophosphate
CC Contralateral Cortex
CCI Control Cortical Impact
CD Circular Dichroism
CDK5 Cyclin-Dependent Kinase 5
cDNA Complementary Deoxyribonucleic Acid
CID Collision-Induced Energy
CKII Casein Kinase Ii
15
CNS Central Nervous System
CsA Cyclosporine A
CSF Cerebrospinal Fluid
CT Computed Tomography
c-tau Cleaved-Tau
CTE Chronic Traumatic Encephalopathy
CTX Primary Cerebrocortical Neuron Culture
D1 Day 1 After Control Cortical Impact
D3 Day 3 After Control Cortical Impact
D7 Day 7 After Control Cortical Impact
DDA Data-Dependent Acquisition
Delta CN Delta Correlation
DMEM Dulbecco's Modified Eagle Medium
DMSO Dimethyl Sulfoxide
DTT Dithiothreitol
EGFP Enhanced Green Fluorescent Protein
ELISA Enzyme-Linked Immuno-Sorbent Assay
ERK Extracellular Signal-Regulated Kinase
ESI Electrospray Ionization
ESI-MS Electrospray Ionization Mass Spectrometry
ETD Electron Transfer Dissociation
eV Electron Volts
FBS Fetal Bovine Serum
FDR False Discovery Rate
FPI Fluid Percussion Injury
16
FTD Frontotemporal Dementia
FTIR Fourier-Transform Infrared Spectroscopy
Fyn Proto-Oncogene Tyrosine-Protein Kinase Fyn
GFAP Glial Fibrillary Acidic Protein
GSK3 Glycogen Synthase Kinase-3
HCD High-Energy Collisional Dissociation
HMW High Molecular Weight
htau Human Tau
IC Ipsilateral Cortex
IC50 The Half Maximal Concentration
IgG Immunoglobin G
K Kilo Dalton
kDa Kilo Dalton
Ki The Inhibitory Constant
LIT Linear Ion Trap
LMW Low Molecular Weight
MALDI Matrix-Assisted Laser Desorption Ionization
MAP Microtubule-Associated Protein
MAPKs Microtubule Associated Protein Kinases
MAPT Microtubule-Associated Protein Tau
MARK Microtubule-Associated Serine/Threonine-Protein Kinase
MBD Microtubule Binding Domain
MRI Magnetic Resonance Imaging
MRM Multiple Reaction Monitoring
MTBD Microtubule Tau Binding Domain
17
mTBI Mild Traumatic Brain Injury
MWCO Molecular Weight Cut-Off
N2a Mouse Neuroblastoma-2a Cells
NBT Nitro Blue Tetrazolium
NFT Neurofibrillary Tangles
nLC-ESMS/MS
Nano Liquid Chromatography-Tandem Mass Spectrometry
NMDA N-Methyl-D-Aspartate
NMDAR N-Methyl-D-Aspartate Receptor
NMR Nuclear Magnetic Resonance
OA Okadaic Acid
OptiMEM Reduced-Serum Minimal Essential Medium
p38 P38-Mitogen-Activated Protein Kinase
PAC Puromycin N-Acetyltransferase
PCS Post-Concussive Syndrome
PEP Posterior Error Probability
PHFs Pair Helical Filaments
PKA Protein Kinase A
PKB Protein Kinase B
PKC Protein Kinase C
PP1 Protein Phosphatase 1
PP2A Protein Phosphatase 2a
PP3 Protein Phosphatase 3
PSM Peptide Sequence Matches
PSP Progressive Supra Nuclear Palsy
18
PVDF Polyvinylidene Difluoride
rCHI Repeated Closed Head Injury
r-mTBI Repetitive Mild Traumatic Brain Injuries
RP-UPLC Reverse Phase-Ultrahigh Pressure Liquid Chromatography
SBDP αII-Spectrin Breakdown Product
SDS-PAGE Sodium Dodecyl Sulfate–Polyacrylamide Gel Electrophoresis
Ser Serine
ST Straight Filament
STS Staurosporine
Tau-BDP Tau-Breakdown Product
TBB 4,5,6,7-Tetrabromo-2-Azabenzimidazole
TBDP Tau-Breakdown Product
TBI Traumatic Brain Injury
TBST Tris-Buffered Saline-Tween
TDP 43 TAR-DNA-Binding Protein 43
Thr Threonine
TIC Total Ion Current
UCH-L1 Ubiquitin Carboxyl-Terminal Esterase L1.
UPLC Ultra-High-Pressure Liquid Chromatography
XCorr X Correlation
Z-DCB Z-Asp-2,6-Dichlorobenzoyloxymethyl Ketone
19
Abstract of Dissertation Presented to the Graduate School of the University of Florida in Partial Fulfillment of the Requirements for the Degree of Doctor of Philosophy
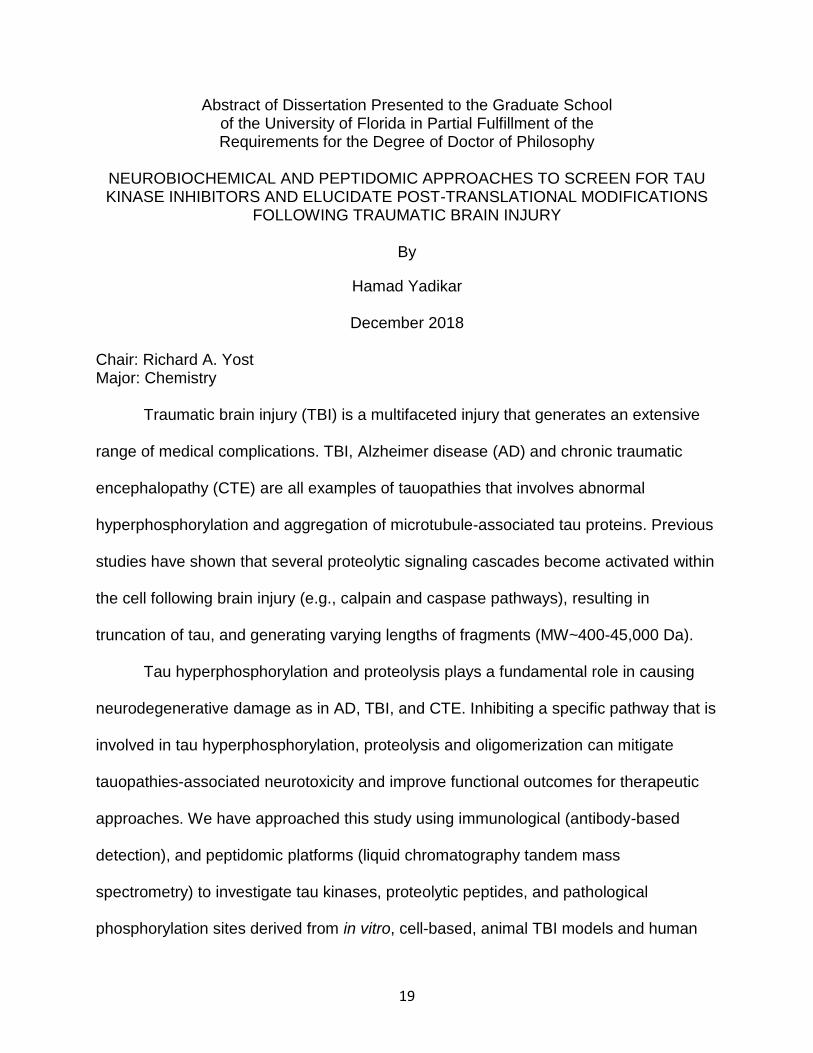
NEUROBIOCHEMICAL AND PEPTIDOMIC APPROACHES TO SCREEN FOR TAU KINASE INHIBITORS AND ELUCIDATE POST-TRANSLATIONAL MODIFICATIONS
FOLLOWING TRAUMATIC BRAIN INJURY
By
Hamad Yadikar
December 2018
Chair: Richard A. Yost Major: Chemistry
Traumatic brain injury (TBI) is a multifaceted injury that generates an extensive
range of medical complications. TBI, Alzheimer disease (AD) and chronic traumatic
encephalopathy (CTE) are all examples of tauopathies that involves abnormal
hyperphosphorylation and aggregation of microtubule-associated tau proteins. Previous
studies have shown that several proteolytic signaling cascades become activated within
the cell following brain injury (e.g., calpain and caspase pathways), resulting in
truncation of tau, and generating varying lengths of fragments (MW~400-45,000 Da).
Tau hyperphosphorylation and proteolysis plays a fundamental role in causing
neurodegenerative damage as in AD, TBI, and CTE. Inhibiting a specific pathway that is
involved in tau hyperphosphorylation, proteolysis and oligomerization can mitigate
tauopathies-associated neurotoxicity and improve functional outcomes for therapeutic
approaches. We have approached this study using immunological (antibody-based
detection), and peptidomic platforms (liquid chromatography tandem mass
spectrometry) to investigate tau kinases, proteolytic peptides, and pathological
phosphorylation sites derived from in vitro, cell-based, animal TBI models and human

20
cerebrospinal fluid TBI samples. From our immunoblotting analysis, we have identified
novel tau kinase inhibitors (TBB and Saracatinib), hyperphosphorylation of tau sites
(e.g., pSer202, pSer396, and pSer404), and high molecular weight proteolytic fragments
following neurotoxic conditions and animal models of TBI.
As for peptidomic analysis, we subjected the samples to ultrafiltration (10 kDa
molecular weight cut-off value), and the filtrates were analyzed using nLC-nESI-MS/MS.
Using our peptidomic approach, we were able to identify novel calpain tau cleavage
sites including G19↓L20, Q49↓T50, A89↓A90, Q124↓E125, and Thr720↓Ser721 following in vitro
digestion. We also able to identify low molecular weight calpain-mediated tau peptides
including N-terminal peptide AEPRQEFEVMEDHAGTYG and C-terminal peptides
SPRHLSNVSSTGSIDMVDSPQLATLADEVS, and STGSIDMVDSPQLA in an in vitro
and in vivo animal TBI models. As for human cerebrospinal fluid samples, we were able
to observe an increase in tau phosphorylation with TBI subjects. We identified the N-
terminal peptide AEPRQEFEVMEDHAGTYGLGDRKDQGGYT that was detected in a
truncated form in the in vitro analysis of tau. Monitoring a subset of these targets
generated from TBI and the accompanied bio-fluid might provide biomarker utilities and
applied as a potential “theranostic” tool in augmenting the clinical trials for new TBI drug
development.
21
CHAPTER 1 LITERATURE REVIEW
Traumatic Brain Injury (TBI)
Traumatic brain injury (TBI) results from changes in brain function caused by
external mechanical or physical force applied to the head, leading to brain tissue
injury.(1) Examples of TBI causes include blast waves, acceleration/deceleration forces,
or penetration by a projectile such as a bullet or vehicle accidents.(2) TBI is the most
usual cause of trauma-related death and disabilities in young adults, associated mostly
with male individuals.(3)
More than 300,000 of the deployed troops in the military service have
experienced TBI from wars and military training from 2000 to 2014(1). Many military
veterans have experienced short and long-term post-TBI or post-concussive
symptoms(2, 4-6). Around half of the estimated 1.9 million Americans who were
exposed to TBI each year suffer at least certain short-term disabilities (1, 2, 7).
Moreover, TBI has been a primary cause of mortalities and disabilities around the
world with the incidence rate of ~ 10 million people(1, 2). TBI can be categorized into
direct brain injuries (in which an object breaks through the skull and dura) and closed-
head injuries (in which the brain skull and dura remains undamaged)(1). TBI can also
be classified based on the severity of the damage into mild, moderate and severe,
depending on several medical conditions such as length of injury, the severity of
consciousness, the occurrence of amnesia, neurological pathologies and medical
reports of brain imaging (e.g., CT or MRI)(7, 8).
Mild TBI (m-TBI) and concussions are terms used to define the least severe
class of TBI, and they embody 80-90% of incidents (8, 9). Symptoms of mild TBI have a
22
wide range of variability. Physical symptoms include nausea, vomiting, dizziness,
headache, while cognitive symptoms include poor concentration, memory
complications, behavioral changes and loss of consciousness(10). More than 70% of
mild TBI patients can recover in 7-10 days(8). About 20% may develop long-term
neurobehavioral, psychiatric or substance abuse complications that may enhance their
vulnerability to TBI and extend the healing process(11-13). Cases, where symptoms
continue for more than three months, are diagnosed with Post-Concussive Syndrome
(PCS) (10, 14). The symptoms of PCS are unpredictable and heterogeneous, which
creates problems in diagnosing the condition. Moreover, reports estimated that 10-20%
of TBI patients develop concussion(15).
Chronic Traumatic Encephalopathy (CTE)
TBI is one of the top recognized risk factors for chronic traumatic encephalopathy
(CTE) and Alzheimer’s disease (AD). CTE is a class of neurodegenerative tauopathy,
found in individuals who experienced repetitive mild traumatic brain injuries (r-mTBI) .
Tauopathy is a class of neurodegenerative disorders linked with hyperphosphorylated
tau and insoluble aggregation leading to the formation of neurofibrillary tangles
(NFT)(16). Tauopathies also occur in Alzheimer disease, frontotemporal dementia
(FTD), progressive supranuclear palsy (PSP), cerebrocortical degeneration, Pick’s
disease, and argyrophilic grain disease(16-18).
CTE is mostly associates with athletes who took part in contact sports including
American football, ice hockey, wrestling, rugby, boxing, and soccer. Other risk factors
are the military association, local violence, and multiple head accidents(19-22).
Symptoms of CTE categorize into four phases, which mostly show 8-10 years after
exposure to r-mTBI(23-25). The first phase of symptoms consists of attention deficit
23
hyperactivity disorder, behavioral changes, mental confusion, dizziness, headaches,
and disorientation. The second phase of symptoms includes memory loss, social
behavior unpredictability, and weak judgment. Third and fourth phases of CTE
symptoms include dementia, decreased mental abilities, movement disorder, deafness,
dizziness, depression, ocular abnormalities, Parkinsonism, and suicidality(19, 23-26).
CTE has a unique neuropathological appearance compared to other tauopathies,
such as AD(23, 27). CTE and AD do share a similar ratio of tau isoforms and
phosphorylation state(24). The four phases of CTE symptoms have been linked with tau
pathology in brain tissue, starting in severity from focal perivascular epicenters of
neurofibrillary tangles (NFT) in the front region of the cortex to severe tauopathy
affecting several parts of the brain. On a molecular level, the neuropathology includes
neuronal loss, microtubule-associated tau protein accumulation, TAR-DNA-binding
protein 43 (TDP-43) deposit formation, alternation in white matter, and other defects.
One major hallmark of tauopathies is the presence of hyperphosphorylated tau protein
that is vulnerable to aggregation, leading to the formation of NFT deposits (16). Up to
the present time, CTE pathology has been recognized exclusively in patients with a
history of TBI(26).
Despite the progress in characterizing CTE neuropathology, CTE is still
unknown. The main reason behind this ambiguity is due to the heterogeneity of CTE
clinical features and neuropathological presentation(26). Animal studies are being
conducted to understand CTE and r-mTBI; however, several studies have not been
successful in elucidating tau pathology seen in CTE(16, 25).
24
Comprehensive diagnosis standards for CTE need to be established in the
medical and scientific fields(28). There is still on-going research to develop diagnostic
methodologies to CTE in living people and to have a better understanding of the
possible consequences of the exposure to brain injury. Thus far, all medical evidence
associated with CTE have been collected from post-mortem autopsy of people that
have been exposed to head trauma and consist of macroscopic (gross anatomical) and
microscopic (cellular and molecular) neuropathologies (28, 29).
The Gross anatomical abnormalities from the autopsy of brains are consistent
with the primary physical manifestations of CTE(23, 30, 31). The physical signs consist
of overall shrinkage in the mass of the brain, atrophy of the frontal, temporal cortices
and medial temporal lobe, enlargement of the ventricles, anterior cavum septi pellucidi,
posterior fenestrations, pallor of the substantia nigra, and locus ceruleus (23, 25, 30).
Moreover, as CTE advances, atrophy of the hippocampus entorhinal cortex and
amygdala may be developed (23). The abnormalities linked with CTE during post-
mortem examination consist of multiple histological features that reflect extracellular and
intercellular biological mechanisms of neurodegeneration(25).
The Role of Tau Protein in Cellular Functions and Dysfunctions
Microtubule-associated protein tau (MAPT) is encoded by a single gene on
chromosome 17q21.31, crossing 16 exons. Exon 2, 3, and 10 of the MAPT gene are
alternatively spliced to generate six different tau isoforms in the human brain tissue(32,
33). Tau protein is found predominantly in neurons relative to non-neuronal cells(34,
35). While tau is mainly found in the cytoskeletal axons of neurons, it can also localize
to the nucleus, plasma membranes, and post-synaptic clefts depending on cell
requirements(5, 17, 25, 36-38).
25
Tau primary function is to bind the microtubule and assist its stabilization and
depolymerization (39). Tau modulates microtubule stability by interacting with tubulin
and promotes its assembly(39). Tau has two significant ways of controlling microtubule
stability: phosphorylation and isoforms. In a normal healthy brain, other microtubule-
associated proteins (MAPs) might be able to compensate for tau function because tau
knockout mice studies did not show significant defects in brain morphology(39). Tau has
several other roles including axonal transport, regulation of actin and neurite
outgrowth(27, 32, 36, 37, 39-41). Moreover, tau can bind to heat shock proteins and be
involved in proteasomal degradation(27).
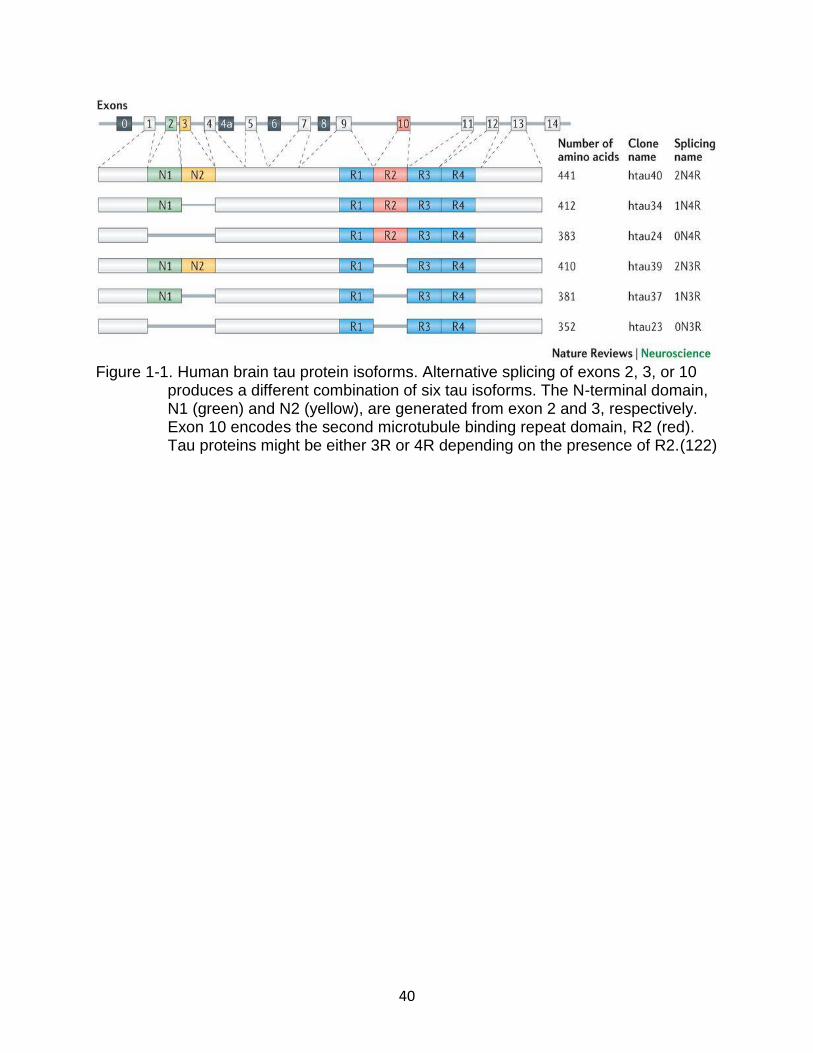
Tau Structure
Tau consists of four functional domains including N-terminal domains (0N, 1N, or
2N inserts), the proline-rich domain, the microtubule-binding domain (MBD) with
conservative and repetitive sequences, and the C-terminal domain (Figure 1-1)(34).
Three isoforms consist of three binding regions (3R), and the other three isoforms
comprise four binding regions (4R)(39). Tau isoforms are expressed differentially during
development with the fetal brain has the shortest isoform of tau (0N3R), while all six tau
isoforms are expressed by tau genes in the adult human brain (0N2R, 1N3R, 2N3R,
0N4R)(35, 42).
Tau is a hydrophilic protein with a net basic charge(43). The carboxy-terminus of
tau protein has the binding domains and contain most of the positively charged amino
acid residues(43). The positively charged Lys residues of the binding domain allow tau
to bind the negatively charged microtubule and maintain it in the stabilized form(41).
This ionic property might cause tau to dissociate from the microtubule as it becomes
hyperphosphorylated by kinases(42). Most tau mutations found in tauopathies decrease

26
tau affinity to bind microtubule and occur in MBD(41). However, it is not proven that
these mutations cause disease, or directly associated with tauopathies(44). On the
other hand, the N-terminal domain consists of acidic amino acid residues that interact
with non-microtubular proteins(39). The isoforms with the four binding domains have
improved stabilization of microtubule compared to those with the three binding
domains(45).
Tau in solution behaves as an intrinsically disordered protein(42). A variety of
probing techniques used to include circular dichroism (CD), Fourier transform infrared
spectroscopy (FTIR), X-ray diffraction, fluorescence, and other analytical methods
suggest that this protein behave as a dynamic coil, lacking a well-characterized
secondary and tertiary structure(42). The NMR data show that 343 out of 441 amino
acids of human tau lack any ordered structure(46). Six small stretches of tau sequence
show the ability to form β-strands, while three segments of tau display poly-proline
helices. Two tau segments of 10 amino acids (114-123 and 428-437) in the N-terminal
and C-terminal domains can form α-helix structures(35, 42, 47, 48).
Tau has a highly dynamic secondary and tertiary structure, compromising many
conformations under normal and pathological conditions and a complex network of
contact with a wide range of transient proteins (35, 42, 49). Tau proteins can also
assemble into dimers, oligomers and form large polymers(42). Cysteine residues
located at the microtubule-binding domain (MTBD) of the tau protein assist the
processes of dimerization and oligomerization(50). However, polyanionic compounds
such as heparin can accelerate the formation of tau aggregates, and not necessarily
need cysteine-cysteine bridges(35, 42, 51, 52). Tau dimerization and oligomerization
27
are suggested to be toxic; yet, there is some evidence suggesting that tau trimers are
the species inducing the toxicity(42). Tau monomers can self-assemble in an anti-
parallel arrangement, through MTBDs. Tau fragments that have MTBDs can assemble
into a fibrillary polymeric structure. Small peptide fragment of only six amino acid
residues having the MTBD can form paired helical filaments (PHF)(35, 42).
Tau Post-Translational Modification
Tau undergoes a variety of post-translational modifications occurring at many
sites along the protein, with most studies focusing on tau phosphorylation(41). Human
tau protein consists of 79 possible phosphorylation sites (serine, tyrosine, and
threonine) on the longest isoform, mostly located in the proline-rich region and the C-
terminal domain(35, 37, 39, 53). At least 30 of these tau sites are phosphorylated by
kinases including: glycogen synthase kinase 3β (GSK3 β), cyclin-dependent kinase 5
(CDK5) casein kinase II (CKII), the mitogen-activated protein kinases (MAPKs),
extracellular signal-regulated kinase (ERK), p38, Jun N-terminal kinase (JNK),
Ca2+/calmodulin-dependent protein kinase II (CaMKII), microtubule-affinity regulating
kinase (MARK), protein kinase A (PKA), protein kinase C (PKC), and tyrosine kinases
including Src kinase family (Src, Fyn and c-abl) (Figure 1-2) (35-37, 53-56).
Brain development regulates tau phosphorylation such as that fetal tau is more
phosphorylated in the embryonic central nervous system (CNS) compared to adult
tau(57, 58). The level of tau phosphorylation lessens in all six isoforms with age
because of the activation of phosphatases(37, 43, 57-60). Phosphatases participate in
controlling tau dephosphorylation on specific amino acid residues, affecting its ability to
associate with the microtubules(17, 35, 39). Reduction of tau phosphatases activity may
lead to tau hyperphosphorylation instead of increased kinase activity.(61)

28
Protein phosphatase 2A (PP2A) is responsible for approximately 70% of tau
dephosphorylation in the human brain(62). PP2A activity is reduced in AD patients
compared to control subjects(62, 63). It is considered normal to have 2-3 phosphate
molecules per one tau molecule. However, when phosphate molecules exceed 7-8 on
one tau molecule, tau might be regarded as hyperphosphorylated(64). Tau toxicity is
more likely to be reflected on specific phosphorylation sites rather than the number of
residues that are phosphorylated(62, 63, 65, 66).
As stated above, tau hyperphosphorylation is one major hallmark of tauopathies
such as CTE and AD. The process of tau hyperphosphorylation alone can cause the
protein aggregation, insoluble PHF formation, and bundling of straight filaments (SF)
into NFT(64). NFT play a pivotal role in initiating several neurodegenerative metabolic
disorders(67). Studies have shown that TBI is associated with a hyperphosphorylated
tau(16, 17, 23, 25). The exact mechanism of tangle development is not fully yet
understood, and it remains controversial as to whether these tangles play a primary role
in the disease development or more of a secondary role(27).
There have been unbiased strategies to study the effect of human kinases ability
to phosphorylate tau at multiple sites linked with AD(68). Approximately 45
phosphorylation sites on tau have been linked with AD pathology (59, 69). The reported
phosphorylation sites are not always universal, but several research groups reported
Ser195, Ser202, Thr205, Thr231, Ser235, Ser396 and Ser404 as possible tau pathological
phosphorylation sites (Figure 1-2) (58, 69, 70). Many of the diseased phosphorylation
sites reported leads to attenuation of tau-microtubule assembly, promoting aggregation
process. Furthermore, dissociated tau has increased vulnerability to proteolytic
29
cleavage by calpain or caspase producing peptide fragments that are susceptible to
aggregation(71).
Several antibodies-based approaches have been conducted to associate specific
phosphorylation site(s) on tau protein with the state of disease. Filamentous tau is
observed immunohistochemically by antibodies that recognize phosphorylated tau
residues. Moreover, tau phospho-antibodies can be utilized for early detection of
pathological tau, before accumulating into the toxic NFT deposits. Antibodies raised
against a specific phosphorylated residue of tau are a precious tool to be utilized in
laboratory and pre-clinical research. It is essential to validate the specificity of these
antibodies using other analytical techniques such as immunoassays for robust and
reliable detection(16, 17, 27, 30, 39, 41).
Other tau post-translational modifications (PTMs) include acetylation,
glycosylation, deamidation, sumoylation, ubiquitination, polyamination, oxidation,
nitration, isomerization, and truncation(27). Several tau PTMs have been suggested to
be associated with the accumulation of pathological tau. For instance, tau oxidation
causes cross-linkages, aggregation and isomerization of the phosphorylated site Thr231
to cis isoform leading to decreased tau dephosphorylation, thereby reducing
microtubule binding and increasing susceptibility to aggregation(27). A study had shown
that introducing human tau oligomers into mouse brain caused diminished memory
consolidation(72). On the other hand, injecting monomeric tau or filamentous tau did not
induce neuronal loss or cognitive damage despite the progressive elevation of NFT
formation(73).
30
These tau pathologies have been linked with cases of single severe TBI, in
patients that have died from sustained concussions and in young military veterans with
a history of exposure to improvised explosive devices(4, 5, 27, 38). Tau pathology
research interest has been increasing, especially in animal models of single and r-mTBI,
and in the development of tau biomarkers for TBI and CTE(74).
Tau Proteolysis
TBI is linked with complex metabolic, biochemical and cellular dysfunctionalities
including ischemia, diffusion hypoxia, mitochondrial dysfunction, increased energy
demands, metabolites imbalances (from excitotoxicity), axonal and dendritic injuries,
neuroinflammation and neuroapoptosis (4, 27). Glutamate receptors subunits genes
were observed to be changed, which is critical because increased concentrations of
glutamate intracellularly can lead to increased production of Na2+ and Ca2+ in the
cytosol which activates protein calpain, resulting proteolysis of cytoskeletal proteins
including tau (Figure 1-4 and Figure 1-5)(75).
Tau can be proteolyzed by several proteases producing fragments of varied
sizes in vitro and in vivo. Tau proteolysis has newly generated research interest
because proteolytic tau fragments ability to contribute to aggregation process(43, 71,
76). Proteolytic fragments of tau have been detected in patients cerebrospinal fluid
(CSF) and plasma with various tauopathies, making them beneficial as biomarkers for
early disease detection(70, 71, 77, 78). Tau proteolytic fragments are classified by their
cleavage site in full-length tau, biological function, the protease involved, their use as a
biomarker and the associated disease. Many proteases cleave tau, a few fragments of
tau have been found with unknown protease(79).
31
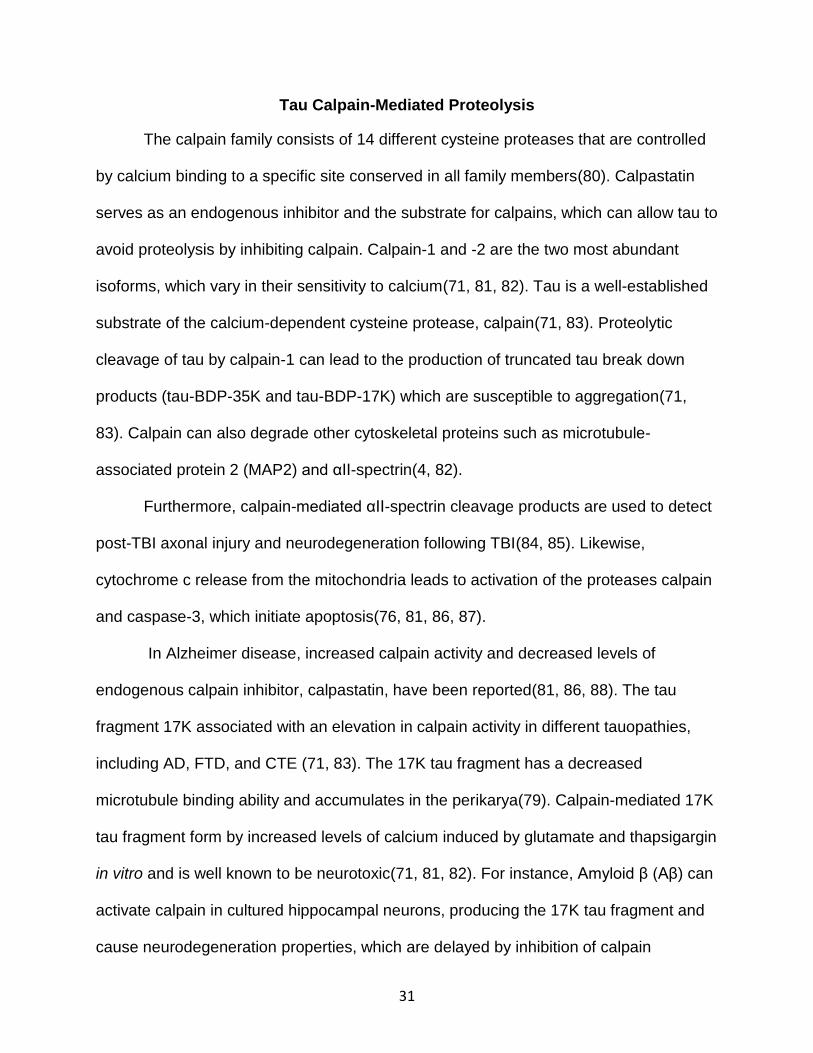
Tau Calpain-Mediated Proteolysis
The calpain family consists of 14 different cysteine proteases that are controlled
by calcium binding to a specific site conserved in all family members(80). Calpastatin
serves as an endogenous inhibitor and the substrate for calpains, which can allow tau to
avoid proteolysis by inhibiting calpain. Calpain-1 and -2 are the two most abundant
isoforms, which vary in their sensitivity to calcium(71, 81, 82). Tau is a well-established
substrate of the calcium-dependent cysteine protease, calpain(71, 83). Proteolytic
cleavage of tau by calpain-1 can lead to the production of truncated tau break down
products (tau-BDP-35K and tau-BDP-17K) which are susceptible to aggregation(71,
83). Calpain can also degrade other cytoskeletal proteins such as microtubule-
associated protein 2 (MAP2) and αII-spectrin(4, 82).
Furthermore, calpain-mediated αII-spectrin cleavage products are used to detect
post-TBI axonal injury and neurodegeneration following TBI(84, 85). Likewise,
cytochrome c release from the mitochondria leads to activation of the proteases calpain
and caspase-3, which initiate apoptosis(76, 81, 86, 87).
In Alzheimer disease, increased calpain activity and decreased levels of
endogenous calpain inhibitor, calpastatin, have been reported(81, 86, 88). The tau
fragment 17K associated with an elevation in calpain activity in different tauopathies,
including AD, FTD, and CTE (71, 83). The 17K tau fragment has a decreased
microtubule binding ability and accumulates in the perikarya(79). Calpain-mediated 17K
tau fragment form by increased levels of calcium induced by glutamate and thapsigargin
in vitro and is well known to be neurotoxic(71, 81, 82). For instance, Amyloid β (Aβ) can
activate calpain in cultured hippocampal neurons, producing the 17K tau fragment and
cause neurodegeneration properties, which are delayed by inhibition of calpain

32
activation(81, 89). Surprisingly, other studies have shown that the 17K tau does not
cause toxicity in vitro and is expressed equally in the brain of AD and normal healthy
control samples(89-92).
Additionally, calpain is an upstream activator of extracellular-regulated kinase
(ERK), which can phosphorylate tau protein(79). Increase in ERK expression leads to
early accumulation of tau in neurons and glia in various tauopathies(93-95). Although
the function of calpain-generated 17K tau fragment in neurodegeneration is
controversial, increase in calpain activity and 17K tau breakdown products are
recognized in human tauopathies. TBI can initiate the production of calpain-mediated
17K tau fragment by increasing calcium leak from dysfunctional organelles leading to
calpain activation and tau cleavage. The susceptibility of tau to calpain and caspase-3
under neurotoxic and neurodegenerative environments has been examined(71). We
have initially reported three novel calpain cleavage sites in rat tau (4-repeat isoform) as
Ser130/Lys131, Gly157/Ala158, and Arg380/Glu381. We built fragment-specific antibodies to
target tau break down products (TBDP)-35K and TBDP-45K(71). We showed that tau
was degraded in injured rat cortex following TBI in vivo to BDPs of 45-42K, 35K. 25K
and 15K(71). Tau-BDP-35K-specific antibody confirmed these products in the injured
cortex. Intravenous administration of SNJ-1945 (calpain-specific inhibitor) inhibited the
production of tau-BDP-35K (71).
The Function of Tau proteolytic fragments in Disease
Tau fragments have been shown to grow and aggregate depending on their
amino acid sequence(35, 72). The protease-resistant PHFs and straight filaments (ST)
core of NFT are made up of tau fragments. Tau neurotoxic peptides usually have the
third and fourth repeat regions; however, the first and the second repeats might also be
33
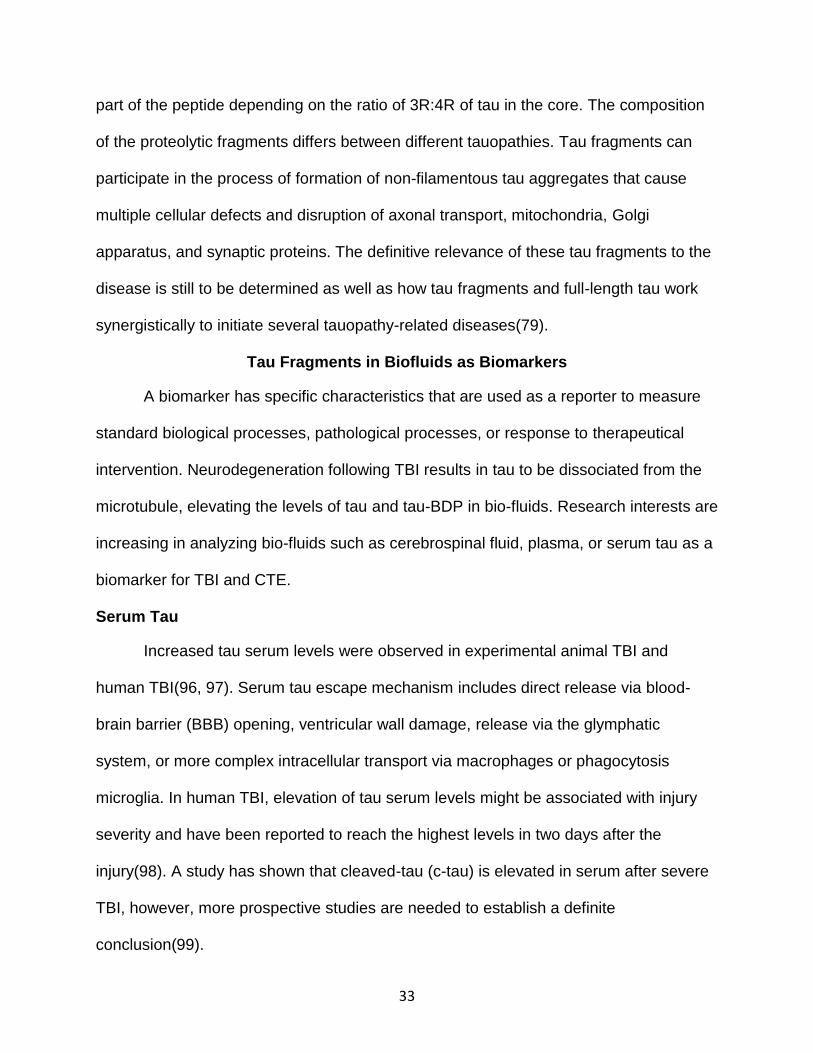
part of the peptide depending on the ratio of 3R:4R of tau in the core. The composition
of the proteolytic fragments differs between different tauopathies. Tau fragments can
participate in the process of formation of non-filamentous tau aggregates that cause
multiple cellular defects and disruption of axonal transport, mitochondria, Golgi
apparatus, and synaptic proteins. The definitive relevance of these tau fragments to the
disease is still to be determined as well as how tau fragments and full-length tau work
synergistically to initiate several tauopathy-related diseases(79).
Tau Fragments in Biofluids as Biomarkers
A biomarker has specific characteristics that are used as a reporter to measure
standard biological processes, pathological processes, or response to therapeutical
intervention. Neurodegeneration following TBI results in tau to be dissociated from the
microtubule, elevating the levels of tau and tau-BDP in bio-fluids. Research interests are
increasing in analyzing bio-fluids such as cerebrospinal fluid, plasma, or serum tau as a
biomarker for TBI and CTE.
Serum Tau
Increased tau serum levels were observed in experimental animal TBI and
human TBI(96, 97). Serum tau escape mechanism includes direct release via blood-
brain barrier (BBB) opening, ventricular wall damage, release via the glymphatic
system, or more complex intracellular transport via macrophages or phagocytosis
microglia. In human TBI, elevation of tau serum levels might be associated with injury
severity and have been reported to reach the highest levels in two days after the
injury(98). A study has shown that cleaved-tau (c-tau) is elevated in serum after severe
TBI, however, more prospective studies are needed to establish a definite
conclusion(99).
34
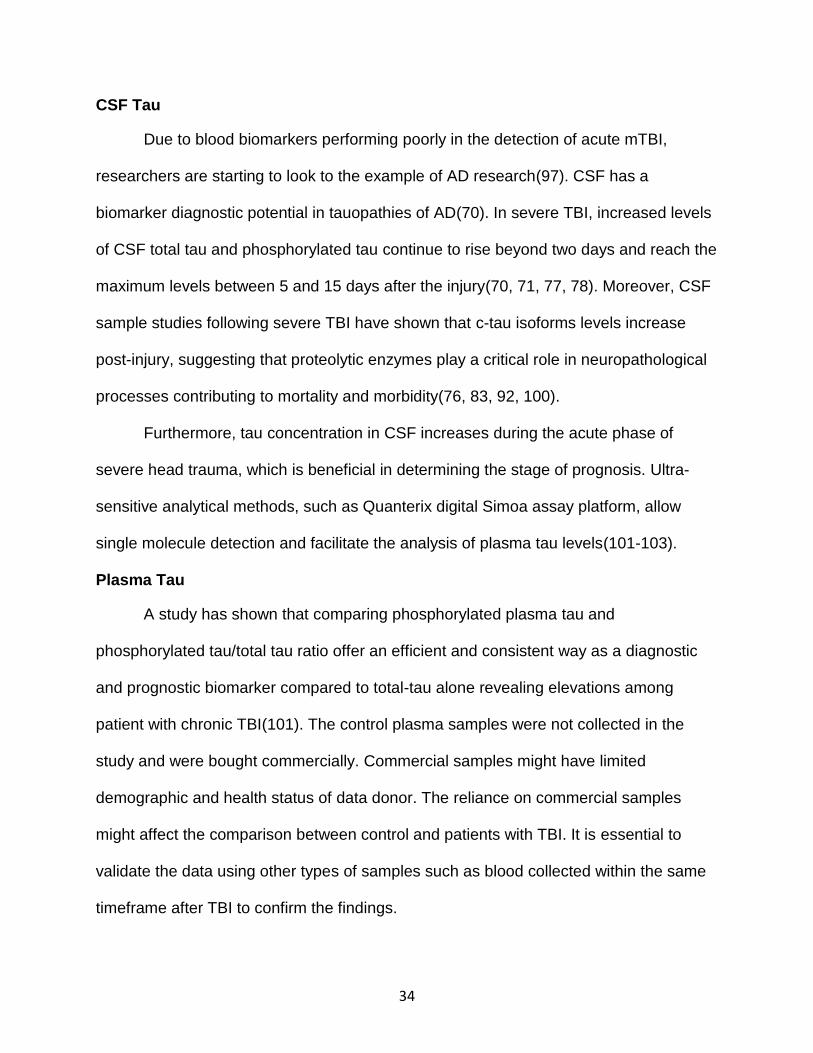
CSF Tau
Due to blood biomarkers performing poorly in the detection of acute mTBI,
researchers are starting to look to the example of AD research(97). CSF has a
biomarker diagnostic potential in tauopathies of AD(70). In severe TBI, increased levels
of CSF total tau and phosphorylated tau continue to rise beyond two days and reach the
maximum levels between 5 and 15 days after the injury(70, 71, 77, 78). Moreover, CSF
sample studies following severe TBI have shown that c-tau isoforms levels increase
post-injury, suggesting that proteolytic enzymes play a critical role in neuropathological
processes contributing to mortality and morbidity(76, 83, 92, 100).
Furthermore, tau concentration in CSF increases during the acute phase of
severe head trauma, which is beneficial in determining the stage of prognosis. Ultra-
sensitive analytical methods, such as Quanterix digital Simoa assay platform, allow
single molecule detection and facilitate the analysis of plasma tau levels(101-103).
Plasma Tau
A study has shown that comparing phosphorylated plasma tau and
phosphorylated tau/total tau ratio offer an efficient and consistent way as a diagnostic
and prognostic biomarker compared to total-tau alone revealing elevations among
patient with chronic TBI(101). The control plasma samples were not collected in the
study and were bought commercially. Commercial samples might have limited
demographic and health status of data donor. The reliance on commercial samples
might affect the comparison between control and patients with TBI. It is essential to
validate the data using other types of samples such as blood collected within the same
timeframe after TBI to confirm the findings.
35
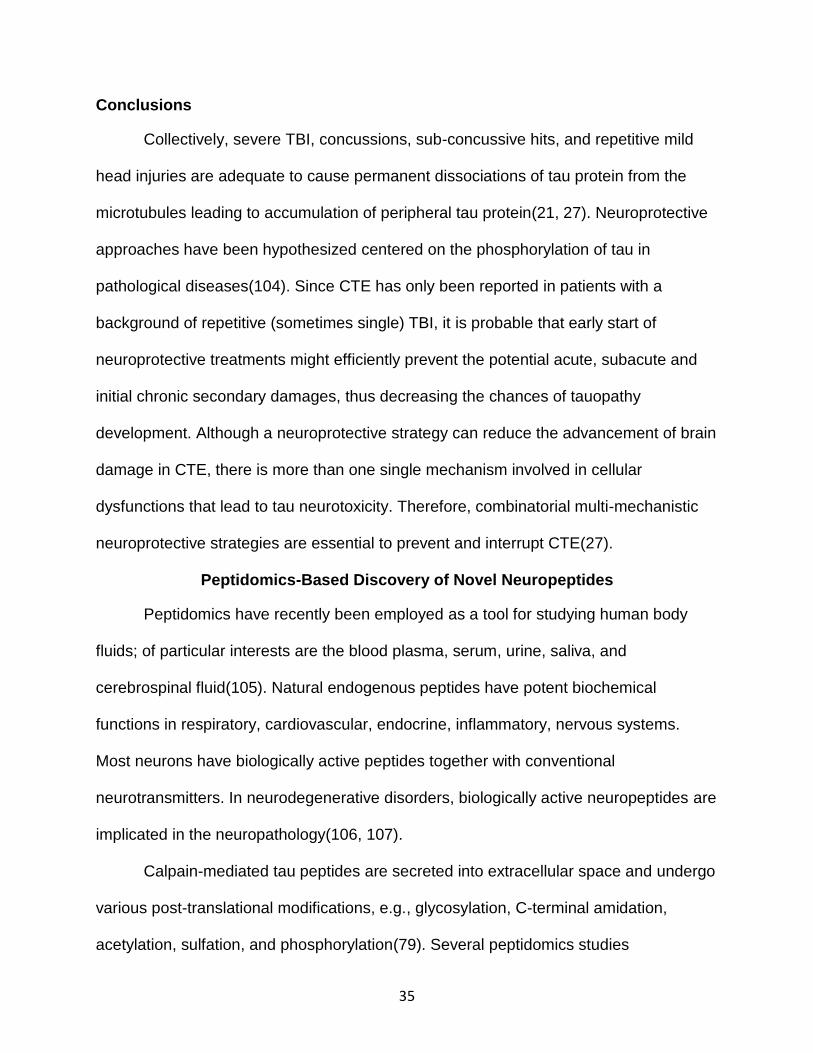
Conclusions
Collectively, severe TBI, concussions, sub-concussive hits, and repetitive mild
head injuries are adequate to cause permanent dissociations of tau protein from the
microtubules leading to accumulation of peripheral tau protein(21, 27). Neuroprotective
approaches have been hypothesized centered on the phosphorylation of tau in
pathological diseases(104). Since CTE has only been reported in patients with a
background of repetitive (sometimes single) TBI, it is probable that early start of
neuroprotective treatments might efficiently prevent the potential acute, subacute and
initial chronic secondary damages, thus decreasing the chances of tauopathy
development. Although a neuroprotective strategy can reduce the advancement of brain
damage in CTE, there is more than one single mechanism involved in cellular
dysfunctions that lead to tau neurotoxicity. Therefore, combinatorial multi-mechanistic
neuroprotective strategies are essential to prevent and interrupt CTE(27).
Peptidomics-Based Discovery of Novel Neuropeptides
Peptidomics have recently been employed as a tool for studying human body
fluids; of particular interests are the blood plasma, serum, urine, saliva, and
cerebrospinal fluid(105). Natural endogenous peptides have potent biochemical
functions in respiratory, cardiovascular, endocrine, inflammatory, nervous systems.
Most neurons have biologically active peptides together with conventional
neurotransmitters. In neurodegenerative disorders, biologically active neuropeptides are
implicated in the neuropathology(106, 107).
Calpain-mediated tau peptides are secreted into extracellular space and undergo
various post-translational modifications, e.g., glycosylation, C-terminal amidation,
acetylation, sulfation, and phosphorylation(79). Several peptidomics studies

36
characterizing CSF and blood plasma supplied alternative strategies for biomarker
diagnosis, which showed increased sensitivity to endogenous peptide alterations not
evidenced by standard proteomics approaches(107, 108). Valuable information is lost
when the sample of proteins are digested artificially with trypsin in proteomics
quantification on the measurement of tryptic peptides. Therefore, from an analytical
standpoint, studying endogenous neuropeptides decrease sources of inconsistencies,
less expensive and decrease sample preparation time, which are critical factors for
building the basis for clinical biomarker research and routine work.
Natural proteolytic peptides can be separated easily by ultrafiltration from the
high molecular weight proteins, which make up the most of CSF protein pool (e.g.,
albumin and immunoglobulins). This ultrafiltration step enriches LMW peptides for
identification by LC-MS (Figure 1-6). The potential identified peptides can be assessed
using software programs that implement different approaches for characterizing and
sequencing, which then can be correlated with peptides that are found in
neurodegenerative disorders and peptides of special interests (i.e., potential
biomarkers)(106, 109-114).
Unfortunately, several potential biomarker candidates published in peptidomics
studies could not be validated further. Technological variances for biomarker discovery
approaches should be less than 10% to expect a decent probability of detection with
sets of clinical samples. However, the most crucial factor is not the detection but the
type, quality, and quantity of the clinical samples being researched as well as the study
design(110, 114-117).
37
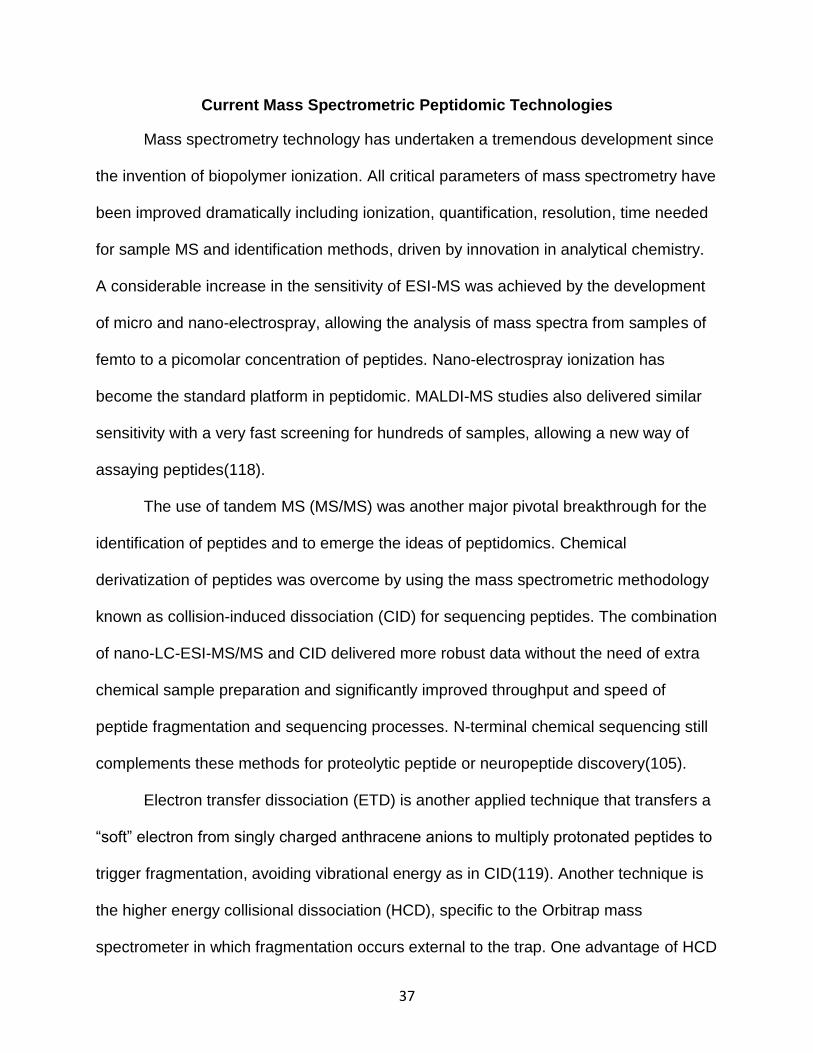
Current Mass Spectrometric Peptidomic Technologies
Mass spectrometry technology has undertaken a tremendous development since
the invention of biopolymer ionization. All critical parameters of mass spectrometry have
been improved dramatically including ionization, quantification, resolution, time needed
for sample MS and identification methods, driven by innovation in analytical chemistry.
A considerable increase in the sensitivity of ESI-MS was achieved by the development
of micro and nano-electrospray, allowing the analysis of mass spectra from samples of
femto to a picomolar concentration of peptides. Nano-electrospray ionization has
become the standard platform in peptidomic. MALDI-MS studies also delivered similar
sensitivity with a very fast screening for hundreds of samples, allowing a new way of
assaying peptides(118).
The use of tandem MS (MS/MS) was another major pivotal breakthrough for the
identification of peptides and to emerge the ideas of peptidomics. Chemical
derivatization of peptides was overcome by using the mass spectrometric methodology
known as collision-induced dissociation (CID) for sequencing peptides. The combination
of nano-LC-ESI-MS/MS and CID delivered more robust data without the need of extra
chemical sample preparation and significantly improved throughput and speed of
peptide fragmentation and sequencing processes. N-terminal chemical sequencing still
complements these methods for proteolytic peptide or neuropeptide discovery(105).
Electron transfer dissociation (ETD) is another applied technique that transfers a
“soft” electron from singly charged anthracene anions to multiply protonated peptides to
trigger fragmentation, avoiding vibrational energy as in CID(119). Another technique is
the higher energy collisional dissociation (HCD), specific to the Orbitrap mass
spectrometer in which fragmentation occurs external to the trap. One advantage of HCD
38
is that it does not suffer from the low mass cutoff of resonant-excitation and therefore
used for isobaric tag-based quantification as reporter ions can be observed(120). The
combination of HCD and ETD were effectively used for peptidomics experiments. The
development of the orbitrap mass analyzer provided a further increase in the quality of
MS/MS data analysis by substantially increasing the resolution, mass accuracy and
speed for thousands of peptides identification(121).
The Scope of the Dissertation
The work presented in this dissertation is intended to highlight the use of tau
kinase inhibitors, post-translational modification and peptidomic approaches for studying
TBI and identifying novel biomarkers that can be used for possible diagnosis and
therapeutical (i.e., theranostic) strategies. This chapter introduced TBI, CTE, and tau
protein in normal and pathological functions. This chapter also gave a brief introduction
of the analytical strengths of using peptidomic platforms to provide useful data for
assessing disease state. The peptidomic approach presented will be used throughout
the remainder of this dissertation to assess tau peptidome from in vitro, mammalian
neuronal culture, animal TBI models, and human CSF-TBI samples. Chapter 2 will
focus on screening tau kinases as drug inhibitors in mouse neuroblastoma cells and
primary neuronal culture. Kinases that are relevant to tau proteolysis, phosphorylation,
and aggregation will be highlighted to be applied for future animal studies and
translational research approaches. Chapter 3 aims to characterize neurotoxic tau
peptide fragments produced in vitro from calpain-1 or under cell-based neurotoxic
challenges. We will perform in vitro calpain-1 digestion of purified human tau-441(non-
phosphorylated and phosphorylated) and naïve transgenic human tau mice cortices.
The samples will be subjected to ultrafiltration (10K MWCO) to study high molecular
39
weight (HMW, retentates) and low molecular weight (LMW, filtrates) tau products by
western blotting and nLC-ESI-MS/MS, respectively. In cell culture-based experiments,
okadaic acid (OA), a phosphatase 1A/2B inhibitor, will be used to induce tau
hyperphosphorylation and test susceptibility of tau to proteolysis when challenged by
the neurotoxic conditions. In chapter 4, we will employ a translational approach from our
findings (in vitro and cell-based studies) for analysis of TBI-induced animal models
samples. Chapter 5 will aim to characterize tau post-translational modification levels
and temporal profile in human cerebrospinal fluid from severe TBI and control subjects.
Those chapters will highlight potential tau biomarkers, cleavage sites,
phosphorylation sites, and fragments that can be used to differentiate TBI and normal
healthy populations. Finally, chapter 6 will provide a summary and conclusions of the
work presented in this dissertation with the future directions that will be conducted.
40
Figure 1-1. Human brain tau protein isoforms. Alternative splicing of exons 2, 3, or 10 produces a different combination of six tau isoforms. The N-terminal domain, N1 (green) and N2 (yellow), are generated from exon 2 and 3, respectively. Exon 10 encodes the second microtubule binding repeat domain, R2 (red). Tau proteins might be either 3R or 4R depending on the presence of R2.(122)
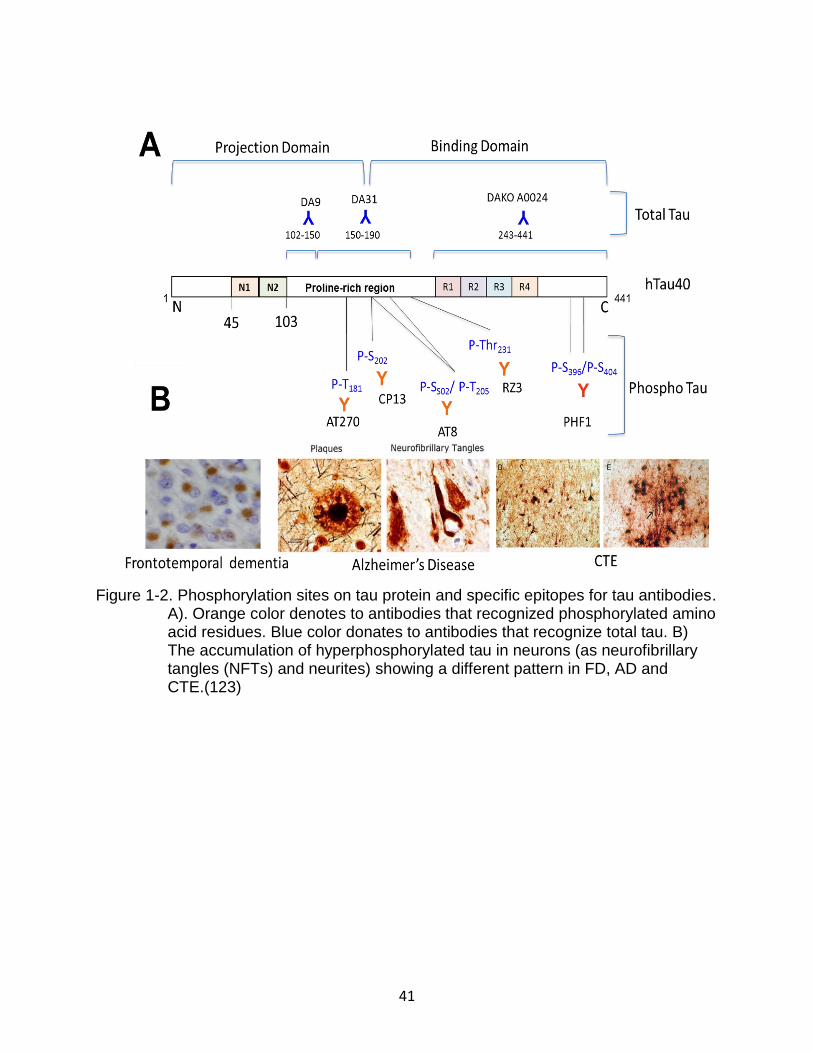
41
Figure 1-2. Phosphorylation sites on tau protein and specific epitopes for tau antibodies. A). Orange color denotes to antibodies that recognized phosphorylated amino acid residues. Blue color donates to antibodies that recognize total tau. B) The accumulation of hyperphosphorylated tau in neurons (as neurofibrillary tangles (NFTs) and neurites) showing a different pattern in FD, AD and CTE.(123)
42
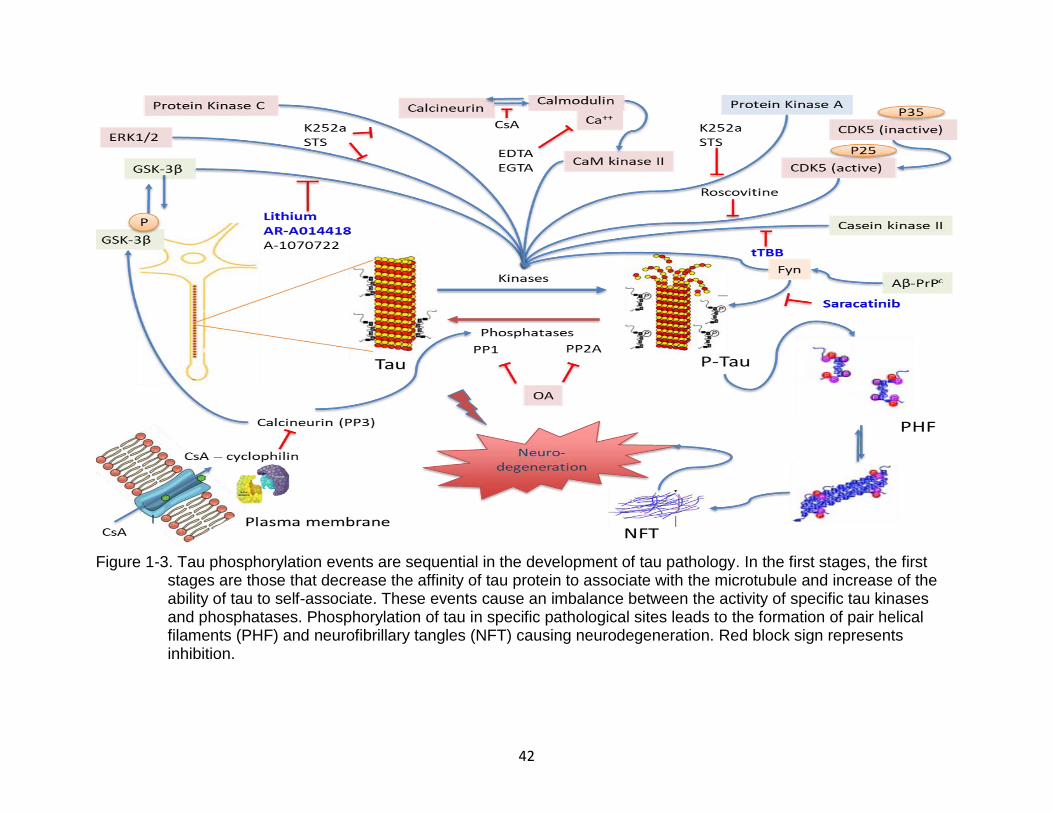
Figure 1-3. Tau phosphorylation events are sequential in the development of tau pathology. In the first stages, the first stages are those that decrease the affinity of tau protein to associate with the microtubule and increase of the ability of tau to self-associate. These events cause an imbalance between the activity of specific tau kinases and phosphatases. Phosphorylation of tau in specific pathological sites leads to the formation of pair helical filaments (PHF) and neurofibrillary tangles (NFT) causing neurodegeneration. Red block sign represents inhibition.
43
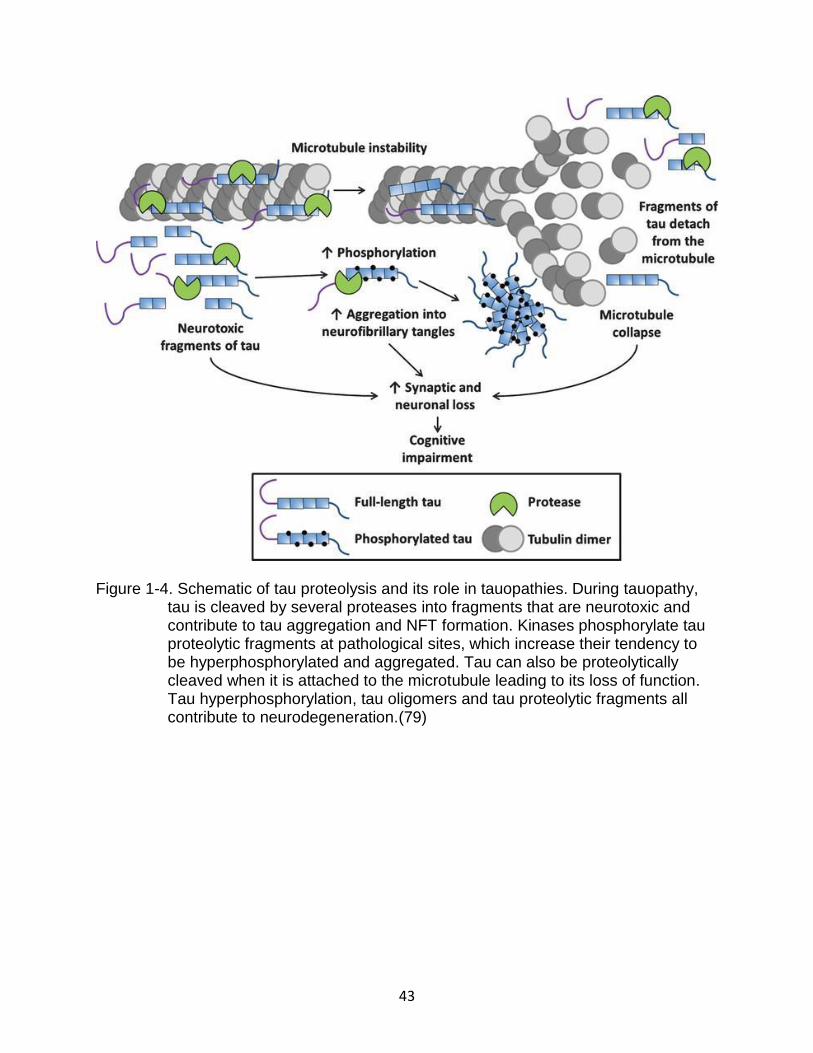
Figure 1-4. Schematic of tau proteolysis and its role in tauopathies. During tauopathy, tau is cleaved by several proteases into fragments that are neurotoxic and contribute to tau aggregation and NFT formation. Kinases phosphorylate tau proteolytic fragments at pathological sites, which increase their tendency to be hyperphosphorylated and aggregated. Tau can also be proteolytically cleaved when it is attached to the microtubule leading to its loss of function. Tau hyperphosphorylation, tau oligomers and tau proteolytic fragments all contribute to neurodegeneration.(79)
44
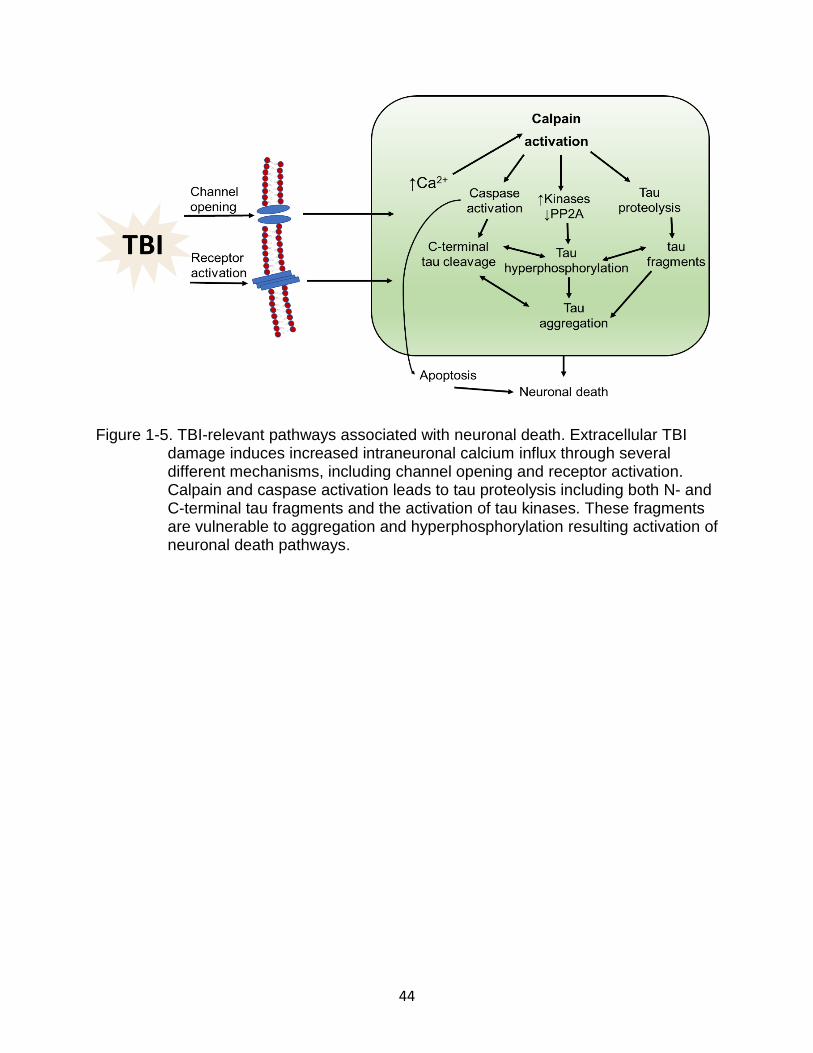
Figure 1-5. TBI-relevant pathways associated with neuronal death. Extracellular TBI
damage induces increased intraneuronal calcium influx through several different mechanisms, including channel opening and receptor activation. Calpain and caspase activation leads to tau proteolysis including both N- and C-terminal tau fragments and the activation of tau kinases. These fragments are vulnerable to aggregation and hyperphosphorylation resulting activation of neuronal death pathways.
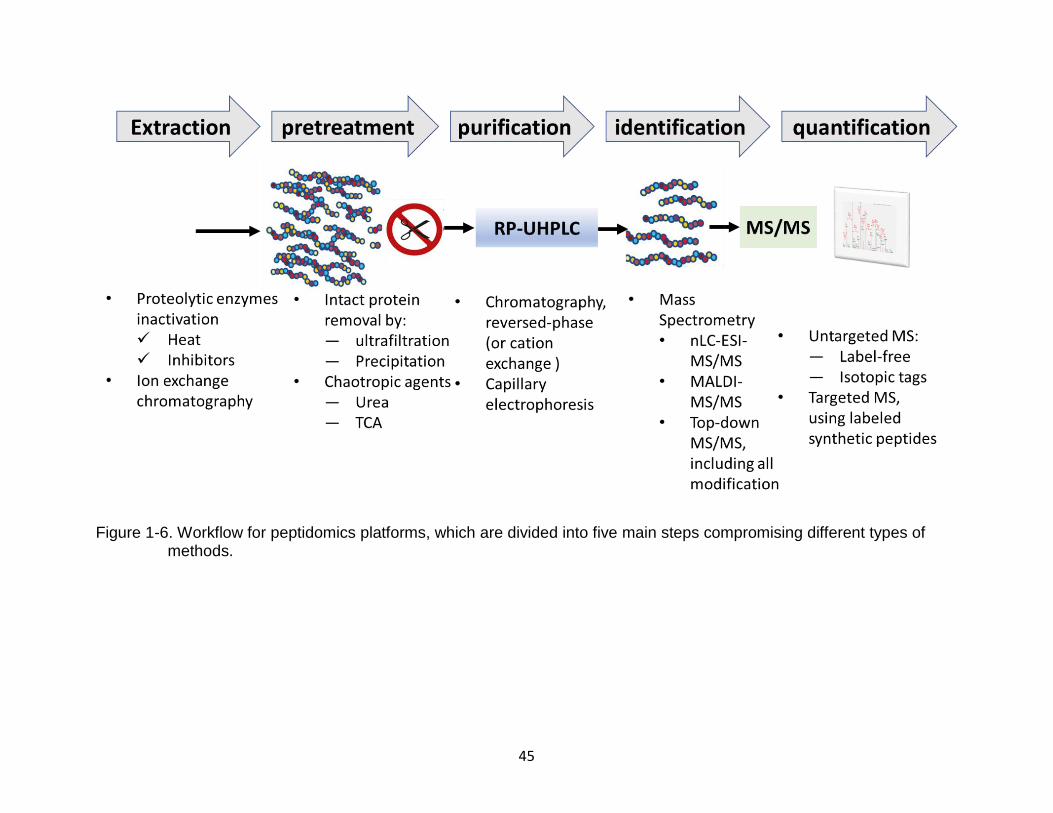
45
Figure 1-6. Workflow for peptidomics platforms, which are divided into five main steps compromising different types of methods.
46
CHAPTER 2 SCREENING OF TAU PROTEIN KINASE INHIBITORS IN A TAUOPATHY-RELEVANT
CELL-BASED MODEL OF TAU HYPERPHOSPHORYLATION AND OLIGOMERIZATION
Introduction
Tauopathy is a multifaceted disorder associated with several neurodegenerative
diseases including traumatic brain injury (TBI), chronic traumatic encephalopathy (CTE),
Alzheimer’s disease (AD). Significant tauopathy hallmarks are the presence of
hyperphosphorylated and aggregated forms of tau(16).
Tau is a structural protein that promotes microtubule stability and tubulin
assembly depending on its phosphorylation state(16, 17, 30). Various kinases and
phosphatases regulate tau phosphorylation state, and its ability to interact with other
microtubule proteins(37, 62). Imbalances in the activities of these kinases and
phosphatases can cause tau protein to be hyperphosphorylated at specific residues and
dissociated from microtubules. Dissociated tau from microtubules has increased
susceptibility to forming larger protein aggregates, filamentous assembly, and bundling
of pair helical filaments (PHF) into neurofibrillary tangles (NFT) causing cellular
neurotoxicity(16, 17, 30, 124, 125).
Pharmaceutical inhibition of tau kinases is one crucial strategy of Neurotherapy
(53). One hypothesis suggests that inhibition of tau kinases leads to decreased tau
hyperphosphorylation and thereby, less aggregated tau. A few protein kinase inhibitors
have been targeted clinically(4, 19, 55, 126-128). Examples of tau kinases being
targeted pharmaceutically are glycogen synthase kinase 3β (GSK-3β) and cyclin-
dependent kinase 5 (CDK5) tested in Alzheimer disease (AD) patients(56, 129).
47
Additionally, casein kinase I (CKI) is thought to play a role in hyperphosphorylation of
tau in AD(130, 131).
The role of CKI in neurodegenerative disease has been more extensively studied
than CKII in the recent years(130-132). Notably, a study reported that the hippocampus
and temporal cortex regions of the brain had increased levels of CKII in AD patients
when compared to controls(132). Furthermore, one kinase protein in the Src family
known as Fyn have been highly researched for its implications with tauopathy and
neurodegeneration in the post-synapse N-methyl-D-aspartate receptors (NMDAR)(54,
133-135).
Tau phosphorylation sites including: Ser202, Ser396/404, Thr108, Thr181, Thr205, and
Thr231 have been reported to affect tau association with microtubules(59, 60, 69, 130).
Analyzing these phosphorylation sites might help to show a pattern of relationships
between tau protein phosphorylation and pathology. Okadaic acid (OA) is a protein
phosphatase 1 and 2A (PP1/2A) inhibitor that can induce tau hyperphosphorylation at
pathological sites associated with diseases in both animal and cell-based models(40,
65, 66). In this study, we treated mouse neuroblastoma N2a cells and rat primary
cerebrocortical neuronal (CTX) culture with OA to induce tau hyperphosphorylation and
oligomerization, mimicking a tauopathy-relevant cell-based model. We used different
tau protein kinase inhibitors to test their efficacy in reducing tau hyperphosphorylation
and oligomerization.
We hypothesize that using OA-induced tau hyperphosphorylation and
oligomerization as a tauopathy-relevant cell-based model to screen for tau kinase
inhibitors might help to translate novel neurotherapeutic targets for clinical trials. Data
48
from our work have shown the various efficacies of the kinase inhibitors in inhibiting the
OA-induced tau hyperphosphorylation and oligomerization. These inhibitors need to be
assessed and validated further in different in vivo tauopathy-related models.
Materials and Methods
Inhibitors
Inhibitors used include: ethylene glycol-bis(β-aminoethyl ether)-N,N,N',N'-
tetraacetic acid (EGTA) (Sigma-Aldrich, St-Louis, MO, USA), Dithiothreitol (DTT)
(Sigma-Aldrich), Lithium chloride (LiCl) (Sigma-Aldrich), N-(4-methoxybenzyl)-N'-(5-
nitro-1,3-thiazol-2-yl)urea (AR-A014418) (Sigma-Aldrich), (9S,10R,12R)-2,3,9,10,11,12-
Hexahydro-10-hydroxy-9-methyl-1-oxo-9,12-epoxy-1H-diindolo[1,2,3-fg:3',2',1'-
kl]pyrrolo[3,4-i][1,6]benzodiazocine-10-carboxylic acid methyl ester (K252a) (Sigma-
Aldrich), (2R)-2-1-butanol (Roscovitine) (Sigma-Aldrich), 4,5,6,7-Tetrabromo-2-
azabenzimidazole (TBB) (Sigma-Aldrich), 1-(7-methoxyquinolin-4-yl)-3-(6-
(trifluoromethyl)pyridin-2-yl)urea (A-1070722) (Sigma-Aldrich), cyclosporine A (Sigma-
Aldrich), N-(5-chloro-1,3-benzodioxol-4-yl)-7-[2-(4-methylpiperazin-1-yl)ethoxy]-5-
(tetrahydro-2H-pyran-4-yloxy)quinazolin-4-amine (Saracatinib) (Selleck Chemicals,
Houston TX), (5S,6R,7R,9R)-6-methoxy-5-methyl-7-(methylamino)-6,7,8,9,15,16-
hexahydro-17-oxa-4b,9a,15-triaza-5,9-methanodibenzo[b,h]cyclonona[jkl]cyclopenta[e]-
as-indacen-14(5h)-one (STS) (ab120056; Abcam, Cambridge, MA, USA), Z-Asp-2,6-
Dichlorobenzoyloxymethyl Ketone (Z-DCB) (Cayman Chemical, Ann Arbor Michigan)
and okadaic acid (Cell Signaling Technology, Danvers, MA). SNJ-1945 was a gift from
(Senju Pharmaceutical Co. Ltd., Kobe, Japan) (Table 2-2).
49
Antibodies
The antibodies that were used in this study were: phospho-tau monoclonal
antibodies PHF-1 (pSer396/pSer404, 1/1000), CP13 (pSer202, 1/1000), RZ3 (pThr231,
1/1000), AT8 (pSer202/pThr205, 1/1000) , AT270 (pThr181, 1/1000) and total tau
monoclonal antibodies: DA9 (aa102-140, 1/1000), DA31 (aa150-190, 1/1000) (gifts from
Professor Peter Davies, Albert Einstein College of Medicine, Bronx, NY), polyclonal total
tau DAKO (aa243-441, 1/5000) (CiteAb, England). Mouse anti-αII-spectrin (ENZO Life
Sciences, Farmingdale, NY, USA, 1/5000). β-actin was used as protein loading control
(Abcam, Cambridge, MA, USA, 1/3000) (see Table 2-1).
Cell Line
Brain Mouse neuroblastoma N2a cells were purchased from American Type
Culture Collection (ATCC #CRL-2266, Manassas, VA, USA) and were grown as
recommended by the manufacturer. The cells were grown in 1:1 Dulbecco’s modified
Eagle medium: reduced serum Eagle’s minimum essential media (DMEM: Opti-MEM)
supplemented with 5% FBS (Thermo-Fisher), 100 units/mL penicillin and 0.1 mg/mL
streptomycin. Cells were incubated at 37°C in a humidified 5% CO2-containing
atmosphere.
Primary Cerebrocortical Neuronal Cultures
Cerebrocortical cells harvested from a homogenized pool of ten 1-d-old
Sprague–Dawley rat brains were plated on poly-L-lysine-coated (0.01% (w/v)) 12-well
culture plates (Erie Scientific, Portsmouth, NH, USA) similar to previously described
methods(71) at a density of 4.36 × 10⁵ cells/ml. Cells were grown in Neurobasal® media
(Thermo Fisher), supplemented with 1% B-27 (Thermo Fisher), 1 mM Glutamine
50
(Thermo Fisher) and incubated at 37°C in a humidified 5% CO2-containing atmosphere.
The medium was replaced every three days.
Cell Treatments
For N2a cells treatments, complete media was replaced with serum-free DMEM
media. For primary cultures, all experiments were performed after ten days in culture,
and the media was replaced with Neurobasal® media supplemented with 0.5% B-27.
For both cell culture types, SNJ-1945 (100 µM) and Z-DCB (60 µM) were added to all
conditions before the treatment for 1 hour. This was followed by treatment with protein
kinase inhibitors K252a (10 µM), AR-A014418 (60 µM), A-1070722 (60 µM), Saracatinib
(100 µM), LiCl (5 mM) TBB (60 µM), EGTA (5 mM), Roscovitine (60 µM), STS (0.5 µM),
CsA (60 µM) (if added) (Table 2-2) for 1 hour followed by OA (100 nM) for 6 hours or 24
hours.
Cell Lysate Collection and Preparation
After the treatment, conditioned media were collected from each well, added into
separate tubes on ice, and centrifuged at 10,000 x g for 10 min at 4°C. Lysis buffer was
added to the attached cells on the 12-well plates (100 µl per well). The Triton-X lysis
buffer included 1mM DTT, 1% phosphatase inhibitors (Sigma), 1% Mini-Complete
protease inhibitor cocktail tablet (Roche Biochemicals) and 1% Triton X-100. The
attached cells were then scraped down into the lysis buffer and collected into separate
1.5 ml Eppendorf tubes. The insoluble pellets from the conditioned culture media were
combined with the lysed cells in the lysis buffer. The cell lysates were incubated for 90
minutes at 4°C and then centrifuged at 15,000 rpm for 15 minutes to remove cell debris.
51
SDS–PAGE and Western Blots
Protein concentrations of cell lysates were determined by bicinchoninic acid
microprotein assays (Pierce Inc., Rockford, IL, USA) against albumin standards. Equal
protein samples (20 μg) were prepared for SDS–PAGE in 8 x loading buffer containing
0.25 M Tris (pH 6.8), 2 mM DTT, 8% SDS, and 0.02% bromophenol blue. Each sample
was subjected to SDS–PAGE electrophoresis on 4-20% precast-gels (Bio-Rad), and
then transferred on to PVDF membranes.
The membranes were blocked in 5% milk for 1 hour and then incubated with
primary antibodies overnight. The secondary antibodies (Amersham Biosciences, UK,
1/10,000) anti-rabbit or anti-mouse IgG conjugated to alkaline phosphatase (Amersham,
Piscataway, NJ, USA), were then added for 1 hour at room temperature. The blots were
then washed with TBST, and immunoreactive bands were visualized by developing with
biotin, avidin-conjugated alkaline phosphatase, nitro blue tetrazolium, and 5-bromo-4-
chloro- 3-indolyl phosphate (BCIT/NBT) developer (KPL, Gaithersburg, MD, USA). A
250K to 14K-rainbow molecular weight marker (RPN800E, GE Healthcare, Biosciences,
Pittsburgh, PA, USA) was used to identify the protein. Quantitative evaluation of protein
levels was performed via computer-assisted densitometric scanning (NIH ImageJ,
version 1.6 software).
Statistical Analysis
Statistical analysis was performed with one-way ANOVA Tukey’s Test. For
multiple comparisons, one-way ANOVA followed by the Bonferroni’s post hoc test was
performed. *p<0.05, **p<0.01, ***p<0.001, **** p<0.0001, ns: non-significant. GraphPad
Prism 7.0 (GraphPad, La Jolla, CA).
52
Ethical Statement
All animal studies conformed to the guidelines outlined in the ‘Guide for the Care
and Use of Laboratory Animals’ from the National Institutes of Health and were
approved by the University of Florida.
Results
Okadaic Acid (OA) Induces Tau Hyperphosphorylation and Oligomerization at Different Time Points in Mouse Neuroblastoma N2a Cells.
Okadaic acid (OA), a protein phosphatase 1/2A inhibitor (PP1/2A), is reported to
induce tau hyperphosphorylation in mouse neuroblastoma cells (N2a)(136), human
neuroblastoma cells (SH-SY5Y)(137), and rat brain(65). Therefore, we treated N2a cells
with okadaic acid (100 nM) to induce tau hyperphosphorylation for six and 24 hours
(Figure 2-1a, b). Western blots were analyzed with total tau monoclonal antibody DA9
(aa102-140) and monoclonal phospho-tau antibodies including CP13 (pSer202) and
PHF-1 (pSer396/pSer404) (Table 2-1). β-actin was used as a loading control.
Untreated control showed that total tau antibody DA9 detected tau protein bands
at 46 kDa (non-phosphorylated tau), 48 kDa (phosphorylated tau) and high molecular
weight bands detected at 165 kDa and 170 kDa (red arrows in Figure 2-1a, b). The
band at 46 kDa (non-phosphorylated tau) was detected at higher densitometric levels
compared to the band at 48 kDa (phosphorylated tau) in control samples. Probing with
DA9 showed that treatment with OA (100 nM) for 6h and 24h dramatically decreased
levels of the 46 kDa (non-phosphorylated tau), increased the levels of 48 kDa
(phosphorylated tau) and increased levels of 170 kDa, presumably accounting for the
formation of tau oligomers (Figure 2-1a, b). This effect was seen to a lesser extent with

53
OA treatment for six hours, as tested by DA9 antibody compared to the 24 hours OA
treatment (Figure 2-1a, b).
Probing with CP13 (pSer202) antibody did not show any bands of tau protein in
control samples. However, with OA treatment, CP13 antibody detected a band formed
at 110 kDa (oligomeric tau form) observed at both 6h and 24h (Figure 2-1a, b). As for
probing with the PHF-1 antibody (pSer396/pSer404), control samples showed low levels of
240 kDa band and 260 kDa bands (PHF-1, indicated in red arrow) (Figure 2-1a, b).
Treatment with OA for 6h and 24h showed a major band detected at 220 kDa and a
dramatic increase of levels of 240 kDa and 260 kDa bands (Figure 2-1a, b).
Interestingly, the 260 kDa band (oligomeric tau; red arrow) (Figure 2-1a) was
detected with PHF-1 with OA treatment for 24 h only. β-actin protein as a loading control
showed no protein level changes across treatment. Taken together, these data suggest
that OA treatment induced tau hyperphosphorylation and oligomerization in N2a cells
and was detected by with different specific phospho-epitope tau antibodies including
pSer202 (CP13), pSer396/pSer404 (PHF-1), and total tau (DA9) antibody. For the following
experiments, OA treatment for 24 h was chosen since it achieved more robust tau
hyperphosphorylation and oligomerization as shown in the immunoblotting data (Figure
2-1a, b).
Testing Tau Kinase Inhibitors on OA-Induced Tau Hyperphosphorylation and Oligomerization in N2a Cells.
In order to test for potential tau protein kinase inhibitors as drug candidates,
mouse neuroblastoma N2a cells were pre-treated with or without various kinase
inhibitors including: LiCl (10 mM), AR-A014418 (AR) (60 µM), A-1070722 (A107)(60
µM), K252a (10 µM), STS (0.5 µM) 4,5,6,7-tetrabromobenzotriazole (TBB) (60 µM),
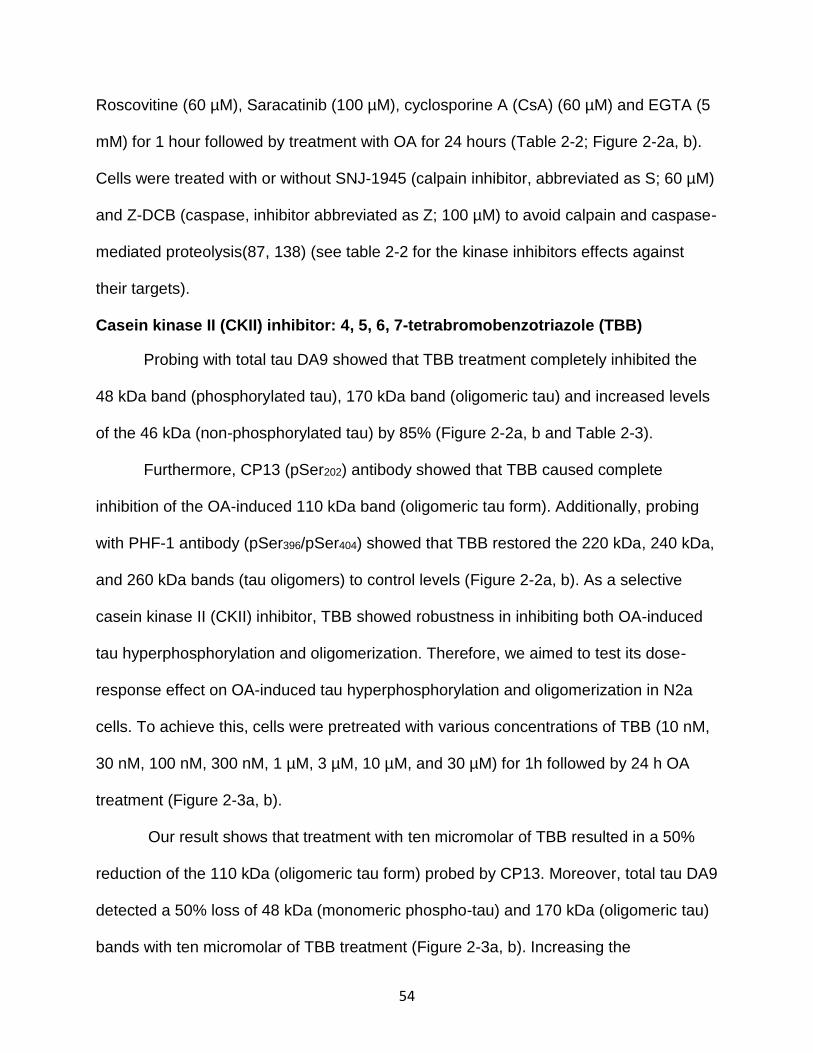
54
Roscovitine (60 µM), Saracatinib (100 µM), cyclosporine A (CsA) (60 µM) and EGTA (5
mM) for 1 hour followed by treatment with OA for 24 hours (Table 2-2; Figure 2-2a, b).
Cells were treated with or without SNJ-1945 (calpain inhibitor, abbreviated as S; 60 µM)
and Z-DCB (caspase, inhibitor abbreviated as Z; 100 µM) to avoid calpain and caspase-
mediated proteolysis(87, 138) (see table 2-2 for the kinase inhibitors effects against
their targets).
Casein kinase II (CKII) inhibitor: 4, 5, 6, 7-tetrabromobenzotriazole (TBB)
Probing with total tau DA9 showed that TBB treatment completely inhibited the
48 kDa band (phosphorylated tau), 170 kDa band (oligomeric tau) and increased levels
of the 46 kDa (non-phosphorylated tau) by 85% (Figure 2-2a, b and Table 2-3).
Furthermore, CP13 (pSer202) antibody showed that TBB caused complete
inhibition of the OA-induced 110 kDa band (oligomeric tau form). Additionally, probing
with PHF-1 antibody (pSer396/pSer404) showed that TBB restored the 220 kDa, 240 kDa,
and 260 kDa bands (tau oligomers) to control levels (Figure 2-2a, b). As a selective
casein kinase II (CKII) inhibitor, TBB showed robustness in inhibiting both OA-induced
tau hyperphosphorylation and oligomerization. Therefore, we aimed to test its dose-
response effect on OA-induced tau hyperphosphorylation and oligomerization in N2a
cells. To achieve this, cells were pretreated with various concentrations of TBB (10 nM,
30 nM, 100 nM, 300 nM, 1 µM, 3 µM, 10 µM, and 30 µM) for 1h followed by 24 h OA
treatment (Figure 2-3a, b).
Our result shows that treatment with ten micromolar of TBB resulted in a 50%
reduction of the 110 kDa (oligomeric tau form) probed by CP13. Moreover, total tau DA9
detected a 50% loss of 48 kDa (monomeric phospho-tau) and 170 kDa (oligomeric tau)
bands with ten micromolar of TBB treatment (Figure 2-3a, b). Increasing the
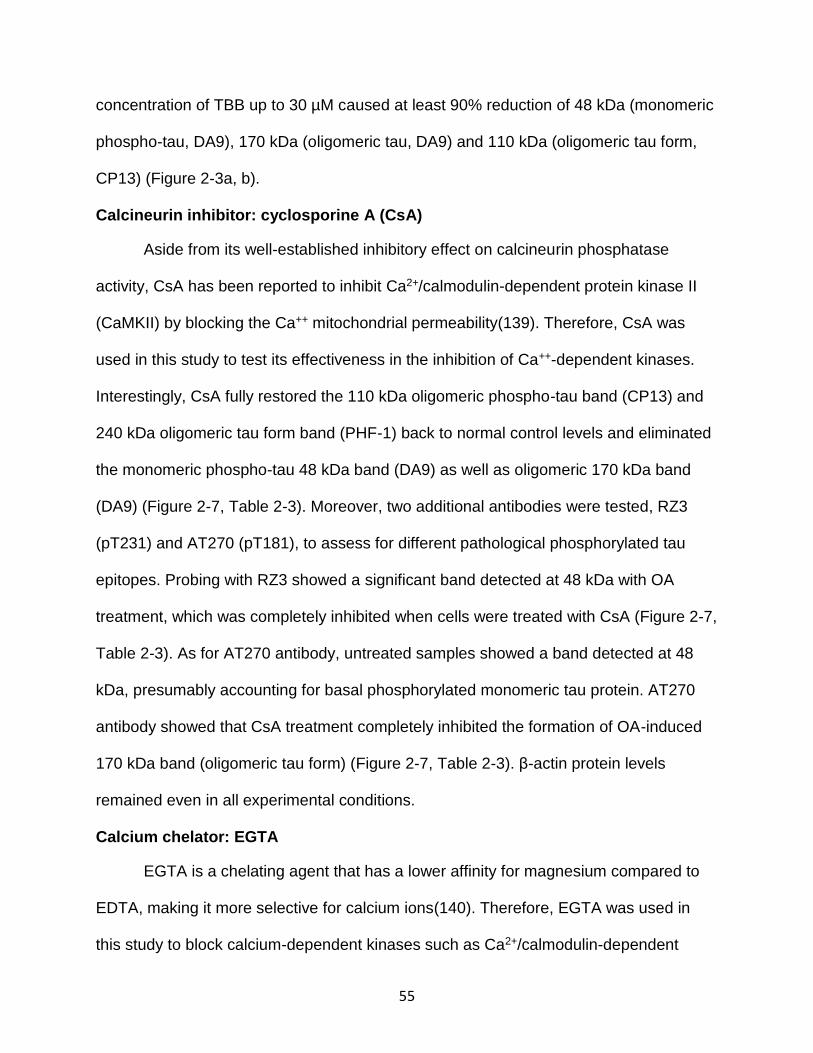
55
concentration of TBB up to 30 µM caused at least 90% reduction of 48 kDa (monomeric
phospho-tau, DA9), 170 kDa (oligomeric tau, DA9) and 110 kDa (oligomeric tau form,
CP13) (Figure 2-3a, b).
Calcineurin inhibitor: cyclosporine A (CsA)
Aside from its well-established inhibitory effect on calcineurin phosphatase
activity, CsA has been reported to inhibit Ca2+/calmodulin-dependent protein kinase II
(CaMKII) by blocking the Ca++ mitochondrial permeability(139). Therefore, CsA was
used in this study to test its effectiveness in the inhibition of Ca++-dependent kinases.
Interestingly, CsA fully restored the 110 kDa oligomeric phospho-tau band (CP13) and
240 kDa oligomeric tau form band (PHF-1) back to normal control levels and eliminated
the monomeric phospho-tau 48 kDa band (DA9) as well as oligomeric 170 kDa band
(DA9) (Figure 2-7, Table 2-3). Moreover, two additional antibodies were tested, RZ3
(pT231) and AT270 (pT181), to assess for different pathological phosphorylated tau
epitopes. Probing with RZ3 showed a significant band detected at 48 kDa with OA
treatment, which was completely inhibited when cells were treated with CsA (Figure 2-7,
Table 2-3). As for AT270 antibody, untreated samples showed a band detected at 48
kDa, presumably accounting for basal phosphorylated monomeric tau protein. AT270
antibody showed that CsA treatment completely inhibited the formation of OA-induced
170 kDa band (oligomeric tau form) (Figure 2-7, Table 2-3). β-actin protein levels
remained even in all experimental conditions.
Calcium chelator: EGTA
EGTA is a chelating agent that has a lower affinity for magnesium compared to
EDTA, making it more selective for calcium ions(140). Therefore, EGTA was used in
this study to block calcium-dependent kinases such as Ca2+/calmodulin-dependent
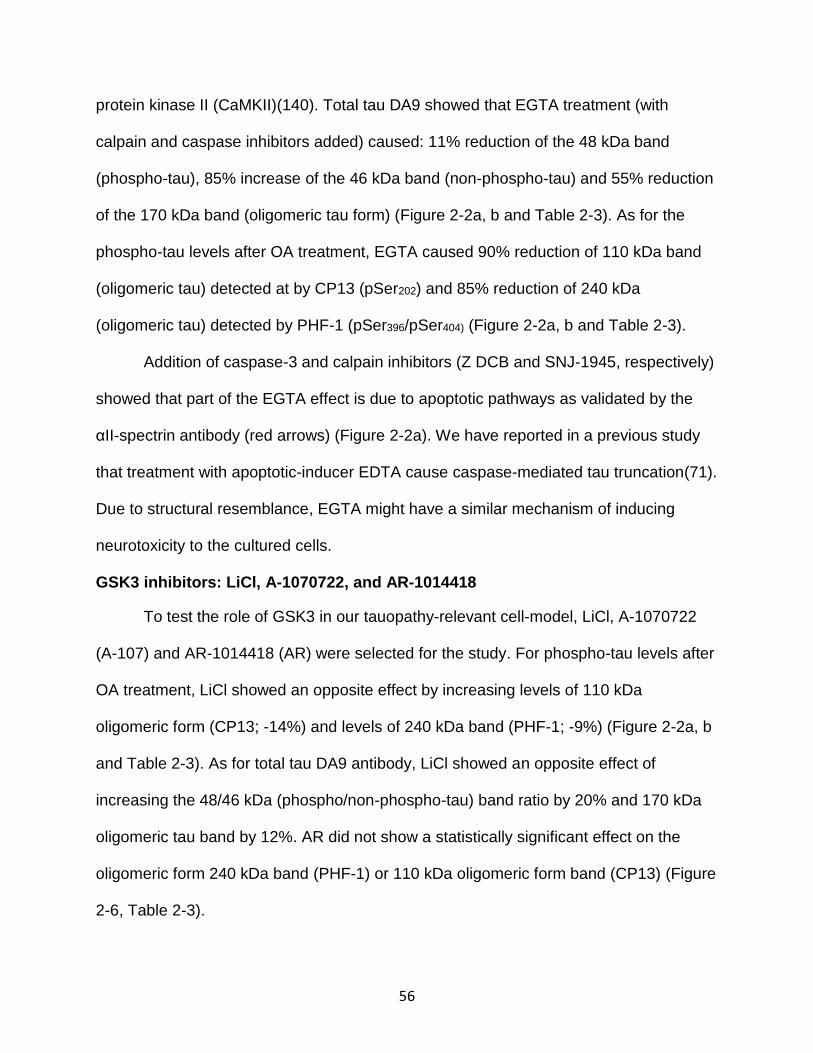
56
protein kinase II (CaMKII)(140). Total tau DA9 showed that EGTA treatment (with
calpain and caspase inhibitors added) caused: 11% reduction of the 48 kDa band
(phospho-tau), 85% increase of the 46 kDa band (non-phospho-tau) and 55% reduction
of the 170 kDa band (oligomeric tau form) (Figure 2-2a, b and Table 2-3). As for the
phospho-tau levels after OA treatment, EGTA caused 90% reduction of 110 kDa band
(oligomeric tau) detected at by CP13 (pSer202) and 85% reduction of 240 kDa
(oligomeric tau) detected by PHF-1 (pSer396/pSer404) (Figure 2-2a, b and Table 2-3).
Addition of caspase-3 and calpain inhibitors (Z DCB and SNJ-1945, respectively)
showed that part of the EGTA effect is due to apoptotic pathways as validated by the
αII-spectrin antibody (red arrows) (Figure 2-2a). We have reported in a previous study
that treatment with apoptotic-inducer EDTA cause caspase-mediated tau truncation(71).
Due to structural resemblance, EGTA might have a similar mechanism of inducing
neurotoxicity to the cultured cells.
GSK3 inhibitors: LiCl, A-1070722, and AR-1014418
To test the role of GSK3 in our tauopathy-relevant cell-model, LiCl, A-1070722
(A-107) and AR-1014418 (AR) were selected for the study. For phospho-tau levels after
OA treatment, LiCl showed an opposite effect by increasing levels of 110 kDa
oligomeric form (CP13; -14%) and levels of 240 kDa band (PHF-1; -9%) (Figure 2-2a, b
and Table 2-3). As for total tau DA9 antibody, LiCl showed an opposite effect of
increasing the 48/46 kDa (phospho/non-phospho-tau) band ratio by 20% and 170 kDa
oligomeric tau band by 12%. AR did not show a statistically significant effect on the
oligomeric form 240 kDa band (PHF-1) or 110 kDa oligomeric form band (CP13) (Figure
2-6, Table 2-3).
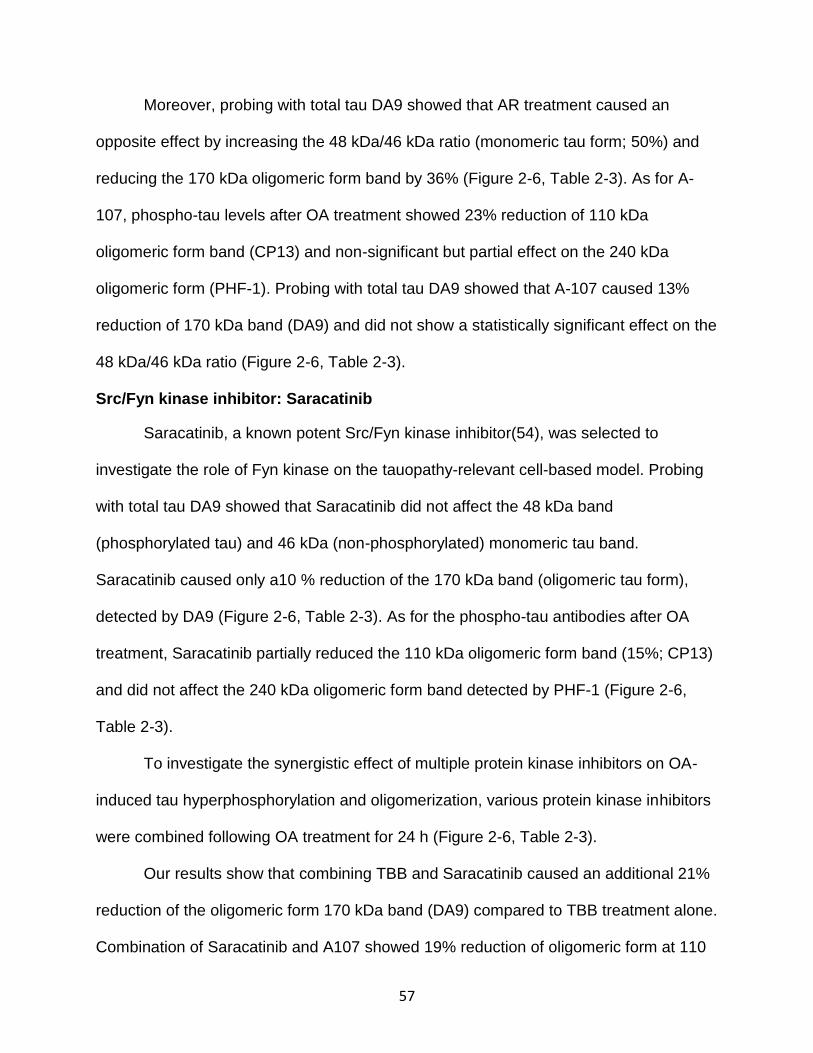
57
Moreover, probing with total tau DA9 showed that AR treatment caused an
opposite effect by increasing the 48 kDa/46 kDa ratio (monomeric tau form; 50%) and
reducing the 170 kDa oligomeric form band by 36% (Figure 2-6, Table 2-3). As for A-
107, phospho-tau levels after OA treatment showed 23% reduction of 110 kDa
oligomeric form band (CP13) and non-significant but partial effect on the 240 kDa
oligomeric form (PHF-1). Probing with total tau DA9 showed that A-107 caused 13%
reduction of 170 kDa band (DA9) and did not show a statistically significant effect on the
48 kDa/46 kDa ratio (Figure 2-6, Table 2-3).
Src/Fyn kinase inhibitor: Saracatinib
Saracatinib, a known potent Src/Fyn kinase inhibitor(54), was selected to
investigate the role of Fyn kinase on the tauopathy-relevant cell-based model. Probing
with total tau DA9 showed that Saracatinib did not affect the 48 kDa band
(phosphorylated tau) and 46 kDa (non-phosphorylated) monomeric tau band.
Saracatinib caused only a10 % reduction of the 170 kDa band (oligomeric tau form),
detected by DA9 (Figure 2-6, Table 2-3). As for the phospho-tau antibodies after OA
treatment, Saracatinib partially reduced the 110 kDa oligomeric form band (15%; CP13)
and did not affect the 240 kDa oligomeric form band detected by PHF-1 (Figure 2-6,
Table 2-3).
To investigate the synergistic effect of multiple protein kinase inhibitors on OA-
induced tau hyperphosphorylation and oligomerization, various protein kinase inhibitors
were combined following OA treatment for 24 h (Figure 2-6, Table 2-3).
Our results show that combining TBB and Saracatinib caused an additional 21%
reduction of the oligomeric form 170 kDa band (DA9) compared to TBB treatment alone.
Combination of Saracatinib and A107 showed 19% reduction of oligomeric form at 110
58
kDa band (CP13) and 71% reduction of oligomeric form 170 kDa band (DA9) (Figure 2-
6, Table 2-3). Surprisingly, combining AR with TBB caused opposite effect by reducing
the effectiveness of TBB inhibition at 110 kDa (CP13) by -20%, 240 kDa (PHF-1)
by`14%, and 170 kDa (DA9) by 20% compared to TBB treatment alone. AR and TBB
combination caused reduction of tau oligomeric form bands by 65% of 110 kDa (CP13),
86% of 240 kDa (PHF-1) and 80% of 170 kDa (DA9) (Figure 2-6, Table 2-3).
Combination of Saracatinib, A107, or AR, did not show a statistically significant effect on
the epitopes pSer202 (CP13) and pSer396/pSer404 (PHF-1) (Figure 2-6, Table 2-3).
CDK5 inhibitor: Roscovitine
Tau protein can be a hyperphosphorylated by cyclin-dependent kinase 5 (CDK5)
in pathological conditions(56, 60, 141). To investigate this, Roscovitine was selected in
this study to test its effect on OA-induced tau hyperphosphorylation and oligomerization.
Surprisingly, Roscovitine showed an opposite effect to what we expected by increasing
levels of oligomeric tau detected at 170 kDa (-51%; DA9), 110 kDa (-11%; CP13) and
240 kDa (-53%; PHF-1) at different epitopes tested (Figure 2-2a, b, Table 2-3). β-actin
protein levels remained even in all experimental conditions.
Baseline and OA-Induced Tau Hyperphosphorylation and Oligomerization: Effects of Various Kinase Inhibitors Treatment in Rat Primary Cerebrocortical Neuronal (CTX) Culture.
To expand our experimental paradigm in a cell-based model suitable for drug
candidate screening, we investigated the effectiveness of protein kinase inhibitors on rat
primary cerebrocortical neuronal (CTX) cultures. In contrast to N2a cells, we did not
observe oligomeric forms of tau protein when tested by total tau (DA31) and phospho-
tau antibodies in CTX cells. Notably, untreated control samples showed basal levels of
phosphorylated tau (67 kDa) detected by total and phospho-tau antibodies including:
59
DA31 (aa150-190), CP13 (pSer202), RZ3 (pThr231), PHF-1 (pSer396/pSer404), AT8
(pSer202/pThr205), and AT270 (pThr205) (Figure 2-4, Table 2-1).
Therefore, CTX cells were pre-incubated with or without protein kinase inhibitors
for 1h (Table 2-2) followed by treatment with or without OA (100 nM) for 24h (OA-
induced hyperphosphorylation or baseline tau phosphorylation). SNJ-1945 and Z-DCB
were added to all experimental conditions to prevent calpain, caspase, or both
proteolytic action as a potential confound. Treatment with OA for 24 h caused a
dramatic increase of 67 kDa band (phospho-tau) at multiple phospho-tau epitopes
(CP13: 9x, RZ3: 9.8x, PHF-1: 13x, AT8: 3x, and AT270: 10x) (Figure 2-4).
Treating CTX cells with TBB reduced basal and OA-induced tau phosphorylation
(67 kDa) at CP13 (-OA: 91%, +OA: 98%), RZ3 (-OA: 100%, +OA: 100%), PHF-1 (-OA:
100%, +OA: 100%), AT8 (-OA: 91%, +OA: 100%), AT270 (-OA: 100%, +OA: 100%)
(Figure 2-4, Table 2-4). As for total tau DA31, TBB treatment caused reduction of the
phospho-tau band at 67 kDa (-OA: 41%, +OA: 91%) and an increase of non-phospho
tau band at 63 kDa (-OA: +53%, +OA: +81%) (Figure 2-4, Figure 2-5, and Table 2-4).
In contrast to N2a cell, LiCl caused considerable reduction of basal and OA-
induced tau phosphorylation (67 kDa) in CTX culture at CP13 (-OA: 94%, +OA: 50%),
RZ3 (-OA: 89%, +OA: 100%), PHF-1 (-OA: 98%, +OA: 100%), AT8 (-OA: 100%, +OA:
81%), AT270 (-OA: 100%, +OA: 100%) and total tau DA31 (-OA:93%, +OA:96%)
(Figure 2-4, Figure 2-5; Table 2-4). Similarly, AR showed a similar trend on basal and
OA-induced tau hyperphosphorylation (Figure 2-4, Figure 2-5; Table 2-4). Moreover,
LiCl and AR showed increased levels of the band 63 kDa (non-phosphorylated tau),
when probed by total tau DA31 (Figure 2-4, Figure 2-5; Table 2-4).
60
Moreover, treating CTX cells with A107 showed substantial inhibition of basal tau
phosphorylation and OA-induced phosphorylation at CP13 (-OA: 92%, +OA: 36%), RZ3
(-OA: 79%, +OA: 70%), PHF-1 (-OA: 65%, +OA: 85%), AT8 (-OA: 82%, +OA: 21%),
AT270 (-OA: 100%, +OA: 100%) and total tau DA31 (-OA: 80%, +OA: 55%) (Figure 2-4,
Figure 2-5; Table 2-4). As for Roscovitine treatment, basal and OA-induced tau
hyperphosphorylation were reduced considerably at CP13 (-OA: 85%, +OA: 63%), RZ3
(-OA: 42%, +OA: 91%), PHF-1 (-OA: 63%, +OA: 81%) and total tau DA31 (30%).
However, Roscovitine had no effect on OA-induced tau phosphorylation at AT8 and
AT270 (Figure 2-4, Figure 2-5; Table 2-4).
On the other hand, CsA had dramatic inhibition on basal tau phosphorylation at
CP13 (90%), RZ3 (91%), PHF-1 (89%), AT8 (95%), AT270 (92%) and total tau DA31
(67 kDa, 95%) (Figure 2-6, Table 2-4). However, when OA added, CsA showed
considerable effect at the epitopes: CP13 (33%), AT8 (86%) and total tau DA31 (28%).
CsA had no effect on OA-induced tau hyperphosphorylation at PHF-1, AT270, and RZ3
(Figure 2-6, Table 2-4). Interestingly, Saracatinib caused reduction of basal and OA-
induced tau hyperphosphorylation at CP13 (-OA: 41%, +OA: 100%), RZ3 (-OA: 81%,
+OA: 100%), PHF-1 (-OA: 52%, +OA: 100%), AT270 (-OA: 0%, +OA: 84%) and total
tau DA31 (-OA: 5%, +OA: 20%). Saracatinib did not show any significant effect at AT8
phospho-tau epitope (Figure 2-4, Figure 2-5; Table 2-4).
Treatment with K252a caused substantial inhibition of basal and OA-induced tau
hyperphosphorylation at CP13 (-OA: 35%, +OA: 41%), RZ3 (-OA: 45%, +OA: 37%),
PHF-1 (-OA: 61%, +OA: 63%), and total tau DA31 (-OA: 41%, +OA: 45%) (Figure 2-4,
Figure 2-5; Table 2-4). K252a did not show any statistically significant inhibition at AT8
61
and AT270 with both basal and OA-induced tau hyperphosphorylation (Figure 2-4,
Figure 2-5; Table 2-4).
Cells treated with STS showed dramatic loss of basal and OA-induced tau
phosphorylation at CP13 (-OA: 86%, +OA: 63%), RZ3 (-OA: 83%, +OA: 81%), PHF-1 (-
OA: 55%, +OA: 89%), AT8 (-OA: 88%, +OA: 12%), AT270 (-OA: 100%, +OA: 100%)
and total tau DA31 (-OA: 41%, +OA: 45%) (Figure 2-4, Figure 2-5; Table 2-4).
Unexpectedly, EGTA caused an opposite effect by further enhancing tau basal
and OA-induced tau hyperphosphorylation in CTX cells at CP13 (-OA: -51%,+OA:-
12%), RZ3 (-OA:-63%,+OA:-22%), PHF-1 (-OA:-22%,+OA:-13%), AT8 (-OA:-
64%,+OA:-5%), AT270 (-OA:-68%,+OA:-63%) and total tau DA31 (-OA:-73%,+OA:-
69%)( Figure 2-4, Figure 2-5;Table 2-4).
β-actin protein levels remained even in all experimental conditions. Taken all
together, treatments with CKII inhibitor TBB, GSK3 inhibitors LiCl and AR-1014418,
and Src/Fyn Kinase inhibitor Saracatinib showed the most robust effect of inhibition
leading to different reduced basal and OA-induced tau phosphorylation profiles
demonstrating the specificity of inhibitors tested in our cell-based models.
Pan kinase inhibitor: K252a and STS
K252a and staurosporine (STS) are very potent cell permeable pan-specific
protein kinase inhibitors that act through the prevention of ATP binding to the kinase
(Table 2-2). In our study, K252a and STS treatment showed 30% increase of 46 kDa
(monomeric non-phosphorylated tau) and 35% decrease of 48 kDa (monomeric
phosphorylated tau) when probed with total tau DA9 antibody (Figure 2-2a, b and Table
2-3). K252a treatment caused 40% reduction of 170 kDa (DA9; oligomeric tau)
62
compared to OA treatment (average of n=3) (Figure 2-2a, b and Table 2-3). For
phospho-tau detection, probing with CP13 antibody showed 60% and 32% reduction in
110 kDa (oligomeric form) with K252a and STS treatment, respectively.
PHF-1 showed 70% and 80% reduction in levels of 240 kDa (oligomeric tau form)
with K252a and STS treatment respectively (Figure 2-2a, b, Table 2-3). Like EGTA, the
addition of STS without caspase and calpain inhibitors (Z-DCB and SNJ-1945,
respectively) caused loss of tau bands at the epitope tested (Figure 2-2a), suggesting a
role of the apoptotic enzyme in causing the proteolysis. The effect of the apoptotic
inducer STS is consistent with our finding that showed tau fragmentation and increased
αII-spectrin breakdown products (145K/120K), suggesting the activation of calpain and
caspase respectively(71).
Discussion
In this study, we used OA to induce tau hyperphosphorylation and
oligomerization in mouse neuroblastoma and rat primary cerebrocortical neuronal
cultures to screen for various tau kinase inhibitors as potential drug candidates. N2a cell
line has been widely used to study mechanisms of neurodegeneration because they are
homogenous culture system that is convenient to handle and can multiply quickly to
produce a significant amount of neuron precursor cells(136).
However, CTX primary cultures were used in this study as they represent a
healthier form of cortical cells as opposed to cell lines, which are cancerous, in a sense
that gene expression in primary cortical culture could represent and mimic the actual in
vivo expression. Additionally, primary culture has the advantage in representing the
complexity of the central nervous system by better translating into in vivo models used
for screening pharmaceutical drug candidate’s compounds(142). OA results in robust
63
tau hyperphosphorylation at multiple pathological epitopes in animal and cell culture
studies(65, 66, 143-146).
To our knowledge, there are no studies that have used OA for studying tau
oligomerization process, in either cell culture or animal models. In this study, OA
treatment induced tau hyperphosphorylation and oligomerization at various phospho-tau
epitopes in N2a cells tested by various tau epitope antibodies. In contrast to N2a cells,
we have only observed the monomeric form of tau protein (ranging from 63 kDa – 67
kDa) in CTX culture. A plausible reason for such effect would be that our separation of
tau proteins by SDS-PAGE was carried out under reducing conditions (Dithiothreitol
(DTT) and -ME) that could have the ability to reduce tau oligomers to the monomeric
form in primary culture. Moreover, our serum-free combination of neurobasal media
contains vitamin E, glutathione, catalase, superoxide dismutase, and transferrin, which
increase neuronal resistance to biological oxidation, e.g., damages by free radical.
Increase in reactive oxygen species activates caspase and calpain which cleaves
cytoskeletal proteins (e.g., spectrin) and contribute to the formation of pathologic tau
(e.g., post-translational modification and aggregation)(27). Thus, the presence of these
antioxidants may have blocked these processes from occurring.
To test the feasibility of our approach we used pan kinase inhibitors (K252a and
STS), GSK3 inhibitors (LiCl, AR-A014418 and A1070722), calcineurin inhibitor
(cyclosporine A), CDK5 inhibitor (Roscovitine), and calcium chelator EGTA (Figure 1-3,
Table 2-1) and were able to detect specific profiles of tau hyperphosphorylation and
oligomerization inhibition indicative of kinase inhibitor specificity. We have also
extended this study to include two more novel concepts of Fyn kinase (tyrosine kinase,
64
indirectly involved) and CKII kinase inhibitors. To our knowledge, these two kinase
inhibitors (TBB and Saracatinib) have not been used previously in studying tau
hyperphosphorylation and oligomerization in cell culture in vitro models.
Moreover, among all the phospho-tau epitopes studied here, the Thr231 epitope is
believed to be associated in the initiation of tau hyperphosphorylation in tauopathies
while other epitopes such as Thr181, Ser202/Thr205, and Ser396/Ser404 are phosphorylated
far ahead during the tauopathy process and the progression of the disease(68). The
phosphorylation sites Thr231 and Thr181 have been proposed as biomarkers in AD
patients while Ser202/Thr205 are used to determine the stage of AD progression(70, 77,
78). Therefore, we selected these phosphorylation sites in our study, to associate the
effectiveness of protein kinase inhibitors with tauopathy-related phosphorylation sites.
PP2A is the primary enzyme responsible for dephosphorylation of tau protein in the
brain, controlling all tau phosphorylation sites. PP2A activity is decreased in AD and TBI
brains(62, 147). Thus, the OA-induced inhibition of PP2A is a highly relevant model to
test various tau protein kinase inhibitors as modulators of tau hyperphosphorylation and
oligomerization targeting tau pathology in CTE (Figure 1-3).
In the N2a and CTX cell culture, CKII inhibitor, TBB, surprisingly provided the
most profound reversal of tau phosphorylation and oligomerization at all the epitopes
analyzed. TBB is a selective, cell-permeable, reversible and ATP/GTP-competitive
inhibitor of casein kinase II (IC50=900 nM for rat liver CKII)(148). CKII function is
aberrant in AD, and its alteration precedes hyperphosphorylated tau accumulation in
NFT formation(132). Moreover, CKII can phosphorylate tau purified from human brain
and neuroblastoma cell line(33, 36, 132, 148).
65
As for the GSK3 inhibitors, AR gave robust suppression of tau
hyperphosphorylation in CTX culture at all tau epitopes tested (Figure 2-4, Figure 2-5;
and Table 2-4) and was less effective in N2a cells (Figure 2-2a, b, and Table 2-3). We
also observed that the effect of AR is more prominent compared to another GSK3
inhibitor, A-107 in primary culture. This could be attributed, in part, to the high selectivity
and specificity of AR to GSK3β(149) compared to A-107 which display selectivity for
both GSK3α and GSK3β (Ki= 0.6 nM for both)(150) thereby diluting the effect of
inhibition of GSK3β, which is considered to be one of the central tau kinase inducing tau
hyperphosphorylation in AD(129).
LiCl is well-known to inhibit GSK3 and other kinases(146). Therefore, the
inhibition of basal and OA-induced tau hyperphosphorylation in the primary culture
could be attributed to the collective effect of LiCl on GSK-3β and other kinases.
However, LiCl showed opposite effect in the N2a cells by increasing OA-induced tau
hyperphosphorylation and oligomerization at multiple tested tau epitopes. A possible
explanation for such differences is the decreased activity of GSK3 at CP13, PHF-1, and
DA9 phosphorylation sites(146). Also, the primary cultures are differentiated cells that
represent the complex nature of the central nervous system (CNS) having potentially
more active GSK3β compared to the cancerous N2a cells.
The use of Roscovitine in CTX culture reduced substantially basal and OA-
induced tau hyperphosphorylation at CP13 (pSer202), RZ3 (pT231, PHF-
1(pSer396/pSer404) and AT270 (pThr181). Roscovitine reduced basal phosphorylation at
AT8 (pSer202/pThr205) but did not affect the OA-induced tau hyperphosphorylation,
reflecting its specificity and the selectivity to our cell models. Also, Roscovitine resulted
66
in opposite effects in the N2a cells by increasing phosphorylation at CP13 (pSer202) and
PHF-1 (pSer396/pSer404). These results could be attributed to the decreased activity of
CDK5 at CP13 and PHF-1 phosphorylation site in the neuroblastoma cells(56, 141, 151,
152).
EGTA treatment caused almost complete inhibition of OA-induced tau
hyperphosphorylation and oligomerization at 110 kDa of CP13 (pSer202) and partial
inhibition at PHF-1 (pSer396/pSer404) in N2a cells but showed opposite effect in primary
culture by increasing basal and OA-induced tau phosphorylation at all tested tau
epitopes. EGTA is well known to chelate intracellular Ca2+ that could potentially inhibit
calcium-dependent kinases such as CaMKII(139, 153). CaMKII plays a significant role
in tau phosphorylation in neuroblastoma cells(153). On the other hand, Saracatinib
reduced both basal and OA-induced tau hyperphosphorylation (67 kDa) in CTX primary
cultures at the epitopes: CP13 (pSer202), RZ3 (pThr231), PHF-1 (pSer396/pSer404) and
AT270 (pThr181).
Saracatinib is a small molecular inhibitor that has a high potency for Src and
Fyn(54, 133-135). Fyn kinase is involved in normal tau phosphorylation(54, 133-135).
Fyn can physically associate with tau and phosphorylate some residues by interacting
through its SH3 domain with SH3-binding domains on tau (PXXP motifs). Calcineurin
inhibitor, CsA caused complete inhibition of OA-induced tau hyperphosphorylation and
oligomerization in N2a cells but was less effective in doing so with CTX culture at the
analyzed epitopes. The differences in effect between N2a and CTX culture might be
due to the lower protein levels of p35, and CDK5 in primary neuronal cultures(154).
67
Moreover, CsA can inhibit calcineurin, which interrupts its binding to calcium-dependent
calmodulin, required for CaMKII activation (Figure 1-3).
Limitations and Future Directions
OA is a potent PP2A/PP1 inhibitor and is known to induce hyperphosphorylation
of tau. However, the idea that OA-induced tau hyperphosphorylation in cells might not
be directly specific to TBI or CTE because the phosphorylation sites checked in the
study are general in tauopathies rather than TBI or CTE-specific.
Other biochemical assessments will be needed to validate our finding in OA-
treated N2a cells and CTX other than western blotting. Supporting data from other
immunologically based methods, such as ELISA and immunocytochemistry will be
added in the future. The different inhibition results between N2a and CTX cultures
suggest differences in the dose responsiveness, the physiological mechanisms, or both.
Going forward, we will need to test these drugs on cell lines that are more
representative of the human CNS to show a consistent trend. Data on dose-response
effects of all the protein kinase inhibitors using both the mouse and rat cultures need to
be included in future studies. Different cell types can have remarkably different dose
ranges and optimizations.
Conclusions
In summary, we identified two novel potential drug candidates (TBB and
Saracatinib) that warrant further test design, possibly involving animal model
tauopathies. Testing the response of TBB and Saracatinib in animal TBI models is
crucial as recent studies implicate pre-fibrillary hyperphosphorylated tau as the toxic
species in tauopathy-related disorders, and therefore, re-establish the interest in tau

68
kinase inhibitors development at putative neurotherapies, which could translate in
human clinical trials.
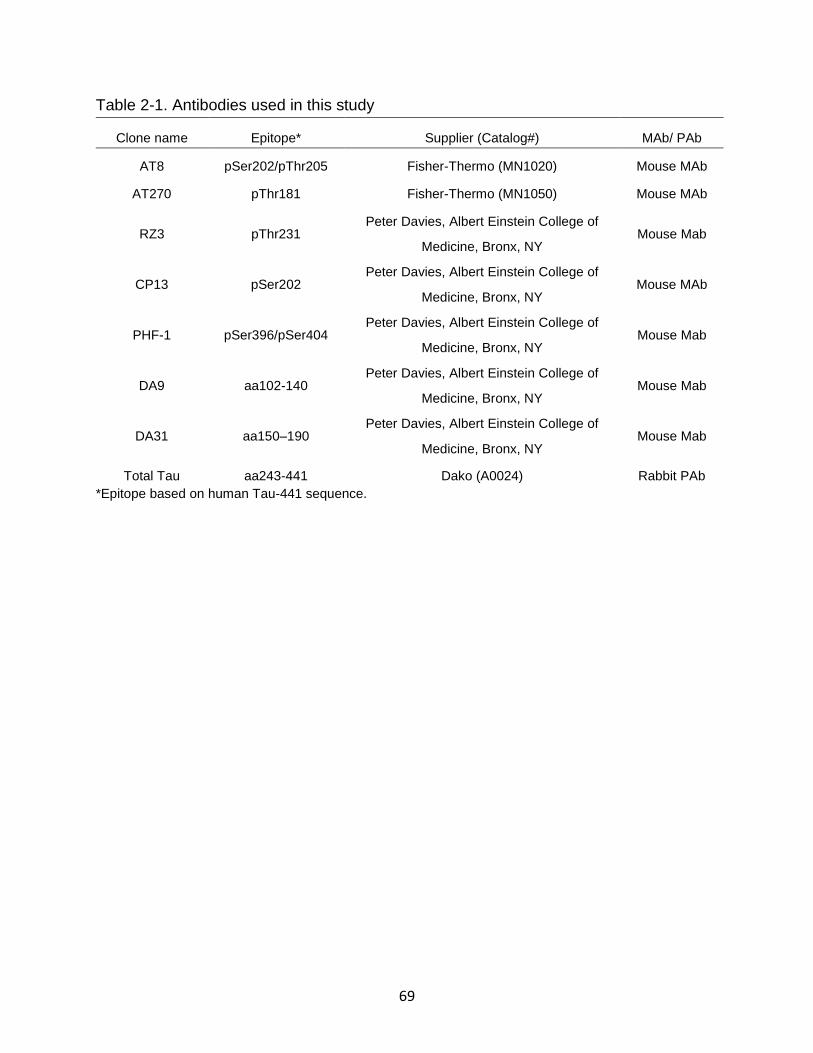
69
Table 2-1. Antibodies used in this study
*Epitope based on human Tau-441 sequence.
Clone name Epitope* Supplier (Catalog#) MAb/ PAb
AT8 pSer202/pThr205 Fisher-Thermo (MN1020) Mouse MAb
AT270 pThr181 Fisher-Thermo (MN1050) Mouse MAb
RZ3 pThr231 Peter Davies, Albert Einstein College of
Medicine, Bronx, NY Mouse Mab
CP13 pSer202 Peter Davies, Albert Einstein College of
Medicine, Bronx, NY Mouse MAb
PHF-1 pSer396/pSer404 Peter Davies, Albert Einstein College of
Medicine, Bronx, NY Mouse Mab
DA9 aa102-140 Peter Davies, Albert Einstein College of
Medicine, Bronx, NY Mouse Mab
DA31 aa150–190 Peter Davies, Albert Einstein College of
Medicine, Bronx, NY Mouse Mab
Total Tau aa243-441 Dako (A0024) Rabbit PAb
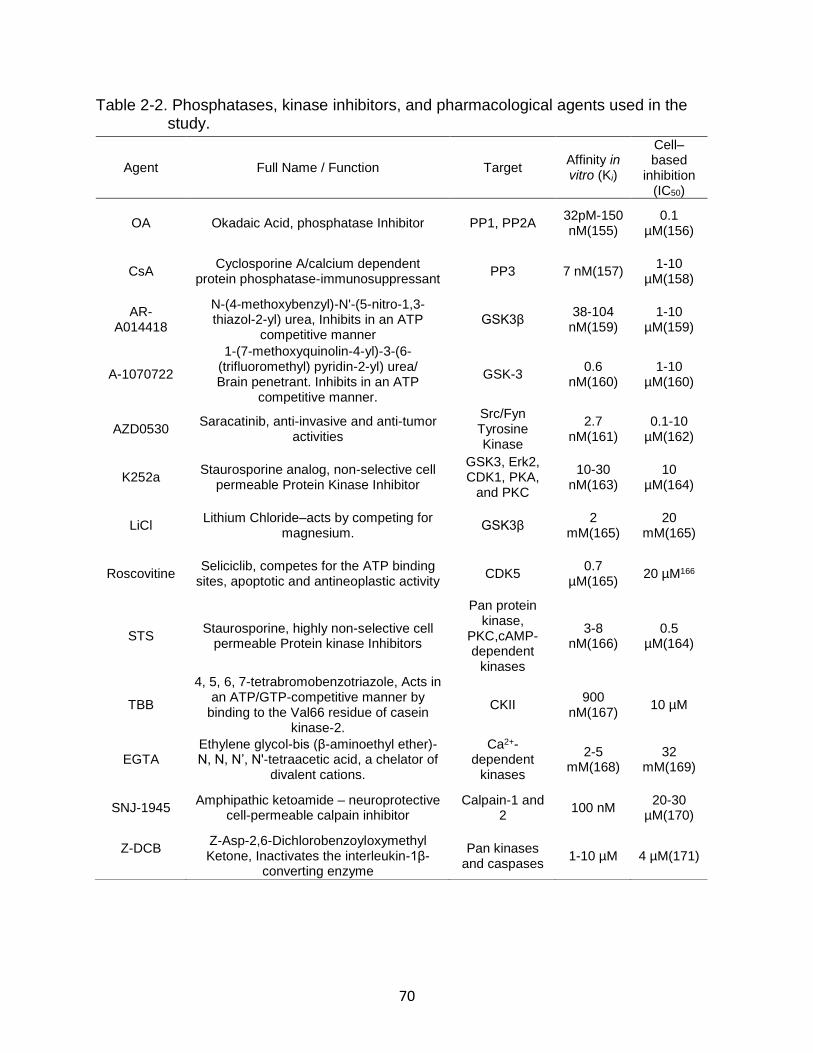
70
Table 2-2. Phosphatases, kinase inhibitors, and pharmacological agents used in the study.
Agent Full Name / Function Target Affinity in vitro (Ki)
Cell–based
inhibition (IC50)
OA Okadaic Acid, phosphatase Inhibitor PP1, PP2A 32pM-150 nM(155)
0.1 µM(156)
CsA Cyclosporine A/calcium dependent
protein phosphatase-immunosuppressant PP3 7 nM(157)
1-10 µM(158)
AR-A014418
N-(4-methoxybenzyl)-N'-(5-nitro-1,3-thiazol-2-yl) urea, Inhibits in an ATP
competitive manner GSK3β
38-104 nM(159)
1-10 µM(159)
A-1070722
1-(7-methoxyquinolin-4-yl)-3-(6-(trifluoromethyl) pyridin-2-yl) urea/ Brain penetrant. Inhibits in an ATP
competitive manner.
GSK-3 0.6
nM(160) 1-10
µM(160)
AZD0530 Saracatinib, anti-invasive and anti-tumor
activities
Src/Fyn Tyrosine Kinase
2.7 nM(161)
0.1-10 µM(162)
K252a Staurosporine analog, non-selective cell
permeable Protein Kinase Inhibitor
GSK3, Erk2, CDK1, PKA,
and PKC
10-30 nM(163)
10 µM(164)
LiCl Lithium Chloride–acts by competing for
magnesium. GSK3β
2 mM(165)
20 mM(165)
Roscovitine Seliciclib, competes for the ATP binding
sites, apoptotic and antineoplastic activity CDK5
0.7 µM(165)
20 µM166
STS Staurosporine, highly non-selective cell
permeable Protein kinase Inhibitors
Pan protein kinase,
PKC,cAMP-dependent
kinases
3-8 nM(166)
0.5 µM(164)
TBB
4, 5, 6, 7-tetrabromobenzotriazole, Acts in an ATP/GTP-competitive manner by
binding to the Val66 residue of casein kinase-2.
CKII 900
nM(167) 10 µM
EGTA Ethylene glycol-bis (β-aminoethyl ether)-N, N, N’, N'-tetraacetic acid, a chelator of
divalent cations.
Ca2+-dependent
kinases
2-5 mM(168)
32 mM(169)
SNJ-1945 Amphipathic ketoamide – neuroprotective
cell-permeable calpain inhibitor Calpain-1 and
2 100 nM
20-30 µM(170)
Z-DCB
Z-Asp-2,6-Dichlorobenzoyloxymethyl Ketone, Inactivates the interleukin-1β-
converting enzyme
Pan kinases and caspases
1-10 µM 4 µM(171)
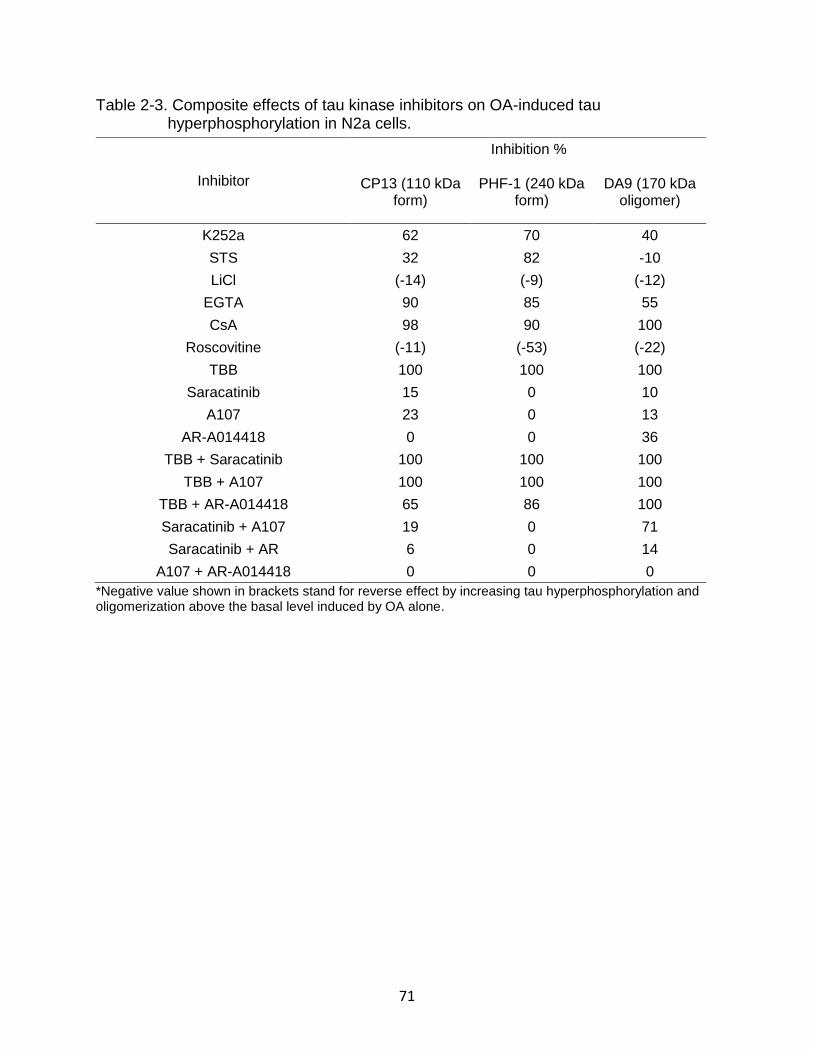
71
Table 2-3. Composite effects of tau kinase inhibitors on OA-induced tau hyperphosphorylation in N2a cells.
*Negative value shown in brackets stand for reverse effect by increasing tau hyperphosphorylation and oligomerization above the basal level induced by OA alone.
Inhibitor
Inhibition %
CP13 (110 kDa form)
PHF-1 (240 kDa form)
DA9 (170 kDa oligomer)
K252a 62 70 40
STS 32 82 -10
LiCl (-14) (-9) (-12)
EGTA 90 85 55
CsA 98 90 100
Roscovitine (-11) (-53) (-22)
TBB 100 100 100
Saracatinib 15 0 10
A107 23 0 13
AR-A014418 0 0 36
TBB + Saracatinib 100 100 100
TBB + A107 100 100 100
TBB + AR-A014418 65 86 100
Saracatinib + A107 19 0 71
Saracatinib + AR 6 0 14
A107 + AR-A014418 0 0 0
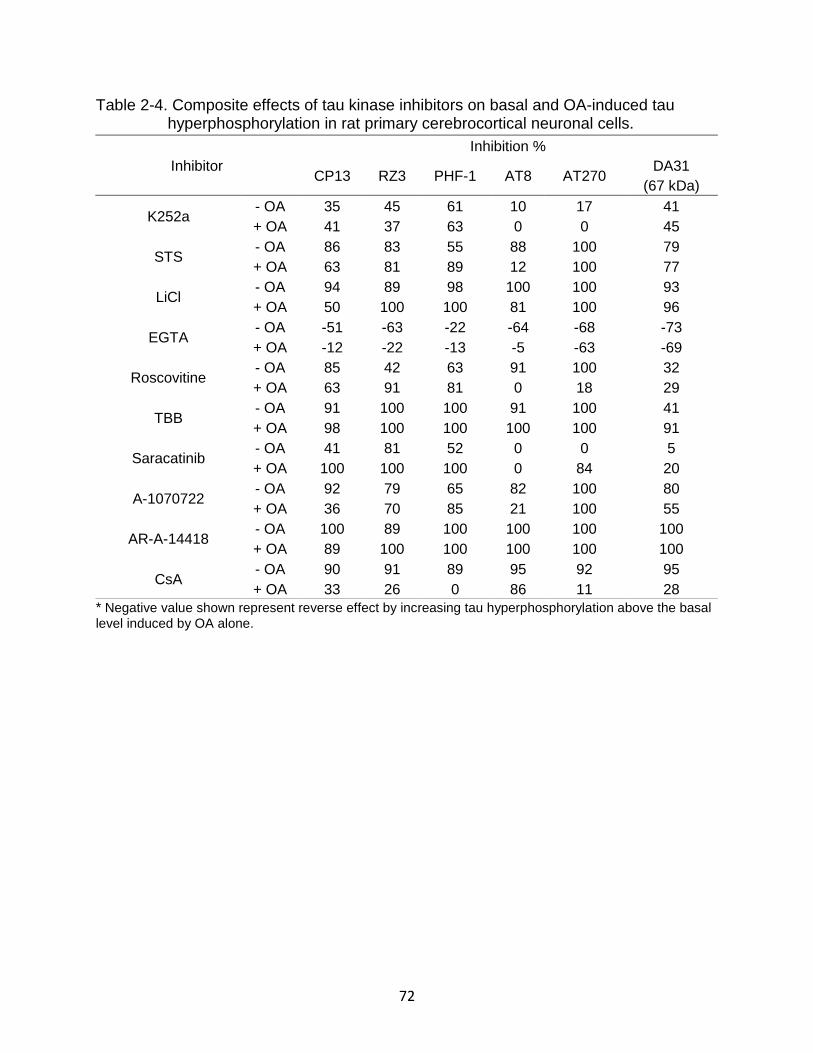
72
Table 2-4. Composite effects of tau kinase inhibitors on basal and OA-induced tau hyperphosphorylation in rat primary cerebrocortical neuronal cells.
* Negative value shown represent reverse effect by increasing tau hyperphosphorylation above the basal
level induced by OA alone.
Inhibitor
Inhibition %
CP13 RZ3 PHF-1 AT8 AT270 DA31
(67 kDa)
K252a - OA 35 45 61 10 17 41
+ OA 41 37 63 0 0 45
STS - OA 86 83 55 88 100 79
+ OA 63 81 89 12 100 77
LiCl - OA 94 89 98 100 100 93
+ OA 50 100 100 81 100 96
EGTA - OA -51 -63 -22 -64 -68 -73
+ OA -12 -22 -13 -5 -63 -69
Roscovitine - OA 85 42 63 91 100 32
+ OA 63 91 81 0 18 29
TBB - OA 91 100 100 91 100 41
+ OA 98 100 100 100 100 91
Saracatinib - OA 41 81 52 0 0 5
+ OA 100 100 100 0 84 20
A-1070722 - OA 92 79 65 82 100 80
+ OA 36 70 85 21 100 55
AR-A-14418 - OA 100 89 100 100 100 100
+ OA 89 100 100 100 100 100
CsA - OA 90 91 89 95 92 95
+ OA 33 26 0 86 11 28

73
Figure 2-1. OA induced tau hyperphosphorylation and oligomerization at different time points in mouse neuroblastoma N2a cells. A. Immunoblots of N2a cells extracted protein (20 µg) using total and phospho-tau antibodies: DA9, CP13, and PHF-1. Blue arrows show phosphorylated and oligomerized tau. Red arrows show minor bands of oligomerized tau. Black arrows show non-phosphorylated tau band. SNJ-1945 (calpain inhibitor) and Z-DCB (caspase inhibitor) were added for 1h before the treatment with OA for 24h. A reverse time course followed OA treatment, and all cells were collected at the same time and conditions. B. Immunoblots quantifications. All data are normalized to β-actin and are expressed as a percentage of control. Data are presented as ± SEM for n=3. Statistical analysis was performed with one-way ANOVA. For multiple comparisons, one-way ANOVA followed by the Bonferroni’s post hoc test was performed. *p<0.05, **p<0.01, ***p<0.001, ****p<0.0001 and ns: non-significant.
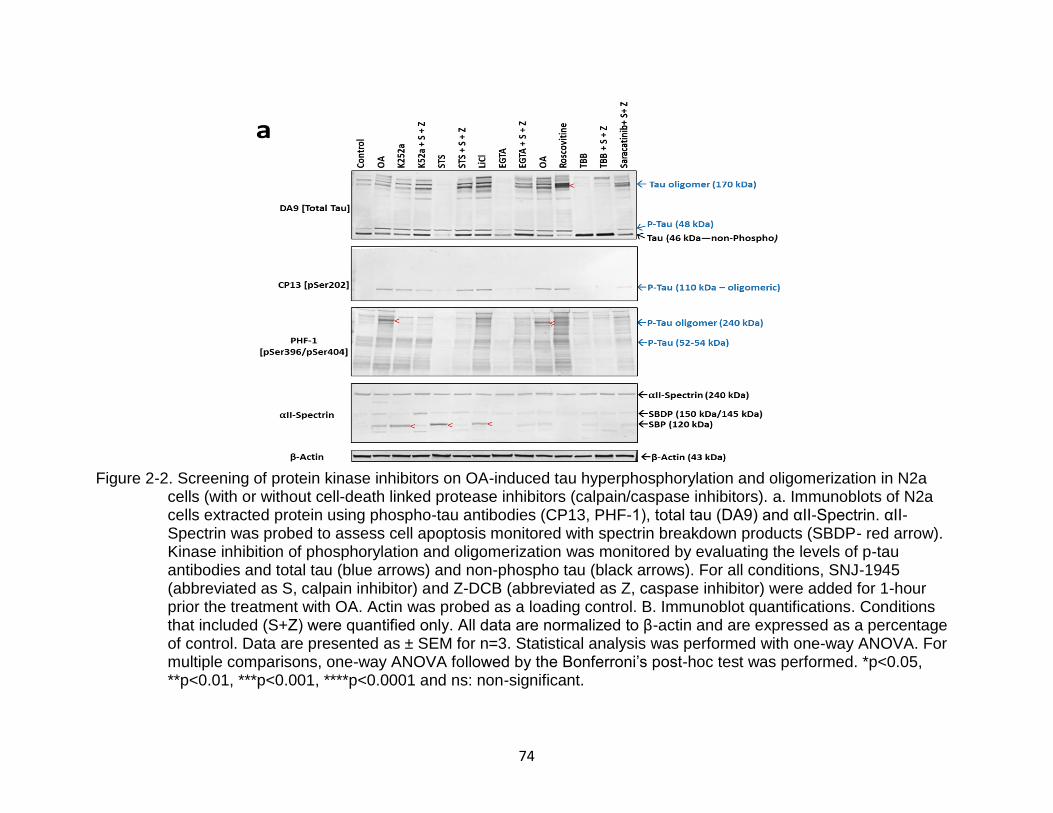
74
Figure 2-2. Screening of protein kinase inhibitors on OA-induced tau hyperphosphorylation and oligomerization in N2a cells (with or without cell-death linked protease inhibitors (calpain/caspase inhibitors). a. Immunoblots of N2a cells extracted protein using phospho-tau antibodies (CP13, PHF-1), total tau (DA9) and αII-Spectrin. αII-Spectrin was probed to assess cell apoptosis monitored with spectrin breakdown products (SBDP- red arrow). Kinase inhibition of phosphorylation and oligomerization was monitored by evaluating the levels of p-tau antibodies and total tau (blue arrows) and non-phospho tau (black arrows). For all conditions, SNJ-1945 (abbreviated as S, calpain inhibitor) and Z-DCB (abbreviated as Z, caspase inhibitor) were added for 1-hour prior the treatment with OA. Actin was probed as a loading control. B. Immunoblot quantifications. Conditions that included (S+Z) were quantified only. All data are normalized to β-actin and are expressed as a percentage of control. Data are presented as ± SEM for n=3. Statistical analysis was performed with one-way ANOVA. For multiple comparisons, one-way ANOVA followed by the Bonferroni’s post-hoc test was performed. *p<0.05, **p<0.01, ***p<0.001, ****p<0.0001 and ns: non-significant.
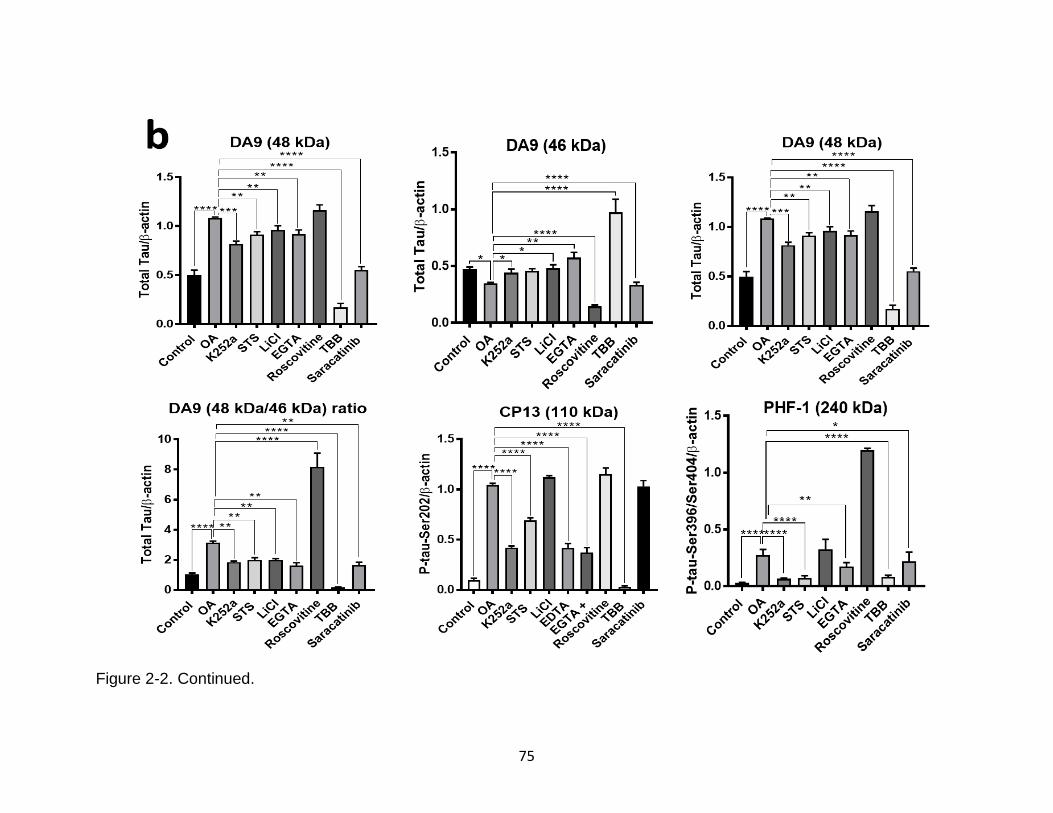
75
Figure 2-2. Continued.
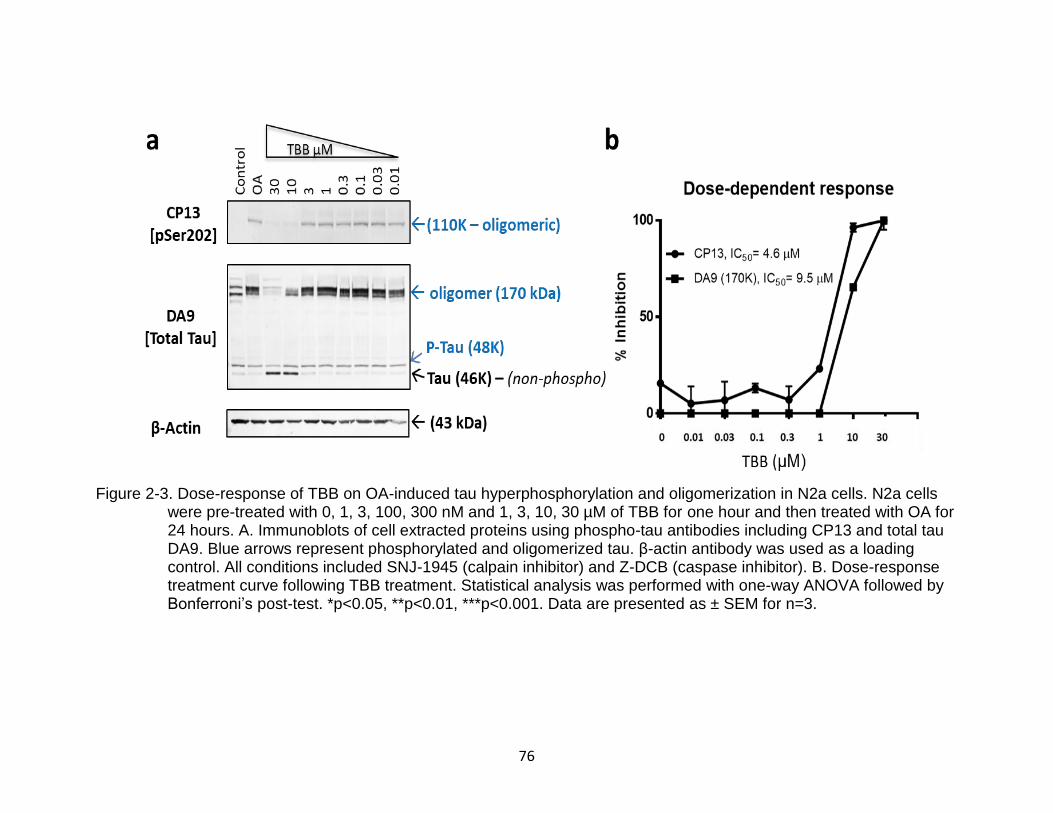
76
Figure 2-3. Dose-response of TBB on OA-induced tau hyperphosphorylation and oligomerization in N2a cells. N2a cells were pre-treated with 0, 1, 3, 100, 300 nM and 1, 3, 10, 30 µM of TBB for one hour and then treated with OA for 24 hours. A. Immunoblots of cell extracted proteins using phospho-tau antibodies including CP13 and total tau DA9. Blue arrows represent phosphorylated and oligomerized tau. β-actin antibody was used as a loading control. All conditions included SNJ-1945 (calpain inhibitor) and Z-DCB (caspase inhibitor). B. Dose-response treatment curve following TBB treatment. Statistical analysis was performed with one-way ANOVA followed by Bonferroni’s post-test. *p<0.05, **p<0.01, ***p<0.001. Data are presented as ± SEM for n=3.
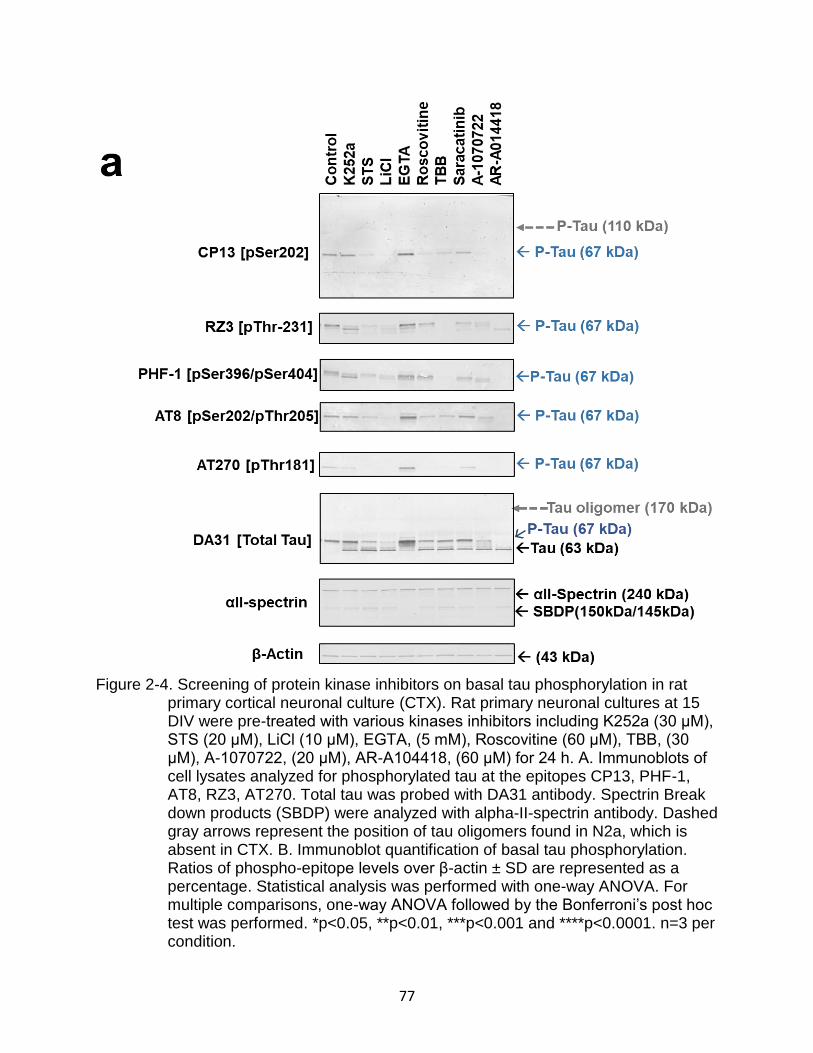
77
Figure 2-4. Screening of protein kinase inhibitors on basal tau phosphorylation in rat primary cortical neuronal culture (CTX). Rat primary neuronal cultures at 15 DIV were pre-treated with various kinases inhibitors including K252a (30 μM), STS (20 μM), LiCl (10 μM), EGTA, (5 mM), Roscovitine (60 μM), TBB, (30 μM), A-1070722, (20 μM), AR-A104418, (60 μM) for 24 h. A. Immunoblots of cell lysates analyzed for phosphorylated tau at the epitopes CP13, PHF-1, AT8, RZ3, AT270. Total tau was probed with DA31 antibody. Spectrin Break down products (SBDP) were analyzed with alpha-II-spectrin antibody. Dashed gray arrows represent the position of tau oligomers found in N2a, which is absent in CTX. B. Immunoblot quantification of basal tau phosphorylation. Ratios of phospho-epitope levels over β-actin ± SD are represented as a percentage. Statistical analysis was performed with one-way ANOVA. For multiple comparisons, one-way ANOVA followed by the Bonferroni’s post hoc test was performed. *p<0.05, **p<0.01, ***p<0.001 and ****p<0.0001. n=3 per condition.
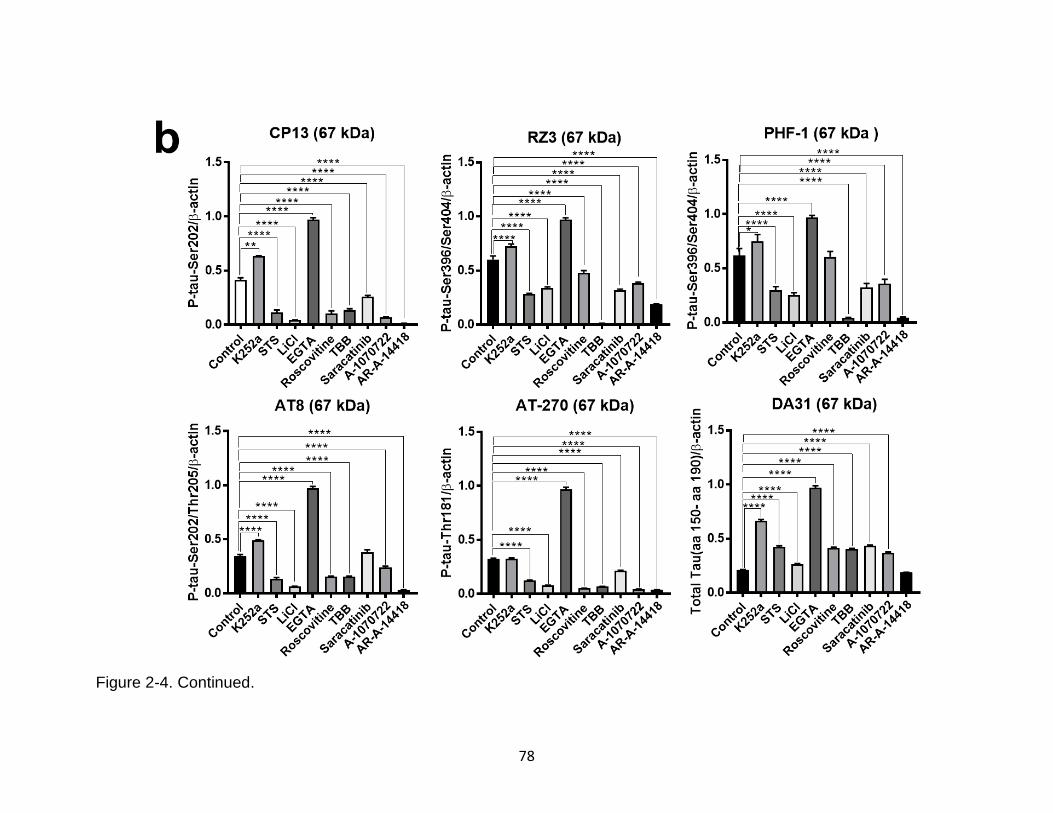
78
Figure 2-4. Continued.
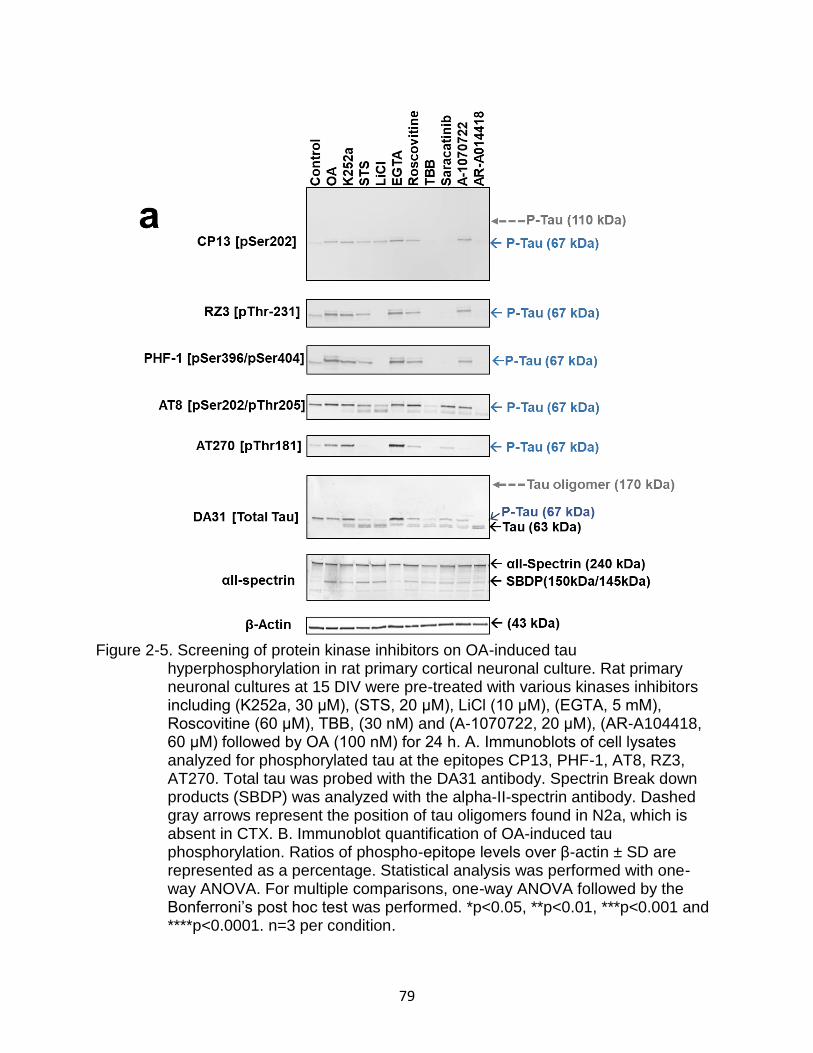
79
Figure 2-5. Screening of protein kinase inhibitors on OA-induced tau hyperphosphorylation in rat primary cortical neuronal culture. Rat primary neuronal cultures at 15 DIV were pre-treated with various kinases inhibitors including (K252a, 30 μM), (STS, 20 μM), LiCl (10 μM), (EGTA, 5 mM), Roscovitine (60 μM), TBB, (30 nM) and (A-1070722, 20 μM), (AR-A104418, 60 μM) followed by OA (100 nM) for 24 h. A. Immunoblots of cell lysates analyzed for phosphorylated tau at the epitopes CP13, PHF-1, AT8, RZ3, AT270. Total tau was probed with the DA31 antibody. Spectrin Break down products (SBDP) was analyzed with the alpha-II-spectrin antibody. Dashed gray arrows represent the position of tau oligomers found in N2a, which is absent in CTX. B. Immunoblot quantification of OA-induced tau phosphorylation. Ratios of phospho-epitope levels over β-actin ± SD are represented as a percentage. Statistical analysis was performed with one-way ANOVA. For multiple comparisons, one-way ANOVA followed by the Bonferroni’s post hoc test was performed. *p<0.05, **p<0.01, ***p<0.001 and ****p<0.0001. n=3 per condition.

80
Figure 2-5. Continued.

81
Figure 2-6. Effect of combining protein kinase inhibitors on OA-induced tau hyperphosphorylation and oligomerization in N2a cells. A. Immunoblots of N2a cells extracted protein using phospho-tau antibodies (CP13, PHF-1, and RZ3), total tau (DA9), and αII-Spectrin. αII-Spectrin was probed to assess cell apoptosis monitored with spectrin breakdown products. For all conditions, SNJ-1945 (calpain inhibitor) and Z-DCB (caspase inhibitor) were added for 1h before the treatment with OA (abbreviated as S+Z). Actin was probed as a loading control. B. Immunoblot quantifications. All data are normalized to β-actin and are expressed as a percentage of control. Data are presented as ± SEM for n=3. Statistical analysis was performed with one-way ANOVA. For multiple comparisons, one-way ANOVA followed by the Bonferroni’s post hoc test was performed. *p<0.05, **p<0.01, ***p<0.001, ****p<0.0001 and ns: non-significant.
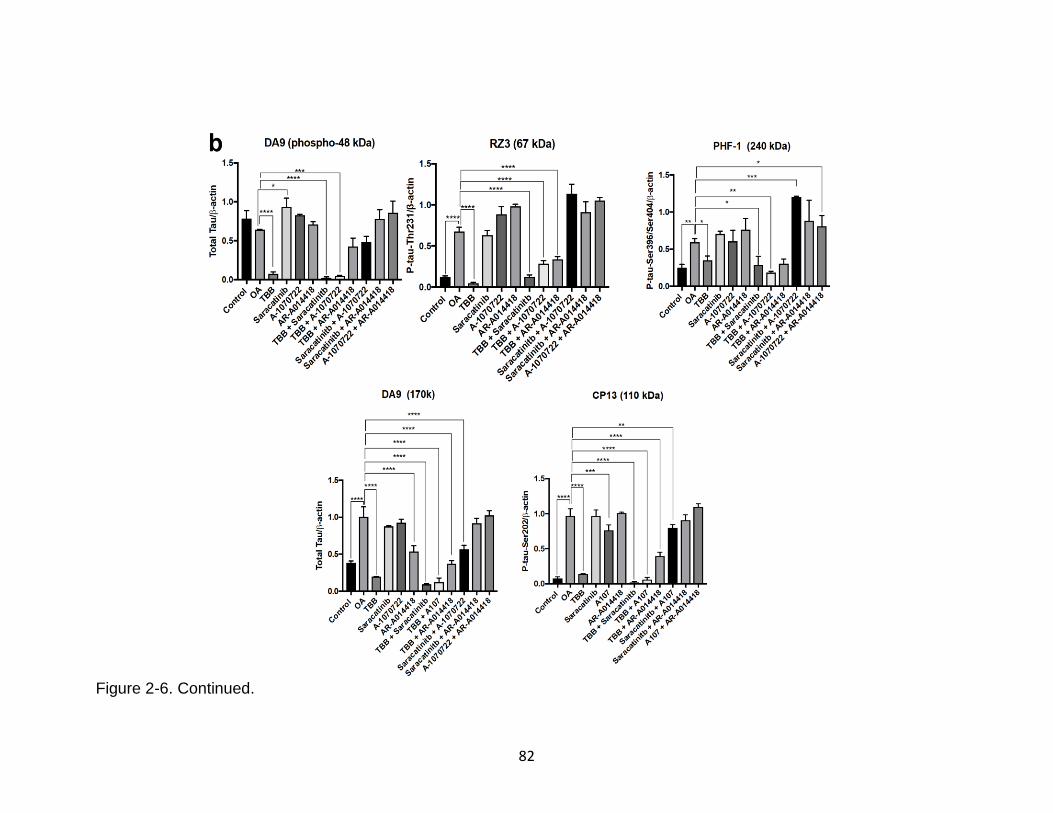
82
Figure 2-6. Continued.
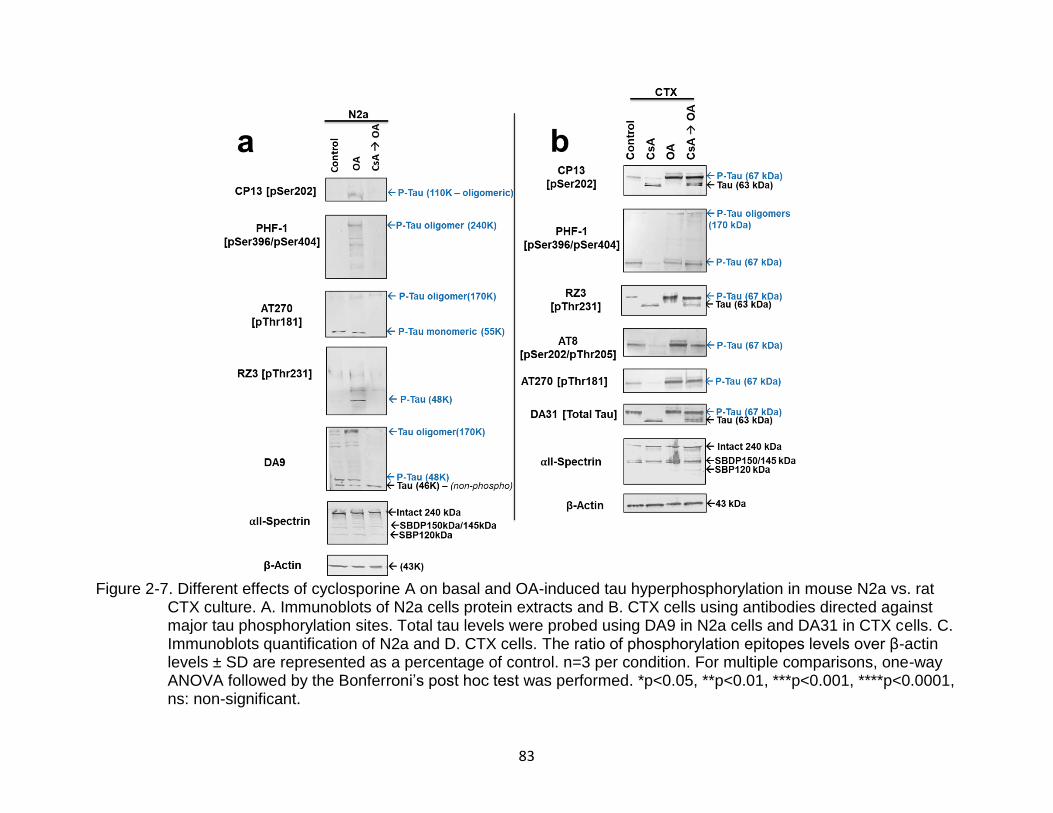
83
Figure 2-7. Different effects of cyclosporine A on basal and OA-induced tau hyperphosphorylation in mouse N2a vs. rat CTX culture. A. Immunoblots of N2a cells protein extracts and B. CTX cells using antibodies directed against major tau phosphorylation sites. Total tau levels were probed using DA9 in N2a cells and DA31 in CTX cells. C. Immunoblots quantification of N2a and D. CTX cells. The ratio of phosphorylation epitopes levels over β-actin levels ± SD are represented as a percentage of control. n=3 per condition. For multiple comparisons, one-way ANOVA followed by the Bonferroni’s post hoc test was performed. *p<0.05, **p<0.01, ***p<0.001, ****p<0.0001, ns: non-significant.
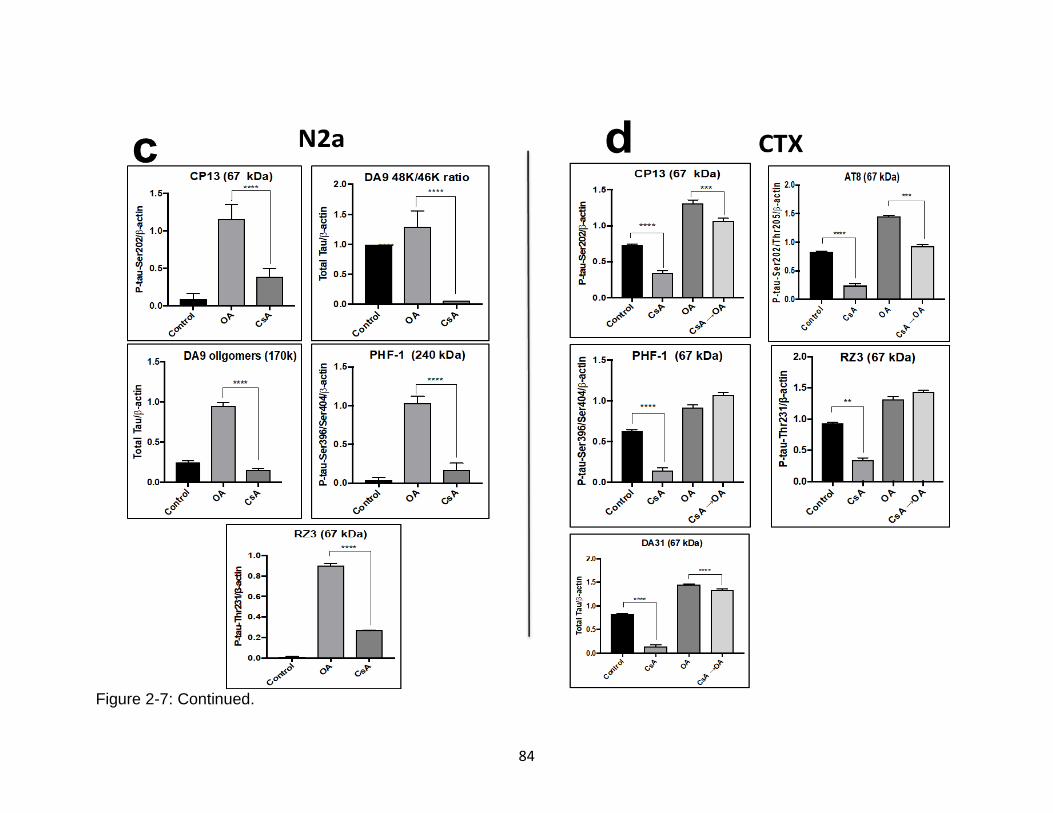
84
Figure 2-7: Continued.
85
CHAPTER 3 IDENTIFICATION OF LOW AND HIGH MOLECULAR WEIGHT TAU FRAGMENTS FOLLOWING IN VITRO CALPAIN DIGESTION AND CELL-BASED NEUROTOXIC
CHALLENGES BY BIOCHEMICAL AND PEPTIDOMIC APPROACHES
Introduction
Microtubule-associated protein tau (MAPT) is a soluble protein whose function is
to control the stability of the axonal microtubules(42). Tau is expressed in the central
nervous system (CNS) and mainly present in neurons and at lower levels in astrocytes
and oligodentrites(42). Tauopathies of the CNS including AD, TBI and Parkinson’s
diseases associate with defective tau protein that can no longer stabilize the
microtubule,(16, 18, 39). Processes occurring in tauopathies disrupt tau physiological
function of microtubule stabilization and formation. Examples of post-translational
modifications (PTMs) that occur in tauopathies include hyperphosphorylation,
acetylation, deamination, glycation, glycosylation, isomerization, methylation, nitration
sumoylation, ubiquitination, and proteolysis(79). Phosphorylation is one of the most
well-characterized and researched PTM of tau, due to its direct ability to disrupt binding
to microtubules and contribution to aggregation as well as neurofibrillary tangles (NFT)
formation(43).
Tau proteolysis has generated a considerable amount of research interest
because of its involvement with tauopathies, mainly through calpain activation(172).
Calpain family consist of 14 different-cysteine-dependent proteases that are regulated
by calcium binding to a specific conserved site in all members of the family(80). Tau
proteolysis by calpain-1 and 2 contribute to opposing functions of regulating synaptic
plasticity and neurodegeneration. Calcium-mediated proteolytic cleavage of tau by
calpain can lead to the production of truncated tau break down products (tau-BDP)
86
which are susceptible to hyperphosphorylation and aggregation processes. Moreover,
calpain can degrade a wide variety of cytoskeletal proteins such as microtubule-
associated protein 2 (MAP2) and αII-spectrin(80, 173, 174).
Calpain-mediated αII-spectrin cleavage products are used to detect post-TBI
axonal injury and neurodegeneration following TBI(84). Calpain degradation of tau
produces a 35K tau fragment and a 17K tau fragment that can contribute to neurotoxic
events within the brain cells.(175) In AD tauopathy, increased calpain activity and
decreased levels of endogenous calpain inhibitor, calpastatin, have been reported(176).
A study of 17K tau-BDP have shown decreased microtubule binding ability of tau and
increased susceptibility to accumulation in the perikarya(175). Another study showed
that amyloid-β (Aβ) could activate calpain in cultured hippocampal neurons, producing
the 17K tau-BDP and cause neurodegeneration properties, which are delayed by
inhibition of calpain activation.(177) Calpain is also an upstream activator of
extracellular-regulated kinase (ERK), which can phosphorylate tau protein(178).
Increase in ERK expression leads to early accumulation of tau in neurons and glia in
various tauopathies(179).
Most proteomics studies nowadays follow the bottom-up approach where protein
samples are digested with trypsin, followed by different fractionation techniques for
peptide identification. This approach results in the generation of tryptic peptides and
leads to fragmentation of native endogenous peptides present in the samples; thus,
making their identification a challenge. Although structural and functional studies of tau
protein have been researched extensively in the past, studies characterizing the
endogenous low molecular weight (LMW, ≤10K) tau peptides are of interest due to their
87
association with a disease state. These natural peptides could reflect several active
processes occurring in vivo in the human brain such as enzymatic/proteolytic activity,
exocytosis, and tau aggregation. The standard analytical proteomics platforms utilize
trypsin digestion and produce tryptic peptides that can be used for quantification using
mass spectrometric analysis. One of the major disadvantages of proteomic studies is
the loss of valuable natural peptide information present in the biological samples leading
to the generation of artificial tryptic peptides ending with Lysine and Arginine residues.
This might be useful for increasing the identification and proteome coverage given the
abundance of Lys and Arg residues in a particular protein. However, the natural
released peptides following traumatic brain injuries and other neurodegenerative
diseases provide valuable use for biomarker studies that can be applied in diagnosis
and therapy “theranostic”. This is defined as peptidomics and any peptidomic approach
involves studying the entire set of naturally occurring endogenous peptides in biological
samples. To our knowledge, there are no peptidomic studies performed systematically
to identify low molecular weight tau peptides as biomarker candidates for
neurodegenerative diseases.
Thus, this chapter aims to characterize tau peptides generated from calpain or
under different cell-based neurotoxic conditions. To achieve this goal, we performed an
in vitro calpain-1 digestion of purified human tau-441(non-phosphorylated and
phosphorylated) and naïve transgenic human tau (htau) mice to study intact or high
molecular weight (HMW) and LMW tau products by western blotting and nLC-ESI-
MS/MS, respectively. We have also used non-phosphorylated and phosphorylated tau
to survey for unique LMW peptidome generated by calpain-1. To take this a step further,
88
we have used rat primary cerebrocortical neuronal culture (CTX) to study HMW and
LMW tau fragments generated when challenged with neurotoxic conditions that trigger
necrosis (MTX), apoptosis (STS), calcium influx (A23187). Moreover, CTX culture was
treated with okadaic acid (OA) to induce tau hyperphosphorylation, test the differential
susceptibility of tau to proteolysis, and analyze the release of LMW proteolytic
fragments in conditioned cell media.
OA is well known to specifically inhibit protein phosphatases 1/2A, which results
in tau hyperphosphorylation within the afflicted cells(180). Therefore, OA was used to
serve as a tauopathy-relevant cell-based model. The processed biological samples
were subjected to ultrafiltration devices with molecular weight cut-off (MWCO) value of
10K. This method was used to enrich LMW fractions that were analyzed by nanoLC-
tandem mass spectrometry. We were able to detect novel proteolytic tau peptides that
might be linked to neurodegeneration, as they were exclusively present in treatments
but not in controls. We were also able to derive calpain-1 cleavage sites using our MS
data. Moreover, we identified phosphorylated sites that that could be critical to the
pattern of calpain-1 proteolysis of tau protein. Our findings might aid in developing
promising future neurotherapeutic strategies with an emphasis on the suppression of
tau proteolysis and biomarker candidates for neurodegenerative diseases.
Material and Methods
Ethics Statement
All animal studies conformed to the guidelines outlined in the ‘Guide for the Care
and Use of Laboratory Animals’ from the National Institutes of Health and were
approved by the University of Florida.
89
Mouse Brain Collection and Samples Preparation
In our study, all mice used aged three months. For naïve transgenic human tau
mouse brain samples, mice were anesthetized and killed by decapitation. Subsequently,
the cortex and hippocampus part of the brains were removed and flash-frozen in liquid
nitrogen. The brain samples were pulverized to a fine powder using a mortar and a
pestle set in dry ice and chilled with liquid nitrogen. The fine powder was then
transferred to microcentrifuge tubes (Eppendorf). The brain powder was lysed with 1%
Triton X-100 lysis buffer containing 20 Mm Tris HCl, pH 7.0, 5 mM EDTA, protease and
phosphatase inhibitor cocktail and 1 mM DTT in LC-MS grade water. The brain lysates
were incubated at 4°C for 120 minutes kept at a tube revolver (Thermo scientific) at low
speed. Following the incubation, the samples were centrifuged at 10,000 x g for 15
minutes at 4°C, and the supernatant was transferred to new tubes. The protein
concentration was determined by performing protein assay using bicinchoninic acid
microprotein assays (Pierce Inc., Rockford, IL, USA) against albumin standards. The
brain lysates were then stored at – 80°C until further use.
In Vitro Calpain-1 Digestion of Purified Tau and Naïve Mouse Brain Lysate
Purified recombinant human tau-441 protein (non-phosphorylated and
phosphorylated; five µg each; rPeptideTM) or mouse cortex naïve brain lysate (10 µg)
were used for the study. The reaction buffer contained 1 mM of DTT (Sigma), 1 mM of
CaCl2 and 100 mM Tris/HCl (pH 7.4). The samples were diluted with ultra-pure water
for a final volume of 100 µl per reaction. The samples were incubated with calpain-1
(Enzo Life Sciences; 1µg/µL) for 1 hour at 30oC followed by addition of 1µM of SNJ-
1945 to stop the reaction (calpain inhibitor; Senju Pharmaceutical Co. Ltd., Kobe,
Japan). Calpain-1 was titrated in the ratio of 1:10, 1:25, 1:50, 1:100, and 1:250 (enzyme
90
to protein ratio). The control contained only the purified protein or naïve mouse brain
sample without the addition of calpain enzyme.
Rat Primary Cerebrocortical Neuronal (CTX) Culture
Rat primary cerebrocortical neuronal culture (CTX) were harvested from a
homogenized pool of 1-day old Sprague–Dawley rat brains and were plated on poly-L-
lysine-coated 12-well culture plates (Erie Scientific, Portsmouth, NH, USA) at a density
of 4.36 × 10⁵ cells/ml. Cultures were maintained in Dulbecco’s modified Eagle’s medium
(DMEM) with 10% fetal bovine serum in a humidified incubator in an atmosphere of
10% CO2 at 37°C. After three days, the DMEM solution was replaced with another
DMEM solution containing 1% cytosine arabinoside (ARC). Two days later, the solution
was replaced with DMEM. The cells were cultured for an additional ten days before use.
Subsequent media changes were done twice a week.
Neurotoxic Challenges
Complete media was replaced with Serum-free medium, Neurobasal-A (Gibco)
consisting of 1% (v/v) B-27 supplement (Gibco), 1 mM L-glutamine (Sigma) and 1%
(v/v) penicillin-streptomycin (Sigma) in a total volume of 500 µl per well in a twelve-well
plate. In addition to untreated controls, the following conditions were used: apoptotic
inducer STS (staurosporine; 0.5 µM; Sigma) that activate calpain and caspase-3,
calcium ionophore A23187 (calcimycin; 20 µM; Sigma, St. Louis, MO, U.S.A.), and
maitotoxin (MTX; 10 nM; Sigma) for 16 hours. A23187 and MTX both acts by activating
extracellular calcium channels leading to an increase of cytosolic Ca2+ ions, and
indirectly can activate calpain-1 and -2. The conditions mentioned above were
pretreated with or without okadaic acid (OA; 100 nM; Cell Signaling) for 6 hours prior
the additions of STS, A23187, and MTX challenges.
91
Preparation and Collection of Cell Lysate and Conditioned Media
After the treatment, conditioned media were collected from each well, added into
separate tubes on ice, and centrifuged at 10,000 x g for 10 min at 4°C. The
supernatants were collected frozen at –80°C until further analysis. As for the attached
CTX cells, 100 µl per well of lysis buffer that included:1 mM DTT, 1x phosphatase
inhibitors (Sigma), 1% Mini-complete protease inhibitor cocktail tablet (Roche
Biochemicals) and 1% Triton X-100 (Sigma) was added. The attached cells were then
scraped down into the lysis buffer and collected into a separate 1.5 ml Eppendorf tubes.
The cell lysates were incubated for 90 minutes at 4°C and then centrifuged at 15,000
rpm for 15 minutes to remove cell debris. The supernatants were collected and frozen at
–80°C until analyzed by SDS-PAGE followed by western blotting.
Sample Preparation and Ultrafiltration
The calpain-1 digested purified tau protein, mouse brain lysate, and CTX
conditioned cell media were loaded into 10K molecular weight cut-off (MWCO)
membrane filter (Vivacon 500 HY, Sartorius Stedim Biotech, Goettingen, Germany) and
centrifuged at 3000g at 4°C for 60 min. Each condition was prepared in three biological
replicates (n=3). The filtrates were evaporated until dryness using speed vacuum
(Thermo Scientific) and reconstituted in 20 µL of LC-MS grade 0.1% formic acid in
water. The samples were stored at –80°C pending analysis. The retentate fractions
were saved for SDS-PAGE described in the following section. As for the cell conditioned
media from CTX culture, the same protocol mentioned above was followed except
subjecting the filtrates to ZipTip cleanup (Millipore Sigma) before nLC-ESI-MS/MS
analysis. The ZipTip C18 (0.6 μL bed volume; 5 μg) were conditioned with 3 x 10 μL of
100% ACN and equilibrated by 3 x 10 μL of 0.1% FA, after which the samples were
92
aspirated ten times for maximum binding. The samples were then washed 1 x 10 μL
0.1% FA and subsequently eluted with ten microliters of 70% ACN, 0.1% FA. Finally,
the eluate solvents were evaporated in speedvac until dryness and stored at –80°C.
The samples were re-suspended in 10 μL 0.1% FA.
Gel Electrophoresis and Western Blotting
Equal amounts of purified protein (5 μg), CTX lysate and mouse brain lysate
proteins (20 μg) were prepared for SDS–PAGE in 8 x Laemli loading buffer containing
0.25 M Tris (pH 6.8), 5% beta-mercaptoethanol (BME), 8% SDS and 0.02%
bromophenol blue. Samples were subjected to SDS-PAGE on 4-20% precast-gels for
60 min at a constant voltage of 200V. After separation, the gels were transferred on to
PVDF membranes using iBlot transfer (Invitrogen, Life Technologies).
The membranes were blocked in 5% milk prepared in TBST for 1 hour. After
blocking. The membranes were incubated at 4°C overnight with continuous shaking with
primary antibodies. Primary antibodies used include PHF-1, CP-13, RZ3 (a gift from
Peter Davies, Albert Einstein College of Medicine, Bronx, NY) and total tau (DA9 and
DAKO). αII-spectrin antibody (BML-FG6090, ENZO Life Sciences, Farmingdale, NY,
USA) was used to assess cell injury.
β-actin and UCH-L1 antibody were used as loading control. After overnight
primary antibody incubation, membranes were washed three times with TBST and
probed using anti-rabbit or anti-mouse IgG conjugated to alkaline phosphatase
(Amersham, Piscataway, NJ, USA), for 1 hour at room temperature and
Immunoreactive bands were detected by developing with nitro blue tetrazolium, and 5-
bromo-4-chloro- 3-indolyl phosphate (BCIT/NBT) (KPL, Gaithersburg, MD, USA). A
250K to 14K-rainbow molecular weight marker (RPN800E, GE Healthcare, Biosciences,
93
Pittsburgh, PA, USA) was used to estimate the molecular weight of the proteins.
Quantitative evaluation of protein levels was performed via computer-assisted
densitometric scanning (NIH ImageJ, version 1.6 software).
Nano-LC-ESI-MS/MS
The filtrate fractions were vortexed for 15 s and centrifuged at 15,000 rpm for 2
min. This step was repeated twice to make sure all the residues has been dissolved.
The samples were transferred into auto-sampler microvial tubes avoiding any air-
bubbles. Five microliters of each sample were injected into the nanoLC system (Waters
NanoAcquity UPLC system). The separation column used was C18, (130Å, 1.7 µm, 100
μm X 100 mm; Waters) fitted with a C18 trap column (5 µm Symmetry 180 µm x 20 mm)
coupled to linear ion trap mass spectrometry (LTQ-XL; Thermo Scientific). The flow rate
was set to 300 nL/min. Peptide separation was achieved using a 120 min linear
gradient, running from 1—50% of solvent B (0.1% formic acid in 100% acetonitrile).
Tandem mass spectrometry was performed on LTQ-XL (Thermo, San Jose, CA, USA).
The mass spectrometer was calibrated using the positive ion standard calibration
solution (Thermo) to maintain the accuracy of the instrument. The peptide samples
eluted from the reversed-phase column were introduced into the mass spectrometer
using a nano-spray ionization source (ADPC-IMC adaptor, New Objective). The mass
spectrometer was operated in a data-dependent acquisition mode with a spray voltage
of 2.1 kV, ion transfer tube voltage at 35 V, and an ion transfer tube temperature at
275oC. The fragmentation mode was set to collision-induced dissociation (CID) with
Helium gas as the collision gas.
The sheath and auxiliary gases were set to zero. The ion signal threshold was
set to 1000 for MS/MS. The normalized collision energy was set to 35%, activation of
94
q=0.25, and activation time of 30 ms for MS/MS acquisitions. The instrument setting for
MS scan was: m/z 300-1800, max injection time 200 ms; AGC target 1e6. Data-
dependent acquisition mode with automatic switching between MS and MS/MS modes
was employed. CID MS/MS was set to collect the top ten most abundant ions for
fragmentation. The isolation width was set to m/z 1.5. The CID target value was set to
10,000 ions for fragmentation. The following dynamic exclusion setting was applied to
precursor ions chosen for MS/MS analysis: repeat count—1; repeat duration—30 s; and
exclusion duration—120 s. The neutral loss experiment where data-dependent settings
were chosen to trigger an MS3 scan when a neutral loss of 97.97, 48.99 or 32.66 m/z
units (corresponding to singly, doubly or triply charged phosphorylated daughter mass
ions, respectively) was detected among the most abundant ten product-ions to enhance
the fragmentation of phosphopeptides. Multistage activation feature was enabled on X
caliber 2.4.1 for neutral loss detection. Each analysis was repeated three times to
confirm the reliability of the mass spectrometric analysis.
Thermo Orbitrap Fusion Tribrid Mass Spectrometer Analysis
Filtrate peptides were desalted with C18-solid phase extraction according to
manufacturer protocol. For high-resolution analysis, we used a Thermo Orbitrap Fusion
tribrid mass spectrometer with high energy collisional dissociation (HCD) in each MS
and MS/MS cycle (Thermo Scientific, Bremen, Germany). The instrument was run in
data-dependent mode with a full MS (m/z 400–2000) resolution of 70 000 and ten
MS/MS experiments (HCD NCE = 28%, isolation width = 3 Th, first mass = 105 Th, 5%
underfill ratio, peptide match set to “preferred”, and an AGC target of 1e6). Dynamic
exclusion for 10 s was used to prevent repeated analysis of the same peptides, and a
lock mass of m/z 445.12003 (polysiloxane ion) was used for real-time internal
95
calibration. The MS system was interfaced with an automated Easy-nLC 1000 system
(Thermo Fisher Scientific, Bremen, Germany). Each sample fraction was loaded onto
an Acclaim Pepmap 100 precolumn (20 mm × 75 μm; 3 μm-C18) and separated on an
Easy-Spray analytical column (500 mm × 75 μm; 2 μm-C18) at a flow rate at 300 nL/min
during a linear gradient from solvent A (0.1% formic acid (v/v)) to 25% solvent B (0.1%
formic acid (v/v), 99.9% acetonitrile (v/v)) for 280 min, followed by ramping up to 98%
solvent B for an additional 20 min. Peptides were sprayed into the orifice of the mass
spectrometer, which was operated in an information-dependent data acquisition mode.
Data Analysis
The MS/MS data analysis was done using Proteome Discoverer 2.2. (Thermo).
The MS and MS/MS spectra were searched against mouse tau (UniProt Identifier:
P10637), rat tau (Identifier: P19332) and human (Identifier: P10636) tau isoforms (all
accessed Sept 2017 from UniProtKB/Swiss-Prot) using their fasta file through Sequest
HT 2.5.0 search engine. Since we selected non-specific enzymatic digestion in Sequest
HT, it would take a longer time to analyze the whole rat, mouse, and human proteome
database. Therefore, we created a subset database that includes only tau isoforms from
the mentioned species above. To validate that the identified peptides are only present in
tau and not another protein, we searched the raw files using the protein BLAST
database. Moreover, we did compare one sample search against the whole human
proteome and tau-441 to make sure there are no discrepancies in the search algorithms
between and no differences in the detected peptides (Figure 3-18).
The minimum and the maximum peptide length were set to 6 and 30,
respectively. The search was performed with no enzyme specificity; oxidized
methionine; phosphorylated serine, threonine, and tyrosine (+79.9663 Da) as dynamic
96
modifications. For the LTQ-XL instrument the precursor mass error tolerance was set to
1.5 Da, and product ion tolerance was set to 0.8 Da.
For the Orbitrap Fusion Tribrid instrument the precursor mass error tolerance
was set to 10 ppm, and daughter ion tolerance was set to 0.6 Da. The tandem mass
spectra and product-ions were inspected manually to make sure the quality of the CID
fragmentation and phosphorylation site identified. The following peptide scores selected
were: ΔCn >0.1, PSM>20 and XCorr>2. A target FDR value of 1% was set for decoy
searches. The phosphorylation sites probabilities were assigned using ptmRS node on
Proteome Discoverer 2.2, which localize phosphorylation sites based on the search
engine identification.
Statistical Analysis
Statistical analysis was performed GraphPad Prism 7.0 (GraphPad, La Jolla, CA)
with one-way ANOVA Tukey’s Test. For multiple comparisons, one-way ANOVA
followed by the Bonferroni’s post hoc test was performed. *p<0.05, **p<0.01,
***p<0.001, **** p<0.0001, ns: non-significant. Peptides presented had at least an XCorr
value of 2, two PSM, and high confidence to be included for the analysis. Peptides with
p-values<0.05 were reported.
Results and Discussion
Tau proteolytic fragments produced by calpain and other proteases following TBI
can potentially play a role in hyperphosphorylation and aggregation (43, 71, 79, 181) In
this study, we designed a simple protocol to collect and enrich the endogenous peptides
from proteolytic cleavages induced by calpain-1 or cell-based neurotoxic activation
system to mimic the conditions of neurodegenerative diseases such as TBI. Figure 3-1
shows the overall workflow utilized in this chapter. In the initial step of this workflow, we
97
added calpain-1 to purified tau-441 (non-phosphorylated and phosphorylated forms)
protein (Figure 3-1A) and transgenic mouse brain lysate (Figure 3-1B). We have
included the non-phosphorylated and phosphorylated tau-441 (tau and p-tau) protein in
our study to account for the differential proteolytic peptides generated by calpain
digestion to mimic pathological processes that occur in the neurodegenerative brain.
The ultrafiltration technique allows simultaneous monitoring of intact parent
protein, high molecular weight tau breakdown products (HMW tau-BDP; retentate
≥10K), and the low molecular weight tau products (LMW tau-BDP; filtrate ≤10K). We
implemented the use of 500 μL capacity ultrafiltration devices with a molecular weight
cut-off (MWCO) value of 10K membrane filter. After centrifugation at 3500 x g for 30
min, we subjected the ultrafiltrate fraction containing the enriched proteolytic peptide
pool from the samples to nano-LC-ESI-MS/MS analysis (Figure 3-1A, 1B, 1C). We
analyzed the retentate fraction (≥10K) that contained the enriched intact protein and
higher molecular weight breakdown products (HMW-BDP) of the bio-sample by SDS-
PAGE followed by western blotting analysis. The reason behind choosing the 10K
MWCO was to reduce the possibility of losing peptides that had a complex secondary
structure or tertiary structure and thus might not pass through lower MWCO due to the
smaller filter pore size (e.g., 3K MWCO). Moreover, the ultrafiltration techniques allow
isolation of high abundance large fragments, which make up the bulk of the protein
content and lower abundance proteolytic peptides; thus, enabling detection of lower
molecular weight peptide fragments (Figure 3-1A, 1B, 1C).
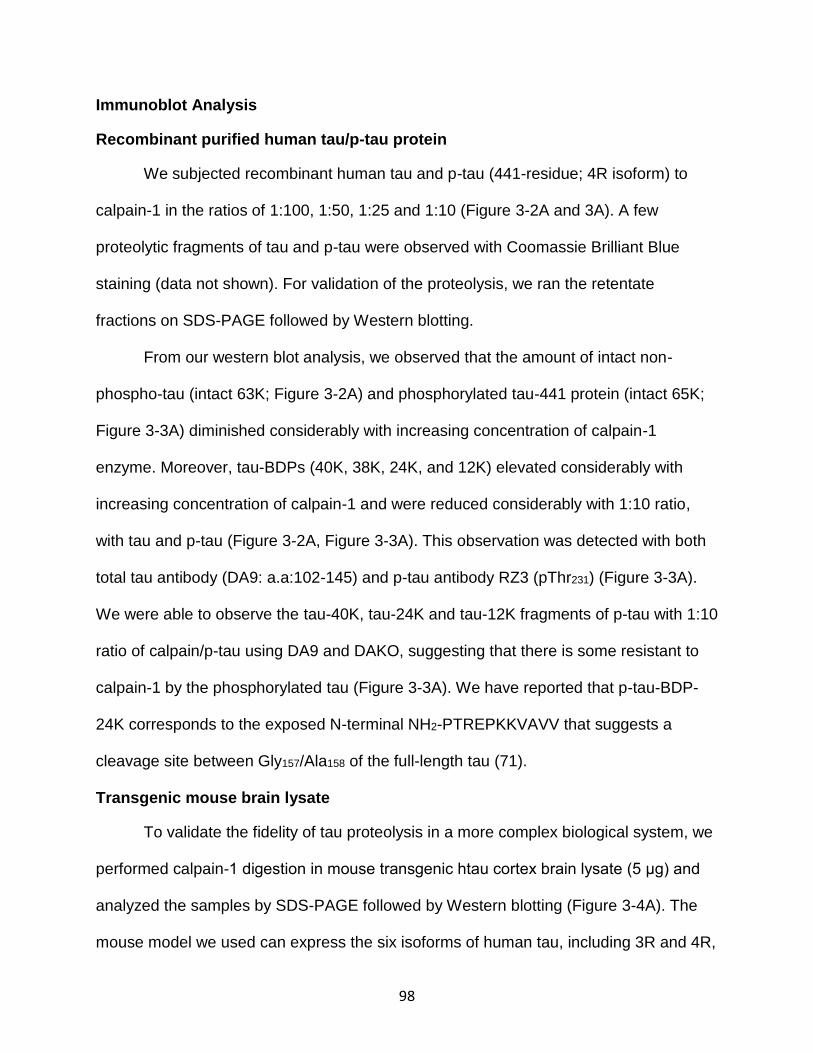
98
Immunoblot Analysis
Recombinant purified human tau/p-tau protein
We subjected recombinant human tau and p-tau (441-residue; 4R isoform) to
calpain-1 in the ratios of 1:100, 1:50, 1:25 and 1:10 (Figure 3-2A and 3A). A few
proteolytic fragments of tau and p-tau were observed with Coomassie Brilliant Blue
staining (data not shown). For validation of the proteolysis, we ran the retentate
fractions on SDS-PAGE followed by Western blotting.
From our western blot analysis, we observed that the amount of intact non-
phospho-tau (intact 63K; Figure 3-2A) and phosphorylated tau-441 protein (intact 65K;
Figure 3-3A) diminished considerably with increasing concentration of calpain-1
enzyme. Moreover, tau-BDPs (40K, 38K, 24K, and 12K) elevated considerably with
increasing concentration of calpain-1 and were reduced considerably with 1:10 ratio,
with tau and p-tau (Figure 3-2A, Figure 3-3A). This observation was detected with both
total tau antibody (DA9: a.a:102-145) and p-tau antibody RZ3 (pThr231) (Figure 3-3A).
We were able to observe the tau-40K, tau-24K and tau-12K fragments of p-tau with 1:10
ratio of calpain/p-tau using DA9 and DAKO, suggesting that there is some resistant to
calpain-1 by the phosphorylated tau (Figure 3-3A). We have reported that p-tau-BDP-
24K corresponds to the exposed N-terminal NH2-PTREPKKVAVV that suggests a
cleavage site between Gly157/Ala158 of the full-length tau (71).
Transgenic mouse brain lysate
To validate the fidelity of tau proteolysis in a more complex biological system, we
performed calpain-1 digestion in mouse transgenic htau cortex brain lysate (5 μg) and
analyzed the samples by SDS-PAGE followed by Western blotting (Figure 3-4A). The
mouse model we used can express the six isoforms of human tau, including 3R and 4R,
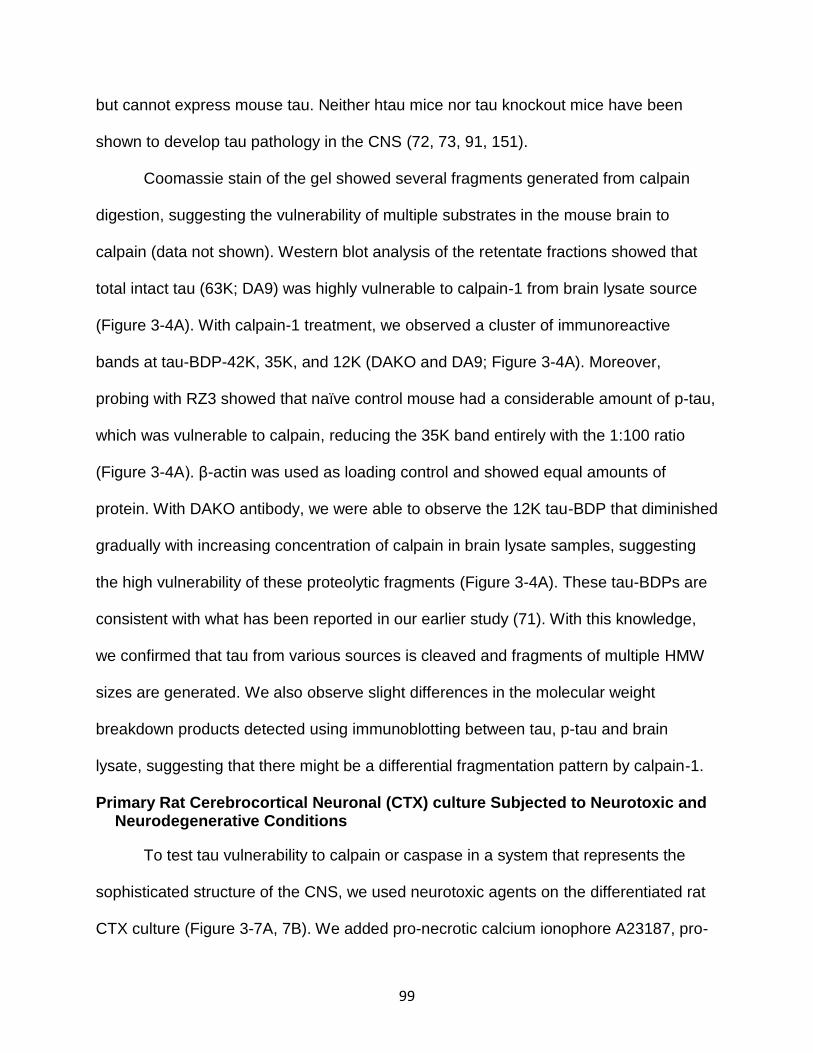
99
but cannot express mouse tau. Neither htau mice nor tau knockout mice have been
shown to develop tau pathology in the CNS (72, 73, 91, 151).
Coomassie stain of the gel showed several fragments generated from calpain
digestion, suggesting the vulnerability of multiple substrates in the mouse brain to
calpain (data not shown). Western blot analysis of the retentate fractions showed that
total intact tau (63K; DA9) was highly vulnerable to calpain-1 from brain lysate source
(Figure 3-4A). With calpain-1 treatment, we observed a cluster of immunoreactive
bands at tau-BDP-42K, 35K, and 12K (DAKO and DA9; Figure 3-4A). Moreover,
probing with RZ3 showed that naïve control mouse had a considerable amount of p-tau,
which was vulnerable to calpain, reducing the 35K band entirely with the 1:100 ratio
(Figure 3-4A). β-actin was used as loading control and showed equal amounts of
protein. With DAKO antibody, we were able to observe the 12K tau-BDP that diminished
gradually with increasing concentration of calpain in brain lysate samples, suggesting
the high vulnerability of these proteolytic fragments (Figure 3-4A). These tau-BDPs are
consistent with what has been reported in our earlier study (71). With this knowledge,
we confirmed that tau from various sources is cleaved and fragments of multiple HMW
sizes are generated. We also observe slight differences in the molecular weight
breakdown products detected using immunoblotting between tau, p-tau and brain
lysate, suggesting that there might be a differential fragmentation pattern by calpain-1.
Primary Rat Cerebrocortical Neuronal (CTX) culture Subjected to Neurotoxic and Neurodegenerative Conditions
To test tau vulnerability to calpain or caspase in a system that represents the
sophisticated structure of the CNS, we used neurotoxic agents on the differentiated rat
CTX culture (Figure 3-7A, 7B). We added pro-necrotic calcium ionophore A23187, pro-
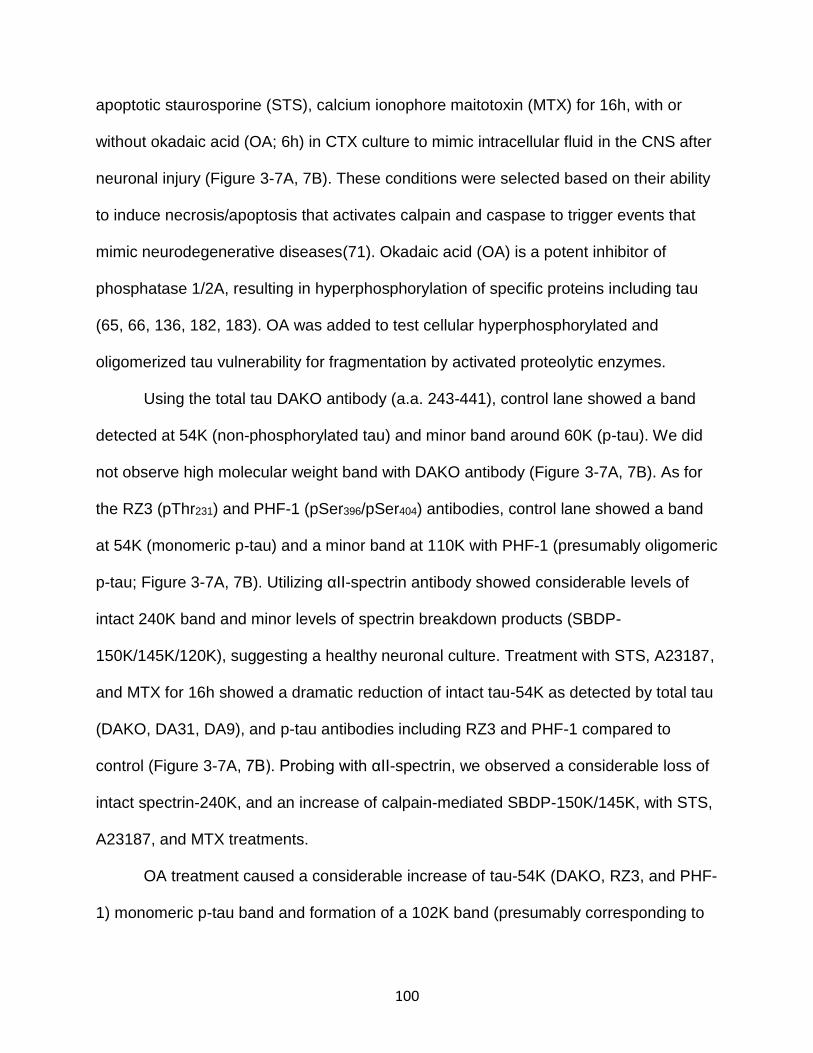
100
apoptotic staurosporine (STS), calcium ionophore maitotoxin (MTX) for 16h, with or
without okadaic acid (OA; 6h) in CTX culture to mimic intracellular fluid in the CNS after
neuronal injury (Figure 3-7A, 7B). These conditions were selected based on their ability
to induce necrosis/apoptosis that activates calpain and caspase to trigger events that
mimic neurodegenerative diseases(71). Okadaic acid (OA) is a potent inhibitor of
phosphatase 1/2A, resulting in hyperphosphorylation of specific proteins including tau
(65, 66, 136, 182, 183). OA was added to test cellular hyperphosphorylated and
oligomerized tau vulnerability for fragmentation by activated proteolytic enzymes.
Using the total tau DAKO antibody (a.a. 243-441), control lane showed a band
detected at 54K (non-phosphorylated tau) and minor band around 60K (p-tau). We did
not observe high molecular weight band with DAKO antibody (Figure 3-7A, 7B). As for
the RZ3 (pThr231) and PHF-1 (pSer396/pSer404) antibodies, control lane showed a band
at 54K (monomeric p-tau) and a minor band at 110K with PHF-1 (presumably oligomeric
p-tau; Figure 3-7A, 7B). Utilizing αII-spectrin antibody showed considerable levels of
intact 240K band and minor levels of spectrin breakdown products (SBDP-
150K/145K/120K), suggesting a healthy neuronal culture. Treatment with STS, A23187,
and MTX for 16h showed a dramatic reduction of intact tau-54K as detected by total tau
(DAKO, DA31, DA9), and p-tau antibodies including RZ3 and PHF-1 compared to
control (Figure 3-7A, 7B). Probing with αII-spectrin, we observed a considerable loss of
intact spectrin-240K, and an increase of calpain-mediated SBDP-150K/145K, with STS,
A23187, and MTX treatments.
OA treatment caused a considerable increase of tau-54K (DAKO, RZ3, and PHF-
1) monomeric p-tau band and formation of a 102K band (presumably corresponding to
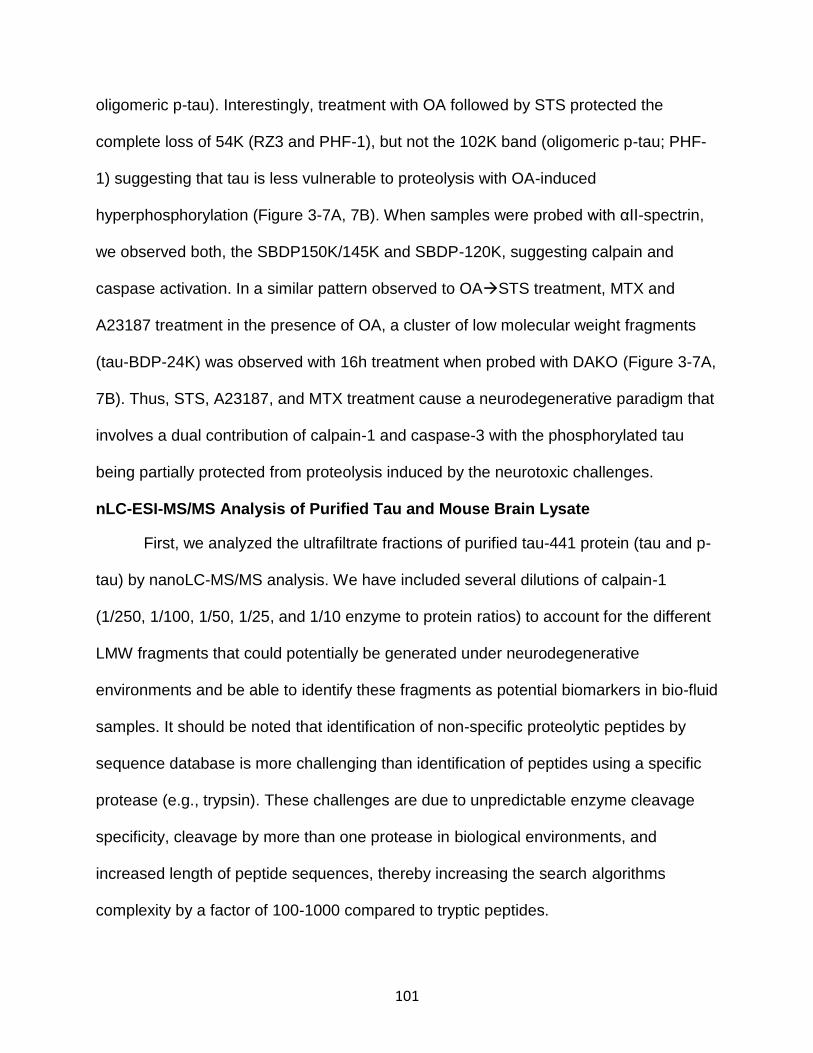
101
oligomeric p-tau). Interestingly, treatment with OA followed by STS protected the
complete loss of 54K (RZ3 and PHF-1), but not the 102K band (oligomeric p-tau; PHF-
1) suggesting that tau is less vulnerable to proteolysis with OA-induced
hyperphosphorylation (Figure 3-7A, 7B). When samples were probed with αII-spectrin,
we observed both, the SBDP150K/145K and SBDP-120K, suggesting calpain and
caspase activation. In a similar pattern observed to OASTS treatment, MTX and
A23187 treatment in the presence of OA, a cluster of low molecular weight fragments
(tau-BDP-24K) was observed with 16h treatment when probed with DAKO (Figure 3-7A,
7B). Thus, STS, A23187, and MTX treatment cause a neurodegenerative paradigm that
involves a dual contribution of calpain-1 and caspase-3 with the phosphorylated tau
being partially protected from proteolysis induced by the neurotoxic challenges.
nLC-ESI-MS/MS Analysis of Purified Tau and Mouse Brain Lysate
First, we analyzed the ultrafiltrate fractions of purified tau-441 protein (tau and p-
tau) by nanoLC-MS/MS analysis. We have included several dilutions of calpain-1
(1/250, 1/100, 1/50, 1/25, and 1/10 enzyme to protein ratios) to account for the different
LMW fragments that could potentially be generated under neurodegenerative
environments and be able to identify these fragments as potential biomarkers in bio-fluid
samples. It should be noted that identification of non-specific proteolytic peptides by
sequence database is more challenging than identification of peptides using a specific
protease (e.g., trypsin). These challenges are due to unpredictable enzyme cleavage
specificity, cleavage by more than one protease in biological environments, and
increased length of peptide sequences, thereby increasing the search algorithms
complexity by a factor of 100-1000 compared to tryptic peptides.
102
To increase the confidence of our matches, we performed the database searches
using false discovery rate (FDR) of 1%, searched against a decoy database, used
minimally five peptide sequence matches (PSMs) based on MS/MS, and an XCorr value
of 2. We identified peptides relating to the protein turnover. All peptides, which are
found in control, were excluded from our bioinformatics analysis.
Since we are interested tau protein fragments in this study, our database search
included only the tau protein (based on UniProt, Human Proteome Org, and Human
Protein Atlas organ distribution datasets). To make sure there are no discrepancies
between the matches, we selected one representative sample of tau digest and ran a
global human proteome search as well as a targeted search against tau-441
(accession# P10636-8). We did not observe any difference in peptide identifications
between the global human proteome search and targeted tau search (Table 3-5; Figure
3-18).
We also were able to observe exclusive tau peptide fragments that were only
present in either the non-phosphorylated or the phosphorylated form of tau but not in
both fractions (Table 3-1 and 3-2). We also observed a variation in the length of the
core peptide identified, suggesting the ability of calpain to multi-process tau residues
further as it becomes more active (Figure 3-2C, 3-3C).
We have implemented the use of PSM counts (spectral count based on MS/MS)
to account for the abundance of each proteolytic peptide in the different samples. This
method can be applied with confidence since each peptide reported was identified at
least five times. Only peptides with high confidence were considered. Figure 3-2B, 3-3B,
103
are plots of peptides with the highest PSM number versus m/z observed in the tau and
p-tau filtrate fractions.
The N-terminal core peptide AEPRQEFEVMEDHAGTYG (a.a.: 2-19) with m/z
689.625 was observed in tau and p-tau with varying lengths on the C-terminal,
extending 4-5 amino acid residues (Figure 3-2C; Figure 3-3C;). This N-terminal
fragment might be linked to Johnson et al. group reported fragmented species which
predominantly consisted of the N-terminus tau using epitope-specific antibodies in
human CSF samples (79). Figure 3-13 shows the product spectrum of
AEPRQEFEVMEDHAGTYG. Other fragments of particular interest are the C-terminal
peptides: SPRHLSNVSSTGSIDMVDSPQLATLADEVS (a.a 404-433) with m/z 1038.75
and TLADEVSASLAKQGL (a.a. 427-441) which are both observed with tau and p-tau
samples. We were able to identify these peptides in varying lengths from the N-terminal
and C-terminal domains (Figure 3-2C; Figure 3-3C). Figure 3-14 shows the product
spectrum of SPRHLSNVSSTGSIDMVDSPQLATLADEVS peptide released from
calpain-1 digestion.
As for brain Lysate filtrate fractions, we have identified two clusters of N-terminal,
the middle region, and C-terminal domain peptides with a fragmentation pattern that is
very closely similar to the recombinant purified tau-441 calpain-mediated proteolysis
pattern (Table 3-3; Figure 3-4B, 3-4C). We have noted that the core sequence region
a.a.:413-441 protein coverage of brain lysate considerably overlaps with the purified tau
protein coverage (Figure 3-2C, 3-3C, 3-4C), suggesting that calpain-1 digested the
cellular htau similar to purified htau protein. Around 110 peptides were exclusively found
from p-tau, 202 peptides from non-phosphorylated tau, 20 peptides from brain lysate,
104
and 24 peptides were found in all samples (Figure 3-5B). Of particular interest as
biomarkers are the C-terminal domain peptides from brain lysate that overlap with the
purified tau fragments including SPRHLSNVSSTGSIDMVDSPQLA (a.a. 404-426),
ASLAKQGL STGSIDMVDSPQLA (aa 413-426), and TLADEVSASLAKQGL (aa 427-
441) (Figure 3-4C and 3-6C). Figure 3-16 shows the product spectrum of the
phosphorylated peptide STGSIDMVDSPQLA released from calpain-1 digestion. Figure
3-4B summarizes the top 10 highest PSM score of calpain-mediated tau peptides from
purified and brain lysate source. Collectively from our bioinformatic analysis, we
identified a total of 404 peptides from tau, 312 from p-tau and 45 peptides from brain
lysate with 24 there are in common between the three samples (n=3). Figure 3-5A
shows a composite summary of representative calpain-mediated proteolytic peptides
identified from tau, ptau, and mouse brain lysate. Figure 3-5B shows a Venn diagram
with the total number of peptides released in each of the biological replicates from the
different samples. The identified peptides are usually spanning either the N-terminal
domain, middle domains or C-terminal domain. Figure 3-5C shows a schematic of
human tau-441 and summarizes the predicted calpain-1 cleavage sites and
phosphorylation sites detected in our study.
Another well-known approach for monitoring peptide abundance for peptidomics
studies is implementing the use of peak intensity. Peak intensity involves the calculation
of the ion current of the peptide as it elutes from LC/MS usually integrating signal over
the entire elution period, measuring the peak value. Figure 3-2D, 3-3D, and 3-4D
demonstrate the peptidome profile of purified human tau, p-tau, and mouse brain lysate
digested by calpain-1 respectively based on their intensity. At each amino acid residue
105
along the protein, the height of the green bars is proportional to the count of peptides
overlapping this position. The intensity of the color (green) is proportional to the sum of
the peptide intensities overlapping this position. The proteolytic peptide profile of tau
and p-tau shows a similar distribution of count and intensity. The brain lysate tau
peptides showed the highest intensity around the C-terminal region. Such differences
might be due to the sample heterogeneity and tau tertiary/quaternary structure
complexity for allowing different access for the enzyme.
Figure 3-6 shows a peptigram of longest tau isoform (P10636; a.a. 758) identified
peptides alignment map generated from ProViz web-based visualization tool (184). The
map alignment was created using a compiled excel file that contains the highest ranked
calpain-mediated peptides (total of 50 peptides) from tau, p-tau, and brain lysate to
determine the potential cleavage sites of calpain. A cluster of varying lengths of the
peptides AEPRQEFEVMEDHAGTYG (a.a. 2-19) and
LGDRKDQGGYTMHQDQEGDTDAGLK (a.a. 20-44) has been identified with high
intensity, suggesting a cleavage site between G19/L20, spanning the N-terminal region of
tau (Figure 3-6A). The tau fragments 26-44, 26-44, 1-44 and 45-441 have been
reported as calpain-1-mediated fragments causing NMDAR-mediated cell death in
cerebellar granule cells (79). Moreover, a cluster of varying lengths of the peptides
SETSDAKSTPTAEDVTAPLVDEGAPGKQA (a.a. 61-89) and
AAQPHTEIPEGTTAEEAGIGDTPSLE (a.a. 90-115) has been identified with high
intensity, suggesting a cleavage site between A89/A90 (Figure 3-6B). The peptides
spanning the C-terminal domain RENAKAKTDHGAEIVYKSPVVSGDT (a.a.696-720)
and SPRHLSNVSSTGSIDMVDSPQLATLADEVS (a.a. 721-750) suggest calpain
106
cleavage site at Thr720/Ser721 (Figure 3-6C). To our knowledge, these calpain-1
cleavage sites have not been reported previously. Figure 3-11 shows sequence
coverage of human tau-441with phosphorylation sites identified using proteome
discoverer 2.2. The coverage of Tau-441 included the N-terminal, mid domain, and C-
terminal domains. Figure 3-12 shows sequence coverage of peptides identified from
human Tau-776 isoform. Unique peptides and phosphorylation sites were identified
from tau-776 isoform and not in tau-441 (Figure 3-12). Figure 3-17 shows a general
protein alignment from the human tau-441 isoform and human longest isoform tau-776,
highlighting the overlapping amino acids in red. The alignment was generated using
BLAST software from NCBI website. The tau-776 is subjected to genetic alternative
splicing leading to the production of tau-441.
Conditioned Media of CTX Culture Analysis by nLC-ESI-MS/MS
Cell conditioned media were a starting material for the identification of
neuropeptides, prohormones growth factors and cytokines (185). With technological
advances in mass spectrometry, conditioned media received attention as a source for
discovering novel primary cleavage sites for peptides processing, ectodomain, and
regulated and neurotoxic proteolytic peptides. Therefore, conditioned media from CTX
culture treated with necrotic and apoptotic agents were collected for analysis by nLC-
ESI-MS/MS to search for tau proteolytic fragments released in response to neurotoxic
challenges.
Cells within a biological system secrete tau as full-length or proteolytic fragments,
depending on cellular environments. Table 3-4 shows the list of peptides identified from
CTX culture conditioned media. We did not observe N-terminal tau peptides in our
analysis (Figure 3-8A). All peptide clusters were identified starting around a.a. 200-700
107
range on the rat tau isoform. One of interest is the C-terminal peptide,
PRHLSNVSSTGSIDMVDSPQLA (a.a. 716-737; accession number P10637),
corresponding to the amino acid 405-426 on human tau-441 isoform, which we have
seen with our in vitro experiment with tau (Figure 3-6B, 3-6C). Figure 3-15 shows the
product spectrum of the peptide PRHLSNVSSTGSIDMVDSPQLA released from
conditioned cell media of primary cerebrocortical cultures. We also observed unique
peptides from the high molecular weight form of tau (rat Tau-752; accession number
P19332-1) (Figure 3-8C and 3-9A). A cluster of similar peptides was observed in htau
mouse brain digested by calpain-1. The presence of the LMW C-terminal tau fragments
agrees with the work showing that synaptosomes from AD brains had high levels of tau
fragments (20-22K), with the majority lacking the C-terminal domain (79). Our peak
intensity analysis overlaps with the PSM counts showing high peptide intensity around
a.a. residue 210-250, 400-450, and a.a. 700-737 of rat tau (Figure 3-8B). We did not
observe peptide released with high confidence from control or OA treatment for 16h.
One might expect such outcome as OA treatment causes hyperphosphorylation of tau
making it less vulnerable to proteolysis.
With STS treatment, we observed the highest number of hits of proteolytic tau
peptides when compared to other tested conditions. One peptide observed in our in
vitro digestion is STGSIDMVDSPQL (a.a.724-736), with a phosphorylation site
probability of 99% at Ser724 residue (corresponding to pSer413 on human tau441)
(Figure 3-10). The rat tau sequences including a.a. 114-201, and a.a. 241- 444 are
missing from the human ta-441 isoform (Figure 3-10A). Due to these variances in amino

108
acid sequences, one might expect different cleavage by proteolytic enzymes. Figure 3-
10B shows rat tau-752 and tau-441 equivalent phosphorylation sites.
STS is a pan-kinase inhibitor that is known to induce apoptosis by activating
caspase-3(164). Others and we have identified a.a. 413-414 as caspase-3 cleavage site
on the human tau-441, suggesting the involvement of caspase-3 in the generation of
this fragment (71, 79). When cells were pretreated with OA followed by STS, we
observed unique fragments not found with STS treatment alone (Figure 3-10A). As for
A23187, no high confidence fragments were detected with and without OA pretreatment
(n=3). An explanation might be that A23187 did not produce LMW (<5K) fragments
released into the conditioned media during the 16h treatment; therefore, a longer time-
course treatment time is needed to confirm this observation. Lastly, MTX (with and
without OA) treatment resulted in peptides of varying length ranging from a.a. 377 to
441 on the rat tau-752 (Figure 3-8B and Figure 3-9A).
Phosphorylation Sites Analysis
As for the phosphorylation sites, we were able to identify novel sites on the p-tau
that are not found in the non-phosphorylated tau-441, particularly close to the C-
terminal domain including Thr63, Thr101, Ser400, Thr403, Ser412, and Tyr394 (Figure 3-7C).
Phosphorylation sites such as Thr69, Ser199, Ser202, Ser396, and Ser404 are associated
with AD brain (59, 60, 68). These phosphorylation sites might cause a differential
pattern of calpain recognition of tau sequence, producing unique peptides fragments.
As for CTX conditioned media, phosphorylated sites that are detected with and
without OA pretreatment are shown in Figure 3-9B. Phosphorylation at pSer724 on
STGSIDMVDSPQL (a.a.724-736) is of interest. It might be possible that
phosphorylation on pSer724 is required for the process of cleaving tau at a.a.
109
Ser723/Ser724 site, as it has been suggested that tau has a dynamic secondary structure
that demands a stereospecific angle, affected by the phosphorylation state to allow the
proteolytic enzyme to access the cleavage site. Alternatively, phosphorylation of
pSer724 might have resulted after tau cleavage as a requirement for the enzyme to
access this site.
Conclusions
In this study, we used in vitro analysis of calpain-mediated tau fragments as a
template to mimic the proteolysis of tau protein post-TBI mimicking other
neurodegenerative disorders including the CTE and FTD. Based on the data from our
immunological and peptidomic study that calpain-1 produced distinct clusters of N-
terminal (e.g., 2-19) and C-terminal peptides (e.g., 413-441) with varying lengths from
purified tau, mouse brain lysate, and cell-based neurotoxic challenges. To our
knowledge, this is the first systematic approach to characterize calpain-mediated
proteolytic fragments of tau protein for a unique peptidome biomarker library using
ultrafiltration-based nanoLC-MS/MS platform. Peptidomic data derived from this work
can serve as a novel approach in clinical diagnosis and therapy approach defined as
“theranostic”.
Our overall data in this study shows that tau is not only degraded into sizeable
molecular weight fragments by calpain but also into small fragments which are low in
molecular weight peptides that could simultaneously play a pathological role in the
neurodegenerative diseases such as Alzheimer’s disease, schizophrenia, CTE, and
TBI. Our results also were consistent with studies that showed the high vulnerability of
tau to calpain producing BDPs of varying length depending on the stage of the injury.
Thus, these results may be used in parallel in clinical studies to monitor the activity of
110
calpain and to investigate if similar patterns of tau peptides are generated in a disease
state, or to monitor the effect of pharmaceutical drugs. A future direction of our work is
to perform functional immunoassays to assess the potential role of these endogenous
peptides in tauopathies disorders, which may include aggregation and
hyperphosphorylation processes.
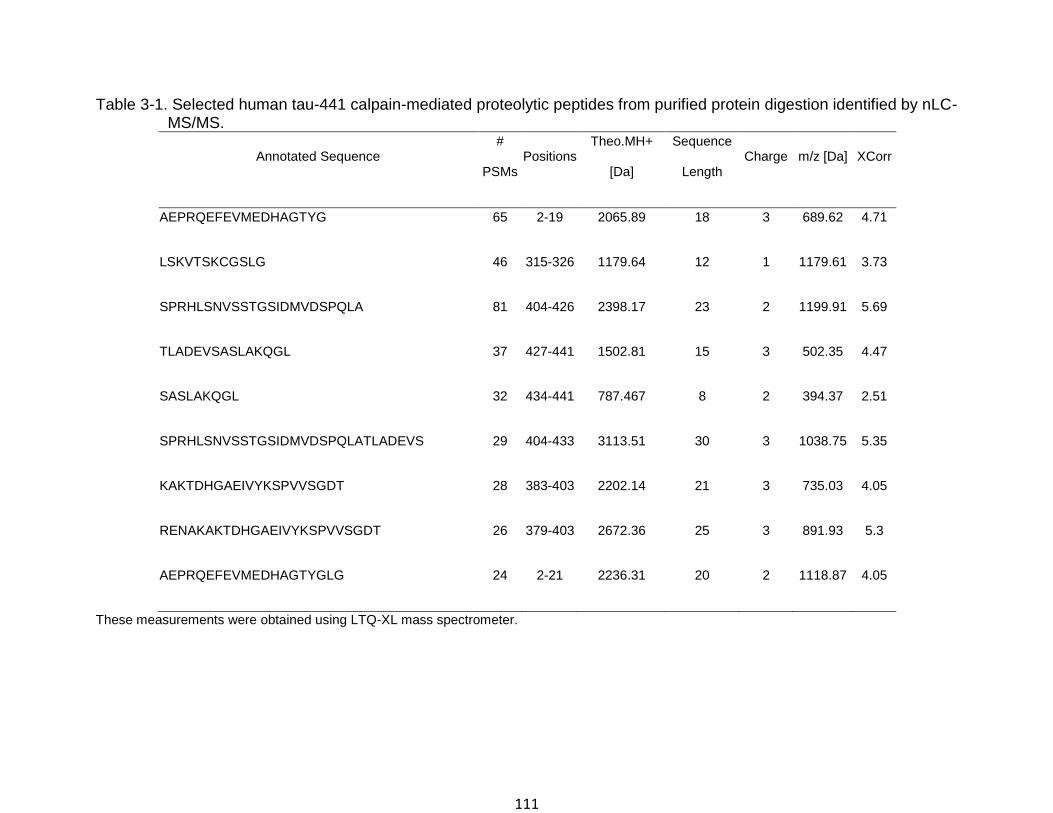
111
Table 3-1. Selected human tau-441 calpain-mediated proteolytic peptides from purified protein digestion identified by nLC-MS/MS.
Annotated Sequence #
PSMs Positions
Theo.MH+
[Da]
Sequence
Length Charge m/z [Da] XCorr
AEPRQEFEVMEDHAGTYG 65 2-19 2065.89 18 3 689.62 4.71
LSKVTSKCGSLG 46 315-326 1179.64 12 1 1179.61 3.73
SPRHLSNVSSTGSIDMVDSPQLA 81 404-426 2398.17 23 2 1199.91 5.69
TLADEVSASLAKQGL 37 427-441 1502.81 15 3 502.35 4.47
SASLAKQGL 32 434-441 787.467 8 2 394.37 2.51
SPRHLSNVSSTGSIDMVDSPQLATLADEVS 29 404-433 3113.51 30 3 1038.75 5.35
KAKTDHGAEIVYKSPVVSGDT 28 383-403 2202.14 21 3 735.03 4.05
RENAKAKTDHGAEIVYKSPVVSGDT 26 379-403 2672.36 25 3 891.93 5.3
AEPRQEFEVMEDHAGTYGLG 24 2-21 2236.31 20 2 1118.87 4.05
These measurements were obtained using LTQ-XL mass spectrometer.
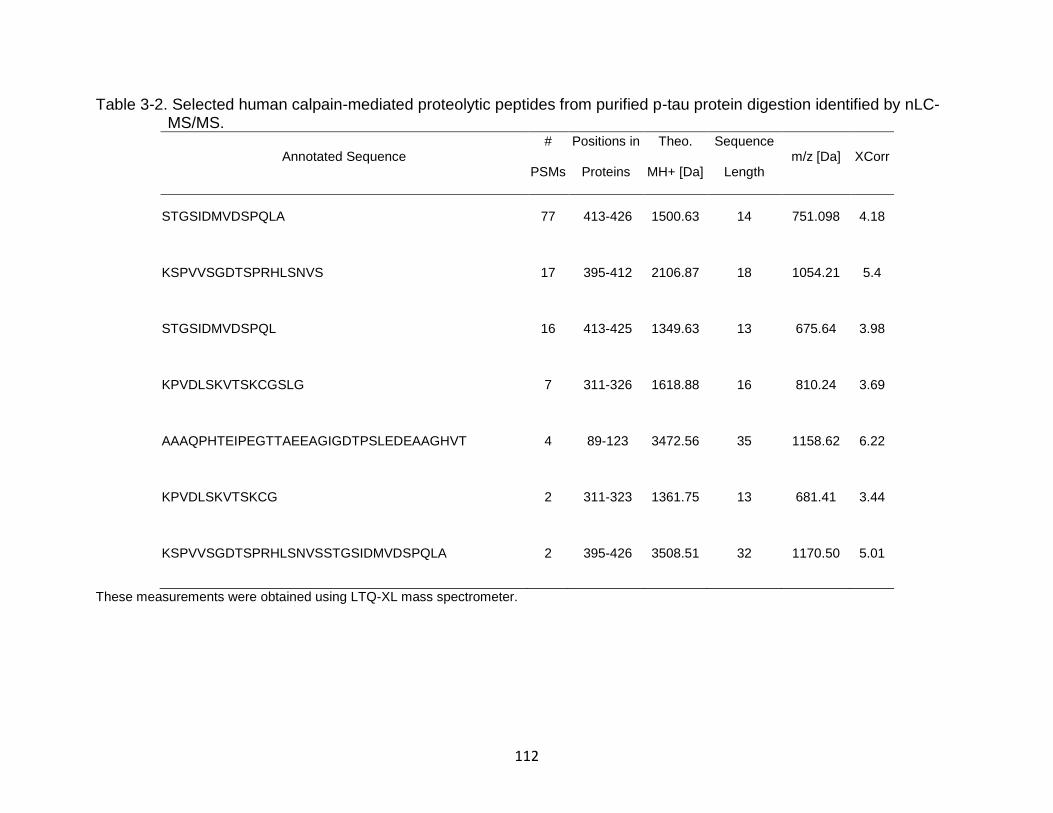
112
Table 3-2. Selected human calpain-mediated proteolytic peptides from purified p-tau protein digestion identified by nLC-MS/MS.
Annotated Sequence #
PSMs
Positions in
Proteins
Theo.
MH+ [Da]
Sequence
Length m/z [Da] XCorr
STGSIDMVDSPQLA 77 413-426 1500.63 14 751.098 4.18
KSPVVSGDTSPRHLSNVS 17 395-412 2106.87 18 1054.21 5.4
STGSIDMVDSPQL 16 413-425 1349.63 13 675.64 3.98
KPVDLSKVTSKCGSLG 7 311-326 1618.88 16 810.24 3.69
AAAQPHTEIPEGTTAEEAGIGDTPSLEDEAAGHVT 4 89-123 3472.56 35 1158.62 6.22
KPVDLSKVTSKCG 2 311-323 1361.75 13 681.41 3.44
KSPVVSGDTSPRHLSNVSSTGSIDMVDSPQLA 2 395-426 3508.51 32 1170.50 5.01
These measurements were obtained using LTQ-XL mass spectrometer.
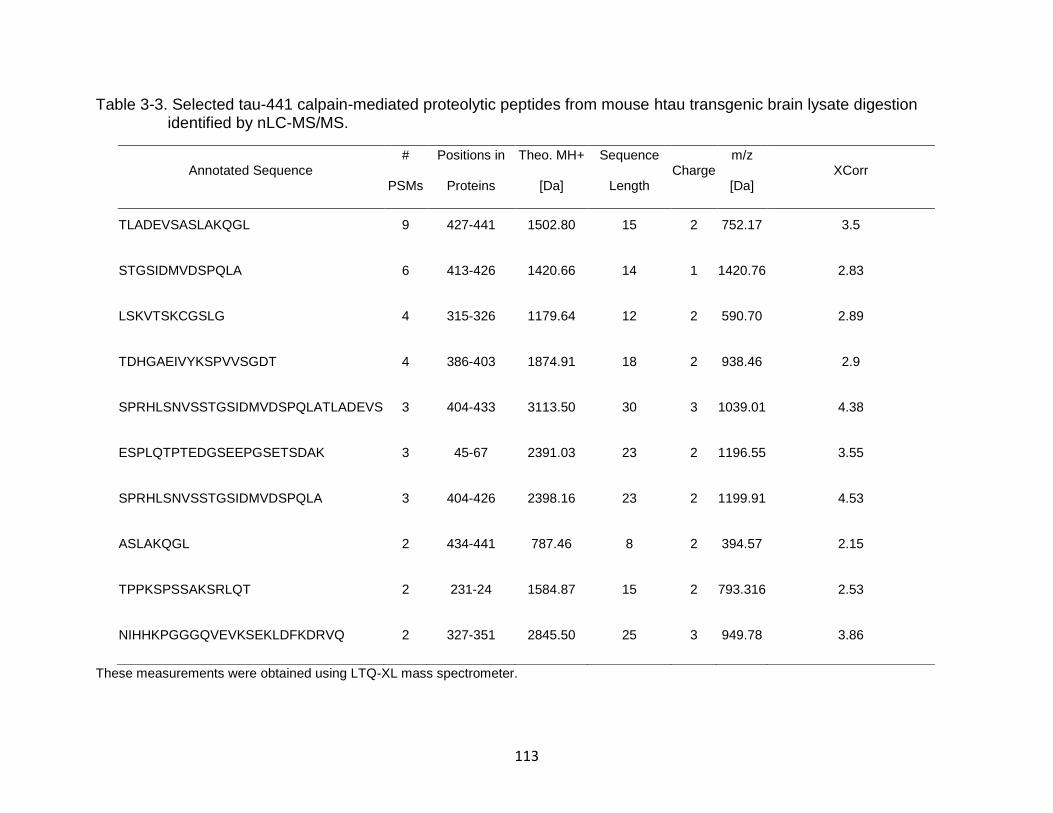
113
Table 3-3. Selected tau-441 calpain-mediated proteolytic peptides from mouse htau transgenic brain lysate digestion identified by nLC-MS/MS.
These measurements were obtained using LTQ-XL mass spectrometer.
Annotated Sequence #
PSMs
Positions in
Proteins
Theo. MH+
[Da]
Sequence
Length Charge
m/z
[Da] XCorr
TLADEVSASLAKQGL 9 427-441 1502.80 15 2 752.17 3.5
STGSIDMVDSPQLA 6 413-426 1420.66 14 1 1420.76 2.83
LSKVTSKCGSLG 4 315-326 1179.64 12 2 590.70 2.89
TDHGAEIVYKSPVVSGDT 4 386-403 1874.91 18 2 938.46 2.9
SPRHLSNVSSTGSIDMVDSPQLATLADEVS 3 404-433 3113.50 30 3 1039.01 4.38
ESPLQTPTEDGSEEPGSETSDAK 3 45-67 2391.03 23 2 1196.55 3.55
SPRHLSNVSSTGSIDMVDSPQLA 3 404-426 2398.16 23 2 1199.91 4.53
ASLAKQGL 2 434-441 787.46 8 2 394.57 2.15
TPPKSPSSAKSRLQT 2 231-24 1584.87 15 2 793.316 2.53
NIHHKPGGGQVEVKSEKLDFKDRVQ 2 327-351 2845.50 25 3 949.78 3.86
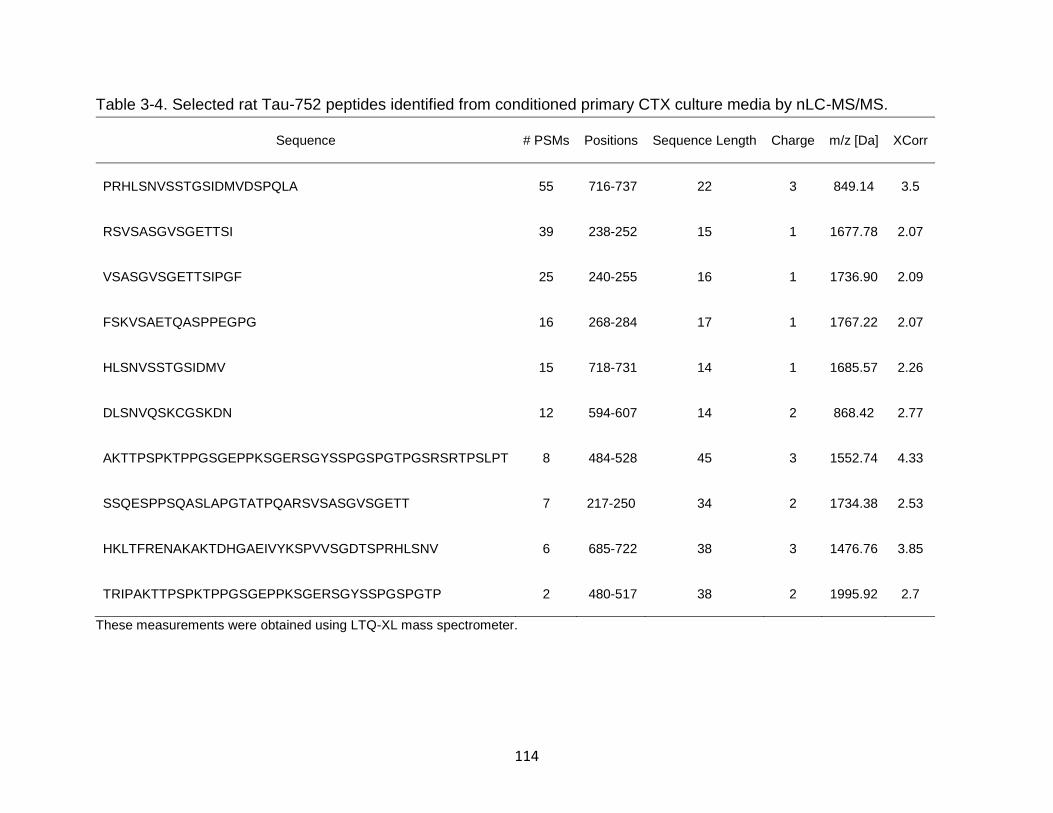
114
Table 3-4. Selected rat Tau-752 peptides identified from conditioned primary CTX culture media by nLC-MS/MS.
These measurements were obtained using LTQ-XL mass spectrometer.
Sequence # PSMs Positions Sequence Length Charge m/z [Da] XCorr
PRHLSNVSSTGSIDMVDSPQLA 55 716-737 22 3 849.14 3.5
RSVSASGVSGETTSI 39 238-252 15 1 1677.78 2.07
VSASGVSGETTSIPGF 25 240-255 16 1 1736.90 2.09
FSKVSAETQASPPEGPG 16 268-284 17 1 1767.22 2.07
HLSNVSSTGSIDMV 15 718-731 14 1 1685.57 2.26
DLSNVQSKCGSKDN 12 594-607 14 2 868.42 2.77
AKTTPSPKTPPGSGEPPKSGERSGYSSPGSPGTPGSRSRTPSLPT 8 484-528 45 3 1552.74 4.33
SSQESPPSQASLAPGTATPQARSVSASGVSGETT 7 217-250 34 2 1734.38 2.53
HKLTFRENAKAKTDHGAEIVYKSPVVSGDTSPRHLSNV 6 685-722 38 3 1476.76 3.85
TRIPAKTTPSPKTPPGSGEPPKSGERSGYSSPGSPGTP 2 480-517 38 2 1995.92 2.7
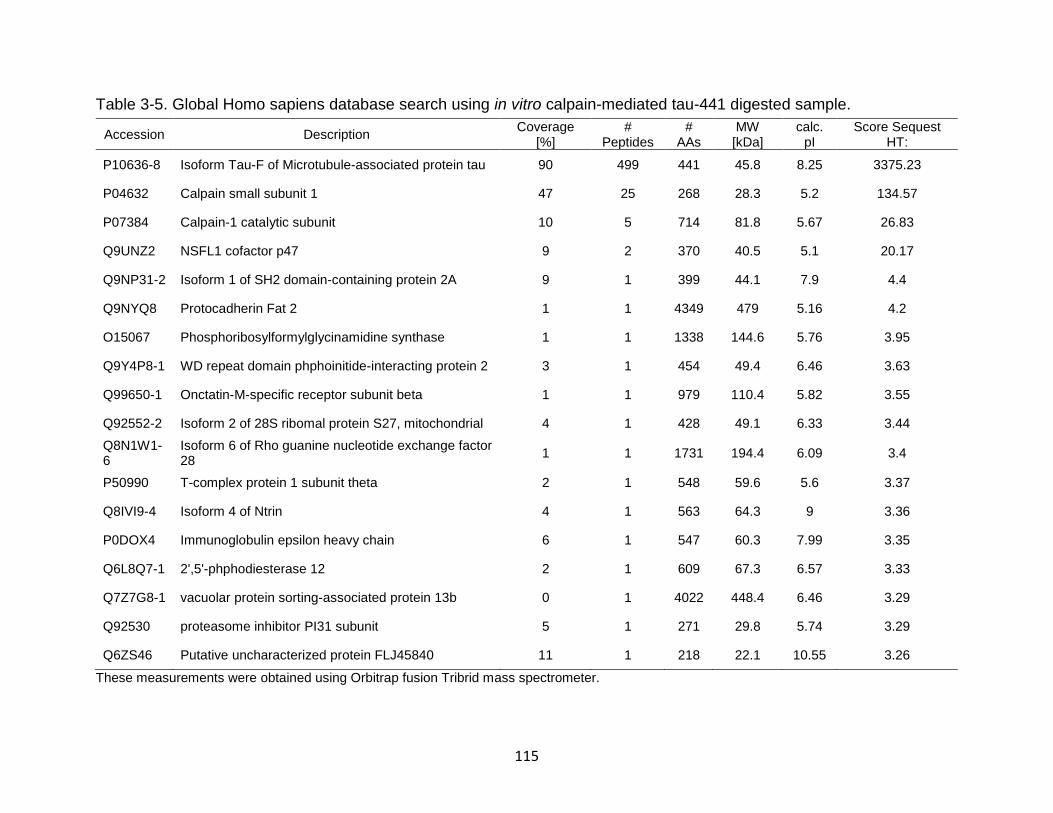
115
Table 3-5. Global Homo sapiens database search using in vitro calpain-mediated tau-441 digested sample.
These measurements were obtained using Orbitrap fusion Tribrid mass spectrometer.
Accession Description Coverage
[%] #
Peptides #
AAs MW [kDa]
calc. pI
Score Sequest HT:
P10636-8 Isoform Tau-F of Microtubule-associated protein tau 90 499 441 45.8 8.25 3375.23
P04632 Calpain small subunit 1 47 25 268 28.3 5.2 134.57
P07384 Calpain-1 catalytic subunit 10 5 714 81.8 5.67 26.83
Q9UNZ2 NSFL1 cofactor p47 9 2 370 40.5 5.1 20.17
Q9NP31-2 Isoform 1 of SH2 domain-containing protein 2A 9 1 399 44.1 7.9 4.4
Q9NYQ8 Protocadherin Fat 2 1 1 4349 479 5.16 4.2
O15067 Phosphoribosylformylglycinamidine synthase 1 1 1338 144.6 5.76 3.95
Q9Y4P8-1 WD repeat domain phphoinitide-interacting protein 2 3 1 454 49.4 6.46 3.63
Q99650-1 Onctatin-M-specific receptor subunit beta 1 1 979 110.4 5.82 3.55
Q92552-2 Isoform 2 of 28S ribomal protein S27, mitochondrial 4 1 428 49.1 6.33 3.44
Q8N1W1-6
Isoform 6 of Rho guanine nucleotide exchange factor 28
1 1 1731 194.4 6.09 3.4
P50990 T-complex protein 1 subunit theta 2 1 548 59.6 5.6 3.37
Q8IVI9-4 Isoform 4 of Ntrin 4 1 563 64.3 9 3.36
P0DOX4 Immunoglobulin epsilon heavy chain 6 1 547 60.3 7.99 3.35
Q6L8Q7-1 2',5'-phphodiesterase 12 2 1 609 67.3 6.57 3.33
Q7Z7G8-1 vacuolar protein sorting-associated protein 13b 0 1 4022 448.4 6.46 3.29
Q92530 proteasome inhibitor PI31 subunit 5 1 271 29.8 5.74 3.29
Q6ZS46 Putative uncharacterized protein FLJ45840 11 1 218 22.1 10.55 3.26
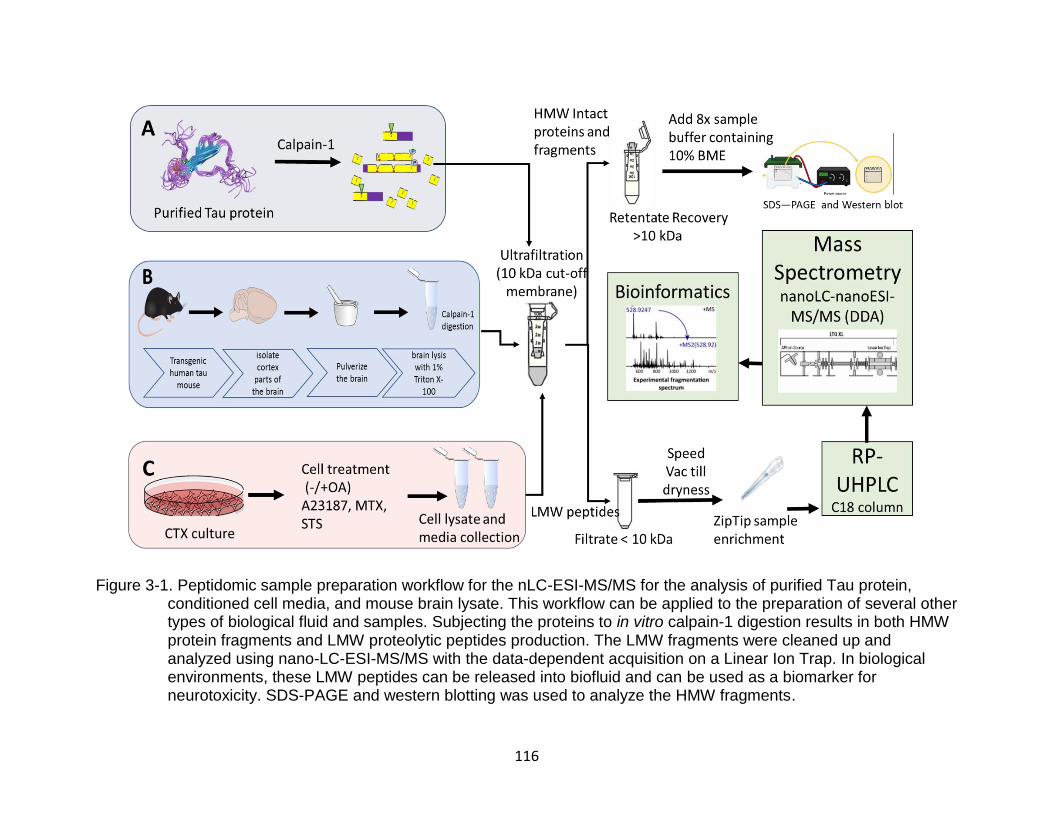
116
Figure 3-1. Peptidomic sample preparation workflow for the nLC-ESI-MS/MS for the analysis of purified Tau protein,
conditioned cell media, and mouse brain lysate. This workflow can be applied to the preparation of several other types of biological fluid and samples. Subjecting the proteins to in vitro calpain-1 digestion results in both HMW protein fragments and LMW proteolytic peptides production. The LMW fragments were cleaned up and analyzed using nano-LC-ESI-MS/MS with the data-dependent acquisition on a Linear Ion Trap. In biological environments, these LMW peptides can be released into biofluid and can be used as a biomarker for neurotoxicity. SDS-PAGE and western blotting was used to analyze the HMW fragments.
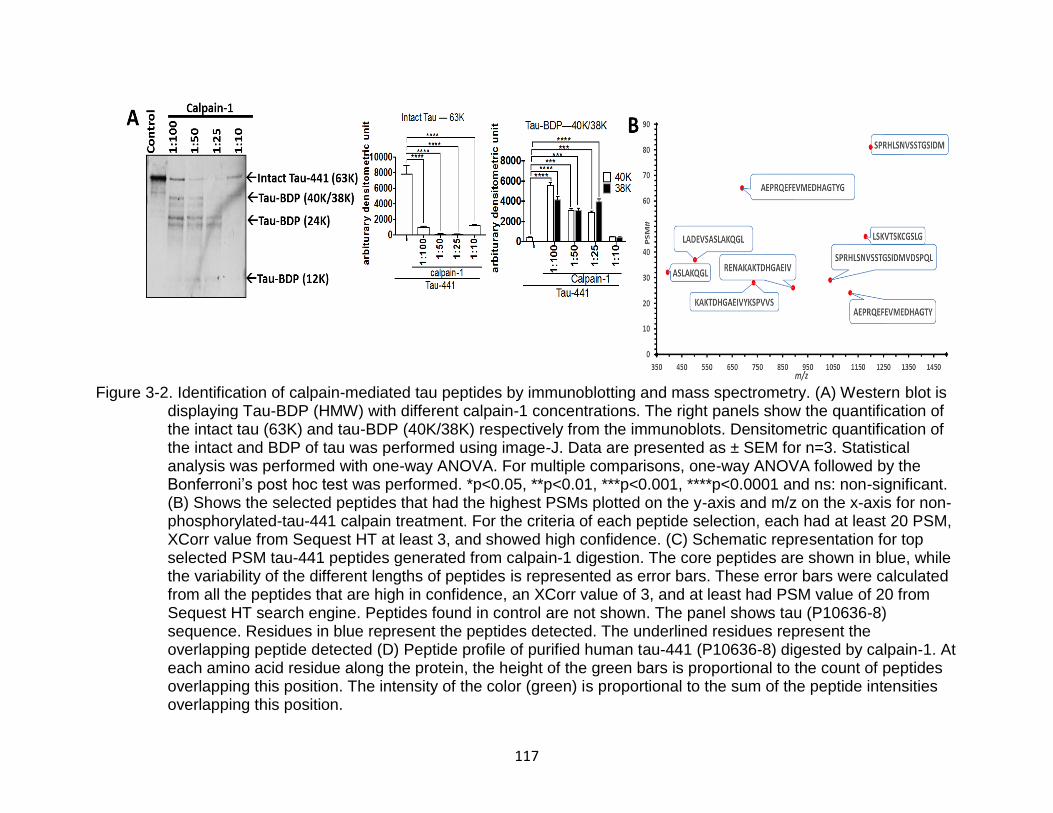
117
Figure 3-2. Identification of calpain-mediated tau peptides by immunoblotting and mass spectrometry. (A) Western blot is displaying Tau-BDP (HMW) with different calpain-1 concentrations. The right panels show the quantification of the intact tau (63K) and tau-BDP (40K/38K) respectively from the immunoblots. Densitometric quantification of the intact and BDP of tau was performed using image-J. Data are presented as ± SEM for n=3. Statistical analysis was performed with one-way ANOVA. For multiple comparisons, one-way ANOVA followed by the Bonferroni’s post hoc test was performed. *p<0.05, **p<0.01, ***p<0.001, ****p<0.0001 and ns: non-significant. (B) Shows the selected peptides that had the highest PSMs plotted on the y-axis and m/z on the x-axis for non-phosphorylated-tau-441 calpain treatment. For the criteria of each peptide selection, each had at least 20 PSM, XCorr value from Sequest HT at least 3, and showed high confidence. (C) Schematic representation for top selected PSM tau-441 peptides generated from calpain-1 digestion. The core peptides are shown in blue, while the variability of the different lengths of peptides is represented as error bars. These error bars were calculated from all the peptides that are high in confidence, an XCorr value of 3, and at least had PSM value of 20 from Sequest HT search engine. Peptides found in control are not shown. The panel shows tau (P10636-8) sequence. Residues in blue represent the peptides detected. The underlined residues represent the overlapping peptide detected (D) Peptide profile of purified human tau-441 (P10636-8) digested by calpain-1. At each amino acid residue along the protein, the height of the green bars is proportional to the count of peptides overlapping this position. The intensity of the color (green) is proportional to the sum of the peptide intensities overlapping this position.

118
Figure 3-2. Continued.
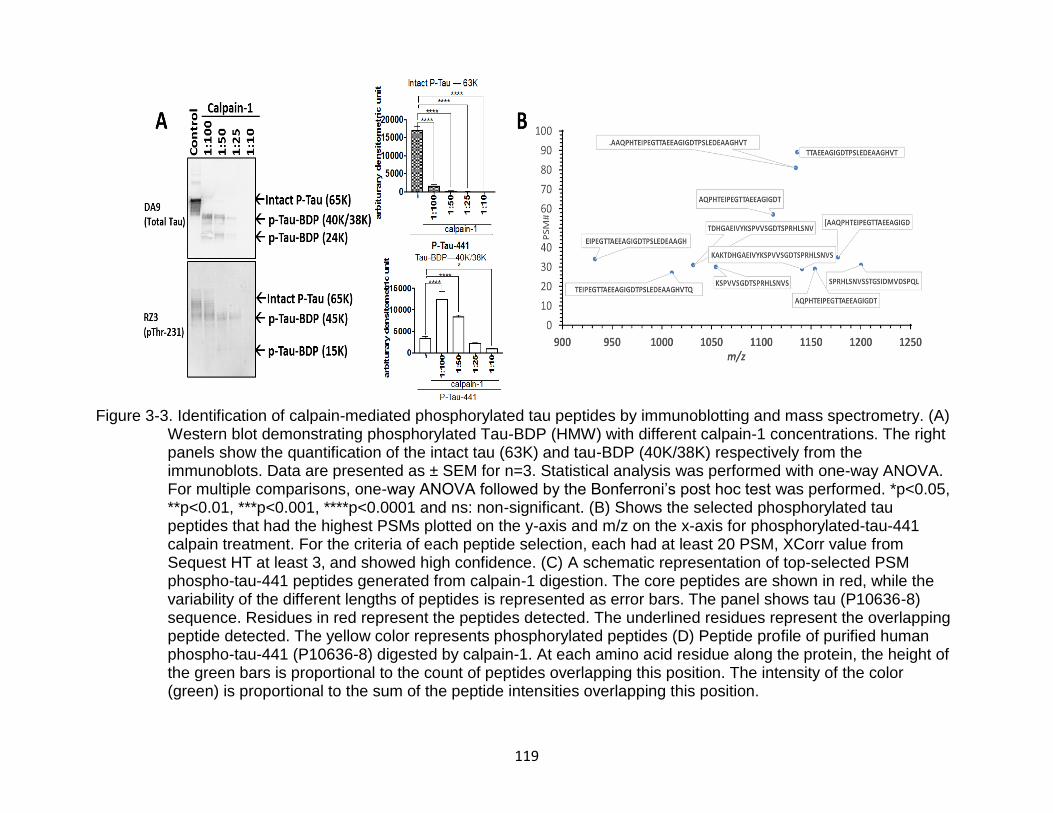
119
Figure 3-3. Identification of calpain-mediated phosphorylated tau peptides by immunoblotting and mass spectrometry. (A) Western blot demonstrating phosphorylated Tau-BDP (HMW) with different calpain-1 concentrations. The right panels show the quantification of the intact tau (63K) and tau-BDP (40K/38K) respectively from the immunoblots. Data are presented as ± SEM for n=3. Statistical analysis was performed with one-way ANOVA. For multiple comparisons, one-way ANOVA followed by the Bonferroni’s post hoc test was performed. *p<0.05, **p<0.01, ***p<0.001, ****p<0.0001 and ns: non-significant. (B) Shows the selected phosphorylated tau peptides that had the highest PSMs plotted on the y-axis and m/z on the x-axis for phosphorylated-tau-441 calpain treatment. For the criteria of each peptide selection, each had at least 20 PSM, XCorr value from Sequest HT at least 3, and showed high confidence. (C) A schematic representation of top-selected PSM phospho-tau-441 peptides generated from calpain-1 digestion. The core peptides are shown in red, while the variability of the different lengths of peptides is represented as error bars. The panel shows tau (P10636-8) sequence. Residues in red represent the peptides detected. The underlined residues represent the overlapping peptide detected. The yellow color represents phosphorylated peptides (D) Peptide profile of purified human phospho-tau-441 (P10636-8) digested by calpain-1. At each amino acid residue along the protein, the height of the green bars is proportional to the count of peptides overlapping this position. The intensity of the color (green) is proportional to the sum of the peptide intensities overlapping this position.
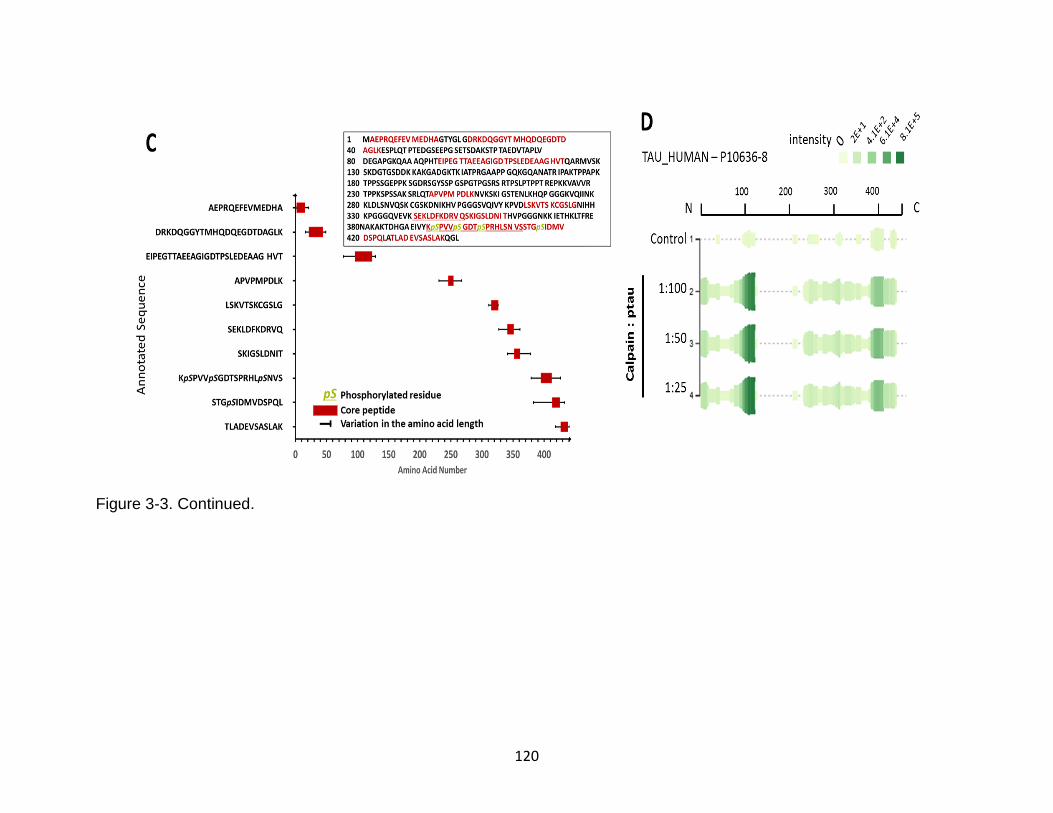
120
Figure 3-3. Continued.
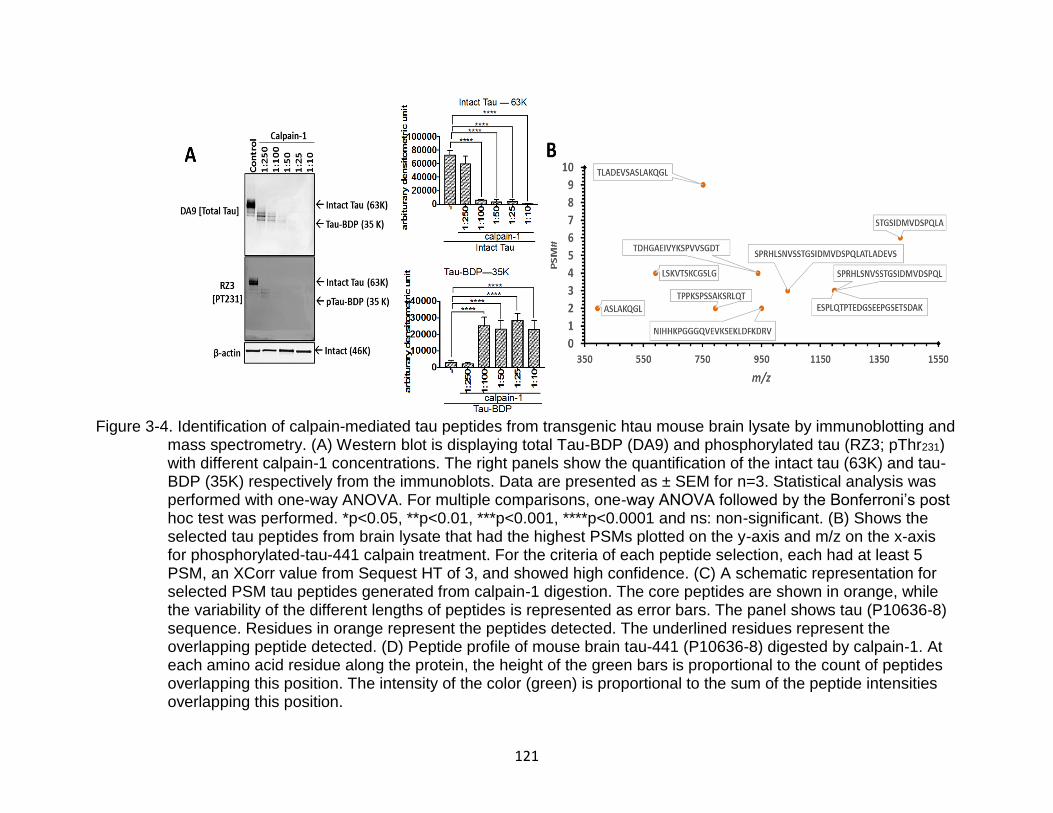
121
Figure 3-4. Identification of calpain-mediated tau peptides from transgenic htau mouse brain lysate by immunoblotting and mass spectrometry. (A) Western blot is displaying total Tau-BDP (DA9) and phosphorylated tau (RZ3; pThr231) with different calpain-1 concentrations. The right panels show the quantification of the intact tau (63K) and tau-BDP (35K) respectively from the immunoblots. Data are presented as ± SEM for n=3. Statistical analysis was performed with one-way ANOVA. For multiple comparisons, one-way ANOVA followed by the Bonferroni’s post hoc test was performed. *p<0.05, **p<0.01, ***p<0.001, ****p<0.0001 and ns: non-significant. (B) Shows the selected tau peptides from brain lysate that had the highest PSMs plotted on the y-axis and m/z on the x-axis for phosphorylated-tau-441 calpain treatment. For the criteria of each peptide selection, each had at least 5 PSM, an XCorr value from Sequest HT of 3, and showed high confidence. (C) A schematic representation for selected PSM tau peptides generated from calpain-1 digestion. The core peptides are shown in orange, while the variability of the different lengths of peptides is represented as error bars. The panel shows tau (P10636-8) sequence. Residues in orange represent the peptides detected. The underlined residues represent the overlapping peptide detected. (D) Peptide profile of mouse brain tau-441 (P10636-8) digested by calpain-1. At each amino acid residue along the protein, the height of the green bars is proportional to the count of peptides overlapping this position. The intensity of the color (green) is proportional to the sum of the peptide intensities overlapping this position.
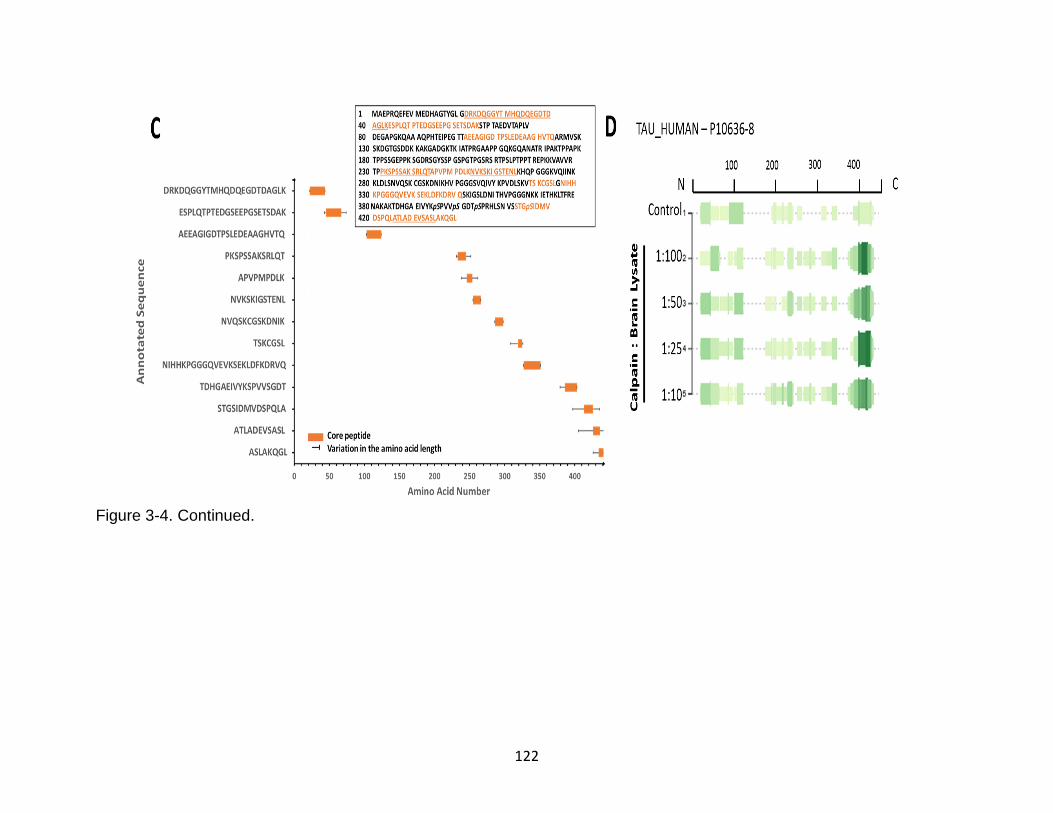
122
Figure 3-4. Continued.
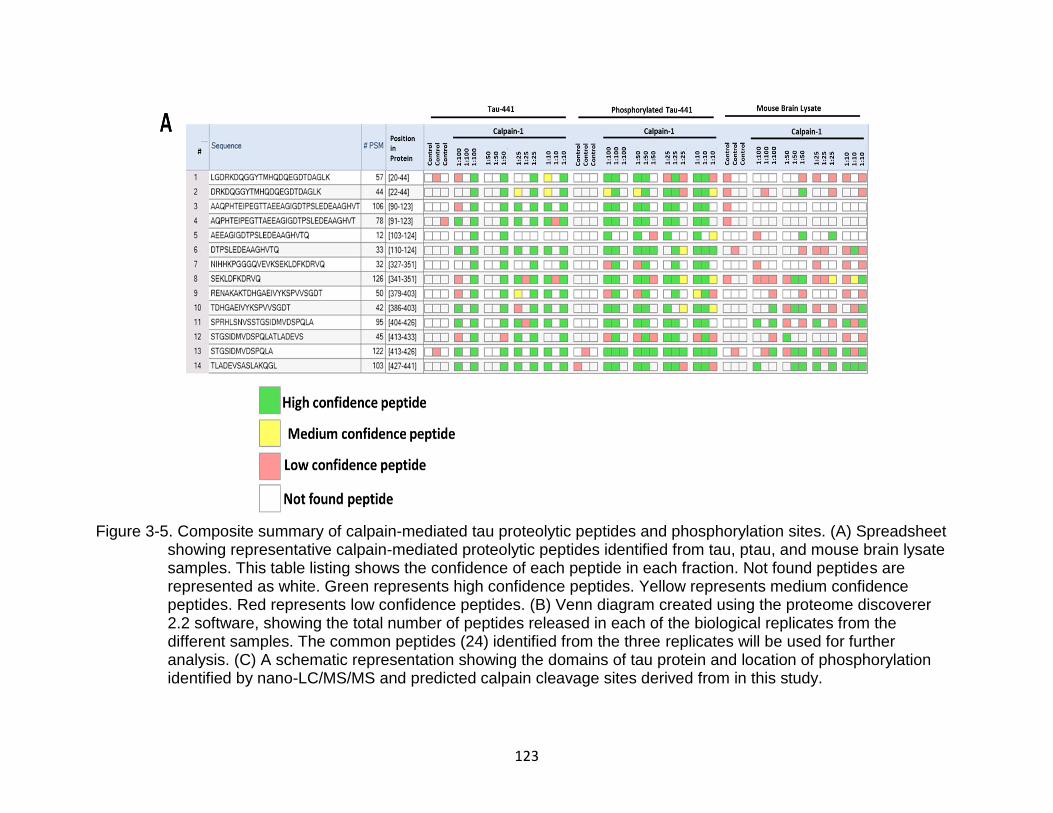
123
Figure 3-5. Composite summary of calpain-mediated tau proteolytic peptides and phosphorylation sites. (A) Spreadsheet showing representative calpain-mediated proteolytic peptides identified from tau, ptau, and mouse brain lysate samples. This table listing shows the confidence of each peptide in each fraction. Not found peptides are represented as white. Green represents high confidence peptides. Yellow represents medium confidence peptides. Red represents low confidence peptides. (B) Venn diagram created using the proteome discoverer 2.2 software, showing the total number of peptides released in each of the biological replicates from the different samples. The common peptides (24) identified from the three replicates will be used for further analysis. (C) A schematic representation showing the domains of tau protein and location of phosphorylation identified by nano-LC/MS/MS and predicted calpain cleavage sites derived from in this study.
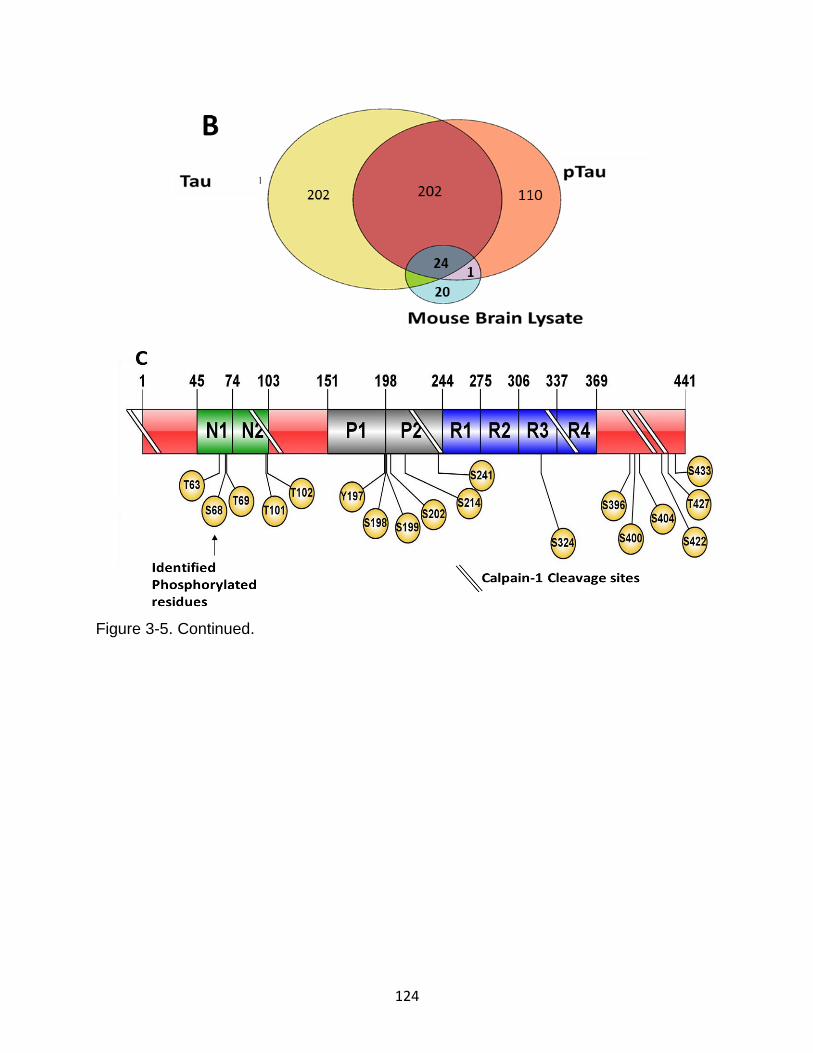
124
Figure 3-5. Continued.
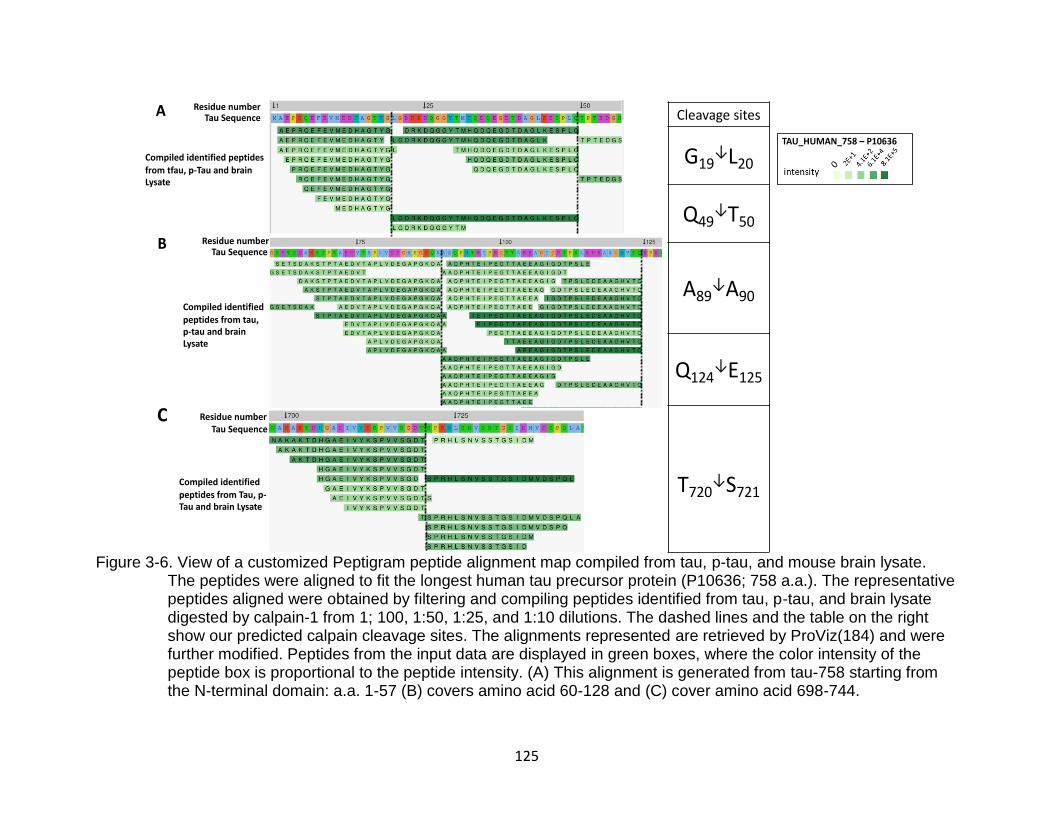
125
Figure 3-6. View of a customized Peptigram peptide alignment map compiled from tau, p-tau, and mouse brain lysate. The peptides were aligned to fit the longest human tau precursor protein (P10636; 758 a.a.). The representative peptides aligned were obtained by filtering and compiling peptides identified from tau, p-tau, and brain lysate digested by calpain-1 from 1; 100, 1:50, 1:25, and 1:10 dilutions. The dashed lines and the table on the right show our predicted calpain cleavage sites. The alignments represented are retrieved by ProViz(184) and were further modified. Peptides from the input data are displayed in green boxes, where the color intensity of the peptide box is proportional to the peptide intensity. (A) This alignment is generated from tau-758 starting from the N-terminal domain: a.a. 1-57 (B) covers amino acid 60-128 and (C) cover amino acid 698-744.
Residue number
Compiled identified peptides from tau, p-tau and brain Lysate
Tau SequenceResidue number
Tau Sequence
Tau SequenceResidue number
Compiled identified peptides
from tfau, p-Tau and brain Lysate
Compiled identified peptides from Tau, p-Tau and brain Lysate
TAU_HUMAN_758 – P10636
A
B
C
Cleavage sites
G19↓L20
Q49↓T50
A89↓A90
Q124↓E125
T720↓S721
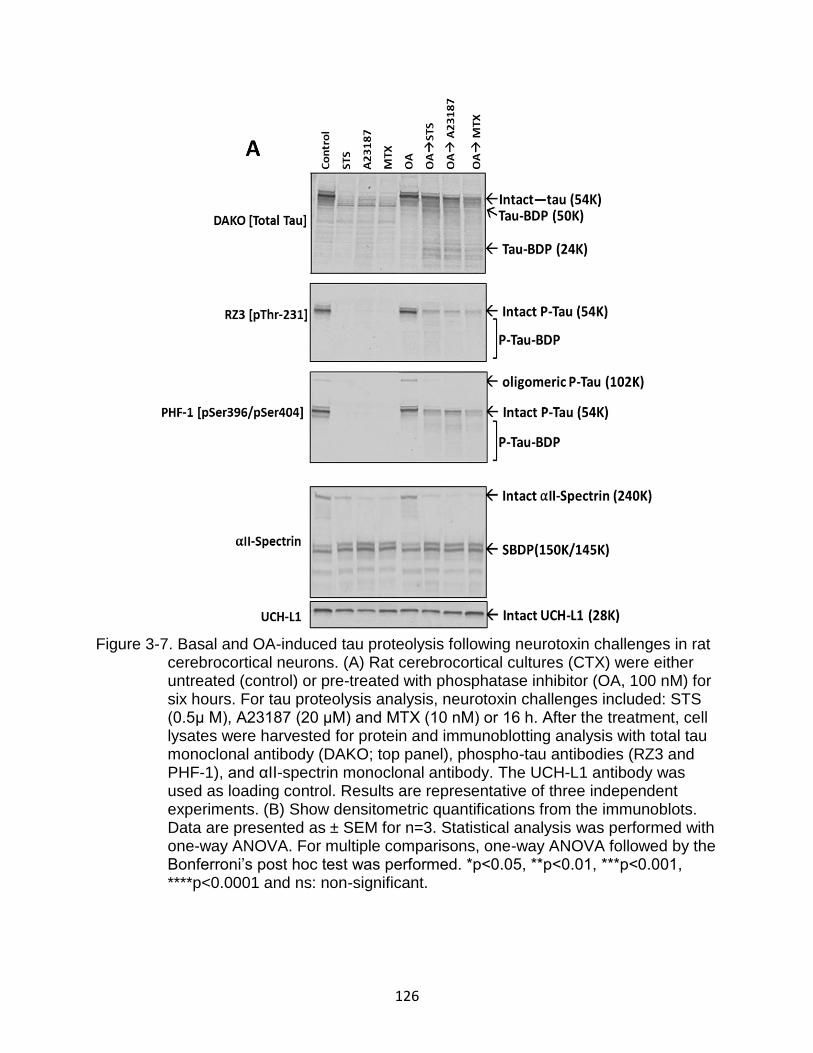
126
Figure 3-7. Basal and OA-induced tau proteolysis following neurotoxin challenges in rat cerebrocortical neurons. (A) Rat cerebrocortical cultures (CTX) were either untreated (control) or pre-treated with phosphatase inhibitor (OA, 100 nM) for six hours. For tau proteolysis analysis, neurotoxin challenges included: STS (0.5μ M), A23187 (20 μM) and MTX (10 nM) or 16 h. After the treatment, cell lysates were harvested for protein and immunoblotting analysis with total tau monoclonal antibody (DAKO; top panel), phospho-tau antibodies (RZ3 and PHF-1), and αII-spectrin monoclonal antibody. The UCH-L1 antibody was used as loading control. Results are representative of three independent experiments. (B) Show densitometric quantifications from the immunoblots. Data are presented as ± SEM for n=3. Statistical analysis was performed with one-way ANOVA. For multiple comparisons, one-way ANOVA followed by the Bonferroni’s post hoc test was performed. *p<0.05, **p<0.01, ***p<0.001, ****p<0.0001 and ns: non-significant.
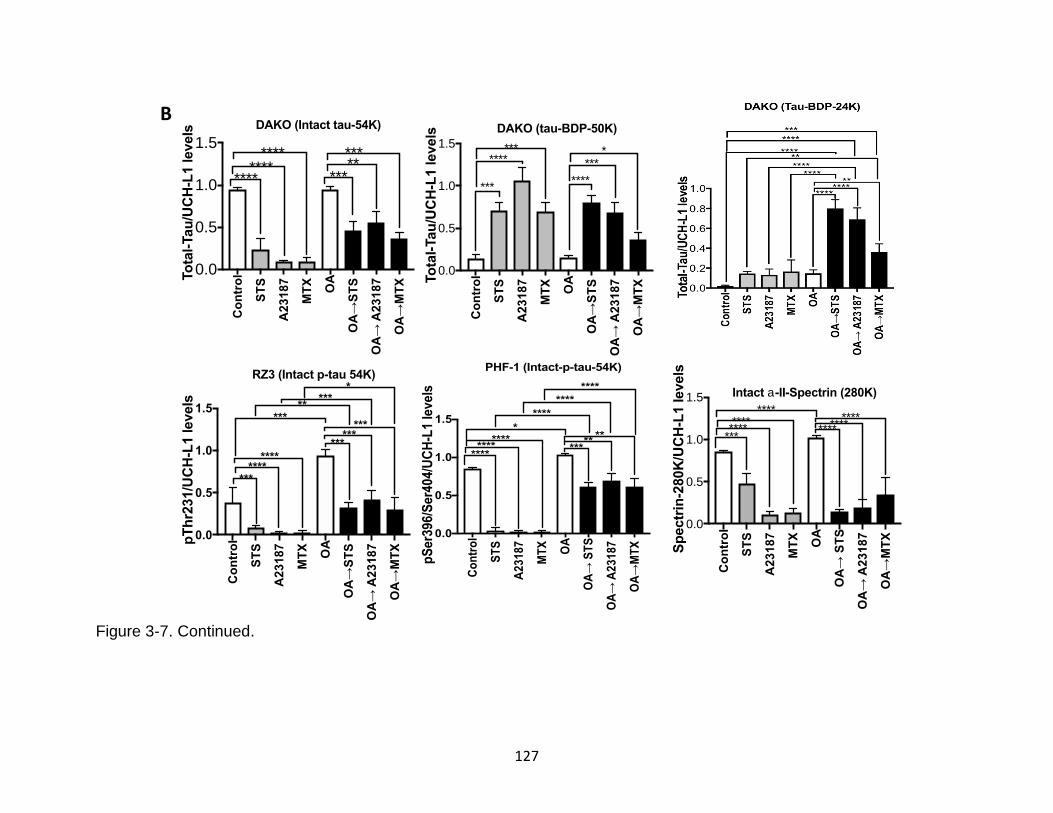
127
Figure 3-7. Continued.
Co
ntr
ol
ST
S
A23
18
7
MT
X
OA
OA→
ST
S
OA→
A23
18
7
OA→
MT
X 0.0
0.5
1.0
1.5
To
tal-
Tau
/UC
H-L
1 levels DAKO (tau-BDP-50K)
***
***
****
******* *
Co
ntr
ol
ST
S
A2
31
87
MT
X
OA
OA→
ST
S
OA→
A2
31
87
OA→
MT
X 0.0
0.5
1.0
1.5
pT
hr2
31/U
CH
-L1 levels
RZ3 (Intact p-tau 54K)
***
********
******
******
*****
*
Co
ntr
ol
ST
S
A2
31
87
MT
X
OA
OA→
ST
S
OA→
A2
31
87
OA→
MT
X 0.0
0.5
1.0
1.5
To
tal-
Tau
/UC
H-L
1 levels
DAKO (Intact tau-54K)
**** ***
******** **
***
Co
ntr
ol
ST
S
A23
18
7
MT
X
OA
OA→
ST
S
OA→
A2
31
87
OA→
MT
X 0.0
0.5
1.0
1.5p
Ser3
96/S
er4
04/U
CH
-L1 levels
PHF-1 (Intact-p-tau-54K)
********
****
*
*****
**
****
****
****
Co
ntr
ol
ST
S
A23
18
7
MT
X
OA
OA→
ST
S
OA→
A2
31
87
OA→
MT
X 0.0
0.5
1.0
1.5
Sp
ectr
in-2
80K
/UC
H-L
1 levels
Intact a-II-Spectrin (280K)
********
***
************
****
B
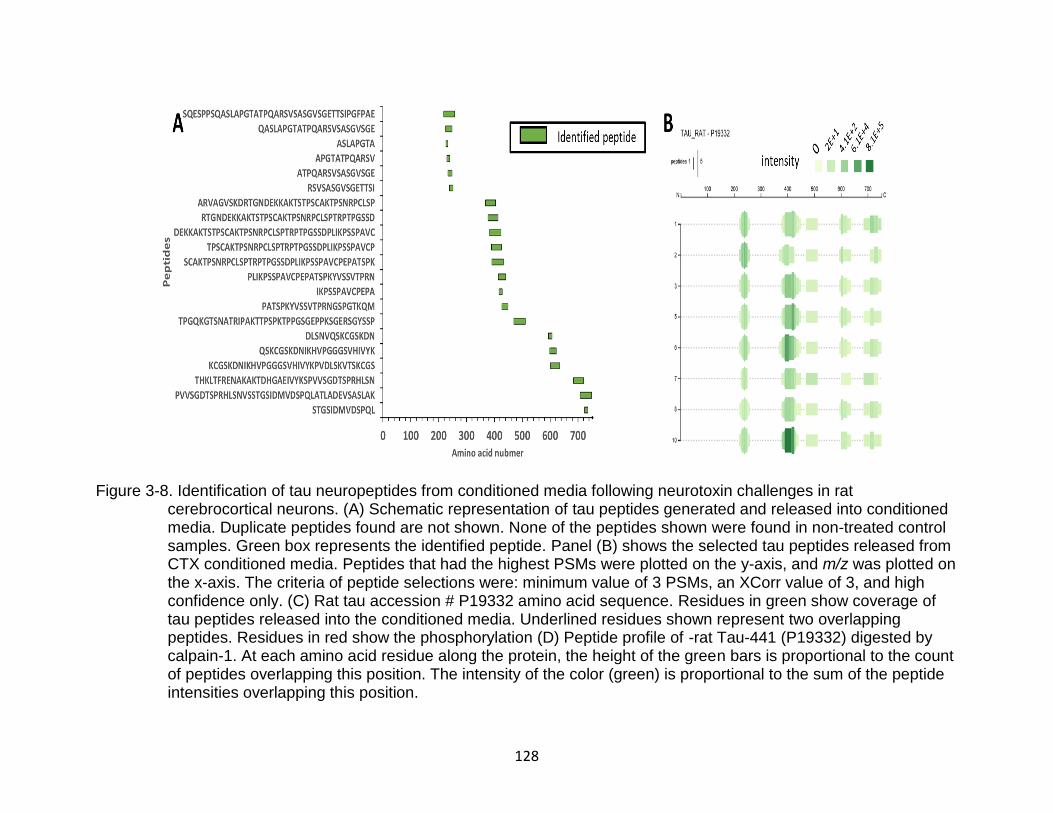
128
Figure 3-8. Identification of tau neuropeptides from conditioned media following neurotoxin challenges in rat cerebrocortical neurons. (A) Schematic representation of tau peptides generated and released into conditioned media. Duplicate peptides found are not shown. None of the peptides shown were found in non-treated control samples. Green box represents the identified peptide. Panel (B) shows the selected tau peptides released from CTX conditioned media. Peptides that had the highest PSMs were plotted on the y-axis, and m/z was plotted on the x-axis. The criteria of peptide selections were: minimum value of 3 PSMs, an XCorr value of 3, and high confidence only. (C) Rat tau accession # P19332 amino acid sequence. Residues in green show coverage of tau peptides released into the conditioned media. Underlined residues shown represent two overlapping peptides. Residues in red show the phosphorylation (D) Peptide profile of -rat Tau-441 (P19332) digested by calpain-1. At each amino acid residue along the protein, the height of the green bars is proportional to the count of peptides overlapping this position. The intensity of the color (green) is proportional to the sum of the peptide intensities overlapping this position.
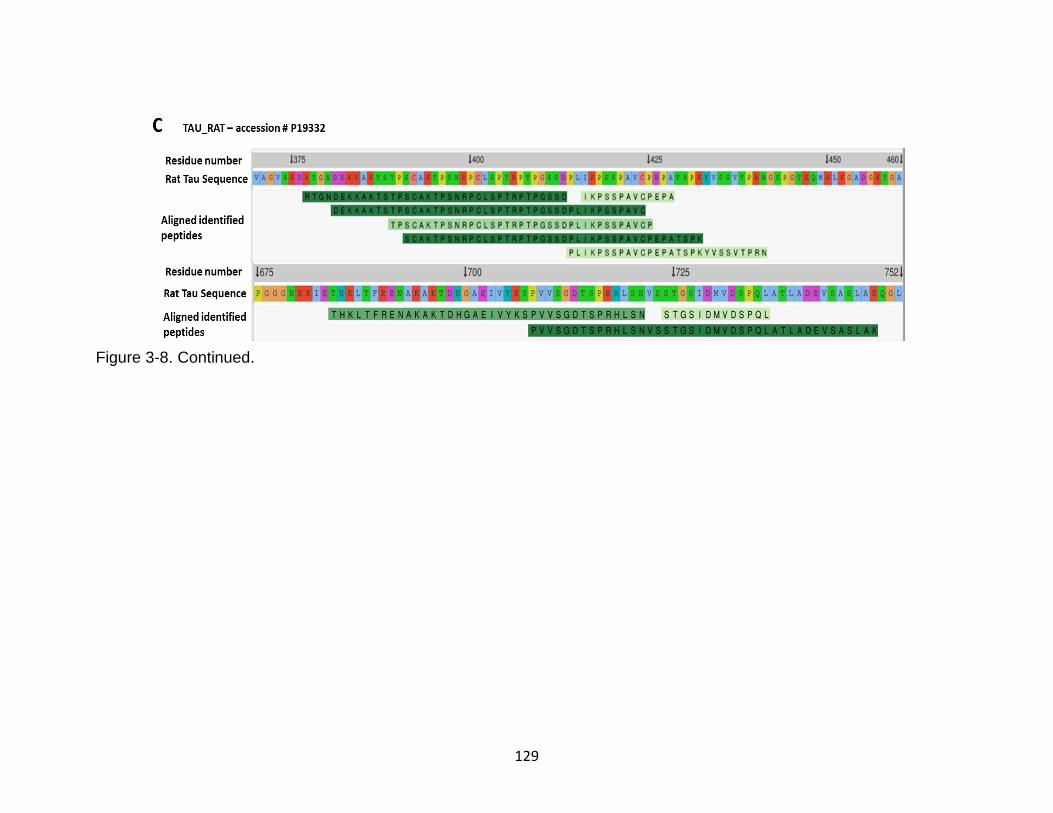
129
Figure 3-8. Continued.
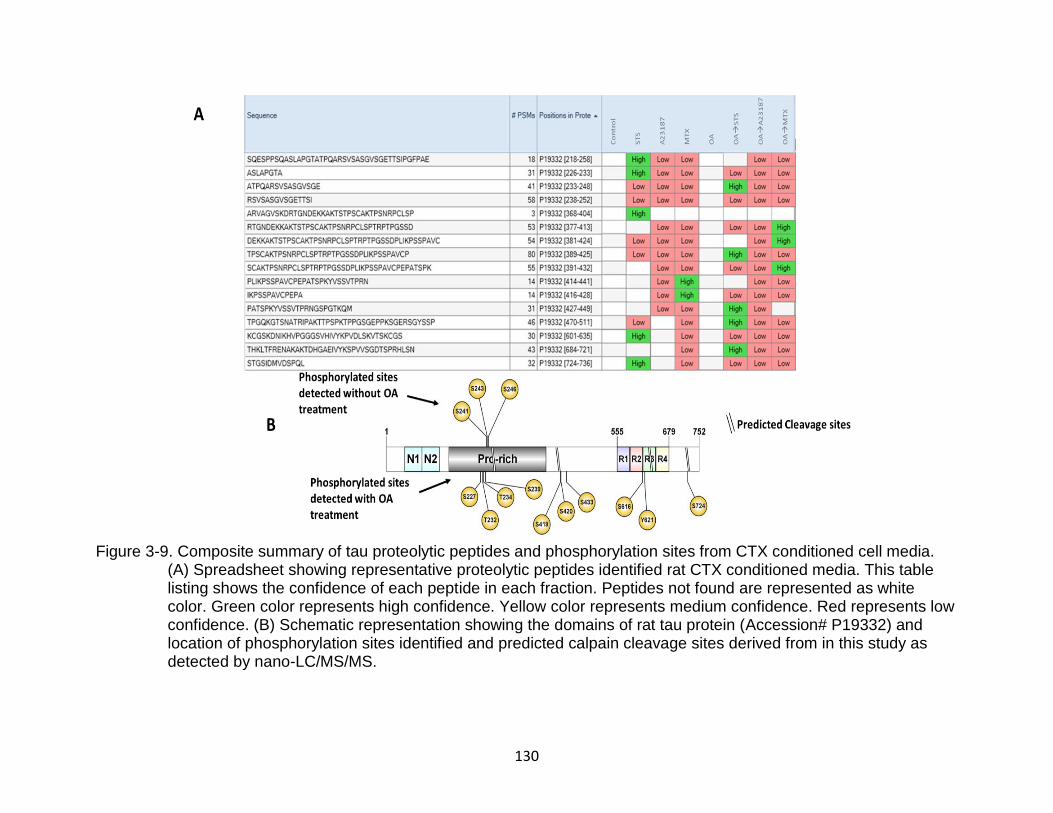
130
Figure 3-9. Composite summary of tau proteolytic peptides and phosphorylation sites from CTX conditioned cell media. (A) Spreadsheet showing representative proteolytic peptides identified rat CTX conditioned media. This table listing shows the confidence of each peptide in each fraction. Peptides not found are represented as white color. Green color represents high confidence. Yellow color represents medium confidence. Red represents low confidence. (B) Schematic representation showing the domains of rat tau protein (Accession# P19332) and location of phosphorylation sites identified and predicted calpain cleavage sites derived from in this study as detected by nano-LC/MS/MS.
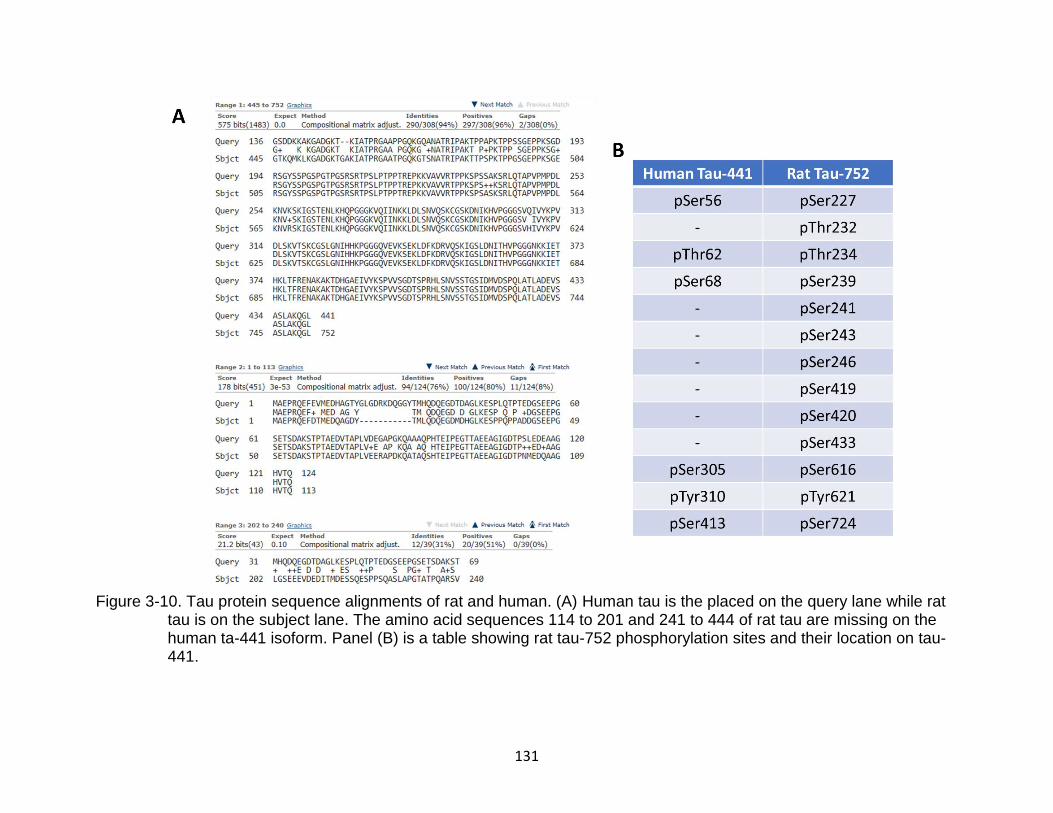
131
Figure 3-10. Tau protein sequence alignments of rat and human. (A) Human tau is the placed on the query lane while rat tau is on the subject lane. The amino acid sequences 114 to 201 and 241 to 444 of rat tau are missing on the human ta-441 isoform. Panel (B) is a table showing rat tau-752 phosphorylation sites and their location on tau-441.
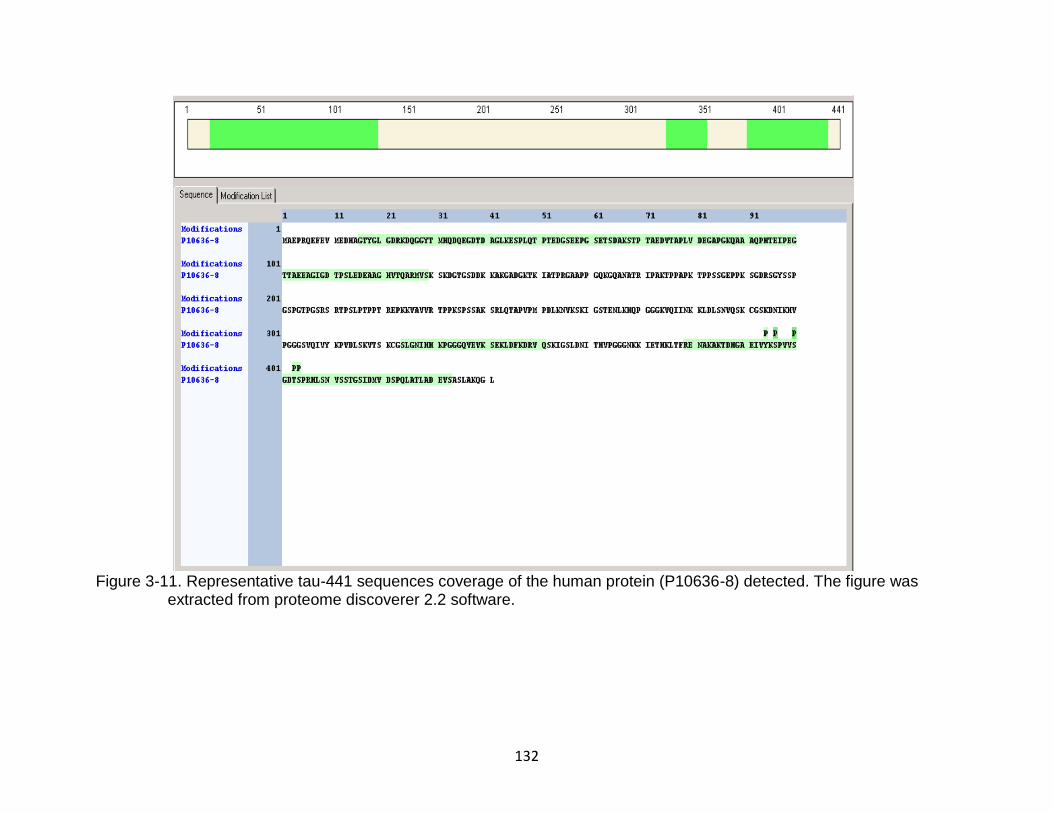
132
Figure 3-11. Representative tau-441 sequences coverage of the human protein (P10636-8) detected. The figure was extracted from proteome discoverer 2.2 software.
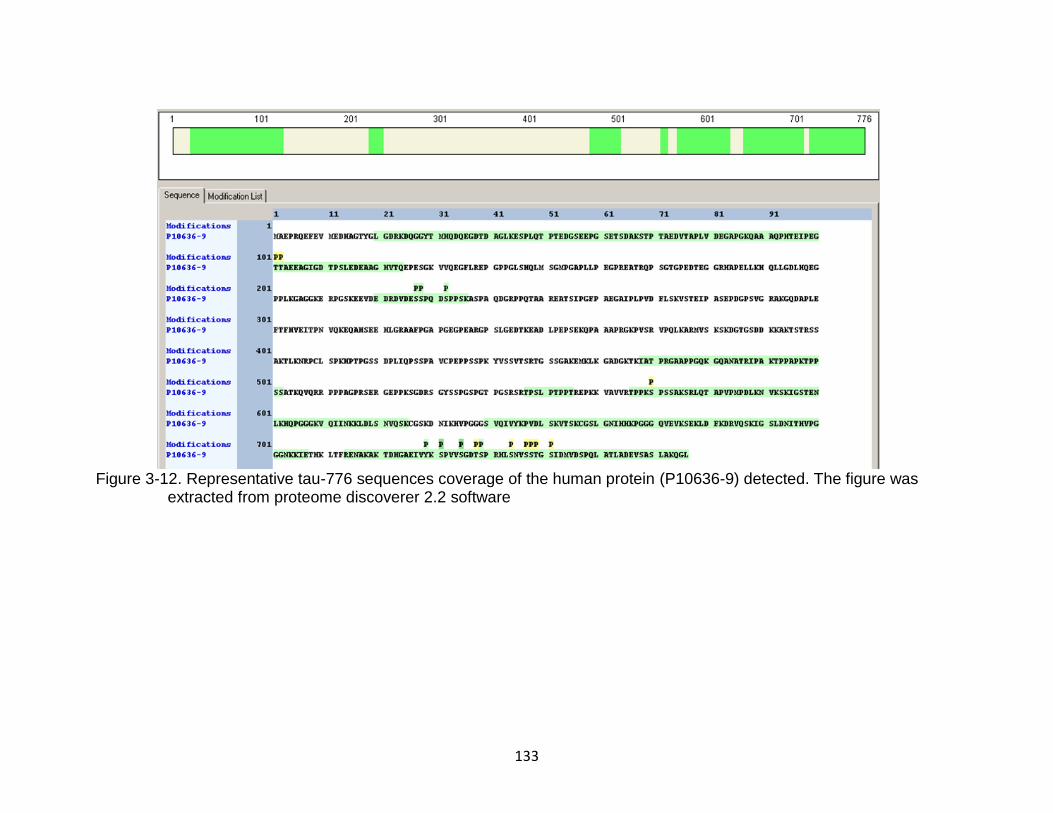
133
Figure 3-12. Representative tau-776 sequences coverage of the human protein (P10636-9) detected. The figure was extracted from proteome discoverer 2.2 software
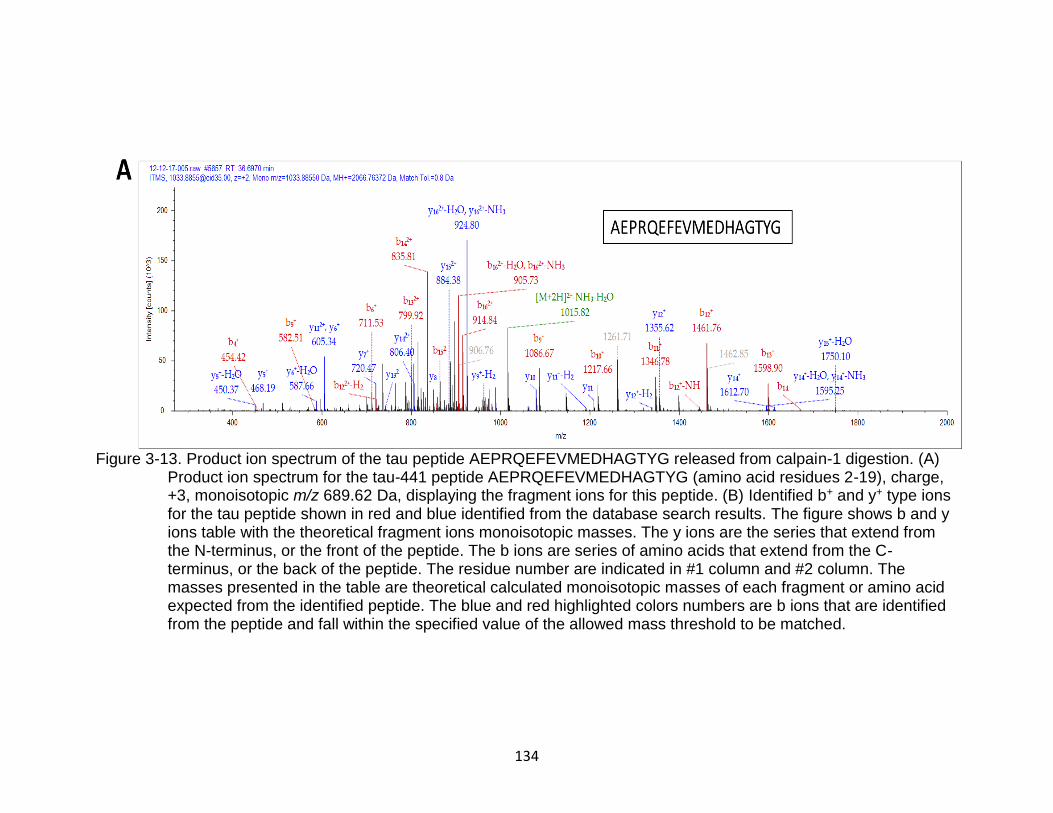
134
Figure 3-13. Product ion spectrum of the tau peptide AEPRQEFEVMEDHAGTYG released from calpain-1 digestion. (A) Product ion spectrum for the tau-441 peptide AEPRQEFEVMEDHAGTYG (amino acid residues 2-19), charge, +3, monoisotopic m/z 689.62 Da, displaying the fragment ions for this peptide. (B) Identified b+ and y+ type ions for the tau peptide shown in red and blue identified from the database search results. The figure shows b and y ions table with the theoretical fragment ions monoisotopic masses. The y ions are the series that extend from the N-terminus, or the front of the peptide. The b ions are series of amino acids that extend from the C-terminus, or the back of the peptide. The residue number are indicated in #1 column and #2 column. The masses presented in the table are theoretical calculated monoisotopic masses of each fragment or amino acid expected from the identified peptide. The blue and red highlighted colors numbers are b ions that are identified from the peptide and fall within the specified value of the allowed mass threshold to be matched.
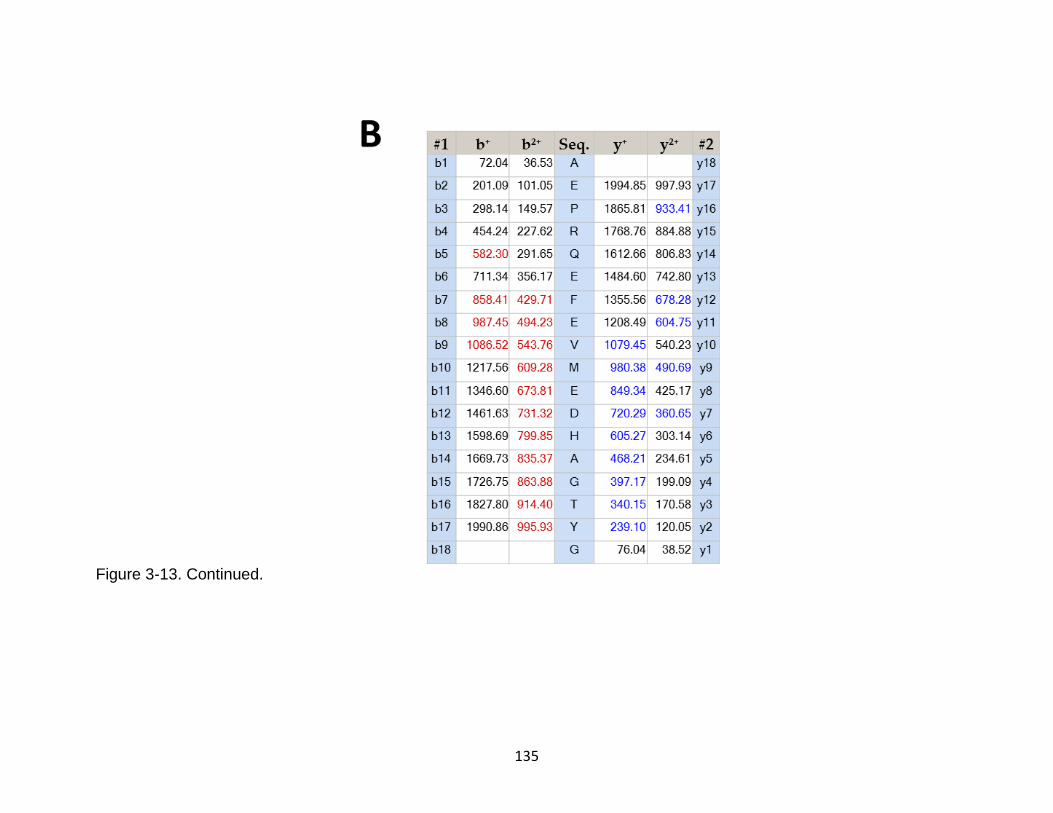
135
Figure 3-13. Continued.
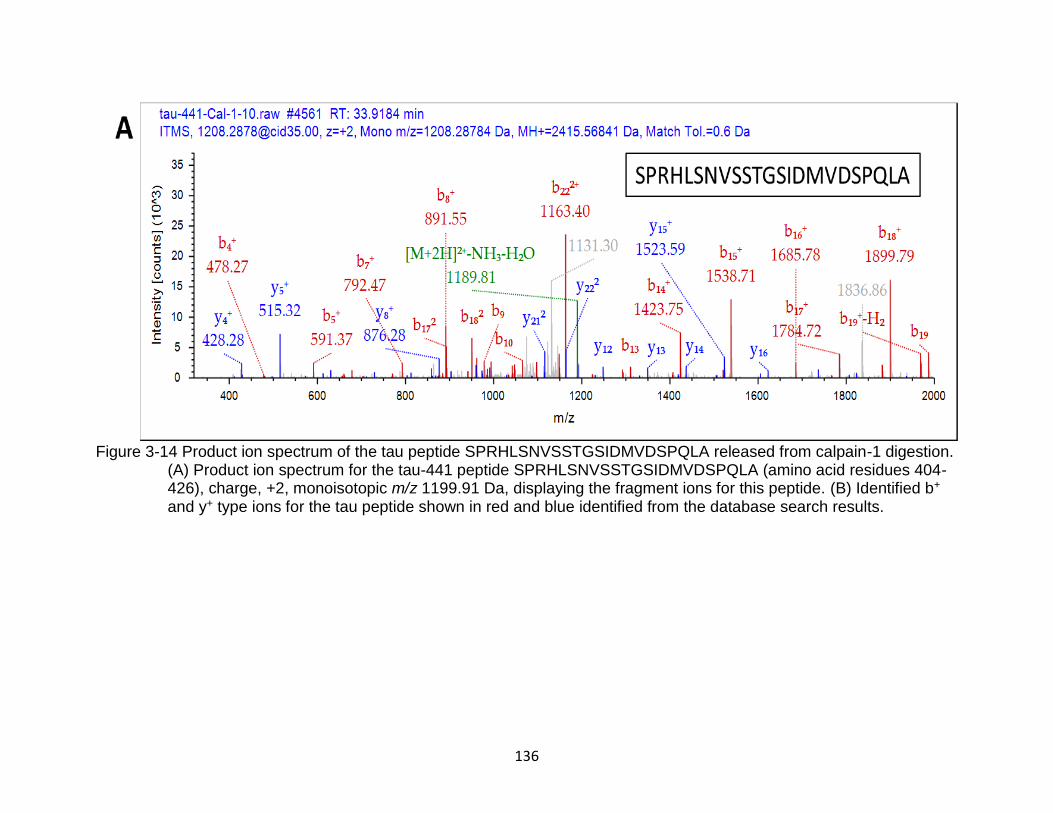
136
Figure 3-14 Product ion spectrum of the tau peptide SPRHLSNVSSTGSIDMVDSPQLA released from calpain-1 digestion. (A) Product ion spectrum for the tau-441 peptide SPRHLSNVSSTGSIDMVDSPQLA (amino acid residues 404-426), charge, +2, monoisotopic m/z 1199.91 Da, displaying the fragment ions for this peptide. (B) Identified b+ and y+ type ions for the tau peptide shown in red and blue identified from the database search results.
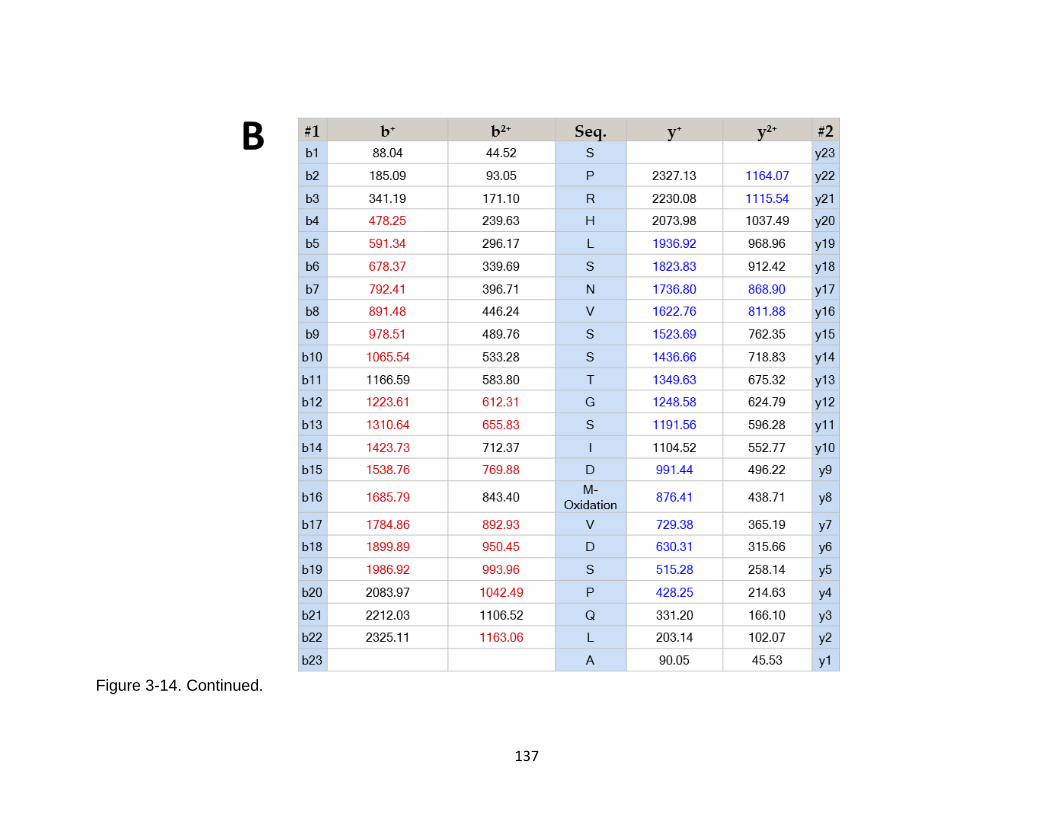
137
Figure 3-14. Continued.
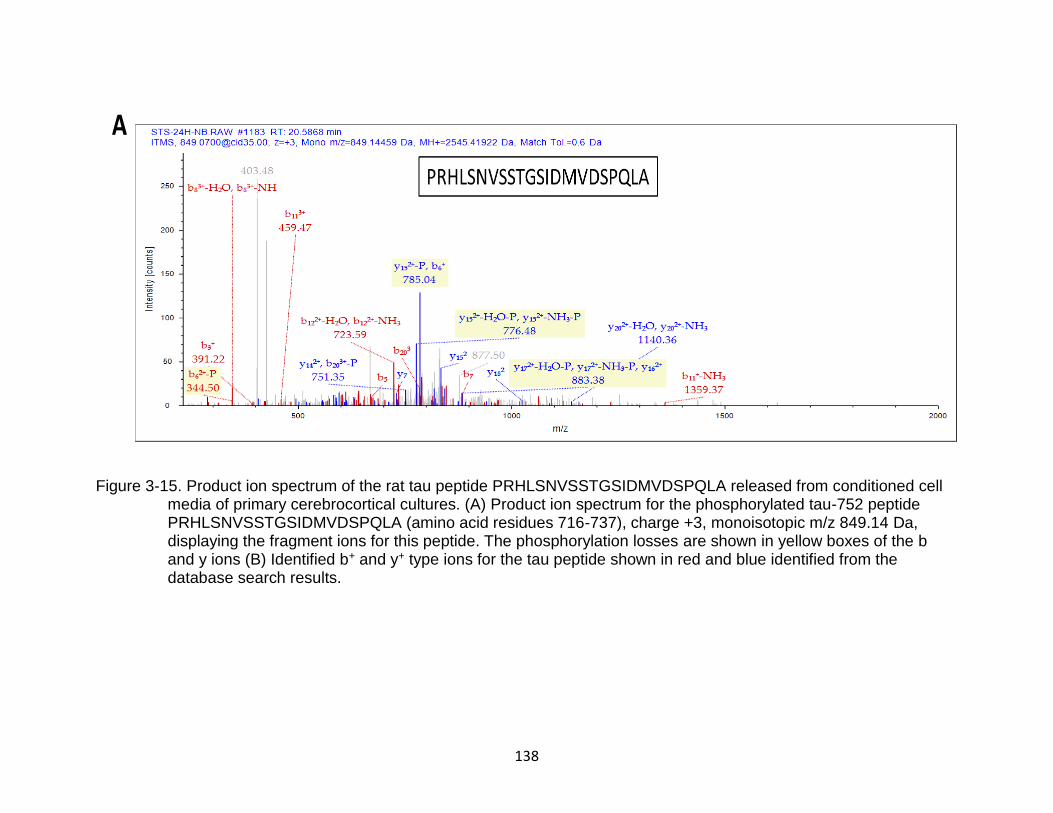
138
Figure 3-15. Product ion spectrum of the rat tau peptide PRHLSNVSSTGSIDMVDSPQLA released from conditioned cell media of primary cerebrocortical cultures. (A) Product ion spectrum for the phosphorylated tau-752 peptide PRHLSNVSSTGSIDMVDSPQLA (amino acid residues 716-737), charge +3, monoisotopic m/z 849.14 Da, displaying the fragment ions for this peptide. The phosphorylation losses are shown in yellow boxes of the b and y ions (B) Identified b+ and y+ type ions for the tau peptide shown in red and blue identified from the database search results.
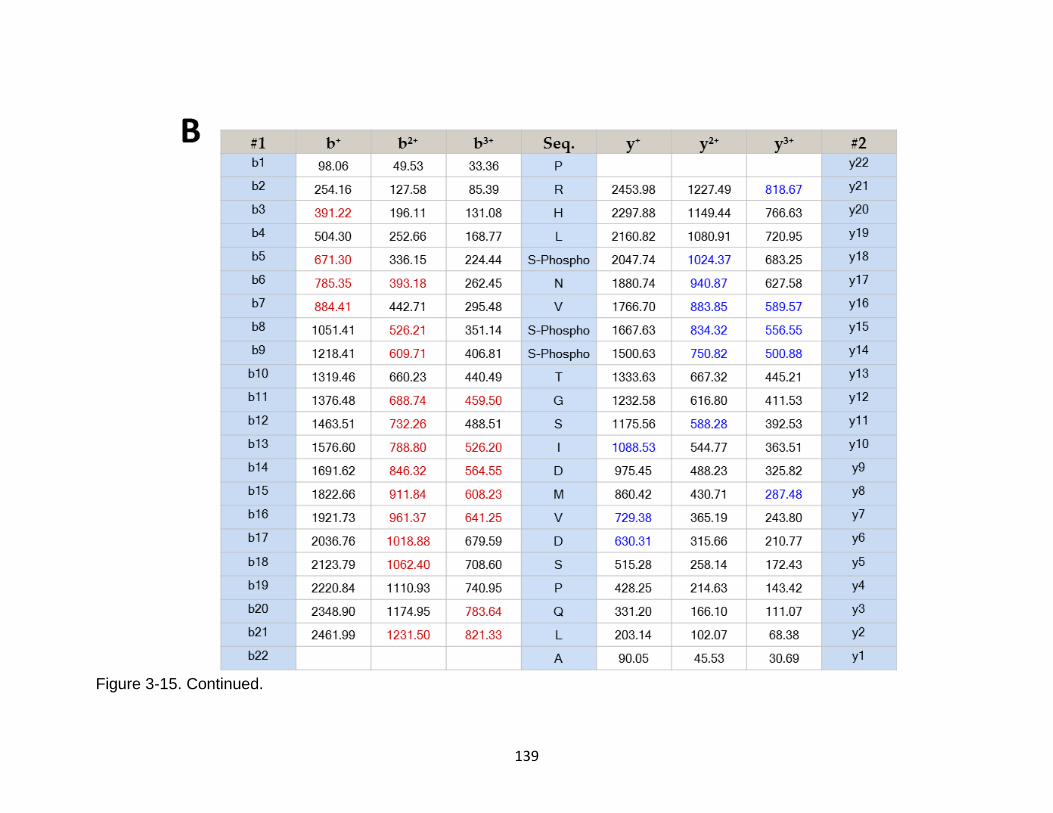
139
Figure 3-15. Continued.

140
Figure 3-16. Product ion spectrum of the phosphorylated tau peptide STGSIDMVDSPQLA released from calpain-1
digestion. (A) Product ion spectrum for the phosphorylated tau-441 peptide STGSIDMVDSPQLA (amino acid residues 413-426), charge +3, monoisotopic m/z 751.09 Da, displaying the fragment ions for this peptide. The phosphorylation losses are shown in yellow boxes of the b+ and y+ ions (B) Identified b+ and y+ type ions for the tau peptide shown in red and blue identified from the database search results
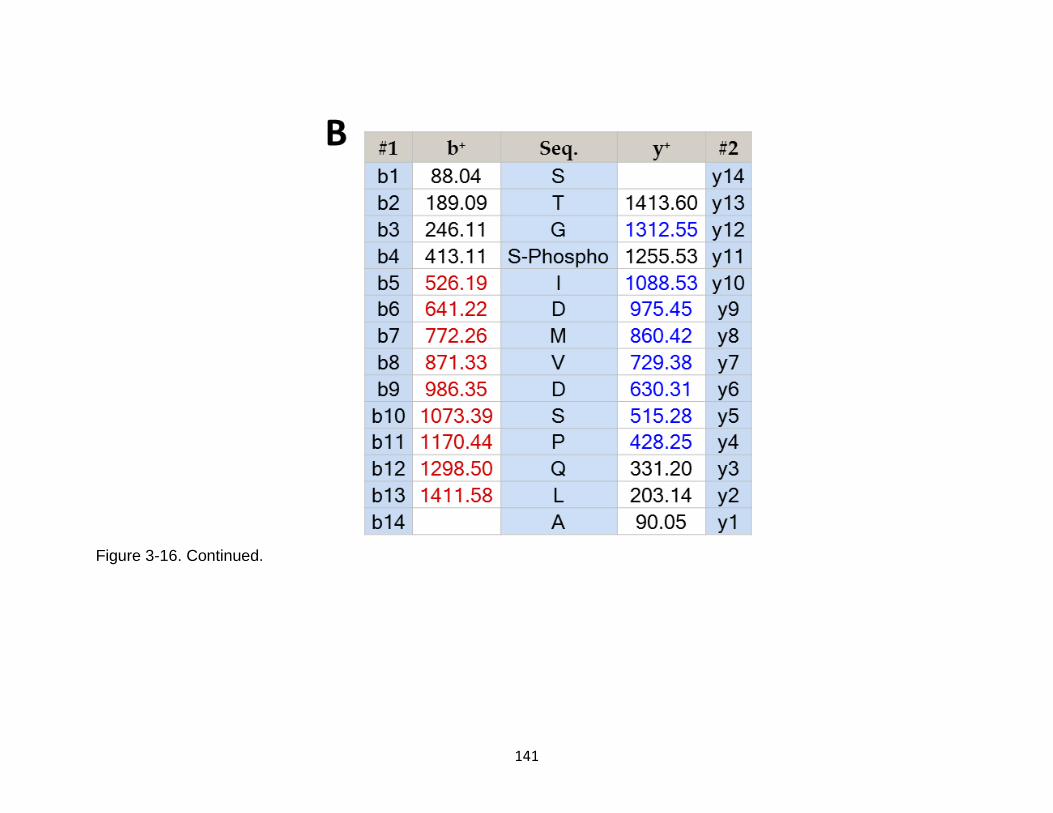
141
Figure 3-16. Continued.
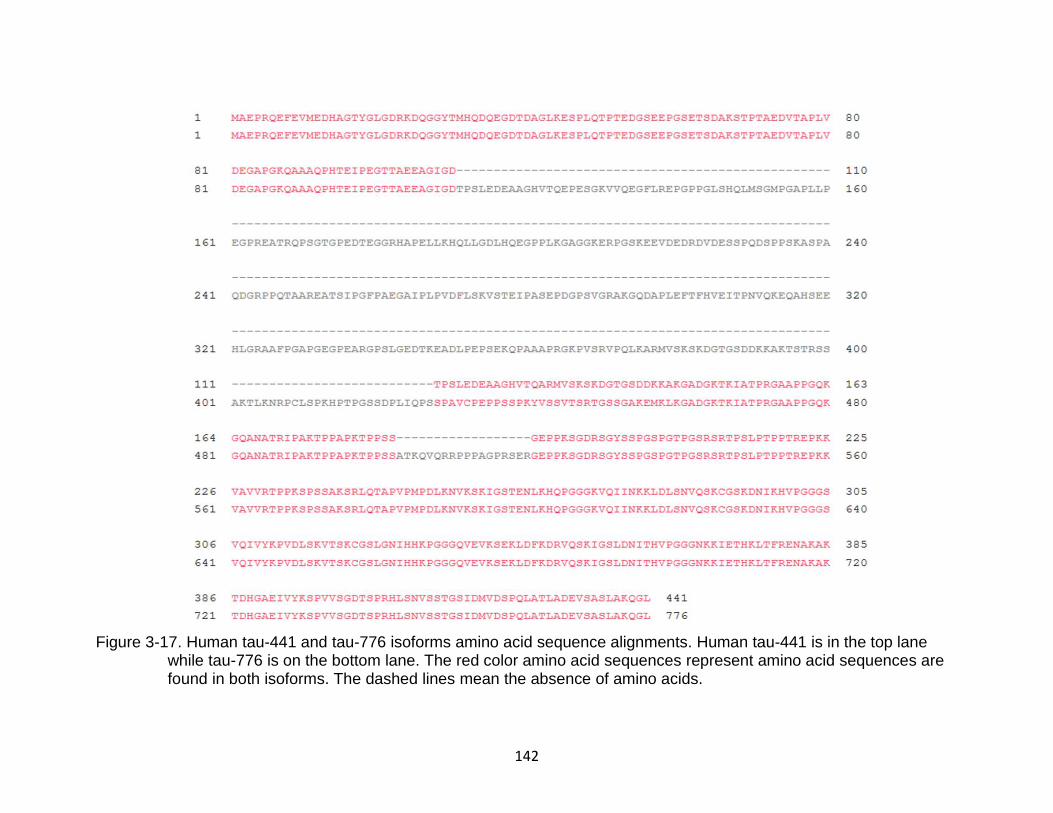
142
Figure 3-17. Human tau-441 and tau-776 isoforms amino acid sequence alignments. Human tau-441 is in the top lane while tau-776 is on the bottom lane. The red color amino acid sequences represent amino acid sequences are found in both isoforms. The dashed lines mean the absence of amino acids.
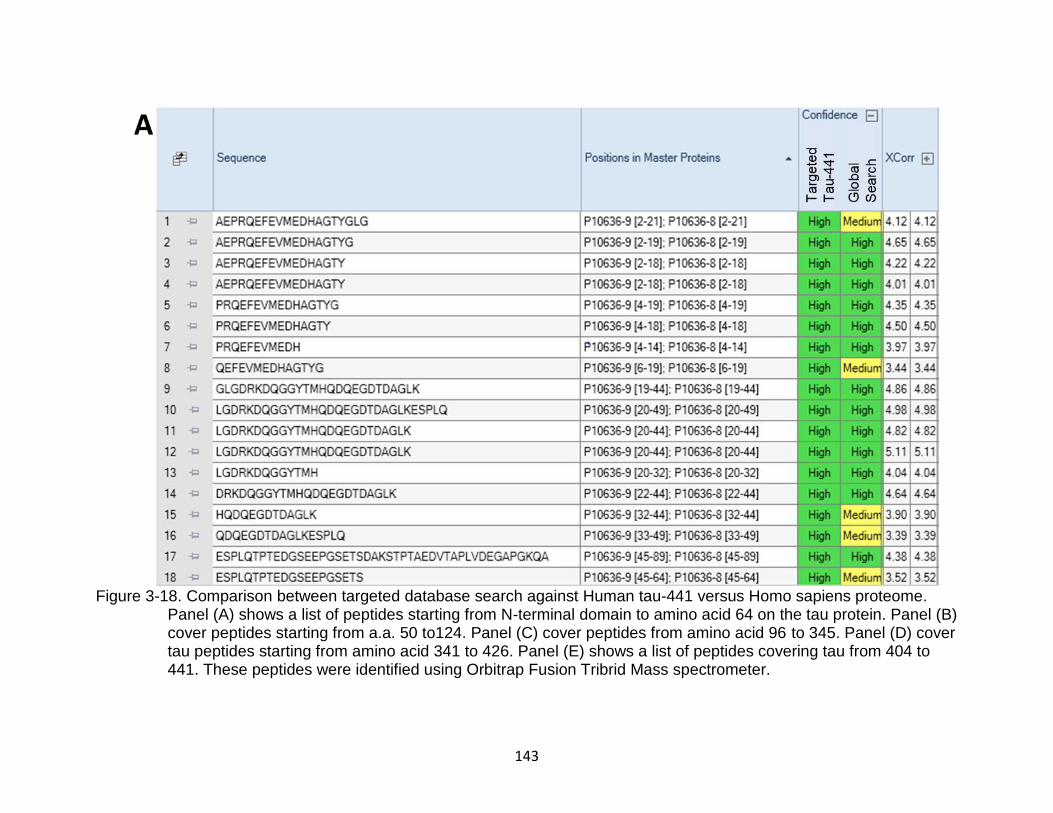
143
Figure 3-18. Comparison between targeted database search against Human tau-441 versus Homo sapiens proteome. Panel (A) shows a list of peptides starting from N-terminal domain to amino acid 64 on the tau protein. Panel (B) cover peptides starting from a.a. 50 to124. Panel (C) cover peptides from amino acid 96 to 345. Panel (D) cover tau peptides starting from amino acid 341 to 426. Panel (E) shows a list of peptides covering tau from 404 to 441. These peptides were identified using Orbitrap Fusion Tribrid Mass spectrometer.
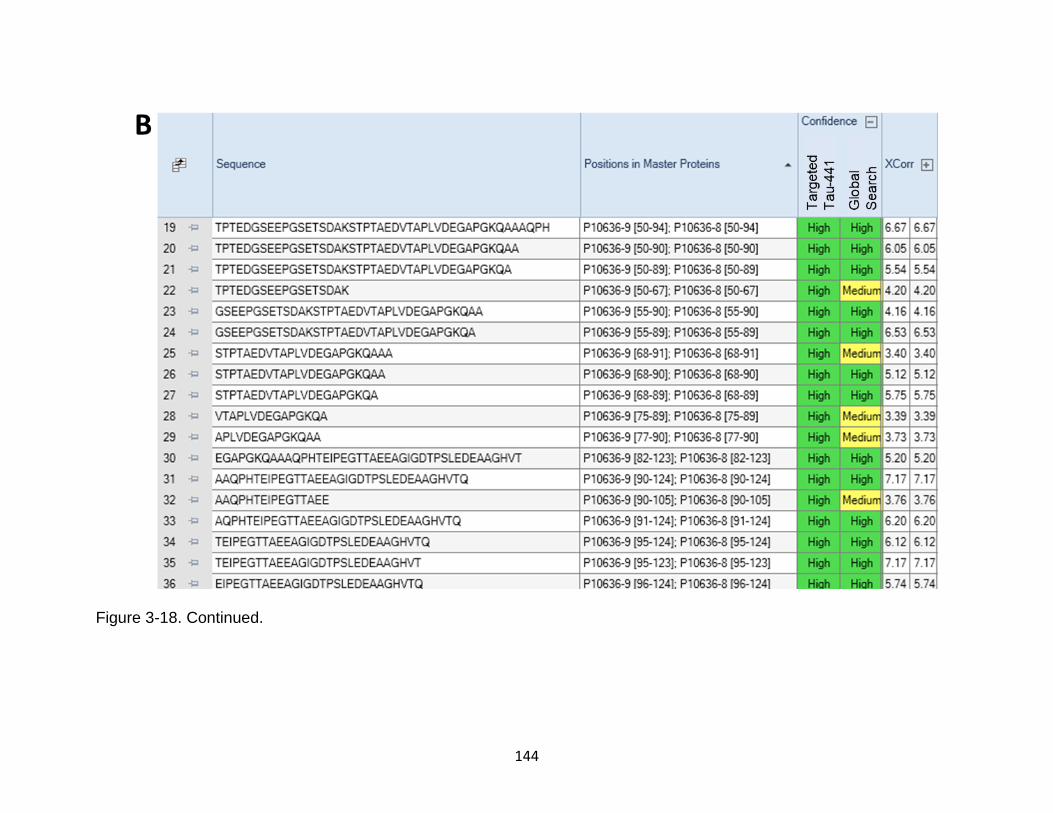
144
Figure 3-18. Continued.
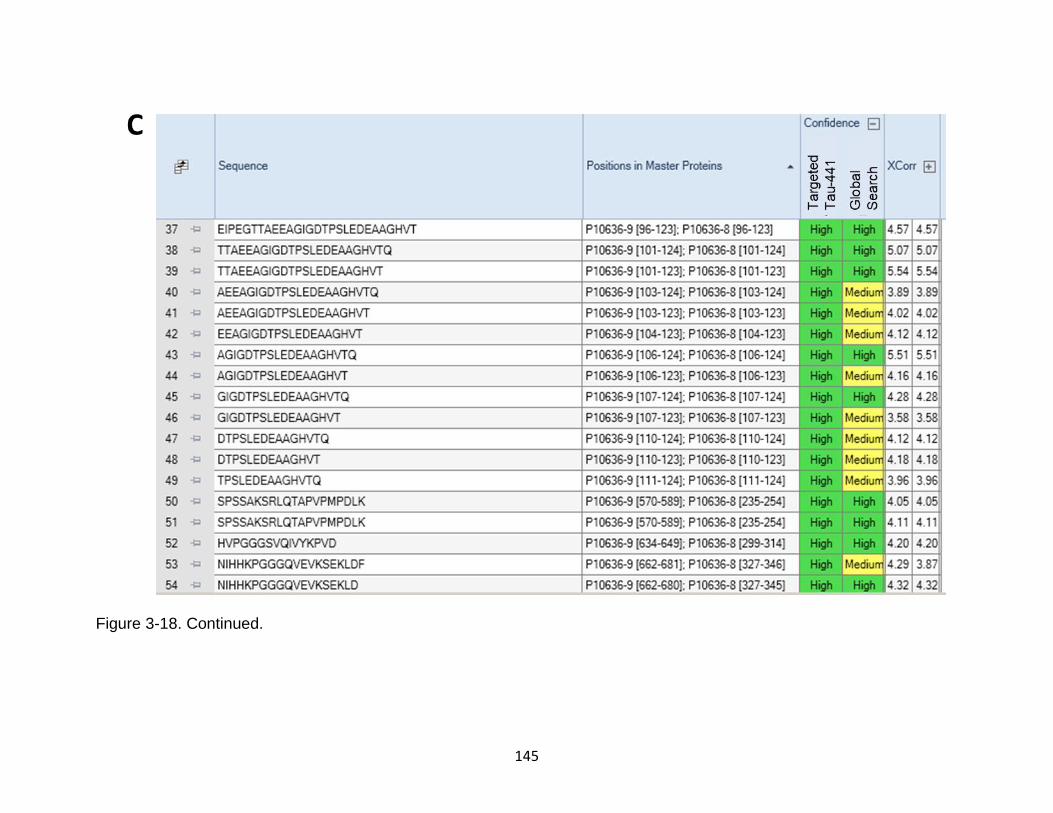
145
Figure 3-18. Continued.
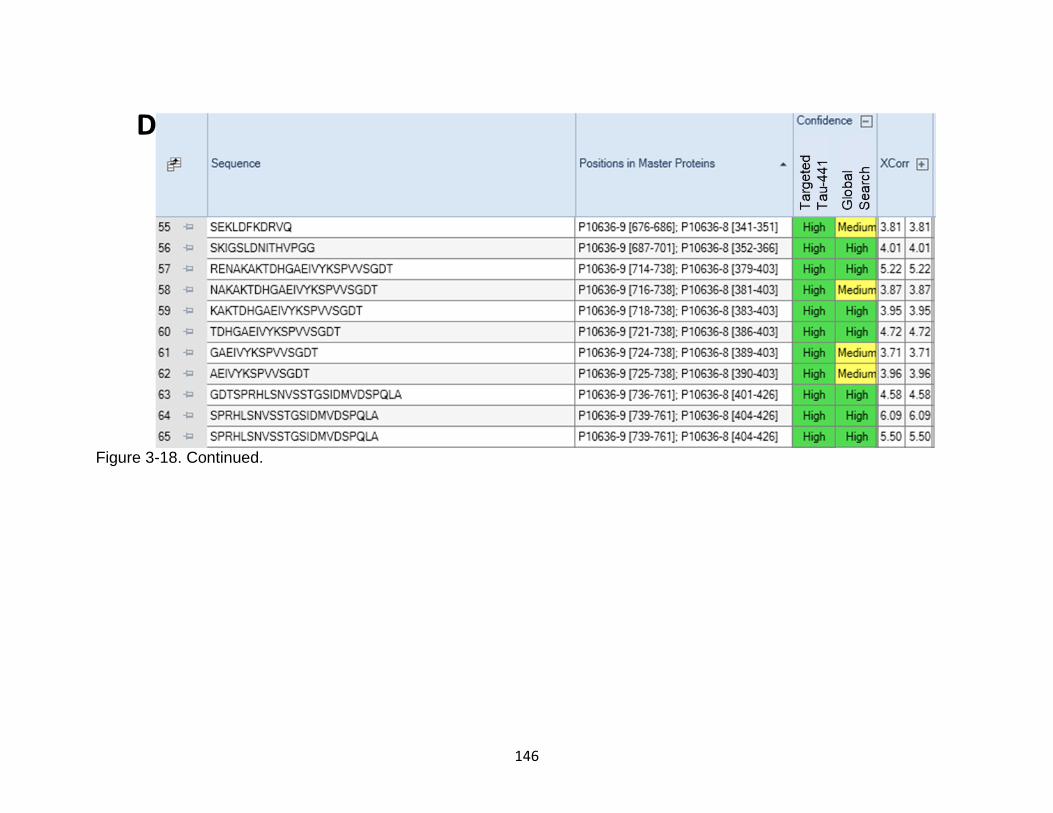
146
Figure 3-18. Continued.
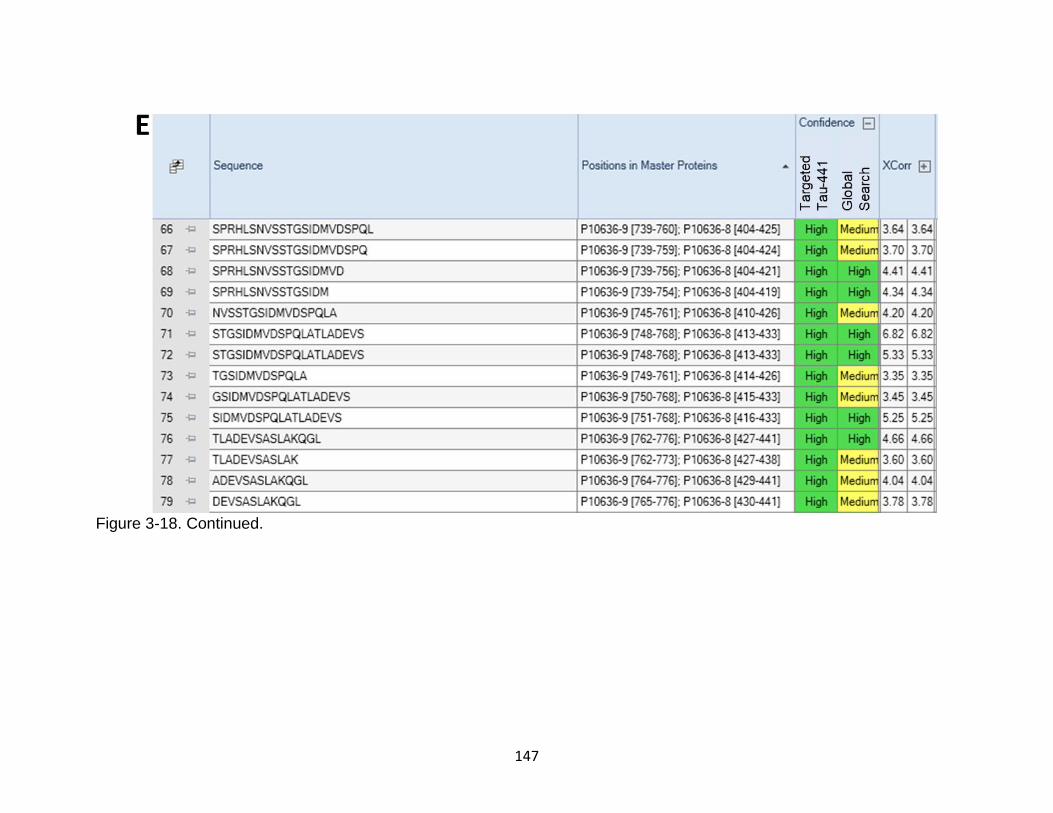
147
Figure 3-18. Continued.

148
CHAPTER 4 ANALYSIS OF TEMPORAL PROFILE OF TBI-INDUCED TAU
HYPERPHOSPHORYLATION AND PROTEOLYSIS IN MOUSE BRAIN BY IMMUNOBLOTTING AND MASS SPECTROMETRY
Introduction
Traumatic brain injury (TBI) is caused by damage from external force resulting
from fast acceleration or deceleration, penetration by a projectile, crush, impact,
potentially leading to short-term or permanent deficiencies of cognitive, physical, and
psychosocial functions(123). TBI is a complicated pathophysiological process that leads
to structural and functional damages resulting from primary and secondary injury
events(186).
The primary injury occurs after the instant physical disturbance of brain tissue
that happens at the moment of exposure to the mechanical force such as contusion,
damages to blood vessels (hemorrhage), and shearing of axons, in which neuronal
axons are torn and stretched. The secondary injury develops over minutes to months
after exposure to the primary injury, in which a cascade of metabolic reactions, cellular
and molecular processes that finally cause apoptosis, tissue injury and
neurodegeneration.(25)
Several biochemical reactions are responsible for the secondary injury, such as
glutamate excitotoxicity, disturbance of cellular calcium levels, elevated free radical
production, lipid peroxidation, mitochondrial damages, cell death, and diffuse axonal
injury. The reaction events of secondary injury cause neuronal, endothelial, glial
apoptosis and white matter disintegration. Apoptosis happens within a couple of
minutes after the injury and could lengthen over an interval of days to months.(187)
149
The medical heterogeneity seen in TBI patients depend on the site and degree of
the initial injury(188). Moreover, preexistent factors and patient condition may also
subsidize the pathophysiological heterogeneity of TBI, for example, age, health, gender,
alcohol, drug consumption and genetic factors(189). Animal studies of TBI are
structured to generate a reasonably homogenous mode of injury considering age,
gender, genetics and the injury parameters(190).
Therefore, it is challenging to fully reproduce all characteristics of secondary
injury seen in human TBI in any one animal model, which potentially could explain why
a lot of pharmaceutical drugs that showed promise in animal studies failed in clinical
studies. Animal models of TBI are undoubtedly critical for understanding the
biochemical and molecular functions of human TBI that clinical studies cannot test.
Moreover, animal studies are vital to develop and characterize novel diagnostic and
therapeutic strategies to translate into preclinical and clinical studies (190).
Several animal models of TBI injuries have been developed in the view of the
heterogeneous nature of the clinical environments. Rodents are used most of the time
instead of larger animals in TBI research because of their cost, small size, and
consistent result measurements(190).
Most of the recent TBI studies are focused on addressing the complex molecular
processes that occur after the head injury(188). The four animal TBI models that are
used extensively are fluid percussion injury (FPI), cortical impact injury (CCI), weight
drop–impact acceleration injury, and blast injury(191). We will cover in this chapter the
CCI animal model of TBI and will not discuss other models since CCI only was selected
for the study.
150
Cortical Impact Injury (CCI)
In order to mimic the cortical tissue loss, subdural hematoma, neuronal axonal
damage, mild TBI, blood-brain barrier (BBB) dysfunction, and even coma(192), the CCI
model was built to use electromagnetic impact or pneumatic devices to drive the
impactor onto the exposed intact dura(191). The physical impact delivered to the
exposed dura through a unilateral craniotomy, most often distort the underlying cortex.
Studies have shown that a wide-ranging neuropathological characterization of the CCI
animal model can include acute cortical, hippocampal, and thalamic
neurodegeneration(193).
One of the significant advantages of this type of injury over the other TBI models
is the convenience, at which the mechanical factors can be controlled, such as time,
velocity, depth of the impact. Therefore, it could be argued that CCI is more beneficial
than FPI model for studies that involve biomechanical factors. Another feature of the
CCI model is the absence of risk of rebound injury when compared with TBI models that
involve gravity-driven devices. The histopathological damages of CCI increase with
increasing the cortical disruption and the velocity of the impact allowing the control of
TBI severity, required for the experimental condition.(194)
The cognitive dysfunction of the animal model is highly related to the depth of the
cortical deformation and the velocity of the impact as measured in the Morris water
maze test in mice and rats. The cognitive impairment might persist up to one year after
the impact and could be associated with brain atrophy. The CCI animal model produces
injury that is consistent with the pathological characteristics of human TBI. Using large
animal TBI models might provide the chance to collect physiological information after
151
the injury in an environment that resembles the intensive care unit and thus could help
in translational studies of animal models into clinical practice.(74, 190)
Most of the animal TBI experiments have been performed on a short-term basis,
in the range of hours to days and seldom beyond one month after the injury(190). The
short-term studies have provided information on the pathophysiology and molecular
function outcomes during the acute stage after the TBI. However, the short-term TBI
studies might not generate a fair assessment of long-term TBI and cannot be
implemented alone in assessing strategies for clinical therapy for long-term therapy.
Studies that involve long-term injury response are critical for evaluating the outcomes of
TBI (three months and more after TBI). The use of different types of injury and longer-
term evaluation after TBI is essential for future preclinical studies.(190)
Analysis of tau phosphorylation levels after TBI models is essential since tau
levels profoundly influence the pathophysiology of TBI, both in short-term and long-term
experiments. Tau can provide highly informative biomarkers for post-TBI. In this
chapter, we implement the use of immunological methods including phospho-specific
tau antibodies to assess the temporal profile of tau phosphorylation and proteolysis
(including LMW and HMW) following TBI. We processed the samples using the
peptidomic approach described in chapter 3 for nano-UPLC-MS/MS. We have identified
novel peptides fragments of tau with different levels of phosphorylation resulted from
TBI mouse injury, which might provide a prognostic biomarker potential for patient
recovery in a tauopathy-relevant disease.

152
Materials and Methods
Ethical Statement
All animal studies conformed to the guidelines outlined in the ‘Guide for the Care
and Use of Laboratory Animals’ from the National Institutes of Health and were
approved by the University of Florida.
Mouse Brain Samples Preparation
TBI in human tau transgenic mice (3-4-month-old; Charles River Laboratories;
USA) was induced using controlled cortical impact (CCI) device. The mice were
anesthetized using 4% isoflurane in oxygen as a carrier gas for four minutes and
maintained under anesthesia with 2-3% isoflurane in oxygen. Surgery was performed
on mice by mounting in a stereotactic frame in prone position and secured by ear and
incisor bars. A 3 mm unilateral (ipsilateral) craniotomy was performed midway between
bregma and lambda with the dura mater remaining intact over the cortex. A brain
trauma was induced by using a PSI TBI-0310 Impactor (Precision Systems and
instrumentation, USA) by impacting the right cortex (ipsilateral cortex) with 2 mm
diameter impactor tip at velocity of 3.5 m/second, 1.5 mm compression depth, and a
200 ms dwell time (compression duration).
After one, three, and seven days post-CCI, the animals were euthanized with a
lethal dose of pentobarbital; whole brains were removed, and snap frozen using liquid
nitrogen. For naïve brain samples, mice were euthanized, and subsequently, brains
were removed and flash-frozen in liquid nitrogen and did not receive an impact injury.
The brains were stored at – 80°C until further use. The brain samples were pulverized
to a fine powder using a mortar and a pestle set in dry ice using liquid nitrogen. The fine
powder was transferred to microcentrifuge tubes (Eppendorf). Powdered brain samples
153
were stored at – 80°C until further use. The brain powder was then lysed with 1% Triton
X-100 lysis buffer containing 20 mM Tris HCl, pH 7.0, 5 mM EDTA, and 1 mM DTT in
double distilled water. The brain samples were incubated at 4°C 90-120 minutes kept at
a tube revolver (Thermo scientific) at low speed (10,000 x g). Following the incubation,
the samples were centrifuged at 14,000 rpm for 15 minutes at 4°C, and the supernatant
was transferred to new tubes. The protein concentration was determined by performing
protein assay using bicinchoninic acid microprotein assays (Pierce Inc., Rockford, IL,
USA) against albumin standards.
Ultrafiltration Method and Ultrafiltrate Processing for Mass Spectrometry
Ultrafiltration step is introduced to partition small peptides from higher molecular
weight protein or protein fragments using an ultrafiltration unit with a molecular weight
cut-off (MWCO) value of 10 kDa (Sartorius Stedim Biotech, VS0102). A sample of 250
µL of brain tissue lysate was loaded into the ultrafiltration device and centrifuged at 4°C
for 20 min, 5000 x g [Eppendorf 5415R]. Twenty micrograms of the retentate were used
for SDS-PAGE and western blot analysis (described in the following section below). The
200 μL of filtrates were dried using speed vacuum (Thermo Scientific). The ultrafiltrate
samples (containing peptides) were reconstituted with 15-µL LC-MS grade water with
0.1% formic acid, and five µL was used for each injection into nanoLC-MS/MS.
Immunoblot Analysis
The retentate fractions of (ipsilateral and contralateral cortex brain lysate) were
analyzed using SDS-PAGE followed by western blotting. The samples (20 µg of protein
for tissue lysate) were mixed with SDS-containing sample buffer along with rainbow
molecular weight marker full-range rainbow (RPN800E, GE Healthcare, USA). Tris-
glycine gels (4-20%, 1 mm X 18 well) were run on 200 V, for about one hour.
154
For immunoblotting, the gel was placed in deionized water for 5 minutes and then
in transfer buffer (25 mM Tris, 192 mM glycine, 20% methanol) for 5 minutes before
electrotransfer to PVDF membrane on the iBlot Dry Blotting system (Carlsbad, CA,
USA) at 20 V for 13 min. The PVDF was blocked with non-fat milk (5%) in Tris-buffered
Saline Tween (TBST) [20 mM, Tris pH 7.5, 15 mM NaCl, and 0.02 % Tween 20] and
probed with specific primary antibodies prepared in 5% skim milk in TBST overnight at 4
°C, followed by secondary goat anti-Rabbit IgG alkaline phosphatase conjugate (Fc
specific) or goat anti-mouse IgG alkaline phosphatase conjugate (69266, EMD Millipore,
USA] for two hours.
Immunoreactive bands were then observed by adding 5-bromo-4-chloro-3-
indolyl phosphate (BCIP) and nitro blue tetrazolium (NBT) [Product Code: 50-81-10].
Dried membrane was scanned with Expression 8836XL (Epson) and the UN-SCAN-IT
software (version 6.1, Silk Scientific Corporation). Quantitative evaluation of the protein
levels was performed with the computer-based densitometric NIH Image J (version 1.6)
software.
Reversed-Phase Nano-UPLC-MS/MS
Separation of peptides from tissue lysate samples was performed on
NanoAcquity UPLC (Waters, Milford, MA) by reversed phase chromatography. Five
microliters of each sample were loaded onto a NanoACQUITY UPLC symmetry C18 trap
column, 100 Å, 5 µm, 180 µm x 20 mm followed by separation on an ACQUITY UPLC
BEH (C18) column, 130 Å, 1.7 µm, 100 μm X 100 mm. The mobile phase consisted of
solvent A (water with 0.1% formic acid) and solvent B (acetonitrile with 0.1% formic
acid) (Honeywell, Muskegon, MI). Separation was achieved within a run time of 135 min
at a flow rate of 300 nL/min. The first linear gradient was run from 1% to 50% B over 90
155
min; the second linear gradient was from 50% to 85% B over 5 min and held for 5 min
before returning to initial mobile-phase composition (1% B). Tandem mass spectra were
collected on LTQ-XL (Thermo, San Jose, CA, USA) using a data-dependent acquisition
method in Xcalibur 4.0 (Thermo).
The analysis was set up for a full scan recorded between m/z 300–1800, and an
MS/MS scan to generate product-ion spectra to determine the amino acid sequence in
consecutive instrument scans of the ten most abundant peaks in the spectrum MS
(scan event 1) with dynamic exclusion enabled. The following dynamic exclusion
settings were applied to precursor ions chosen for product spectra analysis: repeat
count—1; repeat duration—30 s; and exclusion duration—30 s. All MS/MS spectra were
analyzed using Proteome Discoverer 2.2 (Thermo), SEQUEST HT (version: 2.1.1.21).
Database search engines were set up to search with no enzyme UniProt-Tau-441
(P10636-8), FASTA file version 2018_07. The search was achieved using the average
mass for matching the precursor with a fragment ion mass tolerance of 0.8 Da and a
parent ion tolerance of 1.5 Da. Phosphorylation of serine, threonine, and tyrosine was
selected as a dynamic modification, while the oxidation of methionine and cysteine were
selected as a static modification, using the output from SEQUEST HT.
Results and Discussion
Controlled cortical impact (CCI) is a model that implements a mechanical force to
mimic traumatic brain injury (TBI)(191). CCI was invented 30 years ago with the goal of
devising a mechanical platform to study brains subjected to direct physical deformation.
The CCI model quickly altered into a standardized method to analyze different TBI
models and evaluate different strategies for therapy. In this study, we have used the
CCI model to produce mouse TBI at the proper time-points (one, three, and seven
156
days). The five different brain parts in the right and left hemisphere (cerebrocortex,
subcortical white matter, hippocampus, and corpus callosum) were at once dissected
after decapitation.
The cerebrocortex was further dissected into the ipsilateral and contralateral
cortex to study the different effect of the injury on these two regions. After collecting the
brain parts, all samples were snap-frozen with liquid nitrogen at once to minimize
unwanted protein degradation that is not due to CCI. Moreover, phosphatase and
protease inhibitors were added to the lysis of buffer. Since the controlled cortical impact
device targets directly the cortex, there was a focal injury in the ipsilateral (IC) and
contralateral cortex (CC) tissue than in the hippocampal tissue, which was impacted
indirectly by contusive force.
Our mouse models were designed to express only human tau isoforms(195). It
was made by breeding two existing line of tau mice and tau knockout mice(196, 197).
The tau mice express a tau transgene through P1-derived artificial chromosome (PAC)
cloning vector controlled by the tau promoter and generate all human tau isoforms. A
stretch of complementary DNA (cDNA) expressing the enhanced green fluorescent
protein (EGFP) was introduced into exon 1 of the MAPT gene.
As for the neuropathology, htau mice develop age-related tau pathology that
includes rearrangement of tau to cell bodies and dendrites, hyperphosphorylated tau,
aggregation of pair helical filaments (PHF), and detection of neurofibrillary tangles using
thioflavin S at nine to fifteen months. Tau pathology is maximally severe in the cortex
and hippocampal region of the brain and least in the brain stem and spinal cord(195,
198). In our study, all mice used for CCI aged from three to six months. After nine

157
months minimally, the aggregated tau and PHF can be seen by immunoelectron
microscopy. However, insoluble tau aggregates can be separated from the brain tissue
as early as two months. Hyperphosphorylation of tau starts to elevate by six months and
continue to increase by thirteen and fifteen months.(199) Figure 4-1 shows our
optimized peptidomic sample workflow for the nano-LC-ESI-MS/MS after CCI treatment
to htau mouse brain. Subjecting the mouse brain proteins to ultrafiltration results in the
separation of HMW protein fragments from LMW proteolytic peptides production.
Immunoblot Analysis of Tau in Transgenic Mouse Brain after Experimental CCI
To determine the phosphorylation, proteolysis, and oligomerization state of tau
following CCI, we analyzed our samples by western blotting using the tau phospho-
antibodies CP13 (pSer202), PHF-1(pSer396/pSer404), RZ3 (pThr231), AT270 (pThr181) AT8
(pSer202/pThr205), and total tau DAKO (Figure 4-2, 4-3 and Table 2-1).
In the naïve cortex, tau protein was detected as a doublets band around 52K—
54K, when samples were probed with DAKO, AT270, AT8, and PHF-1 (Figure 4-2A and
Figure 4-3A). These bands of tau observed could be attributed to the multiple isoforms
of tau protein, phosphorylation levels, or both. Additionally, the basal levels of
phosphorylation in naïve cortex observed with PHF-1, AT8, and AT270 (Figure 4-2A
and Figure 4-3A), could potentially be an effect of age-related phosphorylation resulting
from the transgenic htau expressed. As described above, tau hyperphosphorylation
starts to elevate by six months and continue to increase by thirteen to fifteen months.
Mouse naïve cortex (24h after craniotomy) did not produce any tau-BDPs (Figure 4-2
and Figure 4-3).
Our total tau antibody (DAKO) detected a considerable increase for tau-55K at
D3 and D7 with contralateral cortex (CC) and ipsilateral cortex (IC) of TBI samples
158
(Figure 4-3). This observation is consistent with Rubenstein et al. group study where
they observed increased levels of total tau and p-tau after TBI in the brain and blood
that were associated with PrPc expression levels as measured immunologically(200).
We also observed with total tau DAKO antibody increased levels of tau-BDP-26K,
starting on day 1 and dramatically peaking at day 7 in both IC and CC samples (Figure
4-3A).
As for AT270 (pThr181) and AT8 (pSer202/pThr205), we observed an increase of
tau-56K considerably after seven days of TBI in the IC and CC (Figure 4-2A, B).
Interestingly, with AT270 and AT8, we were also able to detect a dramatic increase of
high molecular weight bands of tau-225K (accounting for tau oligomers) compared to
naïve cortex after one, three, and seven days of CCI in both cortex brain regions BDPs
(Figure 4-2A, B). Moreover, we observed that as 225K band increase in band intensity,
there was a simultaneous decrease of the tau-56K band as well (Figure 4-2A). One
might expect that p-tau polymerize into oligomers phase, thereby, reducing the total
levels of monomeric p-tau. Phosphorylation at Thr181 and Thr205 has been considered
major toxic sites and are associated with abnormal accumulation of p-tau in postmortem
human brain found after years of sustained repetitive mTBI.
Moreover, a study showed that oligomeric and monomeric p-tau were detected
after four hours, one day, two weeks post-TBI in a non-transgenic rodent model of
parasagittal FPI model(201).
Probing samples with PHF-1 (pSer396/pSer404) showed a dramatic increase for
the tau-56K band after D3 and D7 of TBI in both IC and CC samples (Figure 4-3). A
molecular weight shift was observed for p-tau-56K to p-tau-58K at D7 in both CC and
159
IC. However, we did not observe any Tau-BDP or oligomeric-tau with PHF-1 antibody at
the different time point tested post-TBI (Figure 4-3A). Phosphorylation sites at
pSer396/pSer404 are known to associate with the pathological features of tauopathies in
AD(202) and TBI(200). Therefore, our observation suggests that modifications at the
PHF-1 site can coincide with other pathological sites in post-TBI.
In the mouse IC of the TBI group, probing with RZ3 (pThr231) showed a
considerable increase of p-tau-56K at D1, D3 of IC and D1, D3, and D7 of CC following
CCI (Figure 4-3). RZ3 showed the highest increase in p-tau-56K levels at D1 of IC and
D7 of CC. Interestingly, RZ3 showed a dramatic loss of ptau-56K at D7 in IC samples
and a significant increase in p-tau-BDP-24K (p-value<0.05) at D1 and D7 compared to
control in IC region (Figure 4-3). Like PHF-1, we did not observe any high molecular
weight tau (225K) post-CCI with the RZ3 antibody. We observed tau-BDP 24K only in
IC and not in CC samples. Phosphorylation at Thr231 is known to facilitate tau
hyperphosphorylation, aggregation, and initiate neurodegenerative mechanisms within
the cells. A recent study reported increased GSK3β levels, pThr175, pThr231, and
oligomerized tau in hippocampal neurons of moderate TBI rats(203). Moreover, the
pThr231-Pro232 motif can be either in the cis or trans configuration, but studies indicated
that cis configuration is the pathological form for AD(204).
As for CP13 antibody, tau-56K increased dramatically with D1, D3 D7 in IC and
D7 in CC and to a lesser extent in D1 and D3 of IC (Figure 4-3). Multiple clusters of tau-
BDP were observed as with CP13, concentrating mainly at 24K and 15K at D7 of IC and
CC. Less tau-BDP-24K was observed when samples were probed with CP13 after D1
and D3 of IC and CC post-CCI (Figure 4-3). Again, we did not observe any oligomeric p-
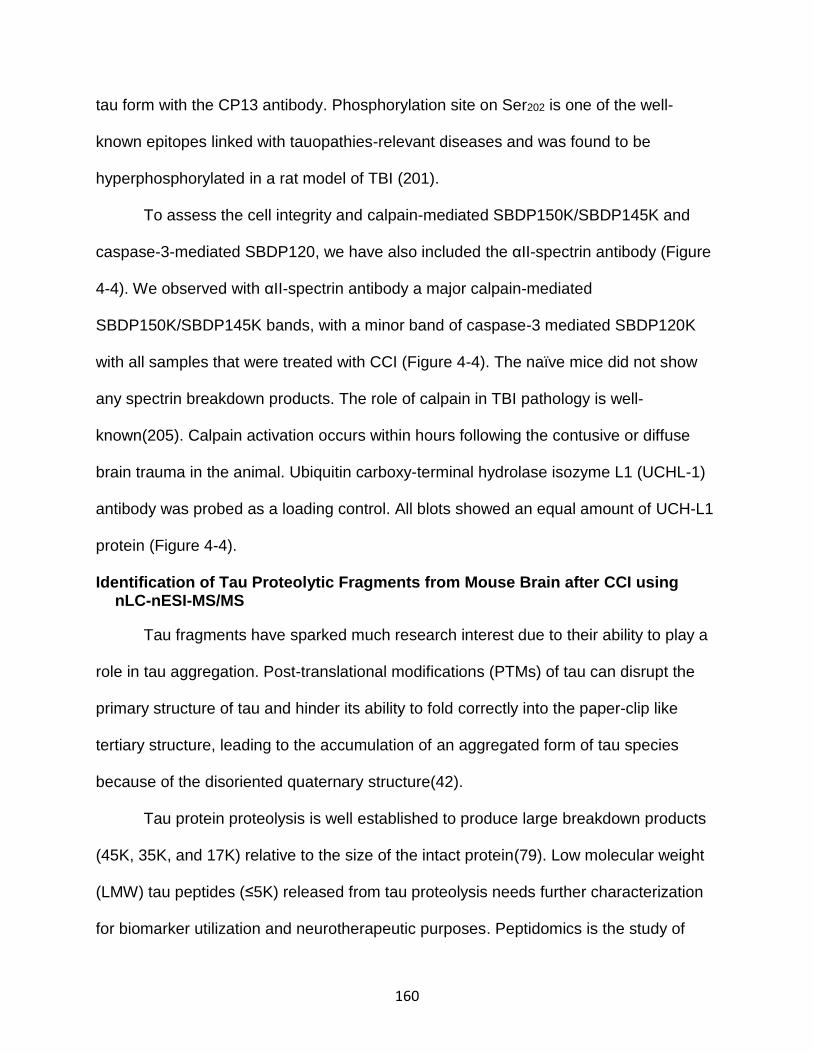
160
tau form with the CP13 antibody. Phosphorylation site on Ser202 is one of the well-
known epitopes linked with tauopathies-relevant diseases and was found to be
hyperphosphorylated in a rat model of TBI (201).
To assess the cell integrity and calpain-mediated SBDP150K/SBDP145K and
caspase-3-mediated SBDP120, we have also included the αII-spectrin antibody (Figure
4-4). We observed with αII-spectrin antibody a major calpain-mediated
SBDP150K/SBDP145K bands, with a minor band of caspase-3 mediated SBDP120K
with all samples that were treated with CCI (Figure 4-4). The naïve mice did not show
any spectrin breakdown products. The role of calpain in TBI pathology is well-
known(205). Calpain activation occurs within hours following the contusive or diffuse
brain trauma in the animal. Ubiquitin carboxy-terminal hydrolase isozyme L1 (UCHL-1)
antibody was probed as a loading control. All blots showed an equal amount of UCH-L1
protein (Figure 4-4).
Identification of Tau Proteolytic Fragments from Mouse Brain after CCI using nLC-nESI-MS/MS
Tau fragments have sparked much research interest due to their ability to play a
role in tau aggregation. Post-translational modifications (PTMs) of tau can disrupt the
primary structure of tau and hinder its ability to fold correctly into the paper-clip like
tertiary structure, leading to the accumulation of an aggregated form of tau species
because of the disoriented quaternary structure(42).
Tau protein proteolysis is well established to produce large breakdown products
(45K, 35K, and 17K) relative to the size of the intact protein(79). Low molecular weight
(LMW) tau peptides (≤5K) released from tau proteolysis needs further characterization
for biomarker utilization and neurotherapeutic purposes. Peptidomics is the study of
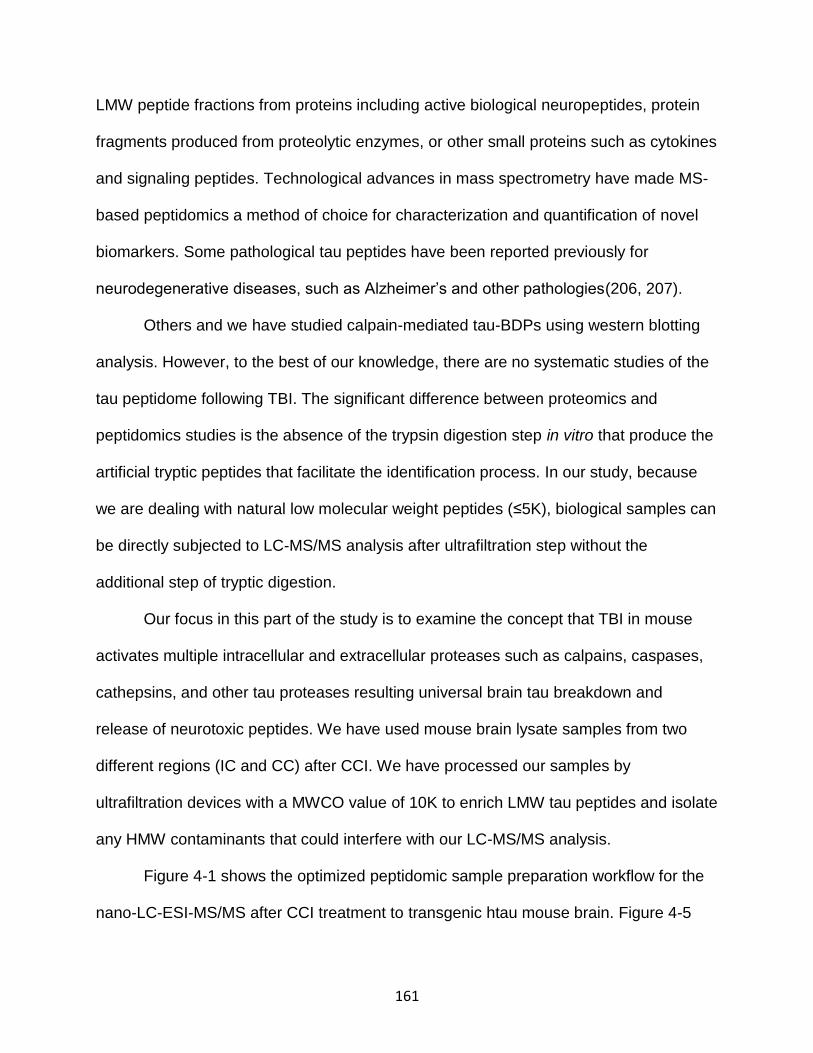
161
LMW peptide fractions from proteins including active biological neuropeptides, protein
fragments produced from proteolytic enzymes, or other small proteins such as cytokines
and signaling peptides. Technological advances in mass spectrometry have made MS-
based peptidomics a method of choice for characterization and quantification of novel
biomarkers. Some pathological tau peptides have been reported previously for
neurodegenerative diseases, such as Alzheimer’s and other pathologies(206, 207).
Others and we have studied calpain-mediated tau-BDPs using western blotting
analysis. However, to the best of our knowledge, there are no systematic studies of the
tau peptidome following TBI. The significant difference between proteomics and
peptidomics studies is the absence of the trypsin digestion step in vitro that produce the
artificial tryptic peptides that facilitate the identification process. In our study, because
we are dealing with natural low molecular weight peptides (≤5K), biological samples can
be directly subjected to LC-MS/MS analysis after ultrafiltration step without the
additional step of tryptic digestion.
Our focus in this part of the study is to examine the concept that TBI in mouse
activates multiple intracellular and extracellular proteases such as calpains, caspases,
cathepsins, and other tau proteases resulting universal brain tau breakdown and
release of neurotoxic peptides. We have used mouse brain lysate samples from two
different regions (IC and CC) after CCI. We have processed our samples by
ultrafiltration devices with a MWCO value of 10K to enrich LMW tau peptides and isolate
any HMW contaminants that could interfere with our LC-MS/MS analysis.
Figure 4-1 shows the optimized peptidomic sample preparation workflow for the
nano-LC-ESI-MS/MS after CCI treatment to transgenic htau mouse brain. Figure 4-5
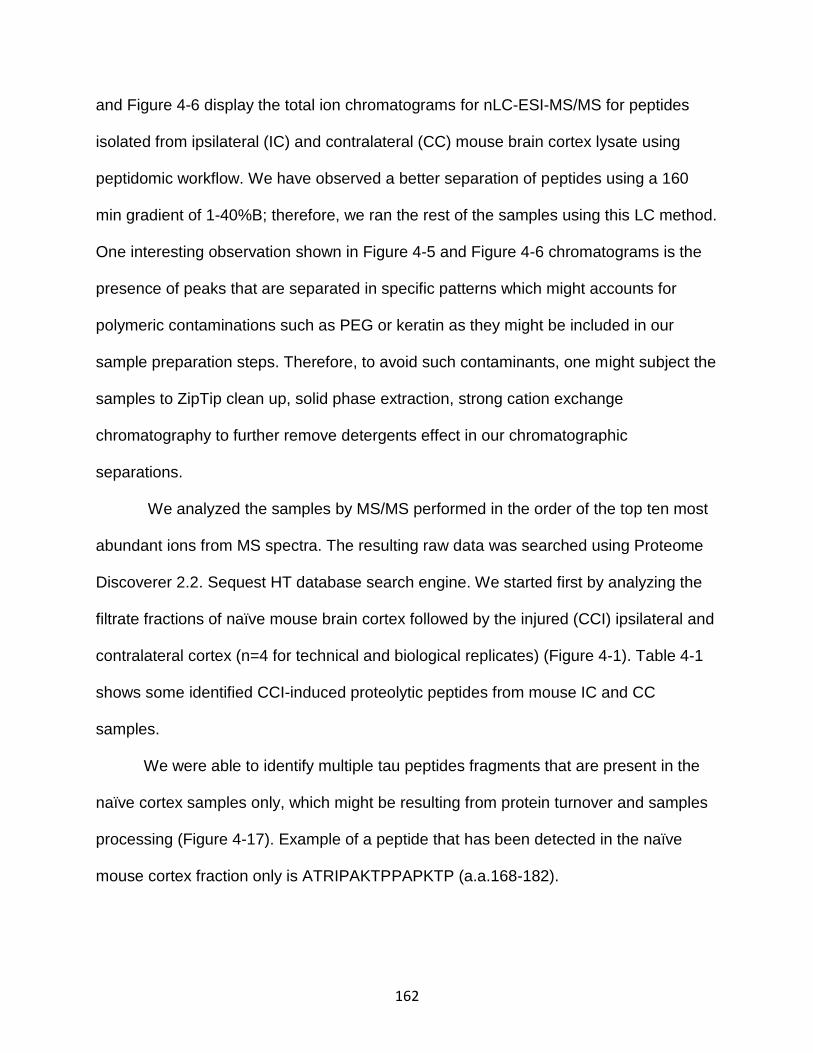
162
and Figure 4-6 display the total ion chromatograms for nLC-ESI-MS/MS for peptides
isolated from ipsilateral (IC) and contralateral (CC) mouse brain cortex lysate using
peptidomic workflow. We have observed a better separation of peptides using a 160
min gradient of 1-40%B; therefore, we ran the rest of the samples using this LC method.
One interesting observation shown in Figure 4-5 and Figure 4-6 chromatograms is the
presence of peaks that are separated in specific patterns which might accounts for
polymeric contaminations such as PEG or keratin as they might be included in our
sample preparation steps. Therefore, to avoid such contaminants, one might subject the
samples to ZipTip clean up, solid phase extraction, strong cation exchange
chromatography to further remove detergents effect in our chromatographic
separations.
We analyzed the samples by MS/MS performed in the order of the top ten most
abundant ions from MS spectra. The resulting raw data was searched using Proteome
Discoverer 2.2. Sequest HT database search engine. We started first by analyzing the
filtrate fractions of naïve mouse brain cortex followed by the injured (CCI) ipsilateral and
contralateral cortex (n=4 for technical and biological replicates) (Figure 4-1). Table 4-1
shows some identified CCI-induced proteolytic peptides from mouse IC and CC
samples.
We were able to identify multiple tau peptides fragments that are present in the
naïve cortex samples only, which might be resulting from protein turnover and samples
processing (Figure 4-17). Example of a peptide that has been detected in the naïve
mouse cortex fraction only is ATRIPAKTPPAPKTP (a.a.168-182).
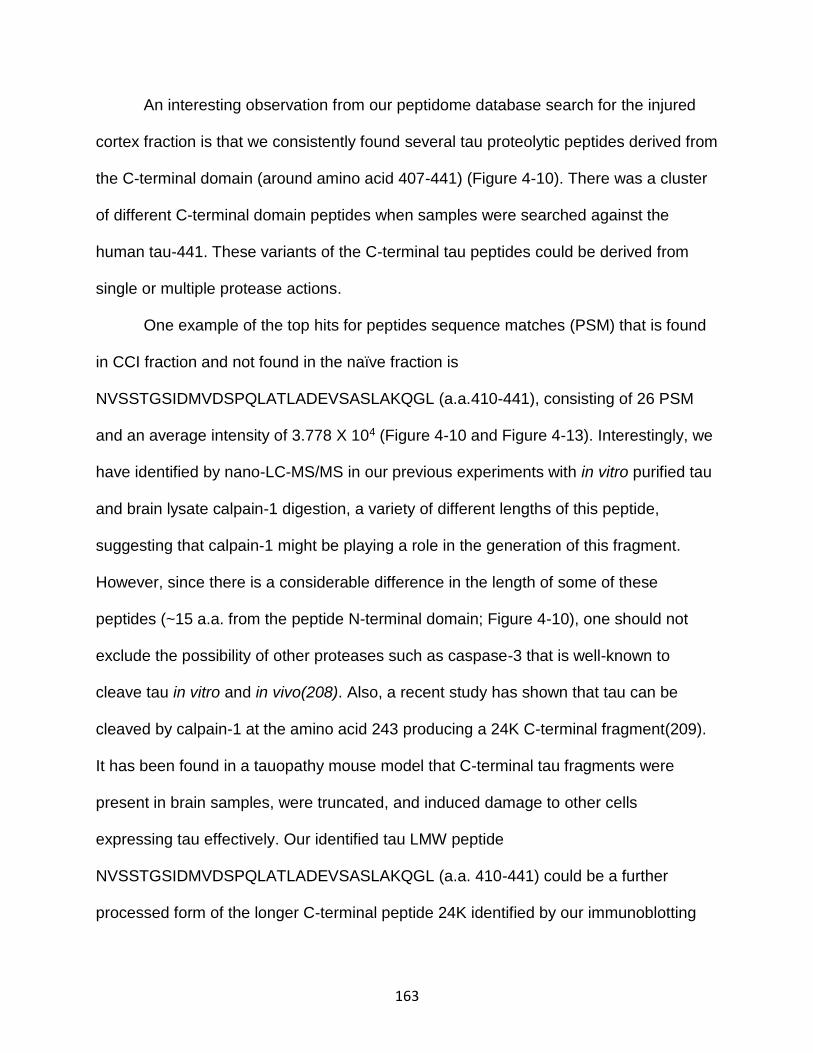
163
An interesting observation from our peptidome database search for the injured
cortex fraction is that we consistently found several tau proteolytic peptides derived from
the C-terminal domain (around amino acid 407-441) (Figure 4-10). There was a cluster
of different C-terminal domain peptides when samples were searched against the
human tau-441. These variants of the C-terminal tau peptides could be derived from
single or multiple protease actions.
One example of the top hits for peptides sequence matches (PSM) that is found
in CCI fraction and not found in the naïve fraction is
NVSSTGSIDMVDSPQLATLADEVSASLAKQGL (a.a.410-441), consisting of 26 PSM
and an average intensity of 3.778 X 10⁴ (Figure 4-10 and Figure 4-13). Interestingly, we
have identified by nano-LC-MS/MS in our previous experiments with in vitro purified tau
and brain lysate calpain-1 digestion, a variety of different lengths of this peptide,
suggesting that calpain-1 might be playing a role in the generation of this fragment.
However, since there is a considerable difference in the length of some of these
peptides (~15 a.a. from the peptide N-terminal domain; Figure 4-10), one should not
exclude the possibility of other proteases such as caspase-3 that is well-known to
cleave tau in vitro and in vivo(208). Also, a recent study has shown that tau can be
cleaved by calpain-1 at the amino acid 243 producing a 24K C-terminal fragment(209).
It has been found in a tauopathy mouse model that C-terminal tau fragments were
present in brain samples, were truncated, and induced damage to other cells
expressing tau effectively. Our identified tau LMW peptide
NVSSTGSIDMVDSPQLATLADEVSASLAKQGL (a.a. 410-441) could be a further
processed form of the longer C-terminal peptide 24K identified by our immunoblotting

164
and other studies(209, 210). Figure 4-15 shows a product ion spectrum of the tau
peptide NVSSTGSIDMVDSPQLATLADEVSASLAKQGL released from CCI-induced
mouse brain cortex.
Another released truncated form of tau C-terminal peptide is
MVDSPQLATLADEVSASLAKQGL (a.a. 419-441), which is very close to the caspase
cleavage site Asp421 reported(211). As mentioned above, tau is well known to be a
substrate of the caspase enzymes, which are recognized for their role in apoptosis.
Asp421 is the most well-characterized caspase cleavage site on tau, which produces a
tau fragment of 50K. Our immunoblots showed a band at tau-BDP-50K detected with
the CP13 antibody, which suggests a proteolyzed tau at Asp421. Caspase tau fragments
can be found in several tauopathies and are inversely correlated with formation of
Asp421 truncated tau which occurs early in the disease process(172, 179). It is
postulated that the accumulation of Asp421 fragments is the result of disruption of the
autophagy process, which is known to occur in tauopathies and AD(212). Moreover,
Asp421 fragments can induce tau hyperphosphorylation causing conformational
changes, thereby enhancing the assembly of PHF and aggregation processes(213-
215).
We were also able to identify the C-terminal peptides:
STGSIDMVDSPQLATLADEVSASLAKQGL (a.a. 413-441) and
HLSNVSSTGSIDMVDSPQLATLADEVSASLAKQ (a.a. 407-441), implying that tau is
processed by proteolytic enzymes mainly on the C-terminal end following TBI (Table 4-
1; Figure 4-10). Likewise, these peptides have been detected in our previous chapter
study using calpain-1 mediated tau proteolysis. We have concluded that a.a.
165
Ser412/Ser413 is one of the top hits for possible calpain cleavage sites on tau, further
supporting the role of calpain-1 in the proteolysis process. However, we also reported in
a previously published study that caspase-3 cleave tau at Ser412/Ser413. It might be
possible that both enzymes can cleave the same tau site, taking into consideration the
different phosphorylation state of the amino acid residues, which might change the
secondary/tertiary structure leading to the dual vulnerability of tau by the enzymes.
Figure 4-14 shows another C-terminal variant of tau peptide
SPQLATLADEVSASLAKQGL that released from CCI-induced mouse brain.
On the other hand, we have identified a tau peptide in the acidic region (N2) that
was also detected from previous in vitro tau calpain digestion which is
EIPEGTTAEEAGIGDTPSLEDEAAGHVTQA (a.a. 96-125) (Table 4-1 and Figure 4-9, 4-
10- 4-11). Figure 4-12 shows a product ion spectrum of
EIPEGTTAEEAGIGDTPSLEDEAAGHVTQA peptide released from CCI injured mouse
brain cortex. This peptide was found only in the IC fractions. Calpain-2 produce tau
fragments of a.a. 3-124(216). Our identified LMW tau peptide (a.a. 96-125) might be a
truncated form of the HMW tau fragment with one amino acid difference from the C-
terminus. Another tau proteolytic fragment found in IC-D3 post-CCI sample is
EAGIGDTPSLEDEAAGHVTQA (a.a.105-125 which is a truncated form of the peptide
EIPEGTTAEEAGIGDTPSLEDEAAGHVTQA found from our in vitro tau digestion. A
Study suggested that cleavage of tau at Q124/A125 by calpain-2 and thrombin and not
calpain-1 suggested that these fragments might not be able to trigger microtubule
polymerization and aggregation into pair helical filaments (PHFs) (89, 216).
166
Since our transgenic mice model can express the six isoforms of human tau,
including 3R and 4R, we included in our bioinformatics database search the longest tau
isoform tau-758 (canonical sequence, accession number P-10636-1) (Figure 4-7 and
Figure 4-8). Tau-441 differs from tau-758 by missing the amino acids 125-375 and 395-
460 due to alternative splicing mechanism. We were able to identify novel two peptides
from the canonical sequence tau-758 including TRQPSGTGPEDTEGGRHAP (a.a. 167-
185) and KYVSSVTSRTGSSGAKEMK (a.a. 440-458) that are only found in ipsilateral
cortex CCI fractions with 21 and 20 PSMs respectively (Figure 4-8). Furthermore, a
Venn diagram was constructed to show the average hits for the control samples versus
IC and CC-TBI fractions at different time points (Figure 4-16A, B). The CC fractions
showed five unique tau peptides, and IC fraction showed six unique peptides from TBI
with high confidence.
To identify phosphorylated tau sites on peptides identified using mass
spectrometry, we enabled the multistage activation mode on our linear ion trap mass
spectrometer. Multistage activation generates more structurally informative ions by
eliminating the ion isolation step between MS/MS and MS/MS/MS. The process starts
with a survey scan, and the trap is re-filled for MS/MS scan of a parent ion. The
resulting MS/MS spectrum is used to identify the neutral loss fragment that corresponds
to either singly, doubly or triply charged molecule of phosphate. The neutral loss ion is
collisionally-activated while the fragments from the precursor ion are still present in the
trap. The result is a composite spectrum that includes daughter ions from both the
precursor and the neutral loss product.
167
Table 4-2 shows identified TBI-induced phosphorylated peptides from mouse
CCI cortex sample ultrafiltrate by nLC-MS/MS. Figure 4-16C, D, compares the number
of phosphorylated and non-phosphorylated peptides from IC and CC samples. We have
identified ten high confidence phosphorylated peptides from IC and twelve peptides
from CC post-TBI. High probability phosphorylation sites identified post-TBI includes
Thr101, Thr102, Thr111, Ser113, Ser210, Thr217, and Ser409. We have obtained high
confidence peptide coverage of these residues as detected by our MS protocol and the
probability of phosphorylation sites detected on these tau peptides ranged from 70% to
99%. Phosphorylation of tau at Thr101 and Thr102 has been reported to be associated
with by casein kinase 1δ (CK1δ) (217).
Interestingly, it has been revealed that phosphorylation of tau by CK1 at Ser210 or
Thr212 was detected only when phosphorylation at Ser214 or Thr217 was also
present(217). Our results agree with the hypothesis of tau phosphorylation in a specific
residue leads to subsequent phosphorylation at neighboring amino acid in the brain.
Monitoring phosphorylation sites are vital for understanding the tau mechanism in
initiating the aggregation process. Another interesting observation is the phosphorylated
site at Ser409, in which a study pointed that neurofibrillary tangle-associated kinase
phosphorylate Thr361 and Ser412 only after pre-phosphorylation of tau by PKA at the
neighboring amino acid residues Ser356 and Ser409 (218). However, to the best of our
knowledge, we are the first to report these phosphorylation sites in TBI animal models.
Conclusions
In this chapter, we have demonstrated that possible tau TBI biomarkers could be
identified from the CCI animal models. Others and we have studied proteolysis in rodent
TBI extensively and showed that TBI leads to a wide range of tau phosphorylation,
168
oligomerization, and protein fragmentation from the N-terminal and mostly in the C-
terminal domain. Earlier studies have mostly focused on HMW break down products
with a molecular weight similar to the intact tau protein. Furthermore, the peptidome in a
normal healthy brain represents an array of bioactive neuropeptides and peptides
derived from a non-specific truncation at the N-terminal, the C-terminus, or both, of the
intact protein. Our results showed that TBI not only generated truncated tau fragments
but also produced LMW proteolytic peptides from either the intact protein or the
fragments. Local activation of proteolytic enzymes attacks unique non-specific sites on
the intact tau protein because of TBI. This results in the formation of HMW breakdown
products and LMW proteolytic peptides that could be released into the biofluids.
We implemented in this study a transgenic mouse model expressing human tau
isoforms. We collected the IC and CC on day one, three and seven from mouse TBI
models that represent severe focal injury. The novelty of the study resides in excluding
trypsin enzyme for our peptidome analysis and directly subjecting our samples to nLC-
MS/MS and bioinformatics searches to identify new tau neuro-toxic peptides. TBI
pathology produced all of the reported peptides herein. We have observed from our
data that caspase family, calpain-1, and 2, more closely relate the pattern of tau
fragmentation to those that are generated in our study (C-terminal domain fragments).
This truncated core peptide is also subjected to phosphorylation (based on our
immunoblotting and MS data) which might play a role in aggregation and activation of
neurodegenerative mechanisms.
In our in vitro studies, we have identified tau fragment from calpain-1 cleavage
that overlaps with our TBI animal experiments. From our peptidomics data in this
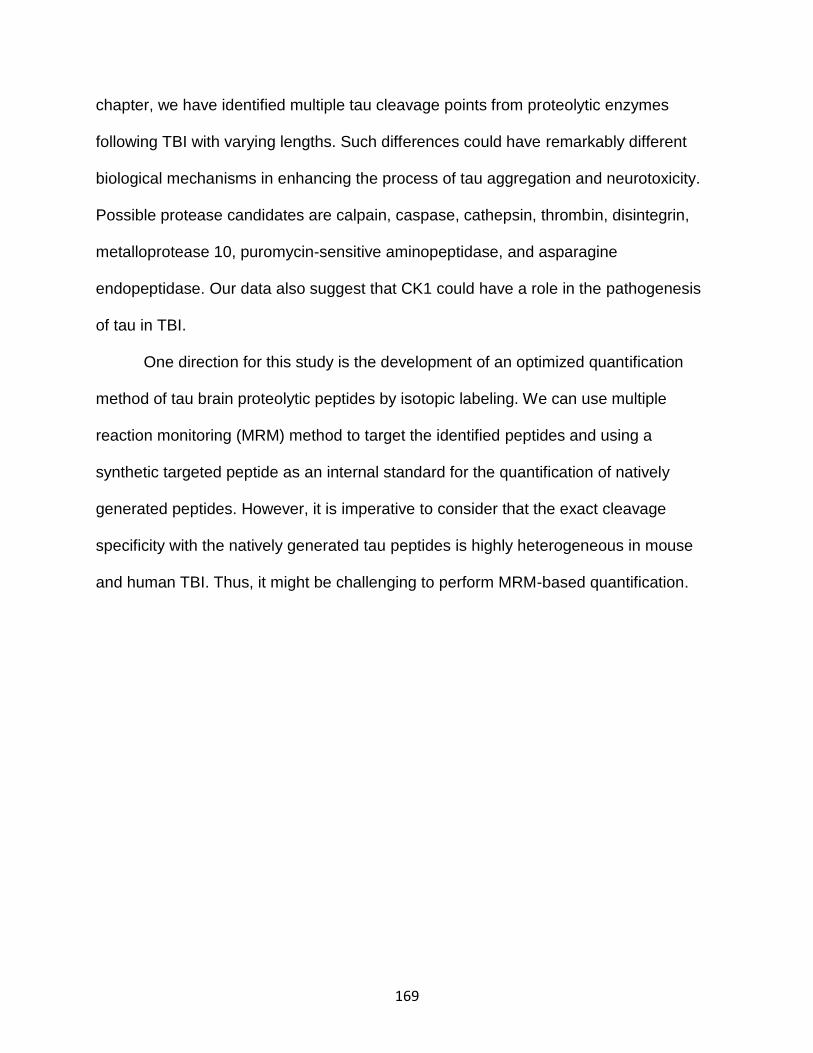
169
chapter, we have identified multiple tau cleavage points from proteolytic enzymes
following TBI with varying lengths. Such differences could have remarkably different
biological mechanisms in enhancing the process of tau aggregation and neurotoxicity.
Possible protease candidates are calpain, caspase, cathepsin, thrombin, disintegrin,
metalloprotease 10, puromycin-sensitive aminopeptidase, and asparagine
endopeptidase. Our data also suggest that CK1 could have a role in the pathogenesis
of tau in TBI.
One direction for this study is the development of an optimized quantification
method of tau brain proteolytic peptides by isotopic labeling. We can use multiple
reaction monitoring (MRM) method to target the identified peptides and using a
synthetic targeted peptide as an internal standard for the quantification of natively
generated peptides. However, it is imperative to consider that the exact cleavage
specificity with the natively generated tau peptides is highly heterogeneous in mouse
and human TBI. Thus, it might be challenging to perform MRM-based quantification.
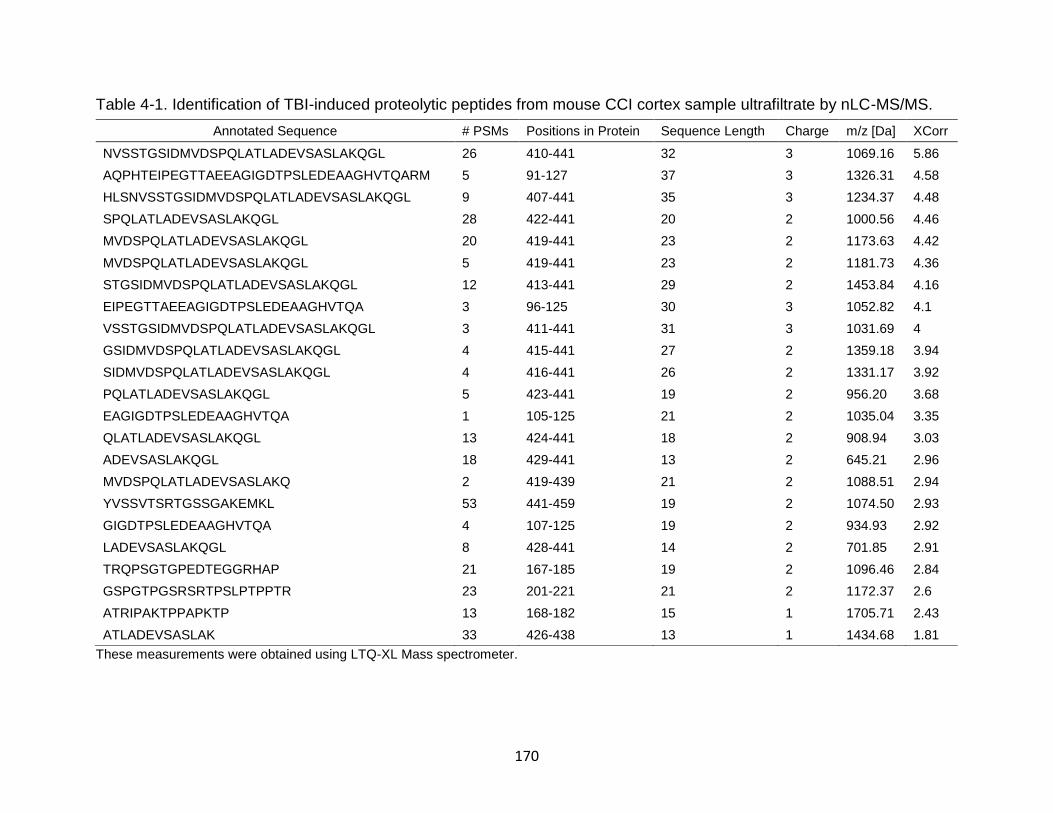
170
Table 4-1. Identification of TBI-induced proteolytic peptides from mouse CCI cortex sample ultrafiltrate by nLC-MS/MS.
These measurements were obtained using LTQ-XL Mass spectrometer.
Annotated Sequence # PSMs Positions in Protein Sequence Length Charge m/z [Da] XCorr
NVSSTGSIDMVDSPQLATLADEVSASLAKQGL 26 410-441 32 3 1069.16 5.86
AQPHTEIPEGTTAEEAGIGDTPSLEDEAAGHVTQARM 5 91-127 37 3 1326.31 4.58
HLSNVSSTGSIDMVDSPQLATLADEVSASLAKQGL 9 407-441 35 3 1234.37 4.48
SPQLATLADEVSASLAKQGL 28 422-441 20 2 1000.56 4.46
MVDSPQLATLADEVSASLAKQGL 20 419-441 23 2 1173.63 4.42
MVDSPQLATLADEVSASLAKQGL 5 419-441 23 2 1181.73 4.36
STGSIDMVDSPQLATLADEVSASLAKQGL 12 413-441 29 2 1453.84 4.16
EIPEGTTAEEAGIGDTPSLEDEAAGHVTQA 3 96-125 30 3 1052.82 4.1
VSSTGSIDMVDSPQLATLADEVSASLAKQGL 3 411-441 31 3 1031.69 4
GSIDMVDSPQLATLADEVSASLAKQGL 4 415-441 27 2 1359.18 3.94
SIDMVDSPQLATLADEVSASLAKQGL 4 416-441 26 2 1331.17 3.92
PQLATLADEVSASLAKQGL 5 423-441 19 2 956.20 3.68
EAGIGDTPSLEDEAAGHVTQA 1 105-125 21 2 1035.04 3.35
QLATLADEVSASLAKQGL 13 424-441 18 2 908.94 3.03
ADEVSASLAKQGL 18 429-441 13 2 645.21 2.96
MVDSPQLATLADEVSASLAKQ 2 419-439 21 2 1088.51 2.94
YVSSVTSRTGSSGAKEMKL 53 441-459 19 2 1074.50 2.93
GIGDTPSLEDEAAGHVTQA 4 107-125 19 2 934.93 2.92
LADEVSASLAKQGL 8 428-441 14 2 701.85 2.91
TRQPSGTGPEDTEGGRHAP 21 167-185 19 2 1096.46 2.84
GSPGTPGSRSRTPSLPTPPTR 23 201-221 21 2 1172.37 2.6
ATRIPAKTPPAPKTP 13 168-182 15 1 1705.71 2.43
ATLADEVSASLAK 33 426-438 13 1 1434.68 1.81
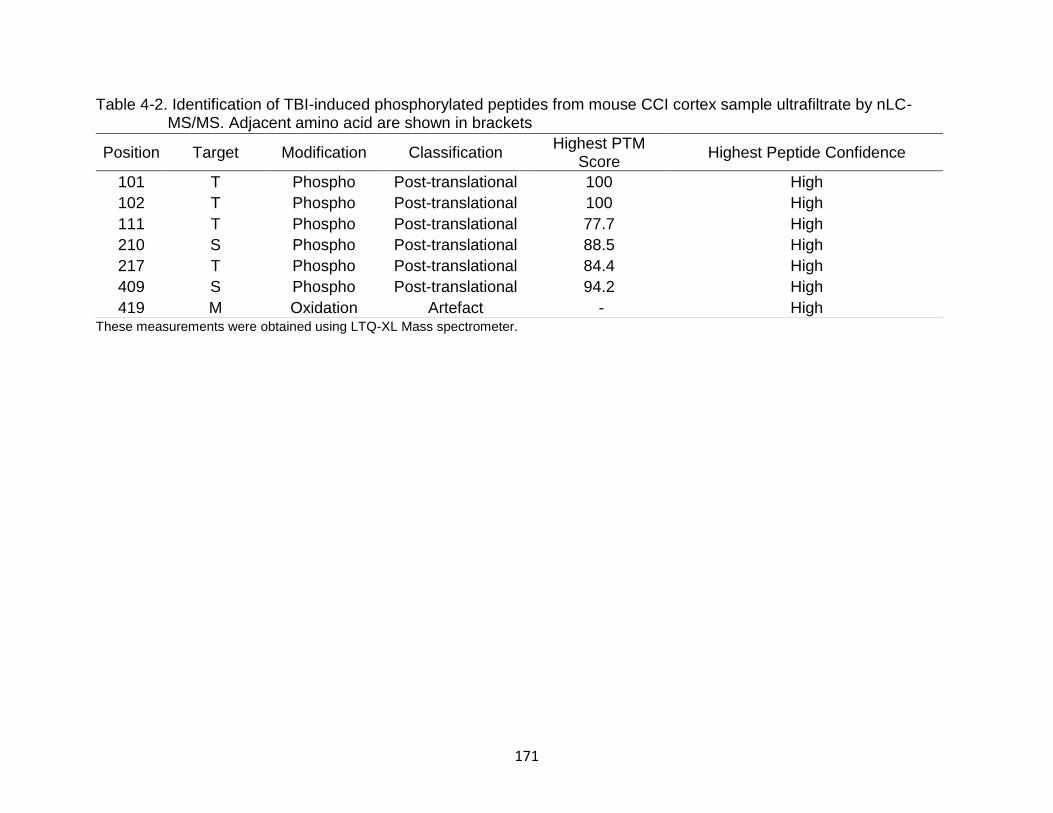
171
Table 4-2. Identification of TBI-induced phosphorylated peptides from mouse CCI cortex sample ultrafiltrate by nLC-MS/MS. Adjacent amino acid are shown in brackets
These measurements were obtained using LTQ-XL Mass spectrometer.
Position Target Modification Classification Highest PTM
Score Highest Peptide Confidence
101 T Phospho Post-translational 100 High
102 T Phospho Post-translational 100 High
111 T Phospho Post-translational 77.7 High
210 S Phospho Post-translational 88.5 High
217 T Phospho Post-translational 84.4 High
409 S Phospho Post-translational 94.2 High
419 M Oxidation Artefact - High
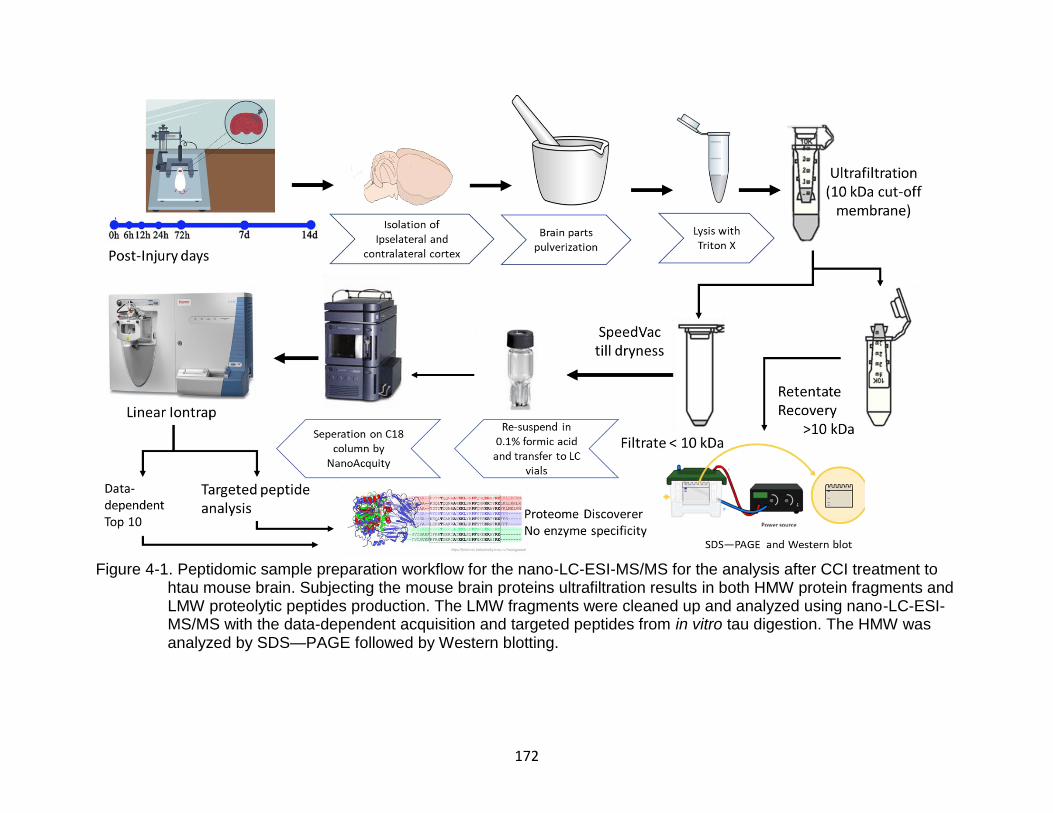
172
Figure 4-1. Peptidomic sample preparation workflow for the nano-LC-ESI-MS/MS for the analysis after CCI treatment to htau mouse brain. Subjecting the mouse brain proteins ultrafiltration results in both HMW protein fragments and LMW proteolytic peptides production. The LMW fragments were cleaned up and analyzed using nano-LC-ESI-MS/MS with the data-dependent acquisition and targeted peptides from in vitro tau digestion. The HMW was analyzed by SDS—PAGE followed by Western blotting.
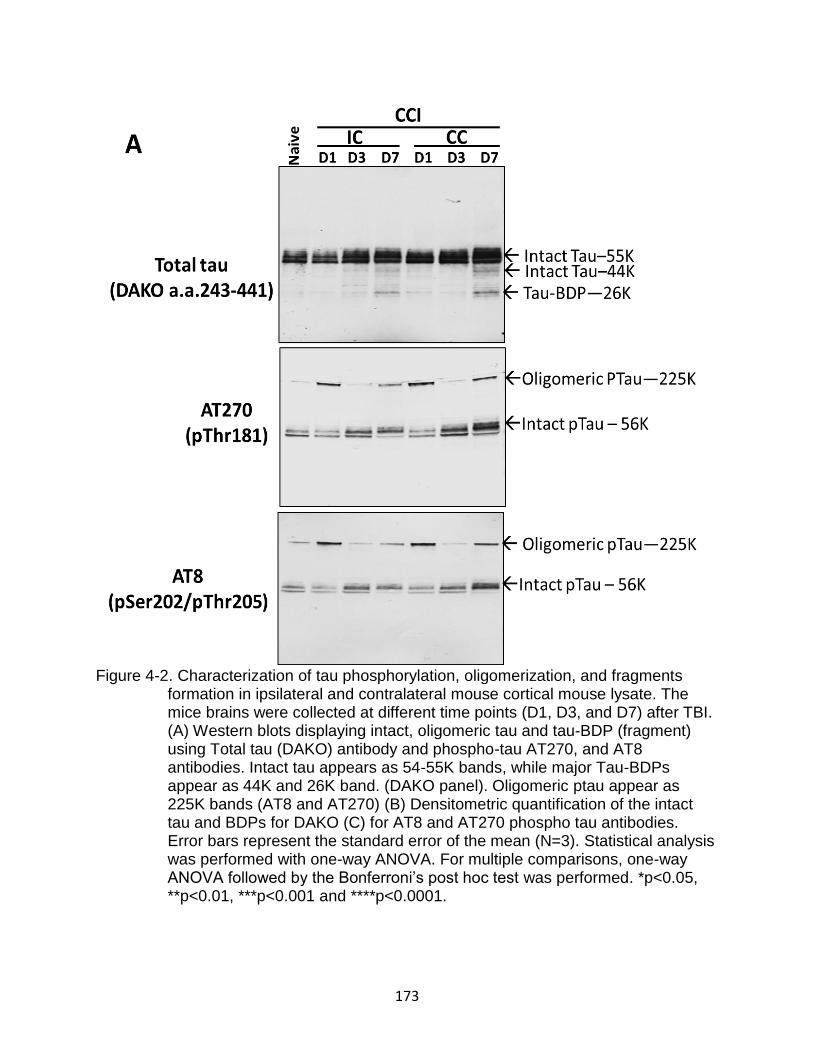
173
Figure 4-2. Characterization of tau phosphorylation, oligomerization, and fragments formation in ipsilateral and contralateral mouse cortical mouse lysate. The mice brains were collected at different time points (D1, D3, and D7) after TBI. (A) Western blots displaying intact, oligomeric tau and tau-BDP (fragment) using Total tau (DAKO) antibody and phospho-tau AT270, and AT8 antibodies. Intact tau appears as 54-55K bands, while major Tau-BDPs appear as 44K and 26K band. (DAKO panel). Oligomeric ptau appear as 225K bands (AT8 and AT270) (B) Densitometric quantification of the intact tau and BDPs for DAKO (C) for AT8 and AT270 phospho tau antibodies. Error bars represent the standard error of the mean (N=3). Statistical analysis was performed with one-way ANOVA. For multiple comparisons, one-way ANOVA followed by the Bonferroni’s post hoc test was performed. *p<0.05, **p<0.01, ***p<0.001 and ****p<0.0001.
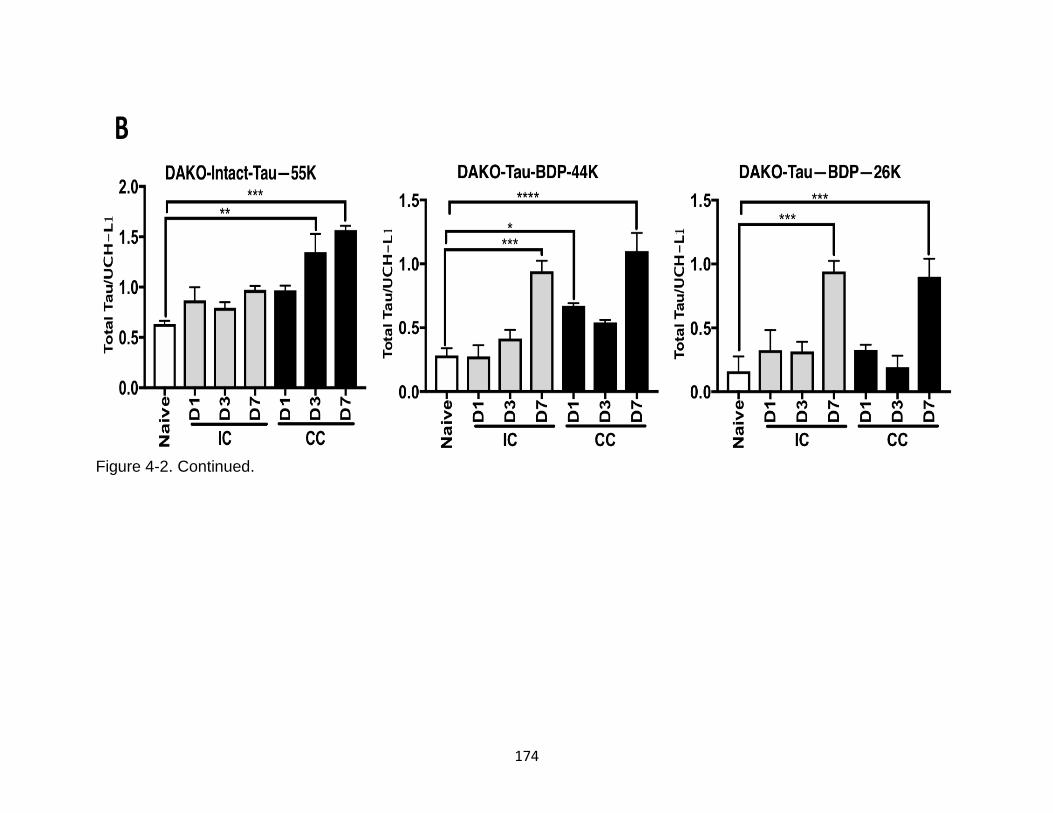
174
Figure 4-2. Continued.
B
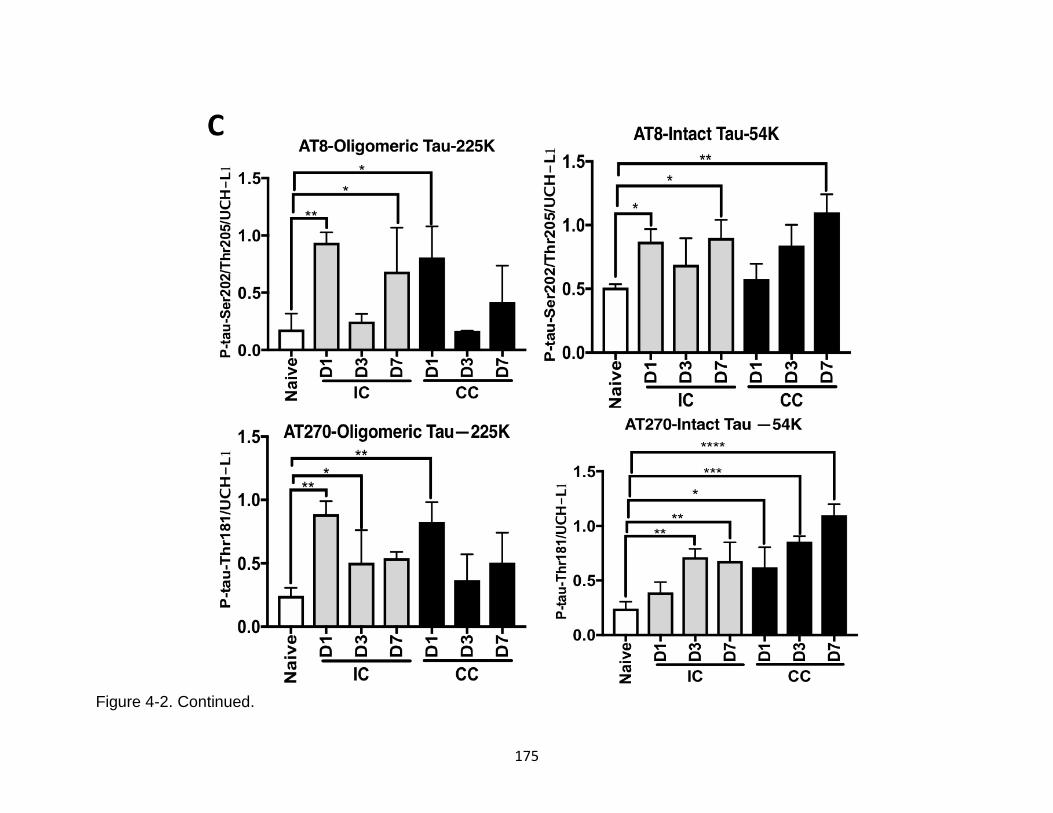
175
Figure 4-2. Continued.
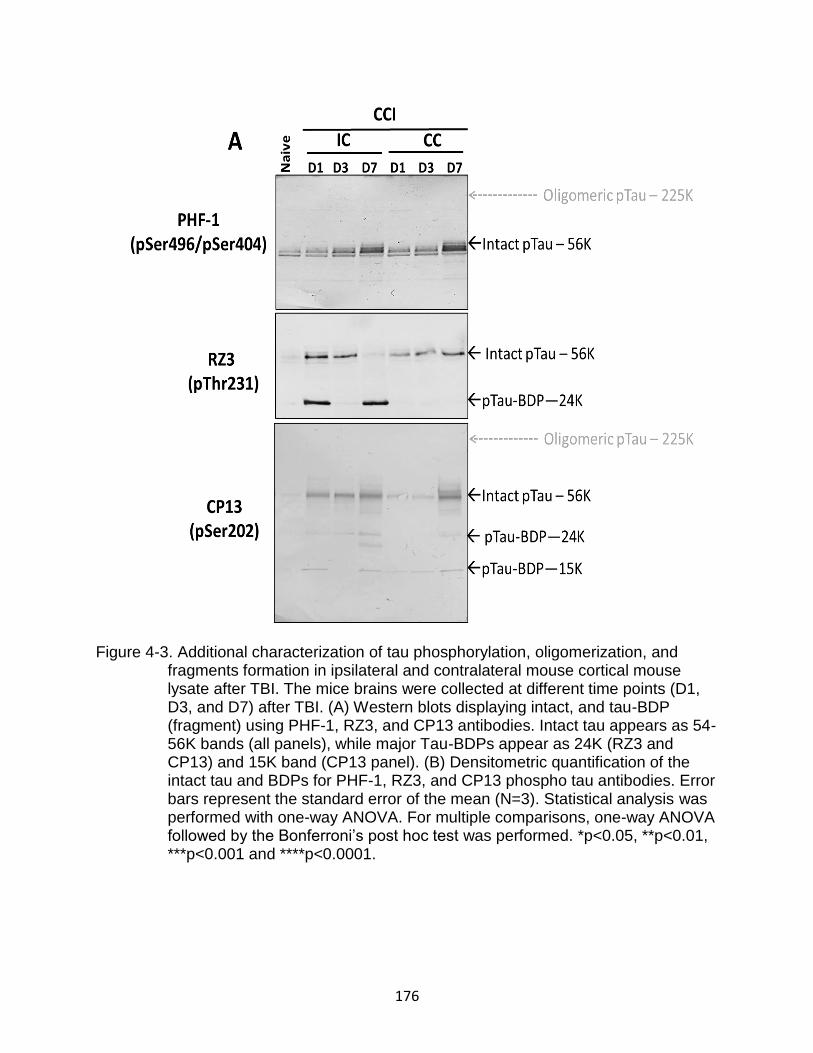
176
Figure 4-3. Additional characterization of tau phosphorylation, oligomerization, and
fragments formation in ipsilateral and contralateral mouse cortical mouse lysate after TBI. The mice brains were collected at different time points (D1, D3, and D7) after TBI. (A) Western blots displaying intact, and tau-BDP (fragment) using PHF-1, RZ3, and CP13 antibodies. Intact tau appears as 54-56K bands (all panels), while major Tau-BDPs appear as 24K (RZ3 and CP13) and 15K band (CP13 panel). (B) Densitometric quantification of the intact tau and BDPs for PHF-1, RZ3, and CP13 phospho tau antibodies. Error bars represent the standard error of the mean (N=3). Statistical analysis was performed with one-way ANOVA. For multiple comparisons, one-way ANOVA followed by the Bonferroni’s post hoc test was performed. *p<0.05, **p<0.01, ***p<0.001 and ****p<0.0001.
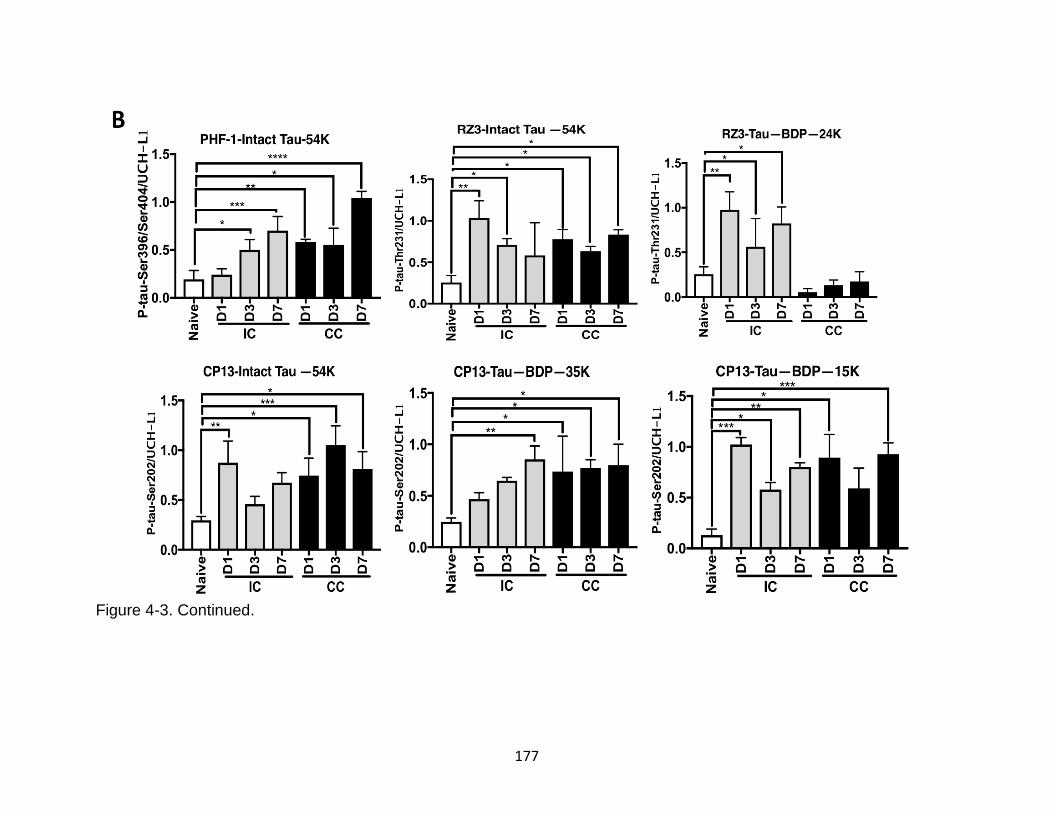
177
Figure 4-3. Continued.

178
Figure 4-4. Assessment of cell injury using α-spectrin antibody in ipsilateral and contralateral mouse cortical mouse lysate
after TBI. (A) Western blots displaying intact-spectrin (240K), and spectrin break down products (SBDP-150K/145K and 120K). (B) Densitometric quantification of the intact 150K/145K SBDPs. Error bars represent the standard error of the mean (N=3). Statistical analysis was performed with one-way ANOVA. For multiple comparisons, one-way ANOVA followed by the Bonferroni’s post hoc test was performed. *p<0.05, **p<0.01, ***p<0.001 and ****p<0.0001.
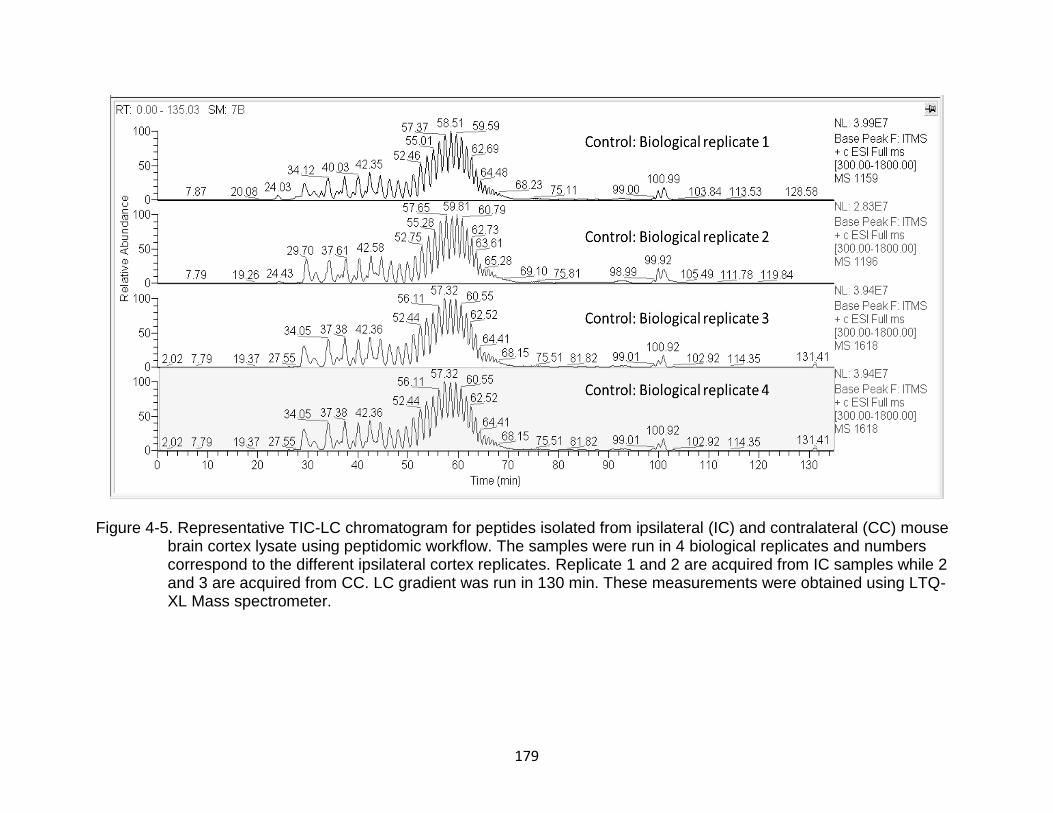
179
Figure 4-5. Representative TIC-LC chromatogram for peptides isolated from ipsilateral (IC) and contralateral (CC) mouse
brain cortex lysate using peptidomic workflow. The samples were run in 4 biological replicates and numbers correspond to the different ipsilateral cortex replicates. Replicate 1 and 2 are acquired from IC samples while 2 and 3 are acquired from CC. LC gradient was run in 130 min. These measurements were obtained using LTQ-XL Mass spectrometer.
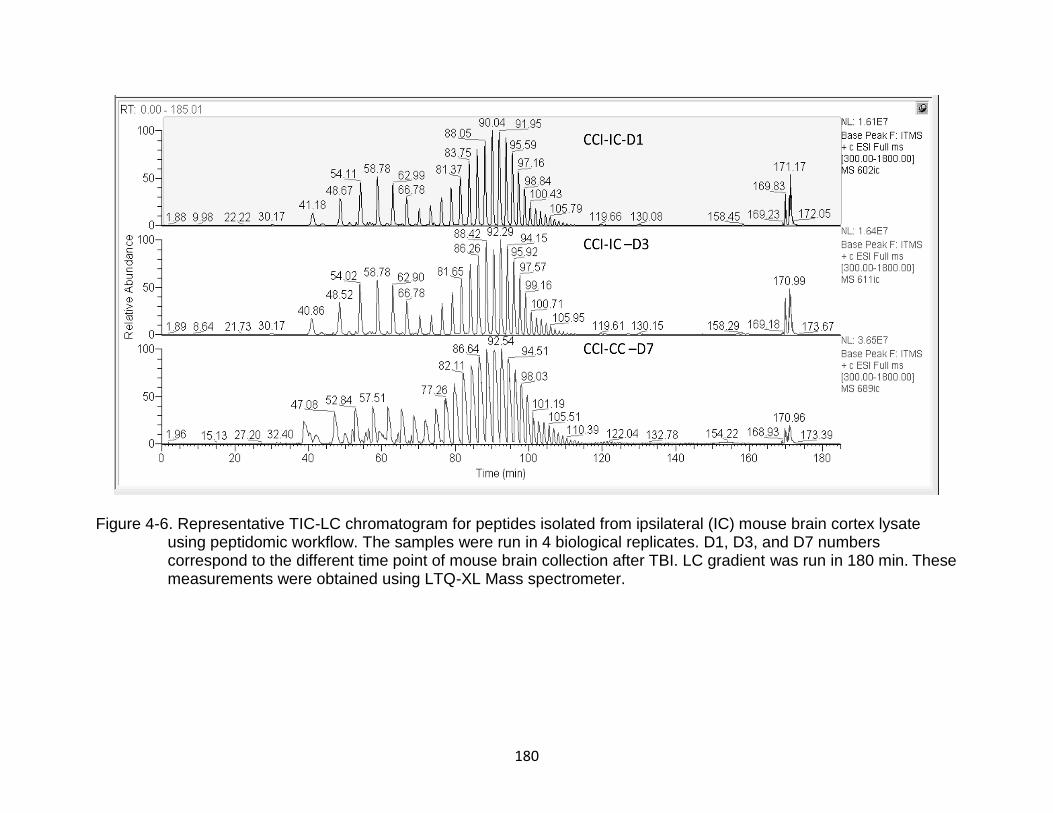
180
Figure 4-6. Representative TIC-LC chromatogram for peptides isolated from ipsilateral (IC) mouse brain cortex lysate
using peptidomic workflow. The samples were run in 4 biological replicates. D1, D3, and D7 numbers correspond to the different time point of mouse brain collection after TBI. LC gradient was run in 180 min. These measurements were obtained using LTQ-XL Mass spectrometer.
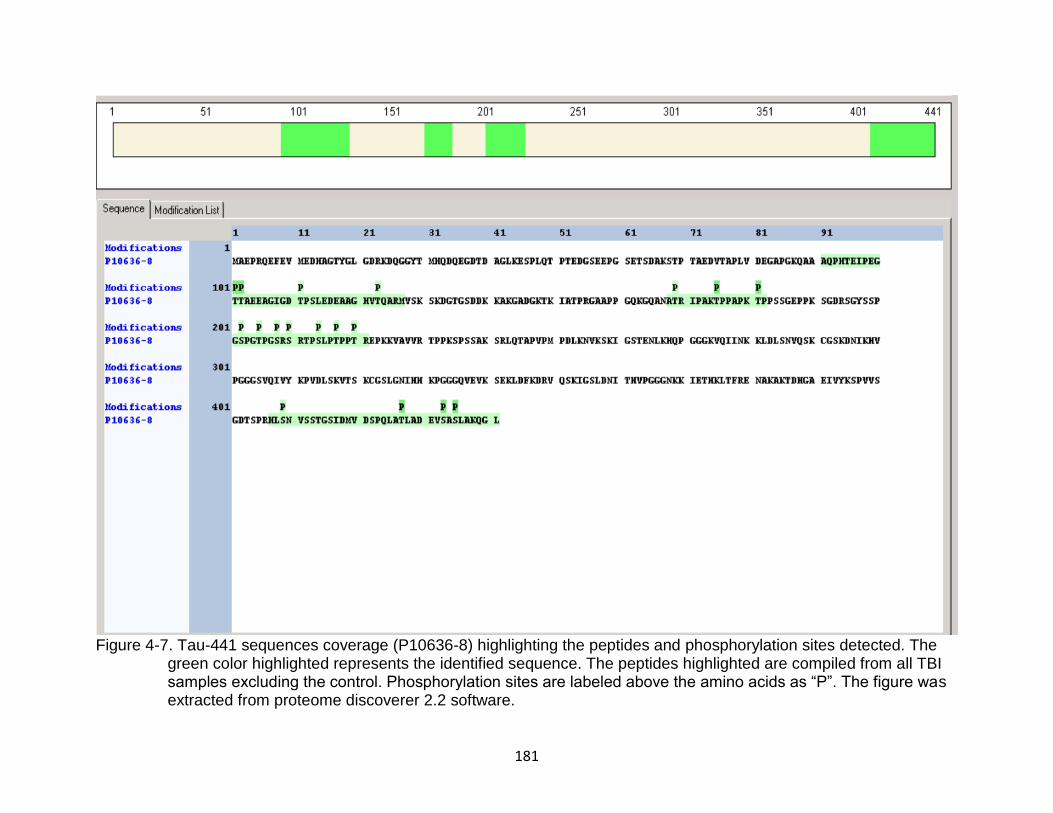
181
Figure 4-7. Tau-441 sequences coverage (P10636-8) highlighting the peptides and phosphorylation sites detected. The green color highlighted represents the identified sequence. The peptides highlighted are compiled from all TBI samples excluding the control. Phosphorylation sites are labeled above the amino acids as “P”. The figure was extracted from proteome discoverer 2.2 software.
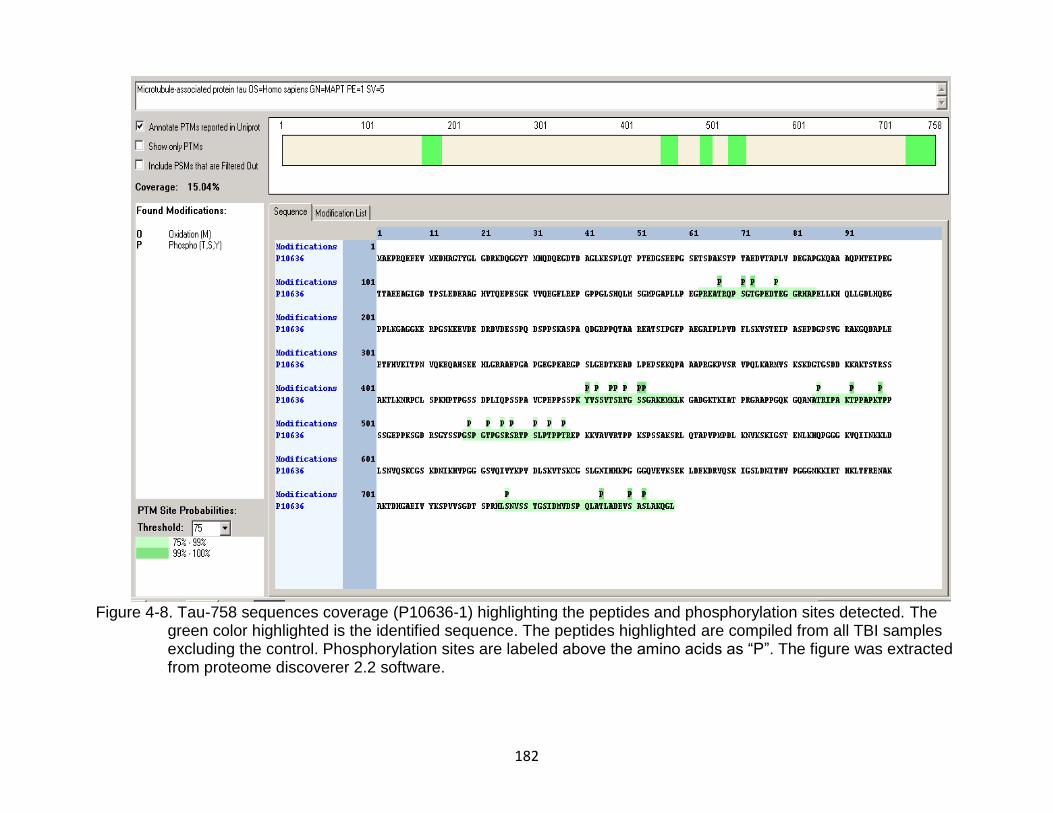
182
Figure 4-8. Tau-758 sequences coverage (P10636-1) highlighting the peptides and phosphorylation sites detected. The green color highlighted is the identified sequence. The peptides highlighted are compiled from all TBI samples excluding the control. Phosphorylation sites are labeled above the amino acids as “P”. The figure was extracted from proteome discoverer 2.2 software.
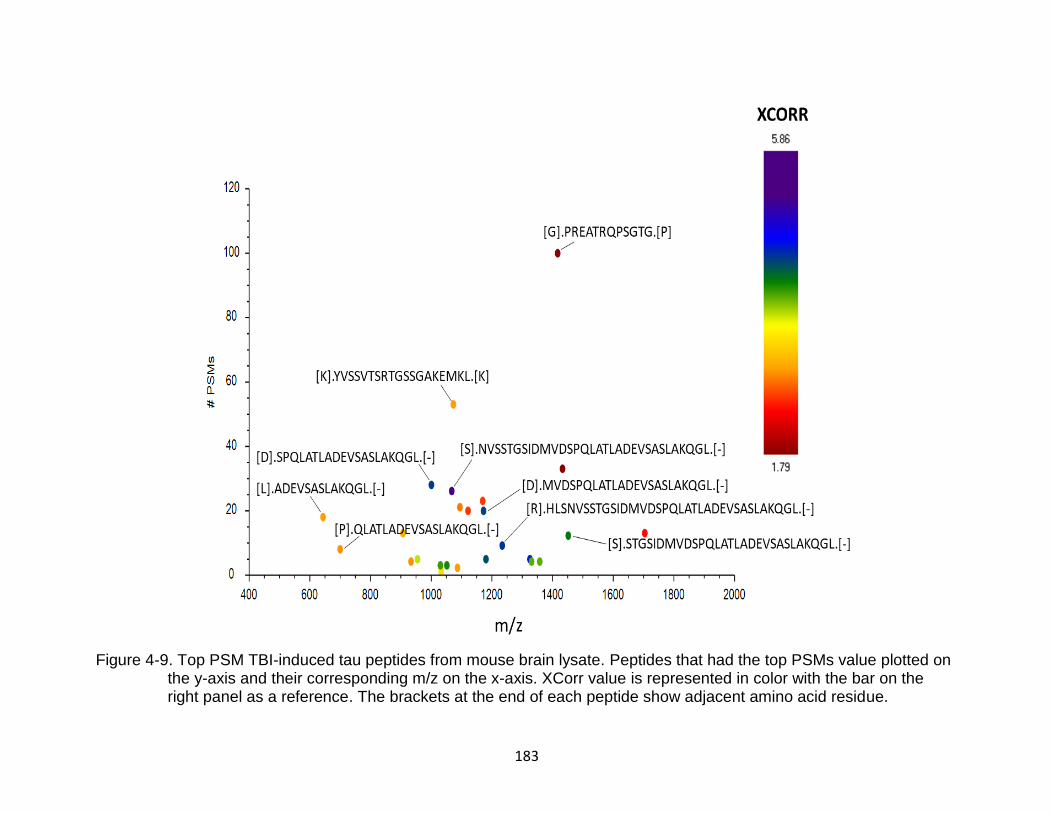
183
Figure 4-9. Top PSM TBI-induced tau peptides from mouse brain lysate. Peptides that had the top PSMs value plotted on the y-axis and their corresponding m/z on the x-axis. XCorr value is represented in color with the bar on the right panel as a reference. The brackets at the end of each peptide show adjacent amino acid residue.
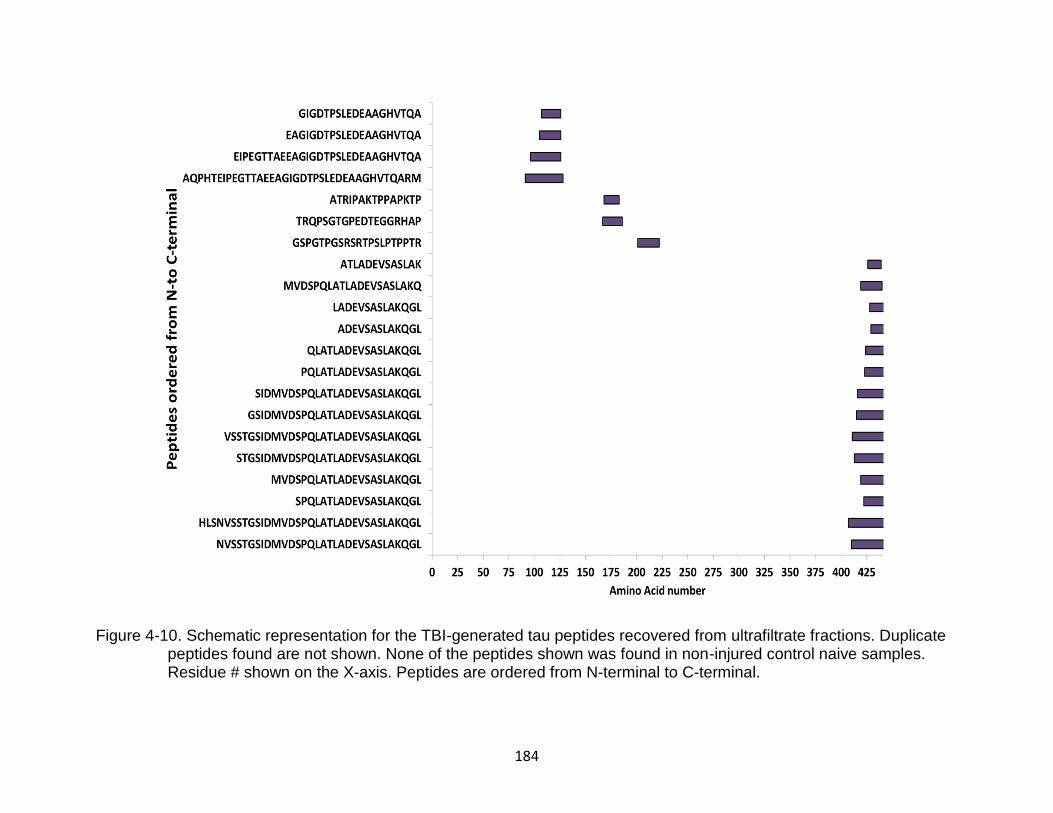
184
Figure 4-10. Schematic representation for the TBI-generated tau peptides recovered from ultrafiltrate fractions. Duplicate
peptides found are not shown. None of the peptides shown was found in non-injured control naive samples. Residue # shown on the X-axis. Peptides are ordered from N-terminal to C-terminal.
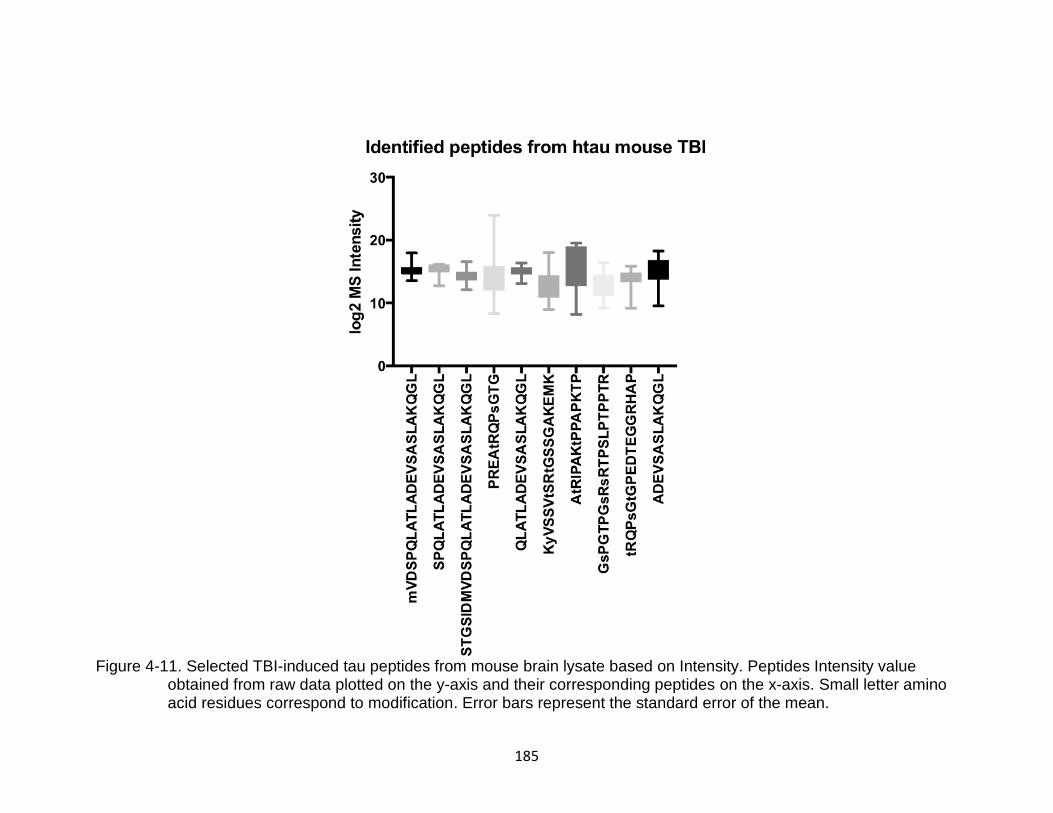
185
Figure 4-11. Selected TBI-induced tau peptides from mouse brain lysate based on Intensity. Peptides Intensity value
obtained from raw data plotted on the y-axis and their corresponding peptides on the x-axis. Small letter amino acid residues correspond to modification. Error bars represent the standard error of the mean.
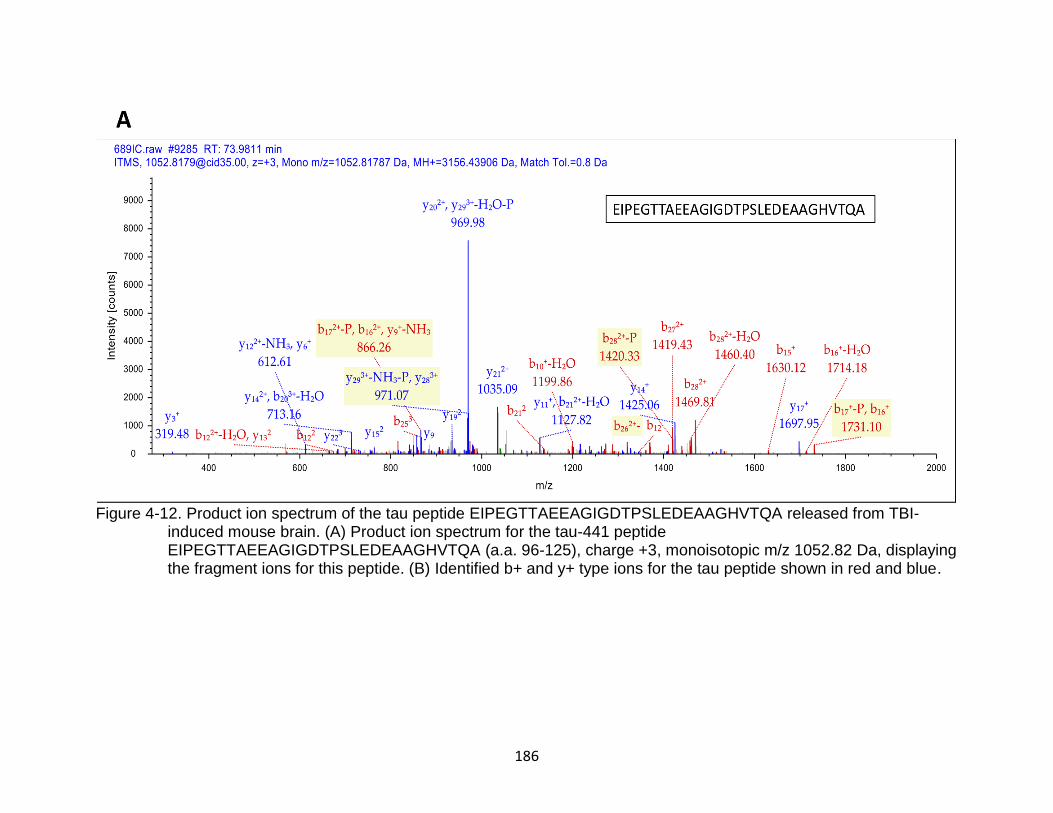
186
Figure 4-12. Product ion spectrum of the tau peptide EIPEGTTAEEAGIGDTPSLEDEAAGHVTQA released from TBI-induced mouse brain. (A) Product ion spectrum for the tau-441 peptide EIPEGTTAEEAGIGDTPSLEDEAAGHVTQA (a.a. 96-125), charge +3, monoisotopic m/z 1052.82 Da, displaying the fragment ions for this peptide. (B) Identified b+ and y+ type ions for the tau peptide shown in red and blue.
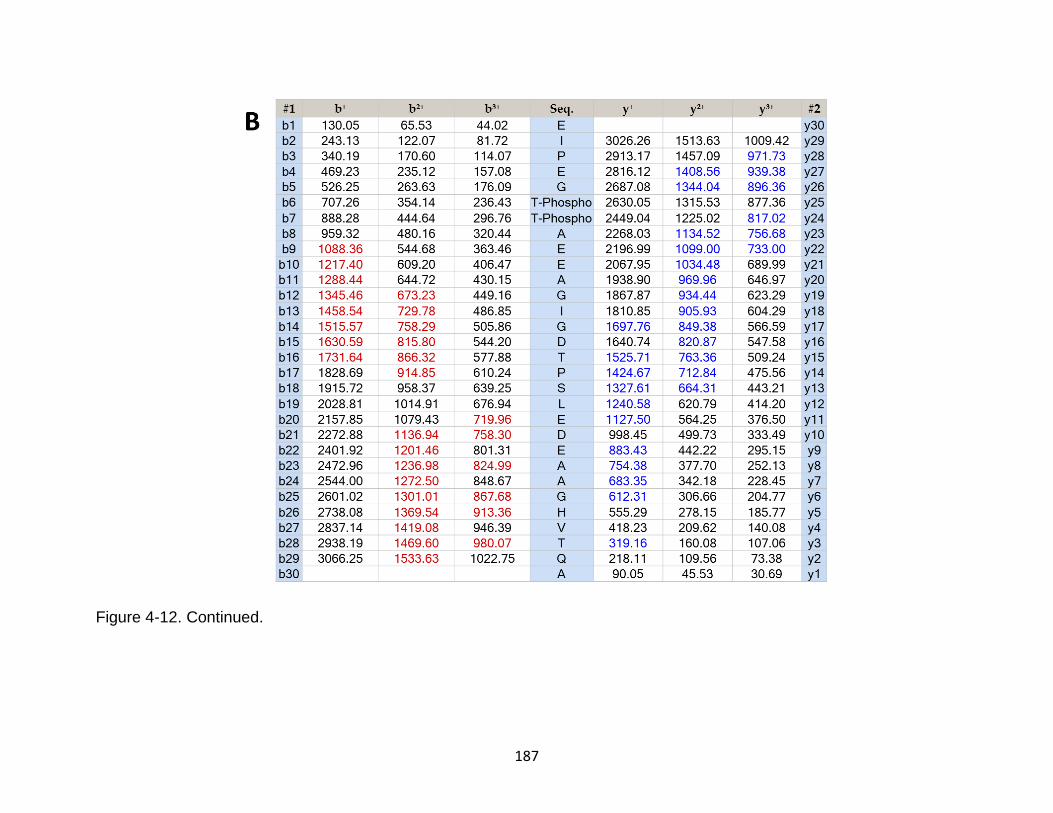
187
Figure 4-12. Continued.
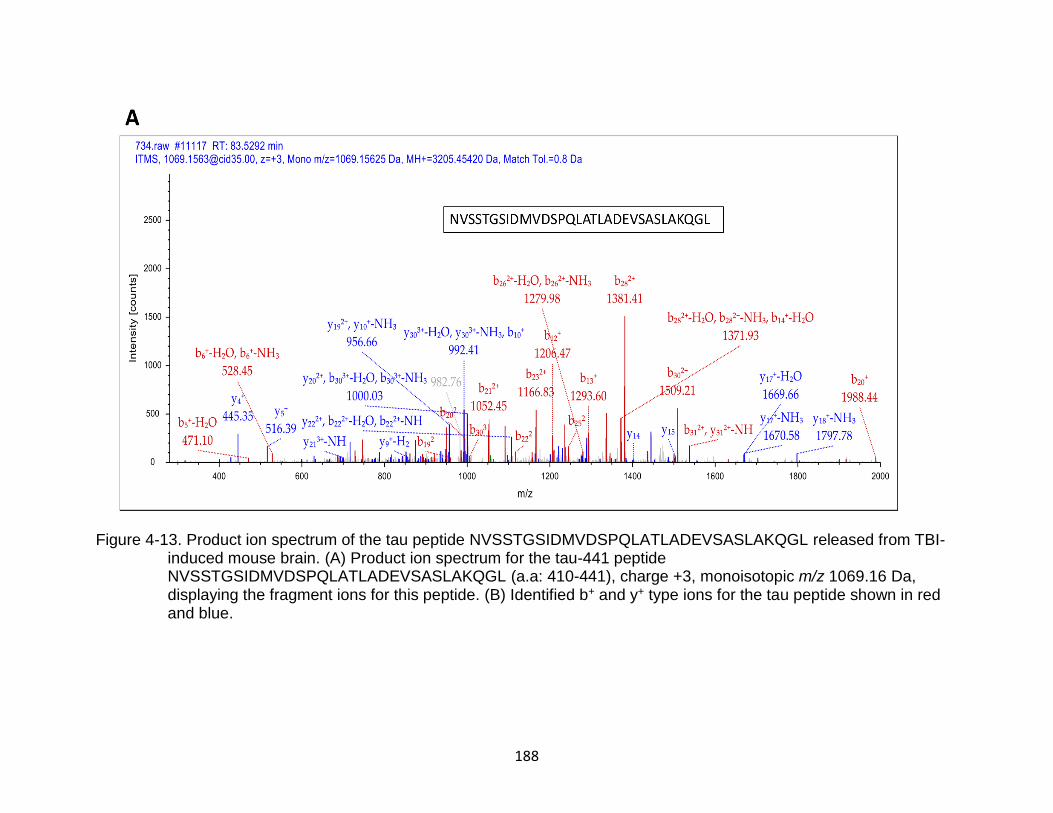
188
Figure 4-13. Product ion spectrum of the tau peptide NVSSTGSIDMVDSPQLATLADEVSASLAKQGL released from TBI-
induced mouse brain. (A) Product ion spectrum for the tau-441 peptide NVSSTGSIDMVDSPQLATLADEVSASLAKQGL (a.a: 410-441), charge +3, monoisotopic m/z 1069.16 Da, displaying the fragment ions for this peptide. (B) Identified b+ and y+ type ions for the tau peptide shown in red and blue.
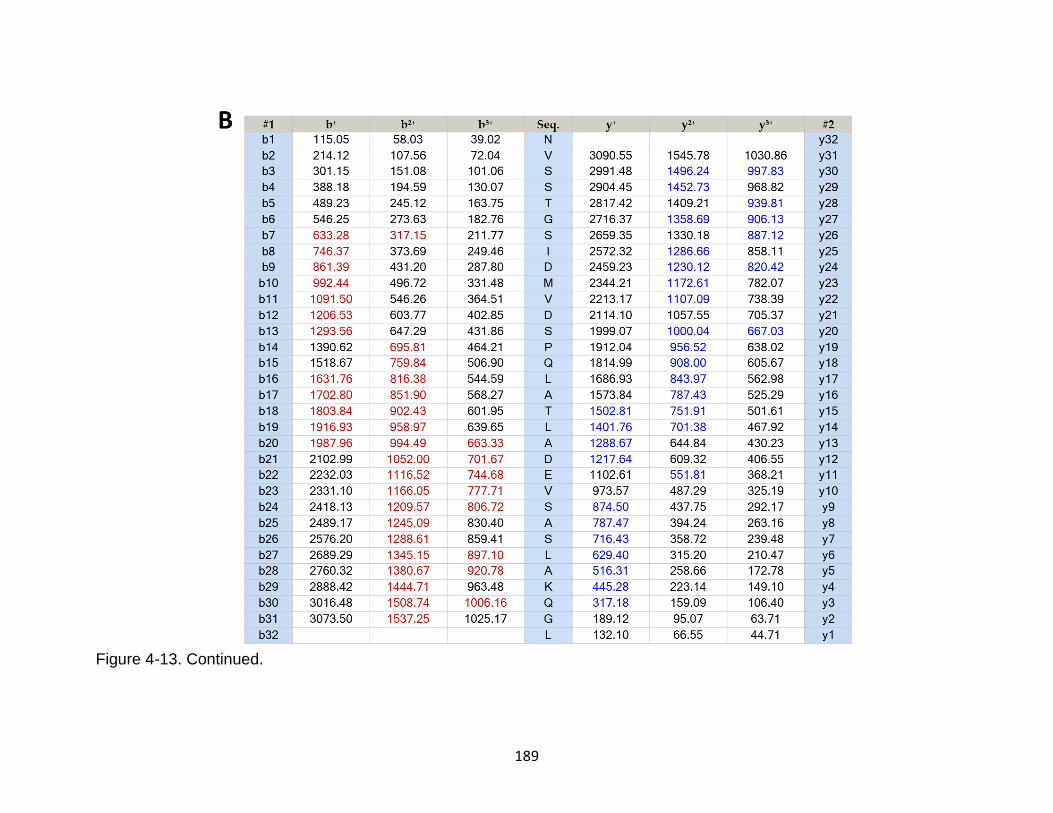
189
Figure 4-13. Continued.
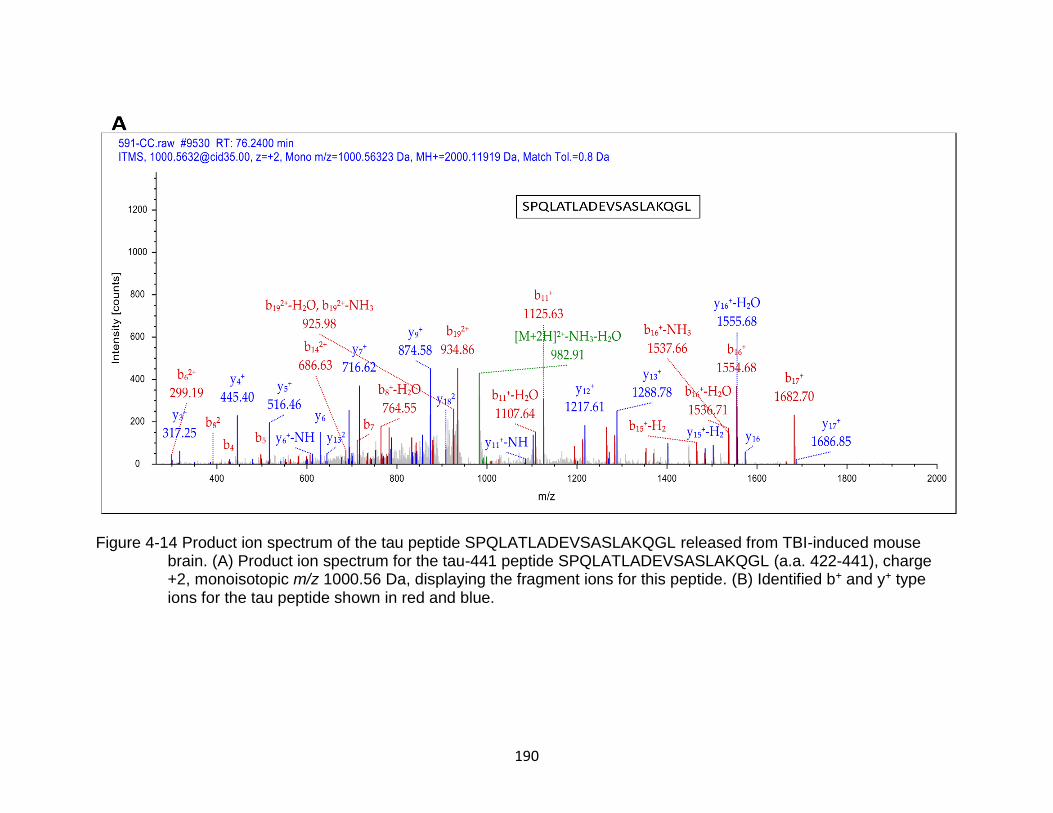
190
Figure 4-14 Product ion spectrum of the tau peptide SPQLATLADEVSASLAKQGL released from TBI-induced mouse brain. (A) Product ion spectrum for the tau-441 peptide SPQLATLADEVSASLAKQGL (a.a. 422-441), charge +2, monoisotopic m/z 1000.56 Da, displaying the fragment ions for this peptide. (B) Identified b+ and y+ type ions for the tau peptide shown in red and blue.
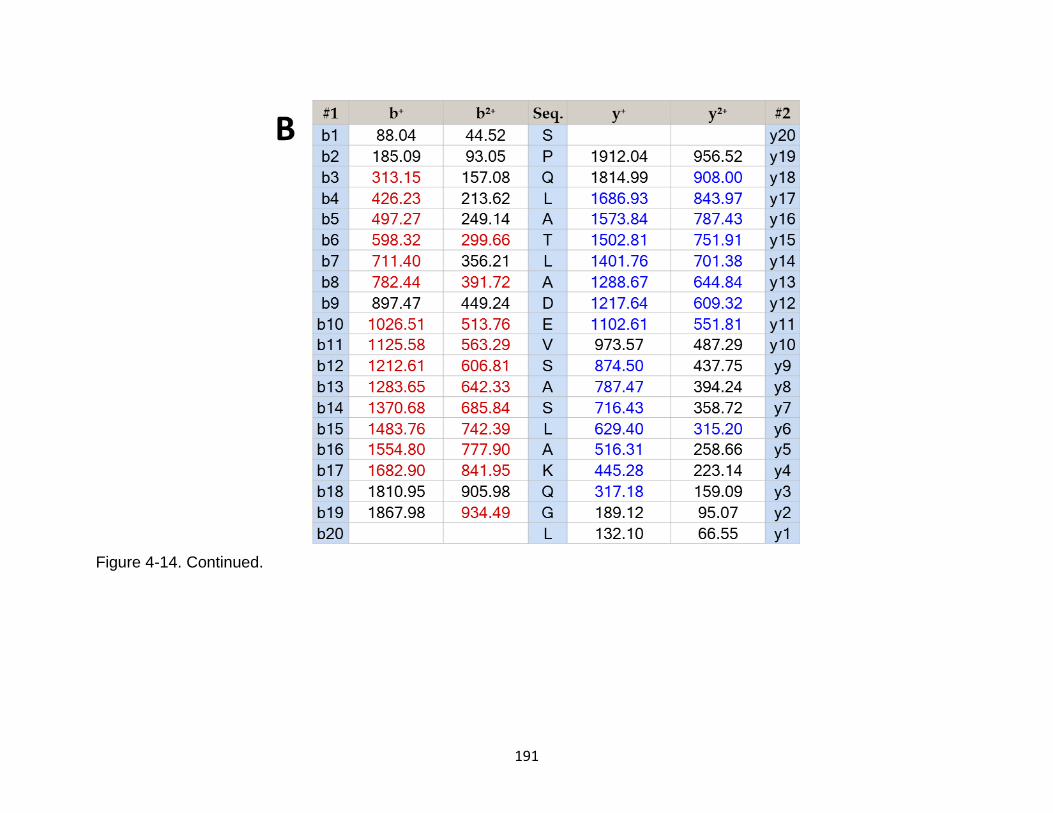
191
Figure 4-14. Continued.
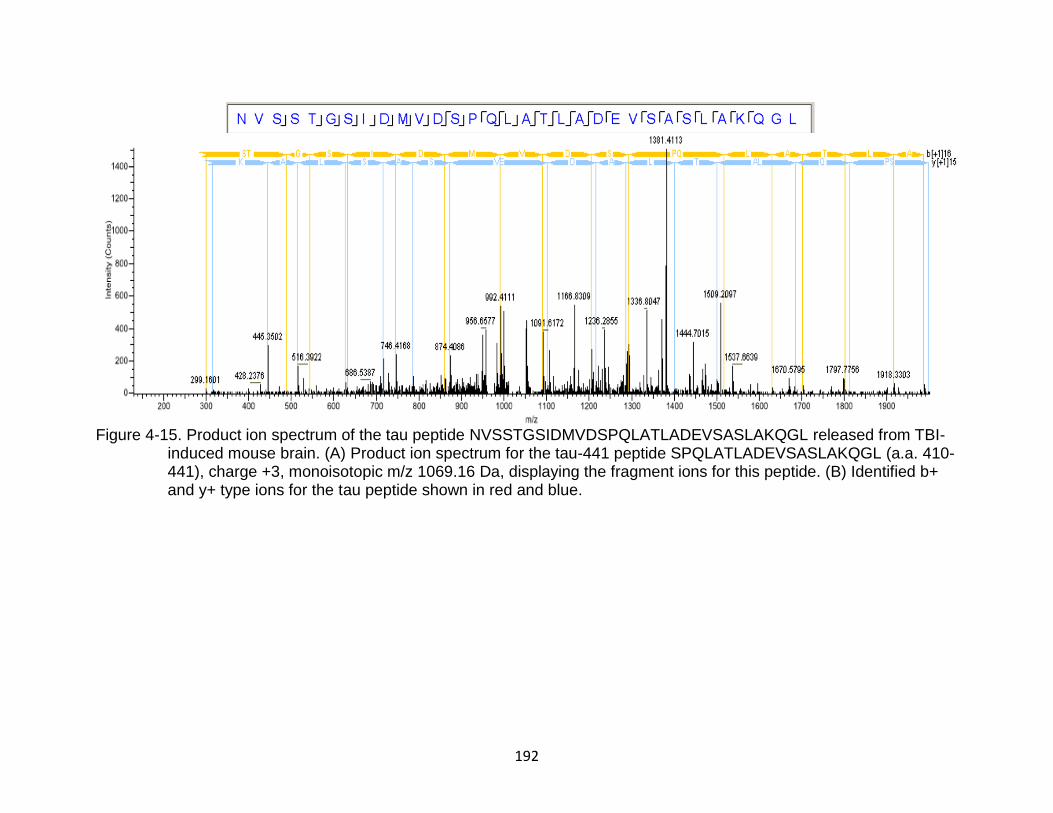
192
Figure 4-15. Product ion spectrum of the tau peptide NVSSTGSIDMVDSPQLATLADEVSASLAKQGL released from TBI-induced mouse brain. (A) Product ion spectrum for the tau-441 peptide SPQLATLADEVSASLAKQGL (a.a. 410-441), charge +3, monoisotopic m/z 1069.16 Da, displaying the fragment ions for this peptide. (B) Identified b+ and y+ type ions for the tau peptide shown in red and blue.
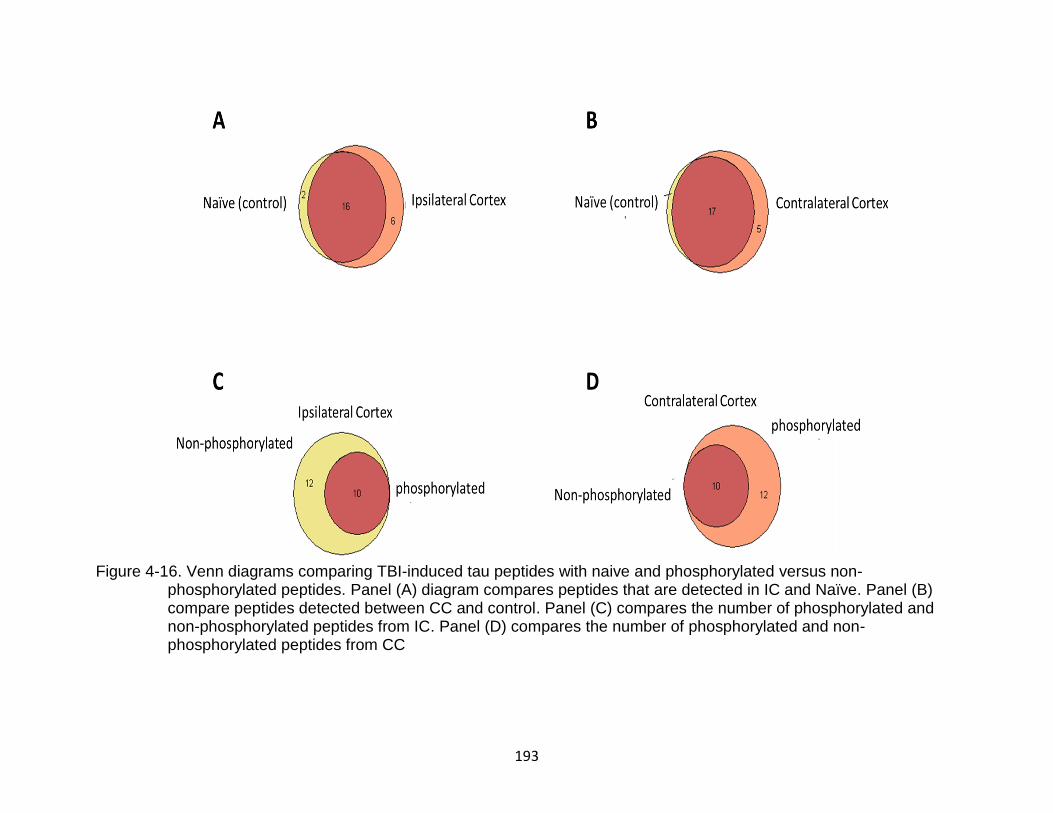
193
Figure 4-16. Venn diagrams comparing TBI-induced tau peptides with naive and phosphorylated versus non-phosphorylated peptides. Panel (A) diagram compares peptides that are detected in IC and Naïve. Panel (B) compare peptides detected between CC and control. Panel (C) compares the number of phosphorylated and non-phosphorylated peptides from IC. Panel (D) compares the number of phosphorylated and non-phosphorylated peptides from CC
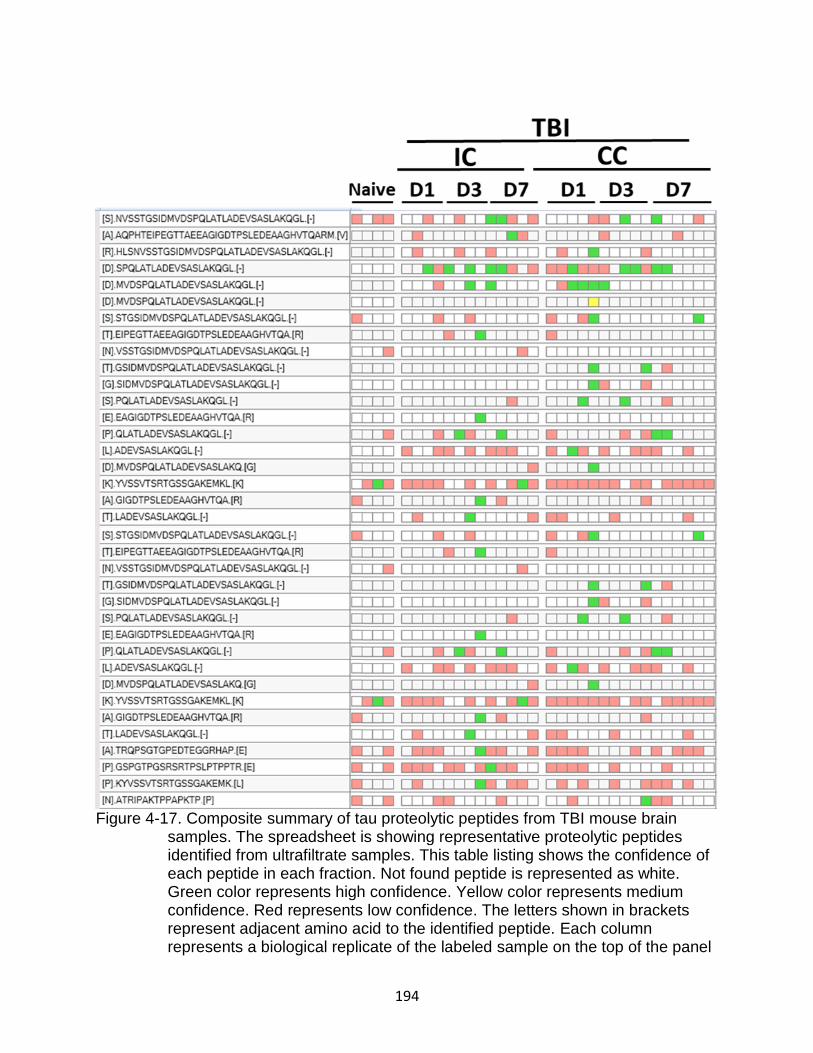
194
Figure 4-17. Composite summary of tau proteolytic peptides from TBI mouse brain samples. The spreadsheet is showing representative proteolytic peptides identified from ultrafiltrate samples. This table listing shows the confidence of each peptide in each fraction. Not found peptide is represented as white. Green color represents high confidence. Yellow color represents medium confidence. Red represents low confidence. The letters shown in brackets represent adjacent amino acid to the identified peptide. Each column represents a biological replicate of the labeled sample on the top of the panel
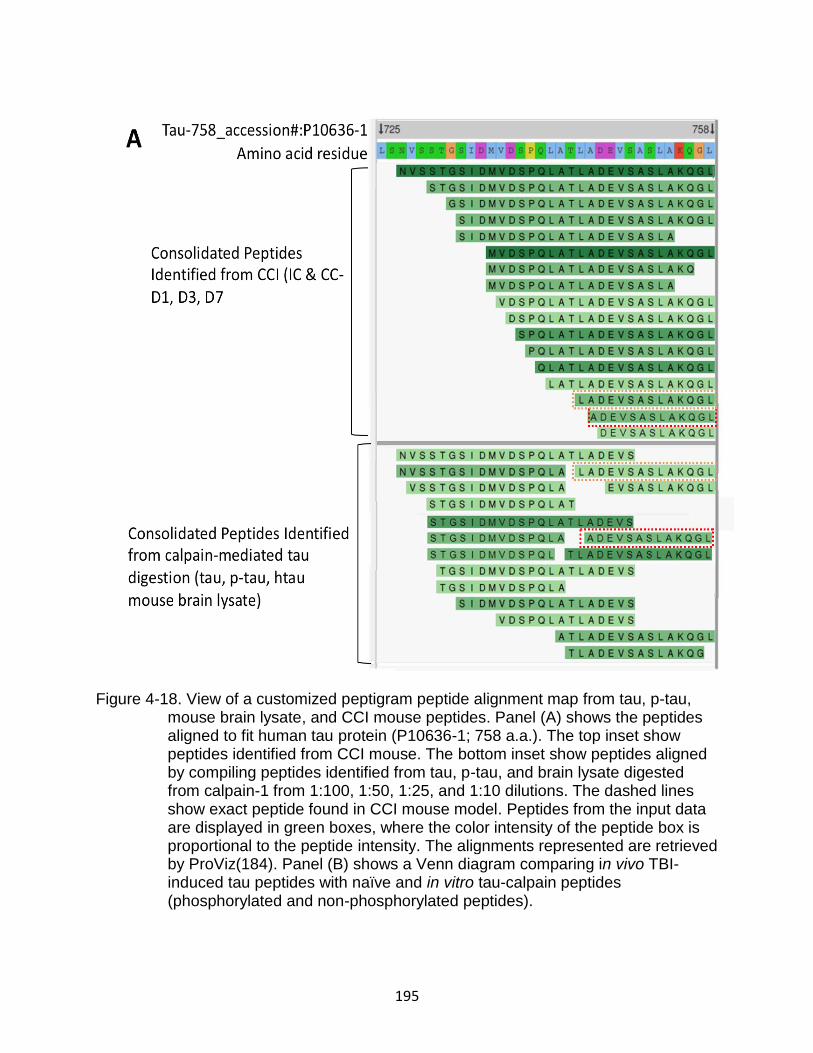
195
Figure 4-18. View of a customized peptigram peptide alignment map from tau, p-tau, mouse brain lysate, and CCI mouse peptides. Panel (A) shows the peptides aligned to fit human tau protein (P10636-1; 758 a.a.). The top inset show peptides identified from CCI mouse. The bottom inset show peptides aligned by compiling peptides identified from tau, p-tau, and brain lysate digested from calpain-1 from 1:100, 1:50, 1:25, and 1:10 dilutions. The dashed lines show exact peptide found in CCI mouse model. Peptides from the input data are displayed in green boxes, where the color intensity of the peptide box is proportional to the peptide intensity. The alignments represented are retrieved by ProViz(184). Panel (B) shows a Venn diagram comparing in vivo TBI-induced tau peptides with naïve and in vitro tau-calpain peptides (phosphorylated and non-phosphorylated peptides).
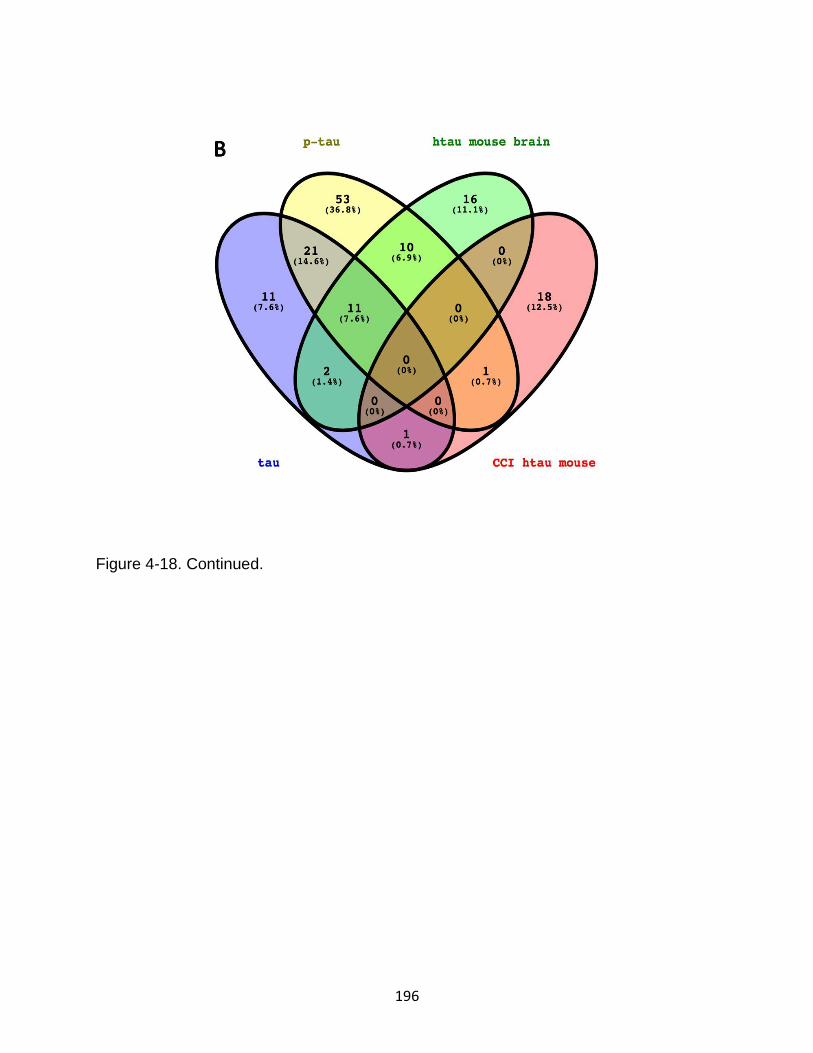
196
Figure 4-18. Continued.
197
CHAPTER 5 CHARACTERIZATION OF TAU POST-TRANSLATIONAL MODIFICATION LEVELS AND TEMPORAL PROFILE IN HUMAN CEREBROSPINAL FLUID FROM SEVERE
TBI AND CONTROL SUBJECTS.
Introduction
Research evidence has shown that the pathological processes involved in TBI
are associated with a temporal profile that is linked with dynamic pathobiology during
the severe and sub-acute post-injury phase. Therefore, it is critical to address the
temporal distinctions for finding, classifying, or both, the chronic effects of TBI as an
independent disease.(188)
Bio-fluid biomarkers play a pivotal role in identifying and characterizing both TBI
severity and temporal profile. For most neurodegenerative and psychiatric diseases
including TBI and CTE, there are few or no biomarkers that can aid in the early
diagnosis or monitoring of disease progression.(4, 219)
The biomarkers in the blood that are currently used reflect the levels of neuronal
and glial damage and injury(220). These biomarkers are beneficial in characterizing the
severity of TBI, particularly in the acute post-trauma stage, for reflecting the severity of
the damage and predicting clinical consequences. However, several blood biomarkers
do not reflect pathological conditions, such as metabolic, vascular, and inflammatory
responses that are responsible for restoring and maintaining neuronal and glial damage
following TBI(220). Given the unsuccessful performance of blood biomarker in the
diagnosis of acute mild TBI (mTBI) as well as the lack of CNS specificity, researchers
began to look for alternative bio-fluid that is easily accessed, like the blood that would
be ideal for clinicians and researchers(221).
198
Cerebrospinal fluid (CSF) is a clear body fluid produced by the specialized
ependymal cells in the choroid plexuses of the ventricles in the brain and absorbed in
the arachnoid granulation(222). About five hundred milliliters of CSF is produced every
day which acts as protective fluid or buffer for the brain, from physical damage,
immunological protection, or both, to the brain inside the skull(223). Due to the direct
contact with the extracellular space of the brain, CSF is a better reflection of the
biochemical and pathological changes that occur inside of the brain(224). The usage of
CSF for pre-clinical and clinical diagnosis of AD is well documented(78, 224-226). In
AD, there are three well-known cerebrospinal fluid biomarkers, which are used to aid
diagnosis of disease: amyloid-β (Aβ) 1—42, total tau protein, and phosphorylated
tau(226, 227). Moreover, CSF biomarkers have been studied taking into accounts the
temporal changes of mTBI and the chronic post-TBI state.
Several proteomics studies have been done in CSF using proteolytic digestion
followed by isobaric labeling for biomarker identification in AD, Parkinson, and multiple
sclerosis(228-230). Little attention has been paid for identifying natural peptidome in the
CSF following TBI. Low molecular weight peptides (LMW) in CSF represent a multitude
of the pathological process in the brain such as aggregation, oxidative stress, apoptosis
secretion, and inflammation. Natural tau peptidome in the CSF has rarely been studied
for potential biomarker, although tau is subjected to hyperphosphorylation and
proteolysis following TBI.
Studying more than one biomarker feature (e.g., tau hyperphosphorylation,
proteolysis, aggregation) is an essential strategy for detection and monitoring disease
development and progression(79). Therefore, in this study, we propose that monitoring
199
LMW and HMW tau, as well as tau hyperphosphorylation/aggregation, could provide
insights into various potential biomarkers for TBI with an emphasis on CSF biomarker
for TBI diagnosis. These tau biomarkers are very promising for the early diagnosis of
TBI.
Materials and Methods
Human TBI and Control Cerebrospinal Fluid Procurement
The healthy control samples CSF (n=15) were purchased (Bioreclamation Co.,
USA). Archived de-identified CSF samples (n=12) from a severe TBI study were
collected from consenting adult subjects presenting to the emergency department of the
Ben Taub General Hospital, Baylor College of Medicine, (Houston, TX, USA)(231). The
study protocol was approved by the Baylor College of Medicine IRB, for subjects
sustaining blunt trauma to the head with a Glasgow coma scale of 12 or less at 12 to 48
hours. CSF samples were collected from the buretrol for up to 10 days or until an
intraventriculostomy was no longer clinically indicated. Timed CSF samples (10 ml) with
a total collection time not exceeding 1 hour were diverted to 15 mL conical
polypropylene centrifuge tubes (BD Falcon, USA) by a qualified and trained hospital
employee according to the hospital’s standard procedures. These CSF samples (5 to 10
ml) were then centrifuged at 4,000 x g with a tabletop centrifuge at room temperature for
5 to 7 minutes to remove loose cells and debris. A volume of 1 ml aliquots of cleared
CSF (supernatant) was pipetted into a 2 ml cryogenic tube, snap-frozen and stored at -
80˚C until further use. For this study, timed CSF samples collected within 48 hours of
injury, were used for the analysis. This procedure has been approved by the Ethics
committee at the University of Florida.
200
Total-Tau-ELISA Kit
CSF total tau (T-tau) concentration was measured using a sandwich enzyme-
linked immunosorbent assay (ELISA) (Innotest hTAU-Ag, Innogenetics, Gent Belgium)
specifically constructed to measure all tau isoforms independently of phosphorylation
status.
SDS-PAGE and Immunoblotting
Samples (unfiltered) were subjected to SDS-PAGE. Ten microliters of the CSF
sample were mixed with μL SDS-containing sample buffer (10% β-ME). Tris-glycine pre-
cast gel (4-20%, 1 mm X 18 well; BioRad) were run on 200V, for about one hour. For
immunoblotting, the protocol was followed as described in chapter 4. The primary
antibodies used include total tau polyclonal (DAKO), phospho-tau primary antibodies
CP13, and PHF-1
Isolation of CSF LMW peptides
Five hundred microliters of CSF were thawed at room temperature, vortexed
gently, and transferred to 1.5 ml Lobind Eppendorf tubes. The rest of the protocol was
followed as described in chapter 4.
nLC-ESI-MS/MS
The high resolution mass spectrometric analysis was followed as described in
chapter 3.
201
Results and Discussion
A total of 12 patients with TBI and 15 controls were used for the analyses. All
samples were collected from a severe TBI cohort and age-matched normal control. The
concentration of tau in CSF after TBI and for controls are shown in Figure 5-1. Total tau
concentration (ng/ml) in TBI patients were significantly higher than controls (p < 0.0249).
CSF total tau increased concentration did not correlate with the various time to sample
withdrawal points studied (6 hours to 48 hours). The increase in total tau concentration
after severe TBI in ventricular CSF is reported in other studies(224, 226). Tau protein
levels are physiologically higher in CSF withdrawn from ventricles than in samples
obtained by lumbar puncture(232).
To further characterize the temporal profile and post-translational modification of
tau, we analyzed the CSF samples using immunoblotting with antibodies that detect
total tau (a.a. 243-441; DAKO), and phosphorylated tau (pSer202, pSer396, and pSer404).
Human CSF samples were subjected to ultrafiltration (10K MWCO). The retentate
fractions were subjected to SDS-PAGE followed by western blotting. Our
immunoblotting data show that median levels of total tau (DAKO) are significantly
elevated (p < 0.0143) in TBI CSF patients (n=12) compared healthy controls within 48
hours (Figure 5-2A, B). Moreover, with DAKO antibody, we were able to observe two
distinct bands, one residing at 55K (intact tau) and the other at 225K (presumably
accounting for oligomeric tau), respectively. Both forms (55K and 225K) of tau were
significantly elevated in TBI subjects (p < 0.0143 and p < 0.0001, respectively) (Figure
5-2B).
Probing CSF samples with CP13 showed considerable increase in intact p-tau
55K and high molecular weight p-tau at 102K (n=12; p < 0.0009) (Figure 5-2A, B).

202
Likewise, PHF-1 antibody detected significant increase in p-tau levels with TBI patients
compared to controls at 102K (n=10; p <0.0019) (Figure 5-2A, B). These results are
consistent with other studies showing elevation in total tau and p-tau in TBI
patients(219, 232).
To look for LMW proteolytic peptides, we identified from animal TBI, and in vitro
tau calpain digestion, we analyzed CSF samples collected withdrawn within 48 hours
from TBI patients. The ultrafiltrate fractions were analyzed by ultra-high-resolution mass
spectrometry (Orbitrap fusionTM tribrid). This instrument combines quadrupole, ion trap
and Orbitrap mass analysis with CID and HCD fragmentation. A set of ten CSF control
samples and ten TBI CSF samples were used for the analysis. Table 5-1 shows a list of
proteins that are found exclusively from TBI ultrafiltrate fractions. Proteins that are found
only in control CSF or in both control and TBI-CSF were filtered out from our analysis.
Proteins which were associated with TBI from our and other studies include
Amyloid-like protein 1, isoform 2 of the Major prion protein, serum amyloid A-1 protein,
serum amyloid A-2 protein, myelin basic protein, isoform 2 of neurofilament light and
medium polypeptide, and neurogranin. To the best of our knowledge, novel proteins that
are reported for the first time to be associated with TBI include Adenylate cyclase type
9, Desmoglein-1, Desmoplakin, glyceraldehyde-2-phosphate dehydrogenase, isoform 2
and 7 of Ras-specific guanine-nucleotide releasing factor (RalGPS1), and isoform beta
and gamma of poliovirus receptor (Table 5-1).
To further gain insight into the production and patterns of tau proteolysis, we
focused our analysis on tau-441 with dominant peptides listed in the peptidome
datasets. By employing the strategy from our in vitro and animal TBI study from chapter
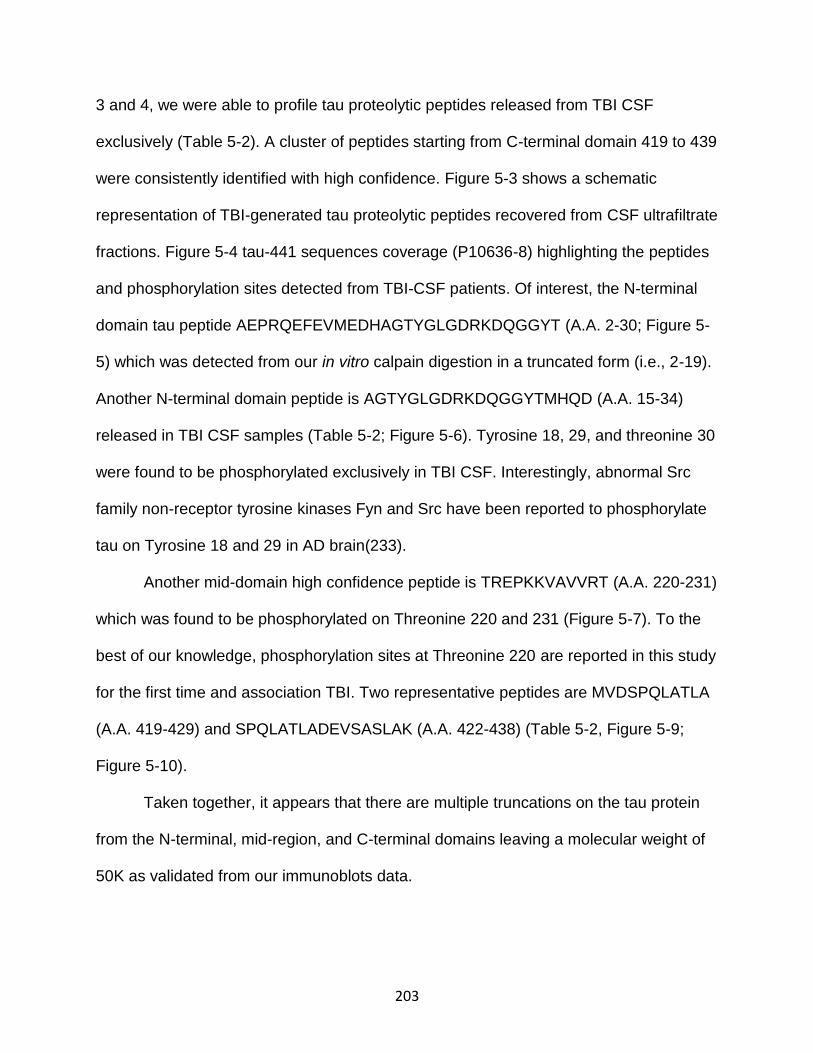
203
3 and 4, we were able to profile tau proteolytic peptides released from TBI CSF
exclusively (Table 5-2). A cluster of peptides starting from C-terminal domain 419 to 439
were consistently identified with high confidence. Figure 5-3 shows a schematic
representation of TBI-generated tau proteolytic peptides recovered from CSF ultrafiltrate
fractions. Figure 5-4 tau-441 sequences coverage (P10636-8) highlighting the peptides
and phosphorylation sites detected from TBI-CSF patients. Of interest, the N-terminal
domain tau peptide AEPRQEFEVMEDHAGTYGLGDRKDQGGYT (A.A. 2-30; Figure 5-
5) which was detected from our in vitro calpain digestion in a truncated form (i.e., 2-19).
Another N-terminal domain peptide is AGTYGLGDRKDQGGYTMHQD (A.A. 15-34)
released in TBI CSF samples (Table 5-2; Figure 5-6). Tyrosine 18, 29, and threonine 30
were found to be phosphorylated exclusively in TBI CSF. Interestingly, abnormal Src
family non-receptor tyrosine kinases Fyn and Src have been reported to phosphorylate
tau on Tyrosine 18 and 29 in AD brain(233).
Another mid-domain high confidence peptide is TREPKKVAVVRT (A.A. 220-231)
which was found to be phosphorylated on Threonine 220 and 231 (Figure 5-7). To the
best of our knowledge, phosphorylation sites at Threonine 220 are reported in this study
for the first time and association TBI. Two representative peptides are MVDSPQLATLA
(A.A. 419-429) and SPQLATLADEVSASLAK (A.A. 422-438) (Table 5-2, Figure 5-9;
Figure 5-10).
Taken together, it appears that there are multiple truncations on the tau protein
from the N-terminal, mid-region, and C-terminal domains leaving a molecular weight of
50K as validated from our immunoblots data.
204
Conclusion
It is observed from the scatter plot that there is increased phosphorylation of both
intact tau (55K) and oligomeric tau (102K) from the CSF TBI cases compared to normal
control samples. Thus, tau and its LMW-BDP might be a promising candidate
biomarker. Tau is extremely sensitive to TBI-induced phosphorylation, oligomerization,
and proteolysis, and could become a new TBI disease tracker diagnostic marker. Also,
the use of TBI proteolytic biomarkers could be used as drug development tools, i.e., TBI
therapeutics to protect the brain should in principle attenuate the levels of such TBI
induced proteolytic biomarker levels. Thus, tau proteolytic biomarkers could be
considered “theranostic tools” with the utilities in augmenting the clinical trials for new
TBI drug development.
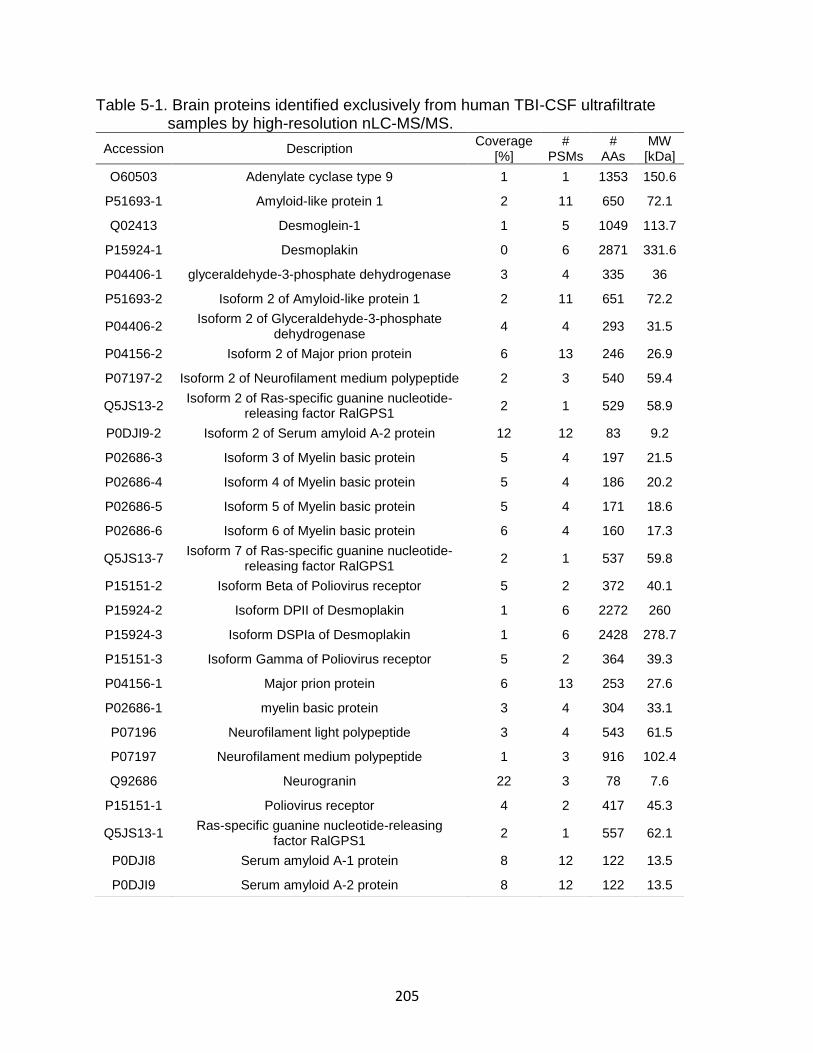
205
Table 5-1. Brain proteins identified exclusively from human TBI-CSF ultrafiltrate samples by high-resolution nLC-MS/MS.
Accession Description Coverage
[%] #
PSMs #
AAs MW [kDa]
O60503 Adenylate cyclase type 9 1 1 1353 150.6
P51693-1 Amyloid-like protein 1 2 11 650 72.1
Q02413 Desmoglein-1 1 5 1049 113.7
P15924-1 Desmoplakin 0 6 2871 331.6
P04406-1 glyceraldehyde-3-phosphate dehydrogenase 3 4 335 36
P51693-2 Isoform 2 of Amyloid-like protein 1 2 11 651 72.2
P04406-2 Isoform 2 of Glyceraldehyde-3-phosphate
dehydrogenase 4 4 293 31.5
P04156-2 Isoform 2 of Major prion protein 6 13 246 26.9
P07197-2 Isoform 2 of Neurofilament medium polypeptide 2 3 540 59.4
Q5JS13-2 Isoform 2 of Ras-specific guanine nucleotide-
releasing factor RalGPS1 2 1 529 58.9
P0DJI9-2 Isoform 2 of Serum amyloid A-2 protein 12 12 83 9.2
P02686-3 Isoform 3 of Myelin basic protein 5 4 197 21.5
P02686-4 Isoform 4 of Myelin basic protein 5 4 186 20.2
P02686-5 Isoform 5 of Myelin basic protein 5 4 171 18.6
P02686-6 Isoform 6 of Myelin basic protein 6 4 160 17.3
Q5JS13-7 Isoform 7 of Ras-specific guanine nucleotide-
releasing factor RalGPS1 2 1 537 59.8
P15151-2 Isoform Beta of Poliovirus receptor 5 2 372 40.1
P15924-2 Isoform DPII of Desmoplakin 1 6 2272 260
P15924-3 Isoform DSPIa of Desmoplakin 1 6 2428 278.7
P15151-3 Isoform Gamma of Poliovirus receptor 5 2 364 39.3
P04156-1 Major prion protein 6 13 253 27.6
P02686-1 myelin basic protein 3 4 304 33.1
P07196 Neurofilament light polypeptide 3 4 543 61.5
P07197 Neurofilament medium polypeptide 1 3 916 102.4
Q92686 Neurogranin 22 3 78 7.6
P15151-1 Poliovirus receptor 4 2 417 45.3
Q5JS13-1 Ras-specific guanine nucleotide-releasing
factor RalGPS1 2 1 557 62.1
P0DJI8 Serum amyloid A-1 protein 8 12 122 13.5
P0DJI9 Serum amyloid A-2 protein 8 12 122 13.5
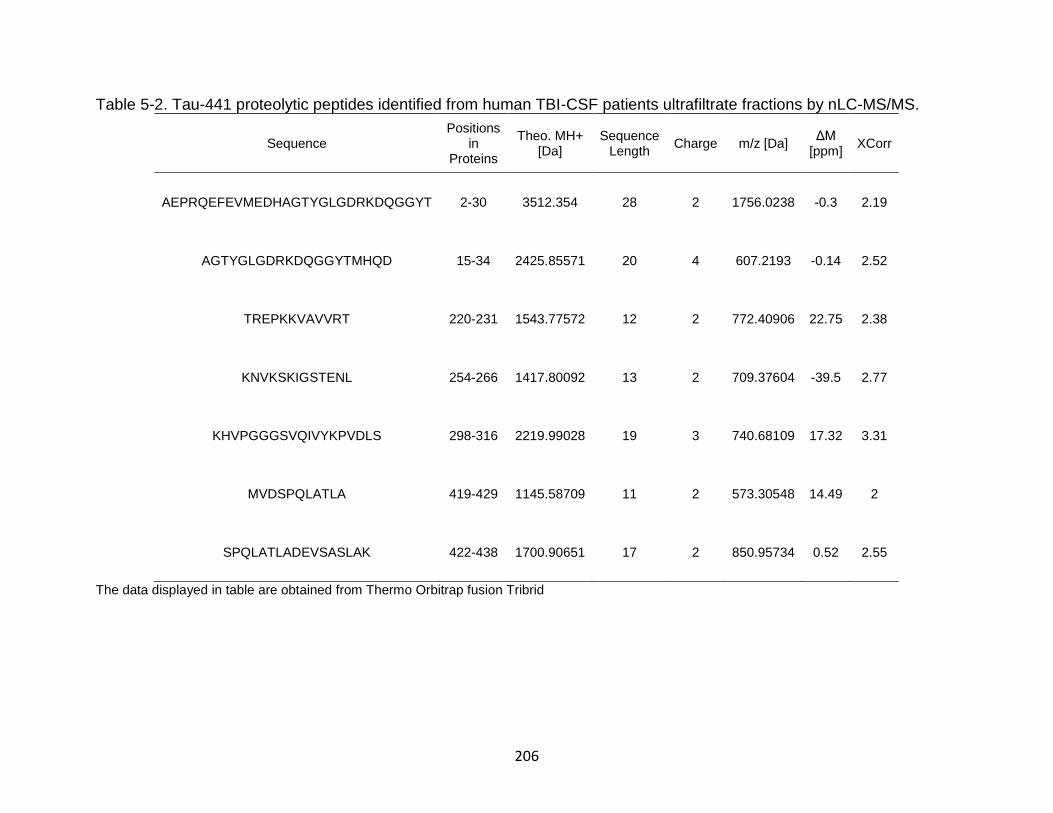
206
Table 5-2. Tau-441 proteolytic peptides identified from human TBI-CSF patients ultrafiltrate fractions by nLC-MS/MS.
Sequence Positions
in Proteins
Theo. MH+ [Da]
Sequence Length
Charge m/z [Da] ΔM
[ppm] XCorr
AEPRQEFEVMEDHAGTYGLGDRKDQGGYT 2-30 3512.354 28 2 1756.0238 -0.3 2.19
AGTYGLGDRKDQGGYTMHQD 15-34 2425.85571 20 4 607.2193 -0.14 2.52
TREPKKVAVVRT 220-231 1543.77572 12 2 772.40906 22.75 2.38
KNVKSKIGSTENL 254-266 1417.80092 13 2 709.37604 -39.5 2.77
KHVPGGGSVQIVYKPVDLS 298-316 2219.99028 19 3 740.68109 17.32 3.31
MVDSPQLATLA 419-429 1145.58709 11 2 573.30548 14.49 2
SPQLATLADEVSASLAK 422-438 1700.90651 17 2 850.95734 0.52 2.55
The data displayed in table are obtained from Thermo Orbitrap fusion Tribrid
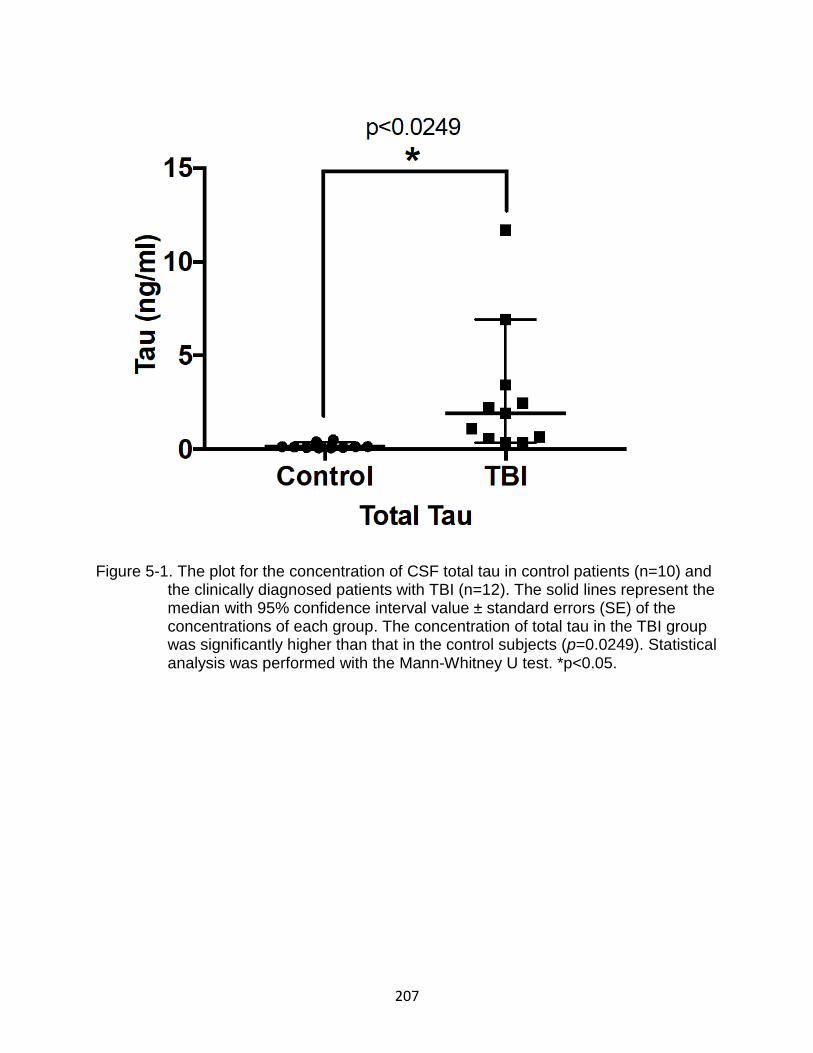
207
Figure 5-1. The plot for the concentration of CSF total tau in control patients (n=10) and
the clinically diagnosed patients with TBI (n=12). The solid lines represent the median with 95% confidence interval value ± standard errors (SE) of the concentrations of each group. The concentration of total tau in the TBI group was significantly higher than that in the control subjects (p=0.0249). Statistical analysis was performed with the Mann-Whitney U test. *p<0.05.
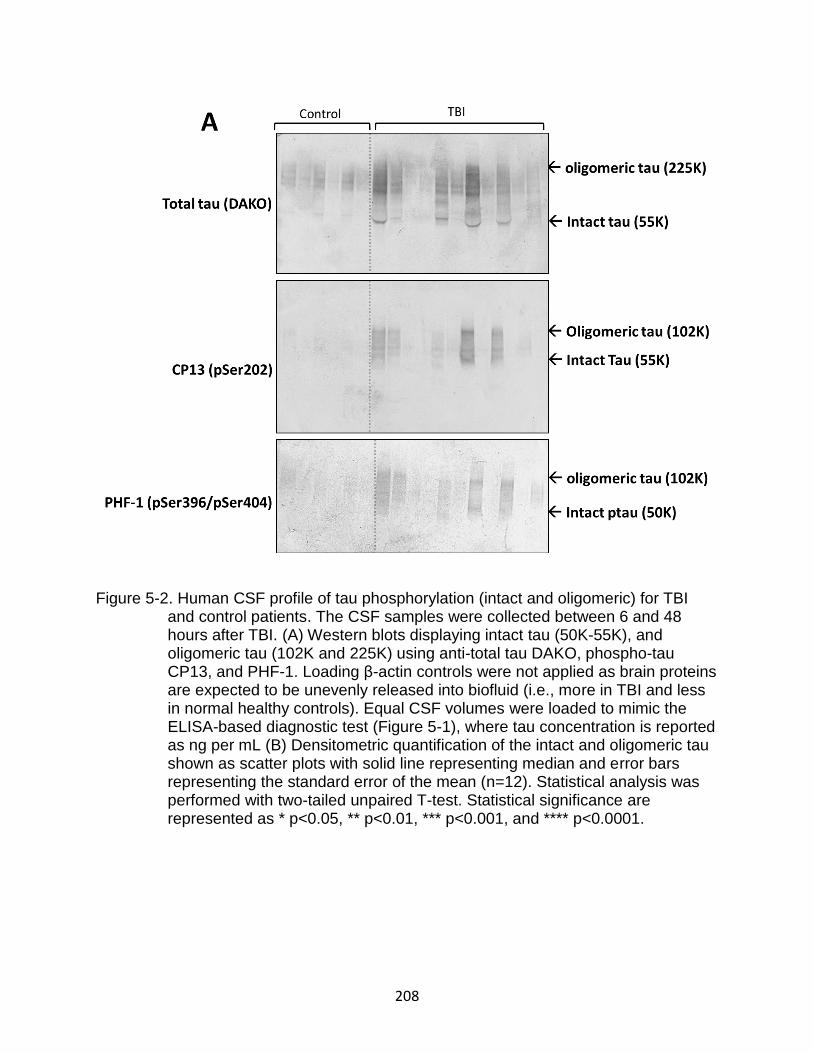
208
Figure 5-2. Human CSF profile of tau phosphorylation (intact and oligomeric) for TBI and control patients. The CSF samples were collected between 6 and 48 hours after TBI. (A) Western blots displaying intact tau (50K-55K), and oligomeric tau (102K and 225K) using anti-total tau DAKO, phospho-tau CP13, and PHF-1. Loading β-actin controls were not applied as brain proteins are expected to be unevenly released into biofluid (i.e., more in TBI and less in normal healthy controls). Equal CSF volumes were loaded to mimic the ELISA-based diagnostic test (Figure 5-1), where tau concentration is reported as ng per mL (B) Densitometric quantification of the intact and oligomeric tau shown as scatter plots with solid line representing median and error bars representing the standard error of the mean (n=12). Statistical analysis was performed with two-tailed unpaired T-test. Statistical significance are represented as * p<0.05, ** p<0.01, *** p<0.001, and **** p<0.0001.
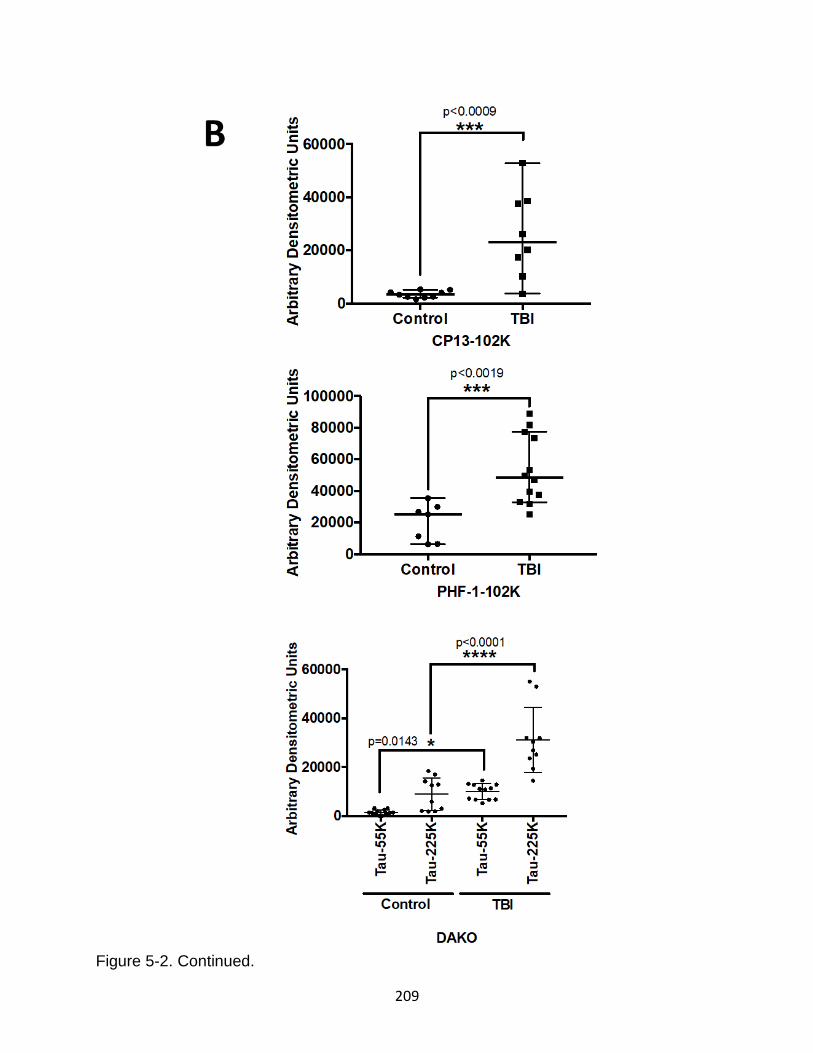
209
Figure 5-2. Continued.
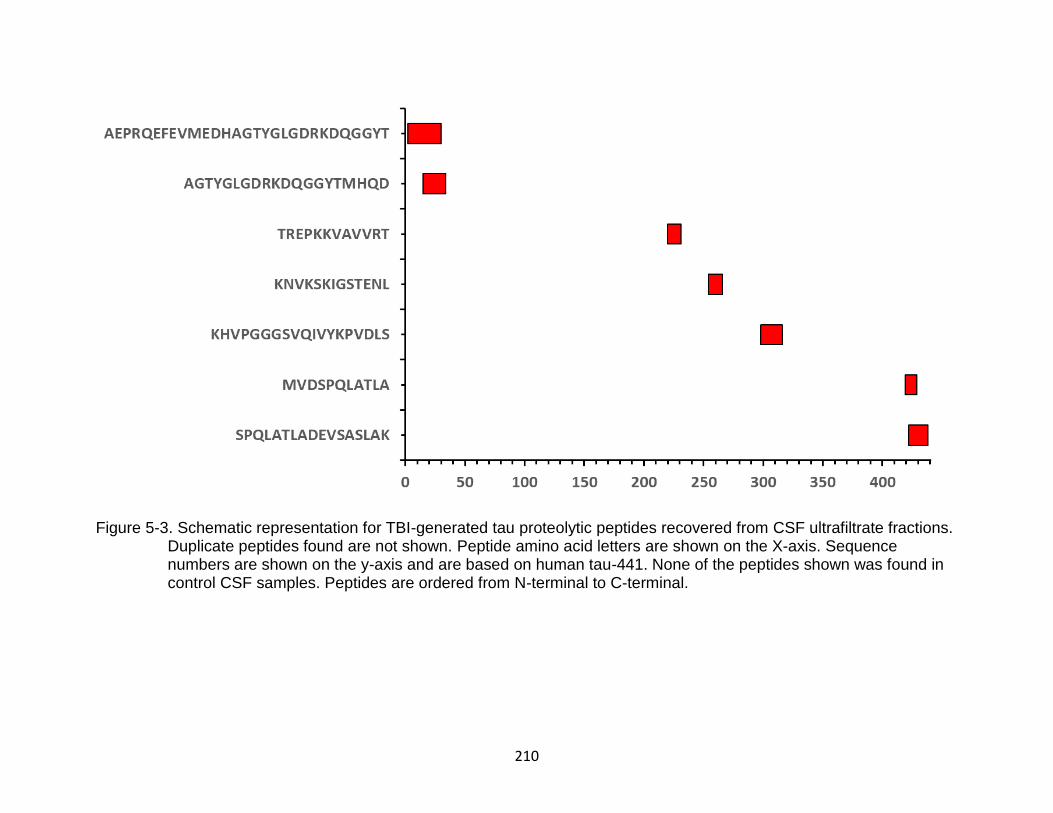
210
Figure 5-3. Schematic representation for TBI-generated tau proteolytic peptides recovered from CSF ultrafiltrate fractions.
Duplicate peptides found are not shown. Peptide amino acid letters are shown on the X-axis. Sequence numbers are shown on the y-axis and are based on human tau-441. None of the peptides shown was found in control CSF samples. Peptides are ordered from N-terminal to C-terminal.
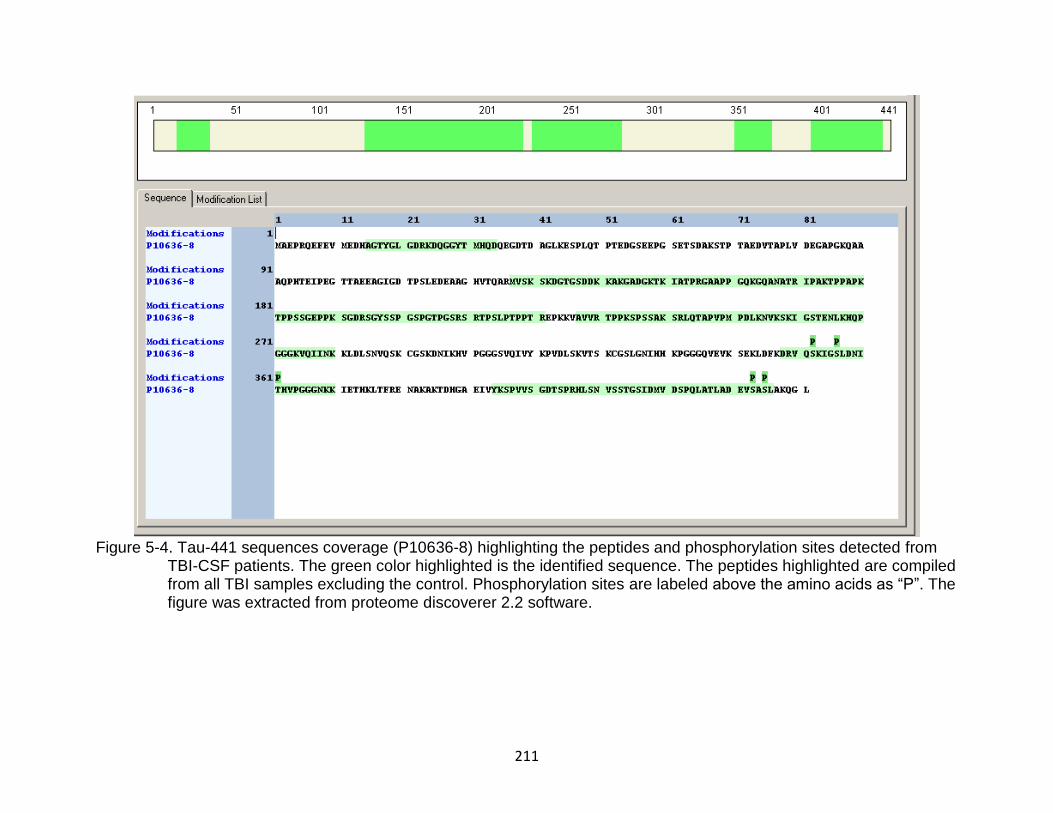
211
Figure 5-4. Tau-441 sequences coverage (P10636-8) highlighting the peptides and phosphorylation sites detected from TBI-CSF patients. The green color highlighted is the identified sequence. The peptides highlighted are compiled from all TBI samples excluding the control. Phosphorylation sites are labeled above the amino acids as “P”. The figure was extracted from proteome discoverer 2.2 software.

212
Figure 5-5. Product ion spectrum of the tau peptide AEPRQEFEVMEDHAGTYGLGDRKDQGGYT released in CSF samples in TBI subjects. (A) Product ion spectrum for the tau-441 peptide AEPRQEFEVMEDHAGTYGLGDRKDQGGYT (amino acid residues 2-30), charge +2, monoisotopic m/z 1756.02380 Da, displaying the fragment ions for this peptide. (B) Identified b+ and y+ type ions in red and blue, respectively. Tyrosine 18, 29, and threonine 30 were found to be phosphorylated.
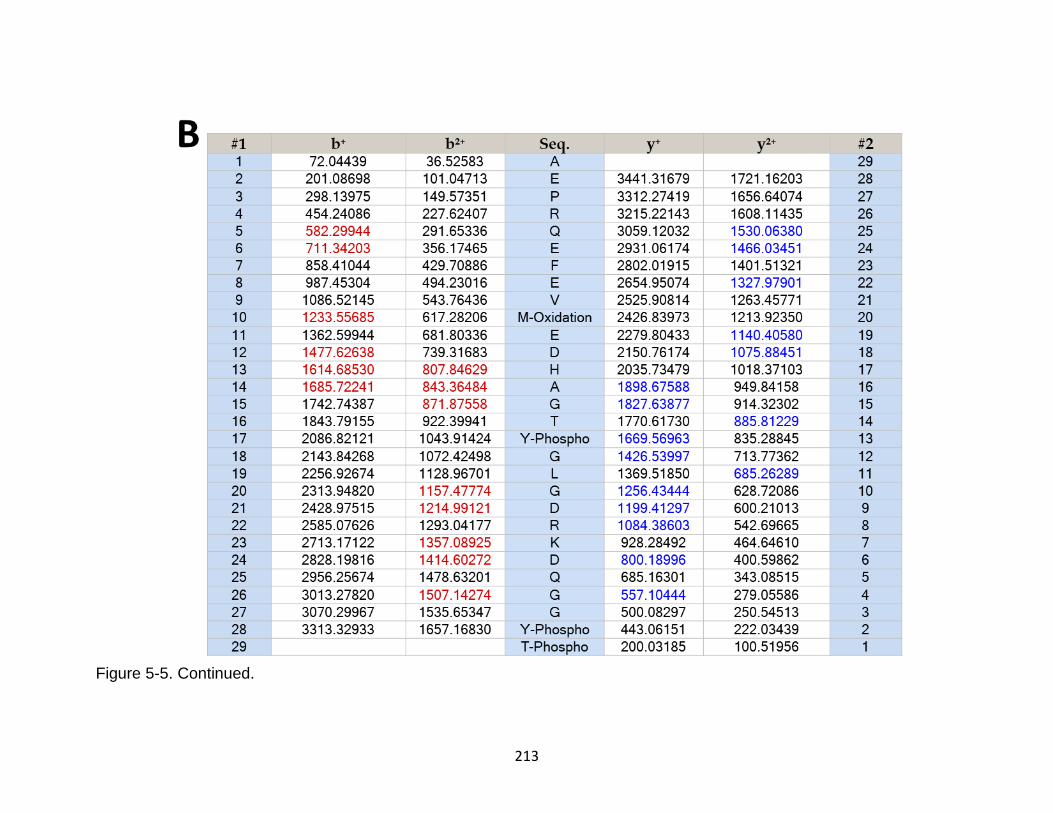
213
Figure 5-5. Continued.
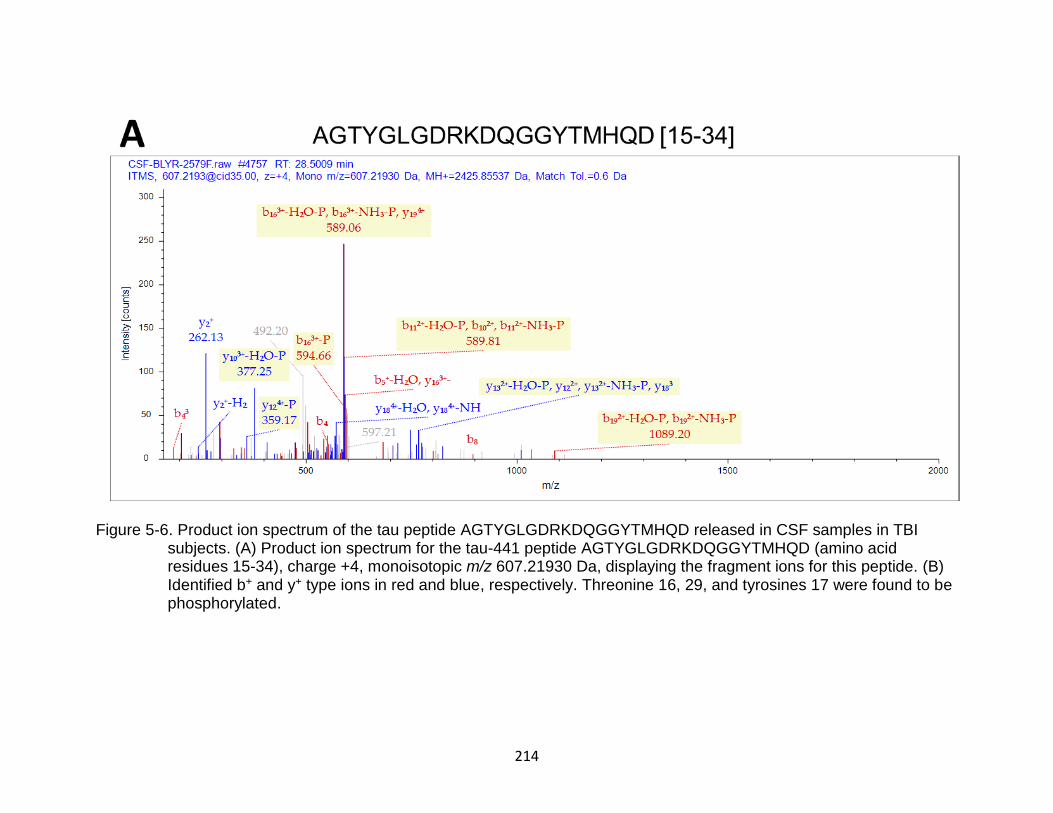
214
Figure 5-6. Product ion spectrum of the tau peptide AGTYGLGDRKDQGGYTMHQD released in CSF samples in TBI subjects. (A) Product ion spectrum for the tau-441 peptide AGTYGLGDRKDQGGYTMHQD (amino acid residues 15-34), charge +4, monoisotopic m/z 607.21930 Da, displaying the fragment ions for this peptide. (B) Identified b+ and y+ type ions in red and blue, respectively. Threonine 16, 29, and tyrosines 17 were found to be phosphorylated.
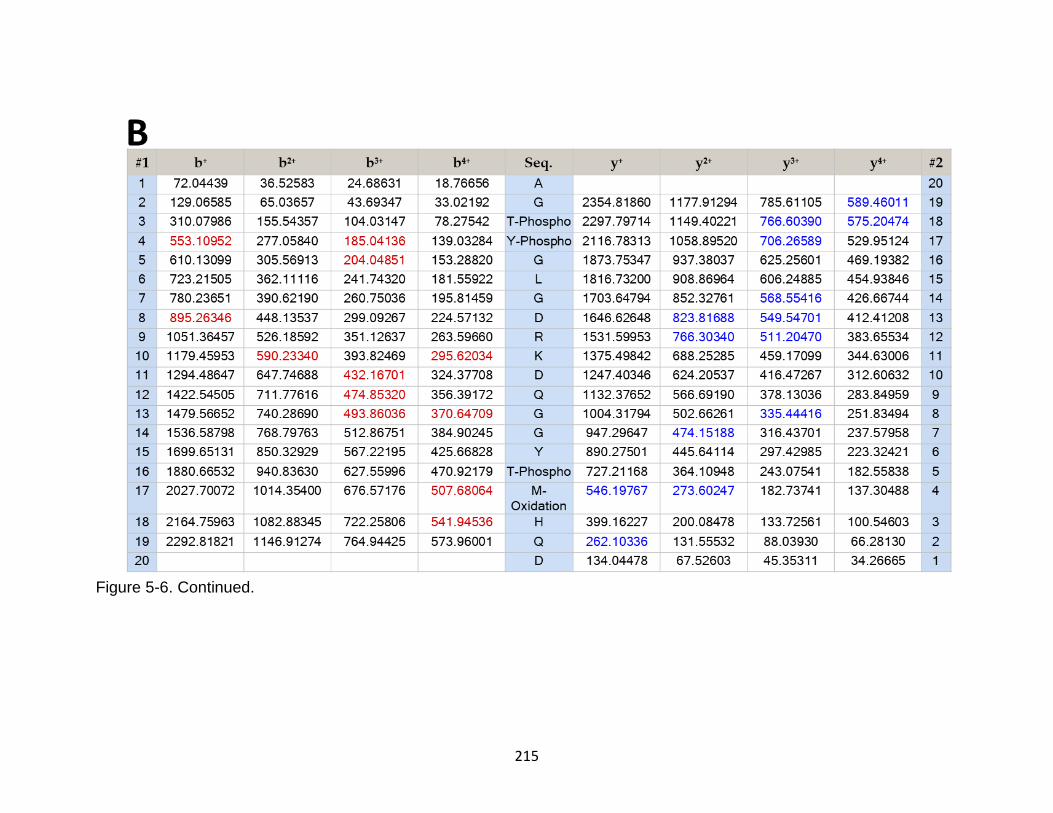
215
Figure 5-6. Continued.
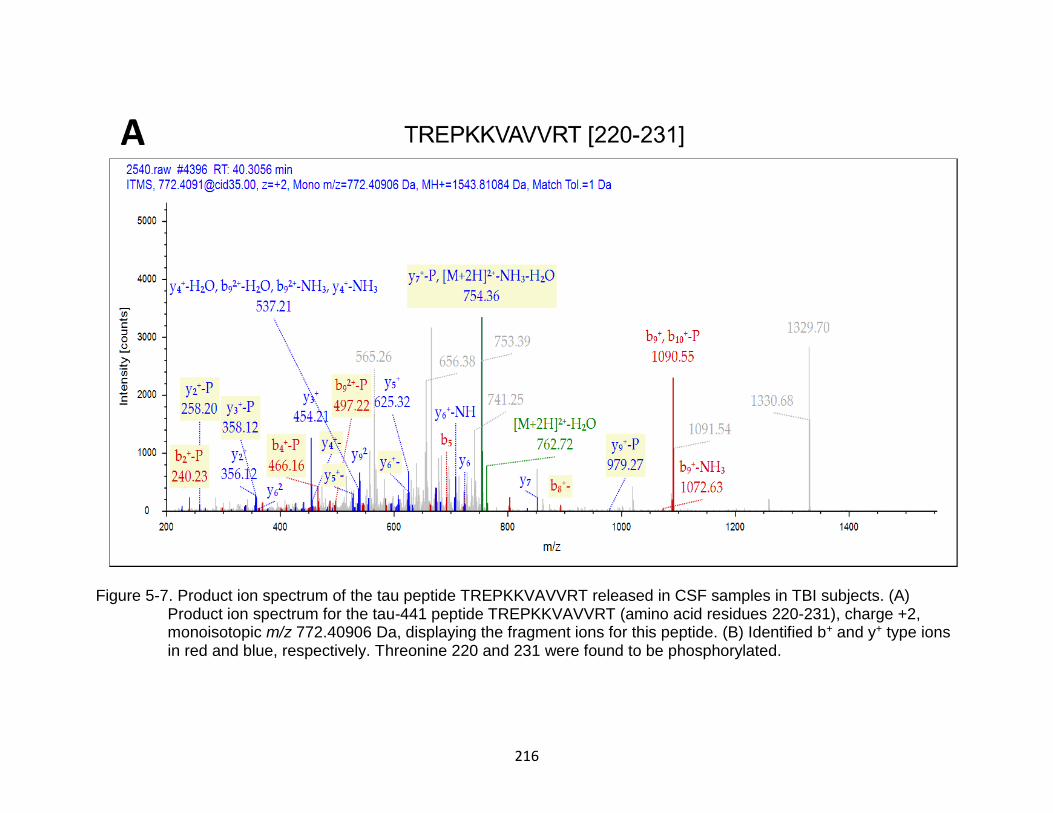
216
Figure 5-7. Product ion spectrum of the tau peptide TREPKKVAVVRT released in CSF samples in TBI subjects. (A) Product ion spectrum for the tau-441 peptide TREPKKVAVVRT (amino acid residues 220-231), charge +2, monoisotopic m/z 772.40906 Da, displaying the fragment ions for this peptide. (B) Identified b+ and y+ type ions in red and blue, respectively. Threonine 220 and 231 were found to be phosphorylated.
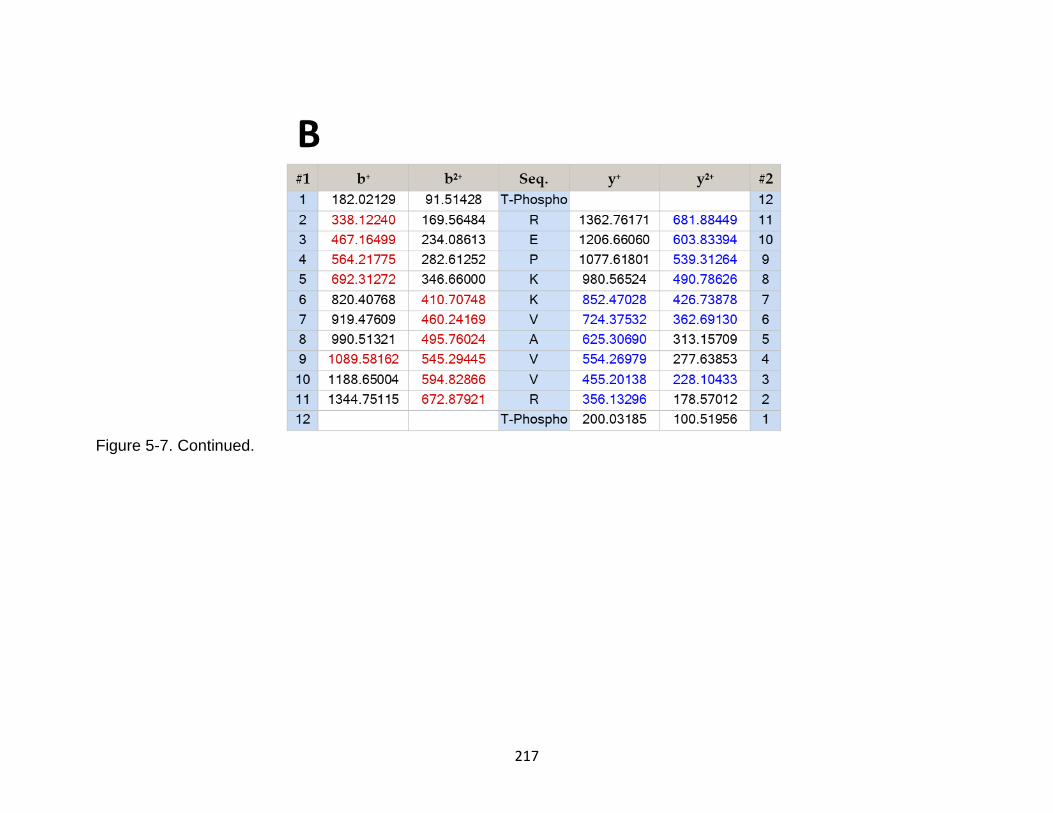
217
Figure 5-7. Continued.
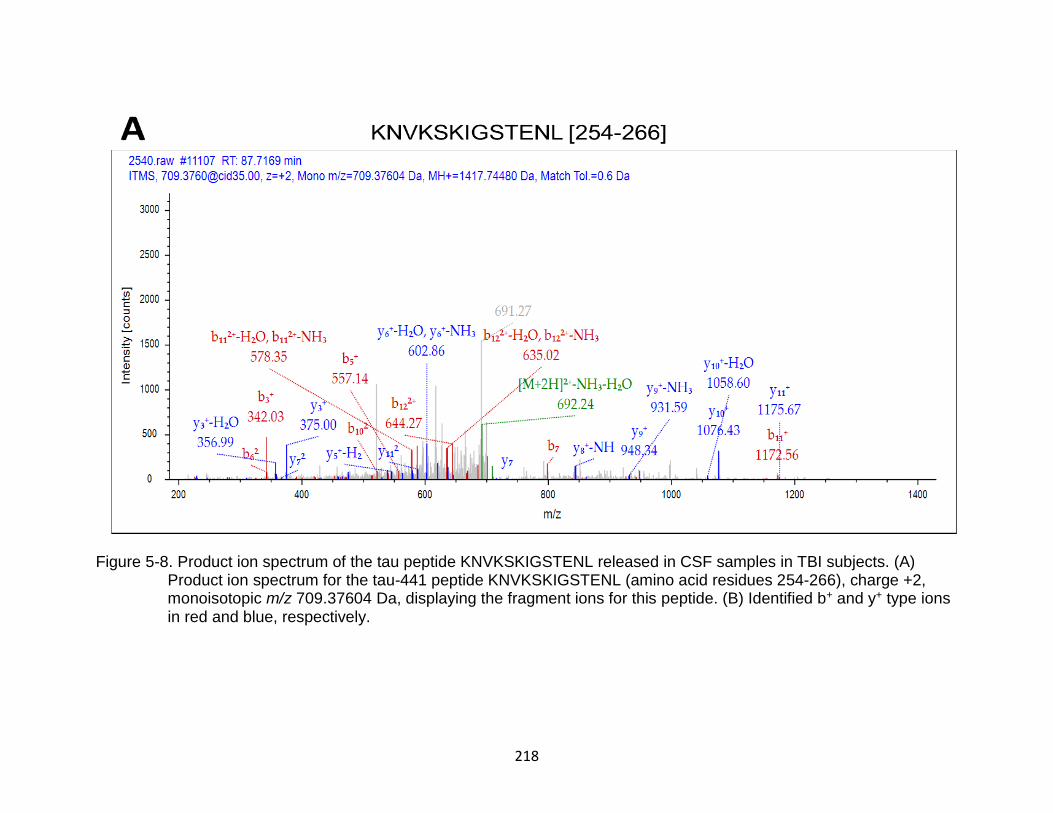
218
Figure 5-8. Product ion spectrum of the tau peptide KNVKSKIGSTENL released in CSF samples in TBI subjects. (A) Product ion spectrum for the tau-441 peptide KNVKSKIGSTENL (amino acid residues 254-266), charge +2, monoisotopic m/z 709.37604 Da, displaying the fragment ions for this peptide. (B) Identified b+ and y+ type ions in red and blue, respectively.
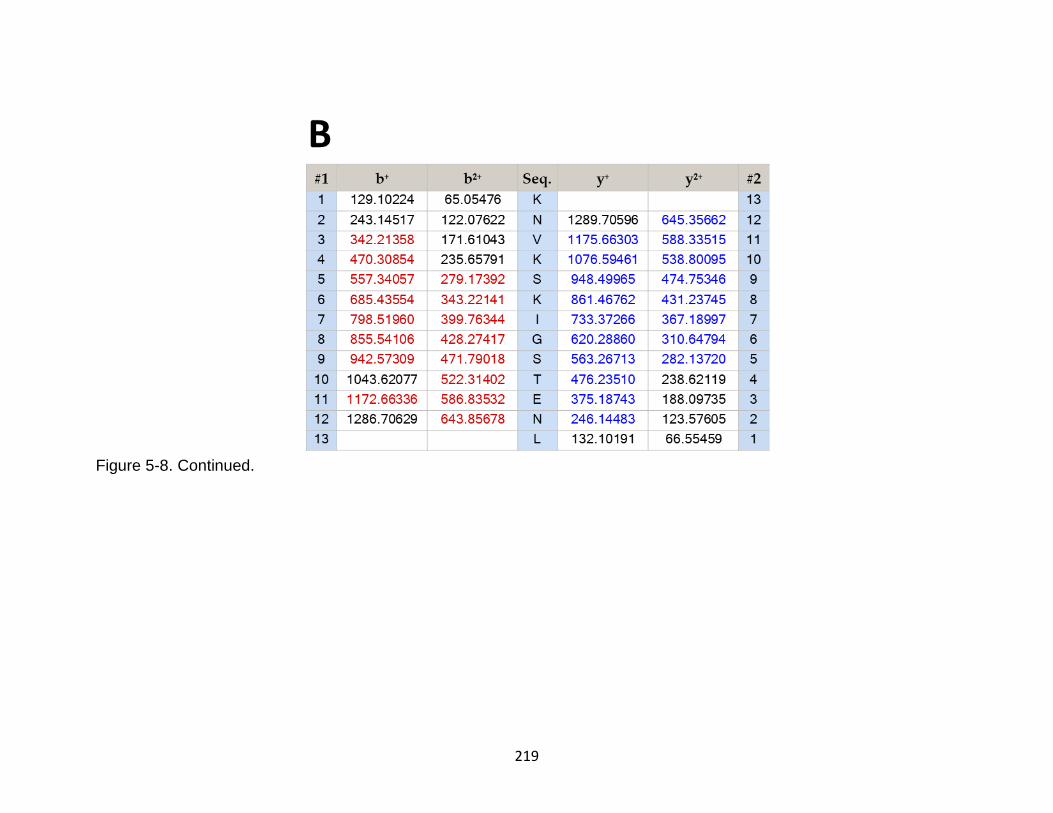
219
Figure 5-8. Continued.
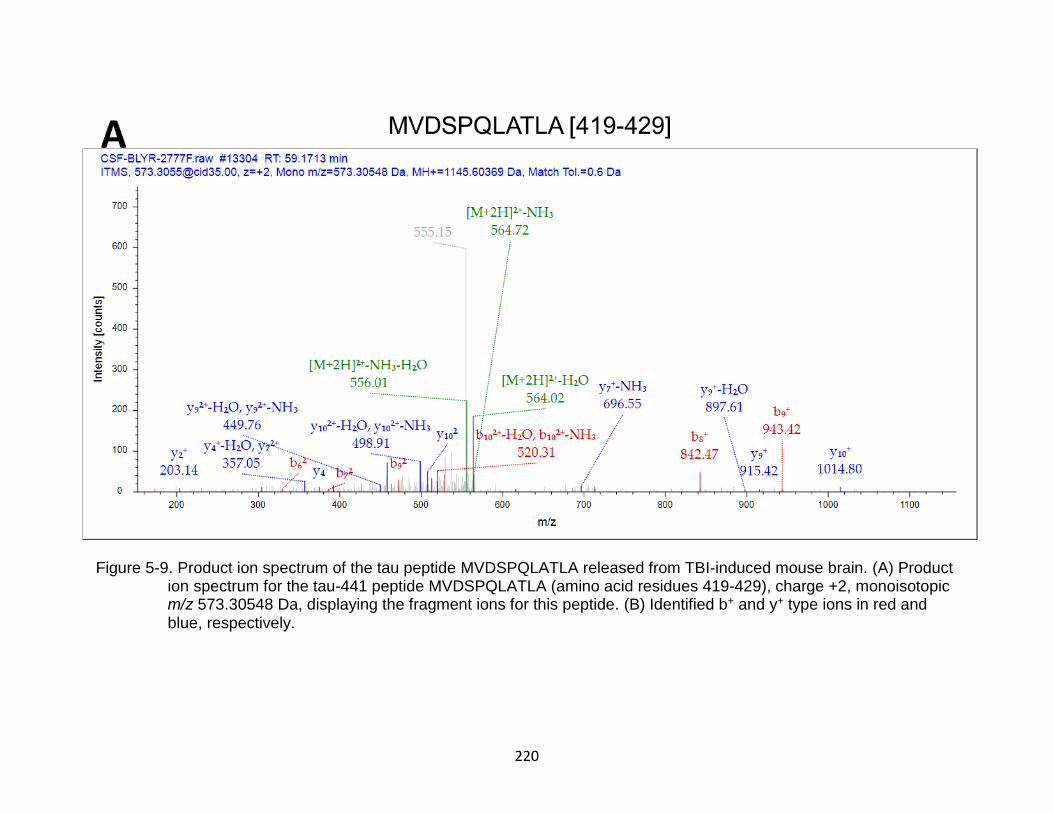
220
Figure 5-9. Product ion spectrum of the tau peptide MVDSPQLATLA released from TBI-induced mouse brain. (A) Product ion spectrum for the tau-441 peptide MVDSPQLATLA (amino acid residues 419-429), charge +2, monoisotopic m/z 573.30548 Da, displaying the fragment ions for this peptide. (B) Identified b+ and y+ type ions in red and blue, respectively.
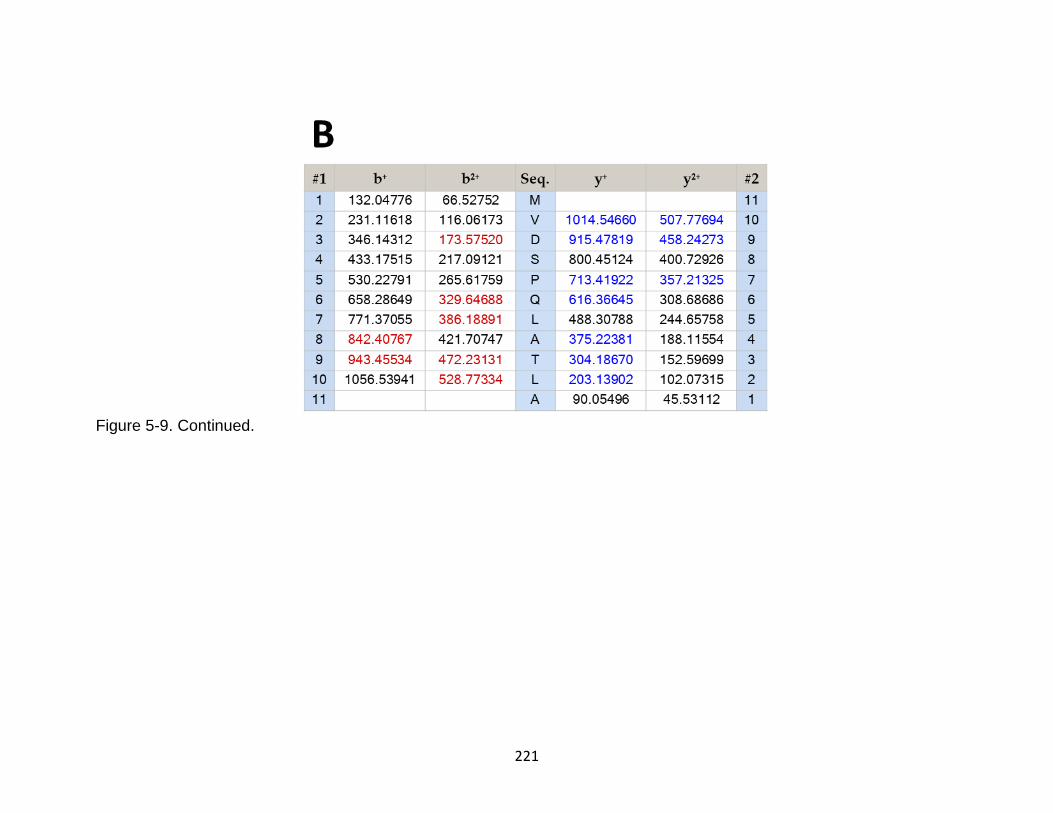
221
Figure 5-9. Continued.
222
CHAPTER 6 CONCLUSIONS AND FUTURE DIRECTIONS
Traumatic brain injury leads to secondary metabolic alterations that play a critical
role in subsequent tissue damage and neuronal cell death. Neurotherapeutic
approaches that interrupt the secondary metabolic pathways, recover behavioral
outcomes, or both, have been well documented on multiple animal models of TBI.
Neuroprotective approaches in human TBI have been unsuccessful, with the failure of
at least thirty clinical trials. The failure in finding successful neuroprotective therapy is
due to the heterogeneity in conceptual issues and methodological approaches between
preclinical and clinical injury. Peptidomic approaches have the potential to provide a
promising neurotherapeutic target and novel biomarkers that characterize the disease
states and might be incorporated into high-throughput clinical assays. Moreover, the
field of peptidomics can aid in the development of new tools to assess pharmacological
interventions for TBI and other neurodegenerative diseases.
Abnormal phosphorylation, aggregation, or both, of the tau protein, play a pivotal
role in the pathogenesis of TBI and other tauopathies such as AD.
Hyperphosphorylation of tau alone is sufficient to induce loss of function as
dephosphorylation of pathological tau by phosphatases restores microtubule stability.
Okadaic acid (OA), a protein phosphatase 1/2A inhibitor, was used to induce tau-
hyperphosphorylation and oligomerization aimed as a screening method for tau protein
kinase inhibitors in an in vitro model of neuroblastoma and rat primary neuronal cortical
cell cultures. CTE-relevant tau phospho-epitopes assessed included pSer202/pThr205
(AT8), pThr181 (AT270), pSer202 (CP13), pSer396/pSer404 (PHF-1) and pThr231 (RZ3).
223
We showed that casein kinase II inhibitor, 4, 5, 6, 7-Tetrabromo-2-
azabenzimidazole (TBB) caused a robust inhibition of OA-induced tau
hyperphosphorylation and oligomerization in mouse and rat neuronal cultured cells.
Moreover, treatment with the calcineurin inhibitor (cyclosporine A), glycogen synthase
kinase inhibitors (LiCl, AR-A014418, and A-1070722, cyclin-dependent kinase 5
(Roscovitine), Fyn/Src kinase inhibitor (Saracatinib) and calcium chelator EGTA showed
robust inhibition of basal and OA-induced tau hyperphosphorylation in our in vitro cell-
based models.
In our work, we found two novel potential drug candidates (TBB and Saracatinib)
that showed efficacy against tau hyperphosphorylation and oligomerization processes.
These promising data warrant further experimentation, possibly including animal models
of tauopathies, which may provide a putative neurotherapy for CTE and other forms of
TBI-induced neurodegenerative diseases.
A possible way of taking these finding further would be pre-injecting TBB
followed by OA injection unilaterally into the amygdala of wild-type mice, and
pathological tau phosphorylation sites can be measured using phospho-tau specific
antibodies. Another future direction for chapter 2 is to use high-content siRNA strategy
for targeting the identified kinases in TBI-induced animal models. One can implement
the usage of immunofluorescence assay for the rapid detection and quantitation of total
tau and pathological tau phosphorylation sites.
Others and we have shown that tau is proteolyzed in vitro, in animal models and
human TBI extensively. The studies described tau protein as high molecular weight
break down products (HMW-BDPs) with a size that is close to the parent protein. To our
224
knowledge, this study is the first systematic approach to characterize TBI-based tau low
molecular weight break down products (LMW-BDPs), we termed this as tau proteolytic
peptidome. Overall, the results show that tau was highly vulnerable to proteolytic
enzymes (e.g., calpain) generating LMW and HMW-BDP following TBI, which can
equally contribute to pathogenesis. These highly active proteolytic enzymes can attack
target proteins and lead to the release of pathological tau peptides, which might in turn
leak, into the biofluid.
We have subjected purified tau protein (phosphorylated and non-phosphorylated)
and brain lysate from transgenic mouse overexpressing human tau (htau) to calpain-1
digestion to characterize the HMW and LMW tau peptide products. We have also
challenged rat primary cerebrocortical neuronal cultures (CTX) with neurotoxic
conditions including A23187, STS, and maitotoxin with or without protein phosphatase
inhibitor okadaic acid (OA) pretreatment, to mimic neurodegenerative conditions. The
samples were subjected to ultrafiltration (10K) and fractionated into HMW (retentate)
and LMW (filtrate) products. The HMW were analyzed by western blotting using total
and phospho-specific tau antibodies, while the filtrate fractions were analyzed using
nanoLC-ESI-MS/MS. We were able to detect novel proteolytic tau peptides that might
be linked to neurodegeneration, as they were exclusively present in treatments but not
in controls. We were also able to derive calpain-1 cleavage sites using our MS data.
Moreover, we identified phosphorylated sites that that could be critical to the pattern of
calpain-1 proteolysis of tau protein.
Our findings might aid in developing promising future neurotherapeutic strategies
emphasizing the suppression of calpain-mediated tau proteolysis and serve as
225
biomarkers for neurodegenerative diseases. In rat tau studies, we have previously
identified tau cleavage sites as Ser130Lys131, Gly157Ala158, and Arg380Glu381. Here we
found additional novel tau-calpain cleavage sites (the longest human tau isoform: Tau-
758) including G19L20, Q49T50, A89A90, Q124E125, and T720S721. These cleavage
points can lead to short peptide formation as evidenced by peptides found
(AEPRQEFEVMEDHAGTYG, SPRHLSNVSSTGSIDMVDSPQLATLADEVS,
TLADEVSASLAKQGL, SPRHLSNVSSTGSIDMVDSPQLA, ASLAKQGL,
STGSIDMVDSPQLA, and TLADEVSASLAKQGL). These peptides can be used for
“theranostic” translational studies to further validate their feasibility for clinical trials.
Such short peptides could have remarkably different kinetics when compared to
their larger tau protein-BDP counterpart we previously reported. One possible future
direction for this chapter would be to include high-resolution mass spectrometric data in
order to confirm and validate our findings. Another possible future direction is to
implement the of human SH-SY5Y neuronal culture in order to facilitate direct tau
peptidome comparison of the fragments as some amino acid sequences in the rat tau
protein is missing from the human tau. If our resources allow, one might also compare
the LMW-BDPs of tau generated using other critical TBI-related enzymes such as
cathepsins, Human high-temperature requirement serine A1 (HtrA1), Puromycin-
sensitive aminopeptidase (PSA), thrombin, caspase-3, disintegrin and metalloprotease
10 (ADAM10), Asparagine endopeptidase (AEP) using the same peptidomic platform. It
was also observed that there are several peptide variants of fragments. For example,
minor differences such as the deletion of one or two C- or N-terminal amino acids (or
both) of tau sequence.
226
Moreover, minor differences such as the addition of one or two C- or N-terminal
amino acids (or both) of sequences are also observed. These differences might be
attributed to the different tau isoforms or sometimes protein turnover. Therefore, going
forward, animal TBI models and human TBI clinical samples are best for pinpointing the
fragments, which are pathologically relevant.
In our experimental design, we approached these studies using a translational
strategy. Ipsilateral and contralateral cortices of transgenic htau mice brain lysates were
collected at different time points (day 1 to day 7) from a mouse model that represents
severe focal injury (CCI) with TBI and control subjects were used. Peptidomic approach
optimized from chapter 3 was used to identify the tau peptidome using nLC-MS/MS and
bioinformatic searches. We have identified natively released tau peptides using our high
throughput ultrafiltration method. From our injured mouse brain TBI ultrafiltrate samples,
based on the origin of proteolytic peptides release, we identified several proteolytic
peptides residing specifically in the C-terminal region and the mid-domain of tau protein.
To further gain insights into the generation and patterns of tau proteolytic
peptides, we focused our bioinformatic searches against a subset that include all tau six
isoforms. It was observed that there are several truncations on the C-terminal domain of
tau protein with varying lengths as detected by nLC-MS/MS in both mouse brain lysate
filtrate fractions. From the immunoblots analysis, we observed with total tau, a band
residing at a calculated molecular weight of 44K and intact tau band at 55K, thus
making it in the same size as the C-terminal core peptide of tau observed by MS/MS.
Another observation is related to the pattern of the C-terminal cleavage of tau, which
was more consistent with those that were generated in vitro by calpain-1. Therefore, it
227
can be concluded that these peptides might have pathological functions in mouse TBI
samples causing the neurotoxicity and cell death. This is consistent with proteomics
studies using mass spectrometry where they reported a distinct lack of C-terminal tau
peptide indicative of tau fragmentation.(234)
Taken together, we have used a combined immunoblot and peptidomic
approach, respectively to study tau-BDP and released peptides following in vitro protein
digestion, cell culture treatment, in vivo mouse and human TBI assisted with
ultrafiltration method (10K MWCO) to separate the larger tau fragments from, the
smaller released peptides. Phosphorylation of tau following TBI was elevated at many
reported pathological sites in mouse samples including pSer202, pThr205, pThr231,
pSer396, and pSer404 (when compared to controls). Another future direction is to develop
an optimized quantification method of these tau brain protein proteolytic peptides. For
classic tryptic peptide, one can use multiple reaction monitoring (MRM) method in
MS/MS to target the specific peptides using synthetic tryptic peptides as internal
standards for the quantification of natively generated peptides.
However, as our data in this study have shown multiple variants of the same core
peptide, thus showing more active proteolytic peptides in mouse and human TBI, and
leading to heterogeneity, which makes it challenging to perform MRM-based
quantification. Ultimately using antibody-based competitive enzyme-linked
immunosorbent assay (ELISA) will be the method of choice for the quantification tau
proteolytic fragments. We plan to build an antibody against the major core tau peptides
and implement the use of competitive ELISA for high precision quantification studies.
228
Another future direction for this study is to use the TBI sample with the more extended
time point of injury (6-9 month) as well as including mild repetitive TBI injury (rCHI).
Finally, the results in this dissertation present novel phosphorylation sites,
potential tau kinases, kinase inhibitor, tau cleavage sites, LMW and HMW proteolytic
peptides that can be used for pharmacological intervention and potential “theranostic”
tools for new TBI drug development.
Overall, phosphorylation sites associated with traumatic brain injuries identified
(pSer202/pThr205 (AT8), pThr181 (AT270), pSer202 (CP13), pSer396/pSer404 (PHF-1) and
pThr231 (RZ3)), calpain cleavage sites identified in this study (G19L20, Q49T50, A89A90,
Q124E125, and T720S721, and the tau proteolytic fragments
(AEPRQEFEVMEDHAGTYG, SPRHLSNVSSTGSIDMVDSPQLATLADEVS,
TLADEVSASLAKQGL, SPRHLSNVSSTGSIDMVDSPQLA, ASLAKQGL,
STGSIDMVDSPQLA, and TLADEVSASLAKQGL) can be used for “theranostic”
translational studies and warrants further investigation before proceeding to clinical
trials.
229
LIST OF REFERENCES
1. Taylor, C. A.; Bell, J. M.; Breiding, M. J.; Xu, L., Traumatic Brain Injury-Related Emergency Department Visits, Hospitalizations, and Deaths - United States, 2007 and 2013. MMWR Surveill Summ 2017, 66, (9), 1-16.
2. Dewan, M. C.; Rattani, A.; Gupta, S.; Baticulon, R. E.; Hung, Y. C.; Punchak, M.; Agrawal, A.; Adeleye, A. O.; Shrime, M. G.; Rubiano, A. M.; Rosenfeld, J. V.; Park, K. B., Estimating the global incidence of traumatic brain injury. J Neurosurg 2018, 1-18.
3. Timaru-Kast, R.; Herbig, E. L.; Luh, C.; Engelhard, K.; Thal, S. C., Influence of Age on Cerebral Housekeeping Gene Expression for Normalization of Quantitative Polymerase Chain Reaction after Acute Brain Injury in Mice. J Neurotrauma 2015, 32, (22), 1777-88.
4. Wang, K. K.; Yang, Z.; Zhu, T.; Shi, Y.; Rubenstein, R.; Tyndall, J. A.; Manley, G. T., An update on diagnostic and prognostic biomarkers for traumatic brain injury. Expert Rev Mol Diagn 2018, 18, (2), 165-180.
5. Ramos-Cejudo, J.; Wisniewski, T.; Marmar, C.; Zetterberg, H.; Blennow, K.; de Leon, M. J.; Fossati, S., Traumatic Brain Injury and Alzheimer's Disease: The Cerebrovascular Link. EBioMedicine 2018, 28, 21-30.
6. Morse, A. M.; Garner, D. R., Traumatic Brain Injury, Sleep Disorders, and Psychiatric Disorders: An Underrecognized Relationship. Med Sci (Basel) 2018, 6, (1), 15.
7. Brown, R. M.; Tang, X.; Dreer, L. E.; Driver, S.; Pugh, M. J.; Martin, A. M.; McKenzie-Hartman, T.; Shea, T.; Silva, M. A.; Nakase-Richardson, R., Change in body mass index within the first-year post-injury: a VA Traumatic Brain Injury (TBI) model systems study. Brain Inj 2018, 1-8.
8. Hosseini, S. H.; Ayyasi, M.; Akbari, H.; Heidari Gorji, M. A., Comparison of Glasgow Coma Scale, Full Outline of Unresponsiveness and Acute Physiology and Chronic Health Evaluation in Prediction of Mortality Rate Among Patients With Traumatic Brain Injury Admitted to Intensive Care Unit. Anesth Pain Med 2017, 7, (5), e33653.
9. Worthington, A.; Wood, R. L., Apathy following traumatic brain injury: A review. Neuropsychologia 2018, 18, (S0028), 30153-2.
10. Starkey, N. J.; Jones, K.; Case, R.; Theadom, A.; Barker-Collo, S.; Feigin, V., Post-concussive symptoms after a mild traumatic brain injury during childhood and adolescence. Brain Inj 2018, 32, (5), 617-626.
11. Karelina, K.; Gaier, K. R.; Weil, Z. M., Traumatic brain injuries during development disrupt dopaminergic signaling. Exp Neurol 2017, 297, 110-117.

230
12. Kwasnica, C. M.; Heinemann, A., Coping with traumatic brain injury: representative case studies. Arch Phys Med Rehabil 1994, 75, (4), 384-9.
13. Rabner, J.; Gottlieb, S.; Lazdowsky, L.; LeBel, A., Psychosis following traumatic brain injury and cannabis use in late adolescence. Am J Addict 2016, 25, (2), 91-3.
14. Holdnack, J. A.; Iverson, G. L.; Silverberg, N. D.; Tulsky, D. S.; Heinemann, A. W., NIH toolbox cognition tests following traumatic brain injury: Frequency of low scores. Rehabil Psychol 2017, 62, (4), 474-484.
15. Dillard, C.; Ditchman, N.; Nersessova, K.; Foster, N.; Wehman, P.; West, M.; Riedlinger, B.; Monasterio, E.; Shaw, B.; Neblett, J., Post-concussion symptoms in mild traumatic brain injury: findings from a paediatric outpatient clinic. Disabil Rehabil 2017, 39, (6), 544-550.
16. Kovacs, G. G., Tauopathies. Handb Clin Neurol 2017, 145, 355-368.
17. Pir, G. J.; Choudhary, B.; Mandelkow, E., models of tauopathy. FASEB J 2017, 31, (12), 5137-5148.
18. Irwin, D. J., Tauopathies as Clinicopathological Entities. Parkinsonism Relat Disord 2016, 22, (0 1), S29-33.
19. Aldag, M.; Armstrong, R. C.; Bandak, F.; Bellgowan, P. S. F.; Bentley, T.; Biggerstaff, S.; Caravelli, K.; Cmarik, J.; Crowder, A.; DeGraba, T. J.; Dittmer, T. A.; Ellenbogen, R. G.; Greene, C.; Gupta, R. K.; Hicks, R.; Hoffman, S.; Latta, R. C.; Leggieri, M. J.; Marion, D.; Mazzoli, R.; McCrea, M.; O'Donnell, J.; Packer, M.; Petro, J. B.; Rasmussen, T. E.; Sammons-Jackson, W.; Shoge, R.; Tepe, V.; Tremaine, L. A.; Zheng, J., The Biological Basis of Chronic Traumatic Encephalopathy following Blast Injury: A Literature Review. J Neurotrauma 2017, 34, (S1), S26-S43.
20. Asken, B. M.; Sullan, M. J.; Snyder, A. R.; Houck, Z. M.; Bryant, V. E.; Hizel, L. P.; McLaren, M. E.; Dede, D. E.; Jaffee, M. S.; DeKosky, S. T.; Bauer, R. M., Factors Influencing Clinical Correlates of Chronic Traumatic Encephalopathy (CTE): a Review. Neuropsychol Rev 2016, 26, (4), 340-363.
21. Gaetz, M., The multi-factorial origins of Chronic Traumatic Encephalopathy (CTE) symptomology in post-career athletes: The athlete post-career adjustment (AP-CA) model. Med Hypotheses 2017, 102, 130-143.
22. Kornguth, S.; Rutledge, N.; Perlaza, G.; Bray, J.; Hardin, A., A Proposed Mechanism for Development of CTE Following Concussive Events: Head Impact, Water Hammer Injury, Neurofilament Release, and Autoimmune Processes. Brain Sci 2017, 7, (12).
231
23. McKee, A. C.; Cantu, R. C.; Nowinski, C. J.; Hedley-Whyte, E. T.; Gavett, B. E.; Budson, A. E.; Santini, V. E.; Lee, H. S.; Kubilus, C. A.; Stern, R. A., Chronic traumatic encephalopathy in athletes: progressive tauopathy after repetitive head injury. J Neuropathol Exp Neurol 2009, 68, (7), 709-35.
24. McKee, A. C.; Daneshvar, D. H.; Alvarez, V. E.; Stein, T. D., The neuropathology of sport. Acta Neuropathol 2014, 127, (1), 29-51.
25. McKee, A. C.; Stein, T. D.; Kiernan, P. T.; Alvarez, V. E., The neuropathology of chronic traumatic encephalopathy. Brain Pathol 2015, 25, (3), 350-64.
26. McKee, A. C.; Cairns, N. J.; Dickson, D. W.; Folkerth, R. D.; Keene, C. D.; Litvan, I.; Perl, D. P.; Stein, T. D.; Vonsattel, J. P.; Stewart, W.; Tripodis, Y.; Crary, J. F.; Bieniek, K. F.; Dams-O'Connor, K.; Alvarez, V. E.; Gordon, W. A.; group, T. C., The first NINDS/NIBIB consensus meeting to define neuropathological criteria for the diagnosis of chronic traumatic encephalopathy. Acta Neuropathol 2016, 131, (1), 75-86.
27. Kulbe, J. R.; Hall, E. D., Chronic traumatic encephalopathy-integration of canonical traumatic brain injury secondary injury mechanisms with tau pathology. Prog Neurobiol 2017, 158, 15-44.
28. Sparks, P.; Lawrence, T.; Hinze, S., Neuroimaging in the Diagnosis of Chronic Traumatic Encephalopathy: A Systematic Review. Clin J Sport Med 2017.
29. Asken, B. M.; Sullan, M. J.; DeKosky, S. T.; Jaffee, M. S.; Bauer, R. M., Research Gaps and Controversies in Chronic Traumatic Encephalopathy: A Review. JAMA Neurol 2017, 74, (10), 1255-1262.
30. Perrine, K.; Helcer, J.; Tsiouris, A. J.; Pisapia, D. J.; Stieg, P., The Current Status of Research on Chronic Traumatic Encephalopathy. World Neurosurg 2017, 102, 533-544.
31. Lindsley, C. W., Chronic Traumatic Encephalopathy (CTE): A Brief Historical Overview and Recent Focus on NFL Players. ACS Chem Neurosci 2017, 8, (8), 1629-1631.
32. Andreadis, A., Misregulation of tau alternative splicing in neurodegeneration and dementia. Prog Mol Subcell Biol 2006, 44, 89-107.
33. Greenwood, J. A.; Scott, C. W.; Spreen, R. C.; Caputo, C. B.; Johnson, G. V., Casein kinase II preferentially phosphorylates human tau isoforms containing an amino-terminal insert. Identification of threonine 39 as the primary phosphate acceptor. J Biol Chem 1994, 269, (6), 4373-80.
34. Sabbagh, J. J.; Dickey, C. A., The Metamorphic Nature of the Tau Protein: Dynamic Flexibility Comes at a Cost. Front Neurosci 2016, 10, 3.
232
35. Zabik, N. L.; Imhof, M. M.; Martic-Milne, S., Structural evaluations of tau protein conformation: methodologies and approaches. Biochem Cell Biol 2017, 95, (3), 338-349.
36. Avila, J.; Ulloa, L.; González, J.; Moreno, F.; Díaz-Nido, J., Phosphorylation of microtubule-associated proteins by protein kinase CK2 in neuritogenesis. Cell Mol Biol Res 1994, 40, (5-6), 573-9.
37. Stoothoff, W. H.; Johnson, G. V., Tau phosphorylation: physiological and pathological consequences. Biochim Biophys Acta 2005, 1739, (2-3), 280-97.
38. Ramos-Cejudo, J.; Wisniewski, T.; Marmar, C.; Zetterberg, H.; Blennow, K.; de Leon, M. J.; Fossati, S., Traumatic Brain Injury and Alzheimer's Disease: The Cerebrovascular Link. EBioMedicine 2018.
39. Guo, T.; Noble, W.; Hanger, D. P., Roles of tau protein in health and disease. Acta Neuropathol 2017, 133, (5), 665-704.
40. Ho, Y. S.; Yang, X.; Lau, J. C.; Hung, C. H.; Wuwongse, S.; Zhang, Q.; Wang, J.; Baum, L.; So, K. F.; Chang, R. C., Endoplasmic reticulum stress induces tau pathology and forms a vicious cycle: implication in Alzheimer's disease pathogenesis. J Alzheimers Dis 2012, 28, (4), 839-54.
41. Mietelska-Porowska, A.; Wasik, U.; Goras, M.; Filipek, A.; Niewiadomska, G., Tau Protein Modifications and Interactions: Their Role in Function and Dysfunction. International Journal of Molecular Sciences 2014, 15, (3), 4671-4713.
42. Avila, J.; Jiménez, J. S.; Sayas, C. L.; Bolós, M.; Zabala, J. C.; Rivas, G.; Hernández, F., Tau Structures. Front Aging Neurosci 2016, 8, 262.
43. Mandelkow, E. M.; Mandelkow, E., Biochemistry and cell biology of tau protein in neurofibrillary degeneration. Cold Spring Harb Perspect Med 2012, 2, (7), a006247.
44. Mudher, A.; Colin, M.; Dujardin, S.; Medina, M.; Dewachter, I.; Naini, S. M. A.; Mandelkow, E. M.; Mandelkow, E.; Buée, L.; Goedert, M.; Brion, J. P., What is the evidence that tau pathology spreads through prion-like propagation? Acta Neuropathol Commun 2017, 5, 99.
45. Kadavath, H.; Hofele, R. V.; Biernat, J.; Kumar, S.; Tepper, K.; Urlaub, H.; Mandelkow, E.; Zweckstetter, M., Tau stabilizes microtubules by binding at the interface between tubulin heterodimers. Proc Natl Acad Sci U S A 2015, 112, (24), 7501-6.
46. Mukrasch, M. D.; Bibow, S.; Korukottu, J.; Jeganathan, S.; Biernat, J.; Griesinger, C.; Mandelkow, E.; Zweckstetter, M., Structural Polymorphism of 441-Residue Tau at Single Residue Resolution. PLoS Biol 2009, 7, (2).

233
47. Giannetti, A. M.; Lindwall, G.; Chau, M. F.; Radeke, M. J.; Feinstein, S. C.; Kohlstaedt, L. A., Fibers of tau fragments, but not full length tau, exhibit a cross beta-structure: implications for the formation of paired helical filaments. Protein Sci 2000, 9, (12), 2427-35.
48. Daebel, V.; Chinnathambi, S.; Biernat, J.; Schwalbe, M.; Habenstein, B.; Loquet, A.; Akoury, E.; Tepper, K.; Müller, H.; Baldus, M.; Griesinger, C.; Zweckstetter, M.; Mandelkow, E.; Vijayan, V.; Lange, A., β-Sheet core of tau paired helical filaments revealed by solid-state NMR. J Am Chem Soc 2012, 134, (34), 13982-9.
49. Li, L.; von Bergen, M.; Mandelkow, E. M.; Mandelkow, E., Structure, stability, and aggregation of paired helical filaments from tau protein and FTDP-17 mutants probed by tryptophan scanning mutagenesis. J Biol Chem 2002, 277, (44), 41390-400.
50. Meraz-Rios, M. A.; Lira-De Leon, K. I.; Campos-Pena, V.; De Anda-Hernandez, M. A.; Mena-Lopez, R., Tau oligomers and aggregation in Alzheimer's disease. J Neurochem 2010, 112, (6), 1353-67.
51. von Bergen, M.; Friedhoff, P.; Biernat, J.; Heberle, J.; Mandelkow, E. M.; Mandelkow, E., Assembly of tau protein into Alzheimer paired helical filaments depends on a local sequence motif ((306)VQIVYK(311)) forming beta structure. Proc Natl Acad Sci U S A 2000, 97, (10), 5129-34.
52. Alonso , A.; Zaidi, T.; Novak, M.; Grundke-Iqbal, I.; Iqbal, K., Hyperphosphorylation induces self-assembly of tau into tangles of paired helical filaments/straight filaments. Proc Natl Acad Sci U S A 2001, 98, (12), 6923-8.
53. Lee, V. M.; Brunden, K. R.; Hutton, M.; Trojanowski, J. Q., Developing therapeutic approaches to tau, selected kinases, and related neuronal protein targets. Cold Spring Harb Perspect Med 2011, 1, (1), a006437.
54. Nygaard, H. B., Targeting Fyn Kinase in Alzheimer's Disease. Biol Psychiatry 2018, 83, (4), 369-376.
55. Georgievska, B.; Sandin, J.; Doherty, J.; Mörtberg, A.; Neelissen, J.; Andersson, A.; Gruber, S.; Nilsson, Y.; Schött, P.; Arvidsson, P. I.; Hellberg, S.; Osswald, G.; Berg, S.; Fälting, J.; Bhat, R. V., AZD1080, a novel GSK3 inhibitor, rescues synaptic plasticity deficits in rodent brain and exhibits peripheral target engagement in humans. J Neurochem 2013, 125, (3), 446-56.
56. Engmann, O.; Giese, K. P., Crosstalk between Cdk5 and GSK3β: Implications for Alzheimer's Disease. Frontiers in Molecular Neuroscience 2009, 2, 2.
57. Agarwal-Mawal, A.; Qureshi, H. Y.; Cafferty, P. W.; Yuan, Z.; Han, D.; Lin, R.; Paudel, H. K., 14-3-3 connects glycogen synthase kinase-3 beta to tau within a brain microtubule-associated tau phosphorylation complex. J Biol Chem 2003, 278, (15), 12722-8.
234
58. Paudel, H. K., The regulatory Ser262 of microtubule-associated protein tau is phosphorylated by phosphorylase kinase. J Biol Chem 1997, 272, (3), 1777-85.
59. Mondragón-Rodríguez, S.; Perry, G.; Luna-Muñoz, J.; Acevedo-Aquino, M. C.; Williams, S., Phosphorylation of tau protein at sites Ser(396-404) is one of the earliest events in Alzheimer's disease and Down syndrome. Neuropathol Appl Neurobiol 2014, 40, (2), 121-35.
60. Sengupta, A.; Grundke-Iqbal, I.; Iqbal, K., Regulation of phosphorylation of tau by protein kinases in rat brain. Neurochem Res 2006, 31, (12), 1473-80.
61. Dolan, P. J.; Johnson, G. V., The role of tau kinases in Alzheimer’s disease. Curr Opin Drug Discov Devel 2010, 13, (5), 595-603.
62. Theendakara, V.; Bredesen, D. E.; Rao, R. V., Downregulation of protein phosphatase 2A by apolipoprotein E: Implications for Alzheimer's disease. Mol Cell Neurosci 2017, 83, 83-91.
63. Zheng, M.; Zou, C.; Li, M.; Huang, G.; Gao, Y.; Liu, H., Folic Acid Reduces Tau Phosphorylation by Regulating PP2A Methylation in Streptozotocin-Induced Diabetic Mice. Int J Mol Sci 2017, 18, (4).
64. Iqbal, K.; Liu, F.; Gong, C. X.; Grundke-Iqbal, I., Tau in Alzheimer Disease and Related Tauopathies. Curr Alzheimer Res 2010, 7, (8), 656-64.
65. Kamat, P. K.; Rai, S.; Swarnkar, S.; Shukla, R.; Ali, S.; Najmi, A. K.; Nath, C., Okadaic acid-induced Tau phosphorylation in rat brain: role of NMDA receptor. Neuroscience 2013, 238, 97-113.
66. Jones, N. C.; Nguyen, T.; Corcoran, N. M.; Velakoulis, D.; Chen, T.; Grundy, R.; O'Brien, T. J.; Hovens, C. M., Targeting hyperphosphorylated tau with sodium selenate suppresses seizures in rodent models. Neurobiol Dis 2012, 45, (3), 897-901.
67. Glass, C. K.; Saijo, K.; Winner, B.; Marchetto, M. C.; Gage, F. H., Mechanisms Underlying Inflammation in Neurodegeneration. Cell 2010, 140, (6), 918-34.
68. Augustinack, J. C.; Schneider, A.; Mandelkow, E. M.; Hyman, B. T., Specific tau phosphorylation sites correlate with severity of neuronal cytopathology in Alzheimer's disease. Acta Neuropathol 2002, 103, (1), 26-35.
69. Alonso, A. D.; Di Clerico, J.; Li, B.; Corbo, C. P.; Alaniz, M. E.; Grundke-Iqbal, I.; Iqbal, K., Phosphorylation of tau at Thr212, Thr231, and Ser262 combined causes neurodegeneration. J Biol Chem 2010, 285, (40), 30851-60.
235
70. Buerger, K.; Teipel, S. J.; Zinkowski, R.; Blennow, K.; Arai, H.; Engel, R.; Hofmann-Kiefer, K.; McCulloch, C.; Ptok, U.; Heun, R.; Andreasen, N.; DeBernardis, J.; Kerkman, D.; Moeller, H.; Davies, P.; Hampel, H., CSF tau protein phosphorylated at threonine 231 correlates with cognitive decline in MCI subjects. Neurology 2002, 59, (4), 627-9.
71. Liu, M. C.; Kobeissy, F.; Zheng, W.; Zhang, Z.; Hayes, R. L.; Wang, K. K., Dual vulnerability of tau to calpains and caspase-3 proteolysis under neurotoxic and neurodegenerative conditions. ASN Neuro 2011, 3, (1), e00051.
72. Lasagna-Reeves, C. A.; Castillo-Carranza, D. L.; Sengupta, U.; Clos, A. L.; Jackson, G. R.; Kayed, R., Tau oligomers impair memory and induce synaptic and mitochondrial dysfunction in wild-type mice. Mol Neurodegener 2011, 6, 39.
73. Santacruz, K.; Lewis, J.; Spires, T.; Paulson, J.; Kotilinek, L.; Ingelsson, M.; Guimaraes, A.; DeTure, M.; Ramsden, M.; McGowan, E.; Forster, C.; Yue, M.; Orne, J.; Janus, C.; Mariash, A.; Kuskowski, M.; Hyman, B.; Hutton, M.; Ashe, K. H., Tau suppression in a neurodegenerative mouse model improves memory function. Science 2005, 309, (5733), 476-81.
74. Wojnarowicz, M. W.; Fisher, A. M.; Minaeva, O.; Goldstein, L. E., Considerations for Experimental Animal Models of Concussion, Traumatic Brain Injury, and Chronic Traumatic Encephalopathy—These Matters Matter. Front Neurol 2017, 8.
75. Dong, X.; Wang, Y.; Qin, Z., Molecular mechanisms of excitotoxicity and their relevance to pathogenesis of neurodegenerative diseases. Acta Pharmacol Sin 2009, 30, (4), 379-87.
76. Olivera-Santa Catalina, M.; Caballero-Bermejo, M.; Argent, R.; Alonso, J. C.; Cuenda, A.; Lorenzo, M. J.; Centeno, F., Hyperosmotic Stress Induces Tau Proteolysis by Caspase-3 Activation in SH-SY5Y Cells. J Cell Biochem 2016, 117, (12), 2781-2790.
77. Hampel, H.; Buerger, K.; Zinkowski, R.; Teipel, S. J.; Goernitz, A.; Andreasen, N.; Sjoegren, M.; DeBernardis, J.; Kerkman, D.; Ishiguro, K.; Ohno, H.; Vanmechelen, E.; Vanderstichele, H.; McCulloch, C.; Moller, H. J.; Davies, P.; Blennow, K., Measurement of phosphorylated tau epitopes in the differential diagnosis of Alzheimer disease: a comparative cerebrospinal fluid study. Arch Gen Psychiatry 2004, 61, (1), 95-102.
78. Hampel, H.; Goernitz, A.; Buerger, K., Advances in the development of biomarkers for Alzheimer's disease: from CSF total tau and Abeta(1-42) proteins to phosphorylated tau protein. Brain Res Bull 2003, 61, (3), 243-53.
79. Quinn, J. P.; Corbett, N. J.; Kellett, K. A. B.; Hooper, N. M., Tau Proteolysis in the Pathogenesis of Tauopathies: Neurotoxic Fragments and Novel Biomarkers. J Alzheimers Dis 2018, 63, (1), 13-33.
236
80. Ono, Y.; Sorimachi, H., Calpains — An elaborate proteolytic system. Biochimica et Biophysica Acta (BBA) - Proteins and Proteomics 2012, 1824, (1), 224-236.
81. Zhang, J. Y.; Peng, C.; Shi, H.; Wang, S.; Wang, Q.; Wang, J. Z., Inhibition of autophagy causes tau proteolysis by activating calpain in rat brain. J Alzheimers Dis 2009, 16, (1), 39-47.
82. Warren, M. W.; Zheng, W.; Kobeissy, F. H.; Cheng Liu, M.; Hayes, R. L.; Gold, M. S.; Larner, S. F.; Wang, K. K., Calpain- and caspase-mediated alphaII-spectrin and tau proteolysis in rat cerebrocortical neuronal cultures after ecstasy or methamphetamine exposure. Int J Neuropsychopharmacol 2007, 10, (4), 479-89.
83. Ferreira, A.; Afreen, S., Methods related to studying tau fragmentation. Methods Cell Biol 2017, 141, 245-258.
84. Mondello, S.; Robicsek, S. A.; Gabrielli, A.; Brophy, G. M.; Papa, L.; Tepas, J.; Robertson, C.; Buki, A.; Scharf, D.; Jixiang, M.; Akinyi, L.; Muller, U.; Wang, K. K.; Hayes, R. L., αII-Spectrin Breakdown Products (SBDPs): Diagnosis and Outcome in Severe Traumatic Brain Injury Patients. J Neurotrauma 2010, 27, (7), 1203-13.
85. Pike, B. R.; Flint, J.; Dutta, S.; Johnson, E.; Wang, K. K.; Hayes, R. L., Accumulation of non-erythroid alpha II-spectrin and calpain-cleaved alpha II-spectrin breakdown products in cerebrospinal fluid after traumatic brain injury in rats. J Neurochem 2001, 78, (6), 1297-306.
86. Gu, J.; Jin, N.; Ma, D.; Chu, D.; Iqbal, K.; Gong, C. X.; Liu, F., Calpain I Activation Causes GLUT3 Proteolysis and Downregulation of O-GlcNAcylation in Alzheimer's Disease Brain. J Alzheimers Dis 2018, 62, (4), 1737-1746.
87. Koumura, A.; Nonaka, Y.; Hyakkoku, K.; Oka, T.; Shimazawa, M.; Hozumi, I.; Inuzuka, T.; Hara, H., A novel calpain inhibitor, ((1S)-1((((1S)-1-benzyl-3-cyclopropylamino-2,3-di-oxopropyl)amino)carbonyl)-3-methylbutyl) carbamic acid 5-methoxy-3-oxapentyl ester, protects neuronal cells from cerebral ischemia-induced damage in mice. Neuroscience 2008, 157, (2), 309-18.
88. Kling, A.; Jantos, K.; Mack, H.; Hornberger, W.; Drescher, K.; Nimmrich, V.; Relo, A.; Wicke, K.; Hutchins, C. W.; Lao, Y.; Marsh, K.; Moeller, A., Discovery of Novel and Highly Selective Inhibitors of Calpain for the Treatment of Alzheimer's Disease: 2-(3-Phenyl-1H-pyrazol-1-yl)-nicotinamides. J Med Chem 2017, 60, (16), 7123-7138.
89. Ferreira, A.; Bigio, E. H., Calpain-mediated tau cleavage: a mechanism leading to neurodegeneration shared by multiple tauopathies. Mol Med 2011, 17, (7-8), 676-85.
90. Ishikawa, A.; Tokunaga, M.; Maeda, J.; Minamihisamatsu, T.; Shimojo, M.; Takuwa, H.; Ono, M.; Ni, R.; Hirano, S.; Kuwabara, S.; Ji, B.; Zhang, M. R.; Aoki, I.; Suhara, T.; Higuchi, M.; Sahara, N., In Vivo Visualization of Tau Accumulation, Microglial Activation, and Brain Atrophy in a Mouse Model of Tauopathy rTg4510. J Alzheimers Dis 2018, 61, (3), 1037-1052.

237
91. Manassero, G.; Guglielmotto, M.; Monteleone, D.; Vasciaveo, V.; Butenko, O.; Tamagno, E.; Arancio, O.; Tabaton, M., Dual Mechanism of Toxicity for Extracellular Injection of Tau Oligomers versus Monomers in Human Tau Mice. J Alzheimers Dis 2017, 59, (2), 743-751.
92. Park, S. Y.; Tournell, C.; Sinjoanu, R. C.; Ferreira, A., Caspase-3- and calpain-mediated tau cleavage are differentially prevented by estrogen and testosterone in beta-amyloid-treated hippocampal neurons. Neuroscience 2007, 144, (1), 119-27.
93. Liu, Y.; Wang, Y.; Zhu, G.; Sun, J.; Bi, X.; Baudry, M., A calpain-2 selective inhibitor enhances learning & memory by prolonging ERK activation. Neuropharmacology 2016, 105, 471-477.
94. Kim, H.; Kang, A. Y.; Ko, A. R.; Park, H. C.; So, I.; Park, J. H.; Cheong, H. I.; Hwang, Y. H.; Ahn, C., Calpain-mediated proteolysis of polycystin-1 C-terminus induces JAK2 and ERK signal alterations. Exp Cell Res 2014, 320, (1), 62-8.
95. Kim, H.; Kang, A. Y.; Ko, A. R.; Park, H. C.; So, I.; Park, J. H.; Cheong, H. I.; Hwang, Y. H.; Ahn, C., Calpain-mediated Proteolysis of Polycystin-1 C-terminus Induces JAK2 and ERK signal Alterations. Exp Cell Res 2013.
96. ShahimPashtun; LinemannThomas; InekciDilek; Asser, K.; BlennowKaj; TegnerYelverton; ZetterbergHenrik; HenriksenKim, Serum Tau Fragments Predict Return to Play in Concussed Professional Ice Hockey Players. https://home.liebertpub.com/neu 2016.
97. Gabbita, S. P.; Scheff, S. W.; Menard, R. M.; Roberts, K.; Fugaccia, I.; Zemlan, F. P., Cleaved-tau: a biomarker of neuronal damage after traumatic brain injury. J Neurotrauma 2005, 22, (1), 83-94.
98. Anada, R. P.; Wong, K. T.; Jayapalan, J. J.; Hashim, O. H.; Ganesan, D., Panel of serum protein biomarkers to grade the severity of traumatic brain injury. Electrophoresis 2018.
99. Pandey, S.; Singh, K.; Sharma, V.; Pandey, D.; Jha, R. P.; Rai, S. K.; Chauhan, R. S.; Singh, R., A prospective pilot study on serum cleaved tau protein as a neurological marker in severe traumatic brain injury. Br J Neurosurg 2017, 31, (3), 356-363.
100. Krishnamurthy, P. K.; Mays, J. L.; Bijur, G. N.; Johnson, G. V., Transient oxidative stress in SH-SY5Y human neuroblastoma cells results in caspase dependent and independent cell death and tau proteolysis. J Neurosci Res 2000, 61, (5), 515-23.
101. Rubenstein, R.; Chang, B.; Yue, J. K.; Chiu, A.; Winkler, E. A.; Puccio, A. M.; Diaz-Arrastia, R.; Yuh, E. L.; Mukherjee, P.; Valadka, A. B.; Gordon, W. A.; Okonkwo, D. O.; Davies, P.; Agarwal, S.; Lin, F.; Sarkis, G.; Yadikar, H.; Yang, Z.; Manley, G. T.; Wang, K. K. W.; Cooper, S. R.; Dams-O'Connor, K.; Borrasso, A. J.; Inoue, T.; Maas, A. I. R.; Menon, D. K.; Schnyer, D. M.; Vassar, M. J.; Investigators, a. t. T.-T., Comparing
238
Plasma Phospho Tau, Total Tau, and Phospho Tau-Total Tau Ratio as Acute and Chronic Traumatic Brain Injury Biomarkers. JAMA Neurol 2017, 74, (9), 1063-1072.
102. Mielke, M. M.; Hagen, C. E.; Xu, J.; Chai, X.; Vemuri, P.; Lowe, V. J.; Airey, D. C.; Knopman, D. S.; Roberts, R. O.; Machulda, M. M.; Jack, C. R.; Petersen, R. C.; Dage, J. L., Plasma phospho-tau181 increases with Alzheimer's disease clinical severity and is associated with tau- and amyloid-positron emission tomography. Alzheimers Dement 2018.
103. Massaro, A. N.; Wu, Y. W.; Bammler, T. K.; Comstock, B.; Mathur, A.; McKinstry, R. C.; Chang, T.; Mayock, D. E.; Mulkey, S. B.; Van Meurs, K.; Juul, S., Plasma Biomarkers of Brain Injury in Neonatal Hypoxic-Ischemic Encephalopathy. J Pediatr 2018, 194, 67-75.e1.
104. Panza, F.; Solfrizzi, V.; Seripa, D.; Imbimbo, B. P.; Lozupone, M.; Santamato, A.; Zecca, C.; Barulli, M. R.; Bellomo, A.; Pilotto, A.; Daniele, A.; Greco, A.; Logroscino, G., Tau-Centric Targets and Drugs in Clinical Development for the Treatment of Alzheimer's Disease. Biomed Res Int 2016, 2016.
105. Dallas, D. C.; Guerrero, A.; Parker, E. A.; Robinson, R. C.; Gan, J.; German, J. B.; Barile, D.; Lebrilla, C. B., Current peptidomics: Applications, purification, identification, quantification, and functional analysis. Proteomics 2015, 15, (0), 1026-38.
106. Verhaert, P. D. E. M., The Bright Future of Peptidomics. Methods Mol Biol 2018, 1719, 407-416.
107. Magalhães, B.; Trindade, F.; Barros, A. S.; Klein, J.; Amado, F.; Ferreira, R.; Vitorino, R., Reviewing Mechanistic Peptidomics in Body Fluids Focusing on Proteases. Proteomics 2018, e1800187.
108. Arapidi, G.; Osetrova, M.; Ivanova, O.; Butenko, I.; Saveleva, T.; Pavlovich, P.; Anikanov, N.; Ivanov, V.; Govorun, V., Peptidomics dataset: Blood plasma and serum samples of healthy donors fractionated on a set of chromatography sorbents. Data Brief 2018, 18, 1204-1211.
109. Agyei, D.; Tsopmo, A.; Udenigwe, C. C., Bioinformatics and peptidomics approaches to the discovery and analysis of food-derived bioactive peptides. Anal Bioanal Chem 2018.
110. Kanlaya, R.; Thongboonkerd, V., Quantitative peptidomics of endogenous peptides involved in TGF-β1-induced epithelial mesenchymal transition of renal epithelial cells. Cell Death Discov 2018, 4, 9-15.
111. La Barbera, G.; Capriotti, A. L.; Cavaliere, C.; Ferraris, F.; Montone, C. M.; Piovesana, S.; Zenezini Chiozzi, R.; Laganà, A., Saliva as a source of new phosphopeptide biomarkers: Development of a comprehensive analytical method based on shotgun peptidomics. Talanta 2018, 183, 245-249.
239
112. Li, L.; Andrén, P. E.; Sweedler, J. V., Editorial and Review: 29th ASMS Sanibel Conference on Mass Spectrometry-Peptidomics: Bridging the Gap between Proteomics and Metabolomics by MS. J Am Soc Mass Spectrom 2018, 29, (5), 801-806.
113. Sheng, B.; Larsen, L. B.; Le, T. T.; Zhao, D., Digestibility of Bovine Serum Albumin and Peptidomics of the Digests: Effect of Glycation Derived from α-Dicarbonyl Compounds. Molecules 2018, 23, (4).
114. Sigdel, T. K.; Nicora, C. D.; Qian, W. J.; Sarwal, M. M., Optimization for Peptide Sample Preparation for Urine Peptidomics. Methods Mol Biol 2018, 9-15.
115. Di Meo, A.; Pasic, M. D.; Yousef, G. M., Proteomics and peptidomics: moving toward precision medicine in urological malignancies. Oncotarget 2016, 7, (32), 52460-52474.
116. Betz, B. B.; Jenks, S. J.; Cronshaw, A. D.; Lamont, D. J.; Cairns, C.; Manning, J. R.; Goddard, J.; Webb, D. J.; Mullins, J. J.; Hughes, J.; McLachlan, S.; Strachan, M. W. J.; Price, J. F.; Conway, B. R., Urinary peptidomics in a rodent model of diabetic nephropathy highlights epidermal growth factor as a biomarker for renal deterioration in patients with type 2 diabetes. Kidney Int 2016, 89, (5), 1125-1135.
117. Menschaert, G.; Vandekerckhove, T. T. M.; Baggerman, G.; Schoofs, L.; Luyten, W.; Criekinge, W. V., Peptidomics Coming of Age: A Review of Contributions from a Bioinformatics Angle. 2010.
118. Schrader, M.; Schulz-Knappe, P.; Fricker, L. D., Historical perspective of peptidomics. EuPA Open Proteomics 2014, 3, 171-182.
119. Syka, J. E.; Coon, J. J.; Schroeder, M. J.; Shabanowitz, J.; Hunt, D. F., Peptide and protein sequence analysis by electron transfer dissociation mass spectrometry. Proc Natl Acad Sci U S A 2004, 101, (26), 9528-33.
120. Chiva, C.; Sabido, E., HCD-only fragmentation method balances peptide identification and quantitation of TMT-labeled samples in hybrid linear ion trap/orbitrap mass spectrometers. J Proteomics 2014, 96, 263-70.
121. Scigelova, M.; Makarov, A., Orbitrap mass analyzer--overview and applications in proteomics. Proteomics 2006, 6 Suppl 2, 16-21.
122. Wang, Y.; Mandelkow, E., Tau in physiology and pathology. Nat Rev Neurosci 2016, 17, (1), 5-21.
123. Blennow, K.; Brody, D. L.; Kochanek, P. M.; Levin, H.; McKee, A.; Ribbers, G. M.; Yaffe, K.; Zetterberg, H., Traumatic brain injuries. Nat Rev Dis Primers 2016, 2, 16084.
240
124. Ni, R.; Ji, B.; Ono, M.; Sahara, N.; Zhang, M. R.; Aoki, I.; Nordberg, A.; Suhara, T.; Higuchi, M., Comparative in-vitro and in-vivo quantifications of pathological tau deposits and their association with neurodegeneration in tauopathy mouse models. J Nucl Med 2018.
125. Sahara, N.; Shimojo, M.; Ono, M.; Takuwa, H.; Febo, M.; Higuchi, M.; Suhara, T., Tau Imaging for a Diagnostic Platform of Tauopathy Using the rTg4510 Mouse Line. Front Neurol 2017, 8, 663.
126. Panza, F.; Solfrizzi, V.; Seripa, D.; Imbimbo, B. P.; Lozupone, M.; Santamato, A.; Tortelli, R.; Galizia, I.; Prete, C.; Daniele, A.; Pilotto, A.; Greco, A.; Logroscino, G., Tau-based therapeutics for Alzheimer's disease: active and passive immunotherapy. Immunotherapy 2016, 8, (9), 1119-34.
127. Tolosa, E.; Litvan, I.; Höglinger, G. U.; Burn, D.; Lees, A.; Andrés, M. V.; Gómez-Carrillo, B.; León, T.; Del Ser, T.; Investigators, T., A phase 2 trial of the GSK-3 inhibitor tideglusib in progressive supranuclear palsy. Mov Disord 2014, 29, (4), 470-8.
128. Ludolph, A. C.; Kassubek, J.; Landwehrmeyer, B. G.; Mandelkow, E.; Mandelkow, E. M.; Burn, D. J.; Caparros-Lefebvre, D.; Frey, K. A.; de Yebenes, J. G.; Gasser, T.; Heutink, P.; Höglinger, G.; Jamrozik, Z.; Jellinger, K. A.; Kazantsev, A.; Kretzschmar, H.; Lang, A. E.; Litvan, I.; Lucas, J. J.; McGeer, P. L.; Melquist, S.; Oertel, W.; Otto, M.; Paviour, D.; Reum, T.; Saint-Raymond, A.; Steele, J. C.; Tolnay, M.; Tumani, H.; van Swieten, J. C.; Vanier, M. T.; Vonsattel, J. P.; Wagner, S.; Wszolek, Z. K.; Parkinsonism, R. W. G. f. T. W., Tauopathies with parkinsonism: clinical spectrum, neuropathologic basis, biological markers, and treatment options. Eur J Neurol 2009, 16, (3), 297-309.
129. Tell, V.; Hilgeroth, A., Recent developments of protein kinase inhibitors as potential AD therapeutics. Front Cell Neurosci 2013, 7, 189.
130. Chen, C.; Gu, J.; Basurto-Islas, G.; Jin, N.; Wu, F.; Gong, C. X.; Iqbal, K.; Liu, F., Up-regulation of casein kinase 1ε is involved in tau pathogenesis in Alzheimer's disease. Sci Rep 2017, 7, (1), 13478.
131. Singh, T. J.; Grundke-Iqbal, I.; Iqbal, K., Phosphorylation of tau protein by casein kinase-1 converts it to an abnormal Alzheimer-like state. J Neurochem 1995, 64, (3), 1420-3.
132. Rosenberger, A. F.; Morrema, T. H.; Gerritsen, W. H.; van Haastert, E. S.; Snkhchyan, H.; Hilhorst, R.; Rozemuller, A. J.; Scheltens, P.; van der Vies, S. M.; Hoozemans, J. J., Increased occurrence of protein kinase CK2 in astrocytes in Alzheimer's disease pathology. J Neuroinflammation 2016, 13, 4.
133. Li, C.; Götz, J., Somatodendritic accumulation of Tau in Alzheimer's disease is promoted by Fyn-mediated local protein translation. EMBO J 2017, 36, (21), 3120-3138.
241
134. Liu, W.; Zhao, J.; Lu, G., miR-106b inhibits tau phosphorylation at Tyr18 by targeting Fyn in a model of Alzheimer's disease. Biochem Biophys Res Commun 2016, 478, (2), 852-7.
135. Kaufman, A. C.; Salazar, S. V.; Haas, L. T.; Yang, J.; Kostylev, M. A.; Jeng, A. T.; Robinson, S. A.; Gunther, E. C.; van Dyck, C. H.; Nygaard, H. B.; Strittmatter, S. M., Fyn inhibition rescues established memory and synapse loss in Alzheimer mice. Ann Neurol 2015, 77, (6), 953-71.
136. Chen, Y.; Wang, C.; Hu, M.; Pan, J.; Chen, J.; Duan, P.; Zhai, T.; Ding, J.; Xu, C., Effects of ginkgolide A on okadaic acid-induced tau hyperphosphorylation and the PI3K-Akt signaling pathway in N2a cells. Planta Med 2012, 78, (12), 1337-41.
137. Zhang, Z.; Simpkins, J. W., Okadaic acid induces tau phosphorylation in SH-SY5Y cells in an estrogen-preventable manner. Brain Res 2010, 1345, 176-81.
138. Khélifa, T.; Beck, W. T., Induction of apoptosis by dexrazoxane (ICRF-187) through caspases in the absence of c-jun expression and c-Jun NH2-terminal kinase 1 (JNK1) activation in VM-26-resistant CEM cells. Biochem Pharmacol 1999, 58, (8), 1247-57.
139. Toledo, F. D.; Pérez, L. M.; Basiglio, C. L.; Ochoa, J. E.; Sanchez Pozzi, E. J.; Roma, M. G., The Ca²⁺-calmodulin-Ca²⁺/calmodulin-dependent protein kinase II signaling pathway is involved in oxidative stress-induced mitochondrial permeability transition and apoptosis in isolated rat hepatocytes. Arch Toxicol 2014, 88, (9), 1695-709.
140. Qin, N.; Olcese, R.; Bransby, M.; Lin, T.; Birnbaumer, L., Ca2+-induced inhibition of the cardiac Ca2+ channel depends on calmodulin. Proc Natl Acad Sci U S A 1999, 96, (5), 2435-8.
141. Bhounsule, A. S.; Bhatt, L. K.; Prabhavalkar, K. S.; Oza, M., Cyclin dependent kinase 5: A novel avenue for Alzheimer's disease. Brain Res Bull 2017, 132, 28-38.
142. Schlachetzki, J. C.; Saliba, S. W.; Oliveira, A. C., Studying neurodegenerative diseases in culture models. Rev Bras Psiquiatr 2013, 35 Suppl 2, S92-100.
143. Zhao, L.; Xiao, Y.; Wang, X. L.; Pei, J.; Guan, Z. Z., Original Research: Influence of okadaic acid on hyperphosphorylation of tau and nicotinic acetylcholine receptors in primary neurons. Exp Biol Med (Maywood) 2016, 241, (16), 1825-33.
144. Broetto, N.; Hansen, F.; Brolese, G.; Batassini, C.; Lirio, F.; Galland, F.; Dos Santos, J. P.; Dutra, M. F.; Gonçalves, C. A., Intracerebroventricular administration of okadaic acid induces hippocampal glucose uptake dysfunction and tau phosphorylation. Brain Res Bull 2016, 124, 136-43.
242
145. Hübinger, G.; Geis, S.; LeCorre, S.; Mühlbacher, S.; Gordon, S.; Fracasso, R. P.; Hoffman, F.; Ferrand, S.; Klafki, H. W.; Roder, H. M., Inhibition of PHF-like tau hyperphosphorylation in SH-SY5Y cells and rat brain slices by K252a. J Alzheimers Dis 2008, 13, (3), 281-94.
146. Bretteville, A.; Marcouiller, F.; Julien, C.; El Khoury, N. B.; Petry, F. R.; Poitras, I.; Mouginot, D.; Lévesque, G.; Hébert, S. S.; Planel, E., Hypothermia-induced hyperphosphorylation: a new model to study tau kinase inhibitors. Sci Rep 2012, 2, 480.
147. Lucke-Wold, B. P.; Turner, R. C.; Logsdon, A. F.; Bailes, J. E.; Huber, J. D.; Rosen, C. L., Linking traumatic brain injury to chronic traumatic encephalopathy: identification of potential mechanisms leading to neurofibrillary tangle development. J Neurotrauma 2014, 31, (13), 1129-38.
148. Sarno, S.; Papinutto, E.; Franchin, C.; Bain, J.; Elliott, M.; Meggio, F.; Kazimierczuk, Z.; Orzeszko, A.; Zanotti, G.; Battistutta, R.; Pinna, L. A., ATP site-directed inhibitors of protein kinase CK2: an update. Curr Top Med Chem 2011, 11, (11), 1340-51.
149. Gould, T. D.; Einat, H.; Bhat, R.; Manji, H. K., AR-A014418, a selective GSK-3 inhibitor, produces antidepressant-like effects in the forced swim test. Int J Neuropsychopharmacol 2004, 7, (4), 387-90.
150. Prabhakaran, J.; Zanderigo, F.; Sai, K. K. S.; Rubin-Falcone, H.; Jorgensen, M. J.; Kaplan, J. R.; Mintz, A.; Mann, J. J.; Kumar, J. S. D., Radiosynthesis and in Vivo Evaluation of [ACS Chem Neurosci 2017, 8, (8), 1697-1703.
151. Patrick, C.; Crews, L.; Desplats, P.; Dumaop, W.; Rockenstein, E.; Achim, C. L.; Everall, I. P.; Masliah, E., Increased CDK5 expression in HIV encephalitis contributes to neurodegeneration via tau phosphorylation and is reversed with Roscovitine. Am J Pathol 2011, 178, (4), 1646-61.
152. Kerokoski, P.; Suuronen, T.; Salminen, A.; Soininen, H.; Pirttilä, T., The levels of cdk5 and p35 proteins and tau phosphorylation are reduced during neuronal apoptosis. Biochem Biophys Res Commun 2001, 280, (4), 998-1002.
153. Wei, Y.; Han, C.; Wang, Y.; Wu, B.; Su, T.; Liu, Y.; He, R., Ribosylation triggering Alzheimer's disease-like Tau hyperphosphorylation via activation of CaMKII. Aging Cell 2015, 14, (5), 754-63.
154. Zhang, J.; Li, H.; Zhou, T.; Zhou, J.; Herrup, K., Cdk5 levels oscillate during the neuronal cell cycle: Cdh1 ubiquitination triggers proteosome-dependent degradation during S-phase. J Biol Chem 2012, 287, (31), 25985-94.
155. Bennett, P. C.; Zhao, W.; Ng, K. T., Concentration-dependent effects of protein phosphatase (PP) inhibitors implicate PP1 and PP2A in different stages of memory formation. Neurobiol Learn Mem 2001, 75, (1), 91-110.
243
156. Cohen, P.; Klumpp, S.; Schelling, D. L., An improved procedure for identifying and quantitating protein phosphatases in mammalian tissues. FEBS Lett 1989, 250, (2), 596-600.
157. Handschumacher, R. E.; Harding, M. W.; Rice, J.; Drugge, R. J.; Speicher, D. W., Cyclophilin: a specific cytosolic binding protein for cyclosporin A. Science 1984, 226, (4674), 544-7.
158. Groblewski, G. E.; Wagner, A. C.; Williams, J. A., Cyclosporin A inhibits Ca2+/calmodulin-dependent protein phosphatase and secretion in pancreatic acinar cells. J Biol Chem 1994, 269, (21), 15111-7.
159. Bhat, R.; Xue, Y.; Berg, S.; Hellberg, S.; Ormo, M.; Nilsson, Y.; Radesater, A. C.; Jerning, E.; Markgren, P. O.; Borgegard, T.; Nylof, M.; Gimenez-Cassina, A.; Hernandez, F.; Lucas, J. J.; Diaz-Nido, J.; Avila, J., Structural insights and biological effects of glycogen synthase kinase 3-specific inhibitor AR-A014418. J Biol Chem 2003, 278, (46), 45937-45.
160. Prabhakaran, J.; Zanderigo, F.; Solingapuram Sai, K. K.; Rubin-Falcone, H.; Jorgensen, M. J.; Kaplan, J. R.; Mintz, A.; Mann, J. J.; Dileep Kumar, J. S., Radiosynthesis and in Vivo Evaluation of [11C]A1070722, a High Affinity GSK-3 PET Tracer in Primate Brain. ACS Chem Neurosci 2017, 8, (8), 1697-703.
161. Chang, Y. M.; Bai, L.; Liu, S.; Yang, J. C.; Kung, H. J.; Evans, C. P., Src family kinase oncogenic potential and pathways in prostate cancer as revealed by AZD0530. Oncogene 2008, 27, (49), 6365-75.
162. Green, T. P.; Fennell, M.; Whittaker, R.; Curwen, J.; Jacobs, V.; Allen, J.; Logie, A.; Hargreaves, J.; Hickinson, D. M.; Wilkinson, R. W.; Elvin, P.; Boyer, B.; Carragher, N.; Ple, P. A.; Bermingham, A.; Holdgate, G. A.; Ward, W. H.; Hennequin, L. F.; Davies, B. R.; Costello, G. F., Preclinical anticancer activity of the potent, oral Src inhibitor AZD0530. Mol Oncol 2009, 3, (3), 248-61.
163. Kase, H.; Iwahashi, K.; Matsuda, Y., K-252a, a potent inhibitor of protein kinase C from microbial origin. J Antibiot (Tokyo) 1986, 39, (8), 1059-65.
164. Ruegg, U. T.; Burgess, G. M., Staurosporine, K-252 and UCN-01: potent but nonspecific inhibitors of protein kinases. Trends Pharmacol Sci 1989, 10, (6), 218-20.
165. Orena, S. J.; Torchia, A. J.; Garofalo, R. S., Inhibition of glycogen-synthase kinase 3 stimulates glycogen synthase and glucose transport by distinct mechanisms in 3T3-L1 adipocytes. J Biol Chem 2000, 275, (21), 15765-72.
166. Murray, M. M.; Bui, T.; Smith, M.; Bagheri-Yarmand, R.; Wingate, H.; Hunt, K. K.; Keyomarsi, K., Staurosporine is chemoprotective by inducing G1 arrest in a Chk1- and pRb-dependent manner. Carcinogenesis 2013, 34, (10), 2244-52.
244
167. Sarno, S.; Reddy, H.; Meggio, F.; Ruzzene, M.; Davies, S. P.; Donella-Deana, A.; Shugar, D.; Pinna, L. A., Selectivity of 4,5,6,7-tetrabromobenzotriazole, an ATP site-directed inhibitor of protein kinase CK2 ('casein kinase-2'). FEBS Lett 2001, 496, (1), 44-8.
168. Chao, T. S.; Byron, K. L.; Lee, K. M.; Villereal, M.; Rosner, M. R., Activation of MAP kinases by calcium-dependent and calcium-independent pathways. Stimulation by thapsigargin and epidermal growth factor. J Biol Chem 1992, 267, (28), 19876-83.
169. Segura-Egea, J. J.; Jimenez-Rubio, A.; Rios-Santos, J. V.; Velasco-Ortega, E.; Calvo-Gutierrez, J. R., In vitro inhibitory effect of EGTA on macrophage adhesion: endodontic implications. J Endod 2003, 29, (3), 211-3.
170. Nakajima, E.; Hammond, K. B.; Rosales, J. L.; Shearer, T. R.; Azuma, M., Calpain, Not Caspase, Is the Causative Protease for Hypoxic Damage in Cultured Monkey Retinal Cells. Invest Ophthalmol Vis Sci 2011, 52, (10), 7059-67.
171. Krakauer, T., Caspase inhibitors attenuate superantigen-induced inflammatory cytokines, chemokines, and T-cell proliferation. Clin Diagn Lab Immunol 2004, 11, (3), 621-4.
172. Lee, G.; Leugers, C. J., Tau and Tauopathies. Prog Mol Biol Transl Sci 2012, 107, 263-93.
173. Ferreira, A., Calpain dysregulation in Alzheimer's disease. ISRN Biochem 2012, 2012, 728571.
174. Siman, R.; Baudry, M.; Lynch, G., Brain fodrin: substrate for calpain I, an endogenous calcium-activated protease. Proc Natl Acad Sci U S A 1984, 81, (11), 3572-6.
175. Park, S. Y.; Ferreira, A., The Generation of a 17 kDa Neurotoxic Fragment: An Alternative Mechanism by which Tau Mediates β-Amyloid-Induced Neurodegeneration. J Neurosci 2005, 25, (22), 5365-75.
176. Kurbatskaya, K.; Phillips, E. C.; Croft, C. L.; Dentoni, G.; Hughes, M. M.; Wade, M. A.; Al-Sarraj, S.; Troakes, C.; O'Neill, M. J.; Perez-Nievas, B. G.; Hanger, D. P.; Noble, W., Upregulation of calpain activity precedes tau phosphorylation and loss of synaptic proteins in Alzheimer's disease brain. Acta Neuropathol Commun 2016, 4, 34.
177. Reifert, J.; Hartung-Cranston, D.; Feinstein, S. C., Amyloid beta-mediated cell death of cultured hippocampal neurons reveals extensive Tau fragmentation without increased full-length tau phosphorylation. J Biol Chem 2011, 286, (23), 20797-811.
178. Qi, H.; Prabakaran, S.; Cantrelle, F. X.; Chambraud, B.; Gunawardena, J.; Lippens, G.; Landrieu, I., Characterization of Neuronal Tau Protein as a Target of Extracellular Signal-regulated Kinase*. J Biol Chem 2016, 291, (14), 7742-53.

245
179. Gendron, T. F.; Petrucelli, L., The role of tau in neurodegeneration. Mol Neurodegener 2009, 4, 13-17.
180. Favre, B.; Turowski, P.; Hemmings, B. A., Differential inhibition and posttranslational modification of protein phosphatase 1 and 2A in MCF7 cells treated with calyculin-A, okadaic acid, and tautomycin. J Biol Chem 1997, 272, (21), 13856-63.
181. Lee, S.; Shea, T. B., Regulation of tau proteolysis by phosphatases. Brain Res 2013, 1495, 30-6.
182. Ozaki, H.; Ishihara, H.; Kohama, K.; Nonomura, Y.; Shibata, S.; Karaki, H., Calcium-independent phosphorylation of smooth muscle myosin light chain by okadaic acid isolated from black sponge (Halichondria okadai). J Pharmacol Exp Ther 1987, 243, (3), 1167-73.
183. Bialojan, C.; Takai, A., Inhibitory effect of a marine-sponge toxin, okadaic acid, on protein phosphatases. Specificity and kinetics. Biochem J 1988, 256, (1), 283-90.
184. Manguy, J.; Jehl, P.; Dillon, E. T.; Davey, N. E.; Shields, D. C.; Holton, T. A., Peptigram: A Web-Based Application for Peptidomics Data Visualization. J Proteome Res 2017, 16, (2), 712-719.
185. Dowling, P.; Clynes, M., Conditioned media from cell lines: a complementary model to clinical specimens for the discovery of disease-specific biomarkers. Proteomics 2011, 11, (4), 794-804.
186. Prins, M.; Greco, T.; Alexander, D.; Giza, C. C., The pathophysiology of traumatic brain injury at a glance. Dis Model Mech 2013, 6, (6), 1307-15.
187. Weber, J. T., Altered Calcium Signaling Following Traumatic Brain Injury. Front Pharmacol 2012, 3.
188. McKee, A. C.; Daneshvar, D. H., The neuropathology of traumatic brain injury. Handb Clin Neurol 2015, 127, 45-66.
189. Opreanu, R. C.; Kuhn, D.; Basson, M. D., The Influence of Alcohol on Mortality in Traumatic Brain Injury. J Am Coll Surg 2010, 210, (6).
190. Xiong, Y.; Mahmood, A.; Chopp, M., Animal models of traumatic brain injury. Nat Rev Neurosci 2013, 14, (2), 128-42.
191. Osier, N.; Dixon, C. E., The Controlled Cortical Impact Model of Experimental Brain Trauma: Overview, Research Applications, and Protocol. Methods Mol Biol 2016, 1462, 177-92.
192. Chodobski, A.; Zink, B. J.; Szmydynger-Chodobska, J., Blood-brain barrier pathophysiology in traumatic brain injury. Transl Stroke Res 2011, 2, (4), 492-516.

246
193. Turtzo, L. C.; Budde, M. D.; Gold, E. M.; Lewis, B. K.; Janes, L.; Yarnell, A.; Grunberg, N. E.; Watson, W.; Frank, J. A., The Evolution of Traumatic Brain Injury in a Rat Focal Contusion Model. NMR Biomed 2013, 26, (4), 468-79.
194. Osier, N. D.; Dixon, C. E., The Controlled Cortical Impact Model: Applications, Considerations for Researchers, and Future Directions. Front Neurol 2016, 7-10.
195. Andorfer, C.; Kress, Y.; Espinoza, M.; de Silva, R.; Tucker, K. L.; Barde, Y. A.; Duff, K.; Davies, P., Hyperphosphorylation and aggregation of tau in mice expressing normal human tau isoforms. J Neurochem 2003, 86, (3), 582-90.
196. Duff, K.; Knight, H.; Refolo, L. M.; Sanders, S.; Yu, X.; Picciano, M.; Malester, B.; Hutton, M.; Adamson, J.; Goedert, M.; Burki, K.; Davies, P., Characterization of pathology in transgenic mice over-expressing human genomic and cDNA tau transgenes. Neurobiol Dis 2000, 7, (2), 87-98.
197. Tucker, K. L.; Meyer, M.; Barde, Y. A., Neurotrophins are required for nerve growth during development. Nat Neurosci 2001, 4, (1), 29-37.
198. Andorfer, C.; Acker, C. M.; Kress, Y.; Hof, P. R.; Duff, K.; Davies, P., Cell-cycle reentry and cell death in transgenic mice expressing nonmutant human tau isoforms. J Neurosci 2005, 25, (22), 5446-54.
199. Kitazawa, M.; Medeiros, R.; LaFerla, F. M., Transgenic Mouse Models of Alzheimer Disease: Developing a Better Model as a Tool for Therapeutic Interventions. Curr Pharm Des 2012, 18, (8), 1131-47.
200. Rubenstein, R.; Chang, B.; Grinkina, N.; Drummond, E.; Davies, P.; Ruditzky, M.; Sharma, D.; Wang, K.; Wisniewski, T., Tau phosphorylation induced by severe closed head traumatic brain injury is linked to the cellular prion protein. Acta Neuropathol Commun 2017, 5.
201. Hawkins, B. E.; Krishnamurthy, S.; Castillo-Carranza, D. L.; Sengupta, U.; Prough, D. S.; Jackson, G. R.; DeWitt, D. S.; Kayed, R., Rapid Accumulation of Endogenous Tau Oligomers in a Rat Model of Traumatic Brain Injury: POSSIBLE LINK BETWEEN TRAUMATIC BRAIN INJURY AND SPORADIC TAUOPATHIES*. J Biol Chem 2013, 288, (23), 17042-50.
202. Götz, J.; Gladbach, A.; Pennanen, L.; van Eersel, J.; Schild, A.; David, D.; Ittner, L. M., Animal models reveal role for tau phosphorylation in human disease. Biochimica et Biophysica Acta (BBA) - Molecular Basis of Disease 2010, 1802, (10), 860-871.
203. Moszczynski, A. J.; Strong, W.; Xu, K.; McKee, A.; Brown, A.; Strong, M. J., Pathologic Thr175 tau phosphorylation in CTE and CTE with ALS. Neurology 2018, 90, (5), e380-7.
247
204. Nakamura, K.; Greenwood, A.; Binder, L.; Bigio, E. H.; Denial, S.; Nicholson, L.; Zhou, X. Z.; Lu, K. P., Proline Isomer-Specific Antibodies Reveal the Early Pathogenic Tau Conformation in Alzheimer's Disease. Cell 2012, 149, (1), 232-44.
205. Liu, S.; Yin, F.; Zhang, J.; Qian, Y., The role of calpains in traumatic brain injury. Brain Inj 2014, 28, (2), 133-7.
206. Holtta, M.; Zetterberg, H.; Mirgorodskaya, E.; Mattsson, N.; Blennow, K.; Gobom, J., Peptidome analysis of cerebrospinal fluid by LC-MALDI MS. PLoS One 2012, 7, (8), e42555.
207. Khoonsari, P. E.; Häggmark, A.; Lönnberg, M.; Mikus, M.; Kilander, L.; Lannfelt, L.; Bergquist, J.; Ingelsson, M.; Nilsson, P.; Kultima, K.; Shevchenko, G., Analysis of the Cerebrospinal Fluid Proteome in Alzheimer's Disease. PLoS One 2016, 11, (3).
208. Kim, B.; Backus, C.; Oh, S.; Feldman, E. L., Hyperglycemia-Induced Tau Cleavage In Vitro And In Vivo: A Possible Link Between Diabetes And Alzheimer’s Disease. J Alzheimers Dis 2013, 34, (3), 727-39.
209. Matsumoto, S. E.; Motoi, Y.; Ishiguro, K.; Tabira, T.; Kametani, F.; Hasegawa, M.; Hattori, N., The twenty-four KDa C-terminal tau fragment increases with aging in tauopathy mice: implications of prion-like properties. Hum Mol Genet 2015, 24, (22), 6403-16.
210. Park, S. Y.; Ferreira, A., The generation of a 17 kDa neurotoxic fragment: an alternative mechanism by which tau mediates beta-amyloid-induced neurodegeneration. J Neurosci 2005, 25, (22), 5365-75.
211. Gamblin, T. C.; Chen, F.; Zambrano, A.; Abraha, A.; Lagalwar, S.; Guillozet, A. L.; Lu, M.; Fu, Y.; Garcia-Sierra, F.; LaPointe, N.; Miller, R.; Berry, R. W.; Binder, L. I.; Cryns, V. L., Caspase cleavage of tau: linking amyloid and neurofibrillary tangles in Alzheimer's disease. Proc Natl Acad Sci U S A 2003, 100, (17), 10032-7.
212. Dolan, P. J.; Johnson, G. V. W., A Caspase Cleaved Form of Tau Is Preferentially Degraded through the Autophagy Pathway*. J Biol Chem 2010, 285, (29), 21978-87.
213. Flores-Rodriguez, P.; Ontiveros-Torres, M. A.; Cardenas-Aguayo, M. C.; Luna-Arias, J. P.; Meraz-Rios, M. A.; Viramontes-Pintos, A.; Harrington, C. R.; Wischik, C. M.; Mena, R.; Floran-Garduno, B.; Luna-Munoz, J., The relationship between truncation and phosphorylation at the C-terminus of tau protein in the paired helical filaments of Alzheimer's disease. Front Neurosci 2015, 9, 33.
214. Mondragon-Rodriguez, S.; Mena, R.; Binder, L. I.; Smith, M. A.; Perry, G.; Garcia-Sierra, F., Conformational changes and cleavage of tau in Pick bodies parallel the early processing of tau found in Alzheimer pathology. Neuropathol Appl Neurobiol 2008, 34, (1), 62-75.
248
215. Jarero-Basulto, J. J.; Luna-Munoz, J.; Mena, R.; Kristofikova, Z.; Ripova, D.; Perry, G.; Binder, L. I.; Garcia-Sierra, F., Proteolytic cleavage of polymeric tau protein by caspase-3: implications for Alzheimer disease. J Neuropathol Exp Neurol 2013, 72, (12), 1145-61.
216. Garg, S.; Timm, T.; Mandelkow, E. M.; Mandelkow, E.; Wang, Y., Cleavage of Tau by calpain in Alzheimer's disease: the quest for the toxic 17 kD fragment. Neurobiol Aging 2011, 32, (1), 1-14.
217. Hanger, D. P.; Byers, H. L.; Wray, S.; Leung, K. Y.; Saxton, M. J.; Seereeram, A.; Reynolds, C. H.; Ward, M. A.; Anderton, B. H., Novel phosphorylation sites in tau from Alzheimer brain support a role for casein kinase 1 in disease pathogenesis. J Biol Chem 2007, 282, (32), 23645-54.
218. Jicha, G. A.; O'Donnell, A.; Weaver, C.; Angeletti, R.; Davies, P., Hierarchical phosphorylation of recombinant tau by the paired-helical filament-associated protein kinase is dependent on cyclic AMP-dependent protein kinase. J Neurochem 1999, 72, (1), 214-24.
219. Agoston, D. V.; Shutes-David, A.; Peskind, E. R., Biofluid biomarkers of traumatic brain injury. Brain Inj 2017, 31, (9), 1195-1203.
220. Kawata, K.; Liu, C. Y.; Merkel, S. F.; Ramirez, S. H.; Tierney, R. T.; Langford, D., Blood biomarkers for brain injury: What are we measuring? Neurosci Biobehav Rev 2016, 68, 460-73.
221. Zetterberg, H.; Smith, D. H.; Blennow, K., Biomarkers of mild traumatic brain injury in cerebrospinal fluid and blood. Nat Rev Neurol 2013, 9, (4), 201-10.
222. Matsumae, M.; Sato, O.; Hirayama, A.; Hayashi, N.; Takizawa, K.; Atsumi, H.; Sorimachi, T., Research into the Physiology of Cerebrospinal Fluid Reaches a New Horizon: Intimate Exchange between Cerebrospinal Fluid and Interstitial Fluid May Contribute to Maintenance of Homeostasis in the Central Nervous System. Neurol Med Chir (Tokyo) 2016, 56, (7), 416-41.
223. Huff, T.; Dulebohn, S. C., Neuroanatomy, Cerebrospinal Fluid. StatPearls Publishing: 2017.
224. Blennow, K.; Dubois, B.; Fagan, A. M.; Lewczuk, P.; de Leon, M. J.; Hampel, H., Clinical utility of cerebrospinal fluid biomarkers in the diagnosis of early Alzheimer’s disease. Alzheimers Dement 2015, 11, (1), 58-69.
225. Niemantsverdriet, E.; Valckx, S.; Bjerke, M.; Engelborghs, S., Alzheimer’s disease CSF biomarkers: clinical indications and rational use. In Acta Neurol Belg, 2017; Vol. 117, pp 591-602.
249
226. Pan, C.; Korff, A.; Galasko, D.; Ginghina, C.; Peskind, E.; Li, G.; Quinn, J.; Montine, T. J.; Cain, K.; Shi, M.; Zhang, J., Diagnostic values of cerebrospinal fluid t-tau and Aβ42 using Meso Scale Discovery assays for Alzheimer’s disease. J Alzheimers Dis 2015, 45, (3), 709-19.
227. Fagan, A. M.; Holtzman, D. M., Cerebrospinal fluid biomarkers of Alzheimer’s disease. Biomark Med 2010, 4, (1), 51-63.
228. Caudle, W. M.; Pan, S.; Shi, M.; Quinn, T.; Hoekstra, J.; Beyer, R. P.; Montine, T. J.; Zhang, J., Proteomic identification of proteins in the human brain: Towards a more comprehensive understanding of neurodegenerative disease. Proteomics Clin Appl 2008, 2, (10-11), 1484-97.
229. Shi, M.; Caudle, W. M.; Zhang, J., Biomarker Discovery in Neurodegenerative Diseases: A Proteomic Approach. Neurobiol Dis 2009, 35, (2), 157-64.
230. Ranganathan, S.; Williams, E.; Ganchev, P.; Gopalakrishnan, V.; Lacomis, D.; Urbinelli, L.; Newhall, K.; Cudkowicz, M. E.; Brown, R. H., Jr.; Bowser, R., Proteomic profiling of cerebrospinal fluid identifies biomarkers for amyotrophic lateral sclerosis. J Neurochem 2005, 95, (5), 1461-71.
231. Robertson, C. S. Effects of Erythropoietin on Cerebral Vascular Dysfunction and Anemia in Traumatic Brain Injury - Full Text View - ClinicalTrials.gov. https://clinicaltrials.gov/ct2/show/NCT00313716
232. Franz, G.; Beer, R.; Kampfl, A.; Engelhardt, K.; Schmutzhard, E.; Ulmer, H.; Deisenhammer, F., Amyloid beta 1-42 and tau in cerebrospinal fluid after severe traumatic brain injury. Neurology 2003, 60, (9), 1457-61.
233. Bhaskar, K.; Hobbs, G. A.; Yen, S. H.; Lee, G., Tyrosine phosphorylation of tau accompanies disease progression in transgenic mouse models of tauopathy. Neuropathol Appl Neurobiol 2010, 36, (6), 462-77.
234. Barthélemy, N. R.; Fenaille, F.; Hirtz, C.; Sergeant, N.; Schraen-Maschke, S.; Vialaret, J.; Buée, L.; Gabelle, A.; Junot, C.; Lehmann, S.; Becher, F., Tau Protein Quantification in Human Cerebrospinal Fluid by Targeted Mass Spectrometry at High Sequence Coverage Provides Insights into Its Primary Structure Heterogeneity. J Proteome Res 2016, 15, (2), 667-76.
250
BIOGRAPHICAL SKETCH
Hamad Yadikar was born in Kuwait in 1986 as the second oldest child to parents
Ahmad Yadikar and Fadila Behbehani. Hamad discovered his interest in science during
his undergraduate education when he attended his lab in biochemistry at Kuwait
University, under the supervision of Professor Jasim Al-Hasan. He worked on a
research project later with Dr. Amal Al-Saffar in studying antioxidant effects of camel
milk on streptozoan-induced diabetic rats using immunohistochemical approaches.
Hamad graduated from Kuwait University College of Science, Department of Biological
Sciences in 2009 with a Bachelor of Science in biochemistry.
Hamad’s later went on to pursue his master’s degree in the medical-biochemistry
field at the faculty of Medicine studying antioxidant effect of manganese
metalloporphyrin coupled with natural reducing agents on prokaryotic, eukaryotic and
mammalian systems. His mentor, Professor Ludmil Benov, was responsible for
supervising his research project. He obtained his master’s degree of Medical Science
from the college of Medicine majoring in biochemistry in 2013. After graduation, he
worked for one year at the forensic biochemistry lab in Kuwait where he was first
introduced to mass spectrometry and to the field of proteomics.
Hamad joined the Yost Research group and Dr. Kevin Wang team in McKnight
Brain Institute at UF in fall of 2015 and received his Ph.D. in chemistry in December
2018. During that time, Hamad mentored undergraduate students through the UF
summer program and four Wang group undergraduates in neuropeptidomics.