
Neural Models of Motion Integration ... - CiteSeerX
33
Boston University OpenBU http://open.bu.edu Cognitive & Neural Systems CAS/CNS Technical Reports 2007-09 Neural Models of Motion Integration, Segmentation, and Probablistic Decision-Making Grossberg, Stephen Boston University Center for Adaptive Systems and Department of Cognitive and Neural Systems http://hdl.handle.net/2144/1952 Boston University
-
Upload
khangminh22 -
Category
Documents
-
view
4 -
download
0
Transcript of Neural Models of Motion Integration ... - CiteSeerX
Boston University
OpenBU http://open.bu.edu
Cognitive & Neural Systems CAS/CNS Technical Reports
2007-09
Neural Models of Motion
Integration, Segmentation, and
Probablistic Decision-Making
Grossberg, Stephen
Boston University Center for Adaptive Systems and Department of Cognitive and
Neural Systems
http://hdl.handle.net/2144/1952
Boston University
Neural models of motion integration, segmentation, and probabilistic decision-making
Stephen Grossberg
Department of Cognitive and Neural Systems
Center for Adaptive Systems and
Center of Excellence for Learning in Education, Science, and Technology Boston University
677 Beacon Street, Boston, MA 02215
Submitted September, 2007 CAS/CNS Technical Report 2007-014
Correspondence should be addressed to: Professor Stephen Grossberg
Department of Cognitive and Neural Systems Boston University
677 Beacon Street, Boston, MA 02215 email: [email protected] fax: 617-353-7755
Keywords: motion integration, motion segmentation, motion capture, decision-making, aperture problem, feature tracking, formotion, complementary computing, V1, V2, MT, MST, LIP, neural network
Acknowledgements: S. Grossberg was supported in part by the National Science Foundation (NSF SBE-0354378) and the Office of Naval Research (ONR N00014-01-1-0624). Thanks to Megan Johnson for her expert help in preparing the manuscript.
Copyright © 2007 Permission to copy without fee all or part of this material is granted provided that: 1. The copies are not made or distributed for direct commercial advantage; 2. the report title, author, document number, and release date appear, and notice is given that copying is by permission of the BOSTON UNIVERSITY CENTER FOR ADAPTIVE SYSTEMS AND DEPARTMENT OF COGNITIVE AND NEURAL SYSTEMS. To copy otherwise, or to republish, requires a fee and / or special permission.
1
Abstract
What brain mechanisms carry out motion integration and segmentation processes that compute unambiguous global motion percepts from ambiguous local motion signals? Consider, for example, a deer running at variable speeds behind forest cover. The forest cover is an occluder that creates apertures through which fragments of the deer’s motion signals are intermittently experienced. The brain coherently groups these fragments into a trackable percept of the deer and its trajectory. Form and motion processes are needed to accomplish this using feedforward and feedback interactions both within and across cortical processing streams. All the cortical areas V1, V2, MT, and MST are involved in these interactions. Figure-ground processes in the form stream through V2, such as the separation of occluding boundaries of the forest cover from boundaries of the deer, select the motion signals which determine global object motion percepts in the motion stream through MT. Sparse, but unambiguous, feature tracking signals are amplified before they propagate across position and are integrated with far more numerous ambiguous motion signals. Figure-ground and integration processes together determine the global percept. A neural model predicts the processing stages that embody these form and motion interactions. Model concepts and data are summarized about motion grouping across apertures in response to a wide variety of displays, and probabilistic decision making in parietal cortex in response to random dot displays.
2
Introduction: The Interdependence of Motion Integration and Segmentation
Aperture Problem and Feature Tracking Signals. Visual motion perception solves the two complementary problems of motion integration and of motion segmentation. The former joins nearby motion signals into a single object, while the latter keeps them separate as belonging to different objects. Wallach (1935; translated by Wuerger, Shapley and Rubin, 1996) first showed that the motion of a featureless line seen behind a circular aperture is perceptually ambiguous: No matter what may be the real direction of motion, the perceived direction is perpendicular to the orientation of the line. This phenomenon was called the aperture problem by Marr and Ullman (1981). The aperture problem is faced by any localized neural motion sensor, such as a neuron in the early visual pathway, which responds to a moving local contour through an aperture-like receptive field. Only when the contour within an aperture contains features, such as line terminators, object corners, or high contrast blobs or dots, can a local motion detector accurately measure the direction and velocity of motion (Shimojo, Silverman and Nakayama, 1989.
These problems become most challenging when an object moves behind multiple occluders. Although the various object parts are then segmented by occluders, the visual system can often integrate these parts into a percept of coherent object motion that crosses the occluders. Studying conditions such as these under which the visual system can and cannot accomplish correct segmentation and integration provides important cues to the processes that are used by the visual system to create object motion percepts during normal viewing conditions.
To solve the interlinked problems of motion integration and segmentation, the visual system uses the relatively few unambiguous motion signals arising from image features, called feature tracking signals, to select the ambiguous motion signals that are consistent with them, while suppressing the more numerous ambiguous signals that are inconsistent with them. In addition, the visual system uses contextual interactions to compute a consistent motion direction and velocity from arrays of ambiguous motion signals when the scene does not include any unambiguous feature tracking signals. A particular challenge is to explain how motion percepts can change from ones of integration to segmentation in response to small changes in object or contextual cues.
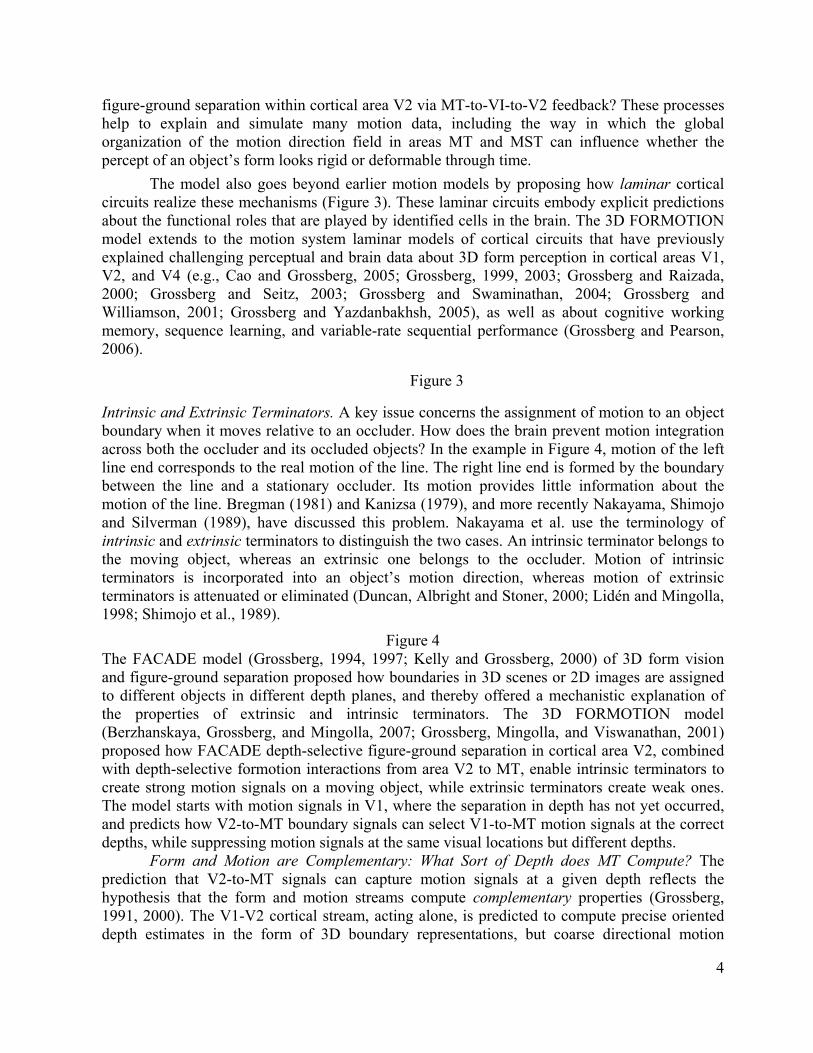
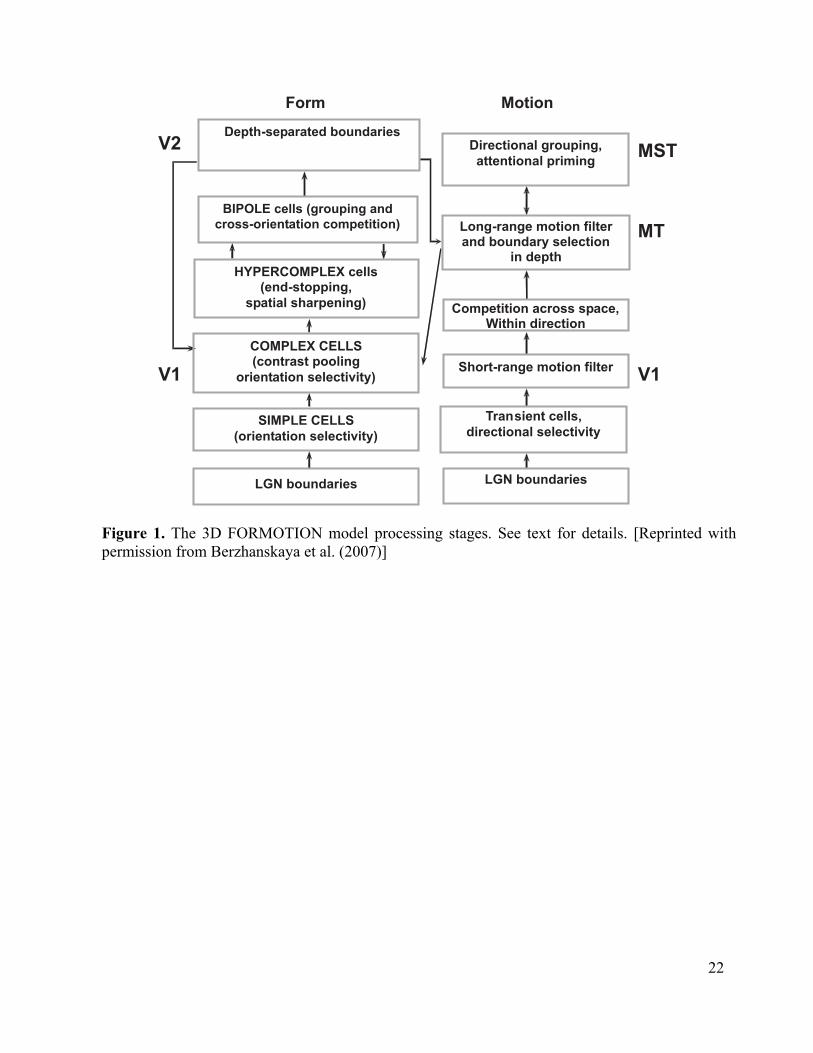
This chapter summarizes efforts to develop a neural model of the cortical form and motion processes that clarify how such motion integration and segmentation processes occur (Figure 1). This 3D FORMOTION model has been progressively developed over the years to explain and predict an ever-broadening set of data about motion perception; e.g., Baloch and Grossberg (1997), Berzhanskaya et al. (2007), Baloch et al. (1999), Chey, Grossberg, and Mingolla (1997, 1998), Grossberg et al. (2001), and Grossberg and Rudd (1989, 1992). Comparisons with related models are found in these archival articles.
Neurophysiological Support for Predicted Aperture Problem Solution. In addition to model explanations of known data, the model has predicted data that were subsequently reported. In particular, Chey, Grossberg, and Mingolla (1997) explained how feature tracking estimates can gradually propagate across space to capture consistent motion directional signals, while suppressing inconsistent ones, in cortical area MT. Such motion capture was predicted to be a key step in solving the aperture problem. Pack and Born (2001) reported neurophysiological data that directly support this prediction. As simulated in the model, MT neurons initially respond primarily to the component of motion perpendicular to a contour's orientation, but over a period
3
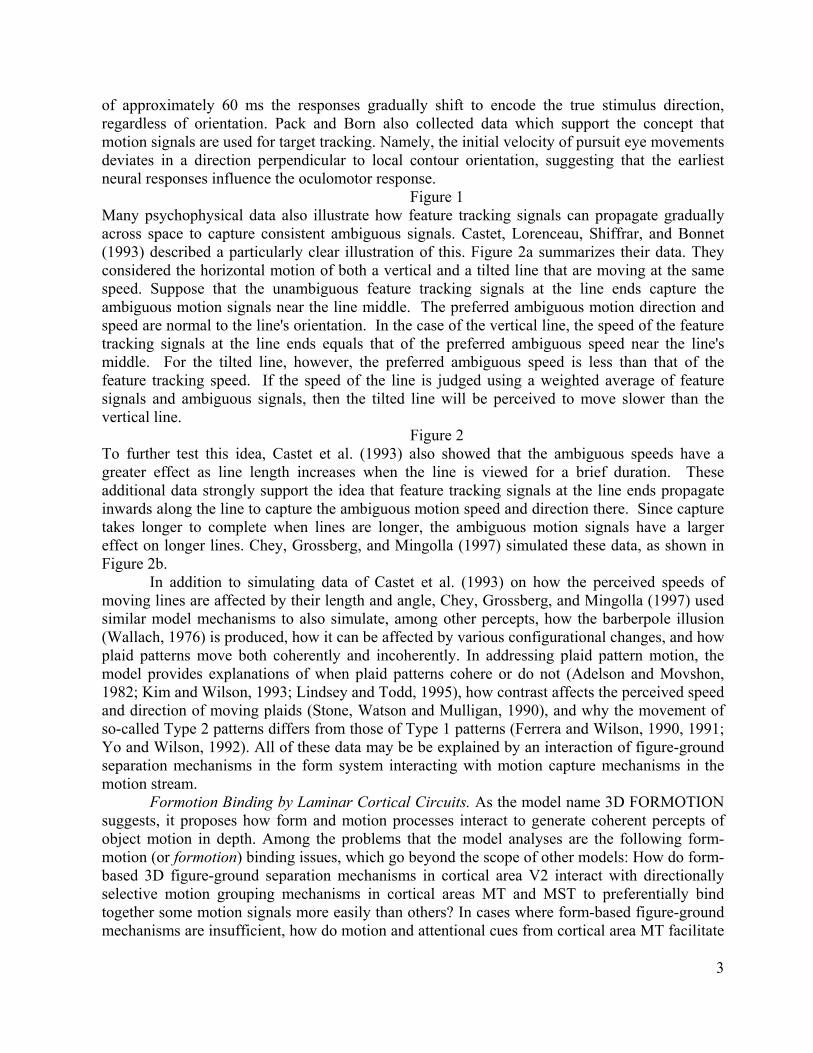
of approximately 60 ms the responses gradually shift to encode the true stimulus direction, regardless of orientation. Pack and Born also collected data which support the concept that motion signals are used for target tracking. Namely, the initial velocity of pursuit eye movements deviates in a direction perpendicular to local contour orientation, suggesting that the earliest neural responses influence the oculomotor response.
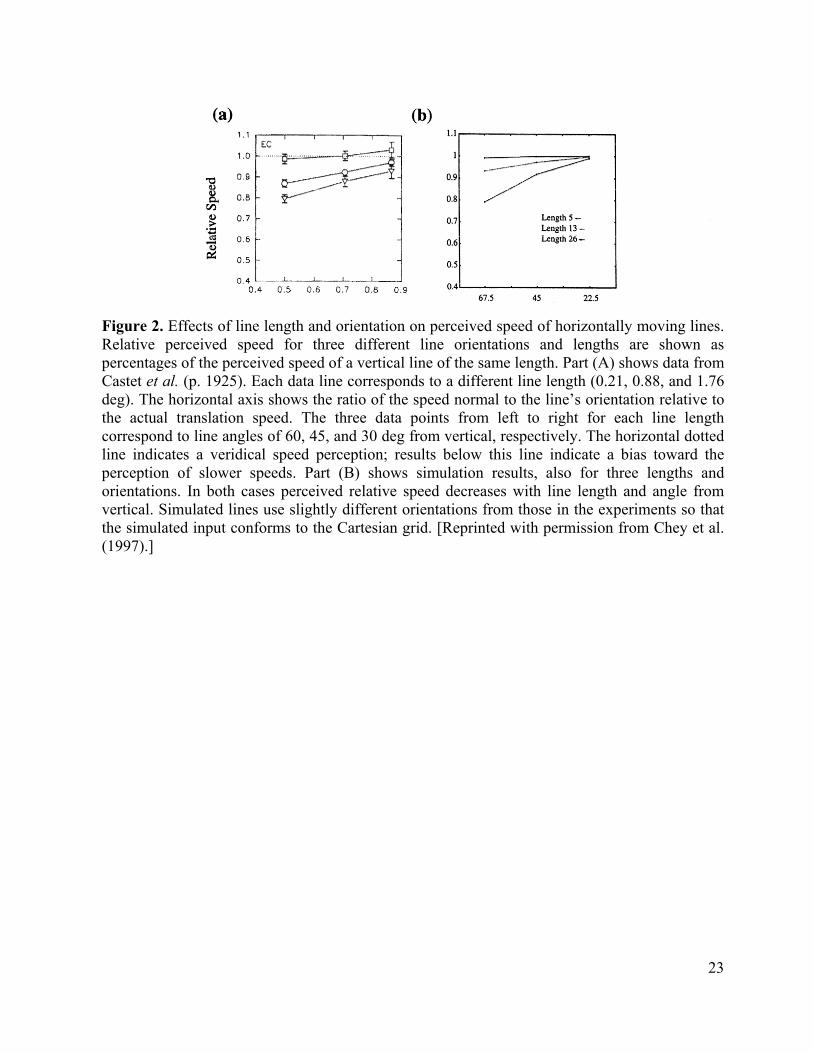
Figure 1 Many psychophysical data also illustrate how feature tracking signals can propagate gradually across space to capture consistent ambiguous signals. Castet, Lorenceau, Shiffrar, and Bonnet (1993) described a particularly clear illustration of this. Figure 2a summarizes their data. They considered the horizontal motion of both a vertical and a tilted line that are moving at the same speed. Suppose that the unambiguous feature tracking signals at the line ends capture the ambiguous motion signals near the line middle. The preferred ambiguous motion direction and speed are normal to the line's orientation. In the case of the vertical line, the speed of the feature tracking signals at the line ends equals that of the preferred ambiguous speed near the line's middle. For the tilted line, however, the preferred ambiguous speed is less than that of the feature tracking speed. If the speed of the line is judged using a weighted average of feature signals and ambiguous signals, then the tilted line will be perceived to move slower than the vertical line.
Figure 2 To further test this idea, Castet et al. (1993) also showed that the ambiguous speeds have a greater effect as line length increases when the line is viewed for a brief duration. These additional data strongly support the idea that feature tracking signals at the line ends propagate inwards along the line to capture the ambiguous motion speed and direction there. Since capture takes longer to complete when lines are longer, the ambiguous motion signals have a larger effect on longer lines. Chey, Grossberg, and Mingolla (1997) simulated these data, as shown in Figure 2b.
In addition to simulating data of Castet et al. (1993) on how the perceived speeds of moving lines are affected by their length and angle, Chey, Grossberg, and Mingolla (1997) used similar model mechanisms to also simulate, among other percepts, how the barberpole illusion (Wallach, 1976) is produced, how it can be affected by various configurational changes, and how plaid patterns move both coherently and incoherently. In addressing plaid pattern motion, the model provides explanations of when plaid patterns cohere or do not (Adelson and Movshon, 1982; Kim and Wilson, 1993; Lindsey and Todd, 1995), how contrast affects the perceived speed and direction of moving plaids (Stone, Watson and Mulligan, 1990), and why the movement of so-called Type 2 patterns differs from those of Type 1 patterns (Ferrera and Wilson, 1990, 1991; Yo and Wilson, 1992). All of these data may be be explained by an interaction of figure-ground separation mechanisms in the form system interacting with motion capture mechanisms in the motion stream.
Formotion Binding by Laminar Cortical Circuits. As the model name 3D FORMOTION suggests, it proposes how form and motion processes interact to generate coherent percepts of object motion in depth. Among the problems that the model analyses are the following form-motion (or formotion) binding issues, which go beyond the scope of other models: How do form-based 3D figure-ground separation mechanisms in cortical area V2 interact with directionally selective motion grouping mechanisms in cortical areas MT and MST to preferentially bind together some motion signals more easily than others? In cases where form-based figure-ground mechanisms are insufficient, how do motion and attentional cues from cortical area MT facilitate
4
figure-ground separation within cortical area V2 via MT-to-VI-to-V2 feedback? These processes help to explain and simulate many motion data, including the way in which the global organization of the motion direction field in areas MT and MST can influence whether the percept of an object’s form looks rigid or deformable through time.
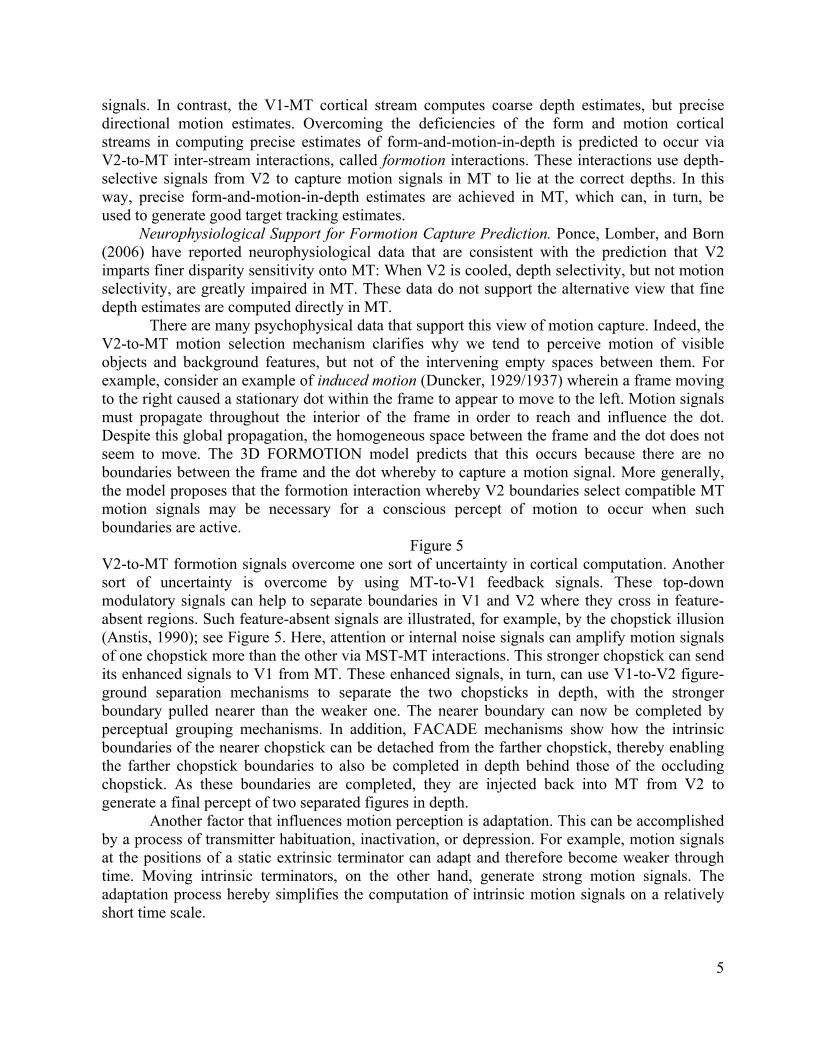
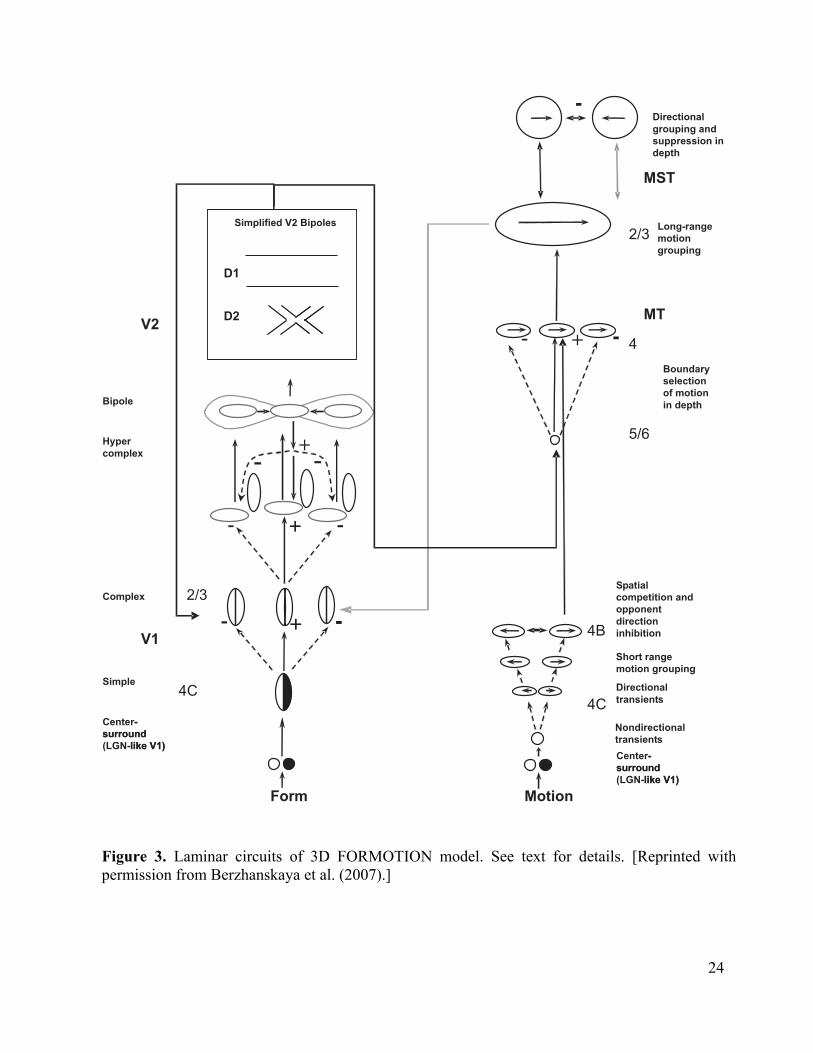
The model also goes beyond earlier motion models by proposing how laminar cortical circuits realize these mechanisms (Figure 3). These laminar circuits embody explicit predictions about the functional roles that are played by identified cells in the brain. The 3D FORMOTION model extends to the motion system laminar models of cortical circuits that have previously explained challenging perceptual and brain data about 3D form perception in cortical areas V1, V2, and V4 (e.g., Cao and Grossberg, 2005; Grossberg, 1999, 2003; Grossberg and Raizada, 2000; Grossberg and Seitz, 2003; Grossberg and Swaminathan, 2004; Grossberg and Williamson, 2001; Grossberg and Yazdanbakhsh, 2005), as well as about cognitive working memory, sequence learning, and variable-rate sequential performance (Grossberg and Pearson, 2006).
Figure 3
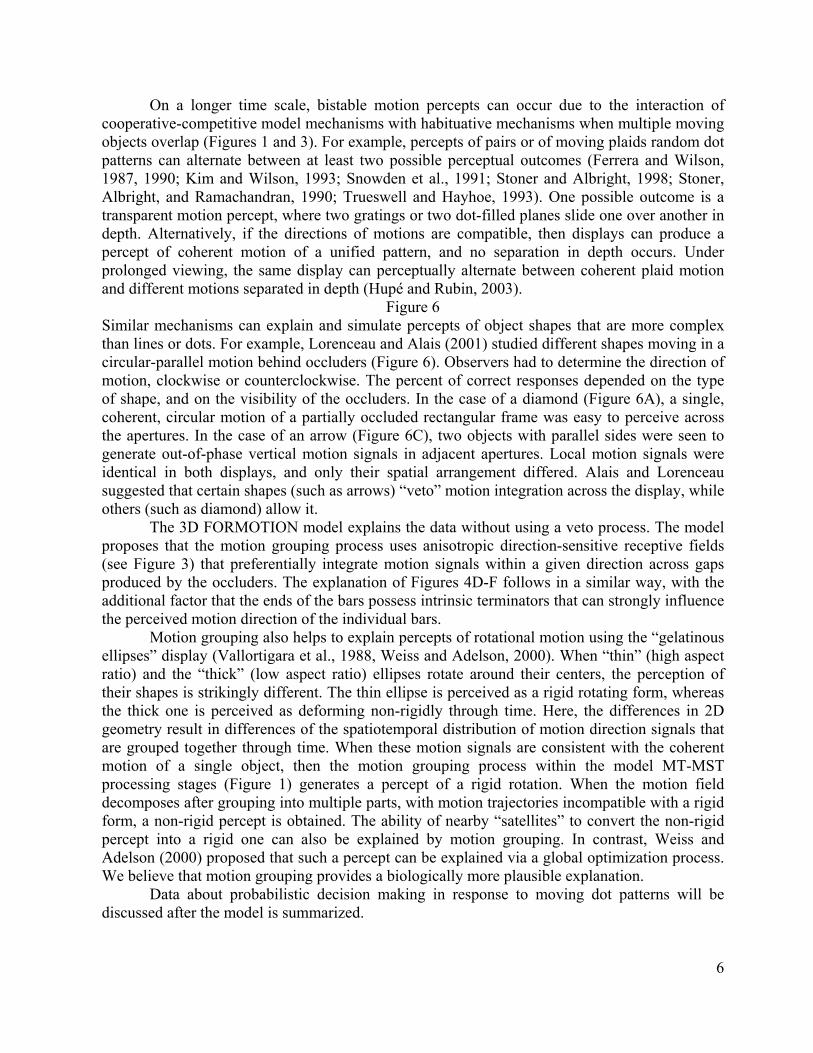
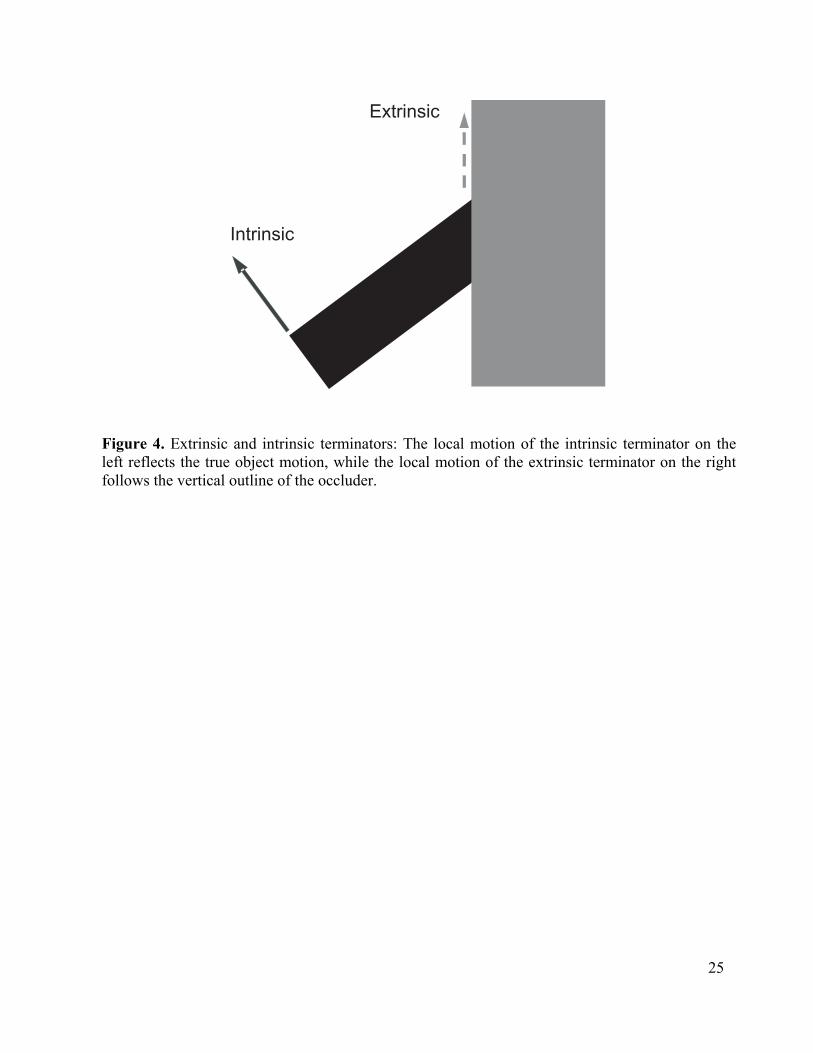
Intrinsic and Extrinsic Terminators. A key issue concerns the assignment of motion to an object boundary when it moves relative to an occluder. How does the brain prevent motion integration across both the occluder and its occluded objects? In the example in Figure 4, motion of the left line end corresponds to the real motion of the line. The right line end is formed by the boundary between the line and a stationary occluder. Its motion provides little information about the motion of the line. Bregman (1981) and Kanizsa (1979), and more recently Nakayama, Shimojo and Silverman (1989), have discussed this problem. Nakayama et al. use the terminology of intrinsic and extrinsic terminators to distinguish the two cases. An intrinsic terminator belongs to the moving object, whereas an extrinsic one belongs to the occluder. Motion of intrinsic terminators is incorporated into an object’s motion direction, whereas motion of extrinsic terminators is attenuated or eliminated (Duncan, Albright and Stoner, 2000; Lidén and Mingolla, 1998; Shimojo et al., 1989).
Figure 4 The FACADE model (Grossberg, 1994, 1997; Kelly and Grossberg, 2000) of 3D form vision and figure-ground separation proposed how boundaries in 3D scenes or 2D images are assigned to different objects in different depth planes, and thereby offered a mechanistic explanation of the properties of extrinsic and intrinsic terminators. The 3D FORMOTION model (Berzhanskaya, Grossberg, and Mingolla, 2007; Grossberg, Mingolla, and Viswanathan, 2001) proposed how FACADE depth-selective figure-ground separation in cortical area V2, combined with depth-selective formotion interactions from area V2 to MT, enable intrinsic terminators to create strong motion signals on a moving object, while extrinsic terminators create weak ones. The model starts with motion signals in V1, where the separation in depth has not yet occurred, and predicts how V2-to-MT boundary signals can select V1-to-MT motion signals at the correct depths, while suppressing motion signals at the same visual locations but different depths.
Form and Motion are Complementary: What Sort of Depth does MT Compute? The prediction that V2-to-MT signals can capture motion signals at a given depth reflects the hypothesis that the form and motion streams compute complementary properties (Grossberg, 1991, 2000). The V1-V2 cortical stream, acting alone, is predicted to compute precise oriented depth estimates in the form of 3D boundary representations, but coarse directional motion
5
signals. In contrast, the V1-MT cortical stream computes coarse depth estimates, but precise directional motion estimates. Overcoming the deficiencies of the form and motion cortical streams in computing precise estimates of form-and-motion-in-depth is predicted to occur via V2-to-MT inter-stream interactions, called formotion interactions. These interactions use depth-selective signals from V2 to capture motion signals in MT to lie at the correct depths. In this way, precise form-and-motion-in-depth estimates are achieved in MT, which can, in turn, be used to generate good target tracking estimates. Neurophysiological Support for Formotion Capture Prediction. Ponce, Lomber, and Born (2006) have reported neurophysiological data that are consistent with the prediction that V2 imparts finer disparity sensitivity onto MT: When V2 is cooled, depth selectivity, but not motion selectivity, are greatly impaired in MT. These data do not support the alternative view that fine depth estimates are computed directly in MT.
There are many psychophysical data that support this view of motion capture. Indeed, the V2-to-MT motion selection mechanism clarifies why we tend to perceive motion of visible objects and background features, but not of the intervening empty spaces between them. For example, consider an example of induced motion (Duncker, 1929/1937) wherein a frame moving to the right caused a stationary dot within the frame to appear to move to the left. Motion signals must propagate throughout the interior of the frame in order to reach and influence the dot. Despite this global propagation, the homogeneous space between the frame and the dot does not seem to move. The 3D FORMOTION model predicts that this occurs because there are no boundaries between the frame and the dot whereby to capture a motion signal. More generally, the model proposes that the formotion interaction whereby V2 boundaries select compatible MT motion signals may be necessary for a conscious percept of motion to occur when such boundaries are active.
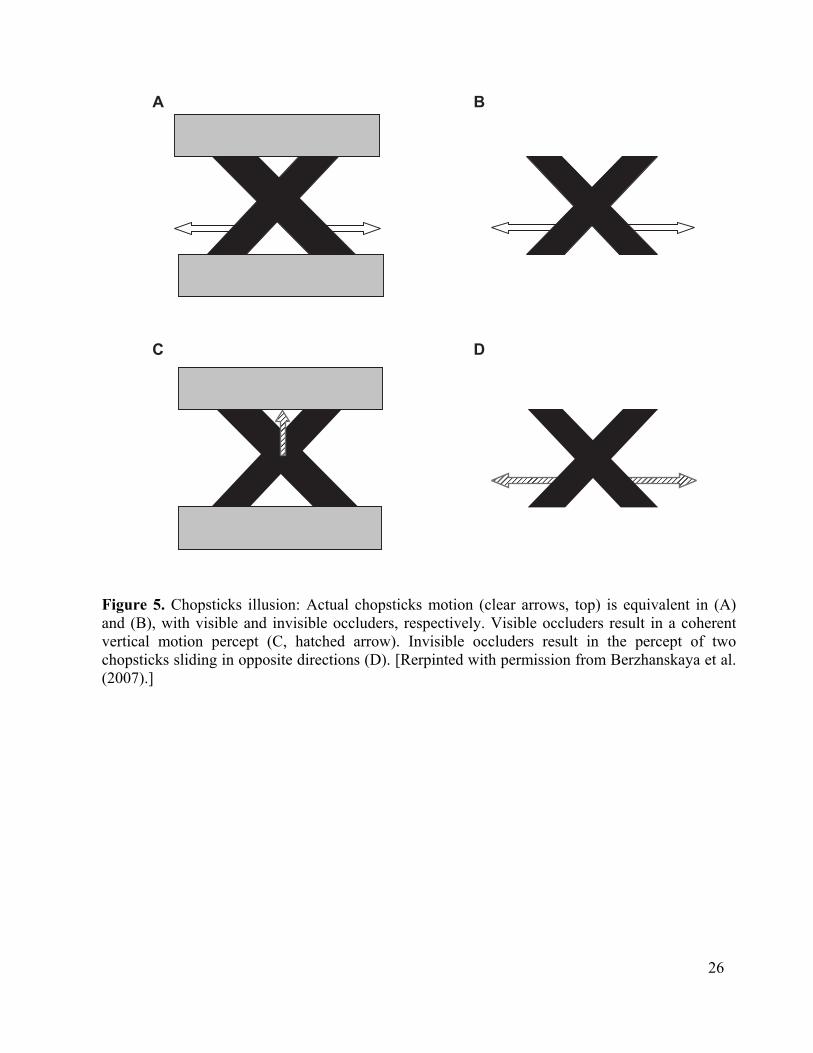
Figure 5 V2-to-MT formotion signals overcome one sort of uncertainty in cortical computation. Another sort of uncertainty is overcome by using MT-to-V1 feedback signals. These top-down modulatory signals can help to separate boundaries in V1 and V2 where they cross in feature-absent regions. Such feature-absent signals are illustrated, for example, by the chopstick illusion (Anstis, 1990); see Figure 5. Here, attention or internal noise signals can amplify motion signals of one chopstick more than the other via MST-MT interactions. This stronger chopstick can send its enhanced signals to V1 from MT. These enhanced signals, in turn, can use V1-to-V2 figure-ground separation mechanisms to separate the two chopsticks in depth, with the stronger boundary pulled nearer than the weaker one. The nearer boundary can now be completed by perceptual grouping mechanisms. In addition, FACADE mechanisms show how the intrinsic boundaries of the nearer chopstick can be detached from the farther chopstick, thereby enabling the farther chopstick boundaries to also be completed in depth behind those of the occluding chopstick. As these boundaries are completed, they are injected back into MT from V2 to generate a final percept of two separated figures in depth.
Another factor that influences motion perception is adaptation. This can be accomplished by a process of transmitter habituation, inactivation, or depression. For example, motion signals at the positions of a static extrinsic terminator can adapt and therefore become weaker through time. Moving intrinsic terminators, on the other hand, generate strong motion signals. The adaptation process hereby simplifies the computation of intrinsic motion signals on a relatively short time scale.
6
On a longer time scale, bistable motion percepts can occur due to the interaction of cooperative-competitive model mechanisms with habituative mechanisms when multiple moving objects overlap (Figures 1 and 3). For example, percepts of pairs or of moving plaids random dot patterns can alternate between at least two possible perceptual outcomes (Ferrera and Wilson, 1987, 1990; Kim and Wilson, 1993; Snowden et al., 1991; Stoner and Albright, 1998; Stoner, Albright, and Ramachandran, 1990; Trueswell and Hayhoe, 1993). One possible outcome is a transparent motion percept, where two gratings or two dot-filled planes slide one over another in depth. Alternatively, if the directions of motions are compatible, then displays can produce a percept of coherent motion of a unified pattern, and no separation in depth occurs. Under prolonged viewing, the same display can perceptually alternate between coherent plaid motion and different motions separated in depth (Hupé and Rubin, 2003).
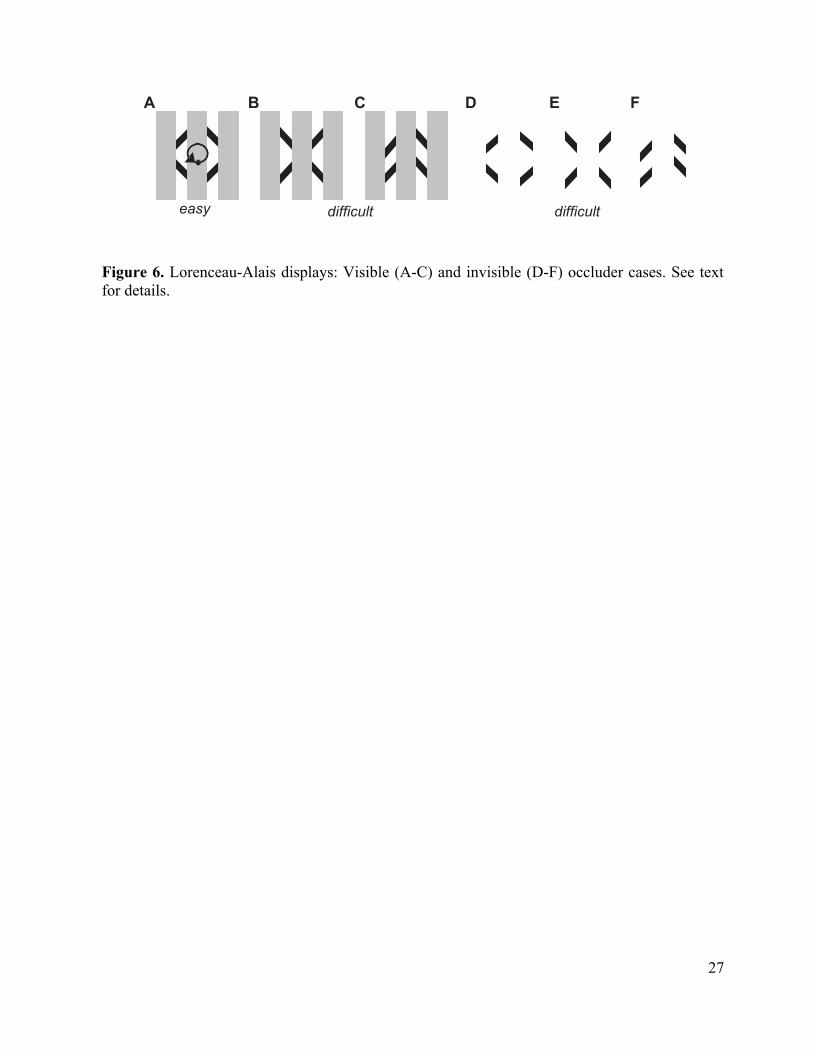
Figure 6 Similar mechanisms can explain and simulate percepts of object shapes that are more complex than lines or dots. For example, Lorenceau and Alais (2001) studied different shapes moving in a circular-parallel motion behind occluders (Figure 6). Observers had to determine the direction of motion, clockwise or counterclockwise. The percent of correct responses depended on the type of shape, and on the visibility of the occluders. In the case of a diamond (Figure 6A), a single, coherent, circular motion of a partially occluded rectangular frame was easy to perceive across the apertures. In the case of an arrow (Figure 6C), two objects with parallel sides were seen to generate out-of-phase vertical motion signals in adjacent apertures. Local motion signals were identical in both displays, and only their spatial arrangement differed. Alais and Lorenceau suggested that certain shapes (such as arrows) “veto” motion integration across the display, while others (such as diamond) allow it.
The 3D FORMOTION model explains the data without using a veto process. The model proposes that the motion grouping process uses anisotropic direction-sensitive receptive fields (see Figure 3) that preferentially integrate motion signals within a given direction across gaps produced by the occluders. The explanation of Figures 4D-F follows in a similar way, with the additional factor that the ends of the bars possess intrinsic terminators that can strongly influence the perceived motion direction of the individual bars.
Motion grouping also helps to explain percepts of rotational motion using the “gelatinous ellipses” display (Vallortigara et al., 1988, Weiss and Adelson, 2000). When “thin” (high aspect ratio) and the “thick” (low aspect ratio) ellipses rotate around their centers, the perception of their shapes is strikingly different. The thin ellipse is perceived as a rigid rotating form, whereas the thick one is perceived as deforming non-rigidly through time. Here, the differences in 2D geometry result in differences of the spatiotemporal distribution of motion direction signals that are grouped together through time. When these motion signals are consistent with the coherent motion of a single object, then the motion grouping process within the model MT-MST processing stages (Figure 1) generates a percept of a rigid rotation. When the motion field decomposes after grouping into multiple parts, with motion trajectories incompatible with a rigid form, a non-rigid percept is obtained. The ability of nearby “satellites” to convert the non-rigid percept into a rigid one can also be explained by motion grouping. In contrast, Weiss and Adelson (2000) proposed that such a percept can be explained via a global optimization process. We believe that motion grouping provides a biologically more plausible explanation.
Data about probabilistic decision making in response to moving dot patterns will be discussed after the model is summarized.
7
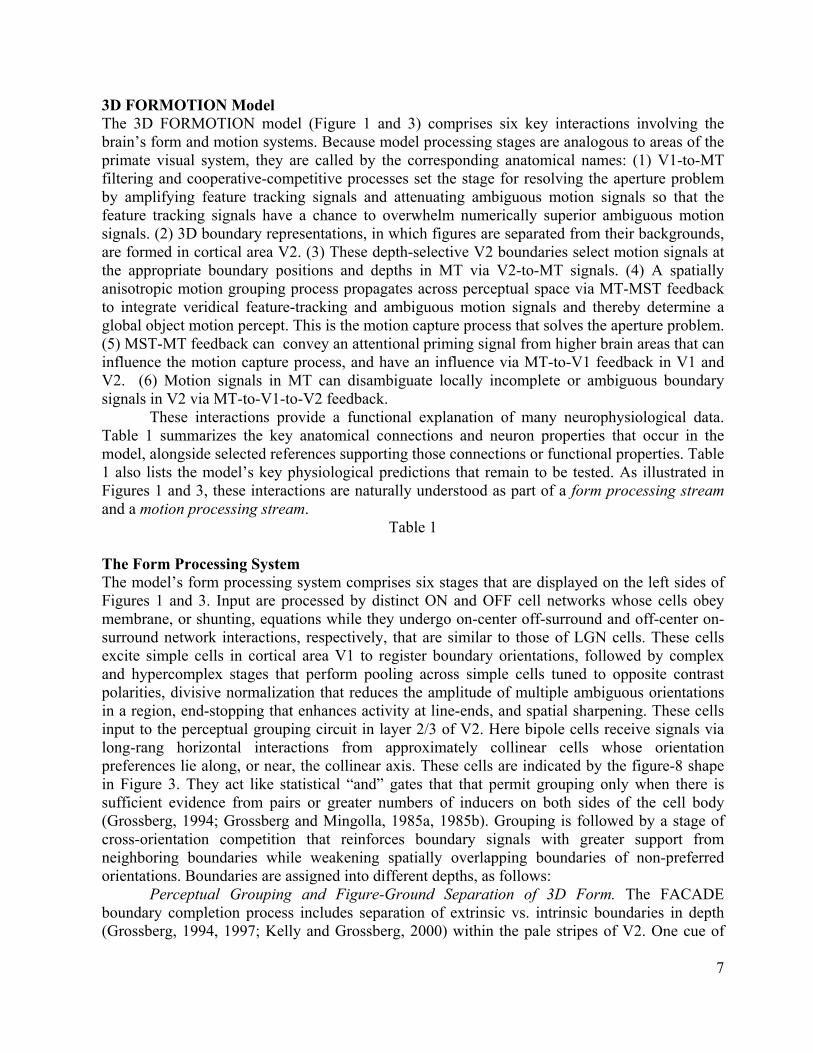
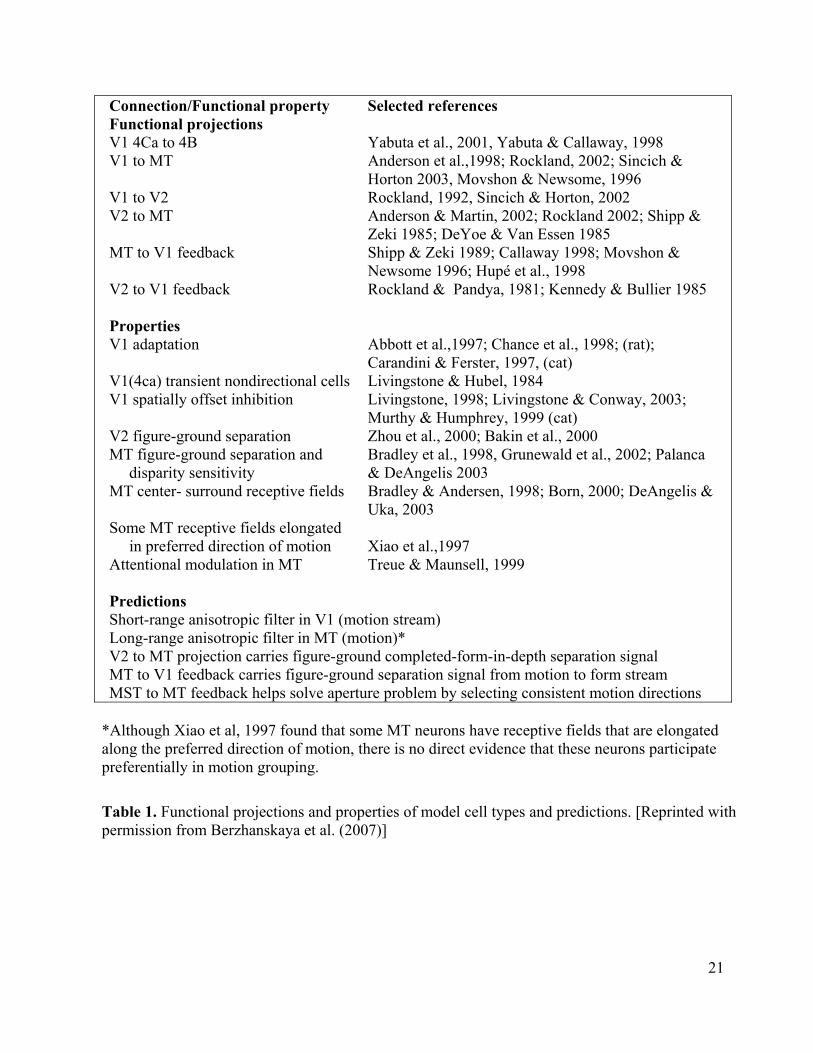
3D FORMOTION Model The 3D FORMOTION model (Figure 1 and 3) comprises six key interactions involving the brain’s form and motion systems. Because model processing stages are analogous to areas of the primate visual system, they are called by the corresponding anatomical names: (1) V1-to-MT filtering and cooperative-competitive processes set the stage for resolving the aperture problem by amplifying feature tracking signals and attenuating ambiguous motion signals so that the feature tracking signals have a chance to overwhelm numerically superior ambiguous motion signals. (2) 3D boundary representations, in which figures are separated from their backgrounds, are formed in cortical area V2. (3) These depth-selective V2 boundaries select motion signals at the appropriate boundary positions and depths in MT via V2-to-MT signals. (4) A spatially anisotropic motion grouping process propagates across perceptual space via MT-MST feedback to integrate veridical feature-tracking and ambiguous motion signals and thereby determine a global object motion percept. This is the motion capture process that solves the aperture problem. (5) MST-MT feedback can convey an attentional priming signal from higher brain areas that can influence the motion capture process, and have an influence via MT-to-V1 feedback in V1 and V2. (6) Motion signals in MT can disambiguate locally incomplete or ambiguous boundary signals in V2 via MT-to-V1-to-V2 feedback. These interactions provide a functional explanation of many neurophysiological data. Table 1 summarizes the key anatomical connections and neuron properties that occur in the model, alongside selected references supporting those connections or functional properties. Table 1 also lists the model’s key physiological predictions that remain to be tested. As illustrated in Figures 1 and 3, these interactions are naturally understood as part of a form processing stream and a motion processing stream.
Table 1 The Form Processing System The model’s form processing system comprises six stages that are displayed on the left sides of Figures 1 and 3. Input are processed by distinct ON and OFF cell networks whose cells obey membrane, or shunting, equations while they undergo on-center off-surround and off-center on-surround network interactions, respectively, that are similar to those of LGN cells. These cells excite simple cells in cortical area V1 to register boundary orientations, followed by complex and hypercomplex stages that perform pooling across simple cells tuned to opposite contrast polarities, divisive normalization that reduces the amplitude of multiple ambiguous orientations in a region, end-stopping that enhances activity at line-ends, and spatial sharpening. These cells input to the perceptual grouping circuit in layer 2/3 of V2. Here bipole cells receive signals via long-rang horizontal interactions from approximately collinear cells whose orientation preferences lie along, or near, the collinear axis. These cells are indicated by the figure-8 shape in Figure 3. They act like statistical “and” gates that that permit grouping only when there is sufficient evidence from pairs or greater numbers of inducers on both sides of the cell body (Grossberg, 1994; Grossberg and Mingolla, 1985a, 1985b). Grouping is followed by a stage of cross-orientation competition that reinforces boundary signals with greater support from neighboring boundaries while weakening spatially overlapping boundaries of non-preferred orientations. Boundaries are assigned into different depths, as follows:
Perceptual Grouping and Figure-Ground Separation of 3D Form. The FACADE boundary completion process includes separation of extrinsic vs. intrinsic boundaries in depth (Grossberg, 1994, 1997; Kelly and Grossberg, 2000) within the pale stripes of V2. One cue of
8
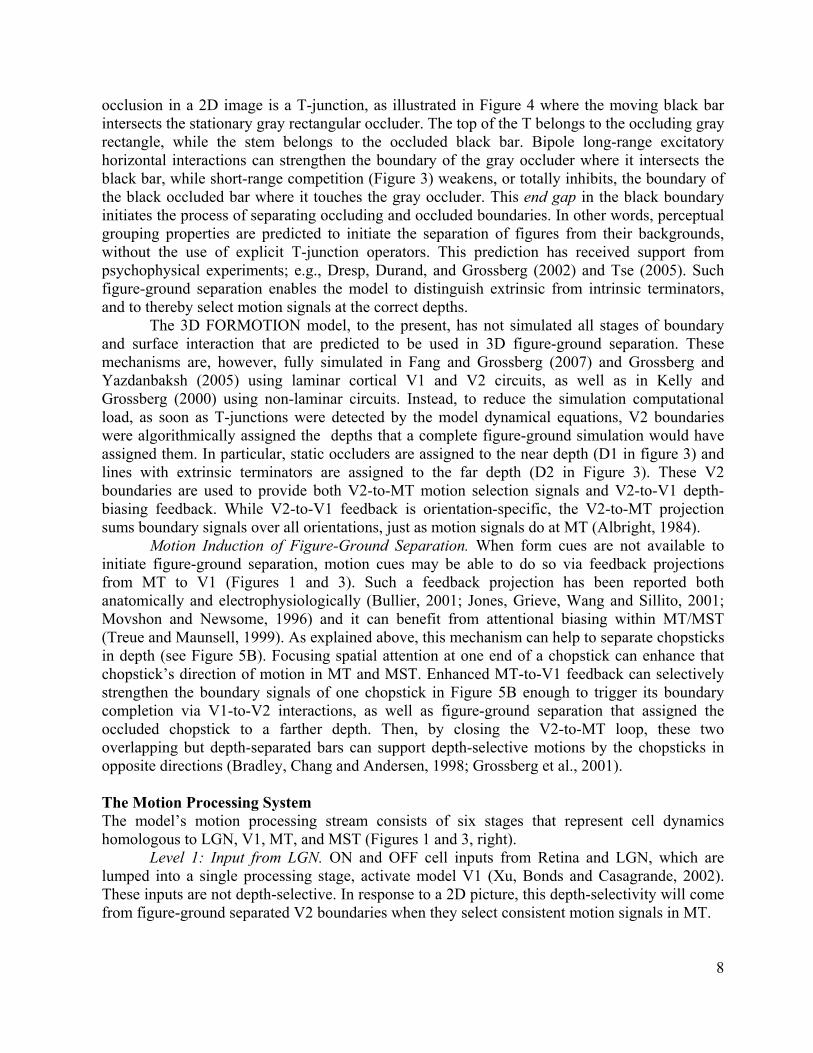
occlusion in a 2D image is a T-junction, as illustrated in Figure 4 where the moving black bar intersects the stationary gray rectangular occluder. The top of the T belongs to the occluding gray rectangle, while the stem belongs to the occluded black bar. Bipole long-range excitatory horizontal interactions can strengthen the boundary of the gray occluder where it intersects the black bar, while short-range competition (Figure 3) weakens, or totally inhibits, the boundary of the black occluded bar where it touches the gray occluder. This end gap in the black boundary initiates the process of separating occluding and occluded boundaries. In other words, perceptual grouping properties are predicted to initiate the separation of figures from their backgrounds, without the use of explicit T-junction operators. This prediction has received support from psychophysical experiments; e.g., Dresp, Durand, and Grossberg (2002) and Tse (2005). Such figure-ground separation enables the model to distinguish extrinsic from intrinsic terminators, and to thereby select motion signals at the correct depths.
The 3D FORMOTION model, to the present, has not simulated all stages of boundary and surface interaction that are predicted to be used in 3D figure-ground separation. These mechanisms are, however, fully simulated in Fang and Grossberg (2007) and Grossberg and Yazdanbaksh (2005) using laminar cortical V1 and V2 circuits, as well as in Kelly and Grossberg (2000) using non-laminar circuits. Instead, to reduce the simulation computational load, as soon as T-junctions were detected by the model dynamical equations, V2 boundaries were algorithmically assigned the depths that a complete figure-ground simulation would have assigned them. In particular, static occluders are assigned to the near depth (D1 in figure 3) and lines with extrinsic terminators are assigned to the far depth (D2 in Figure 3). These V2 boundaries are used to provide both V2-to-MT motion selection signals and V2-to-V1 depth-biasing feedback. While V2-to-V1 feedback is orientation-specific, the V2-to-MT projection sums boundary signals over all orientations, just as motion signals do at MT (Albright, 1984).
Motion Induction of Figure-Ground Separation. When form cues are not available to initiate figure-ground separation, motion cues may be able to do so via feedback projections from MT to V1 (Figures 1 and 3). Such a feedback projection has been reported both anatomically and electrophysiologically (Bullier, 2001; Jones, Grieve, Wang and Sillito, 2001; Movshon and Newsome, 1996) and it can benefit from attentional biasing within MT/MST (Treue and Maunsell, 1999). As explained above, this mechanism can help to separate chopsticks in depth (see Figure 5B). Focusing spatial attention at one end of a chopstick can enhance that chopstick’s direction of motion in MT and MST. Enhanced MT-to-V1 feedback can selectively strengthen the boundary signals of one chopstick in Figure 5B enough to trigger its boundary completion via V1-to-V2 interactions, as well as figure-ground separation that assigned the occluded chopstick to a farther depth. Then, by closing the V2-to-MT loop, these two overlapping but depth-separated bars can support depth-selective motions by the chopsticks in opposite directions (Bradley, Chang and Andersen, 1998; Grossberg et al., 2001). The Motion Processing System The model’s motion processing stream consists of six stages that represent cell dynamics homologous to LGN, V1, MT, and MST (Figures 1 and 3, right).
Level 1: Input from LGN. ON and OFF cell inputs from Retina and LGN, which are lumped into a single processing stage, activate model V1 (Xu, Bonds and Casagrande, 2002). These inputs are not depth-selective. In response to a 2D picture, this depth-selectivity will come from figure-ground separated V2 boundaries when they select consistent motion signals in MT.
9
The 3D FORMOTION model uses both ON and OFF input cells. For example, if a bright chopstick moves to the right on a dark background, ON cells respond to its leading edge, but OFF cells respond to its trailing edge. Likewise, when the chopstick reverses direction and starts to move to the left, its leading edge now activates ON cells and its trailing edge OFF cells. By differentially activating ON and OFF cells in different parts of this motion cycle, these cells have more time to recover from habituation, so that the system remains more sensitive to repetitive motion signals.
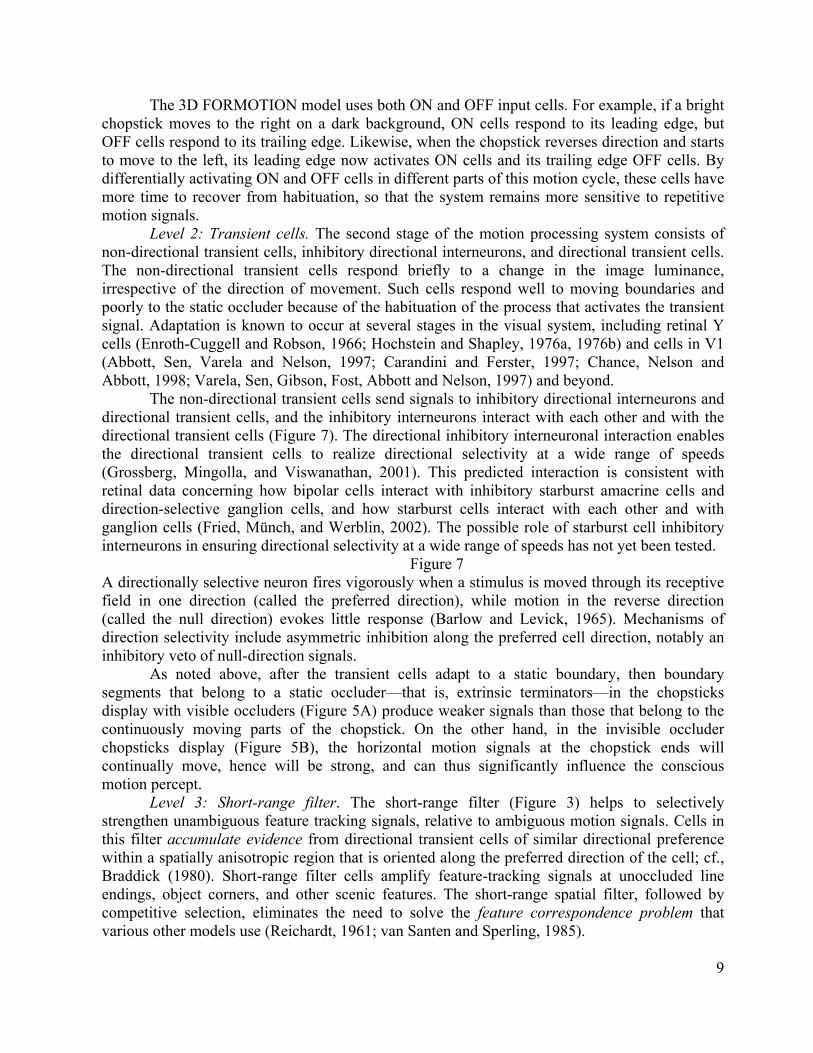
Level 2: Transient cells. The second stage of the motion processing system consists of non-directional transient cells, inhibitory directional interneurons, and directional transient cells. The non-directional transient cells respond briefly to a change in the image luminance, irrespective of the direction of movement. Such cells respond well to moving boundaries and poorly to the static occluder because of the habituation of the process that activates the transient signal. Adaptation is known to occur at several stages in the visual system, including retinal Y cells (Enroth-Cuggell and Robson, 1966; Hochstein and Shapley, 1976a, 1976b) and cells in V1 (Abbott, Sen, Varela and Nelson, 1997; Carandini and Ferster, 1997; Chance, Nelson and Abbott, 1998; Varela, Sen, Gibson, Fost, Abbott and Nelson, 1997) and beyond.
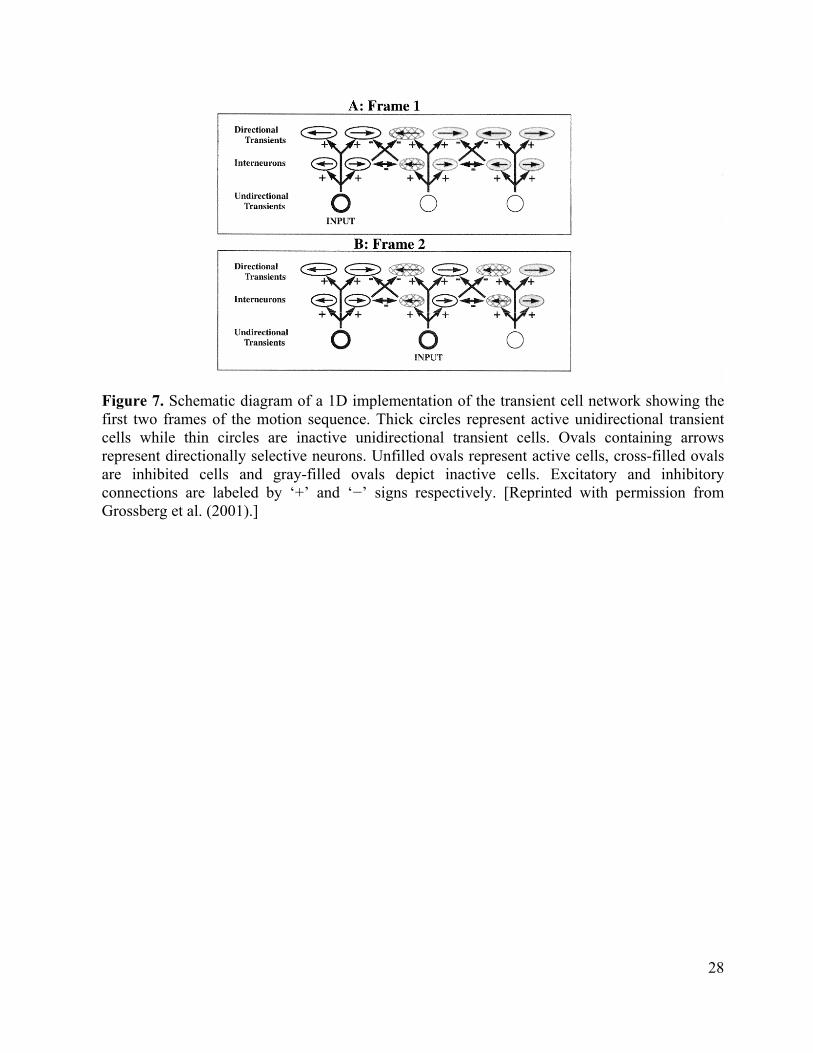
The non-directional transient cells send signals to inhibitory directional interneurons and directional transient cells, and the inhibitory interneurons interact with each other and with the directional transient cells (Figure 7). The directional inhibitory interneuronal interaction enables the directional transient cells to realize directional selectivity at a wide range of speeds (Grossberg, Mingolla, and Viswanathan, 2001). This predicted interaction is consistent with retinal data concerning how bipolar cells interact with inhibitory starburst amacrine cells and direction-selective ganglion cells, and how starburst cells interact with each other and with ganglion cells (Fried, Münch, and Werblin, 2002). The possible role of starburst cell inhibitory interneurons in ensuring directional selectivity at a wide range of speeds has not yet been tested.
Figure 7 A directionally selective neuron fires vigorously when a stimulus is moved through its receptive field in one direction (called the preferred direction), while motion in the reverse direction (called the null direction) evokes little response (Barlow and Levick, 1965). Mechanisms of direction selectivity include asymmetric inhibition along the preferred cell direction, notably an inhibitory veto of null-direction signals.
As noted above, after the transient cells adapt to a static boundary, then boundary segments that belong to a static occluder—that is, extrinsic terminators—in the chopsticks display with visible occluders (Figure 5A) produce weaker signals than those that belong to the continuously moving parts of the chopstick. On the other hand, in the invisible occluder chopsticks display (Figure 5B), the horizontal motion signals at the chopstick ends will continually move, hence will be strong, and can thus significantly influence the conscious motion percept.
Level 3: Short-range filter. The short-range filter (Figure 3) helps to selectively strengthen unambiguous feature tracking signals, relative to ambiguous motion signals. Cells in this filter accumulate evidence from directional transient cells of similar directional preference within a spatially anisotropic region that is oriented along the preferred direction of the cell; cf., Braddick (1980). Short-range filter cells amplify feature-tracking signals at unoccluded line endings, object corners, and other scenic features. The short-range spatial filter, followed by competitive selection, eliminates the need to solve the feature correspondence problem that various other models use (Reichardt, 1961; van Santen and Sperling, 1985).
10
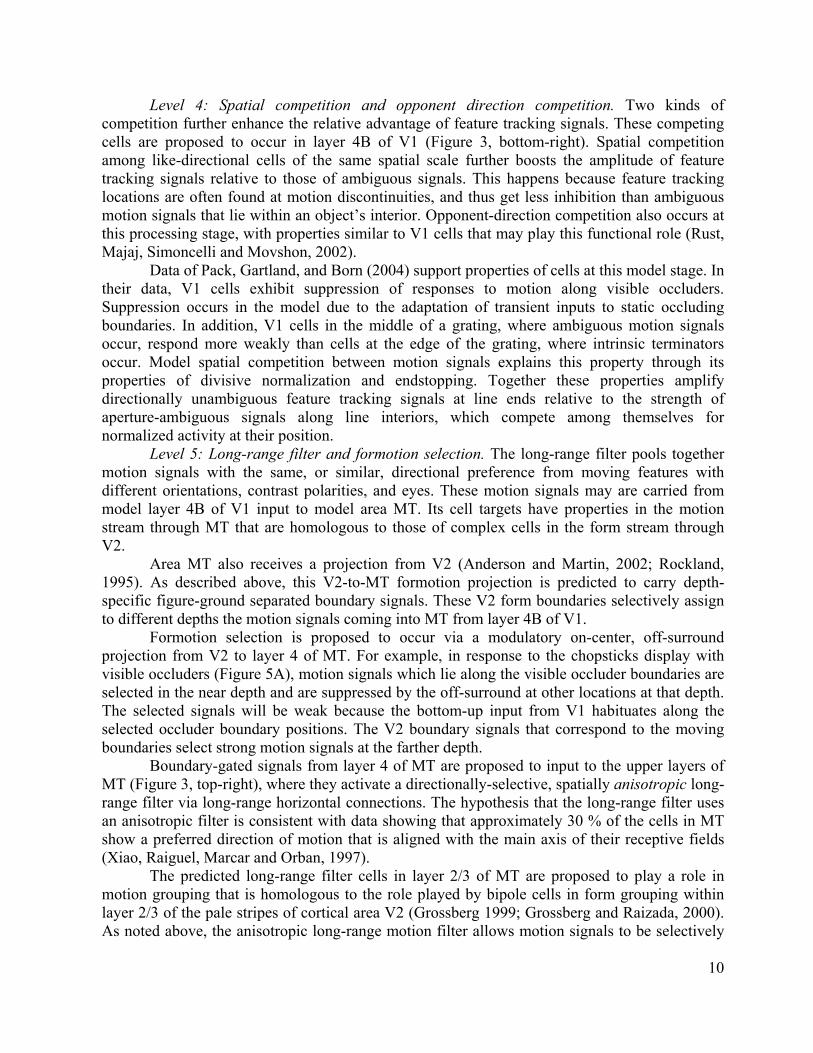
Level 4: Spatial competition and opponent direction competition. Two kinds of competition further enhance the relative advantage of feature tracking signals. These competing cells are proposed to occur in layer 4B of V1 (Figure 3, bottom-right). Spatial competition among like-directional cells of the same spatial scale further boosts the amplitude of feature tracking signals relative to those of ambiguous signals. This happens because feature tracking locations are often found at motion discontinuities, and thus get less inhibition than ambiguous motion signals that lie within an object’s interior. Opponent-direction competition also occurs at this processing stage, with properties similar to V1 cells that may play this functional role (Rust, Majaj, Simoncelli and Movshon, 2002).
Data of Pack, Gartland, and Born (2004) support properties of cells at this model stage. In their data, V1 cells exhibit suppression of responses to motion along visible occluders. Suppression occurs in the model due to the adaptation of transient inputs to static occluding boundaries. In addition, V1 cells in the middle of a grating, where ambiguous motion signals occur, respond more weakly than cells at the edge of the grating, where intrinsic terminators occur. Model spatial competition between motion signals explains this property through its properties of divisive normalization and endstopping. Together these properties amplify directionally unambiguous feature tracking signals at line ends relative to the strength of aperture-ambiguous signals along line interiors, which compete among themselves for normalized activity at their position. Level 5: Long-range filter and formotion selection. The long-range filter pools together motion signals with the same, or similar, directional preference from moving features with different orientations, contrast polarities, and eyes. These motion signals may are carried from model layer 4B of V1 input to model area MT. Its cell targets have properties in the motion stream through MT that are homologous to those of complex cells in the form stream through V2.
Area MT also receives a projection from V2 (Anderson and Martin, 2002; Rockland, 1995). As described above, this V2-to-MT formotion projection is predicted to carry depth-specific figure-ground separated boundary signals. These V2 form boundaries selectively assign to different depths the motion signals coming into MT from layer 4B of V1.
Formotion selection is proposed to occur via a modulatory on-center, off-surround projection from V2 to layer 4 of MT. For example, in response to the chopsticks display with visible occluders (Figure 5A), motion signals which lie along the visible occluder boundaries are selected in the near depth and are suppressed by the off-surround at other locations at that depth. The selected signals will be weak because the bottom-up input from V1 habituates along the selected occluder boundary positions. The V2 boundary signals that correspond to the moving boundaries select strong motion signals at the farther depth.
Boundary-gated signals from layer 4 of MT are proposed to input to the upper layers of MT (Figure 3, top-right), where they activate a directionally-selective, spatially anisotropic long-range filter via long-range horizontal connections. The hypothesis that the long-range filter uses an anisotropic filter is consistent with data showing that approximately 30 % of the cells in MT show a preferred direction of motion that is aligned with the main axis of their receptive fields (Xiao, Raiguel, Marcar and Orban, 1997).
The predicted long-range filter cells in layer 2/3 of MT are proposed to play a role in motion grouping that is homologous to the role played by bipole cells in form grouping within layer 2/3 of the pale stripes of cortical area V2 (Grossberg 1999; Grossberg and Raizada, 2000). As noted above, the anisotropic long-range motion filter allows motion signals to be selectively
11
integrated across occluders in a manner that naturally explains the percepts generated by the Lorenceau-Alais displays of Figure 6. Level 6: Directional grouping. The first five model stages can amplify feature tracking signals and assign motion signals to the correct depths. However, they do not explain how feature tracking signals propagate across space to select consistent motion directions from ambiguous motion directions, suppress inconsistent motion directions, all the while without distorting their speed estimates,. They also cannot explain how motion integration can compute a vector average of ambiguous motion signals across space to determine the perceived motion direction when feature tracking signals are not present at that depth. The final stage of the model accomplishes this goal by using a motion grouping network that is interpreted to exist in ventral MST (MSTv), which is known to be important for target tracking (Bherezovskii and Born, 1999; Born and Tootell, 1992; Eifuku and Wurtz, 1998; Pack, Grossberg, and Mingolla, 2001; Tanaka et al., 1993). We predict that this motion grouping network determines the coherent motion direction of discrete moving objects.
During motion grouping, cells that code the same, or similar, directions in MT send convergent inputs to cells in model MSTv via the motion grouping network. Within MSTv, directional competition at each position determines a winning motion direction. This winning directional cell then feeds back to its source cells in MT. This feedback selects activities of MT cells that code the winning direction, while suppressing activities of cells that code other directions. Using this broad feedback kernel, the motion grouping network enables feature tracking signals to select similar directions at nearby ambiguous motion positions, while suppressing other directions there. In other words, motion capture occurs and disambiguates ambiguous motion positions.
The next cycle of the feedback process allows these newly unambiguous motion directions to select consistent MSTv grouping cells at positions near them. As the grouping process cycles between MT and MSTv, the motion capture process propagates across space. Chey et al. (1997) and Grossberg et al. (2001) used this process to simulate data showing how the present model solves the aperture problem via a gradual process of motion capture, and Pack and Born (2001) provided supportive neurophysiological data by directly recording from MT cells, as noted above. Ubiquitous Circuit Design for Selection, Attention, and Learning. Both the V2-to-MT and the MSTv-to-MT signals carry out their selection processes using modulatory on-center, off-surround interactions. The V2-to-MT signals select motion signals at the locations and depth of a moving boundary. The MSTv-to-MT signals select motion signals in the direction and depth of a motion grouping. Adaptive Resonance Theory predicted that such a modulatory on-center, off-surround network would be used to carry out attentive selection and modulation of adaptive tuning within all brain circuits wherein fast and stable learning of appropriate features is needed. In the V2-to-MT circuit, a formotion association is learned. In the MST-to-MT circuit, directional grouping cells are learned. Grossberg (2003) and Raizada and Grossberg (2003) review behavioral and neurobiological data that support this prediction in several brain systems. The Ponce, Lomber, and Born (2006) study supports the V2-to-MT prediction, but does not study how this association is learned. There do not seem to be any direct neurophysiological tests of the MSTv-to-MT prediction.
Temporal Dynamics of Decision-Making during Motion Perception
12
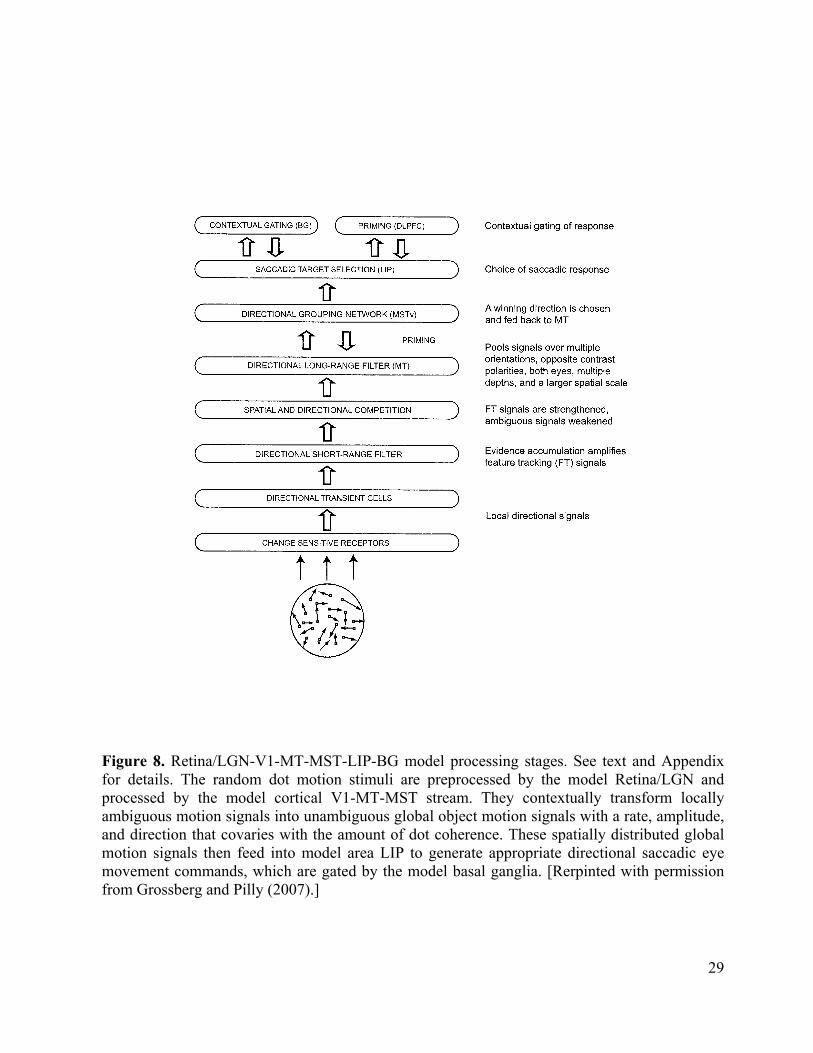
Motion Capture in Perceptual Decision-Making. The 3D FORMOTION model sheds new light on how the brain makes movement decisions, in particular saccadic eye movements, in response to probabilistically defined motion stimuli. It is well known that speed and accuracy of perceptual decisions covary with certainty in the input, and correlate with the rate of evidence accumulation in parietal and frontal cortical neurons. An enhancement of the 3D FORMOTION model with an parietal, indeed an LIP, directional movement processing stage that is gated by the basal ganglia (Figure 8) is sufficient to explain many data of this kind (Grossberg and Pilly, 2007; Pilly and Grossberg, 2005, 2006).
In particular, this enhanced model can quantitatively simulate dynamic properties of decision-making in response to the types of ambiguous visual motion stimuli that have been studied in LIP neurophysiological recordings by Newsome, Shadlen, and colleagues. The most important circuits of this enhanced model already lie within the 3D FORMOTION model. since the rate of motion capture in the MT-MST grouping network covaries with the activation rate and amplitude of LIP cells that control a monkey’s observable behavior in the experiment. The model hereby clarifies how brain circuits that solve the aperture problem, notably the circuits that realize motion capture, control properties of probabilistic decision making in real time. This is not surprising when one interprets the motion capture process as a resolution of ambiguity that selects the best consensus movement that is compatible with motion data.
Figure 8 Are the Brain’s Cecisions Bayesian? These results are of particular interest because some scientists, including Newsome and Shadlen, have proposed that perception and decision-making can be described as Bayesian inference, which estimates the optimal interpretation of the stimulus given priors and likelihoods. However, Bayesian concepts do not provide a way to discover the neocortical mechanisms that make decisions. The present model explains data that Bayesian models have heretofore failed to explain, does so without an appeal to Bayesian inference and, unlike other existing models of these data, generates perceptual representations in response to the experimental visual stimuli. The model quantitatively simulates the time course of LIP neuronal dynamics, as well as behavioral accuracy and reaction time properties, during both correct and error trials at different levels of input ambiguity in both fixed duration and reaction time tasks. Model MST computes the global direction of random dot motion stimuli as part of the motion capture process, while model LIP computes the perceptual decision that leads to a saccadic eye movement. This self-organizing system thus trades accuracy against speed, and illustrates how cortical dynamics go beyond Bayesian concepts, while clarifying why probability theory ideas are initially so appealing. Concerning the appeal of statistical, in particular Bayesian, concepts, it should be noted that the shunting on-center off-surround networks (Grossberg, 1973, 1980) that occur ubiquitously in the brain, and also in the 3D FORMOTION model, tend to normalize the activities across a neural network. The spatially distributed pattern of these normalized activities may be viewed as a type of real-time probability distribution. In addition, any filtering operation, such as the short-range and long-range filters, may be interpreted as a prior (namely, the current neural signal) multiplied by a conditional probability or likelihood (namely, the filter connection strength to the target cell). Likewise, a contrast-enhancing operation, such as the LIP recurrent on-center off-surround network that selects a winning direction from filter inputs, may be viewed as maximizing the posterior. These insights have been known in the neural modeling literature for a long time (Grossberg, 1978). However, as Figures 1, 3, and 8 illustrate, such local processes do not embody the computational intelligence of an entire neural system that has emerged
13
through evolution to realize particular behavioral competences, such as motion perception and decision-making.
Two Movement tasks. Newsome, Shadlen, and colleagues studied neural correlates of perceptual decision-making in macaques which were trained to discriminate motion direction. Random dot motion displays, covering a 5o diameter aperture centered at the fixation point, were used to control motion coherence; namely, the fraction of dots moving non-randomly in a particular direction from one frame to the next in each of three interleaved sequences. Varying motion coherence provided a quantitative way to control the ambiguity of directional information that the monkey used to make a saccadic eye movement to a peripheral choice target in the perceived motion direction, and thus the task difficulty.
Two kinds of tasks were employed, namely fixed duration (FD) and reaction time (RT) tasks. In the FD task (Roitman and Shadlen, 2002; Shadlen and Newsome, 2001), monkeys viewed the moving dots for a fixed duration of 1 s, and then made a saccade to the target in the judged direction after a variable delay. In the RT task (Roitman and Shadlen, 2002), monkeys had theoretically unlimited viewing time, and were trained to report their decision as soon as the motion direction was perceived. The RT task allowed measurement of how long it took the monkey to make a decision, which was defined as the time from the onset of the motion until when the monkey initiated a saccade. Neurophysiological recordings were done in LIP while the monkeys performed these tasks. The recorded neurons had receptive fields (RF) that encompassed just one target, and did not include the circular aperture in which the moving dots were displayed. Also, they were among those that showed sustained activity during the delay period of a memory-guided saccade task. Even though there is no motion stimulus within their classical receptive fields, these neurons still respond with directional-selectivity, probably because of extensive training on the task during which an association was learned (Bichot et al., 1996). This property has also been observed for neurons in superior colliculus whose movement fields contain just one target (Horwitz et al., 2004a; Horwitz and Newsome, 2001a).
Figure 9 The recorded LIP neurons show visuo-motor responses. On correct trials during the decision-making period, more coherence in the favored direction causes faster LIP cell activation, on average, in both the tasks (Figure 9), and also higher maximal cell activation in the FD task (Figures 9(C-F)). More coherence in the opposite direction causes faster cell inhibition in both the tasks, and also lower minimal cell activation in the FD task.
Comparing Trackable Features with Coherently Moving Dots. There are many details that need to be carefully discussed to quantitatively simulated data from this paradigm. These details should not, however, obscure the main point, which is that a clear mechanistic homolog exists between sparse feature tracking signals and sparse but coherent moving dots.
We have already discuss that the brain needs to ensure that a sparse set of unambiguous feature tracking motion signals can gradually capture a vastly greater number of ambiguous motion signals to determine the global direction and speed of object motion. In the case of random dot motion discrimination tasks, the signal dots at any coherence level produce unambiguous, though short-lived, motion signals. The model shows how the same mechanisms that help resolve the aperture problem can also enable a small number of coherently moving dots to capture the motion directions of a large number of unambiguous, but incoherently moving, dots. The intuitive idea is that the MT-MST feedback loop needs more time to capture the incoherent motion signals when there are more of them, and cannot achieve as high a level of
14
asymptotic response magnitude when more of them compete with the emerging winning direction. In other words, the effectiveness of the motion capture process depends on the input coherence. LIP then converts the inputs from MST into an eye movement command, and thereby enables the monkey to report its decision via a saccade.
Experiments that Directly Probe Brain Design vs. Those that Do Not. Another point worth noting is that a display of moving dots does not experience an aperture problem. All of the dots are capable, in principle, of generating unambiguous directional motion signals. However, the model’s circuits reflect, I would argue, a brain design that has evolved to overcome the aperture problem. As a result, the brain can compute unambiguous object motion direction estimates in response to locally ambiguous motion signals. The brain can thereby successfully track important moving targets in the environment even under probabilistically defined environmental conditions.
One might argue that the best experiments are ones that most directly probe brain design. From this perspective, experiments with moving dots are not the best possible probes of a system that has evolved to solve the aperture problem. Of course, it is not possible to confidently design such experiments until one has a strong modeling hypothesis about what this design may be, and that can only be gleaned by a sustained theoretical analysis of many different kinds of parametric experimental data. The 3D FORMOTION model contributes to such an analysis, while also articulating key features of the brain’s design for generating object motion percepts.
References Abbott, L.F., Sen, K., Varela, J.A. & Nelson, S.B. (1997). Synaptic depression and cortical gain
control. Science, 275, 220-222. Adelson, E.H. & Movshon, J.A. (1982). Phenomenal coherence of moving visual patterns.
15
Nature, 300, 523-525. Albright, T.D. (1984). Direction and orientation selectivity of neurons in visual area MT of the
macaque. Journal of Neurophysiology, 52, 1106-1130. Anderson, J.C., Binzegger, T., Martin, K.A. & Rockland., K.S. (1998). The connection from
cortical area V1 to V5: a light and electron microscopic study. Journal of Neuroscience, 18, 10525-10540.
Anderson, J.C. and Martin, K.A. (2002). Connection from cortical area V2 to MT in macaque monkey. Journal of Comparative Neurology, 443, 56-70.
Anstis, S. M. (1990). Imperceptible intersections: the chopstick illusion. In AI and the Eye. New York, NY: Wiley.
Bakin, J.S., Nakayama, K. & Gilbert, C.D. (2000). Visual responses in monkey areas V1 and V2 to three-dimensional surface configurations. Journal of Neuroscience, 20, 8188-8198.
Baloch, A.A. & Grossberg, S. (1997). A neural model of high-level motion processing: line motion and formotion dynamics. Vision Research, 37, 3037-3059.
Baloch, A.A., Grossberg, S., Mingolla, E. & Nogueira, C.A.M. (1998). A neural model of first-order and second-order motion perception and magnocellular dynamics. Journal of the Optical Society of America A, 16, 953-978.
Barlow, H.B. & Levick, W.R. (1965). The mechanism of directionally selective units in rabbit’s retina. Journal of Physiology, 178, 477-504.
Berezovskii,, V. & Born, R.T. (1999). Specificity of projections from wide-field and local motion-processing regions within the middle temporal visual area of the owl monkey. The Journal of Neuroscience, 20, 1157-1169.
Berzhanskaya, J., Grossberg, S. & Mingolla, E. (2007). Laminar cortical dynamics of visual form and motion interactions during coherent object motion perception. Spatial Vision, 20, 337-395.
Bichot, N.P. & Schall, J.D. (1996). Thompson KG Visual feature selectivity in frontal eye fields induced by experience in mature macaques. Nature, 381, 697-699.
Born, R.T. (2000). Center-surround interactions in the middle temporal visual area of the owl monkey. Journal of Neurophysiology, 84, 2658-2669.
Born, R. & Tootell, R. (1992). Segregation of global and local motion processing in macaque middle temporal cortex. Nature, 357, 497-499.
Braddick, O.J. (1980). Low-level and high-level processes in apparent motion. Philosophical Transactions of the Royal Society of London Series B, 290, 137-151.
Bradley, D.C. and Andersen, R.A. (1998) Center-surround antagonism based on disparity in primate area MT. Journal of Neuroscience, 18, 552-565.
Bradley, D.C., Chang G.C. & Andersen, R.A. (1998). Encoding of three-dimensional structure-from-motion by primate area MT neurons. Nature, 392, 714-717.
Bregman, A.L. (1981). Asking the “what for” question in auditory perception. In M. Kubovy and J. R. Pomerantz (eds.), Perceptual organization. Hillsdale, NJ: Earlbaum Associate.
Bullier, J. (2001). Integrated model of visual processing. Brain Research - Brain Research Reviews, 36, 96-107.
Callaway, E.M. (1998). Local circuits in primary visual cortex of the macaque monkey. Annual Review of Neuroscience, 21, 47-74.
Cao, Y. & Grossberg, S. (2005). A laminar cortical model of stereopsis and 3D surface perception: Closure and da Vinci stereopsis. Spatial Vision, 18, 515-578.
Carandini, M. & Ferster, D. (1997). Visual adaptation hyperpolarizes cells of the cat striate
16
cortex. Science, 276, 949. Castet, E., Lorenceau, J., Shiffrar, M. & Bonnet, C. (1993) Perceived speed of moving lines
depends on orientation, length, speed and luminance. Vision Research, 33, 1921-1936. Chance, F.S., Nelson., S.B. & Abbott, L.F. (1998). Synaptic depression and the temporal
response characteristics of V1 cells. Journal of Neuroscience, 18, 4785-4799. Chey, J., Grossberg, S. & Mingolla, E. (1997). Neural dynamics of motion processing and speed
discrimination. Vision Research, 38, 2769-2786. Chey, J., Grossberg, S. & Mingolla, E. (1998). Neural dynamics of motion processing and speed
discrimination. Vision Research, 38, 2769-2786. DeAngelis, G.C. & Uka, T. (2003). Coding of horizontal disparity and velocity by MT neurons
in the alert macaque. Journal of Neurophysiology, 89, 1094-1111. DeYoe, E.A. & Van Essen, D.C. (1985). Segregation of efferent connections and receptive field
properties in visual area V2 of the macaque. Nature, 317, 58-61. Dresp, B., Durand, S. & Grossberg, S. (2002). Depth perception from pairs of overlapping cues
in pictorial displays. Spatial Vision, 15, 255-276. Duncan, R.O., Albright, T.D. & Stoner, G.R. (2000). Occlusion and the interpretation of visual
motion: perceptual and neuronal effects of context. Journal of Neuroscience, 20, 5885-5897. Duncker, K. (1937). Induced motion. In W.E. Ellis (Ed.), A Sourcebook of Gestalt Psychology.
London: Routledge and Kegan Paul. (Original work published in 1929). Eifuku, S. & Wurtz, R.H. (1998). Response to motion in extrastriate area MSTl: Center-surround
interactions. Journal of Neurophysiology, 80, 282-296. Enroth-Cugell, C. & Robson, J. (1966). The contrast sensitivity of retinal ganglion cells of the
cat. Journal of Physiology (London), 187, 517-552. Fang, L. & Grossberg, S. (2007). From stereogram to surface: How the brain sees the world in
depth. Spatial Vision, in press. Ferrera, V.P. & Wilson, H.R. (1987). Direction specific masking and the analysis of motion in
two dimensions. Vision Research, 27, 1783-1796. Ferrera, V.P. & Wilson, H.R. (1990). Perceived direction of moving two-dimensional patterns.
Vision Research, 30, 273-387. Ferrera, V.P. & Wilson, H.R. (1991). Perceived speed of moving two-dimensional patterns.
Vision Research, 31, 877-893. Fried, S.I., Münch, T.A. & Werblin, F.S. (2002). Mechanisms and circuitry underlying
directional selectivity in the retina. Nature, 420, 411-414. Grossberg, S. (1973). Contour enhancement, short-term memory, and constancies in
reverberating neural networks. Studies in Applied Mathematics, 52, 213-257. Grossberg, S. (1978). A theory of human memory: Self-organization and performance of
sensory-motor codes, maps, and plans. In R. Rosen and F. Snell (Eds.), Progress in theoretical biology, Volume 5 (p. 233-374). New York, NY: Academic Press.
Grossberg, S. (1980). How does a brain build a cognitive code? Psychological Review, 87, 1-51. Grossberg, S. (1991). Why do parallel cortical systems exist for the perception of static form and
moving form? Perception and Psychophysics, 49, 117-141. Grossberg, S. (1994). 3-D vision and figure-ground separation by visual cortex. Perception &
Psychophysics, 55, 48-121. Grossberg, S. (1997). Cortical dynamics of three-dimensional figure-ground perception of two-
dimensional pictures. Psychological Review, 104, 618-658. Grossberg, S. (1999). How does the cerebral cortex work? Learning, attention and grouping by
17
the laminar circuits of visual cortex. Spatial Vision, 12, 163-185. Grossberg, S. (2000). The complementary brain: Unifying brain dynamics and modularity.
Trends in Cognitive Sciences, 4, 233-246. Grossberg, S., Mingolla, E. & Viswanathan, L. (2001). Neural dynamics of motion integration
and segmentation within and across apertures. Vision Research, 41, 2351-2553. Grossberg, S. (2003). How does the cerebral cortex work? Development, learning, attention, and
3D vision by laminar circuits of visual cortex. Behavioral and Cognitive Neuroscience Reviews, 2, 47-76.
Grossberg, S. & Mingolla, E. (1985a). Neural dynamics of form perception: Boundary completion, illusory figures, and neon color spreading. Psychological Review, 92, 173-211
Grossberg, S. & Mingolla, E. (1985b). Neural dynamics of perceptual grouping: Textures, boundaries, and emergent segmentations. Perception and Psychophysics, 38, 141-171.
Grossberg, S. & Pearson, L. (2006). Laminar cortical dynamics of cognitive and motor working memory, sequence learning and performance: Towards a unified theory of how the cerebral cortex works. CAS/CNS Tech Report-2006-002. Submitted for publication.
Grossberg, S. & Pilly, P. (2007). Neural dynamics of probabilistic decision making during motion perception in the visual cortex. . CAS/CNS Tech Report-2007-001. Vision Research, in press.
Grossberg, S. & Raizada, R.D. (2000). Contrast-sensitive perceptual grouping and object-based attention in the laminar circuits of primary visual cortex. Vision Research, 40, 1413-1432.
Grossberg, S. & Rudd, M. (1989). A neural architecture for visual motion perception: group and element apparent motion. Neural Networks, 2, 421-450.
Grossberg, S. & Rudd, M.E. (1992). Cortical dynamics of visual motion perception: short-range and long-range apparent motion. Psychological Review, 99, 78-121.
Grossberg, S. & Seitz, A. (2003). Laminar development of receptive fields, maps and columns in visual cortex: the coordinating role of the subplate. Cerebral Cortex, 13, 852-863.
Grossberg, S. & Swaminathan, G. (2004). A laminar cortical model for 3D perception of slanted and curved surfaces and of 2D images: development, attention, and bistability. Vision Research, 44, 1147-1187.
Grossberg S. & Williamson J.R. (2001). A neural model of how horizontal and interlaminar connections of visual cortex develop into adult circuits that carry out perceptual grouping and learning. Cerebral Cortex, 11, 37-58.
Grossberg, S. & Yazdanbaksh, A. (2005). Laminar cortical dynamics of 3D surface perception: Stratification, transparency, and neon color spreading. Vision Research, 45, 1725-1743.
Grunewald, A., Bradley, D.C. & Andersen, R.A. (2002). Neural correlates of structure-from-motion perception in macaque V1 and MT. Journal of Neuroscience, 22, 6195-6207.
Hochstein, S. & Shapley, R.M. (1976a). Linear and nonlinear spatial subunits in Y cat retinal ganglion cells. Journal of Physiology, 262, 265-284.
Hochstein, S. & Shapley R.M. (1976b). Quantitative analysis of retinal ganglion cell classifications. Journal of Physiology, 262, 237-264.
Horwitz, G.D. & Newsome, W.T. (2001a). Target Selection for Saccadic Eye Movements: Direction-Selective Visual Responses in the Superior Colliculus. Journal of Neurophysiology, 86, 2527-2542.
Horwitz, G.D., Batista, A.P. & Newsome, W.T. (2004a). Direction-selective visual responses in macaque superior colliculus induced by behavioral training. Neuroscience Letters, 366, 315-319.
18
Hupé, J.M., James, A.C., Payne, B.R., Lomber, S.G., Girard, P. & Bullier, J. (1998). Cortical feedback improves discrimination between figure and background by V1, V2 and V3 neurons. Nature, 394, 784-787.
Hupé, J.M. & Rubin, N. (2003). The dynamics of bi-stable alternation in ambiguous motion displays: a fresh look at plaids. Vision Research, 43, 531-548.
Jones, H.E., Grieve, K.L., Wang, W. & Sillito, A.M. (2001). Surround suppression in primate V1. Journal of Neurophysiology, 86, 2011-2028.
Kanizsa, G. (1979). Organization in vision: essays on Gestalt perception. NewYork, NY: Praeger Press.
Kelly, F. J. & Grossberg, S. (2000). Neural dynamics of 3-D surface perception: Figure-ground separation and lightness perception. Perception & Psychophysics, 62, 1596-1619.
Kennedy, H. & Bullier, J. (1985). A double-labeling investigation of the afferent connectivity to cortical areas V1 and V2 of the macaque monkey. Journal of Neuroscience, 5, 2815-2830.
Kim, J. & Wilson, H.R. (1993). Dependence of plaid motion coherence on component grating directions. Vision Research, 33, 2479-2489.
Lidén, L. & Mingolla, E. (1998). Monocular occlusion cues alter the influence of terminator motion in the barber pole phenomenon. Vision Research, 38, 3883-3898.
Lindsey, D.T. & Todd, J.T. (1996). On the relative contributions of motion energy and transparency to the perception of moving plaids. Vision Research, 36, 207-222.
Livingstone, M.S. (1998). Mechanisms of direction selectivity in macaque V1. Neuron, 20, 509-526.
Livingstone, M.S. & Conway, B.R. (2003). Substructure of direction-selective receptive fields in macaque V1. Journal of Neurophysiology, 89, 2743-2759.
Livingstone, M.S. & Hubel, D.H. (1984). Anatomy and physiology of a color system in the primate visual cortex. Journal of Neuroscience, 4, 309-356.
Lorenceau, J. & Alais, D. (2001). Form constraints in motion binding. Nature Neuroscience, 4, 745-751.
Marr, D. & Ullman, S. (1981). Directional selectivity and its use in early visual processing. Proceedings of the Royal Society of London B, 211, 151-180.
Movshon, J.A. & Newsome, W.T. (1996). Visual response properties of striate cortical neurons projecting to area MT in macaque monkeys. Journal of Neuroscience. 16, 7733-7741.
Murthy, A. & Humphrey, A.L. (1999). Inhibitory contributions to spatiotemporal receptive-field structure and direction selectivity in simple cells of cat area 17. Journal of Neurophysiology, 81, 1212-1224.
Nakayama, K., Shimojo, S. & Silverman, G.H. (1989). Stereoscopic depth: its relation to image segmentation, grouping, and the recognition of occluded objects. Perception, 18, 55-68.
Pack, C.C. & Born, R. T. (2001). Temporal dynamics of a neural solution to the aperture problem in visual area MT of macaque brain. Nature, 409, 1040-1042.
Pack, C.C., Gartland, A.J. & Born, R.T. (2004). Integration of contour and terminator signals in visual area MT of alert macaque. Journal of Neuroscience, 24, 3268-3280.
Pack, C., Grossberg, S. & Mingolla, E. (2001). A neural model of smooth pursuit control and motion perception by cortical area MST. Journal of Cognitive Neuroscience, 13, 102-120.
Palanca, B.J. & DeAngelis, G.C. (2003). Macaque middle temporal neurons signal depth in the absence of motion. Journal of Neuroscience, 23, 7647-7658.
Pilly, P. K., & Grossberg, S. (2005). Brain without Bayes: Temporal dynamics of decision-making in the laminar circuits of visual cortex. Society of Neuroscience Abstracts, 591.1.
19
Pilly, P. K., & Grossberg, S. (2006). Brain without Bayes: Temporal dynamics of decision-making during form and motion perception by the laminar circuits of visual cortex. Journal of Vision, 6, 886.
Ponce, C.R., Lomber, S.G. & Born R.T. (2006). Modality-specific changes in tuning properties of MT neurons during inactivation of the indirect (V2/V3) pathway in alert macaques. Society for Neuroscience abstracts, Atlanta, GA.
Raizada RD. & Grossberg S. (2003). Towards a theory of the laminar architecture of cerebral cortex: Computational clues from the visual system. Cerebral Cortex, 13, 100-113.
Reichardt W. (1961). In W.A. Rosenblith (ed.), Sensory Communication (p. 303). New York, NY: Wiley.
Rockland, K.S. (1992) Laminar distribution of neurons projecting from area V1 to V2 in macaque and squirrel monkeys. Cerebral Cortex, 2, 38-47.
Rockland, K.S. (1995). Morphology of individual axons projecting from area V2 to MT in the macaque. Journal of Comparative Neurology, 355, 15-26.
Rockland, K.S. (2002). Visual cortical organization at the single axon level: a beginning. Neuroscience Research, 42, 155-166.
Rockland, K.S. & Pandya, D.N. (1981). Cortical connections of the occipital lobe ian the rhesus monkey: interconnections between areas 17, 18, 19 and the superior temporal sulcus. Brain Research, 212, 249-270.
Roitman, J.D. & Shadlen, M.N. (2002). Response of Neurons in the Lateral Intraparietal Area during a Combined Visual Discrimination Reaction Time Task. Journal of Neuroscience, 22, 9475-9489.
Rust, N.C., Majaj, N.J., Simoncelli, E.P. & Movshon, J.A. (2002). Gain control in Macaque area MT is directionally selective. Society for Neuroscience Abstracts, Orlando, Florida.
Shadlen, M.N. & Newsome, W.T. (2001). Neural Basis of a Perceptual Decision in the Parietal Cortex (Area LIP) of the Rhesus Monkey. Journal of Neurophysiology, 86, 1916-1936.
Shimojo, S., Silverman, G.H. & Nakayama, K. (1989). Occlusion and the solution to the aperture problem for motion. Vision Research, 29, 619-626.
Shipp, S. & Zeki, S. (1985). Segregation of pathways leading from area V2 to areas V4 and V5 of macaque monkey visual cortex. Nature, 315, 322-325.
Shipp, S. & Zeki, S. (1989). The organization of connections between areas V5 and V1 in Macaque visual cortex. European Journal of Neuroscience, 1, 309-332.
Sincich, L.C. & Horton, J.C. (2002). Divided by cytochrome oxidase: a map of the projections from V1 to V2 in macaques. Science, 295, 1734-1737.
Sincich, L.C. & Horton, J.C. (2003). Independent projection streams from macaque striate cortex to the second visual area and middle temporal area. Journal of Neuroscience, 23, 5684-5692.
Snowden, R.J., Treue, S., Erickson R.G. & Andersen R.A. (1991). The response of area MT and V1 neurons to transparent motion. Journal of Neuroscience, 11, 2768-2785.
Stone, L.S., Watson, A.B. & Mulligan, J.B. (1990). Effect of contrast on the perceived direction of a moving plaid. Vision Research, 30, 1049-1067.
Stoner, G.R., Albright, T.D. & Ramachandran, V.S. (1990). Transparency and coherence in human motion perception. Nature, 344, 153-155.
Stoner, G.R. & Albright, T.D. (1998). Luminance contrast affects motion coherency in plaid patterns by acting as a depth-from-occlusion cue. Vision Research, 38, 387-401.
Tanaka, K., Sugita, Y., Moriya, M. & Saito, H. (1993). Analysis of object motion in the ventral
20
part of the medial superior temporal area of the macaque visual cortex. Journal of Neurophysiology, 69, 128-142.
Treue, S. & Maunsell, J.H. (1999). Effects of attention on the processing of motion in macaque middle temporal and medial superior temporal visual cortical areas. Journal of Neuroscience, 19, 7591-7602.
Trueswell, J.C. & Hayhoe, M.M. (1993). Surface segmentation mechanisms and motion perception. Vision Research, 33, 313-323.
Tse, P.U. (2005). Voluntary attention modulates the brightness of overlapping transparent surfaces. Vision Research, 45, 1095-1098.
Vallortigara, G., Bressan, P. & Bertamini, M. (1988). Perceptual alternations in stereokinesis. Perception, 17, 4.-31.
van Santen, J.P. & Sperling, G. (1985) Elaborated Reichardt detectors. Journal of the Optical Society of America A., 2, 300-321.
Varela, J.A., Sen, K., Gibson, J., Fost, J., Abbott, L.F. & Nelson., S.B. (1997). A quantitative description of short-term plasticity at excitatory synapses in Layer 2/3 of rat primary visual cortex. Journal of Neuroscience, 17, 7926-7940.
Wallach, H. (1935). On the visually perceived direction of motion. Psychologische Forschung, 20, 325-380.
Wallach, H. (1976). On Perception. New York: Quadrangle. Weiss, Y. & Adelson, E.H. (2000). Adventures with gelatinous ellipses—constraints on models
of human motion analysis. Perception, 29, 543-566. Wuerger, S., Shapley, R. & Rubin, N. (1996). ‘On the visually perceived direction of motion’ by
Hans Wallach: 60 years later. Perception, 25, 1317-1367. Xiao, D.K., Raiguel, S., Marcar, V. & Orban, G.A. (1997). The spatial distribution of the
antagonistic surround of MT/V5 neurons. Cerebral Cortex, 7, 662-677. Xu, X., Bonds, A.B. & Casagrande, V.A. (2002). Modeling receptive-field structure of
koniocellular, magnocellular, and parvocellular LGN cells in the owl monkey (Aotus trivigatus). Visual Neuroscience, 19, 703-711.
Yabuta, N.H., Sawatari, A. & Callaway, E.M. (2001). Two functional channels from primary visual cortex to dorsal visual cortical areas. Science, 292, 297-300.
Yabuta, N.H. & Callaway, E.M. (1998) Functional streams and local connections of layer 4C neurons in primary visual cortex of the macaque monkey. Journal of Neuroscience, 18, 9489-9499.
Yo, C. & Wilson, H.R. (1991). Perceived speed of moving two-dimensional patterns depents on duration, contrast and eccentricity. Vision Research, 32, 877-893.
Zhou, H., Friedman, H.S. & von der Heydt, R. (2000). Coding of border ownership in monkey visual cortex. Journal of Neuroscience, 20, 6594-6611
21
Connection/Functional property Selected references Functional projections V1 4Ca to 4B Yabuta et al., 2001, Yabuta & Callaway, 1998 V1 to MT Anderson et al.,1998; Rockland, 2002; Sincich &
Horton 2003, Movshon & Newsome, 1996 V1 to V2 Rockland, 1992, Sincich & Horton, 2002 V2 to MT Anderson & Martin, 2002; Rockland 2002; Shipp &
Zeki 1985; DeYoe & Van Essen 1985 MT to V1 feedback Shipp & Zeki 1989; Callaway 1998; Movshon &
Newsome 1996; Hupé et al., 1998 V2 to V1 feedback Rockland & Pandya, 1981; Kennedy & Bullier 1985 Properties V1 adaptation Abbott et al.,1997; Chance et al., 1998; (rat);
Carandini & Ferster, 1997, (cat) V1(4ca) transient nondirectional cells Livingstone & Hubel, 1984 V1 spatially offset inhibition Livingstone, 1998; Livingstone & Conway, 2003;
Murthy & Humphrey, 1999 (cat) V2 figure-ground separation Zhou et al., 2000; Bakin et al., 2000 MT figure-ground separation and disparity sensitivity
Bradley et al., 1998, Grunewald et al., 2002; Palanca & DeAngelis 2003
MT center- surround receptive fields Bradley & Andersen, 1998; Born, 2000; DeAngelis & Uka, 2003
Some MT receptive fields elongated in preferred direction of motion Xiao et al.,1997 Attentional modulation in MT Treue & Maunsell, 1999 Predictions Short-range anisotropic filter in V1 (motion stream) Long-range anisotropic filter in MT (motion)* V2 to MT projection carries figure-ground completed-form-in-depth separation signal MT to V1 feedback carries figure-ground separation signal from motion to form stream MST to MT feedback helps solve aperture problem by selecting consistent motion directions
*Although Xiao et al, 1997 found that some MT neurons have receptive fields that are elongated along the preferred direction of motion, there is no direct evidence that these neurons participate preferentially in motion grouping.
Table 1. Functional projections and properties of model cell types and predictions. [Reprinted with permission from Berzhanskaya et al. (2007)]
22
Depth-separated boundaries
BIPOLE cells (grouping and
cross-orientation competition)
SIMPLE CELLS
(orientation selectivity)
HYPERCOMPLEX cells(end-stopping,
spatial sharpening)
COMPLEX CELLS(contrast pooling
orientation selectivity)
LGN boundaries
Directional grouping,
attentional priming
Long-range motion filterand boundary selection
in depth
Competition across space,Within direction
Short-range motion filter
Transient cells,
directional selectivity
LGN boundaries
V1
V2
MT
MST
V1
Form Motion
Figure 1. The 3D FORMOTION model processing stages. See text for details. [Reprinted with permission from Berzhanskaya et al. (2007)]
23
Figure 2. Effects of line length and orientation on perceived speed of horizontally moving lines. Relative perceived speed for three different line orientations and lengths are shown as percentages of the perceived speed of a vertical line of the same length. Part (A) shows data from Castet et al. (p. 1925). Each data line corresponds to a different line length (0.21, 0.88, and 1.76 deg). The horizontal axis shows the ratio of the speed normal to the line’s orientation relative to the actual translation speed. The three data points from left to right for each line length correspond to line angles of 60, 45, and 30 deg from vertical, respectively. The horizontal dotted line indicates a veridical speed perception; results below this line indicate a bias toward the perception of slower speeds. Part (B) shows simulation results, also for three lengths and orientations. In both cases perceived relative speed decreases with line length and angle from vertical. Simulated lines use slightly different orientations from those in the experiments so that the simulated input conforms to the Cartesian grid. [Reprinted with permission from Chey et al. (1997).]
24
Motion
MT
2/3
4C
4B
5/6
4
Long-range
motion
grouping
MST
Boundary
selection
of motion
in depth
Directional
grouping and
suppression in
depth
Spatial
competition and
opponent
direction
inhibition
Short range
motion grouping
Directional
transients
Nondirectional
transients
- + -
-
-
Form
V1
Bipole
Hyper
complex
Complex
Simple
2/3
V2
Simplified V2 Bipoles
D1
D2
4C
+ -- + -
- -
- + -- + -
+
Center-
surround
(LGN-like V1)
-
surround
like V1)Center-
surround
(LGN-like V1)
-
surround
like V1)
Figure 3. Laminar circuits of 3D FORMOTION model. See text for details. [Reprinted with permission from Berzhanskaya et al. (2007).]
25
Intrinsic
Extrinsic
Figure 4. Extrinsic and intrinsic terminators: The local motion of the intrinsic terminator on the left reflects the true object motion, while the local motion of the extrinsic terminator on the right follows the vertical outline of the occluder.
26
C D
A B
Figure 5. Chopsticks illusion: Actual chopsticks motion (clear arrows, top) is equivalent in (A) and (B), with visible and invisible occluders, respectively. Visible occluders result in a coherent vertical motion percept (C, hatched arrow). Invisible occluders result in the percept of two chopsticks sliding in opposite directions (D). [Rerpinted with permission from Berzhanskaya et al. (2007).]
27
difficulteasy
A B C ED F
difficult
Figure 6. Lorenceau-Alais displays: Visible (A-C) and invisible (D-F) occluder cases. See text for details.
28
Figure 7. Schematic diagram of a 1D implementation of the transient cell network showing the first two frames of the motion sequence. Thick circles represent active unidirectional transient cells while thin circles are inactive unidirectional transient cells. Ovals containing arrows represent directionally selective neurons. Unfilled ovals represent active cells, cross-filled ovals are inhibited cells and gray-filled ovals depict inactive cells. Excitatory and inhibitory connections are labeled by ‘+’ and ‘−’ signs respectively. [Reprinted with permission from Grossberg et al. (2001).]
29
Figure 8. Retina/LGN-V1-MT-MST-LIP-BG model processing stages. See text and Appendix for details. The random dot motion stimuli are preprocessed by the model Retina/LGN and processed by the model cortical V1-MT-MST stream. They contextually transform locally ambiguous motion signals into unambiguous global object motion signals with a rate, amplitude, and direction that covaries with the amount of dot coherence. These spatially distributed global motion signals then feed into model area LIP to generate appropriate directional saccadic eye movement commands, which are gated by the model basal ganglia. [Rerpinted with permission from Grossberg and Pilly (2007).]
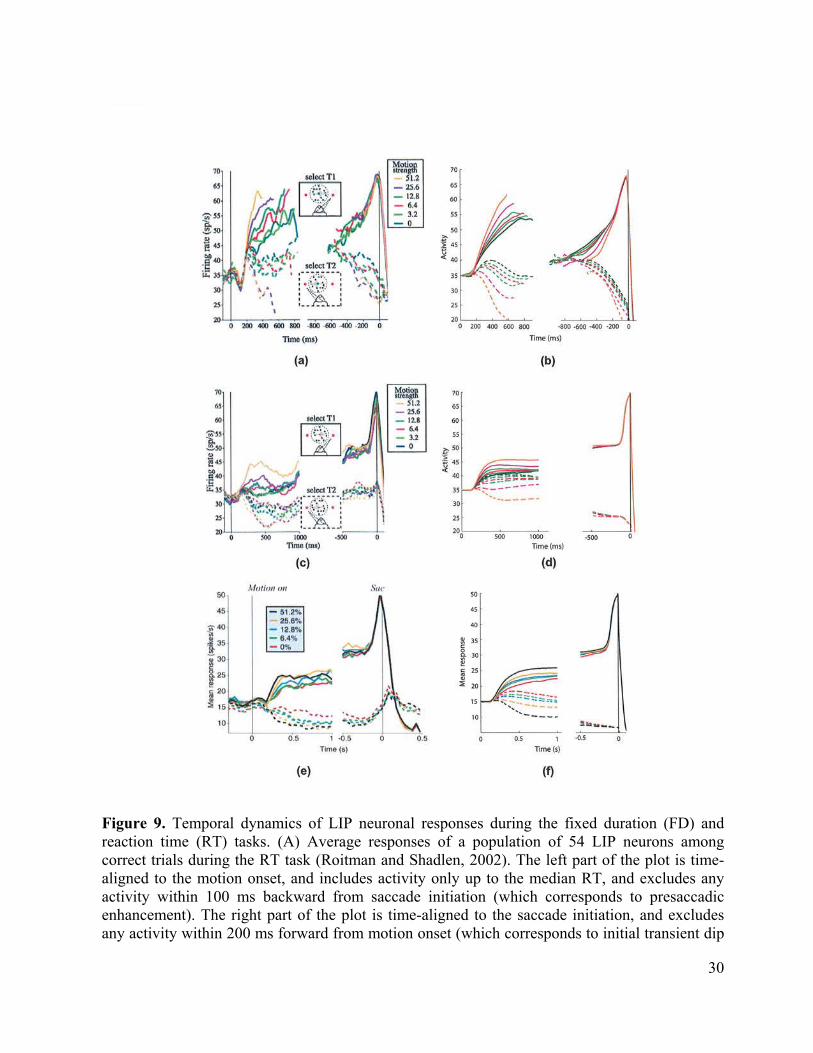
30
Figure 9. Temporal dynamics of LIP neuronal responses during the fixed duration (FD) and reaction time (RT) tasks. (A) Average responses of a population of 54 LIP neurons among correct trials during the RT task (Roitman and Shadlen, 2002). The left part of the plot is time-aligned to the motion onset, and includes activity only up to the median RT, and excludes any activity within 100 ms backward from saccade initiation (which corresponds to presaccadic enhancement). The right part of the plot is time-aligned to the saccade initiation, and excludes any activity within 200 ms forward from motion onset (which corresponds to initial transient dip
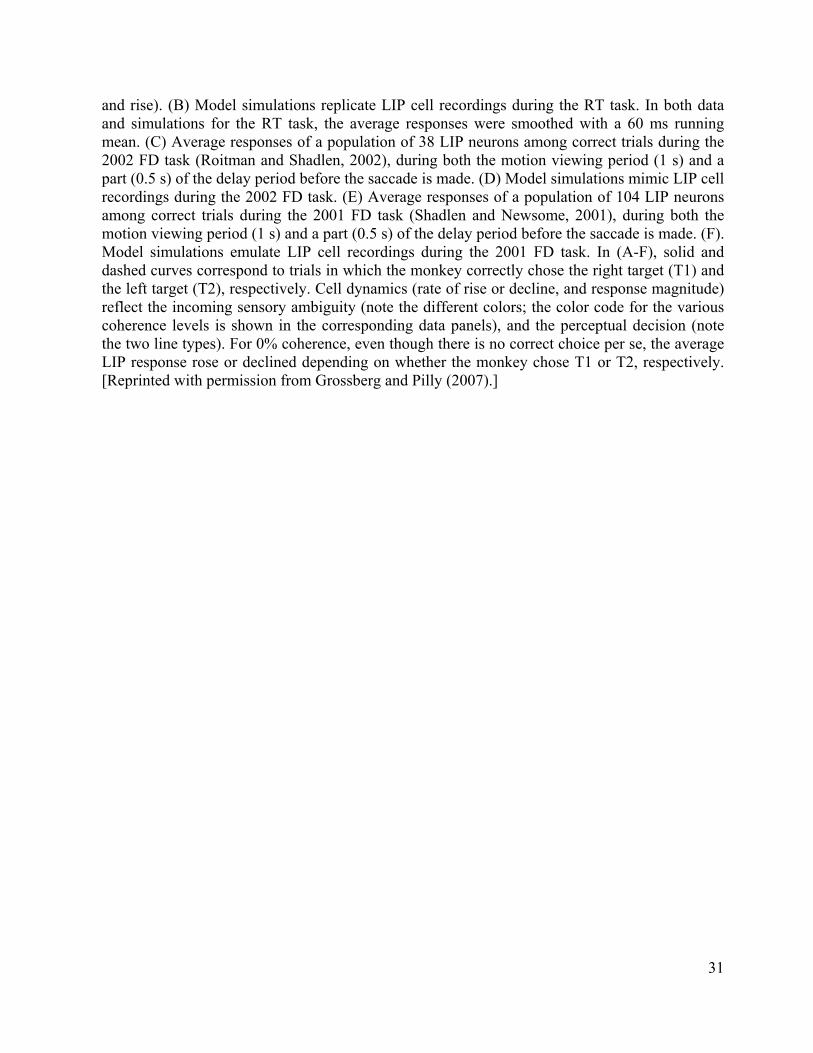
31
and rise). (B) Model simulations replicate LIP cell recordings during the RT task. In both data and simulations for the RT task, the average responses were smoothed with a 60 ms running mean. (C) Average responses of a population of 38 LIP neurons among correct trials during the 2002 FD task (Roitman and Shadlen, 2002), during both the motion viewing period (1 s) and a part (0.5 s) of the delay period before the saccade is made. (D) Model simulations mimic LIP cell recordings during the 2002 FD task. (E) Average responses of a population of 104 LIP neurons among correct trials during the 2001 FD task (Shadlen and Newsome, 2001), during both the motion viewing period (1 s) and a part (0.5 s) of the delay period before the saccade is made. (F). Model simulations emulate LIP cell recordings during the 2001 FD task. In (A-F), solid and dashed curves correspond to trials in which the monkey correctly chose the right target (T1) and the left target (T2), respectively. Cell dynamics (rate of rise or decline, and response magnitude) reflect the incoming sensory ambiguity (note the different colors; the color code for the various coherence levels is shown in the corresponding data panels), and the perceptual decision (note the two line types). For 0% coherence, even though there is no correct choice per se, the average LIP response rose or declined depending on whether the monkey chose T1 or T2, respectively. [Reprinted with permission from Grossberg and Pilly (2007).]