Understanding the Subsynchronous Oscillation ... - NTNU Open

Neuropsychologia 51 (2013 ) 1287 –1295
Contents lists available at SciVerse ScienceDirect
Neuropsychologia
0028-39http://d
n CorrUniversTel.: +35
E-mmcbran
journal homepage: www.elsevier.com/locate/neuropsychologia
Neural correlates of visual integration in Williams syndrome: Gammaoscillation patterns in a model of impaired coherence
Inês Bernardino a, João Castelhano a, Reza Farivar b, Eduardo D. Silva a,c, Miguel Castelo-Branco a,n
a Visual Neuroscience Laboratory, IBILI, Faculty of Medicine, University of Coimbra, Coimbra, Portugalb Harvard Medical School and Massachusetts General Hospital, A. Athinoula Martinos Center for Biomedical Imaging, Charlestown, MA, USAc Centre for Hereditary Eye Diseases, Department of Ophthalmology, University Hospital Coimbra, Coimbra, Portugal
a r t i c l e i n f o
Article history:Received 5 November 2012Received in revised form4 March 2013Accepted 27 March 2013Available online 12 April 2013
Keywords:Williams syndromeLow-gamma oscillations3D integrationVisual coherenceEEG/ERP
32/$ - see front matter & 2013 Elsevier Ltd. Ax.doi.org/10.1016/j.neuropsychologia.2013.03.0
espondence to: Visual Neuroscience Laboratoity of Coimbra, Azinhaga de Santa Comba, 31239480200; fax: +351239480217.ail addresses: [email protected],[email protected] (M. Castelo-Branco).
a b s t r a c t
Williams syndrome (WS) is a clinical model of dorsal stream vulnerability and impaired visualintegration. However, little is still known about the neurophysiological correlates of perceptualintegration in this condition. We have used a 3D structure-from-motion (SFM) integrative task tocharacterize the neuronal underpinnings of 3D perception in WS and to probe whether gammaoscillatory patterns reflect changed holistic perception. Coherent faces were parametrically modulatedin 3D depth (three different depth levels) to vary levels of stimulus ambiguity. We have found that theelectrophysiological (EEG/ERP) correlates of such holistic percepts were distinct across groups. Indepen-dent component analysis demonstrated the presence of a novel component with a late positivity around200 ms that was absent in controls. Source localization analysis of ERP signals showed a posterioroccipital shift in WS and reduced parietal dorsal stream sources. Interestingly, low gamma-bandoscillations (20–40 Hz) induced by this 3D perceptual integration task were significantly stronger andsustained during the stimulus presentation in WS whereas high gamma-band oscillations (60–90 Hz)were reduced in this clinical model of impaired visual coherence, as compared to controls.
These observations suggest that dorsal stream processing of 3D SFM stimuli has distinct neuralcorrelates in WS and different cognitive strategies are employed by these patients to reach visualcoherence. Importantly, we found evidence for the presence of different sub-bands (20–40 Hz/60–90 Hz)within the gamma range which can be dissociated concerning the respective role on the coherentpercept formation, both in typical and atypical development.
& 2013 Elsevier Ltd. All rights reserved.
1. Introduction
Williams syndrome (WS) is a clinical model of dorsal streamvulnerability and impaired visual integration. This rare geneticneurodevelopmental disorder, with a prevalence of 1 in 7500 to20,000 live births (Stromme, Bjornstad, & Ramstad, 2002) resultsfrom a hemideletion on chromosome 7q11.23 (Bayes, Magano,Rivera, Flores, & Perez Jurado, 2003; Korenberg et al., 2000). Itinvolves a distinct cognitive profile of relative weaknesses andstrengths and is an important model of impaired visual integrationand coherence (Bellugi, Lichtenberger, Jones, Lai, & George, 2000;Wang, Doherty, Rourke, & Bellugi, 1995). Accordingly, thesepatients exhibit a tendency to focus on parts or details of animage and consequently fail in integrating local and global levels
ll rights reserved.20
ry, IBILI-Faculty of Medicine,000-354 Coimbra, Portugal.
of analysis such as in hierarchical figures (Bernardino et al., 2012).Moreover, the presence of visuospatial impairments along withmotion coherence deficits has been described as the hallmark inthis condition (Atkinson et al., 2006; Bellugi et al., 2000). A neuralcorrelate for such developmental deficits has been corroborated bystructural and functional imaging data showing dorsal visualpathway vulnerability (Eckert et al., 2006; Eckert et al., 2005;Jackowski et al., 2009; Meyer-Lindenberg et al., 2004; Meyer-Lindenberg, Mervis, & Berman, 2006; Mobbs et al., 2007; Reisset al., 2004; Reiss et al., 2000). This pathway, projecting fromoccipital to parietal regions, plays an important role for spatialprocessing and has been described as subserving motion proces-sing and 3D depth perception (Milner & Goodale, 2008). Takentogether, these evidences suggest WS as a representative model ofimpaired visual integration and coherence associated with dorsalvisual stream dysfunction.
The magnitude of visual coherence deficits has been welldocumented in WS by behavioural studies focusing on 2D and3D motion coherence, requiring the integration of local signalsinto object percepts (Atkinson et al., 2003, 2006; Castelo-Branco
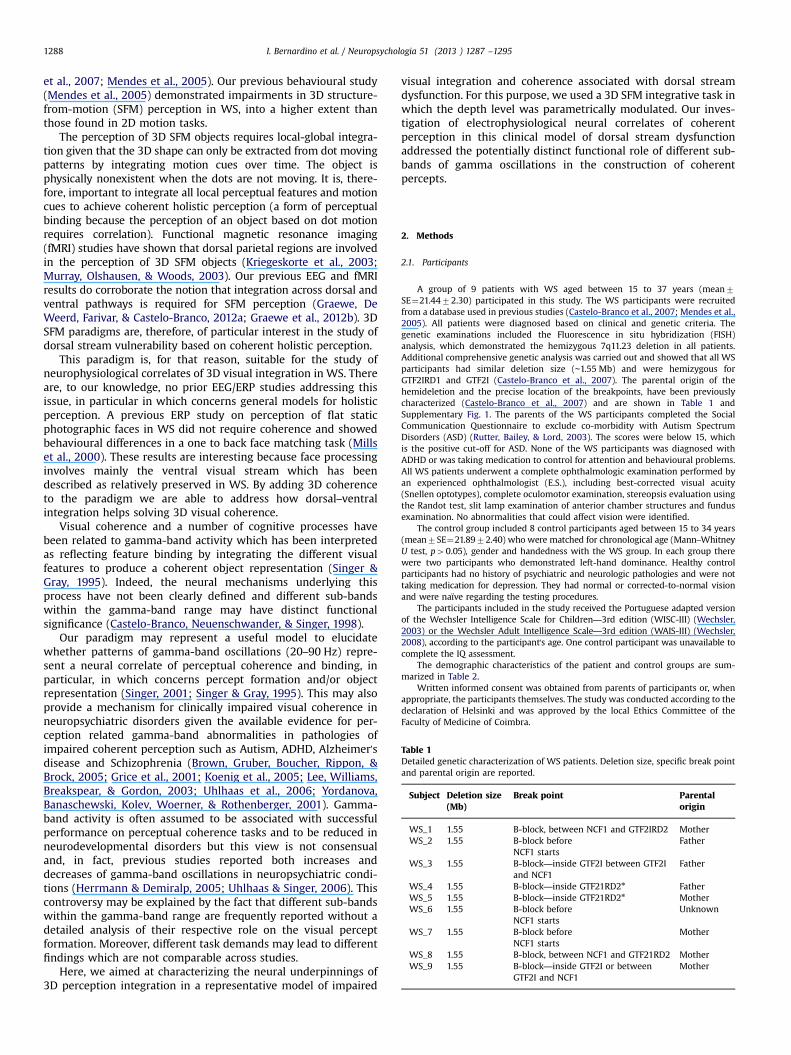
Table 1Detailed genetic characterization of WS patients. Deletion size, specific break pointand parental origin are reported.
Subject Deletion size(Mb)
Break point Parentalorigin
WS_1 1.55 B-block, between NCF1 and GTF2IRD2 MotherWS_2 1.55 B-block before Father
NCF1 startsWS_3 1.55 B-block—inside GTF2I between GTF2I
and NCF1Father
WS_4 1.55 B-block—inside GTF21RD2n FatherWS_5 1.55 B-block—inside GTF21RD2n MotherWS_6 1.55 B-block before Unknown
NCF1 startsWS_7 1.55 B-block before Mother
NCF1 startsWS_8 1.55 B-block, between NCF1 and GTF21RD2 MotherWS_9 1.55 B-block—inside GTF2I or between
GTF2I and NCF1Mother
I. Bernardino et al. / Neuropsychologia 51 (2013 ) 1287 –12951288
et al., 2007; Mendes et al., 2005). Our previous behavioural study(Mendes et al., 2005) demonstrated impairments in 3D structure-from-motion (SFM) perception in WS, into a higher extent thanthose found in 2D motion tasks.
The perception of 3D SFM objects requires local-global integra-tion given that the 3D shape can only be extracted from dot movingpatterns by integrating motion cues over time. The object isphysically nonexistent when the dots are not moving. It is, there-fore, important to integrate all local perceptual features and motioncues to achieve coherent holistic perception (a form of perceptualbinding because the perception of an object based on dot motionrequires correlation). Functional magnetic resonance imaging(fMRI) studies have shown that dorsal parietal regions are involvedin the perception of 3D SFM objects (Kriegeskorte et al., 2003;Murray, Olshausen, & Woods, 2003). Our previous EEG and fMRIresults do corroborate the notion that integration across dorsal andventral pathways is required for SFM perception (Graewe, DeWeerd, Farivar, & Castelo-Branco, 2012a; Graewe et al., 2012b). 3DSFM paradigms are, therefore, of particular interest in the study ofdorsal stream vulnerability based on coherent holistic perception.
This paradigm is, for that reason, suitable for the study ofneurophysiological correlates of 3D visual integration in WS. Thereare, to our knowledge, no prior EEG/ERP studies addressing thisissue, in particular in which concerns general models for holisticperception. A previous ERP study on perception of flat staticphotographic faces in WS did not require coherence and showedbehavioural differences in a one to back face matching task (Millset al., 2000). These results are interesting because face processinginvolves mainly the ventral visual stream which has beendescribed as relatively preserved in WS. By adding 3D coherenceto the paradigm we are able to address how dorsal–ventralintegration helps solving 3D visual coherence.
Visual coherence and a number of cognitive processes havebeen related to gamma-band activity which has been interpretedas reflecting feature binding by integrating the different visualfeatures to produce a coherent object representation (Singer &Gray, 1995). Indeed, the neural mechanisms underlying thisprocess have not been clearly defined and different sub-bandswithin the gamma-band range may have distinct functionalsignificance (Castelo-Branco, Neuenschwander, & Singer, 1998).
Our paradigm may represent a useful model to elucidatewhether patterns of gamma-band oscillations (20–90 Hz) repre-sent a neural correlate of perceptual coherence and binding, inparticular, in which concerns percept formation and/or objectrepresentation (Singer, 2001; Singer & Gray, 1995). This may alsoprovide a mechanism for clinically impaired visual coherence inneuropsychiatric disorders given the available evidence for per-ception related gamma-band abnormalities in pathologies ofimpaired coherent perception such as Autism, ADHD, Alzheimer'sdisease and Schizophrenia (Brown, Gruber, Boucher, Rippon, &Brock, 2005; Grice et al., 2001; Koenig et al., 2005; Lee, Williams,Breakspear, & Gordon, 2003; Uhlhaas et al., 2006; Yordanova,Banaschewski, Kolev, Woerner, & Rothenberger, 2001). Gamma-band activity is often assumed to be associated with successfulperformance on perceptual coherence tasks and to be reduced inneurodevelopmental disorders but this view is not consensualand, in fact, previous studies reported both increases anddecreases of gamma-band oscillations in neuropsychiatric condi-tions (Herrmann & Demiralp, 2005; Uhlhaas & Singer, 2006). Thiscontroversy may be explained by the fact that different sub-bandswithin the gamma-band range are frequently reported without adetailed analysis of their respective role on the visual perceptformation. Moreover, different task demands may lead to differentfindings which are not comparable across studies.
Here, we aimed at characterizing the neural underpinnings of3D perception integration in a representative model of impaired
visual integration and coherence associated with dorsal streamdysfunction. For this purpose, we used a 3D SFM integrative task inwhich the depth level was parametrically modulated. Our inves-tigation of electrophysiological neural correlates of coherentperception in this clinical model of dorsal stream dysfunctionaddressed the potentially distinct functional role of different sub-bands of gamma oscillations in the construction of coherentpercepts.
2. Methods
2.1. Participants
A group of 9 patients with WS aged between 15 to 37 years (mean7SE¼21.4472.30) participated in this study. The WS participants were recruitedfrom a database used in previous studies (Castelo-Branco et al., 2007; Mendes et al.,2005). All patients were diagnosed based on clinical and genetic criteria. Thegenetic examinations included the Fluorescence in situ hybridization (FISH)analysis, which demonstrated the hemizygous 7q11.23 deletion in all patients.Additional comprehensive genetic analysis was carried out and showed that all WSparticipants had similar deletion size (∼1.55 Mb) and were hemizygous forGTF2IRD1 and GTF2I (Castelo-Branco et al., 2007). The parental origin of thehemideletion and the precise location of the breakpoints, have been previouslycharacterized (Castelo-Branco et al., 2007) and are shown in Table 1 andSupplementary Fig. 1. The parents of the WS participants completed the SocialCommunication Questionnaire to exclude co-morbidity with Autism SpectrumDisorders (ASD) (Rutter, Bailey, & Lord, 2003). The scores were below 15, whichis the positive cut-off for ASD. None of the WS participants was diagnosed withADHD or was taking medication to control for attention and behavioural problems.All WS patients underwent a complete ophthalmologic examination performed byan experienced ophthalmologist (E.S.), including best-corrected visual acuity(Snellen optotypes), complete oculomotor examination, stereopsis evaluation usingthe Randot test, slit lamp examination of anterior chamber structures and fundusexamination. No abnormalities that could affect vision were identified.
The control group included 8 control participants aged between 15 to 34 years(mean7SE¼21.8972.40) who were matched for chronological age (Mann–WhitneyU test, p40.05), gender and handedness with the WS group. In each group therewere two participants who demonstrated left-hand dominance. Healthy controlparticipants had no history of psychiatric and neurologic pathologies and were nottaking medication for depression. They had normal or corrected-to-normal visionand were naïve regarding the testing procedures.
The participants included in the study received the Portuguese adapted versionof the Wechsler Intelligence Scale for Children—3rd edition (WISC-III) (Wechsler,2003) or the Wechsler Adult Intelligence Scale—3rd edition (WAIS-III) (Wechsler,2008), according to the participant's age. One control participant was unavailable tocomplete the IQ assessment.
The demographic characteristics of the patient and control groups are sum-marized in Table 2.
Written informed consent was obtained from parents of participants or, whenappropriate, the participants themselves. The study was conducted according to thedeclaration of Helsinki and was approved by the local Ethics Committee of theFaculty of Medicine of Coimbra.
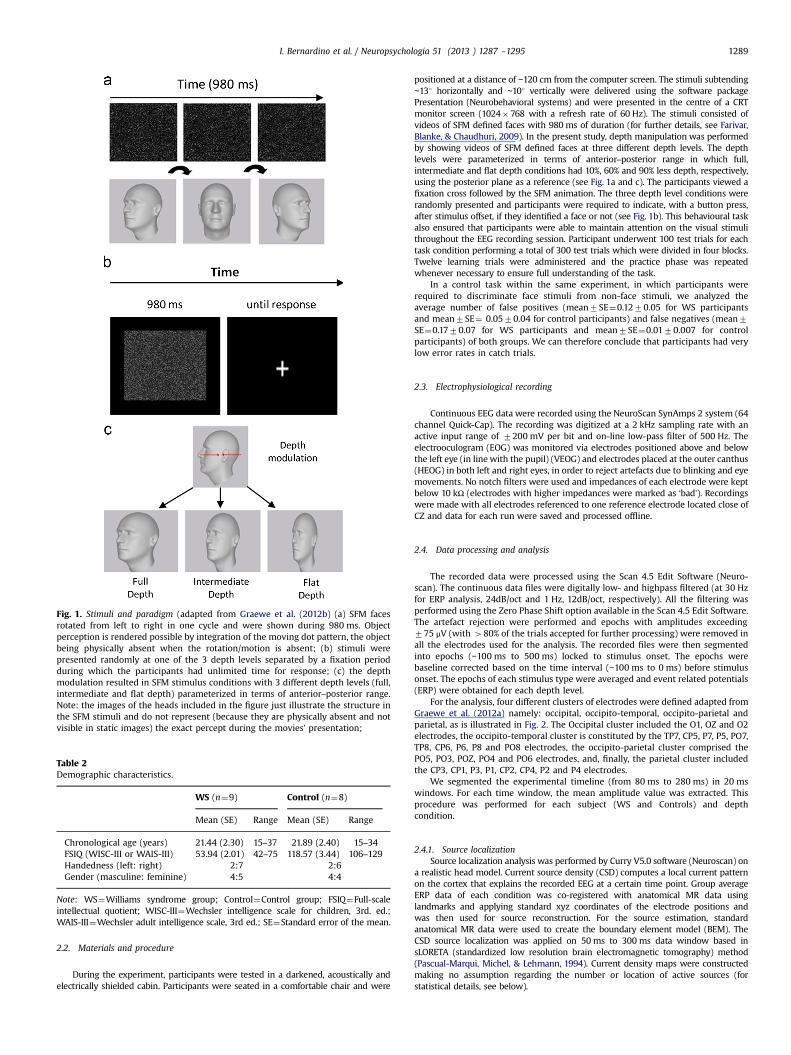
Fig. 1. Stimuli and paradigm (adapted from Graewe et al. (2012b) (a) SFM facesrotated from left to right in one cycle and were shown during 980 ms. Objectperception is rendered possible by integration of the moving dot pattern, the objectbeing physically absent when the rotation/motion is absent; (b) stimuli werepresented randomly at one of the 3 depth levels separated by a fixation periodduring which the participants had unlimited time for response; (c) the depthmodulation resulted in SFM stimulus conditions with 3 different depth levels (full,intermediate and flat depth) parameterized in terms of anterior–posterior range.Note: the images of the heads included in the figure just illustrate the structure inthe SFM stimuli and do not represent (because they are physically absent and notvisible in static images) the exact percept during the movies’ presentation;
Table 2Demographic characteristics.
WS (n¼9) Control (n¼8)
Mean (SE) Range Mean (SE) Range
Chronological age (years) 21.44 (2.30) 15–37 21.89 (2.40) 15–34FSIQ (WISC-III or WAIS-III) 53.94 (2.01) 42–75 118.57 (3.44) 106–129Handedness (left: right) 2:7 2:6Gender (masculine: feminine) 4:5 4:4
Note: WS¼Williams syndrome group; Control¼Control group; FSIQ¼Full-scaleintellectual quotient; WISC-III¼Wechsler intelligence scale for children, 3rd. ed.;WAIS-III¼Wechsler adult intelligence scale, 3rd ed.; SE¼Standard error of the mean.
I. Bernardino et al. / Neuropsychologia 51 (2013 ) 1287 –1295 1289
2.2. Materials and procedure
During the experiment, participants were tested in a darkened, acoustically andelectrically shielded cabin. Participants were seated in a comfortable chair and were
positioned at a distance of ∼120 cm from the computer screen. The stimuli subtending∼131 horizontally and ∼101 vertically were delivered using the software packagePresentation (Neurobehavioral systems) and were presented in the centre of a CRTmonitor screen (1024�768 with a refresh rate of 60 Hz). The stimuli consisted ofvideos of SFM defined faces with 980 ms of duration (for further details, see Farivar,Blanke, & Chaudhuri, 2009). In the present study, depth manipulation was performedby showing videos of SFM defined faces at three different depth levels. The depthlevels were parameterized in terms of anterior–posterior range in which full,intermediate and flat depth conditions had 10%, 60% and 90% less depth, respectively,using the posterior plane as a reference (see Fig. 1a and c). The participants viewed afixation cross followed by the SFM animation. The three depth level conditions wererandomly presented and participants were required to indicate, with a button press,after stimulus offset, if they identified a face or not (see Fig. 1b). This behavioural taskalso ensured that participants were able to maintain attention on the visual stimulithroughout the EEG recording session. Participant underwent 100 test trials for eachtask condition performing a total of 300 test trials which were divided in four blocks.Twelve learning trials were administered and the practice phase was repeatedwhenever necessary to ensure full understanding of the task.
In a control task within the same experiment, in which participants wererequired to discriminate face stimuli from non-face stimuli, we analyzed theaverage number of false positives (mean7SE¼0.1270.05 for WS participantsand mean7SE¼ 0.0570.04 for control participants) and false negatives (mean7SE¼0.1770.07 for WS participants and mean7SE¼0.0170.007 for controlparticipants) of both groups. We can therefore conclude that participants had verylow error rates in catch trials.
2.3. Electrophysiological recording
Continuous EEG data were recorded using the NeuroScan SynAmps 2 system (64channel Quick-Cap). The recording was digitized at a 2 kHz sampling rate with anactive input range of 7200 mV per bit and on-line low-pass filter of 500 Hz. Theelectrooculogram (EOG) was monitored via electrodes positioned above and belowthe left eye (in line with the pupil) (VEOG) and electrodes placed at the outer canthus(HEOG) in both left and right eyes, in order to reject artefacts due to blinking and eyemovements. No notch filters were used and impedances of each electrode were keptbelow 10 kΩ (electrodes with higher impedances were marked as ‘bad’). Recordingswere made with all electrodes referenced to one reference electrode located close ofCZ and data for each run were saved and processed offline.
2.4. Data processing and analysis
The recorded data were processed using the Scan 4.5 Edit Software (Neuro-scan). The continuous data files were digitally low- and highpass filtered (at 30 Hzfor ERP analysis, 24dB/oct and 1 Hz, 12dB/oct, respectively). All the filtering wasperformed using the Zero Phase Shift option available in the Scan 4.5 Edit Software.The artefact rejection were performed and epochs with amplitudes exceeding775 μV (with 480% of the trials accepted for further processing) were removed inall the electrodes used for the analysis. The recorded files were then segmentedinto epochs (−100 ms to 500 ms) locked to stimulus onset. The epochs werebaseline corrected based on the time interval (−100 ms to 0 ms) before stimulusonset. The epochs of each stimulus type were averaged and event related potentials(ERP) were obtained for each depth level.
For the analysis, four different clusters of electrodes were defined adapted fromGraewe et al. (2012a) namely: occipital, occipito-temporal, occipito-parietal andparietal, as is illustrated in Fig. 2. The Occipital cluster included the O1, OZ and O2electrodes, the occipito-temporal cluster is constituted by the TP7, CP5, P7, P5, PO7,TP8, CP6, P6, P8 and PO8 electrodes, the occipito-parietal cluster comprised thePO5, PO3, POZ, PO4 and PO6 electrodes, and, finally, the parietal cluster includedthe CP3, CP1, P3, P1, CP2, CP4, P2 and P4 electrodes.
We segmented the experimental timeline (from 80 ms to 280 ms) in 20 mswindows. For each time window, the mean amplitude value was extracted. Thisprocedure was performed for each subject (WS and Controls) and depthcondition.
2.4.1. Source localizationSource localization analysis was performed by Curry V5.0 software (Neuroscan) on
a realistic head model. Current source density (CSD) computes a local current patternon the cortex that explains the recorded EEG at a certain time point. Group averageERP data of each condition was co-registered with anatomical MR data usinglandmarks and applying standard xyz coordinates of the electrode positions andwas then used for source reconstruction. For the source estimation, standardanatomical MR data were used to create the boundary element model (BEM). TheCSD source localization was applied on 50 ms to 300 ms data window based insLORETA (standardized low resolution brain electromagnetic tomography) method(Pascual-Marqui, Michel, & Lehmann, 1994). Current density maps were constructedmaking no assumption regarding the number or location of active sources (forstatistical details, see below).
I. Bernardino et al. / Neuropsychologia 51 (2013 ) 1287 –12951290
2.4.2. Independent component analysisAfter pre-processing the EEG data, an independent component analysis (ICA)
was applied for each condition dataset. ICA was performed in Curry V5.0 software(Neuroscan). The main components were visually inspected and the componentscorresponding to P100, N170 and P200 were considered for final analysis. Theprojected power accounted for (ppaf) by each component was calculated (foradditional statistics, see below).
2.4.3. Time–frequency analysisFor time–frequency analysis, the continuous data files were digitally high-pass
filtered at 1 Hz, 12dB/oct and low-pass filter at 100 Hz, 24dB/oct to focus themodulations of activity in the gamma-band range using a finite impulse responsefilter. In order to perform signal “correction” of eye movement related artefacts wecomputed independent component analysis (ICA) based on all electrodes (includ-ing 4 EOG channels) as performed in Keren, Yuval-Greenberg, & Deouell (2010). Weidentified blinks and other ocular artefact components based on amplitude criteria
Fig. 2. Clusters of electrodes. Illustration of the regional clusters of electrodesdefined for the analysis: occipital cluster (O1, OZ, O2), occipito-temporal cluster(TP7, CP5, P7, P5, PO7, TP8, CP6, P6, P8, PO8), occipito-parietal cluster (PO5, PO3,POZ, PO4, PO6) and parietal cluster (CP3, CP1, P3, P1, CP2, CP4, P2, P4).
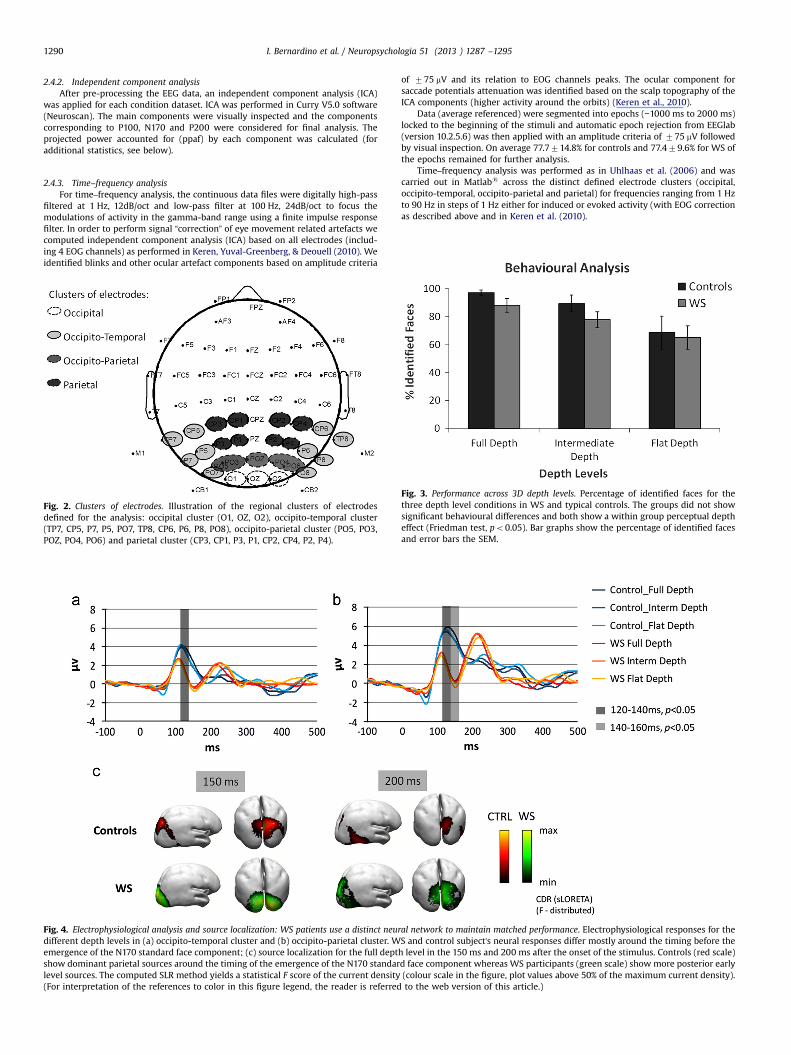
Fig. 4. Electrophysiological analysis and source localization: WS patients use a distinct neurdifferent depth levels in (a) occipito-temporal cluster and (b) occipito-parietal cluster. Wemergence of the N170 standard face component; (c) source localization for the full deptshow dominant parietal sources around the timing of the emergence of the N170 standarlevel sources. The computed SLR method yields a statistical F score of the current density(For interpretation of the references to color in this figure legend, the reader is referred
of 775 mV and its relation to EOG channels peaks. The ocular component forsaccade potentials attenuation was identified based on the scalp topography of theICA components (higher activity around the orbits) (Keren et al., 2010).
Data (average referenced) were segmented into epochs (−1000 ms to 2000 ms)locked to the beginning of the stimuli and automatic epoch rejection from EEGlab(version 10.2.5.6) was then applied with an amplitude criteria of 775 mV followedby visual inspection. On average 77.7714.8% for controls and 77.479.6% for WS ofthe epochs remained for further analysis.
Time–frequency analysis was performed as in Uhlhaas et al. (2006) and wascarried out in Matlabs across the distinct defined electrode clusters (occipital,occipito-temporal, occipito-parietal and parietal) for frequencies ranging from 1 Hzto 90 Hz in steps of 1 Hz either for induced or evoked activity (with EOG correctionas described above and in Keren et al. (2010).
Fig. 3. Performance across 3D depth levels. Percentage of identified faces for thethree depth level conditions in WS and typical controls. The groups did not showsignificant behavioural differences and both show a within group perceptual deptheffect (Friedman test, po0.05). Bar graphs show the percentage of identified facesand error bars the SEM.
al network to maintain matched performance. Electrophysiological responses for theS and control subject's neural responses differ mostly around the timing before theh level in the 150 ms and 200 ms after the onset of the stimulus. Controls (red scale)d face component whereas WS participants (green scale) show more posterior early(colour scale in the figure, plot values above 50% of the maximum current density).to the web version of this article.)
I. Bernardino et al. / Neuropsychologia 51 (2013 ) 1287 –1295 1291
2.4.4. Statistical analysisFor the statistical analysis, nonparametric statistics (Mann–Whitney U tests,
Wilcoxon rank sum test) were carried out to avoid biases due to deviations fromnormality and variance heterogeneity. The Bonferroni–Holms correction for multi-ple comparisons which strongly controls the family-wise error rate at level alphawas applied when appropriate (Holm, 1979). We performed ICA analysis to obtainan independent data driven statistical decomposition. To assess the significance ofthe main ICA components for each group, we performed a Generalized linear modelregression (GLMfit function from Matlabs Statistics Toolbox, v. R2010a) with ICAcomponent as predictors of the group average ERPs. This enables to find compo-nents that explained ERP data from one group and not the other.
Concerning the statistics of source localization, we applied the sLORETAmethod which yields a statistical value (F-distribution) from which the maximumcurrent densities can be extracted.
All statistical analyses were performed with the IBM SPSS Statistics 19.0software package and Matlabs.
3. Results
3.1. Behavioural data
BothWS and control groups showed high detection rates that werematched across depth levels (Full: 88.1%, 97.0%; Intermediate: 77.8%,89.4% and Flat: 65.0%, 68.6% for WS and controls, respectively).Accordingly, although the WS group shows a small tendency for lowerdetection rates than controls, no significant performance differenceswere found between the two groups for full, intermediate and flatdepth levels (Mann–Whitney tests, p40.05) on the percentage ofidentified faces. Therefore, results indicated that the participants weresuccessful in recognizing the SFM defined faces and were matched forstimulus difficulty (see Fig. 3). A within group depth effect was foundboth for controls (Friedman test, po0.05) and patients (Friedman test,po0.05) indicating that the depth manipulation resulted in significantwithin group effects in both cases.
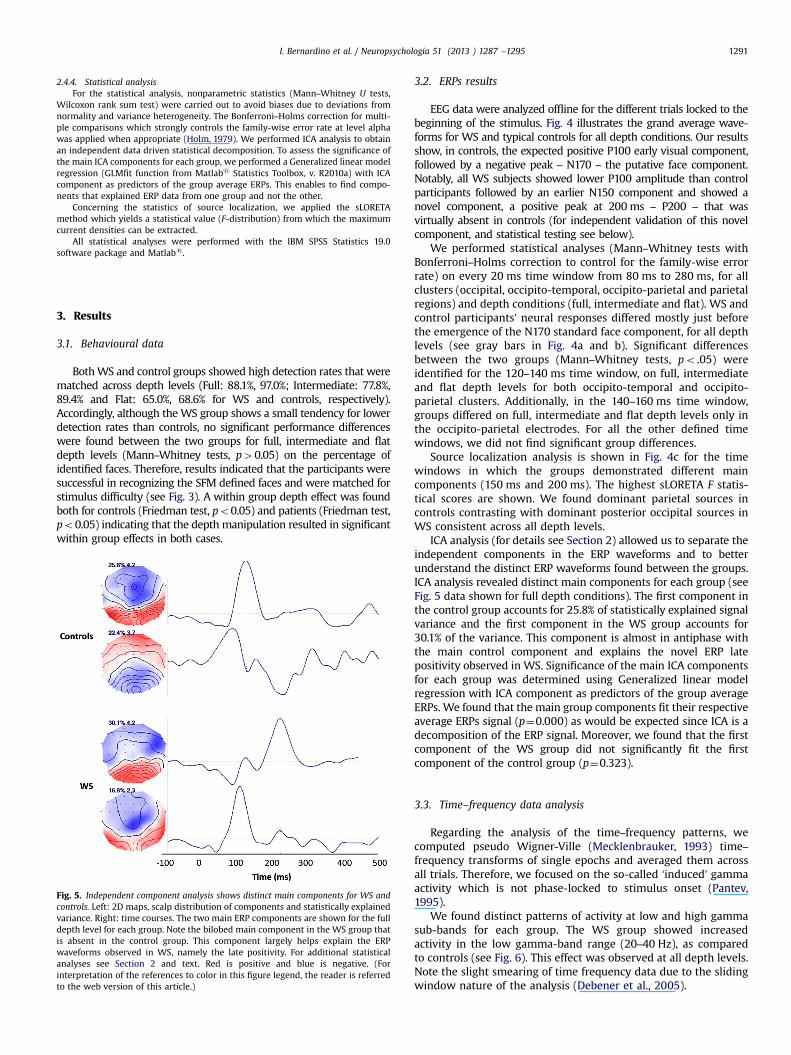
Fig. 5. Independent component analysis shows distinct main components for WS andcontrols. Left: 2D maps, scalp distribution of components and statistically explainedvariance. Right: time courses. The two main ERP components are shown for the fulldepth level for each group. Note the bilobed main component in the WS group thatis absent in the control group. This component largely helps explain the ERPwaveforms observed in WS, namely the late positivity. For additional statisticalanalyses see Section 2 and text. Red is positive and blue is negative. (Forinterpretation of the references to color in this figure legend, the reader is referredto the web version of this article.)
3.2. ERPs results
EEG data were analyzed offline for the different trials locked to thebeginning of the stimulus. Fig. 4 illustrates the grand average wave-forms for WS and typical controls for all depth conditions. Our resultsshow, in controls, the expected positive P100 early visual component,followed by a negative peak – N170 – the putative face component.Notably, all WS subjects showed lower P100 amplitude than controlparticipants followed by an earlier N150 component and showed anovel component, a positive peak at 200 ms – P200 – that wasvirtually absent in controls (for independent validation of this novelcomponent, and statistical testing see below).
We performed statistical analyses (Mann–Whitney tests withBonferroni–Holms correction to control for the family-wise errorrate) on every 20 ms time window from 80 ms to 280 ms, for allclusters (occipital, occipito-temporal, occipito-parietal and parietalregions) and depth conditions (full, intermediate and flat). WS andcontrol participants’ neural responses differed mostly just beforethe emergence of the N170 standard face component, for all depthlevels (see gray bars in Fig. 4a and b). Significant differencesbetween the two groups (Mann–Whitney tests, po .05) wereidentified for the 120–140 ms time window, on full, intermediateand flat depth levels for both occipito-temporal and occipito-parietal clusters. Additionally, in the 140–160 ms time window,groups differed on full, intermediate and flat depth levels only inthe occipito-parietal electrodes. For all the other defined timewindows, we did not find significant group differences.
Source localization analysis is shown in Fig. 4c for the timewindows in which the groups demonstrated different maincomponents (150 ms and 200 ms). The highest sLORETA F statis-tical scores are shown. We found dominant parietal sources incontrols contrasting with dominant posterior occipital sources inWS consistent across all depth levels.
ICA analysis (for details see Section 2) allowed us to separate theindependent components in the ERP waveforms and to betterunderstand the distinct ERP waveforms found between the groups.ICA analysis revealed distinct main components for each group (seeFig. 5 data shown for full depth conditions). The first component inthe control group accounts for 25.8% of statistically explained signalvariance and the first component in the WS group accounts for30.1% of the variance. This component is almost in antiphase withthe main control component and explains the novel ERP latepositivity observed in WS. Significance of the main ICA componentsfor each group was determined using Generalized linear modelregression with ICA component as predictors of the group averageERPs. We found that the main group components fit their respectiveaverage ERPs signal (p¼0.000) as would be expected since ICA is adecomposition of the ERP signal. Moreover, we found that the firstcomponent of the WS group did not significantly fit the firstcomponent of the control group (p¼0.323).
3.3. Time–frequency data analysis
Regarding the analysis of the time–frequency patterns, wecomputed pseudo Wigner-Ville (Mecklenbrauker, 1993) time–frequency transforms of single epochs and averaged them acrossall trials. Therefore, we focused on the so-called ‘induced’ gammaactivity which is not phase-locked to stimulus onset (Pantev,1995).
We found distinct patterns of activity at low and high gammasub-bands for each group. The WS group showed increasedactivity in the low gamma-band range (20–40 Hz), as comparedto controls (see Fig. 6). This effect was observed at all depth levels.Note the slight smearing of time frequency data due to the slidingwindow nature of the analysis (Debener et al., 2005).
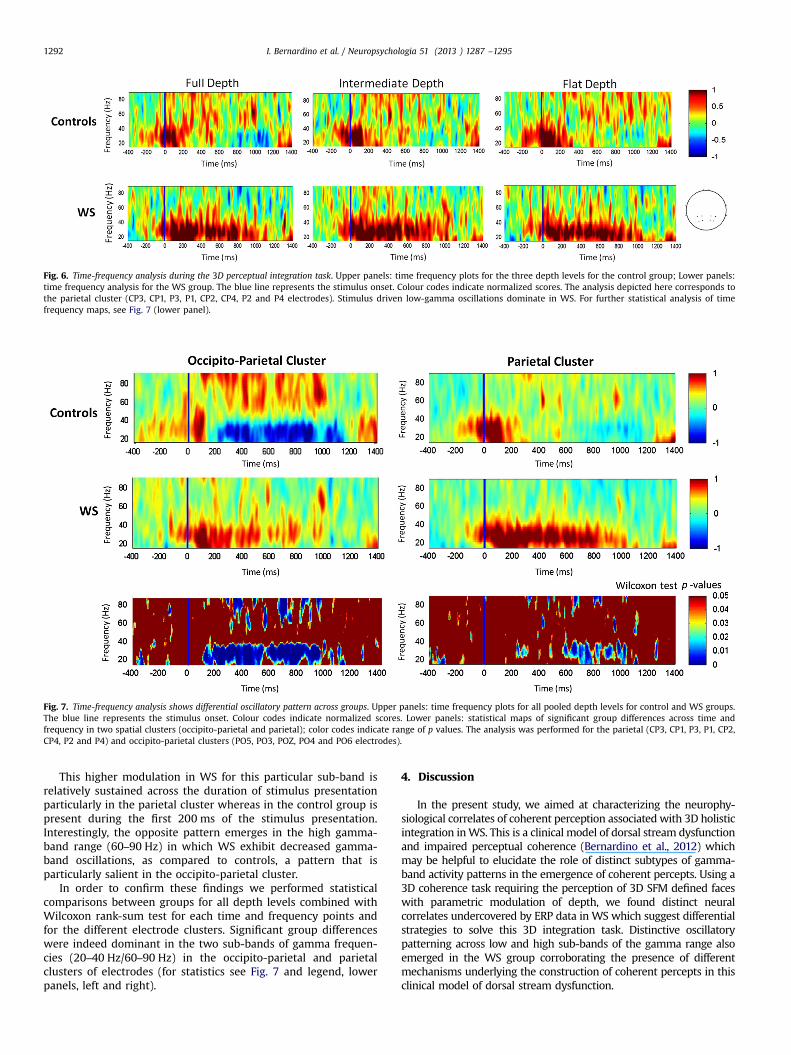
Fig. 6. Time-frequency analysis during the 3D perceptual integration task. Upper panels: time frequency plots for the three depth levels for the control group; Lower panels:time frequency analysis for the WS group. The blue line represents the stimulus onset. Colour codes indicate normalized scores. The analysis depicted here corresponds tothe parietal cluster (CP3, CP1, P3, P1, CP2, CP4, P2 and P4 electrodes). Stimulus driven low-gamma oscillations dominate in WS. For further statistical analysis of timefrequency maps, see Fig. 7 (lower panel).
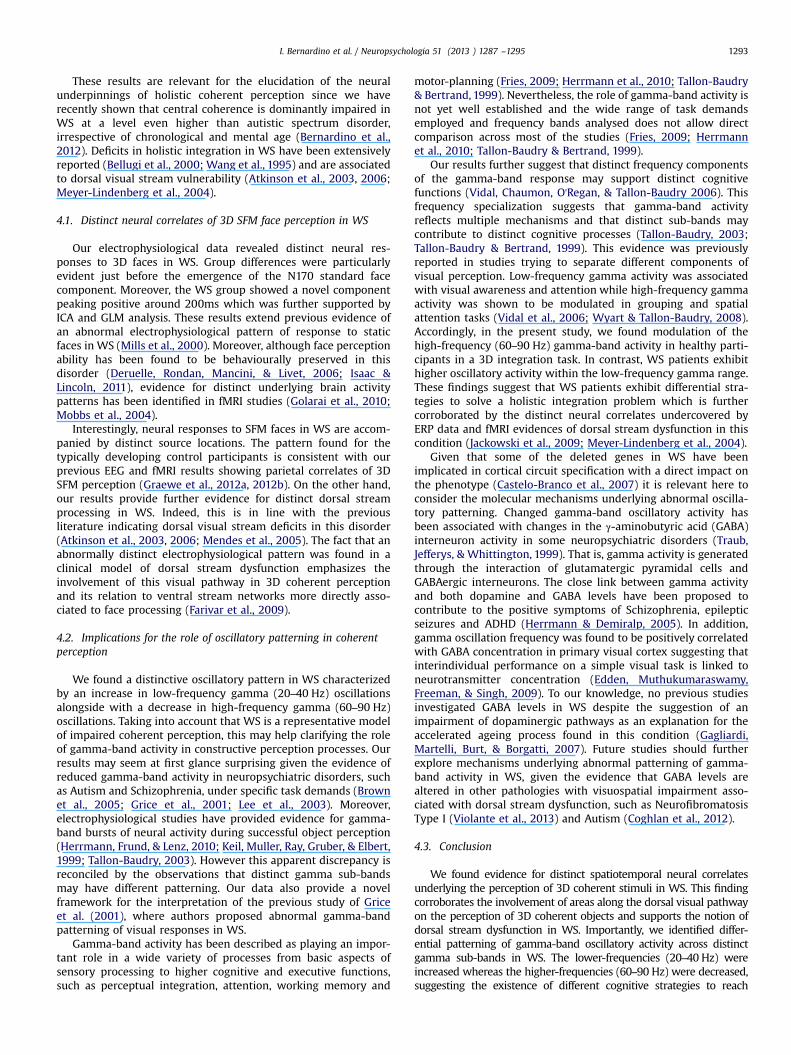
Fig. 7. Time-frequency analysis shows differential oscillatory pattern across groups. Upper panels: time frequency plots for all pooled depth levels for control and WS groups.The blue line represents the stimulus onset. Colour codes indicate normalized scores. Lower panels: statistical maps of significant group differences across time andfrequency in two spatial clusters (occipito-parietal and parietal); color codes indicate range of p values. The analysis was performed for the parietal (CP3, CP1, P3, P1, CP2,CP4, P2 and P4) and occipito-parietal clusters (PO5, PO3, POZ, PO4 and PO6 electrodes).
I. Bernardino et al. / Neuropsychologia 51 (2013 ) 1287 –12951292
This higher modulation in WS for this particular sub-band isrelatively sustained across the duration of stimulus presentationparticularly in the parietal cluster whereas in the control group ispresent during the first 200 ms of the stimulus presentation.Interestingly, the opposite pattern emerges in the high gamma-band range (60–90 Hz) in which WS exhibit decreased gamma-band oscillations, as compared to controls, a pattern that isparticularly salient in the occipito-parietal cluster.
In order to confirm these findings we performed statisticalcomparisons between groups for all depth levels combined withWilcoxon rank-sum test for each time and frequency points andfor the different electrode clusters. Significant group differenceswere indeed dominant in the two sub-bands of gamma frequen-cies (20–40 Hz/60–90 Hz) in the occipito-parietal and parietalclusters of electrodes (for statistics see Fig. 7 and legend, lowerpanels, left and right).
4. Discussion
In the present study, we aimed at characterizing the neurophy-siological correlates of coherent perception associated with 3D holisticintegration inWS. This is a clinical model of dorsal stream dysfunctionand impaired perceptual coherence (Bernardino et al., 2012) whichmay be helpful to elucidate the role of distinct subtypes of gamma-band activity patterns in the emergence of coherent percepts. Using a3D coherence task requiring the perception of 3D SFM defined faceswith parametric modulation of depth, we found distinct neuralcorrelates undercovered by ERP data in WS which suggest differentialstrategies to solve this 3D integration task. Distinctive oscillatorypatterning across low and high sub-bands of the gamma range alsoemerged in the WS group corroborating the presence of differentmechanisms underlying the construction of coherent percepts in thisclinical model of dorsal stream dysfunction.
I. Bernardino et al. / Neuropsychologia 51 (2013 ) 1287 –1295 1293
These results are relevant for the elucidation of the neuralunderpinnings of holistic coherent perception since we haverecently shown that central coherence is dominantly impaired inWS at a level even higher than autistic spectrum disorder,irrespective of chronological and mental age (Bernardino et al.,2012). Deficits in holistic integration in WS have been extensivelyreported (Bellugi et al., 2000; Wang et al., 1995) and are associatedto dorsal visual stream vulnerability (Atkinson et al., 2003, 2006;Meyer-Lindenberg et al., 2004).
4.1. Distinct neural correlates of 3D SFM face perception in WS
Our electrophysiological data revealed distinct neural res-ponses to 3D faces in WS. Group differences were particularlyevident just before the emergence of the N170 standard facecomponent. Moreover, the WS group showed a novel componentpeaking positive around 200ms which was further supported byICA and GLM analysis. These results extend previous evidence ofan abnormal electrophysiological pattern of response to staticfaces in WS (Mills et al., 2000). Moreover, although face perceptionability has been found to be behaviourally preserved in thisdisorder (Deruelle, Rondan, Mancini, & Livet, 2006; Isaac &Lincoln, 2011), evidence for distinct underlying brain activitypatterns has been identified in fMRI studies (Golarai et al., 2010;Mobbs et al., 2004).
Interestingly, neural responses to SFM faces in WS are accom-panied by distinct source locations. The pattern found for thetypically developing control participants is consistent with ourprevious EEG and fMRI results showing parietal correlates of 3DSFM perception (Graewe et al., 2012a, 2012b). On the other hand,our results provide further evidence for distinct dorsal streamprocessing in WS. Indeed, this is in line with the previousliterature indicating dorsal visual stream deficits in this disorder(Atkinson et al., 2003, 2006; Mendes et al., 2005). The fact that anabnormally distinct electrophysiological pattern was found in aclinical model of dorsal stream dysfunction emphasizes theinvolvement of this visual pathway in 3D coherent perceptionand its relation to ventral stream networks more directly asso-ciated to face processing (Farivar et al., 2009).
4.2. Implications for the role of oscillatory patterning in coherentperception
We found a distinctive oscillatory pattern in WS characterizedby an increase in low-frequency gamma (20–40 Hz) oscillationsalongside with a decrease in high-frequency gamma (60–90 Hz)oscillations. Taking into account that WS is a representative modelof impaired coherent perception, this may help clarifying the roleof gamma-band activity in constructive perception processes. Ourresults may seem at first glance surprising given the evidence ofreduced gamma-band activity in neuropsychiatric disorders, suchas Autism and Schizophrenia, under specific task demands (Brownet al., 2005; Grice et al., 2001; Lee et al., 2003). Moreover,electrophysiological studies have provided evidence for gamma-band bursts of neural activity during successful object perception(Herrmann, Frund, & Lenz, 2010; Keil, Muller, Ray, Gruber, & Elbert,1999; Tallon-Baudry, 2003). However this apparent discrepancy isreconciled by the observations that distinct gamma sub-bandsmay have different patterning. Our data also provide a novelframework for the interpretation of the previous study of Griceet al. (2001), where authors proposed abnormal gamma-bandpatterning of visual responses in WS.
Gamma-band activity has been described as playing an impor-tant role in a wide variety of processes from basic aspects ofsensory processing to higher cognitive and executive functions,such as perceptual integration, attention, working memory and
motor-planning (Fries, 2009; Herrmann et al., 2010; Tallon-Baudry& Bertrand, 1999). Nevertheless, the role of gamma-band activity isnot yet well established and the wide range of task demandsemployed and frequency bands analysed does not allow directcomparison across most of the studies (Fries, 2009; Herrmannet al., 2010; Tallon-Baudry & Bertrand, 1999).
Our results further suggest that distinct frequency componentsof the gamma-band response may support distinct cognitivefunctions (Vidal, Chaumon, O'Regan, & Tallon-Baudry 2006). Thisfrequency specialization suggests that gamma-band activityreflects multiple mechanisms and that distinct sub-bands maycontribute to distinct cognitive processes (Tallon-Baudry, 2003;Tallon-Baudry & Bertrand, 1999). This evidence was previouslyreported in studies trying to separate different components ofvisual perception. Low-frequency gamma activity was associatedwith visual awareness and attention while high-frequency gammaactivity was shown to be modulated in grouping and spatialattention tasks (Vidal et al., 2006; Wyart & Tallon-Baudry, 2008).Accordingly, in the present study, we found modulation of thehigh-frequency (60–90 Hz) gamma-band activity in healthy parti-cipants in a 3D integration task. In contrast, WS patients exhibithigher oscillatory activity within the low-frequency gamma range.These findings suggest that WS patients exhibit differential stra-tegies to solve a holistic integration problem which is furthercorroborated by the distinct neural correlates undercovered byERP data and fMRI evidences of dorsal stream dysfunction in thiscondition (Jackowski et al., 2009; Meyer-Lindenberg et al., 2004).
Given that some of the deleted genes in WS have beenimplicated in cortical circuit specification with a direct impact onthe phenotype (Castelo-Branco et al., 2007) it is relevant here toconsider the molecular mechanisms underlying abnormal oscilla-tory patterning. Changed gamma-band oscillatory activity hasbeen associated with changes in the γ-aminobutyric acid (GABA)interneuron activity in some neuropsychiatric disorders (Traub,Jefferys, & Whittington, 1999). That is, gamma activity is generatedthrough the interaction of glutamatergic pyramidal cells andGABAergic interneurons. The close link between gamma activityand both dopamine and GABA levels have been proposed tocontribute to the positive symptoms of Schizophrenia, epilepticseizures and ADHD (Herrmann & Demiralp, 2005). In addition,gamma oscillation frequency was found to be positively correlatedwith GABA concentration in primary visual cortex suggesting thatinterindividual performance on a simple visual task is linked toneurotransmitter concentration (Edden, Muthukumaraswamy,Freeman, & Singh, 2009). To our knowledge, no previous studiesinvestigated GABA levels in WS despite the suggestion of animpairment of dopaminergic pathways as an explanation for theaccelerated ageing process found in this condition (Gagliardi,Martelli, Burt, & Borgatti, 2007). Future studies should furtherexplore mechanisms underlying abnormal patterning of gamma-band activity in WS, given the evidence that GABA levels arealtered in other pathologies with visuospatial impairment asso-ciated with dorsal stream dysfunction, such as NeurofibromatosisType I (Violante et al., 2013) and Autism (Coghlan et al., 2012).
4.3. Conclusion
We found evidence for distinct spatiotemporal neural correlatesunderlying the perception of 3D coherent stimuli in WS. This findingcorroborates the involvement of areas along the dorsal visual pathwayon the perception of 3D coherent objects and supports the notion ofdorsal stream dysfunction in WS. Importantly, we identified differ-ential patterning of gamma-band oscillatory activity across distinctgamma sub-bands in WS. The lower-frequencies (20–40 Hz) wereincreased whereas the higher-frequencies (60–90 Hz) were decreased,suggesting the existence of different cognitive strategies to reach

I. Bernardino et al. / Neuropsychologia 51 (2013 ) 1287 –12951294
visual coherence in WS. In sum, patterning of different sub-bandswithin the gamma range can be dissociated during coherent perceptformation, in typical and atypical development.
Acknowledgments
We are grateful to the participants and their families for theirparticipation and support, and Eugenio Rodriguez for his support indata analysis. This research was supported by the PortugueseFoundation for Science and Technology grant numbers: PTDC/SAU-NEU/68483/2006, PTDC/SAU-ORG/118380/2010, COMPETE, PEst-C/SAU/UI3282/2011 and PIC/IC/82986/2007 to M.C.B. (PI); and indivi-dual scholarships—SRFH/BD/41401/2007 to I.B. and SFRH/BD/65341/2009 to J.C.
Appendix A. Supporting information
Supplementary data associated with this article can be found inthe online version at http://dx.doi.org/10.1016/j.neuropsychologia.2013.03.020.
References
Atkinson, J., Braddick, O., Anker, S., Curran, W., Andrew, R., Wattam-Bell, J., &Braddick, F. (2003). Neurobiological models of visuospatial cognition inchildren with Williams syndrome: measures of dorsal-stream and frontalfunction. Developmental Neuropsychology, 23, 139–172.
Atkinson, J., Braddick, O., Rose, F. E., Searcy, Y. M., Wattam-Bell, J., & Bellugi, U.(2006). Dorsal-stream motion processing deficits persist into adulthood inWilliams syndrome. Neuropsychologia, 44, 828–833.
Bayes, M., Magano, L. F., Rivera, N., Flores, R., & Perez Jurado, L. A. (2003).Mutational mechanisms of Williams–Beuren syndrome deletions. AmericanJournal of Human Genetics, 73, 131–151.
Bellugi, U., Lichtenberger, L., Jones, W., Lai, Z., St, & George, M. (2000). I. Theneurocognitive profile of Williams Syndrome: a complex pattern of strengthsand weaknesses. Journal of Cognitive Neuroscience, 12(Suppl 1), 7–29.
Bernardino, I., Mouga, S., Almeida, J., van Asselen, M., Oliveira, G., & Castelo-Branco,M. (2012). A direct comparison of local–global integration in autism and otherdevelopmental disorders: implications for the central coherence hypothesis.PLoS One, 7(6), e39351. /http://dx.doi.org/10.1371/journal.pone.0039351S.Epub 2012 June 19.e39351.
Brown, C., Gruber, T., Boucher, J., Rippon, G., & Brock, J. (2005). Gammaabnormalities during perception of illusory figures in autism. Cortex, 41, 364–376.
Castelo-Branco, M., Mendes, M., Sebastiao, A. R., Reis, A., Soares, M., Saraiva, J.,Bernardes, R., Flores, R., Perez-Jurado, L., & Silva, E. (2007). Visual phenotype inWilliams–Beuren syndrome challenges magnocellular theories explaininghuman neurodevelopmental visual cortical disorders. Journal of Clinical Inves-tigation, 117, 3720–3729.
Castelo-Branco, M., Neuenschwander, S., & Singer, W. (1998). Synchronization ofvisual responses between the cortex, lateral geniculate nucleus, and retina inthe anesthetized cat. Journal of Neuroscience, 18, 6395–6410.
Coghlan, S., Horder, J., Inkster, B., Mendez, M. A., Murphy, D. G., & Nutt, D. J. (2012).GABA system dysfunction in autism and related disorders: from synapse tosymptoms. Neuroscience & Biobehavioral Reviews, 36, 2044–2055.
Debener, S., Ullsperger, M., Siegel, M., Fiehler, K., von Cramon, D. Y., & Engel, A. K.(2005). Trial-by-trial coupling of concurrent electroencephalogram and func-tional magnetic resonance imaging identifies the dynamics of performancemonitoring. Journal of Neuroscience, 25, 11730–11737.
Deruelle, C., Rondan, C., Mancini, J., & Livet, M. O. (2006). Do children with Williamssyndrome fail to process visual configural information? Research in Develop-mental Disabilities, 27, 243–253.
Eckert, M. A., Galaburda, A. M., Karchemskiy, A., Liang, A., Thompson, P., Dutton, R. A., Lee,A. D., Bellugi, U., Korenberg, J. R., Mills, D., Rose, F. E., & Reiss, A. L. (2006). Anomaloussylvian fissure morphology in Williams syndrome. NeuroImage, 33, 39–45.
Eckert, M. A., Hu, D., Eliez, S., Bellugi, U., Galaburda, A., Korenberg, J., Mills, D., &Reiss, A. L. (2005). Evidence for superior parietal impairment in Williamssyndrome. Neurology, 64, 152–153.
Edden, R. A., Muthukumaraswamy, S. D., Freeman, T. C., & Singh, K. D. (2009).Orientation discrimination performance is predicted by GABA concentrationand gamma oscillation frequency in human primary visual cortex. Journal ofNeuroscience, 29, 15721–15726.
Farivar, R., Blanke, O., & Chaudhuri, A. (2009). Dorsal–ventral integration in therecognition of motion-defined unfamiliar faces. Journal of Neuroscience, 29,5336–5342.
Fries, P. (2009). Neuronal gamma-band synchronization as a fundamentalprocess in cortical computation. Annual Review of Neuroscience, 32, 209–224.
Gagliardi, C., Martelli, S., Burt, M. D., & Borgatti, R. (2007). Evolution of neurologicfeatures in Williams syndrome. Pediatric Neurology, 36, 301–306.
Golarai, G., Hong, S., Haas, B. W., Galaburda, A. M., Mills, D. L., Bellugi, U., Grill-Spector, K., & Reiss, A. L. (2010). The fusiform face area is enlarged in Williamssyndrome. Journal of Neuroscience, 30, 6700–6712.
Graewe, B., De Weerd, P., Farivar, R., & Castelo-Branco, M. (2012a). Stimulusdependency of object-evoked responses in human visual cortex: an inverseproblem for category specificity. PLoS One, 7, e30727.
Graewe, B., Lemos, R., Ferreira, C., Santana, I., Farivar, R., De Weerd, P., & Castelo-Branco, M. (2012b). Impaired processing of 3D motion-defined faces in MCI andhealthy ageing: an fMRI study. Cerebral Cortex. 2012 Aug 9. /http://dx.doi.org/10.1093/cercor/bhs246S. [Epub ahead of print].
Grice, S. J., Spratling, M. W., Karmiloff-Smith, A., Halit, H., Csibra, G., de Haan, M., &Johnson, M. H. (2001). Disordered visual processing and oscillatory brainactivity in autism and Williams syndrome. NeuroReport, 12, 2697–2700.
Herrmann, C. S., & Demiralp, T. (2005). Human EEG gamma oscillations inneuropsychiatric disorders. Clinical Neurophysiology, 116, 2719–2733.
Herrmann, C. S., Frund, I., & Lenz, D. (2010). Human gamma-band activity: a reviewon cognitive and behavioral correlates and network models. Neuroscience &Biobehavioral Reviews, 34, 981–992.
Holm, S. (1979). A simple sequentially rejective multiple test procedure. Scandina-vian Journal of Statistics, 65–70.
Isaac, L., & Lincoln, A. (2011). Featural versus configural face processing in a raregenetic disorder: Williams syndrome. Journal of Intellectual Disability Research,551034–1042.
Jackowski, A. P., Rando, K., Maria de Araujo, C., Del Cole, C. G., Silva, I., & Tavares deLacerda, A. L. (2009). Brain abnormalities in Williams syndrome: a review ofstructural and functional magnetic resonance imaging findings. EuropeanJournal of Paediatric Neurology, 13, 305–316.
Keil, A., Muller, M. M., Ray, W. J., Gruber, T., & Elbert, T. (1999). Human gammaband activity and perception of a gestalt. Journal of Neuroscience, 19,7152–7161.
Keren, A. S., Yuval-Greenberg, S., & Deouell, L. Y. (2010). Saccadic spike potentials ingamma-band EEG: characterization, detection and suppression. NeuroImage,49, 2248–2263.
Koenig, T., Prichep, L., Dierks, T., Hubl, D., Wahlund, L. O., John, E. R., & Jelic, V.(2005). Decreased EEG synchronization in Alzheimer's disease and mildcognitive impairment. Neurobiology of Aging, 26, 165–171.
Korenberg, J. R., Chen, X. N., Hirota, H., Lai, Z., Bellugi, U., Burian, D., Roe, B., &Matsuoka, R. (2000). VI. Genome structure and cognitive map of Williamssyndrome. Journal of Cognitive Neuroscience, 12(Suppl 1), 89–107.
Kriegeskorte, N., Sorger, B., Naumer, M., Schwarzbach, J., van den Boogert, E., Hussy,W., & Goebel, R. (2003). Human cortical object recognition from a visual motionflowfield. Journal of Neuroscience, 23, 1451–1463.
Lee, K. H., Williams, L. M., Breakspear, M., & Gordon, E. (2003). Synchronous gammaactivity: a review and contribution to an integrative neuroscience model ofschizophrenia. Brain Research Brain Research Reviews, 41, 57–78.
Mecklenbrauker, W. F. G. (1993). The Wigner distribution—theory and applications insignal processing. Amesterdam. Elsevier.
Mendes, M., Silva, F., Simoes, L., Jorge, M., Saraiva, J., & Castelo-Branco, M. (2005).Visual magnocellular and structure from motion perceptual deficits in aneurodevelopmental model of dorsal stream function. Brain Research: CognitiveBrain Research, 25, 788–798.
Meyer-Lindenberg, A., Kohn, P., Mervis, C. B., Kippenhan, J. S., Olsen, R. K., Morris, C.A., & Berman, K. F. (2004). Neural basis of genetically determined visuospatialconstruction deficit in Williams syndrome. Neuron, 43, 623–631.
Meyer-Lindenberg, A., Mervis, C. B., & Berman, K. F. (2006). Neural mechanisms inWilliams syndrome: a unique window to genetic influences on cognition andbehaviour. Nature Reviews Neuroscience, 7, 380–393.
Mills, D. L., Alvarez, T. D., St, George, M., Appelbaum, L. G., Bellugi, U., & Neville, H.(2000). III. Electrophysiological studies of face processing in Williams syn-drome. Journal of Cognitive Neuroscience, 12(Suppl 1), 47–64.
Milner, A. D., & Goodale, M. A. (2008). Two visual systems re-viewed. Neuropsy-chologia, 46, 774–785.
Mobbs, D., Eckert, M. A., Menon, V., Mills, D., Korenberg, J., Galaburda, A. M., Rose, F.E., Bellugi, U., & Reiss, A. L. (2007). Reduced parietal and visual corticalactivation during global processing in Williams syndrome. DevelopmentalMedicine & Child Neurology, 49, 433–438.
Mobbs, D., Garrett, A. S., Menon, V., Rose, F. E., Bellugi, U., & Reiss, A. L. (2004).Anomalous brain activation during face and gaze processing in Williamssyndrome. Neurology, 62, 2070–2076.
Murray, S. O., Olshausen, B. A., & Woods, D. L. (2003). Processing shape, motion andthree-dimensional shape-from-motion in the human cortex. Cerebral Cortex, 13,508–516.
Pantev, C. (1995). Evoked and induced gamma-band activity of the human cortex.Brain Topography, 7, 321–330.
Pascual-Marqui, R. D., Michel, C. M., & Lehmann, D. (1994). Low resolutionelectromagnetic tomography: a new method for localizing electrical activityin the brain. International Journal of Psychophysiology, 18, 49–65.
Reiss, A. L., Eckert, M. A., Rose, F. E., Karchemskiy, A., Kesler, S., Chang, M., Reynolds,M. F., Kwon, H., & Galaburda, A. (2004). An experiment of nature: brainanatomy parallels cognition and behavior in Williams syndrome. Journal ofNeuroscience, 24, 5009–5015.
Reiss, A. L., Eliez, S., Schmitt, J. E., Straus, E., Lai, Z., Jones, W., & Bellugi, U. (2000). IV.Neuroanatomy of Williams syndrome: a high-resolution MRI study. Journal ofCognitive Neuroscience, 12(Suppl 1), 65–73.
I. Bernardino et al. / Neuropsychologia 51 (2013 ) 1287 –1295 1295
Rutter, M., Bailey, A., & Lord, C. (2003). Social communication questionnaire. LosAngeles: Western Psychological Services.
Singer, W. (2001). Consciousness and the binding problem. Annals of the New YorkAcademy of Sciences, 929, 123–146.
Singer, W., & Gray, C. M. (1995). Visual feature integration and the temporalcorrelation hypothesis. Annual Review of Neuroscience, 18, 555–586.
Stromme, P., Bjornstad, P. G., & Ramstad, K. (2002). Prevalence estimation ofWilliams syndrome. Journal of Child Neurology, 17, 269–271.
Tallon-Baudry, C. (2003). Oscillatory synchrony and human visual cognition. Journalof Physiology Paris, 97, 355–363.
Tallon-Baudry, C., & Bertrand, O. (1999). Oscillatory gamma activity in humans andits role in object representation. Trends in Cognitive Sciences, 3, 151–162.
Traub, R. D., Jefferys, J. G., & Whittington, M. A. (1999). Fast oscillations in corticalcircuits. Cambridge: MIT press.
Uhlhaas, P. J., Linden, D. E., Singer, W., Haenschel, C., Lindner, M., Maurer, K., &Rodriguez, E. (2006). Dysfunctional long-range coordination of neural activityduring Gestalt perception in schizophrenia. Journal of Neuroscience, 26,8168–8175.
Uhlhaas, P. J., & Singer, W. (2006). Neural synchrony in brain disorders: relevancefor cognitive dysfunctions and pathophysiology. Neuron, 52, 155–168.
Vidal, J. R., Chaumon, M., O'Regan, J. K., & Tallon-Baudry, C. (2006). Visual groupingand the focusing of attention induce gamma-band oscillations at differentfrequencies in human magnetoencephalogram signals. Journal of CognitiveNeuroscience, 18, 1850–1862.
Violante, I. R., Ribeiro, M. J., Edden, R. A., Guimaraes, P., Bernardino, I., Rebola, J.,Cunha, G., Silva, E., & Castelo-Branco, M. (2013). GABA deficit in the visualcortex of patients with neurofibromatosis type 1: genotype-phenotype correla-tions and functional impact. Brain.
Wang, P. P., Doherty, S., Rourke, S. B., & Bellugi, U. (1995). Unique profile of visuo-perceptual skills in a genetic syndrome. Brain and Cognition, 29, 54–65.
Wechsler, D. (2003). Manual for the intelligence scale for children. Lisbon: Cegoc-Tea.Wechsler, D. (2008). Manual for the intelligence scale for adults. Lisbon: Cegoc-Tea.Wyart, V., & Tallon-Baudry, C. (2008). Neural dissociation between visual awareness
and spatial attention. Journal of Neuroscience, 28, 2667–2679.Yordanova, J., Banaschewski, T., Kolev, V., Woerner, W., & Rothenberger, A. (2001).
Abnormal early stages of task stimulus processing in children with attention-deficit hyperactivity disorder—evidence from event-related gamma oscilla-tions. Clinical Neurophysiology, 112, 1096–1108.
Copyright © 2022 FDOKUMEN