
Network topology and the evolution of dynamics in an artificial genetic regulatory network model...
24
BioSystems 85 (2006) 177–200 Network topology and the evolution of dynamics in an artificial genetic regulatory network model created by whole genome duplication and divergence P. Dwight Kuo a, ∗ , Wolfgang Banzhaf a , Andr´ e Leier b a Department of Computer Science, Memorial University of Newfoundland, St. John’s, NL, Canada A1B 3X5 b Advanced Computational Modelling Centre, University of Queensland, Brisbane, Qld 4072, Australia Received 18 October 2005; received in revised form 21 January 2006; accepted 23 January 2006 Abstract Topological measures of large-scale complex networks are applied to a specific artificial regulatory network model created through a whole genome duplication and divergence mechanism. This class of networks share topological features with natural transcriptional regulatory networks. Specifically, these networks display scale-free and small-world topology and possess subgraph distributions similar to those of natural networks. Thus, the topologies inherent in natural networks may be in part due to their method of creation rather than being exclusively shaped by subsequent evolution under selection. The evolvability of the dynamics of these networks is also examined by evolving networks in simulation to obtain three simple types of output dynamics. The networks obtained from this process show a wide variety of topologies and numbers of genes indicating that it is relatively easy to evolve these classes of dynamics in this model. © 2006 Elsevier Ireland Ltd. All rights reserved. Keywords: Regulatory networks; GRNs; Network motifs; Scale-free; Small-world; Duplication and divergence 1. Introduction Regulatory networks have become an important new area of research in the biological and biomedical sciences (Bower and Bolouri, 2001; Davidson, 2001; Kitano, 2001). Specifically, the DNA information controlling gene expression (i.e. regulation) is the key to under- standing differences between species and to evolution (Hood and Galas, 2003). Taking these regulatory inter- actions as a whole, a network of interactions (a so-called ∗ Corresponding author. Tel.: +1 8582435763; fax: +1 7097397026. E-mail addresses: [email protected], [email protected] (P. Dwight Kuo), [email protected] (W. Banzhaf), [email protected] (A. Leier).. regulatory network) can be visualized where genes in- teract by regulating other genes and their products to produce and regulate a myriad of cellular processes and functions. This allows nature to set up and control the mechanisms of evolution, development and physiology. Studying models of regulatory networks can help us to understand some of these mechanisms providing valu- able lessons for biology. This contribution uses an artificial genetic regulatory network model to pose questions regarding the topolog- ical organization of regulatory networks. Specifically, ensembles of this network model are investigated to de- termine whether they may be classified as scale-free, small-world and possess network motifs. In addition, the networks are then evolved toward simple output dynamics. 0303-2647/$ – see front matter © 2006 Elsevier Ireland Ltd. All rights reserved. doi:10.1016/j.biosystems.2006.01.004
-
Upload
independent -
Category
Documents
-
view
0 -
download
0
Transcript of Network topology and the evolution of dynamics in an artificial genetic regulatory network model...

A
ttdm
ti©
K
1
a(2gs(a
((
0d
BioSystems 85 (2006) 177–200
Network topology and the evolution of dynamics in anartificial genetic regulatory network model created
by whole genome duplication and divergence
P. Dwight Kuoa,∗, Wolfgang Banzhafa, Andre Leierb
a Department of Computer Science, Memorial University of Newfoundland, St. John’s, NL, Canada A1B 3X5b Advanced Computational Modelling Centre, University of Queensland, Brisbane, Qld 4072, Australia
Received 18 October 2005; received in revised form 21 January 2006; accepted 23 January 2006
bstract
Topological measures of large-scale complex networks are applied to a specific artificial regulatory network model createdhrough a whole genome duplication and divergence mechanism. This class of networks share topological features with naturalranscriptional regulatory networks. Specifically, these networks display scale-free and small-world topology and possess subgraphistributions similar to those of natural networks. Thus, the topologies inherent in natural networks may be in part due to theirethod of creation rather than being exclusively shaped by subsequent evolution under selection.The evolvability of the dynamics of these networks is also examined by evolving networks in simulation to obtain three simple
ypes of output dynamics. The networks obtained from this process show a wide variety of topologies and numbers of genes
ndicating that it is relatively easy to evolve these classes of dynamics in this model.2006 Elsevier Ireland Ltd. All rights reserved.
Small-w
eywords: Regulatory networks; GRNs; Network motifs; Scale-free;. Introduction
Regulatory networks have become an important newrea of research in the biological and biomedical sciencesBower and Bolouri, 2001; Davidson, 2001; Kitano,001). Specifically, the DNA information controllingene expression (i.e. regulation) is the key to under-tanding differences between species and to evolution
Hood and Galas, 2003). Taking these regulatory inter-ctions as a whole, a network of interactions (a so-called∗ Corresponding author. Tel.: +1 8582435763; fax: +1 7097397026.E-mail addresses: [email protected], [email protected]
P. Dwight Kuo), [email protected]. Banzhaf), [email protected] (A. Leier)..
303-2647/$ – see front matter © 2006 Elsevier Ireland Ltd. All rights reservoi:10.1016/j.biosystems.2006.01.004
orld; Duplication and divergence
regulatory network) can be visualized where genes in-teract by regulating other genes and their products toproduce and regulate a myriad of cellular processes andfunctions. This allows nature to set up and control themechanisms of evolution, development and physiology.Studying models of regulatory networks can help us tounderstand some of these mechanisms providing valu-able lessons for biology.
This contribution uses an artificial genetic regulatorynetwork model to pose questions regarding the topolog-ical organization of regulatory networks. Specifically,ensembles of this network model are investigated to de-
termine whether they may be classified as scale-free,small-world and possess network motifs. In addition,the networks are then evolved toward simple outputdynamics.ed.

Systems
178 P.D. Kuo et al. / Bio2. Background
2.1. Topological measures
Since one of the most basic features of any complexnetwork is its structure, it is natural to investigate net-work connectivity. The structure of networks is oftenconstrained and shaped by the growth processes thatcreate them (including evolution in the case of naturalnetworks). Studying the topology of natural networksallows an understanding of the structures and dynamicswhich have been exploited by nature. By comparing thetopologies of artificial networks with natural networks,questions regarding the benefits of one topology overanother can be answered. In addition, some insights intothe growth processes which create particular topologiesmay be gained.
Typically, nodes in such an abstraction represent in-dividual genes and their associated proteins while thedirected edges which connect the nodes represent onegene’s effect (excitatory or inhibitory) on another.
2.1.1. Scale-free network topologiesA topological feature often found in large complex
networks is the so-called “scale-free” topology. In net-works of such a topology, the vertex degree distribution,P(k), decays as a power-law. This has been shown fora variety of biological systems (Wuchty, 2001; Watts,2003; Jeong et al., 2000; Guelzim et al., 2002; van Noortet al., 2004; Babu et al., 2004). A scale-free networktopology can emerge in the context of a growing net-work with the addition of new vertices connecting pref-erentially to vertices which are highly connected in thenetwork (Barabasi and Albert, 1999), as well as throughexplicit optimization (Valverde et al., 2002) and dupli-cation and divergence (Romualdo et al., 2003; Kuo andBanzhaf, 2004).
2.1.2. Small-world network topologiesAnother topological feature found in large com-
plex networks is the so-called “Small-world” topol-ogy. Watts (2003) defines a Small-world graph as anygraph with n vertices and average vertex degree k thatexhibits L ≈ Lrandom(n, k) ∼ ln (n)
ln (k) and C � Crandom ∼kn
for n � k � ln (n) � 1. C is the clustering coefficientwhich is defined as follows: if vertex v has kv neigh-
bours, C = 2 ∑n(
kv(kv−1))
, where L is the charac-
n v=1 2teristic path-length of the network (average number oflinks connecting two nodes). Lrandom and Crandom refer tothe characteristic path-length and clustering coefficientfor a random graph with the same k and n, respectively.
85 (2006) 177–200
Small-world topology has also been noted in biologicalnetworks (Watts, 2003; van Noort et al., 2004).
2.1.3. Network motifsThe previous two topological measures characterize
networks at the global level. Local graph properties ofnetworks have also been investigated such as static net-work motifs (Milo et al., 2002, 2004; Shen-Or et al.,2002; Wuchty et al., 2003; Yeger-Lotem et al., 2004;Dobrin et al., 2004; Mangan and Alon, 2003; Vazquezet al., 2004; Banzhaf and Kuo, 2004).
Network motifs are defined as the structural elements(subgraphs) which occur in statistically significant quan-tities in the networks under consideration as comparedto random networks (Milo et al., 2002). The implica-tion of having certain subgraphs being found in greaterabundance than would be expected in similar randomnetworks is that these local network motifs may conveya functional advantage to the system. It is believed thatstudying network motifs can lead to a better understand-ing of the potential basic structural elements which makeup complex networks. Several motifs such as the bi-fan(Kashtan et al., 2004), the feed-forward loop (Manganand Alon, 2003) and the feedback loop (Kashtan et al.,2004) have been the subject of study.
Tables A.1 (three-nodes), A.2 and A.3 (four-nodes)show connection patterns in directed graphs includingauto-regulatory connections. A presentation of all four-node connection patterns is impractical due to space lim-itations.
2.2. Artificial regulatory network model
The artificial regulatory network (ARN) model con-sidered here (Banzhaf, 2003a,b; Banzhaf and Kuo, 2004;Kuo and Banzhaf, 2004; Kuo et al., 2004) consists ofa bit string representing a genome with direction (i.e.5′ → 3′ in DNA) and mobile “proteins” which interactwith the genome through their constituent bit patterns.Proteins are able to interact with the genome, most no-tably at “regulatory” sites located upstream from genes.Attachment to these sites produces either inhibition oractivation of the corresponding protein. These interac-tions may be interpreted as a regulatory network withproteins acting as transcription factors.
A “promoter” signals the beginning of a gene on thebit string analogous to an open reading frame (ORF) onDNA—a long sequence of DNA that contains no “stop”
codon and therefore encodes all or part of a protein. Eachgene is set to a fixed length of lgene = 5 32-bit integerswhich results in an expressed bit pattern of 160-bits. Apromoter bit sequence of 8-bits was arbitrarily selected
ystems
ttptmldHwae
aaoigsta5b
vbdmbiqtqsa
“c
P.D. Kuo et al. / BioS
o be “01010101”. By randomly choosing “0”s and “1”so generate a genome, any one-byte pattern can be ex-ected to appear with probability 2−8 = 0.39%. Sincehe promoter pattern itself is repetitive, overlapping pro-
oters or periodic extensions of the pattern are not al-owed, i.e. a bit sequence of “0101010101” (10-bits) isetected as a single promoter site starting at the first bit.owever, regions associated with one gene may overlapith another should a promoter pattern also exist withinportion of the coding region of a gene. In such cases,
ach gene is treated independently.Immediately upstream from the promoter exist two
dditional 32-bit segments which represent the enhancernd inhibitor sites. As previously mentioned, attachmentf proteins (transcription factors) to these sites resultsn changes to protein production for the correspondingenes (regulation). It is assumed that only one regulatoryite exists for the increase of expression and one site forhe decrease of expression of a given protein. This isradical simplification since natural genomes may have–10 regulatory sites per gene that may even be occupiedy complexes of proteins (Banzhaf, 2003a).
Processes such as transcription, diffusion, spatialariations and elements such as introns, RNA-like mo-ile elements and translation procedures resulting in aifferent alphabet for proteins are neglected. This lastechanism is replaced as follows. Each protein is a 32-
it sequence constructed by a many-to-one mapping ofts corresponding gene which contains five 32-bit se-uences. The protein sequence is created by performinghe majority rule on each bit position of these five se-uences so as to arrive at a 32-bit protein. Ties (not pos-ible with an odd number for lg) for a given bit position
re resolved by chance.Proteins may then be examined to see how theymatch” with the genome at the regulatory sites. Thisomparison is implemented using the XOR operator
Fig. 1. Bit string for one gen
85 (2006) 177–200 179
which returns a “1” if bits on both patterns are com-plementary. The degree of match between the genomeand the protein bit patterns is specified by the numberof bits set to “1” during an XOR operation. In general, aGaussian distribution results from measuring the matchbetween proteins and bit sequences in a randomly gen-erated genome (Banzhaf, 2003a). By making the sim-plifying assumption that the occupation of both of agene’s regulatory sites modulates the expression of itscorresponding protein, a gene–protein interaction net-work may be deduced comprising the different genesand proteins parameterized by strength of match. Thebit-string for one gene is shown in Fig. 1.
The rate at which protein i is produced is given by:
dci
dt= δ(ei − hi)ci∑
j cj
(1)
ei, hi = 1
N
N∑j
cj exp(β(uj − umax)) (2)
where ei and hi represent the excitation and inhibitionof the production of protein i, uj represents the numberof matching bits between protein j and activation or in-hibition site i, umax represents the maximum match (inthis case, 32), β and δ are positive scaling factors, andci is the concentration of protein i at time t. The con-centrations of the various proteins are required to sumto 1. This ensures competition between binding sites forproteins.
The effect of one gene’s products on another can beinvestigated in the ARN model by looking at the degreeof match between one gene’s protein and another’s reg-ulatory sites (one excitatory and one inhibitory site). At
e in the ARN model.
different matching strengths (thresholds), different net-work topologies are obtained. An example is shown inFigs. 2 and 3. Each node in the diagram represents a genefound in the genome along with its corresponding pro-

180 P.D. Kuo et al. / BioSystems 85 (2006) 177–200
Fig. 2. Gene–protein interaction network for a random genome at a threshold of 21 bits.
for a r
in any ARN graph at threshold 0) goes from 1.0 to 0.0.There is a sharp transition from full connectivity to noconnectivity.
Fig. 3. Gene–protein interaction network
tein forming a gene–protein pair. Edges in the diagramrepresent a regulatory influence of one gene’s proteinon another gene. For the diagrams presented, the net-work interaction diagrams at thresholds of 21 and 22 areshown. Fig. 3 is in fact a subgraph of Fig. 2.
Although the actual genome has not changed, by sim-ply changing the threshold parameter, different networktopologies are obtained. Figs. 2 and 3 also possess differ-ent numbers of genes since only connected gene–proteinpairs are displayed. Should a change in the parameter-ized threshold lead to the creation of an isolated node, itis deleted from the diagram. Only the largest network ofinteractions is displayed.
It is possible to have multiple clusters of gene–proteininteractions that are not interconnected. This is likely tooccur as the threshold level is increased. As connectionsbetween gene–protein pairs are lost due to the threshold,each cluster of gene–protein pairs becomes isolated fromthe others. This often occurs abruptly indicating a phasetransition between sparse and full network connectivity.
The relationship between the number of edges in thegraph and the threshold is shown in Fig. 4 for a sampleof 200 networks. As the threshold increases from 0 to32 (the x–axis), the fraction of edges in the graph overandom genome at a threshold of 22 bits.
the number of edges in a fully connected network ofthe same number of nodes (also the number of edges
Fig. 4. Diagram showing the fraction of edges in a graph at a giventhreshold (x–axis) compared to a fully connected graph for 200 net-works.

ystems 85 (2006) 177–200 181
2
egndoptttgf
sadSa(caaotpoa2p
3
mtntstrtfosB
3
l
by 12 duplication events per genome leading to individ-ual genomes of length LG = 212 × 32 = 131,072. Fromthese genomes, the number of genes were then deter-mined based on the number of promoter patterns present.
P.D. Kuo et al. / BioS
.3. Whole genome duplication and divergence
Whole genome duplication might be an importantvolutionary mechanism for generating novelty in theenome and additionally might give a reasonable expla-ation for speciation (Ohno, 1970). When whole genomeuplication occurs, pairs of functionally redundant paral-gous genes are created. Since only one gene of a pair ofaralogous genes is required to retain its original func-ion, the second is free to diverge. This might lead tohe second gene being lost or acquiring a novel functionhrough subsequent mutations. A review of the role ofene duplication in the creation of novel proteins can beound in Hughes (2005).
Evidence for either whole genome duplications orubstantial gene duplication events exist in the liter-ture. Specifically, there has been evidence for geneuplications in Saccharomyces cerevisiae (Wolfe andhields, 1997; Friedman and Hughes, 2001; Teichmannnd Babu, 2004; Dujon et al., 2004; Kellis et al., 2004)and in simulation by van Noort et al. (2004)), Es-herichia coli (Babu and Teichmann, 2003; Friedmannd Hughes, 2001; Teichmann and Babu, 2004; Babu etl., 2004), vertebrates (Nadeau and Sankoff, 1997) andther organisms. More generally, three quarters of theranscription factors in E. coli have arisen from gene du-lication (Babu and Teichmann, 2003) and at least 50%f prokaryotic genes and over 90% of eukaryotic genesre created by gene duplication (Teichmann and Babu,004). A review of the mechanisms facilitating gene du-lications can be found in Zhang (2004).
. Network topologies in the ARN model
With the ARN, duplication and divergence can beore directly investigated due to its implementation on
he genetic string as opposed to an examination at theetwork level (i.e. where gene duplication happens onhe genome level in nature) as is the case in other ab-tract regulatory network models (i.e. differential equa-ion models, Boolean models). In addition, topologicalelationships can be easily investigated by parameteriza-ion of the threshold. Specifically, the presence of scale-ree, Small-world and network motif topologies can bebserved in the ARN model. In Sections 3.1–3.3, weummarize our findings previously published in parts inanzhaf and Kuo (2004) and Kuo and Banzhaf (2004).
.1. Gene duplication and the ARN model
The ARN genome is created through a series of wholeength duplication and divergence events. First, a random
Fig. 5. Histogram of the number of genes in each genome (200genomes) fitted to a power-law: P(g) ∼ g−γ for a mutation rate of1.0%. γ was calculated to be 0.9779.
32-bit string is generated. This string is then used in a se-ries of whole length duplications followed by mutationsto generate a genome of length LG.
To generate such networks, a divergence (or muta-tion) rate for the duplication and divergence mechanismmust be chosen. First, mutation rates of 1% and 5%were examined. Two-hundred genomes were generated
Fig. 6. Histogram of the number of genes in each genome (200genomes) fitted to a power-law: P(g) ∼ g−γ for a mutation rate of5.0%.

182 P.D. Kuo et al. / BioSystems 85 (2006) 177–200
Fig. 7. Histogram of the number of genes in 200 genomes whose bitshave been chosen at random.
The distribution of the number of genes present in thegenome of size LG is shown in Figs. 5 and 6.
The distribution of the number of genes in Fig. 5 fol-lows a power-law-like distribution. However, in Fig. 6the distribution is disrupted. This is attributed to thehigher rate of mutation. At such a mutation rate, thedisruption of the network becomes so prevalent that itbegins to disrupt the duplication of nodes leading to anetwork with a random number of genes.
For an 8-bit promoter, the probability that it remainsintact after one duplication event is only 66% at a mu-tation rate of 5%. Therefore, many of the genes copiedduring the duplication process will be subsequently de-stroyed (by disruption of the promoter) in later dupli-cation steps. However, there will also be other geneswhich arise from this higher mutation rate. But, thesenew genes will also be easily destroyed via mutation.Genomes which start with very large numbers of genesare disrupted early on in the duplication process by muta-tion, while those with few genes obtain additional genesthrough mutation.
To test this explanation, genomes of length LG werecreated completely at random without the use of duplica-tion and divergence. The distribution of these completelyrandomly generated networks are shown in Fig. 7. Thisdistribution is quite similar to that generated in Fig. 6lending additional support to the hypothesis that at 5%mutation the network topology becomes effectively ran-domized.
In the case of no mutations (0% probability of mu-tation) during the duplication process, a large numberof networks either have zero genes (where there are no01010101 patterns in the original 32-bit starting string),
Fig. 8. Distribution of values of γ for the best fit of P(k) ∼ k−γ witha mutation rate of 1.0%.
or have 2(# of duplications) genes (due to the presence of a01010101 pattern in the original 32-bit starting string).We wish to obtain a network which shows a topologyprimarily due to the effects of duplication. Therefore,the distribution of the number of genes in networks gen-erated by duplication and divergence may be used as anestimate of the effect of mutation rate on the networkas compared to randomly generated genomes. Obtain-ing a power-law-like distribution of the number of genesaccomplishes this goal. That distribution is sufficientlyrandomized so as not to resemble the case of 0% muta-tion while not being dominated by mutational effects (asshown by its lack of similarity to the Gaussian-like dis-tributions shown in Figs. 6 and 7). With these considera-tions in mind, the networks generated by 1% divergencemay be examined with respect to their topologies.
3.2. Scale-free and small-world topologies in theARN model
The network of gene–protein interactions is param-eterized by the threshold value leading to 32 possiblenetworks for each genome (although the case of zeroconnectivity and full connectivity are neglected). Thehistograms of the vertex degree distribution were fittedto the equation P(k) = αk−γ for each threshold value,using the sum of least squares method. The thresholdvalue which produced a γ value closest to 2.5 was kept(a large number of networks which have displayed scale-
free behavior exhibit values of 2 < γ ≤ 3 (Goh et al.,2002)). Values for the parameter γ characterizing scale-free networks were calculated for 200 genomes and areshown in Figs. 8 and 9.
P.D. Kuo et al. / BioSystems 85 (2006) 177–200 183
Fa
dnolp
cwtddion
Fd
Fig. 11. Plot of C/Crandom and (Lrandom − L)/Lrandom for each of the
ig. 9. Distribution of values of γ for the best fit of P(k) ∼ k−γ withmutation rate of 5.0%.
There exist many genomes created by duplication andivergence which may be considered to satisfy the defi-ition of a scale-free network. Fig. 10 shows an examplef one network’s vertex degree distribution fit to a power-aw distribution. It does obey a distribution similar to aower-law (scale-free) distribution.
In Fig. 8, there is a large number of networks whoseoefficient γ is close to 0, which would seem to be at oddsith the previous statement. However, it can be attributed
o the fact that with a low mutation rate the probability ofiscovering new promoter patterns through subsequent
uplication and divergence steps is also low. Therefore,f there were few promoters in the initial string, there willften be few genes in the overall genome. With a smallumber of genes, the scale-free coefficient γ will oftenig. 10. Degree distribution of a network generated by duplication andivergence with 1% mutation.
randomly generated genomes (200 genomes) with a mutation rate of1.0%.
be of small magnitude. In addition, from the distributionof γ in Fig. 9, the majority of the networks created by 5%mutation cannot be classified as scale-free. This again,reinforces the previous finding that a mutation rate of5% or higher during the duplication and divergence pro-cess generates networks that are close to having randomconnectivity.
To test whether these networks could also be classi-fied as having small-world topology, the clustering co-efficient, C, and the characteristic path-length, L, werecalculated and compared to a randomly connected net-work of the same size and vertex degree distribution. Thethreshold value that produced a network with the smallestabsolute difference, | L − Lrandom |, that also satisfiedC � Crandom were taken to be those most characteris-tic of the Small-world network topology. The additionalconstraint, L > 1.3, was also enforced to exclude graphsthat were close to being fully connected.
The distributions for the clustering coefficient andthe characteristic path-length obtained from the 200genomes for 1% mutation are shown in Fig. 11. It canbe derived from the figure, that a majority of genomeshas a threshold at which the interaction network ap-proaches or satisfies the definition of a small-world net-work topology. All graphs considered as having scale-free and small-world topology were found in the transi-tion areas of Fig. 4.
Why does whole genome duplication create scale-freeand small-world topologies? Part of the answer is thatthe duplication process, despite being performed directly
on the genetic string can be considered to be similar tothe mechanism of preferential attachment at the networklevel.
184 P.D. Kuo et al. / BioSystems 85 (2006) 177–200
connectesents a
self-evident that the maximum distance between any twonodes in only the original graph and the copied portion of
Fig. 12. An example of the effect of two duplication events. Highlyattachment). Each node represents a gene protein pair; each edge repr
Consider the duplication process on a string whichcontains multiple genes while neglecting the effects ofmutation. For simplicity, it is assumed that no additionalgenes are created from a duplication event by joiningthe end of one genome and the beginning of its copy.On the left of Fig. 12, a network of five gene–proteinpairs is shown that proceeds through a single duplica-tion event generating the network shown on the rightside.
The more highly connected nodes on the left (the orig-inal nodes and their copies—all shown in grey) becomeeven more highly connected after a single duplicationevent. This can again be seen in the third part of the di-agram which shows the result of a further duplicationevent. As the number of duplication events increases,the difference in the number of connections betweenhighly connected nodes and less connected nodes in-creases. This can be thought of as a form of preferen-tial attachment since nodes that are already highly con-nected will become even more so after subsequent du-plication events. Preferential attachment has been shownto be a mechanism which can generate scale-free net-works (Barabasi and Albert, 1999; Romualdo et al.,2003).
However, this part of the answer neglects the mecha-nism of mutation. Mutation may be thought of as an op-
erator which reorganizes the network. If mutations occuron a gene, this may either change the gene–protein pair’sbinding site, or the generated protein thus reorganizinga portion of the network. The other possibilities are thated (shaded) nodes become even more highly connected (preferentialn interaction between gene–protein pairs.
mutations may either disrupt the promoter pattern ineffect deleting a gene–protein pair from the network,create a new gene–protein pair by creating a new pro-moter site, or are neutral. The topology of the networkas measured by the number of genes in the system isdominated by the effects of duplication, not divergence.Thus, the scale-free distribution observed is due to theduplication mechanism, acting similar to preferentialattachment.
How can the small-world topologies found in theARN model be explained? If we examine the definitionof a small-world network more closely, it colloquiallystates that a network is highly clustered but that thereare many links between these clusters which effectivelyreduce the overall diameter of the network. Frequently,hubs also appear in small-world networks (Watts, 2003).Hubs also appear in the ARN model through the dupli-cation process (analogous to preferential attachment tomore highly connected nodes). However, because of theway the duplication process works (assuming no muta-tion), the maximum distance1 between any two nodesbefore and after a duplication remains constant. Thishappens because the duplication step effectively makesa copy of all nodes and all edges simultaneously. It is
the network are the same (if we discount the edges which
1 The number of edges traversed to get from node “a” to “b”.
P.D. Kuo et al. / BioSystems 85 (2006) 177–200 185
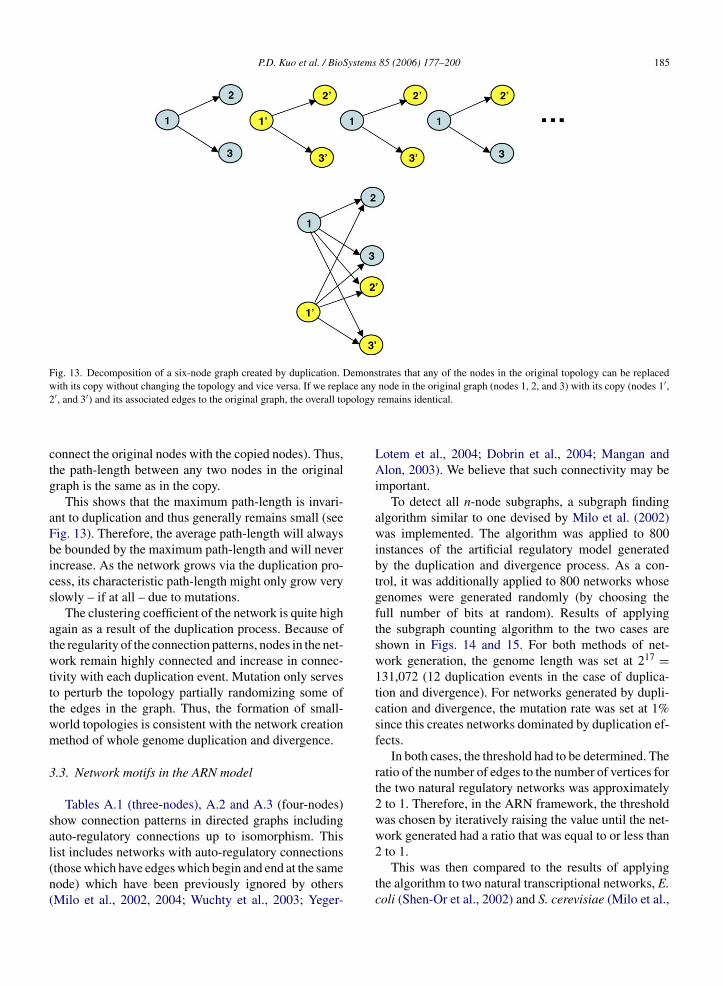
Fig. 13. Decomposition of a six-node graph created by duplication. Demonstrates that any of the nodes in the original topology can be replacedw ace any ′2 pology
ctg
aFbics
atwtttwm
3
sal(n(
ith its copy without changing the topology and vice versa. If we repl′, and 3′) and its associated edges to the original graph, the overall to
onnect the original nodes with the copied nodes). Thus,he path-length between any two nodes in the originalraph is the same as in the copy.
This shows that the maximum path-length is invari-nt to duplication and thus generally remains small (seeig. 13). Therefore, the average path-length will alwayse bounded by the maximum path-length and will neverncrease. As the network grows via the duplication pro-ess, its characteristic path-length might only grow verylowly – if at all – due to mutations.
The clustering coefficient of the network is quite highgain as a result of the duplication process. Because ofhe regularity of the connection patterns, nodes in the net-ork remain highly connected and increase in connec-
ivity with each duplication event. Mutation only serveso perturb the topology partially randomizing some ofhe edges in the graph. Thus, the formation of small-orld topologies is consistent with the network creationethod of whole genome duplication and divergence.
.3. Network motifs in the ARN model
Tables A.1 (three-nodes), A.2 and A.3 (four-nodes)how connection patterns in directed graphs includinguto-regulatory connections up to isomorphism. This
ist includes networks with auto-regulatory connectionsthose which have edges which begin and end at the sameode) which have been previously ignored by othersMilo et al., 2002, 2004; Wuchty et al., 2003; Yeger-node in the original graph (nodes 1, 2, and 3) with its copy (nodes 1 ,remains identical.
Lotem et al., 2004; Dobrin et al., 2004; Mangan andAlon, 2003). We believe that such connectivity may beimportant.
To detect all n-node subgraphs, a subgraph findingalgorithm similar to one devised by Milo et al. (2002)was implemented. The algorithm was applied to 800instances of the artificial regulatory model generatedby the duplication and divergence process. As a con-trol, it was additionally applied to 800 networks whosegenomes were generated randomly (by choosing thefull number of bits at random). Results of applyingthe subgraph counting algorithm to the two cases areshown in Figs. 14 and 15. For both methods of net-work generation, the genome length was set at 217 =131,072 (12 duplication events in the case of duplica-tion and divergence). For networks generated by dupli-cation and divergence, the mutation rate was set at 1%since this creates networks dominated by duplication ef-fects.
In both cases, the threshold had to be determined. Theratio of the number of edges to the number of vertices forthe two natural regulatory networks was approximately2 to 1. Therefore, in the ARN framework, the thresholdwas chosen by iteratively raising the value until the net-work generated had a ratio that was equal to or less than
2 to 1.This was then compared to the results of applyingthe algorithm to two natural transcriptional networks, E.coli (Shen-Or et al., 2002) and S. cerevisiae (Milo et al.,

186 P.D. Kuo et al. / BioSystems 85 (2006) 177–200
Fig. 14. Average frequency of occurrence for subgraphs of size threein 800 instances of the artificial regulatory network model generatedby a duplication and divergence procedure.
2002). The results can be seen in Figs. 16 and 17. InFigs. 14–17, the most frequent natural subgraphs (ID-22and ID-12) are both well represented in duplication anddivergence-generated artificial networks whereas onlyone can be detected in fully random networks.
The subgraph counts for subgraphs of size three andfour for all types of regulatory networks investigated arepresented in Tables A.1 and A.3. For artificial networks,average numbers of counts are shown, whereas for nat-
ural regulatory systems only one network each is inves-tigated.Using the sum of square error (SSE) criterion, thesimilarity between the distributions of subgraphs for the
Fig. 15. Average frequency of occurrence for subgraphs of size three in800 randomly generated instances of the artificial regulatory networkmodel.
Fig. 16. Frequency of occurrence for subgraphs of size three in thetranscriptional network of Escherichia coli.
four types of networks was calculated. The similarityis shown for both three and four node subgraphs inTable 1.
The network distributions obtained from duplicationand divergence (D&D) are quite similar to that of S. cere-visiae for subgraph sizes of both three and four accordingto the SSE criterion. In contrast, the distributions of therandomly generated networks were not similar to anyof the three other network types investigated. Networkscreated by duplication and divergence and the regula-tory networks of E. coli and S. cerevisiae are all moresimilar to each other than to the randomly generated
networks.Because gene duplication is considered a more im-portant mechanism of evolution in eukaryotes than in
Fig. 17. Frequency of occurrence for subgraphs of size three in thetranscriptional network of Saccharomyces cerevisiae.

P.D. Kuo et al. / BioSystems 85 (2006) 177–200 187
Fig. 18. Average frequency of occurrence for subgraphs of size fourin 200 instances of the artificial regulatory network model generatedby a duplication and divergence procedure.
Fig. 19. Average frequency of occurrence for subgraphs of size four in200 randomly generated instances of the artificial regulatory networkmodel.
Table 1Sum of square error (SSE) between the distributions of subgraph counts(for subgraph size three/four) for the four types of networks examined
D&D Rand E. coli Yeast
D&D 0 – – –Rand 1.5348/5.3093 0 – –E. coli 1.0844/1.4227 2.2392/5.6148 0 –Yeast 0.0072/0.0984 1.4886/5.1497 1.1693/1.2356 0
Each distribution has been normalized such that the maximum countof any individual subgraph is 1.0.
Fig. 20. Frequency of occurrence for subgraphs of size four in thetranscriptional network of Escherichia coli.
prokaryotes, it is interesting that the duplication and di-vergence networks are more similar to the eukaryotic S.cerevisiae rather than the prokaryotic E. coli. This mightsuggest that the topology has been shaped by duplicationevents in S. cerevisiae’s evolutionary history. Teichmannand Babu (2004) suggest that over 90% of eukaryoticgenes are created by gene duplication. Our observationssupport this argument: It is striking how similar the dis-tributions of subgraphs are for these three networks as
compared to the randomly created topologies.We can further investigate the individual subgraphswell represented in these networks. From Figs. 14,
Fig. 21. Frequency of occurrence for subgraphs of size four in thetranscriptional network of Saccharomyces cerevisiae.

188 P.D. Kuo et al. / BioSystems 85 (2006) 177–200
on the
Fig. 22. The effect of whole genome duplication16 and 17, motifs with IDs 12 and 22 are present insubstantial numbers. These motifs correspond to the so-called single input module (Milo et al., 2002). This isalso the case when examining subgraphs of size four inFigs. 18–21 where network motif IDs 459 and 563 arewell represented. However, in counts of both three andfour node subgraphs, the single input modules were notwell represented in randomly created graphs.
How is the single-input module created by duplica-tion and divergence? We can examine the effect of du-plication on the simplest of gene interactions, where onegene has a regulatory influence on another. If these genesand their connections are duplicated we can obtain theso-called single input module network motif.
Fig. 22 shows the effects of two duplications onthe simplest of regulatory influences. As can be seentwo types of subgraphs should be created with equalprobability, the single-input module and the so-calledsingle-output module. However, from examining the mo-tif counts for both natural and artificial networks thecounts yield asymmetrical number. In Leier et al. (2005)we will show why this is a natural consequence of theduplication and divergence process.
4. Evolving dynamics in the ARN model
In the previous section, the topology of the ARNmodel was investigated. Topology, however, is only oneof the aspects of a genetic regulatory network. It is thedynamics of the network that gives rise to the myriad offunctions observed in natural systems. Here we examinethe dynamics of our ARN model by attempting to evolve
simple time series.If we try to evolve time series in the ARN model, theevolvability of the ARN model can be looked at withsome possible relevance to the evolvability of natural
simplest possible interaction between two genes.
systems. The types of analysis and search mechanismsrelevant to such processes could also be important tothe field of synthetic biology where synthetic geneticregulatory networks have been evolved in vivo towarddynamics such as oscillations (Yokobayashi et al., 2002)in silico (Mason et al., 2004) and in numero (Francoisand Hakim., 2004). Such an investigation also provides aframework in which we can begin to study the interplaybetween network dynamics, evolution and topology (seealso Kuo et al. (2004)).
4.1. Extracting a signal from the ARN model
Simulation of the ARN model produces the dynam-ics of the protein concentrations in the system. However,the system has no assigned semantics—protein concen-trations have no meaning outside the system (they per-form no cellular function other than regulation). Addi-tionally, since the protein concentrations must sum to 1(i.e.
∑ci = 1), certain functions are excluded (e.g. two
sinusoids with the same phase and frequency).In order to use the ARN framework to obtain more
arbitrary dynamics, a mapping is required. We have cho-sen to do this by adding an additional transcription fac-tor binding site to the genome. Remember that proteinsacting as transcription factors can bind to transcriptionfactor binding sites influencing the transcription of ad-jacent genes. The rate of transcription of this new siteis taken to be similar to a protein concentration whichhas no other effects on the system. It is the dynamics ofthis particular site that will be evolved toward specificdynamics.
This is done by randomly choosing an additional 64-bit sequence along the genome. The first 32-bits specifya transcription factor binding site representing an inhibi-tion site while the second 32-bits specify a transcription

ystems 85 (2006) 177–200 189
ftsohsicgauNdesdt
aibittibs
4
u2pu1uot(Ei
cdif
#csb
P.D. Kuo et al. / BioS
actor binding site for activation. The proteins in the sys-em are free to bind to these two additional regulatoryites (which can be thought of as a gene with no proteinf its own or promoter). The levels of activation and in-ibition produced at these two sites are calculated in theame way as in Eq. (2) and are modulated by the proteinsn the system. However, instead of calculating a “con-entration” of a protein generated from this site (whichenerates no actual protein of its own) as is the case forgene, the activity at this site is simply summed and
sed directly as an output function, s(t) = ∑i(ei − hi).
ormalization of s(t) between −1 and 1 generates theynamics of this site which are taken to be the dynamicsxtracted from this network. Without this normalizationtep, it is difficult to match the scaling of the desiredynamics. However, since the scaling is effectively arbi-rary, this is not a problem.
The additional binding sites added to the genomere a method to extract dynamics from the changesn protein concentrations of the ARN model. This cane visualized as a network like the ones presentedn Figs. 2 and 3 except where each protein is linkedo an additional node representing the new inhibi-ion/activation site (that does not generate a protein ofts own). Additional inhibition/activation sites may alsoe added to the genome for the extraction of additionalignals.
.2. Optimization and simulation details
A simple (50 + 100)-Evolutionary Strategy (ES) issed to evolve the solution, s(t) (Beyer and Schwefel,002). Genomes were generated by 10 duplication eventser genome subject to 1% mutation leading to individ-al genomes of length LG = 32,768. Each generation,00 new individuals are created from the current pop-lation using 1% single-point (bit-flip) mutation (i.e.n average, 328 mutations per genome). The fitness ofhese solutions was calculated and the best 50 of 150parents + children) proceed to the next generation. TheS was terminated when the best solution found was not
mproved upon for 250 generations.The objective is to minimize the fitness function cal-
ulated as the mean square error (MSE) between theesired function and the evolved function. The follow-ng cases were examined and are shown in Fig. 23:(t) = sin(t) (Case #1), f (t) = 2 exp (−0.1t) − 1 (Case
2) and f (t) = 21+exp (−0.2t+10) − 1 (Case #3). Theseases represent oscillatory, decaying exponential andigmoidal dynamics which are all relatively simple yetiologically important.
Fig. 23. Plot of the three time series.
All solutions were generated with a time step ofdt = 0.1 s. The constant step size facilitates the quickcomparison of dynamics between solutions. In addition,since the dynamics of the system do not change quicklywith respect to this particular step size (i.e. the secondderivative of the function is small), it is an appropriatechoice for the three cases. The initial protein concentra-tions (the initial conditions for the differential equation)are set to 1
# of genes . In addition, the first 100 time steps(10 s) are ignored in order to exclude the startup dy-namics of the model. Thus, for calculation of the fitnessfunction, the normalized output generated by the ARNmodel from time t = 10, . . . , 110 s is compared with thetime series f (t) from time t = 0, . . . , 100 s.
4.3. Results
Table 2 summarizes the results of 10 evolutionaryruns for each of the 3 fitness cases. Fig. 24 shows theprogress of the best evolutionary run for each case.
The ARN model accurately generates dynamics ap-proximating the sinusoid, the exponential and the sig-moid functions with good accuracy for all runs. In allfitness cases and evolutionary runs, the MSE calculatedwas less than 0.00588654. Additional support for thesuccess of these simulations can be seen in the final pop-ulation fitness averages shown in Table 2. The averagepopulation fitness values (MSE) are relatively small withlow standard deviation indicating that the population issuch that all individuals generate solutions that closely
approximate the respective objective functions.A wide variety of networks with differing numbersof genes were found to generate equivalent dynamicsfor the three time series. The numbers of genes used

190 P.D. Kuo et al. / BioSystems 85 (2006) 177–200
Table 2Results of 10 runs of (50 + 100)-ES on each case
Case-run Best MSE #Gens. #Genes Avg. MSE (Pop.) Avg. #Genes (Pop.)
1-1 0.001445217 731 47 0.00287 (7.7e−4) 45.31(5.72)1-2 0.001165628 381 74 0.00316 (7.8e−4) 76.92(3.42)1-3 0.000614281 1214 105 0.00114 (1.5e−4) 117.59(4.57)1-4 0.000747053 835 234 0.00291 (8.2e−4) 244.00(13.2)1-5 0.001861556 428 63 0.00326 (6.8e−4) 75.08(9.34)1-6 0.000640149 1077 101 0.00186 (3.5e−4) 102.49(4.08)1-7 0.001561523 315 26 0.00440 (8.5e−4) 32.78(5.55)1-8 0.000151746 1040 124 0.00058 (1.3e−4) 135.63(6.32)1-9 0.000519559 933 71 0.00134 (3.4e−4) 92.88(53.2)1-10 0.000846462 858 55 0.00270 (4.5e−4) 48.57(3.22)
2-1 0.00411971 708 133 0.00447 (1.3e−4) 142.83(5.88)2-2 0.00478168 642 166 0.00554 (2.5e−4) 185.95(13.5)2-3 0.00363873 354 27 0.00641 (5.5e−4) 52.22(7.00)2-4 0.00441011 359 20 0.00660 (6.1e−4) 31.95(7.38)2-5 0.00381064 747 97 0.00505 (3.0e−4) 106.81(5.71)2-6 0.00402240 877 63 0.00464 (1.8e−4) 58.83(4.17)2-7 0.00426413 501 128 0.00574 (3.5e−4) 116.14(8.75)2-8 0.00537858 287 176 0.00661 (4.6e−4) 164.40(11.1)2-9 0.00511630 466 58 0.00688 (5.6e−4) 54.26(3.73)2-10 0.00588654 519 45 0.00643 (1.7e−4) 45.65(3.10)
3-1 0.00101533 1235 154 0.00150 (1.3e−4) 147.59(20.6)3-2 0.00035992 557 36 0.00068 (1.2e−4) 39.22(2.40)3-3 0.00001843 758 100 0.00004 (1.0e−5) 102.45(2.93)3-4 0.00001732 721 96 0.00004 (1.0e−5) 96.55(2.80)3-5 0.00011328 617 97 0.00025 (6.0e−5) 102.78(4.02)3-6 0.00002073 825 104 0.00013 (5.0e−5) 109.78(5.03)3-7 0.00005429 465 108 0.00044 (1.8e−4) 112.37(11.4)3-8 0.00016598 879 177 0.00047 (2.2e−4) 186.02(9.87)3-9 0.00005034 575 195 0.00031 (1.2e−4) 212.16(9.57)3-10 0.00002219 987 39 0.00006 (1.0e−5) 39.49(2.42)
The standard deviation is given in parenthesis.
Fig. 24. Fitness plot of the best solutions and the average fitnessesusing (50 + 100)-ES for each case.
to obtain solutions was usually large, due to a lack of apenalty on the number of genes during evolution. The al-gorithm was then reapplied with the addition of a penaltyon the number of genes. Because penalty functions aretypically arbitrary and problem dependent (since theydirectly affect the search space), a simple approach wastaken. Instead of penalizing the number of genes in thesystem, networks with more than 10 genes were setto have a fitness of 4.0. In this way, the fitness land-scape of each time series is not as directly impacted.Regions of the search space which have 10 or less genesare completely unaffected while regions with more than10 genes are equally penalized. In this way, we can besure that we have not drastically altered the entire searchspace when performing search. In other words, the solu-
tions found using this new fitness function could also befound with the original fitness function and would havethe same fitness—which allows direct comparison ofsolutions.
stems
required to generate an oscillator in the ARN modelis 2.
The requirements to generate a decaying exponentialin the ARN model are decidedly simpler. In the dynam-
Fig. 25. Three two-gene networks that generate sigmoid dynamics. The “O” n
85 (2006) 177–200 191
ical equations the effects of excitation and inhibition onone gene are exponential in nature. Therefore, we simplywould need one gene in the system whose protein prod-uct binds with greater strength to the inhibitory ratherthan the excitatory site from which the dynamics are ex-tracted. So, one gene is required to create the dynamicsof a decaying exponential.
The situation is somewhat more complicated in thecase of the sigmoid-type function. A means of derivingthe minimum requirements for this function to a canon-ical form as was done for the previous two types of dy-namics was not found. However, it can be reasoned thatthe minimum number of genes required must be greaterthan one since a network with only one gene leads toexponential-type dynamics. To show that the sigmoiddynamics can be generated with two genes, the algo-rithm was rerun such that networks with more than twogenes had a fitness of 4.0. Fig. 25 shows examples ofthree different network topologies which can generatethe sigmoid dynamics.
Therefore, the minimum number of genes required togenerate a sigmoid is two.
In all of these cases, the number of genes actuallyused by the ARN is far higher than the minimum re-quirement. This has a bearing on evolvability. Provideda large number of degrees of freedom is cheaply avail-able to the system, AND provided that the overall in-teraction of these degrees of freedom allows reaching agoal incrementally, a large number might have an ad-vantage over a small number in terms of search effi-ciency and evolvability. We conjecture that in such acase that once a good solution has been found, a grad-
P.D. Kuo et al. / BioSy
Results of 10 runs on each time series are shownin Table A.2. The algorithm was terminated when thebest fitness obtained was less than 5.0 × 10⁻³ ratherthan after 250 generations of fitness stagnation. Use ofthe previous termination criterion can lead to algorithmtermination before a good solution has been obtained.In all runs, networks were obtained which have 10 orless genes and can generate the desired dynamics withMSE < 5.0 × 10⁻³.
What would be the minimum number of genes re-quired to generate equivalent dynamics for each time se-ries? For the sinusoid, a simple oscillator can be writtenin the matrix form:
x(t) =[
0 ω
−ω 0
]x(t)
which leads to x1 = − sin(ωt) and x2 = − cos(ωt). Wecan take the vector x to be the concentrations of gene–protein pairs.
If this equation was to be implemented in the ARNmodel how would it look? There would be two gene–protein pairs represented by nodes, “1” and “2”. Thefirst equation (x1 = ωx2) can be implemented by node“2” having an inhibitory relationship with node “1”. Thesecond equation, likewise, can be implemented with anexcitatory relationship between node “1” and node “2”.In this way, the simple oscillator can be implemented.For the ARN dynamic model to extract this oscillatorydynamic, it would simply have to have higher connectiv-ity with one of the protein products of either node “1” or“2”. Therefore, the minimum possible number of genes
ode denotes the additional site used to extract the network dynamics.
ual decline in the number of degrees of freedom with asimultaneous readjustment of the remaining degrees isa far better strategy than employing parsimony from thebeginning.

Systems
192 P.D. Kuo et al. / Bio5. Conclusion
The ARN model first proposed by Banzhaf (2003a)was studied from the perspective of network topologyand the evolution of dynamics. We addressed questionsraised in both artificial evolutionary processes andnetwork biology. Specifically, the model was examinedfrom the perspective of the scale-free, small-worldand network motif topological properties when createdusing a whole genome duplication and divergenceprocess. This process was chosen since it has beenpreviously implicated as an important factor in theevolution of genomes and due to its simplicity.
Networks generated from this processes can indeedbe classified as being scale-free and small-world. Al-though many researchers have claimed that the presenceof scale-free and Small-world network topologies arehallmarks of evolution, we believe that these propertiesfollow naturally from the processes of generation of thenetworks. In addition, these networks were also foundto have subgraph distributions similar to those found inthe transcriptional regulatory networks of E. coli and S.cerevisiae unlike those of random networks.
For the examination of static network topology, evo-lution was not included among the processes. Therefore,the topologies obtained are directly related to the methodof construction. This might indicate that such topologiesin natural networks may be a result of the way they arecreated rather than being explicitly molded by evolu-tion. In other words, the node and vertex distributionoutcomes are a reflection of the generation mechanismrather than the result of evolutionary pressures. It maybe the case that the motif distributions in these naturalnetworks are to a large part also the result of otherorganizing forces such as duplication and divergence(although evolutionary pressures are certainly responsi-
ble for fine-tuning of distributions). Therefore, it may bemore interesting to investigate transcriptional regulatorynetwork topology with regard to the methods of networkcreation. Efforts in this direction are just beginning.85 (2006) 177–200
Further, the evolution of the dynamics of this modelhas been investigated. It was demonstrated that thedynamics of this model can be evolved toward simpletime series behaviors such as the sinusoid, sigmoidand decaying exponential time series. Examining thenetworks generated in different genomes shows thatmany different networks give good approximations toeach of the prescribed behaviors. This indicates thatwithin the ARN framework there exist an extensivenumber of functionally equivalent topologies whichmay be progressively evolved.
Due to the way in which genes are specified in themodel, there are plenty of opportunities for individuals inthe population to acquire neutral mutations beneficial totheir further evolution (Ohta, 2002). Since extensive non-coding regions exist in these genomes, neutral mutationsare free to accumulate new genes that might suddenlyappear when a new promoter pattern has been createdthrough mutation.
An open question within this framework is how thenumber of genes affects the ability to generate functionsof a given type. From the results presented, we deducethat it is quite easy to evolve the ARN model towardsimple time series. Evolvability is helped in our case bymore degrees of freedom. In addition, it was observedthat each solution evolved for any of the time series dif-fered substantially from run to run. A huge number ofdifferent topologies can generate equivalent dynamics. Isthis the trick nature used to provide good, yet individualsolutions to organisms?
Acknowledgements
The authors would like to thank Francois Kepes, LeonGlass, Theodore Perkins, Peter Swain, Mike Hallett andWilliam Langdon for helpful discussions.
Appendix A. Additional data
See Figs. A.1–A.3 and Tables A.1–A.3.

P.D. Kuo et al. / BioSystems 85 (2006) 177–200 193
Fig. A.1. Network motifs of s
ize three and their ID.
194 P.D. Kuo et al. / BioSystems 85 (2006) 177–200
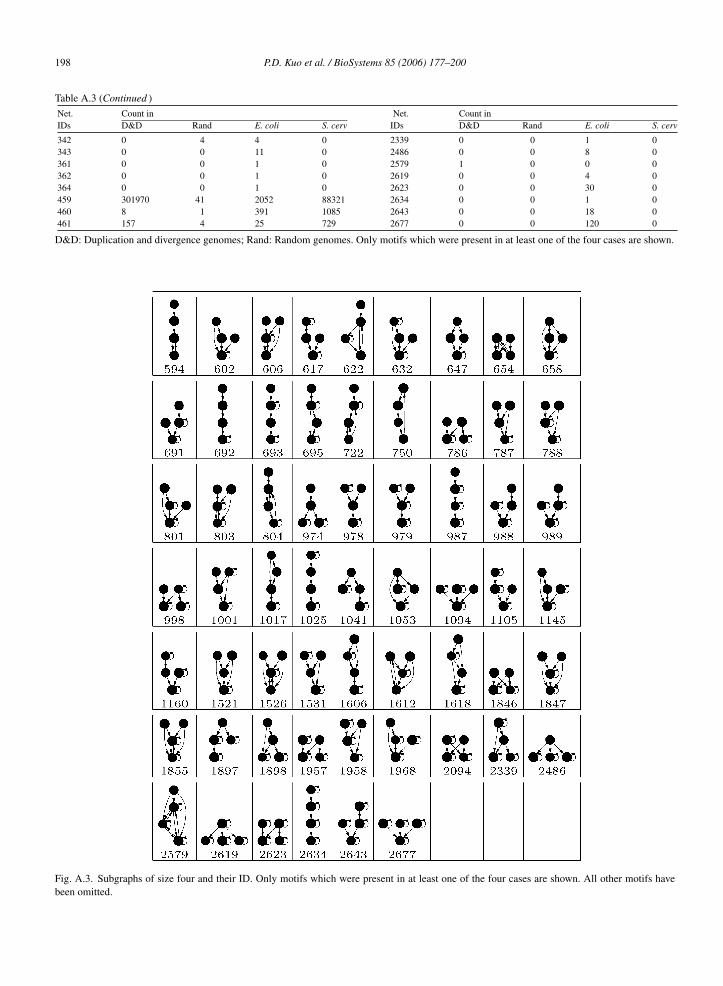
Fig. A.2. Subgraphs of size four and their ID. Only motifs which were present in at least one of the four cases are shown. All other motifs havebeen omitted.

P.D. Kuo et al. / BioSystems 85 (2006) 177–200 195
Table A.1Subgraphs of size three and their distribution
Net. Count in Net. Count in
ID ID* D&D Rand E. coli S. cerv ID ID* D&D Rand E. coli S. cerv
0 6 2424 76 35 751 43 A 0 0 0 01 A 4 0 0 1 44 108 0 0 0 02 12 490 271 40 246 45 A 1 0 0 03 A 11 0 26 24 46 110 0 0 0 04 14 6 0 0 0 47 A 0 0 0 05 A 0 0 0 0 48 A 0 0 3 06 A 12 0 124 138 49 A 0 0 0 07 A 0 0 8 0 50 A 0 0 0 08 A 0 0 1 0 51 A 0 0 0 19 A 0 0 2 0 52 A 0 0 0 0
10 A 0 0 0 0 53 A 0 0 1 011 A 0 0 0 0 54 A 0 0 0 012 36 27659 0 587 8800 55 A 0 0 0 013 A 8 0 76 104 56 A 0 0 0 014 38 15 0 2 44 57 A 0 0 0 015 A 0 0 1 1 58 A 0 0 0 016 A 20 0 11 22 59 A 0 0 54 417 46 0 0 0 1 60 A 0 0 12 018 A 0 0 0 0 61 A 0 0 0 019 A 0 0 2 1 62 A 0 0 0 020 A 0 0 1 0 63 A 0 0 0 021 A 0 0 0 0 64 A 10 0 0 022 A 5016 0 3353 2987 65 A 0 0 0 023 74 36 0 0 18 66 A 0 0 0 024 A 5 0 0 0 67 A 0 0 0 025 78 3 0 0 0 68 238 0 0 0 026 A 0 0 0 0 69 A 0 0 0 027 A 6 0 53 25 70 A 0 0 0 028 A 0 0 32 0 71 A 0 0 0 029 A 0 0 0 0 72 A 0 0 0 030 A 0 0 0 0 73 A 0 0 6 031 A 14 0 713 0 74 A 0 0 3 032 A 0 0 0 0 75 A 0 0 0 033 A 3 0 0 0 76 A 0 0 46 034 A 0 0 0 0 77 A 0 0 0 035 A 0 0 0 0 78 A 0 0 0 036 A 0 0 0 0 79 A 0 0 0 037 A 0 0 0 0 80 A 0 0 0 038 98 0 0 0 0 81 A 0 0 0 039 A 0 0 0 0 82 A 0 0 0 040 102 0 0 0 0 83 A 0 0 0 041 A 0 0 0 0 84 A 0 0 0 0
A 6 0 14 3 A 0 0 0 0
DA
42
&D: Duplication and divergence genomes; Rand: Random genomes. ID* arare subgraphs with self-regulatory connections which do not have a design
85
e the subgraph designations given by Milo et al. (2002). IDs shown asation in Milo et al. (2002).

196 P.D. Kuo et al. / BioSystems 85 (2006) 177–200
Table A.2Results of 10 runs of (50 + 100)-ES on each case with a penalty function
Case-run Best MSE #Gens. #Genes Avg. MSE (Pop.) Avg. #Genes (Pop.)
1-1 0.00287157 89122 10 0.00734 (1.1e−3) 9.73(0.54)1-2 0.00444153 13643 8 0.00912 (8.1e−4) 7.29(0.43)1-3 0.00486211 401417 9 0.01027 (2.3e−4) 9.18(0.18)1-4 0.00470516 133229 10 0.00707 (6.1e−4) 10.20(0.20)1-5 0.00356387 21205 10 0.01493 (4.7e−3) 10.20(0.20)1-6 0.00493755 99553 10 0.00870 (1.5e−3) 9.92(0.49)1-7 0.00398828 11342 10 0.02751 (1.3e−2) 10.00(0.49)1-8 0.00472991 23091 10 0.00989 (2.4e−3) 10.20(0.20)1-9 0.00480238 395 9 0.30263 (7.5e−2) 9.47(0.56)1-10 0.00281274 1664 8 0.20032 (7.5e−2) 9.59(0.89)
2-1 0.00484099 639 8 0.00811 (5.4e−4) 7.02(2.08)2-2 0.00492588 2799 9 0.00714 (6.2e−4) 9.02(0.98)2-3 0.00418354 820 5 0.00659 (5.0e−4) 6.32(1.69)2-4 0.00478972 5336 9 0.00636 (4.9e−4) 9.33(1.02)2-5 0.00497284 1676 9 0.00759 (4.2e−4) 9.31(0.71)2-6 0.00490717 468 9 0.00810 (6.9e−4) 8.82(1.01)2-7 0.00430360 642 10 0.00785 (6.5e−4) 8.51(1.49)2-8 0.00472030 3529 10 0.00577 (2.6e−4) 9.67(0.73)2-9 0.00467765 10112 10 0.00601 (2.6e−4) 10.18(0.25)2-10 0.00413019 241 5 0.00798 (9.1e−4) 7.00(1.66)
3-1 0.00345716 35 6 0.05491 (1.8e−2) 8.84(1.35)3-2 0.00375144 61 9 0.04274 (1.5e−2) 8.80(1.05)3-3 0.00425317 8 6 0.13660 (7.1e−2) 7.71(1.66)3-4 0.00149893 15 8 0.10153 (4.1e−2) 8.41(1.62)3-5 0.00373932 21 10 0.07446 (3.5e−2) 8.44(1.42)3-6 0.00299901 208 8 0.01359 (4.0e−3) 8.92(0.99)3-7 0.00341115 32 7 0.03841 (1.1e−2) 8.55(1.16)3-8 0.00492678 109 10 0.01886 (6.7e−3) 8.49(1.25)3-9 0.00101274 4 6 0.39698 (1.8e−1) 7.73(1.84)3-10 0.00423338 19 9 0.07139 (3.1e−2) 8.59(1.40)
The standard deviation is given in parenthesis.
Table A.3Subgraphs of size four and their distribution
Net. Count in Net. Count inIDs D&D Rand E. coli S. cerv IDs D&D Rand E. coli S. cerv
0 4137 43 4 843 462 2 0 8 232 56 125 10 116 463 1 0 0 13 0 1 0 5 465 1 0 46 3464 1716 2 0 0 466 0 0 0 96 3 2 38 150 468 0 0 0 18 0 2 0 0 469 0 0 0 1
12 61 249 3 329 472 0 0 17 613 0 3 0 0 473 0 0 9 014 1531 247 510 16925 474 0 0 3 215 0 3 0 31 475 0 0 2 016 9 5 0 75 483 4 0 0 12018 0 3 5 19 484 0 0 1 119 0 2 0 0 487 0 0 0 121 0 4 1 11 493 5 0 16 3322 0 0 0 3 494 0 0 0 1723 1 0 0 0 498 0 0 1 426 0 3 36 157 499 0 0 0 1528 0 0 2 10 505 0 0 1 035 1337 1 8 1105 525 0 0 0 137 0 0 0 5 533 0 0 0 2

P.D. Kuo et al. / BioSystems 85 (2006) 177–200 197
Table A.3 (Continued )
Net. Count in Net. Count inIDs D&D Rand E. coli S. cerv IDs D&D Rand E. coli S. cerv
39 0 0 0 1 548 0 0 1 045 1451 123 118 1246 563 130570 0 45585 5956946 0 1 72 81 564 521 2 0 12147 10 4 0 0 565 34 0 0 049 530 0 0 0 566 11 0 0 051 0 4 58 4 568 54 0 0 055 0 3 1 0 570 16 2 191 12956 0 0 6 0 571 0 0 103 063 10 245 0 92 576 161 0 19077 064 0 3 8 0 578 20 0 0 065 0 4 0 0 587 410 3 1606 15067 0 4 0 0 588 8 4 0 069 1 0 0 0 590 24 2 0 3271 0 5 0 11 594 3 4 0 077 1 0 0 0 602 1028 0 415 2479 0 4 0 0 606 27 0 0 088 0 0 1 0 617 0 0 90 095 0 4 7 0 622 0 0 0 1696 1 4 0 0 632 0 0 5 098 1293 246 188 3859 647 3 0 0 099 0 3 167 528 654 2 0 0 0
100 0 5 0 51 658 20 0 0 0102 1 4 0 0 691 0 0 624 0106 291 3 3569 4618 692 0 4 6 0108 2 4 0 16 693 0 0 8 0112 1 4 1 195 695 0 0 7 0113 0 0 39 83 722 0 0 0 1114 0 0 0 1 750 0 1 0 0120 0 0 12 0 786 0 0 1950 118123 0 3 18 43 787 2 0 96 3124 0 0 1 0 788 0 0 11 0125 0 0 0 5 801 167 0 659 0126 0 0 1 0 803 75 0 0 0131 0 0 259 0 804 0 0 0 1137 0 0 1 0 974 0 0 18 0145 1 4 10 27 978 0 0 15 0150 2 4 0 10 979 0 0 9 0154 1 0 0 0 987 0 0 2 0158 10 0 7 14 988 0 0 202 0164 0 0 0 1 989 0 0 81 0199 0 3 6 28 998 0 0 281 0200 0 0 14 0 1001 0 0 1 0201 0 0 5 3 1017 0 0 1 0202 0 0 1 0 1025 0 0 1 0207 0 0 5 0 1041 0 0 15 1237 39 2 0 6 1053 0 0 9 1273 0 0 40 2 1094 0 0 2710 0274 0 0 6 0 1105 0 0 124 0275 0 0 1 0 1145 0 0 61 0279 0 0 9 0 1160 0 0 13 0281 0 0 508 0 1521 44 0 26 3282 0 0 30 0 1526 5 0 0 0283 0 0 1 0 1531 0 0 9 0289 0 0 1 0 1606 0 0 6 0293 1 4 704 1261 1612 0 0 0 1294 0 0 16 0 1618 0 0 5 0295 0 0 0 2 1846 0 0 57 1296 0 0 1 0 1847 43 0 7 0298 0 0 1 0 1855 354 0 0 0301 0 0 43 14 1897 0 0 14 0302 0 0 3 0 1898 0 0 4 0303 0 0 7 0 1957 0 0 208 0306 0 0 1 0 1958 0 0 1 0309 6 0 125 737 1968 0 0 99 0310 0 0 5 0 2094 0 0 14 0
198 P.D. Kuo et al. / BioSystems 85 (2006) 177–200
Table A.3 (Continued )
Net. Count in Net. Count inIDs D&D Rand E. coli S. cerv IDs D&D Rand E. coli S. cerv
342 0 4 4 0 2339 0 0 1 0343 0 0 11 0 2486 0 0 8 0361 0 0 1 0 2579 1 0 0 0362 0 0 1 0 2619 0 0 4 0364 0 0 1 0 2623 0 0 30 0459 301970 41 2052 88321 2634 0 0 1 0460 8 1 391 1085 2643 0 0 18 0461 157 4 25 729 2677 0 0 120 0
D&D: Duplication and divergence genomes; Rand: Random genomes. Only motifs which were present in at least one of the four cases are shown.
Fig. A.3. Subgraphs of size four and their ID. Only motifs which were present in at least one of the four cases are shown. All other motifs havebeen omitted.

ystems
R
B
B
B
B
B
B
B
B
D
D
D
F
F
G
G
H
H
J
P.D. Kuo et al. / BioS
eferences
abu, M., Teichmann, S.A., 2003. Evolution of transcription factorsand the gene regulatory network in Escherichia coli. Nucl. AcidsRes. 31 (4), 1234–1244.
abu, M., Luscombe, N., Aravind, L., Gerstein, M., Teichmann, S.A.,2004. Structure and evolution of transcriptional regulatory net-works. Curr. Opin. Struct. Biol. 14, 283–292.
anzhaf, W., 2003. On the dynamics of an artificial regulatory network.In: Banzhaf, W., Christaller, T., Dittrich, P., Kim, J.T., Ziegler, J.(Eds.), Advances in Artificial Life—Proceedings of the SeventhEuropean Conference on Artificial Life (ECAL), vol. 2801 of Lec-ture Notes in Artificial Intelligence. Springer-Verlag, pp. 217–227.
anzhaf, W., 2003. Artificial regulatory networks and genetic program-ming. In: Riolo, R.L., Worzel, B. (Eds.), Genetic ProgrammingTheory and Practice. Kluwer, pp. 43–62 (Chapter 4).
anzhaf, W., Kuo, P., 2004. Network motifs in artificial and naturaltranscriptional regulatory networks. J. Biol. Phys. Chem. 4 (2),85–92.
arabasi, A.-L., Albert, R., 1999. Emergence of scaling in randomnetworks. Science 286, 509–512.
eyer, H.-G., Schwefel, H.-P., 2002. Evolution strategies: a compre-hensive introduction. Nat. Comput. 1 (1), 3–52.
ower, J., Bolouri, H. (Eds.), 2001. Computational Modelling of Ge-netic and Biochemical Networks. MIT Press, Cambridge, MA.
avidson, E., 2001. Genomic Regulatory Systems. Academic Press,San Diego, CA.
obrin, R., Beg, Q., Barabasi, A.-L., Olvai, Z., 2004. Aggregation oftopological motifs in the E. coli transcriptional regulatory network.BMC Bioinformat. 5 (10).
ujon, B., Sherman, D., Fischer, G., Durrens, P., Casaregola, S., La-fontaine, I., De Montigny, J., Marck, C., Neuveglise, C., Talla,E., Goffard, N., Frangeul, L., Aigle, M., Anthouard, V., Babour,A., Barbe, V., Barnay, S., Blanchin, S., Beckerich, J., Beyne, E.,Bleykasten, C., Boisrame, A., Boyer, J., Cattolico, L., Confan-ioleri, F., De Daruvar, A., Despons, L., Fabre, E., Fairhead, C.,Ferry-Dumazet, H., Groppi, A., Hantraye, F., Hennequin, C., Jau-niaux, N., Joyet, P., Kachouri, R., Kerrest, A., Koszul, R., Lemaire,M., Lesur, I., Ma, L., Muller, H., Nicaud, J., Nikolski, M., Oz-tas, S., Ozier-Kalogeropoulos, O., Pellenz, S., Potier, S., Richard,G., Straub, M., Suleau, A., Swennen, D., Tekaia, F., Wesolowski-Louvel, M., Westhof, E., Wirth, B., Zeniou-Meyer, M., Zivanovic,I., Bolotin-Fukuhara, M., Thierry, A., Bouchier, C., Caudron, B.,Scarpelli, C., Gaillardin, C., Weissenbach, J., Wincker, P., Souciet,J., 2004. Genome evolution in yeasts. Nature 430 (6995), 35–44.
rancois, P., Hakim, V., 2004. Design of genetic networks with speci-fied functions by evolution in silico. Proc. Natl. Acad. Sci. 101 (2),580–585.
riedman, R., Hughes, A.L., 2001. Gene duplication and the structureof eukaryotic genomes. Genome Res. 11 (3), 373–381.
oh, K., Oh, E., Jeong, H., Kahng, B., Kim, D., 2002. Classification ofscale-free networks. Proc. Natl. Acad. Sci. 99 (20), 12583–12588.
uelzim, N., Bottani, S., Bourgine, P., Kepes, F., 2002. Topologicaland causal structure of the yeast transcriptional regulatory network.Nat. Genet. 31, 60–63.
ood, L., Galas, D., 2003. The digital code of DNA. Nature 421 (6921),444–448.
ughes, A.L., 2005. Gene duplication and the origin of novel proteins.Proc. Natl. Acad. Sci. 102 (25), 8791–8792.
eong, H., Tombor, B., Albert, R., Oltvai, Z., Barabasi, A.-L., 2000.The large-scale organization of metabolic networks. Nature 407,651–654.
85 (2006) 177–200 199
Kashtan, N., Itzkovitz, S., Milo, R., Alon, U., 2004. Topological gen-eralizations of network motifs. Phys. Rev. E 70, 031909.
Kellis, M., Birren, B., Lander, E., 2004. Proof and evolutionary anal-ysis of ancient genome duplication in the yeast Saccharomycescerevisiae. Nature 428, 617–624.
Kitano, H. (Ed.), 2001. Foundations of Systems Biology. MIT Press,Cambridge, MA.
Kuo, P., Banzhaf, W., 2004. Scale-free and small world network topolo-gies in an artificial regulatory network model. Proceedings of theNinth International Conference on the Simulation and Synthesis ofLiving Systems (ALIFE), pp. 404–409.
Kuo, P., Leier, A., Banzhaf, W., 2004. Evolving dynamics in an artificialregulatory network model. In: Yao, X., Burke, E., Lozano, J., Smith,J., Merelo-Guervos, J., Bullinaria, J., Rowe, J., Tino, P., Kaban, A.,Schwefel, H.-P. (Eds.), Proceedings of the Eighth Conference onParallel Problem Solving from Nature (PPSN), vol. 3242 of LectureNotes in Computer Science, Springer-Verlag,s pp. 571–580.
Leier, A., Kuo, P., Banzhaf, W. Analysis of preferential network motifgeneration in an artificial regulatory network model created byduplication and divergence. Adv. Complex Syst., in preparation.
Mangan, S., Alon, U., 2003. Structure and function of the feed-forwardloop network motif. Proc. Natl. Acad. Sci. 100 (21), 11980–11985.
Mason, J., Linsay, P., Collins, J., Glass, L., 2004. Evolving complexdynamics in electronic models of genetic networks. Chaos 14 (3),707–715.
Milo, R., Shen-Or, S., Itzkovitz, S., Kashtan, N., Chklovskii, D., Alon,U., 2002. Network motifs: simple building blocks of complex net-works. Science 298, 824–827.
Milo, R., Itzkovitz, S., Kashtan, N., Levitt, R., Shen-Orr, S., Ayzensh-tat, I., Sheffer, M., Alon, U., 2004. Superfamilies of evolved anddesigned networks. Nature 303, 1538–1542.
Nadeau, J., Sankoff, D., 1997. Comparable rates of gene loss and func-tional divergence after genome duplications early in vertebrate evo-lution. Genetics 147, 1259–1266.
Ohno, S., 1970. Evolution by Gene Duplication. Springer, Berlin.Ohta, T., 2002. Near-neutrality in evolution of genes and gene regula-
tion Proc. Natl. Acad. Sci. 99 (25) 16134–16137Romualdo, P., Smith, E., Sole, R., 2003. Evolving protein interac-
tion networks through gene duplication. J. Theor. Biol. 222, 199–210.
Shen-Or, S., Milo, R., Mangan, S., Alon, U., 2002. Network motifsin the transcriptional regulation network of Escherichia coli. Nat.Genet. 31, 64–68.
Teichmann, S.A., Babu, M., 2004. Gene regulatory network growth byduplication. Nat. Genet. 36 (5), 492–496.
Valverde, S., Ferrer Cancho, R., Sole, R., 2002. scale-free networksfrom optimal design. Europhys. Lett. 60, 512–517.
van Noort, V., Snel, B., Huynen, M.A., 2004. The yeast coexpressionnetwork has a small-world, scale-free architecture and can be ex-plained by a simple model. EMBO Rep. 5 (3), 280–284.
Vazquez, A., Dobrin, R., Sergi, D., Eckmann, J.-P., Oltvai, Z.N.,Barabasi, A.-L., 2004. The topological relationship betweenthe large-scale attributes and local interaction patterns ofcomplex networks. Proc. Natl. Acad. Sci. 101 (52), 17940–17945.
Watts, D., 2003. Small Worlds: The Dynamics of Networks betweenOrder and Randomness. Princeton University Press, Princeton, NJ.
Wolfe, K., Shields, D., 1997. Molecular evidence for an ancient du-plication of the entire yeast genome. Nature 387 (6634), 708–713.
Wuchty, S., 2001. Scale-free behavior in protein domain networks.Mol. Biol. Evol. 18 (9), 1694–1702.
Systems
200 P.D. Kuo et al. / BioWuchty, S., Oltvai, Z., Barabasi, A.-L., 2003. Evolutionary conserva-
tion of motif constituents in the yeast protein interaction network.Nat. Genet. 35 (2), 176–179.Yeger-Lotem, E., Sattath, S., Kashtan, N., Itzkovitz, S., Milo, R., Pin-ter, R.Y., Alon, U., Margalit, H., 2004. Network motifs in inte-grated cellular networks of transcription-regulation and protein–
85 (2006) 177–200
protein interaction. Proc. Natl. Acad. Sci. 101 (16), 5934–5939.
Yokobayashi, Y., Weiss, R., Arnold, F., 2002. Directed evolution of agenetic circuit. Proc. Natl. Acad. Sci. 99 (26), 16587–16591.
Zhang, J., 2004. Evolution by gene duplication: an update. Trends Ecol.Evol. 18, 292–298.