
Network Management: Getting Started
116
JP1 Version 11 Network Management: Getting Started 3021-3-A71-10(E)
-
Upload
khangminh22 -
Category
Documents
-
view
0 -
download
0
Transcript of Network Management: Getting Started

JP1 Version 11
Network Management: Getting Started3021-3-A71-10(E)
Notices
■ Relevant program productsJP1/Network Node Manager i (for Windows)P-2942-82BL JP1/Network Node Manager i 11-10P-2942-83BL JP1/Network Node Manager i Advanced 11-10P-2942-89BL JP1/Network Node Manager i Developer's Toolkit 11-00
JP1/SNMP System Observer (for Windows)P-2942-8RBL JP1/SNMP System Observer 11-10
JP1/SNMP System Observer - Agent for Process (for Windows)P-2A42-8JBL JP1/SNMP System Observer - Agent for Process 11-00
JP1/Network Element Manager (for Windows)P-2942-8CB4 JP1/Network Element Manager for Cisco 11-10P-2942-8DB4 JP1/Network Element Manager for AX Series 11-10
JP1/Extensible SNMP Agent for Windows (for Windows)P-2A42-8BBL JP1/Extensible SNMP Agent for Windows 11-00
JP1/Network Node Manager i (for Linux)P-8242-82BL JP1/Network Node Manager i 11-10P-8242-83BL JP1/Network Node Manager i Advanced 11-10P-8242-89BL JP1/Network Node Manager i Developer's Toolkit 11-00
JP1/SNMP System Observer (for Linux)P-8242-8RBL JP1/SNMP System Observer 11-10
JP1/SNMP System Observer - Agent for Process (for Linux)P-8142-8JBL JP1/SNMP System Observer - Agent for Process 11-00
JP1/Extensible SNMP Agent (for Linux)P-8142-8ABL JP1/Extensible SNMP Agent 11-00
JP1/SNMP System Observer - Agent for Process (for UNIX)P-1M42-8JBL JP1/SNMP System Observer - Agent for Process 11-00 (for AIX)P-1J42-8JBL JP1/SNMP System Observer - Agent for Process 11-00 (for HP-UX (IPF))P-9D42-8JBL JP1/SNMP System Observer - Agent for Process 11-00 (for Solaris)
JP1/Extensible SNMP Agent (for UNIX)P-1M42-8ABL JP1/Extensible SNMP Agent 11-00 (for AIX)P-1J42-8ABL JP1/Extensible SNMP Agent 11-00 (for HP-UX (IPF))P-9D42-8ABL JP1/Extensible SNMP Agent 11-00 (for Solaris)
■ TrademarksHITACHI, JP1 are either trademarks or registered trademarks of Hitachi, Ltd. in Japan and other countries.Cisco is a registered trademark or trademark of Cisco Systems, Inc. and/or its affiliates in the United States and certainother countries.
Network Management: Getting Started 2
IBM, AIX are trademarks of International Business Machines Corporation, registered in many jurisdictions worldwide.Internet Explorer is either a registered trademark or trademark of Microsoft Corporation in the United States and/orother countries.Itanium is a trademark of Intel Corporation in the United States and other countries.Linux(R) is the registered trademark of Linus Torvalds in the U.S. and other countries.Microsoft is either a registered trademark or a trademark of Microsoft Corporation in the United States and/or othercountries.Oracle and Java are registered trademarks of Oracle and/or its affiliates.Red Hat is a trademark or a registered trademark of Red Hat Inc. in the United States and other countries.All SPARC trademarks are used under license and are trademarks or registered trademarks of SPARC International,Inc., in the United States and other countries. Products bearing SPARC trademarks are based upon an architecturedeveloped by Sun Microsystems, Inc.Symantec is a trademark or a registered trademark of Symantec Corporation or its affiliates in the U.S. and othercountries.UNIX is a registered trademark of The Open Group in the United States and other countries.Windows is either a registered trademark or a trademark of Microsoft Corporation in the United States and/or othercountries.Windows Server is either a registered trademark or a trademark of Microsoft Corporation in the United States and/orother countries.Other company and product names mentioned in this document may be the trademarks of their respective owners.The following program products contain some parts whose copyrights are reserved by Oracle and/or its affiliates:P-9D42-8JBL, and P-9D42-8ABL.The following program products contain some parts whose copyrights are reserved by UNIX System Laboratories,Inc.: P-9D42-8JBL, and P-9D42-8ABL.This product includes software developed by the Apache Software Foundation.(http://www.apache.org)This product includes software developed by the Indiana University Extreme! Lab.(http://www.extreme.indiana.edu)This product includes software developed by The Legion Of The Bouncy Castle.(http://www.bouncycastle.org)This product includes software developed by Trantor Standard Systems Inc.(http://www.trantor.ca)
JP1/SNMP System Observer includes RSA BSAFE(R) Cryptographic software of EMC Corporation.
Network Management: Getting Started 3

■ Microsoft product screen shotsMicrosoft product screen shots reprinted with permission from Microsoft Corporation.
■ RestrictionsInformation in this document is subject to change without notice and does not represent a commitment on the part ofHitachi. The software described in this manual is furnished according to a license agreement with Hitachi. The licenseagreement contains all of the terms and conditions governing your use of the software and documentation, includingall warranty rights, limitations of liability, and disclaimers of warranty.Material contained in this document may describe Hitachi products not available or features not available in yourcountry.No part of this material may be reproduced in any form or by any means without permission in writing from thepublisher.
■ IssuedMar. 2017: 3021-3-A71-10(E)
■ CopyrightAll Rights Reserved. Copyright (C) 2016, 2017, Hitachi, Ltd.Copyright (C) 2016, 2017, Hitachi Solutions, Ltd.Copyright (C) 2016, 2017, Hitachi Systems, Ltd.Copyright (C) 2009 Hewlett-Packard Development Company, L.P.This software and documentation are based in part on software and documentation under license from Hewlett-PackardCompany.
Network Management: Getting Started 4

Summary of amendments
The following table lists changes in this manual (3021-3-A71-10(E)) and productchanges related to this manual.
Changes Location
Windows Server 2016 is now supported. -
The following browser is no longer supported:• Internet Explorer 9
1.2.1
Supported Firefox versions were changed. 1.2.1, C.3
In addition to the above changes, minor editorial corrections were made.
Network Management: Getting Started 5
Preface
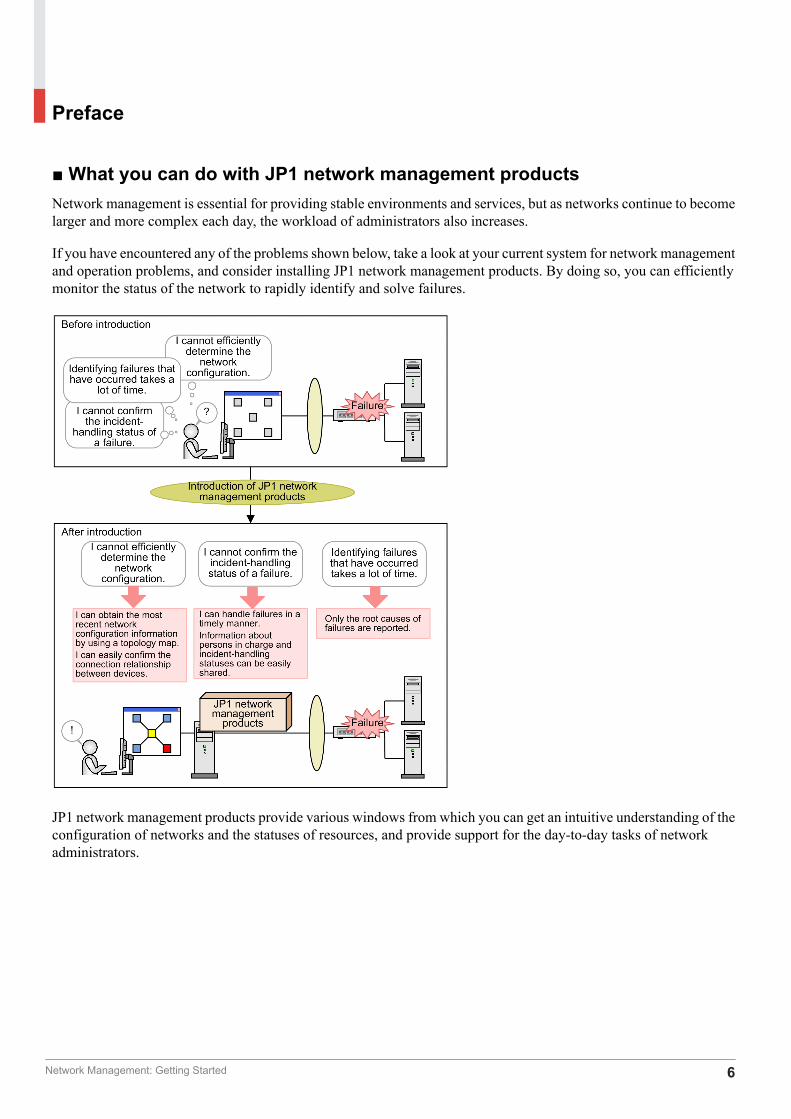
■ What you can do with JP1 network management productsNetwork management is essential for providing stable environments and services, but as networks continue to becomelarger and more complex each day, the workload of administrators also increases.
If you have encountered any of the problems shown below, take a look at your current system for network managementand operation problems, and consider installing JP1 network management products. By doing so, you can efficientlymonitor the status of the network to rapidly identify and solve failures.
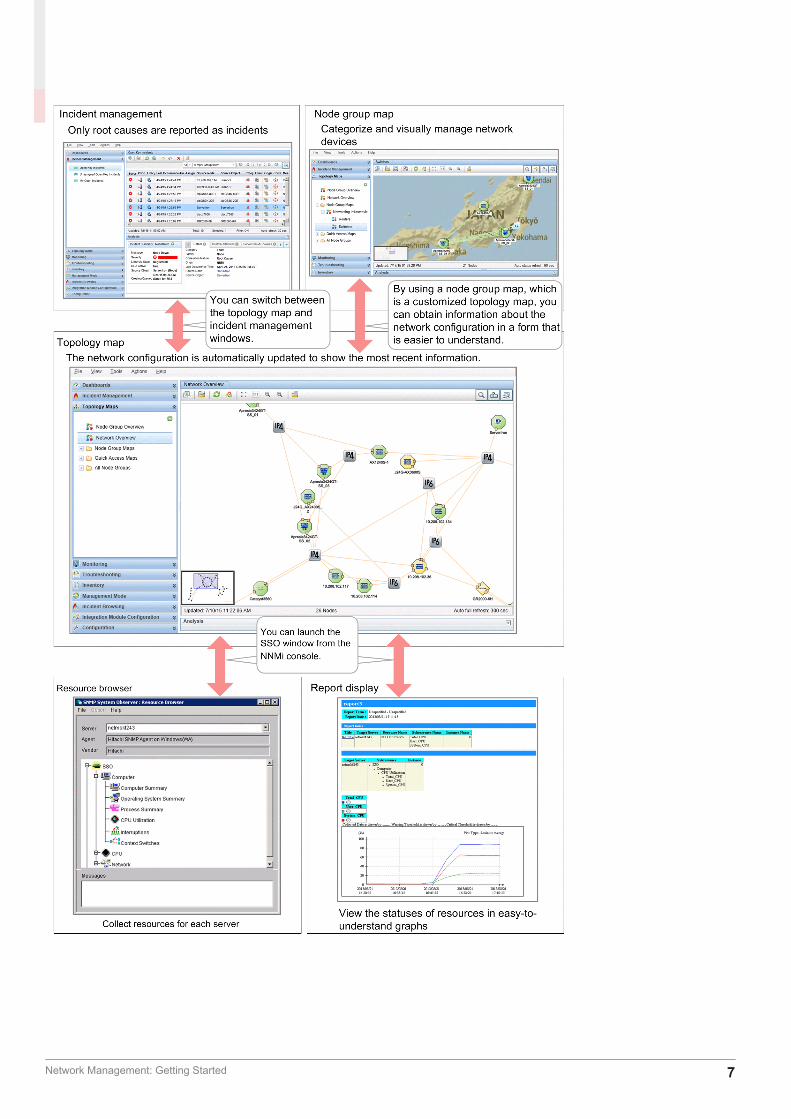
JP1 network management products provide various windows from which you can get an intuitive understanding of theconfiguration of networks and the statuses of resources, and provide support for the day-to-day tasks of networkadministrators.
Network Management: Getting Started 6
Network Management: Getting Started 7
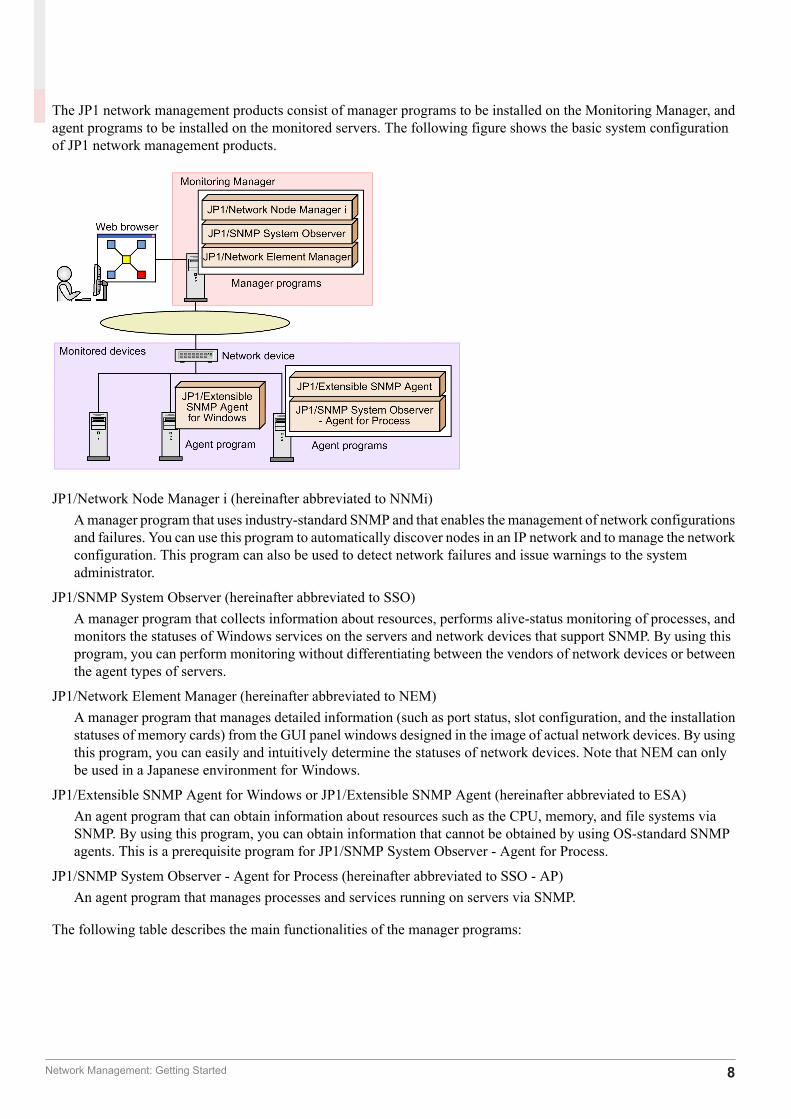
The JP1 network management products consist of manager programs to be installed on the Monitoring Manager, andagent programs to be installed on the monitored servers. The following figure shows the basic system configurationof JP1 network management products.
JP1/Network Node Manager i (hereinafter abbreviated to NNMi)A manager program that uses industry-standard SNMP and that enables the management of network configurationsand failures. You can use this program to automatically discover nodes in an IP network and to manage the networkconfiguration. This program can also be used to detect network failures and issue warnings to the systemadministrator.
JP1/SNMP System Observer (hereinafter abbreviated to SSO)A manager program that collects information about resources, performs alive-status monitoring of processes, andmonitors the statuses of Windows services on the servers and network devices that support SNMP. By using thisprogram, you can perform monitoring without differentiating between the vendors of network devices or betweenthe agent types of servers.
JP1/Network Element Manager (hereinafter abbreviated to NEM)A manager program that manages detailed information (such as port status, slot configuration, and the installationstatuses of memory cards) from the GUI panel windows designed in the image of actual network devices. By usingthis program, you can easily and intuitively determine the statuses of network devices. Note that NEM can onlybe used in a Japanese environment for Windows.
JP1/Extensible SNMP Agent for Windows or JP1/Extensible SNMP Agent (hereinafter abbreviated to ESA)An agent program that can obtain information about resources such as the CPU, memory, and file systems viaSNMP. By using this program, you can obtain information that cannot be obtained by using OS-standard SNMPagents. This is a prerequisite program for JP1/SNMP System Observer - Agent for Process.
JP1/SNMP System Observer - Agent for Process (hereinafter abbreviated to SSO - AP)An agent program that manages processes and services running on servers via SNMP.
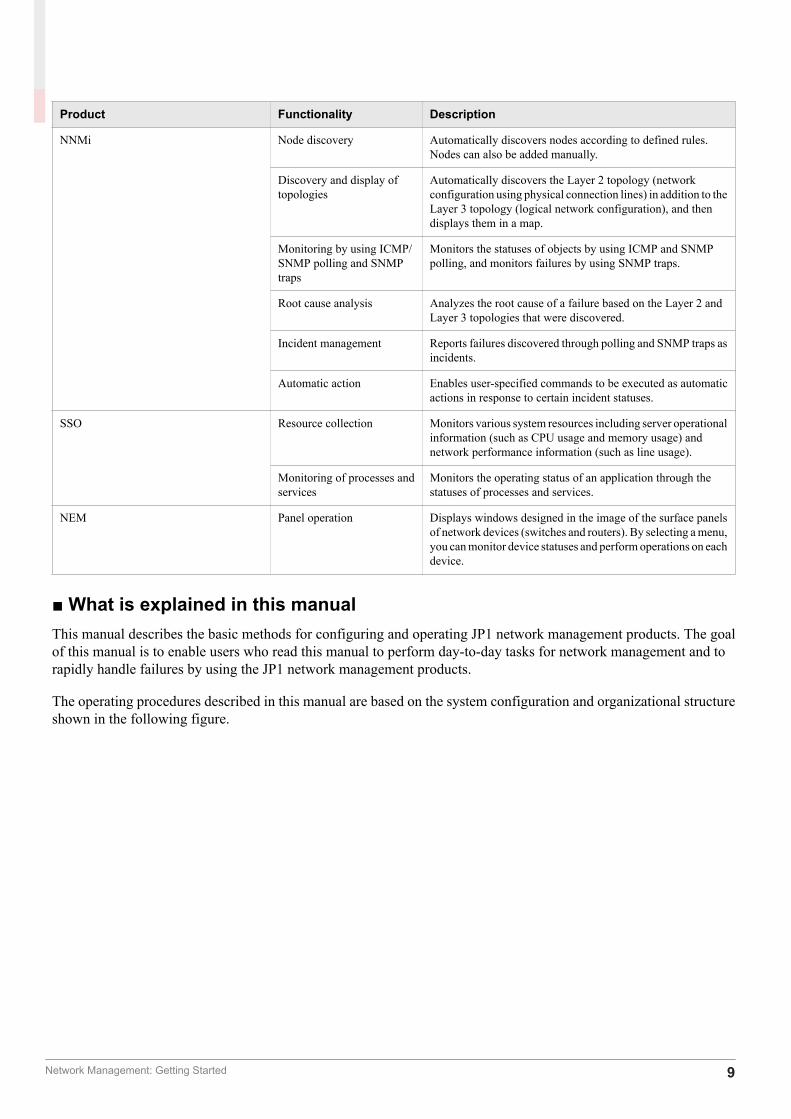
The following table describes the main functionalities of the manager programs:
Network Management: Getting Started 8
Product Functionality Description
NNMi Node discovery Automatically discovers nodes according to defined rules.Nodes can also be added manually.
Discovery and display oftopologies
Automatically discovers the Layer 2 topology (networkconfiguration using physical connection lines) in addition to theLayer 3 topology (logical network configuration), and thendisplays them in a map.
Monitoring by using ICMP/SNMP polling and SNMPtraps
Monitors the statuses of objects by using ICMP and SNMPpolling, and monitors failures by using SNMP traps.
Root cause analysis Analyzes the root cause of a failure based on the Layer 2 andLayer 3 topologies that were discovered.
Incident management Reports failures discovered through polling and SNMP traps asincidents.
Automatic action Enables user-specified commands to be executed as automaticactions in response to certain incident statuses.
SSO Resource collection Monitors various system resources including server operationalinformation (such as CPU usage and memory usage) andnetwork performance information (such as line usage).
Monitoring of processes andservices
Monitors the operating status of an application through thestatuses of processes and services.
NEM Panel operation Displays windows designed in the image of the surface panelsof network devices (switches and routers). By selecting a menu,you can monitor device statuses and perform operations on eachdevice.
■ What is explained in this manualThis manual describes the basic methods for configuring and operating JP1 network management products. The goalof this manual is to enable users who read this manual to perform day-to-day tasks for network management and torapidly handle failures by using the JP1 network management products.
The operating procedures described in this manual are based on the system configuration and organizational structureshown in the following figure.
Network Management: Getting Started 9

Setup procedure explained in this manual
1. The supervisor operator asks the system build engineer to set up an environment for the JP1 network managementproducts.
2. The system build engineer prepares a server to be used as the Monitoring Manager and then sets up the MonitoringManager environment.
3. The system build engineer asks each site system administrator to set up an environment for the Monitoring Agent.
4. Each site system administrator sets up the Monitoring Agent environment and then notifies the system buildengineer.
5. After receiving notification from the site system administrators, the system build engineer configures the JP1network management products.
6. After configuring the JP1 network management products, the system build engineer notifies the supervisor operator.
7. After receiving notification from the system build engineer, the supervisor operator registers an operator responsibleas a user and starts operation using the JP1 network management products.
■ How to read this manualIn addition to this manual, the JP1 network management product provides multiple manuals and Help resources. Tolearn more about advanced functionality and operations, read these manuals and Help resources as shown belowaccording to your purpose.
Network Management: Getting Started 10
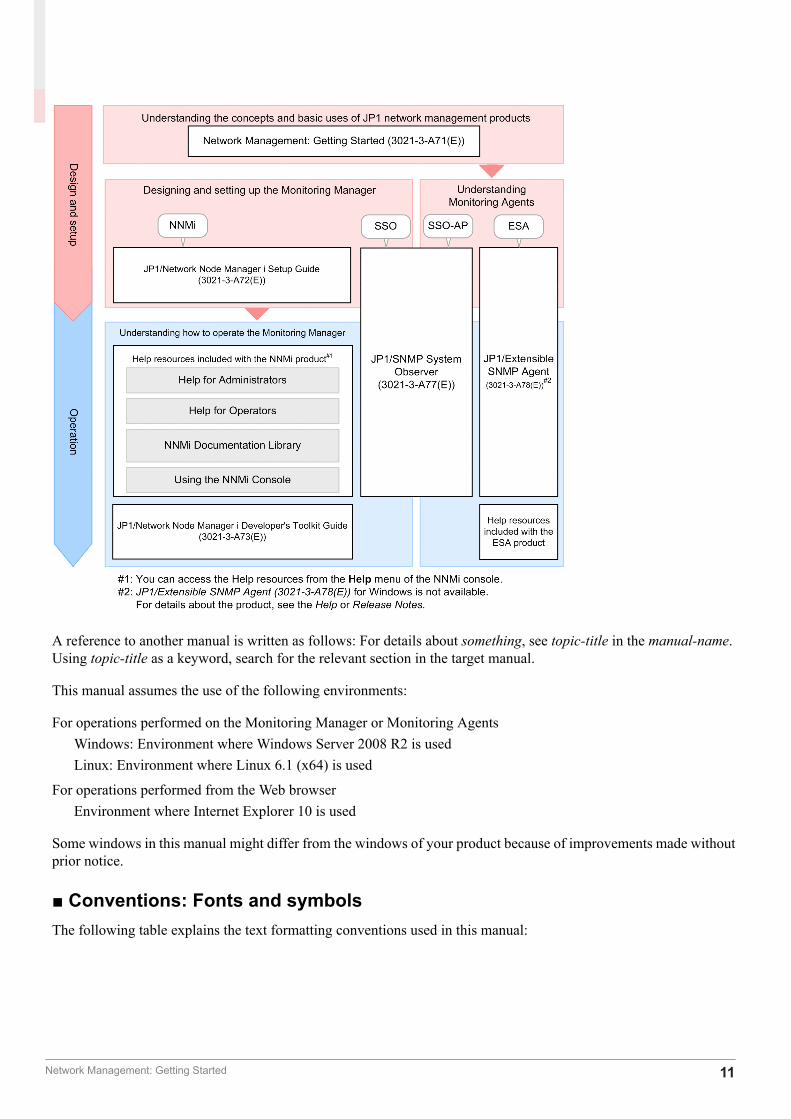
A reference to another manual is written as follows: For details about something, see topic-title in the manual-name.Using topic-title as a keyword, search for the relevant section in the target manual.
This manual assumes the use of the following environments:
For operations performed on the Monitoring Manager or Monitoring AgentsWindows: Environment where Windows Server 2008 R2 is usedLinux: Environment where Linux 6.1 (x64) is used
For operations performed from the Web browserEnvironment where Internet Explorer 10 is used
Some windows in this manual might differ from the windows of your product because of improvements made withoutprior notice.
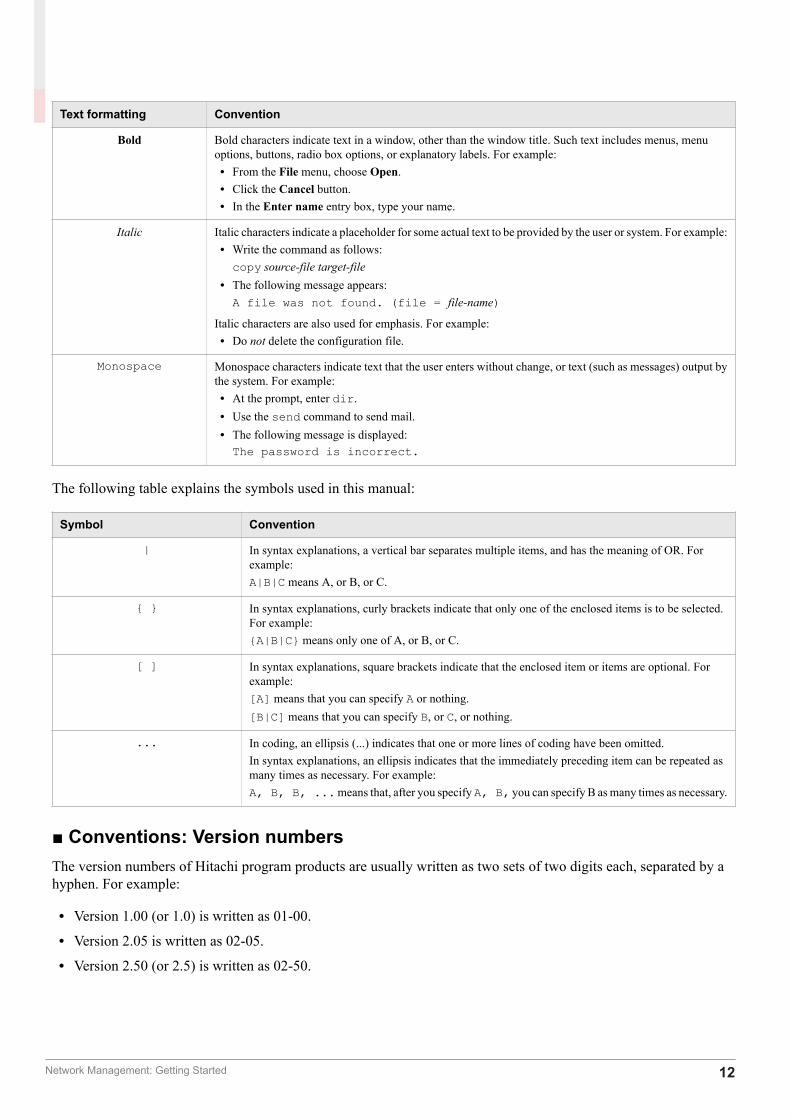
■ Conventions: Fonts and symbolsThe following table explains the text formatting conventions used in this manual:
Network Management: Getting Started 11
Text formatting Convention
Bold Bold characters indicate text in a window, other than the window title. Such text includes menus, menuoptions, buttons, radio box options, or explanatory labels. For example:• From the File menu, choose Open.• Click the Cancel button.• In the Enter name entry box, type your name.
Italic Italic characters indicate a placeholder for some actual text to be provided by the user or system. For example:• Write the command as follows:copy source-file target-file
• The following message appears:A file was not found. (file = file-name)
Italic characters are also used for emphasis. For example:• Do not delete the configuration file.
Monospace Monospace characters indicate text that the user enters without change, or text (such as messages) output bythe system. For example:• At the prompt, enter dir.• Use the send command to send mail.• The following message is displayed:The password is incorrect.
The following table explains the symbols used in this manual:
Symbol Convention
| In syntax explanations, a vertical bar separates multiple items, and has the meaning of OR. Forexample:A|B|C means A, or B, or C.
{ } In syntax explanations, curly brackets indicate that only one of the enclosed items is to be selected.For example:{A|B|C} means only one of A, or B, or C.
[ ] In syntax explanations, square brackets indicate that the enclosed item or items are optional. Forexample:[A] means that you can specify A or nothing.[B|C] means that you can specify B, or C, or nothing.
... In coding, an ellipsis (...) indicates that one or more lines of coding have been omitted.In syntax explanations, an ellipsis indicates that the immediately preceding item can be repeated asmany times as necessary. For example:A, B, B, ... means that, after you specify A, B, you can specify B as many times as necessary.
■ Conventions: Version numbersThe version numbers of Hitachi program products are usually written as two sets of two digits each, separated by ahyphen. For example:
• Version 1.00 (or 1.0) is written as 01-00.
• Version 2.05 is written as 02-05.
• Version 2.50 (or 2.5) is written as 02-50.
Network Management: Getting Started 12

• Version 12.25 is written as 12-25.
The version number might be shown on the spine of a manual as Ver. 2.00, but the same version number would bewritten in the program as 02-00.
Network Management: Getting Started 13
Contents
Notices 2Summary of amendments 5Preface 6
1 Setting Up JP1 Network Management Products 171.1 General procedure for setting up JP1 network management products 181.2 Preparation before installation 191.2.1 Checking the server environment 191.2.2 Checking the prerequisites of the Monitoring Manager (for Windows) 211.2.3 Checking the prerequisites of the Monitoring Manager (for Linux) 221.2.4 Storage location of the commands of each product 231.3 Setting up the Monitoring Manager (for Windows) 251.3.1 Installing NNMi (for Windows) 251.3.2 Installing SSO (for Windows) 251.3.3 Installing NEM (for Windows) 261.3.4 Setting up NNMi (for Windows) 261.3.5 Setting up SSO (for Windows) 271.4 Setting up the Monitoring Manager (for Linux) 301.4.1 Installing NNMi (for Linux) 301.4.2 Installing SSO (for Linux) 311.4.3 Setting up NNMi (for Linux) 311.4.4 Setting up SSO (for Linux) 321.5 Setting up the Monitoring Agent (for Windows) 351.5.1 Installing ESA (for Windows) 351.5.2 Installing SSO - AP (for Windows) 361.5.3 Setting up ESA (for Windows) 361.6 Setting up the Monitoring Agent (for Linux) 381.6.1 Checking the prerequisites of the Monitoring Agent (for Linux) 381.6.2 Installing ESA (for Linux) 391.6.3 Installing SSO - AP (for Linux) 391.6.4 Setting up ESA (for Linux) 401.6.5 Setting up SSO - AP (for Linux) 411.6.6 Restarting the Monitoring Agent (for Linux) 42
2 Configuring JP1 Network Management Products 442.1 General procedure for configuring JP1 network management products 452.2 Configuring NNMi 46
Network Management: Getting Started 14
2.2.1 Accessing NNMi 462.2.2 About the NNMi console 472.2.3 Registering users 472.2.4 Configuring communication protocols 492.2.5 Performing network discovery 512.2.6 Configuring node groups 572.2.7 Configuring monitoring settings 622.2.8 Configuring incidents 652.3 Configuring SSO 732.3.1 Accessing SSO 732.3.2 Resource collection 742.3.3 Monitoring of processes and services 79
3 Normal Operation by Using JP1 Network Management Products 833.1 Network monitoring by using JP1 network management products 843.1.1 Network monitoring types 843.1.2 Polling 853.1.3 Starting network monitoring 863.1.4 Monitoring resources 893.2 Periodic maintenance of JP1 network management products 913.2.1 Checking the NNMi operating status 913.2.2 Exporting or importing the NNMi settings 913.2.3 Backing up or restoring NNMi 923.2.4 Archiving or deleting NNMi incidents 923.2.5 Periodically deleting SSO collection data 93
4 Troubleshooting by Using JP1 Network Management Products 954.1 Analyzing the root cause of a failure 964.2 Troubleshooting mechanism 984.3 Troubleshooting a network failure 994.3.1 Handling a network device node that is going down 994.3.2 Handling an abnormality in the operating status of a process or service 101
Appendixes 103A Advanced Use 104B Version Changes 106B.1 Changes in version 11-10 106C Reference Material for This Manual 107C.1 Related publications 107C.2 Abbreviations for Microsoft product names 107C.3 Conventions: Abbreviations for product names 107C.4 Conventions: Acronyms 108
Network Management: Getting Started 15

C.5 Conventions: KB, MB, GB, and TB 109
Glossary 110
Index 112
Network Management: Getting Started 16
This chapter describes how you (the system build engineer) install JP1 network managementproducts and create an environment that monitors the network.
1 Setting Up JP1 Network Management Products
Network Management: Getting Started 17
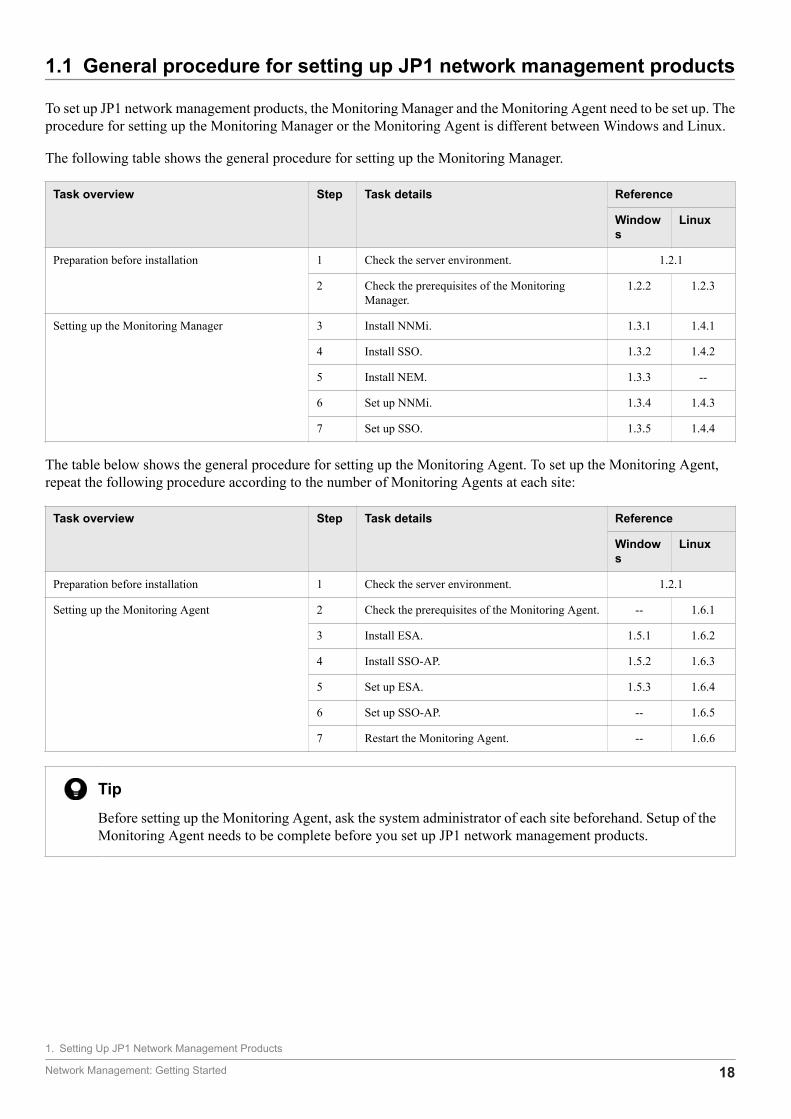
1.1 General procedure for setting up JP1 network management products
To set up JP1 network management products, the Monitoring Manager and the Monitoring Agent need to be set up. Theprocedure for setting up the Monitoring Manager or the Monitoring Agent is different between Windows and Linux.
The following table shows the general procedure for setting up the Monitoring Manager.
Task overview Step Task details Reference
Windows
Linux
Preparation before installation 1 Check the server environment. 1.2.1
2 Check the prerequisites of the MonitoringManager.
1.2.2 1.2.3
Setting up the Monitoring Manager 3 Install NNMi. 1.3.1 1.4.1
4 Install SSO. 1.3.2 1.4.2
5 Install NEM. 1.3.3 --
6 Set up NNMi. 1.3.4 1.4.3
7 Set up SSO. 1.3.5 1.4.4
The table below shows the general procedure for setting up the Monitoring Agent. To set up the Monitoring Agent,repeat the following procedure according to the number of Monitoring Agents at each site:
Task overview Step Task details Reference
Windows
Linux
Preparation before installation 1 Check the server environment. 1.2.1
Setting up the Monitoring Agent 2 Check the prerequisites of the Monitoring Agent. -- 1.6.1
3 Install ESA. 1.5.1 1.6.2
4 Install SSO-AP. 1.5.2 1.6.3
5 Set up ESA. 1.5.3 1.6.4
6 Set up SSO-AP. -- 1.6.5
7 Restart the Monitoring Agent. -- 1.6.6
TipBefore setting up the Monitoring Agent, ask the system administrator of each site beforehand. Setup of theMonitoring Agent needs to be complete before you set up JP1 network management products.
1. Setting Up JP1 Network Management Products
Network Management: Getting Started 18
1.2 Preparation before installation
1.2.1 Checking the server environmentBefore installing JP1 network management products, check whether the server environment to be used for operation isappropriate.
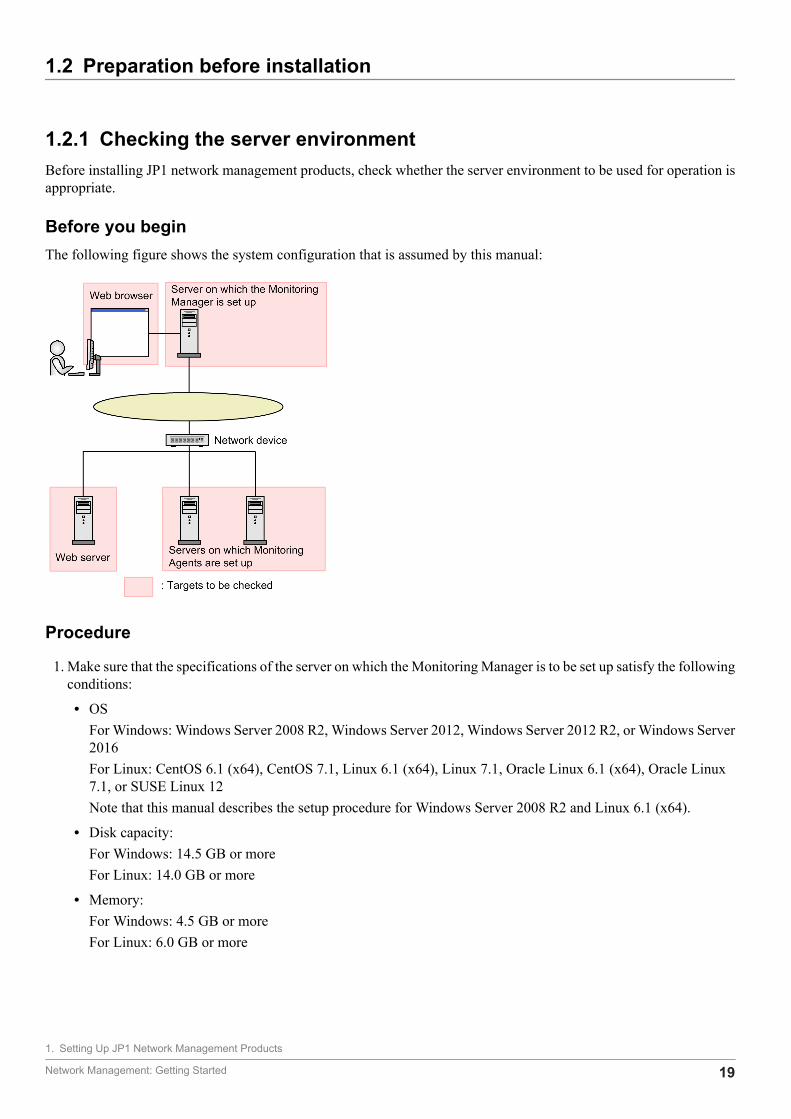
Before you beginThe following figure shows the system configuration that is assumed by this manual:
Procedure
1. Make sure that the specifications of the server on which the Monitoring Manager is to be set up satisfy the followingconditions:
• OSFor Windows: Windows Server 2008 R2, Windows Server 2012, Windows Server 2012 R2, or Windows Server2016For Linux: CentOS 6.1 (x64), CentOS 7.1, Linux 6.1 (x64), Linux 7.1, Oracle Linux 6.1 (x64), Oracle Linux7.1, or SUSE Linux 12Note that this manual describes the setup procedure for Windows Server 2008 R2 and Linux 6.1 (x64).
• Disk capacity:For Windows: 14.5 GB or moreFor Linux: 14.0 GB or more
• Memory:For Windows: 4.5 GB or moreFor Linux: 6.0 GB or more
1. Setting Up JP1 Network Management Products
Network Management: Getting Started 19
2. Make sure that the specifications of the server on which the Monitoring Agent is to be set up satisfy the followingconditions:
• OSFor Windows: Windows Server 2008 R2, Windows Server 2012, Windows Server 2012 R2, or Windows Server2016For Linux: CentOS 6.1 (x64), CentOS 7.1, Linux 6.1 (x64), Linux 7.1, Oracle Linux 6.1 (x64), Oracle Linux7.1, or SUSE Linux 12For UNIX: HP-UX (IPF), AIX V6.1, AIX V7.1, Solaris 10, or Solaris 11Note that this manual describes the setup procedure for Windows Server 2008 R2 and Linux 6.1 (x64).
• Disk capacity:For Windows: 65.0 MB or moreFor Linux: 150.0 MB or more
• Memory:For Windows: 15.0 MB or moreFor Linux: 70.0 MB or more
3. Check the language settings of the server on which the Monitoring Manager is to be set up.For Windows, set the locale as follows:
• For a Japanese environment: Japanese
• For an English environment: English
• For a Chinese environment: Chinese
For Linux, set the locale as follows:
• For a Japanese environment: ja_JP.UTF-8
• For an English environment: C
• For a Chinese environment: zh_CN.utf8
4. Check the port number of the Web server.The port number of the Web server is used during the installation of NNMi. The default is 80.
5. Make sure that the Web browser to be used satisfies the following conditions:
• Web browser:If the OS is Windows: Internet Explorer 10 or 11, or Firefox ESR 45If the OS is Linux: Firefox ESR 45
• Adobe Flash Player:Prepare the Java Plug-in that is required by NNMi. For details, see the Release Notes.
• Java Plug-in:Prepare the Java Plug-in that is required by SSO. For details, see the Release Notes.
Next stepsAfter making sure that there is no problem in the server environment, proceed to the next task of checking theprerequisites.
Related topics• Topic Preinstallation Checklists in the JP1/Network Node Manager i Setup Guide.
1. Setting Up JP1 Network Management Products
Network Management: Getting Started 20
• 1.2.2 Checking the prerequisites of the Monitoring Manager (for Windows)• 1.2.3 Checking the prerequisites of the Monitoring Manager (for Linux)
1.2.2 Checking the prerequisites of the Monitoring Manager (for Windows)If the Monitoring Manager is to run on Windows, check the settings below, and then start installing the JP1 networkmanagement products.
Before you beginFor details about the prerequisites, see the topic Preinstallation Checklists in the JP1/Network Node Manager i SetupGuide.
Procedure
1. Check the host name of the Monitoring Manager.The host name is used when setting the trap destination and during login.
2. Make sure that the port number to be used by the Monitoring Manager is not used.If you execute netstat -an at the command prompt, you can check the currently used port numbers.For details about the port numbers, see the topic List of Ports Used by NNMi in the JP1/Network Node Manager iSetup Guide. For details about SSO, see Port Number Settings.
3. Assign a static IP address to the Monitoring Manager.You need to assign a static IP address, not a dynamic IP address by DHCP.
4. Check the installation folder of NNMi.The installation folder of NNMi is used during its installation. The default folders are as follows:
• For the program: C:\Program Files (x86)\Hitachi\Cm2NNMi\• For data: C:\ProgramData\Hitachi\Cm2NNMi\
5. Check the installation folder of SSO.The installation folder of SSO is used during its installation. The default folder is as follows:
• C:\Program Files\HITACHI\JP1SSO\
6. Disable the antivirus software.Disable the antivirus software only during the installation of the JP1 network management products.
7. Set the SNMP Trap service, which is a Windows SNMP-related service, to Disabled.
8. If you monitor the Monitoring Manager by using SNMP, make sure the SNMP service is available.
9. Use Windows Firewall to make sure that access to the port number used by the Monitoring Manager is enabled.For details about access to the port number, see the topic Firewall pass-through direction in the JP1/Network NodeManager i Setup Guide.
10. Make sure that the values set for the environment variables TEMP and TMP are the same.If the values of the environment variables TEMP and TMP differ, the installation of NNMi might fail. If the valuesdiffer, set the same value. Note that 500.0 MB of the %TEMP% folder is used during the installation.
1. Setting Up JP1 Network Management Products
Network Management: Getting Started 21
11. Click Administrative Tools, Remote Desktop Services, and then Remote Desktop Session HostConfiguration. Specify the Remote Desktop settings as follows:
• Do not delete temporary folders on exit
• Do not use temporary folders per session
Next stepsAfter you make sure that there is no problem in the prerequisite environment, proceed to the next task of setting up theMonitoring Manager.
Related topics• 1.3 Setting up the Monitoring Manager (for Windows)
1.2.3 Checking the prerequisites of the Monitoring Manager (for Linux)If the Monitoring Manager is to run on Linux, check the settings below, and then start installing the JP1 networkmanagement products.
Before you beginFor details about the prerequisites, see the topic Preinstallation Checklists in the JP1/Network Node Manager i SetupGuide.
Procedure
1. Check the host name of the Monitoring Manager.The host name is used for setting the trap destination and during login.
2. Make sure that the port number to be used by the Monitoring Manager is not used.If you execute netstat -an at the command prompt, you can check the currently used port numbers.For details about the port numbers, see the topic List of Ports Used by NNMi in the JP1/Network Node Manager iSetup Guide.
3. Assign a static IP address to the Monitoring Manager.You need to assign a static IP address, not a dynamic IP address by DHCP.
4. Disable the antivirus software.Disable the antivirus software only during the installation of the JP1 network management products.
5. Make sure that the following packages and library files are installed:
• kernel-2.6.32-220.4.2.el6.x86_64.rpm or later
• kernel-firmware-2.6.32-220.4.2.el6.noarch.rpm or later
• /lib64/libaio.so.1
• /usr/lib64/libXtst.so.6
• /usr/lib64/libXi.so.6
• glibc (i686)
1. Setting Up JP1 Network Management Products
Network Management: Getting Started 22
• libstdc++ (i686)
• libgcc (i686)
• ncompress (x86_64)
• tar (x86_64)
• gdb (x86_64)
• openmotif (x86_64)
• glibc (x86_64)
• glibc-common (x86_64)
• glibc-devel (i686)
• glibc-devel (x86_64)
• glibc-headers (x86_64)
• glibc-utils (x86_64)
• nscd (x86_64)
• libXtst (i686)
In addition, install the library files that depend on each of the files above. The required packages and library filesdiffer depending on the type or version of the OS. For details, see the Release Notes.
6. Open the /etc/sysctl.conf file, and set the kernel parameters.Add the following entries to the /etc/sysctl.conf file:
# NNM settings for embedded databasekernel.shmmax = 68719476736# NNM settings for UDP receive and send buffer sizesnet.core.rmem_max = 8388608net.core.wmem_max = 2097152
In the entries above, the shared memory (kernel.shmmax) is set to 64.0 GB, the UDP receive buffer(net.core.rmem_max) is set to 8.0 MB, and the UDP send buffer (net.core.wmem_max) is set to 2.0 MB. The sharedmemory (kernel.shmmax) needs to be set if an embedded database is used.
Next stepsAfter you make sure that there is no problem in the prerequisite environment, proceed to the next task of setting up theMonitoring Manager.
Related topics• 1.4 Setting up the Monitoring Manager (for Linux)
1.2.4 Storage location of the commands of each productThe following shows the storage location of the commands of each product:
Storage location of the NNMi commands
• For Windowsinstallation-folder-of-NNMi\bin\
1. Setting Up JP1 Network Management Products
Network Management: Getting Started 23

• For Linux/opt/OV/bin/
Storage location of the SSO commands
• For Windowsinstallation-folder-of-SSO\bin\
• For Linux/opt/CM2/SSO/bin/
Storage location of the SSO - AP commands
• For Windowsinstallation-folder-of-SSO-AP\bin\
• For Linux/opt/CM2/APM/bin/
Storage location of the ESA commands
• For Windowsinstallation-folder-of-ESA\bin\
• For Linux/opt/CM2/ESA/bin
1. Setting Up JP1 Network Management Products
Network Management: Getting Started 24
1.3 Setting up the Monitoring Manager (for Windows)
You need to install and set up NNMi, SSO, and NEM to set up the Monitoring Manager in a Windows environment.
1.3.1 Installing NNMi (for Windows)If the Monitoring Manager is to run on Windows, use the Hitachi Integrated installer and follow the wizard to installNNMi.
Procedure
1. As a user with Administrators permissions, log in to the server on which the Monitoring Manager is to be set up,and then insert the distribution media.
2. Select JP1/Network Node Manager i.A window to confirm the NNMi setting values appears.
3. Specify the port number of the Web server, and then press the Enter key.If you press the Enter key without entering a value, the default value is specified. The default value is 80.
4. Specify the installation folder of NNMi.If you press the Enter key without entering a value, the default value is specified. The default value is as follows:
• For the program: C:\Program Files (x86)\Hitachi\Cm2NNMi\• For data: C:\ProgramData\Hitachi\Cm2NNMi\
The NNMi settings file, database, and log file are stored in the installation folder for data.
5. Enter yes, and then press the Enter key.The installation of NNMi starts. When the installation is complete, the command prompt automatically closes.
Next stepsNext, install SSO.
Related topics• 1.3.2 Installing SSO (for Windows)
1.3.2 Installing SSO (for Windows)If the Monitoring Manager is to run on Windows, use the Hitachi Integrated installer and follow the wizard to installSSO.
Procedure
1. As a user with Administrators permissions, log in to the server on which the Monitoring Manager is to be set up,and then insert the distribution media.
1. Setting Up JP1 Network Management Products
Network Management: Getting Started 25
2. Select JP1/SNMP System Observer.
3. Install SSO by following the installer instructions.
Next stepsIf you are using a switch or router that is supported by NEM, install NEM. If you do not need to install NEM, proceedto the task of setting up NNMi.
Related topics• 1.3.3 Installing NEM (for Windows)• 1.3.4 Setting up NNMi (for Windows)
1.3.3 Installing NEM (for Windows)If the Monitoring Manager is to run on Windows and you are using a switch or router that is supported by NEM, installNEM. Use the Hitachi Integrated installer and follow the wizard to install NEM.
Procedure
1. As a user with Administrators permissions, log in to the server on which the Monitoring Manager is to be set up,and then insert the distribution media.
2. Select JP1/Network Element Manager.
3. Install NEM by following the installer instructions.
Next stepsNext, set up NNMi.
Related topics• 1.3.4 Setting up NNMi (for Windows)
1.3.4 Setting up NNMi (for Windows)If the Monitoring Manager is to run on Windows, stop the NNMi service, and then set up the system account. To registerother members, first log in to the NNMi console, and then register users.
Before you beginIf the command prompt was opened before the installation and remains open, close it, and then open it again.
Procedure
1. In the command prompt, execute ovstop -c to stop the NNMi service.The NNMi service stops. Immediately after the installation, the NNMi service is stopped.
1. Setting Up JP1 Network Management Products
Network Management: Getting Started 26
2. Execute nnmchangesyspw.ovpl to set the password.Enter y, and then specify the password by following the message.
3. Execute ovstart -c to start NNMi.
4. Execute ovstatus -c to check the NNMi status.If all statuses are in the running status, there is no problem.
Next stepsNext, set up SSO.
Related topics• 1.2.4 Storage location of the commands of each product• 2.2.3 Registering users• 1.3.5 Setting up SSO (for Windows)
1.3.5 Setting up SSO (for Windows)If the Monitoring Manager is to run on Windows, set the community name and the SSO definition information to setup SSO.
(1) Adding information about the connection from SSO to NNMiExecute the ssonnmsetup command of SSO to set the connection information for linking with NNMi.
Procedure
1. Execute the following command:ssonnmsetup -add -user user-name -password password -port port-number -sslSpecify the user name and password of the system account. For port-number, specify the port number of the Webserver. Specify the -ssl option only if HTTPS is used for communication.
Related topics• 1.2.4 Storage location of the commands of each product• 1.3.4 Setting up NNMi (for Windows)• 1.2.1 Checking the server environment
(2) Setting the SSO definition information for NNMiExecute a command to set the SSO definition information for NNMi.
1. Setting Up JP1 Network Management Products
Network Management: Getting Started 27
Procedure
1. Execute the nnmconfigimport.ovpl command of NNMi to set the incident definition.nnmconfigimport.ovpl -u user-name -p password -f installation-folder-of-SSO\incident\ssoincident.defSpecify the user name and password of the system account.If an APM instance that does not use TCP communication for event notification is used to monitor processes orservices, the following incident definition must also be set:nnmconfigimport.ovpl -u user-name -p password -f installation-folder-of-SSO\incident\apmtrap.def
2. Execute the nnmconfigimport.ovpl command of NNMi to set the URL action definition.nnmconfigimport.ovpl -u user-name -p password -f installation-folder-of-SSO\urlaction\ssourlaction.defSpecify the user name and password of the system account.
3. Execute the ssoauth command of SSO to register a user in SSO.ssoauth -add -user user-name -password passwordSet the user name and password that are used for logging in from the SSO console.
4. Execute the ssostart command of SSO to start SSO.
5. Execute the ssostatus command of SSO to check the SSO status.If all statuses are in the running status, there is no problem.
Related topics• 1.2.4 Storage location of the commands of each product
(3) Setting the community nameThe community name is a password for accessing the MIB object by using the SNMP protocol. To collect resources,you need to match the get community names of the Monitoring Agent and the Monitoring Manager. To monitorprocesses and services, you need to match the set community names of the Monitoring Agent and the MonitoringManager.
Procedure
1. Open the SNMP definition file (installation-folder-of-SSO\conf\ssosnmp.conf).
2. Edit the SNMP definition file.
3. Execute the ssoapcom command as follows to load the definition file again:ssoapcom -r
4. Execute the ssocollectd command as follows to load the definition file again:ssocollcetd -r
1. Setting Up JP1 Network Management Products
Network Management: Getting Started 28

Next stepsYou have now successfully completed the setup of the Monitoring Manager. Make sure that the setup of the MonitoringAgent at each site is complete. If the setup of the Monitoring Agent at each site is complete, proceed to the next task ofsetting up the JP1 network management products.
Related topics• 1.2.4 Storage location of the commands of each product• 1.3.4 Setting up NNMi (for Windows)• 1.5 Setting up the Monitoring Agent (for Windows)• 2. Configuring JP1 Network Management Products
1. Setting Up JP1 Network Management Products
Network Management: Getting Started 29
1.4 Setting up the Monitoring Manager (for Linux)
Install and set up NNMi and SSO to set up the Monitoring Manager in a Linux environment.
1.4.1 Installing NNMi (for Linux)If the Monitoring Manager is to run on Linux, use the Hitachi Integrated installer and follow the wizard to install NNMi.
Procedure
1. As a user with root permissions, log in to the server on which the Monitoring Manager is to be set up.
2. For the environment variable LC_ALL, set the following locale:
• For a Japanese environment# LC_ALL=ja_JP.UTF-8# export LC_ALL
• For an English environment# LC_ALL=C# export LC_ALL
• For a Chinese environment# LC_ALL=zh_CN.utf8# export LC_ALL
3. Insert the distribution media of NNMi, and then execute the following command:/mount-directory-name-of-the-provided-media/X64LIN/setup /mount-directory-name-of-the-provided-media
4. In the initial window of Hitachi PP Installer, enter I.
5. Select JP1/Network Node Manager i, and then enter I.A message confirming that you want to continue the installation appears.
6. Enter Y.
7. Enter information by following the installer instructions.If you press the Enter key without entering a value, the default value is specified.NNMi is installed in the following folders:
• For the program: /opt/OV/• For data: /var/opt/OV/
Next stepsNext, install SSO.
Related topics• 1.4.2 Installing SSO (for Linux)
1. Setting Up JP1 Network Management Products
Network Management: Getting Started 30
1.4.2 Installing SSO (for Linux)If the Monitoring Manager is to run on Linux, use the Hitachi Integrated installer and follow the wizard to install SSO.
Procedure
1. As a user with root permissions, log in to the server on which the Monitoring Manager is to be set up, and then insertthe distribution media.
2. Execute the following command:/mount-directory-name-of-the-provided-media/X64LIN/setup /mount-directory-name-of-the-provided-media
3. In the initial window of Hitachi PP Installer, enter I.
4. Select JP1/SNMP System Observer, and then enter I.A message confirming that you want to continue the installation appears.
5. Enter Y.SSO is installed.
Next stepsNext, set up NNMi.
Related topics• 1.4.3 Setting up NNMi (for Linux)
1.4.3 Setting up NNMi (for Linux)If the Monitoring Manager is to run on Linux, set the language environment and the system account to set up NNMi.
(1) Setting the language environmentAfter the installation of NNMi is complete, you need to add the language setting to the /etc/init.d/netmgt file.
Procedure
1. Open the /etc/init.d/netmgt file.
2. Add the following two lines immediately before the line /opt/OV/bin/ovstart:
• For a Japanese environmentLANG=ja_JP.UTF-8export LANG
• For an English environmentLANG=Cexport LANG
• For a Chinese environment
1. Setting Up JP1 Network Management Products
Network Management: Getting Started 31
LANG=zh_CN.utf8export LANG
3. Overwrite the /etc/init.d/netmgt file.Now, the language environment is set.
(2) Setting up the system accountSet up the system account of NNMi. The procedure for setting up the account is the same as that for Windows.
After setting the system account, set up SSO.
Related topics• 1.2.4 Storage location of the commands of each product• 1.3.4 Setting up NNMi (for Windows)• 1.4.4 Setting up SSO (for Linux)
1.4.4 Setting up SSO (for Linux)If the Monitoring Manager is to run on Linux, set the language environment and the definition information to set upSSO.
(1) Setting the language environmentAfter the installation of SSO is complete, you need to add the language setting to the /etc/rc.d/init.d/sso file.
Procedure
1. Open the /etc/rc.d/init.d/sso file.
2. Add the following two lines immediately after the line ./etc/rc.d/init.d/functions.
• For a Japanese environmentLANG=ja_JP.UTF-8export LANG
• For an English environmentLANG=Cexport LANG
• For a Chinese environmentLANG=zh_CN.utf8export LANG
3. Overwrite the /etc/rc.d/init.d/sso file.Now, the language environment is set.
1. Setting Up JP1 Network Management Products
Network Management: Getting Started 32
(2) Adding information about the connection from SSO to NNMiSet the connection information for linking with NNMi. The procedure for setting the information is the same as that forWindows.
Related topics• (1) Adding information about the connection from SSO to NNMi
(3) Setting the SSO definition information for NNMiExecute a command to set the SSO definition information for NNMi.
Procedure
1. Execute the nnmconfigimport.ovpl command of NNMi to set the incident definition.nnmconfigimport.ovpl -u user-name -p password -f /etc/opt/CM2/SSO/incident/ssoincident.defSpecify the user name and password of the system account.If an APM instance that does not use TCP communication for event notification is used to monitor processes orservices, the following incident definition must also be set:nnmconfigimport.ovpl -u user-name -p password -f installation-folder-of-SSO \incident\apmtrap.def
2. Execute the nnmconfigimport.ovpl command of NNMi to set the URL action definition.nnmconfigimport.ovpl -u user-name -p password -f /etc/opt/CM2/SSO/urlaction/ssourlaction.defSpecify the user name and password of the system account.
3. Execute the ssoauth command of SSO to register a user in SSO.ssoauth -add -user user-name -password passwordSet the user name and password that are used for logging in from the SSO console.
4. Execute the ssostart command of SSO to start SSO.
5. Execute the ssostatus command of SSO to check the SSO status.If all statuses are in the running status, there is no problem.
Related topics• 1.2.4 Storage location of the commands of each product
(4) Setting the community nameThe community name is a password for accessing the MIB object by using the SNMP protocol. To collect resources,you need to match the get community names of the Monitoring Agent and the Monitoring Manager. To monitorprocesses and services, you need to match the set community names of the Monitoring Agent and the MonitoringManager.
1. Setting Up JP1 Network Management Products
Network Management: Getting Started 33
Procedure
1. Open the SNMP definition file (/etc/opt/CM2/SSO/conf/ssosnmp.conf).
2. Edit the SNMP definition file.
3. Execute the ssoapcom command as follows to load the definition file again:ssoapcom -r
4. Execute the ssocollectd command as follows to load the definition file again:ssocollcetd -r
Next stepsAfter setting the community name, make sure that the setup of the Monitoring Agent at each site is complete. If thesetup of the Monitoring Agent at each site is complete, proceed to the task of setting up the JP1 network managementproducts.
Related topics• 1.2.4 Storage location of the commands of each product• (2) Setting the SSO definition information for NNMi• 1.6 Setting up the Monitoring Agent (for Linux)• 2. Configuring JP1 Network Management Products
1. Setting Up JP1 Network Management Products
Network Management: Getting Started 34
1.5 Setting up the Monitoring Agent (for Windows)
For a Monitoring Agent that is to run on Windows, install and set up ESA and SSO - AP to set up the Monitoring Agent.
TipWe recommend that you (the system administrator at each site) install the Monitoring Agent at a time thatwill not affect your business's work.
1.5.1 Installing ESA (for Windows)If the Monitoring Agent is to run on Windows, use the Hitachi Integrated installer and follow the wizard to install ESA.
Procedure
1. Make sure that the Windows SNMP service is installed.If the service is not installed, install it. For details about how to install the Windows SNMP service, see the Windowsdocumentation.
2. For the hosts file (system-root-folder\system32\drivers\etc\hosts) of the computer on which you willinstall an agent, set the following host names:
• Host name of the Monitoring Manager
• Host name of the Monitoring Agent
3. As a user with Administrators permissions, log in to the computer on which you will install the agent, and then insertthe distribution media.
4. Select JP1/Extensible SNMP Agent.
5. Install ESA by following the installer instructions.
6. Start the Windows SNMP service.
7. Execute the snmpcheck command of ESA to check the ESA status.If all statuses are running (except for hismsmib), there is no problem.
8. Stop the Windows SNMP service.
Next stepsNext, install SSO - AP.
Related topics• 1.2.4 Storage location of the commands of each product• 1.5.2 Installing SSO - AP (for Windows)
1. Setting Up JP1 Network Management Products
Network Management: Getting Started 35
1.5.2 Installing SSO - AP (for Windows)If the Monitoring Agent is to run on Windows, use the Hitachi Integrated installer and follow the wizard to install SSO- AP.
Procedure
1. As a user with Administrators permissions, log in to the computer on which you will install the agent, and then insertthe distribution media.
2. Select JP1/SNMP System Observer - Agent for Process.
3. Install SSO - AP by following the installer instructions.
4. Start the Windows SNMP System Observer - Agent for Process service.
5. Execute the apmcheck command of SSO - AP to check the SSO - AP status.If all statuses are in the running status, there is no problem.
Next stepsNext, set up ESA.
Related topics• 1.2.4 Storage location of the commands of each product• 1.5.3 Setting up ESA (for Windows)
1.5.3 Setting up ESA (for Windows)If the Monitoring Agent is to run on Windows, set the community name and the trap destination for the Windows SNMPservice.
(1) Setting the community name for the Windows SNMP serviceThe community name is a password for accessing the MIB object by using the SNMP protocol. To collect resources orto monitor processes and services, you need to match the community names of the Monitoring Agent and the MonitoringManager. To set the community name, from the Windows Services window, display the SNMP Service properties, andthen set the name. For details, see the Windows documentation.
(2) Setting the trap destination for the Windows SNMP serviceThe trap destination determines where SNMP traps should be sent, and is used to check the manager that receivesMonitoring Agent traps. If you want to send traps to the Monitoring Manager, you need to use the Monitoring Agentto set the trap destination.
Procedure
1. From the Windows Services window, display the SNMP Service properties, and then set the trap destination.For details, see the Windows documentation.
1. Setting Up JP1 Network Management Products
Network Management: Getting Started 36

Next stepsNext, specify settings for monitoring the network by using the JP1 network management products.
Related topics• 2. Configuring JP1 Network Management Products
1. Setting Up JP1 Network Management Products
Network Management: Getting Started 37
1.6 Setting up the Monitoring Agent (for Linux)
For a Monitoring Agent that is to run on Linux, install and set up ESA and SSO - AP to set up the Monitoring Agent.
TipWe recommend that you (the system administrator at each site) install the Monitoring Agent at a time thatwill not affect your business's work.
1.6.1 Checking the prerequisites of the Monitoring Agent (for Linux)If the Monitoring Agent is to run on Linux, check the settings below, and then start installing the Monitoring Agent.
Procedure
1. Make sure that the following packages or subsequent patch files are applied to the OS:
• glibc-2.12-1.25.el6.i686
• libgcc-4.4.5-6.el6.i686
• libstdc++-4.4.5-6.el6.i686
• nss-softokn-freebl-3.12.7-1.1.el6.i686
• net-snmp-5.5-31.el6
• net-snmp-libs-5.5-31.el6
• net-snmp-utils-5.5-31.el6
The required packages differ depending on the type or version of the OS. For details about the packages to be applied,see the Release Notes.
2. Make sure that the following commands used to obtain the MIB values are installed:
• /usr/bin/vmstat
• /bin/ps
• /usr/bin/uptime
• /usr/bin/free
• /usr/bin/mpstat
3. Make sure that the native agent is installed.If the native agent is not installed, install it. For details about how to install the native agent, see the topic Notesabout installation in the manual JP1/Extensible SNMP Agent.
Next stepsCheck the prerequisites of the Monitoring Agent, and then install ESA.
Related topics• 1.2.4 Storage location of the commands of each product
1. Setting Up JP1 Network Management Products
Network Management: Getting Started 38
• 1.6.2 Installing ESA (for Linux)
1.6.2 Installing ESA (for Linux)If the Monitoring Agent is to run on Linux, use the Hitachi Integrated installer and follow the wizard to install ESA.
Procedure
1. For the /etc/hosts file, set the IP address that corresponds to the host name of the Monitoring Agent.(Example) 11.22.33.44 esahost
2. As a user with root permissions, log in to the computer on which you will install the agent, and then insert thedistribution media.
3. Execute the following command:/mount-directory-name-of-the-provided-media/linux/setup /mount-directory-name-of-the-provided-media
4. In the initial window of Hitachi PP Installer, enter I.
5. Select JP1/Extensible SNMP Agent, and then enter I.A message confirming that you want to continue the installation appears.
6. Enter Y.
7. Enter information by following the installer instructions.If you press the Enter key without entering a value, the default value is specified.
Next stepsNow, you have successfully installed ESA. Next, install SSO - AP.
Related topics• 1.6.3 Installing SSO - AP (for Linux)
1.6.3 Installing SSO - AP (for Linux)If the Monitoring Agent is to run on Linux, use the Hitachi Integrated installer and follow the wizard to install SSO -AP.
Procedure
1. As a user with root permissions, log in to the computer on which you will install the agent, and then insert thedistribution media.
2. Execute the following command:/mount-directory-name-of-the-provided-media/linux/setup /mount-directory-name-of-the-provided-media
3. In the initial window of Hitachi PP Installer, enter I.
1. Setting Up JP1 Network Management Products
Network Management: Getting Started 39
4. Select JP1/SSO - Agent for Process, and then enter I.A message confirming that you want to continue the installation appears.
5. Enter Y.
6. Install SSO - AP by following the installer instructions.
Next stepsNow, you have successfully installed SSO - AP. Next, set up ESA.
Related topics• 1.6.4 Setting up ESA (for Linux)
1.6.4 Setting up ESA (for Linux)If the Monitoring Agent is to run on Linux, set the community name and the trap destination for the configurationdefinition file (/etc/SnmpAgent.d/snmpd.conf). The configuration definition file is stored on the computer onwhich you installed the agent.
(1) Setting the community nameThe community name is a password for accessing the MIB object by using the SNMP protocol. To collect resources,you need to match the get community names of the Monitoring Agent and the Monitoring Manager. To monitorprocesses and services, you need to match the set community names of the Monitoring Agent and the MonitoringManager.
Procedure
1. Open the configuration definition file (/etc/SnmpAgent.d/snmpd.conf).
2. Search for the following line in the configuration definition file:get-community-name: publicFor the get community name, public is set by default.
3. Change the get community name.(Example) get-community-name: private
4. Search for the following line in the configuration definition file:#set-community-name: # enter community name
5. Change the setting as follows:set-community-name:
6. On the right side of the label set-community-name:, set the set community name.(Example) set-community-name: private
7. Save the configuration definition file (/etc/SnmpAgent.d/snmpd.conf), and then close it.
1. Setting Up JP1 Network Management Products
Network Management: Getting Started 40
(2) Setting the trap destinationThe trap destination determines where SNMP traps should be sent, and is used to check the manager that receivesMonitoring Agent traps. If you want to send traps to the Monitoring Manager, you need to use the Monitoring Agentto set the trap destination.
Procedure
1. Open the configuration definition file (/etc/SnmpAgent.d/snmpd.conf).
2. Search for the following line in the configuration definition file:#trap-dest: # enter trap destination
3. Change the setting as follows:trap-dest:
4. On the right side of the label trap-dest:, enter the host name or IP address of the manager to which the MonitoringAgent sends traps.(Example) trap-dest: 15.2.113.223
5. Save the configuration definition file (/etc/SnmpAgent.d/snmpd.conf), and then close it.
Next stepsNext, set up SSO - AP.
Related topics• 1.6.5 Setting up SSO - AP (for Linux)
1.6.5 Setting up SSO - AP (for Linux)If the Monitoring Agent is to run on Linux, change the hosts file and port number.
(1) Setting the local IP address in the hosts fileIf 127.0.0.1 is defined as the local IP address in the /etc/hosts file, the SSO - AP process cannot be monitored.You need to define the actual local IP address.
Procedure
1. Open the /etc/hosts file.
2. Search for the following line:127.0.0.1 local-server-name localhost. localdomain localhost
3. Change the line as follows:127.0.0.1 localhost. localdomain localhostIP-address-of-the-local-server local-server-name(Example)
1. Setting Up JP1 Network Management Products
Network Management: Getting Started 41
127.0.0.1 localhost. localdomain localhost172.16.49.18 linux01
4. Save the /etc/hosts file, and then close it.
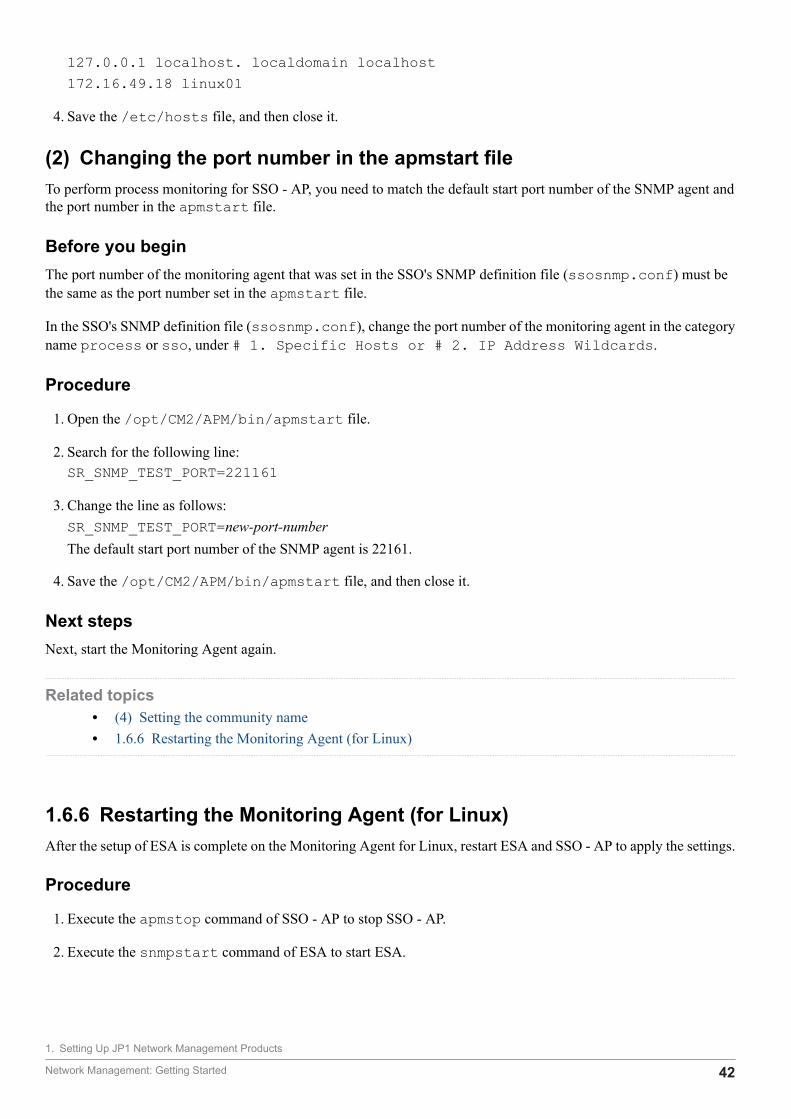
(2) Changing the port number in the apmstart fileTo perform process monitoring for SSO - AP, you need to match the default start port number of the SNMP agent andthe port number in the apmstart file.
Before you beginThe port number of the monitoring agent that was set in the SSO's SNMP definition file (ssosnmp.conf) must bethe same as the port number set in the apmstart file.
In the SSO's SNMP definition file (ssosnmp.conf), change the port number of the monitoring agent in the categoryname process or sso, under # 1. Specific Hosts or # 2. IP Address Wildcards.
Procedure
1. Open the /opt/CM2/APM/bin/apmstart file.
2. Search for the following line:SR_SNMP_TEST_PORT=221161
3. Change the line as follows:SR_SNMP_TEST_PORT=new-port-numberThe default start port number of the SNMP agent is 22161.
4. Save the /opt/CM2/APM/bin/apmstart file, and then close it.
Next stepsNext, start the Monitoring Agent again.
Related topics• (4) Setting the community name• 1.6.6 Restarting the Monitoring Agent (for Linux)
1.6.6 Restarting the Monitoring Agent (for Linux)After the setup of ESA is complete on the Monitoring Agent for Linux, restart ESA and SSO - AP to apply the settings.
Procedure
1. Execute the apmstop command of SSO - AP to stop SSO - AP.
2. Execute the snmpstart command of ESA to start ESA.
1. Setting Up JP1 Network Management Products
Network Management: Getting Started 42
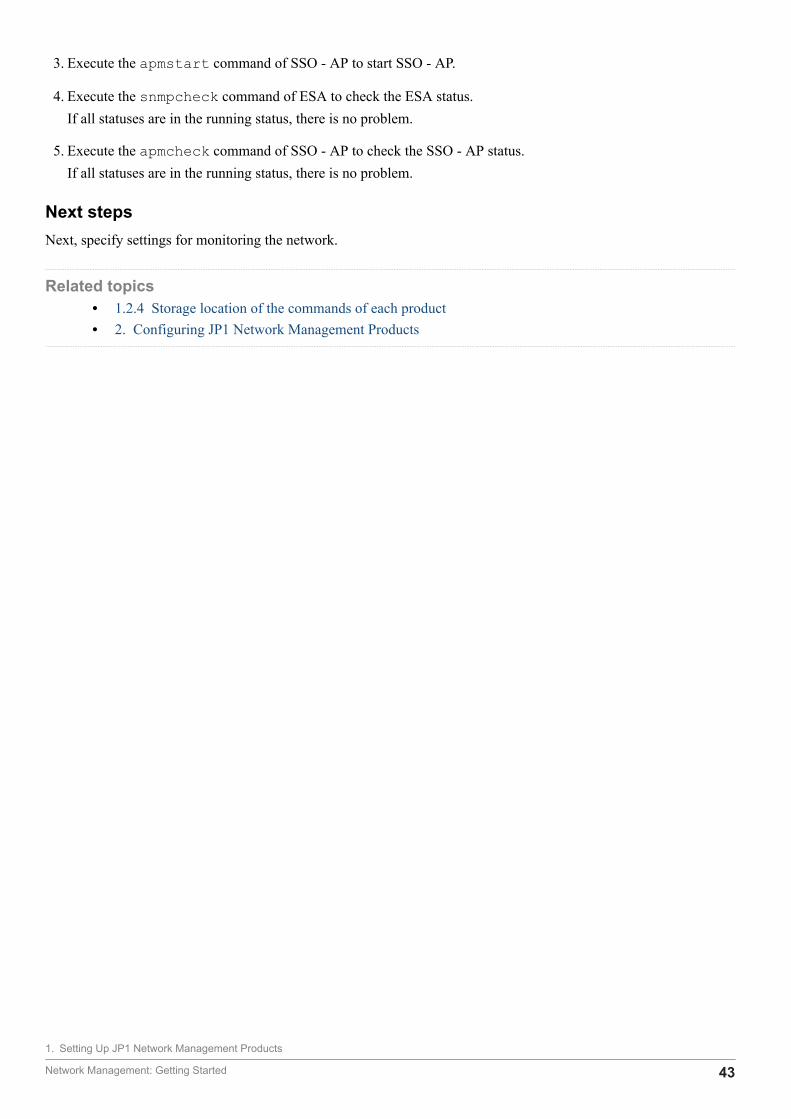
3. Execute the apmstart command of SSO - AP to start SSO - AP.
4. Execute the snmpcheck command of ESA to check the ESA status.If all statuses are in the running status, there is no problem.
5. Execute the apmcheck command of SSO - AP to check the SSO - AP status.If all statuses are in the running status, there is no problem.
Next stepsNext, specify settings for monitoring the network.
Related topics• 1.2.4 Storage location of the commands of each product• 2. Configuring JP1 Network Management Products
1. Setting Up JP1 Network Management Products
Network Management: Getting Started 43
This chapter describes how you (the system build engineer) access NNMi or SSO to start networkmanagement.
2 Configuring JP1 Network Management Products
Network Management: Getting Started 44
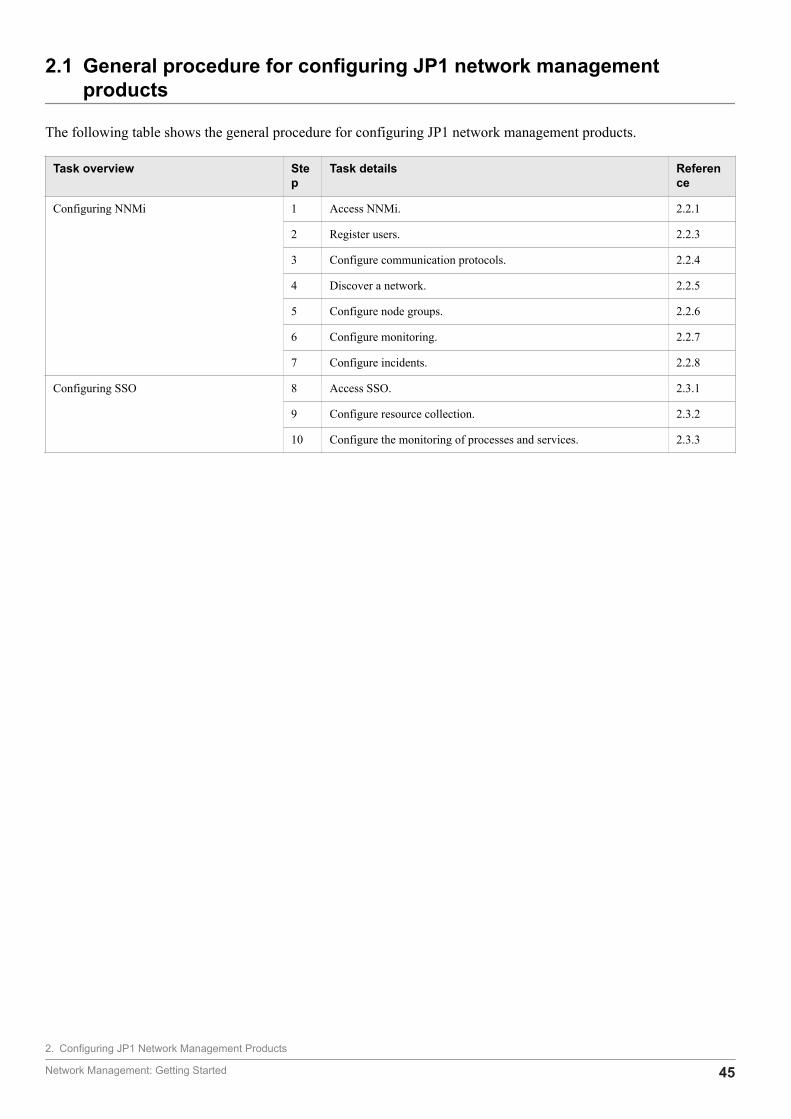
2.1 General procedure for configuring JP1 network managementproducts
The following table shows the general procedure for configuring JP1 network management products.
Task overview Step
Task details Reference
Configuring NNMi 1 Access NNMi. 2.2.1
2 Register users. 2.2.3
3 Configure communication protocols. 2.2.4
4 Discover a network. 2.2.5
5 Configure node groups. 2.2.6
6 Configure monitoring. 2.2.7
7 Configure incidents. 2.2.8
Configuring SSO 8 Access SSO. 2.3.1
9 Configure resource collection. 2.3.2
10 Configure the monitoring of processes and services. 2.3.3
2. Configuring JP1 Network Management Products
Network Management: Getting Started 45

2.2 Configuring NNMi
2.2.1 Accessing NNMiIn the following procedure, from the Web browser, you access NNMi and start setup.
Before you beginConfigure the following Web browser settings:
• Allow pop-up windows to open (disable the pop-up blocker).
• Enable active scripting, and allow cookies to be saved.
• If IE ESC is enabled in Internet Explorer, add about:blank to Trusted sites.
Procedure
1. From the Web browser, access NNMi.URL: http://host-name:port-number/nnm/• host-name: Specify the host name (FQDN) of the server on which you installed NNMi. You can also specify the
IP address.
• port-number: Specify the port number of the Web server specified during installation of NNMi.
The NNMi Sign in window is displayed.
2. Enter the user name and password.Sign in by using the system account.User name: systemPassword: Password for the system account
3. Click Sign in.The NNMi console is displayed.
ImportantThe user name of the system account is fixed to system. The system account is used for initialsettings and maintenance work. We recommend not using this account during normal operations becausethe password for the account can be changed by using a command.
Next stepsYou have now successfully signed in to NNMi. In the next section, you will learn basic operations while configuringNNMi.
Related topics• 1.3.4 Setting up NNMi (for Windows)• 1.4.3 Setting up NNMi (for Linux)• 2.1 General procedure for configuring JP1 network management products
2. Configuring JP1 Network Management Products
Network Management: Getting Started 46
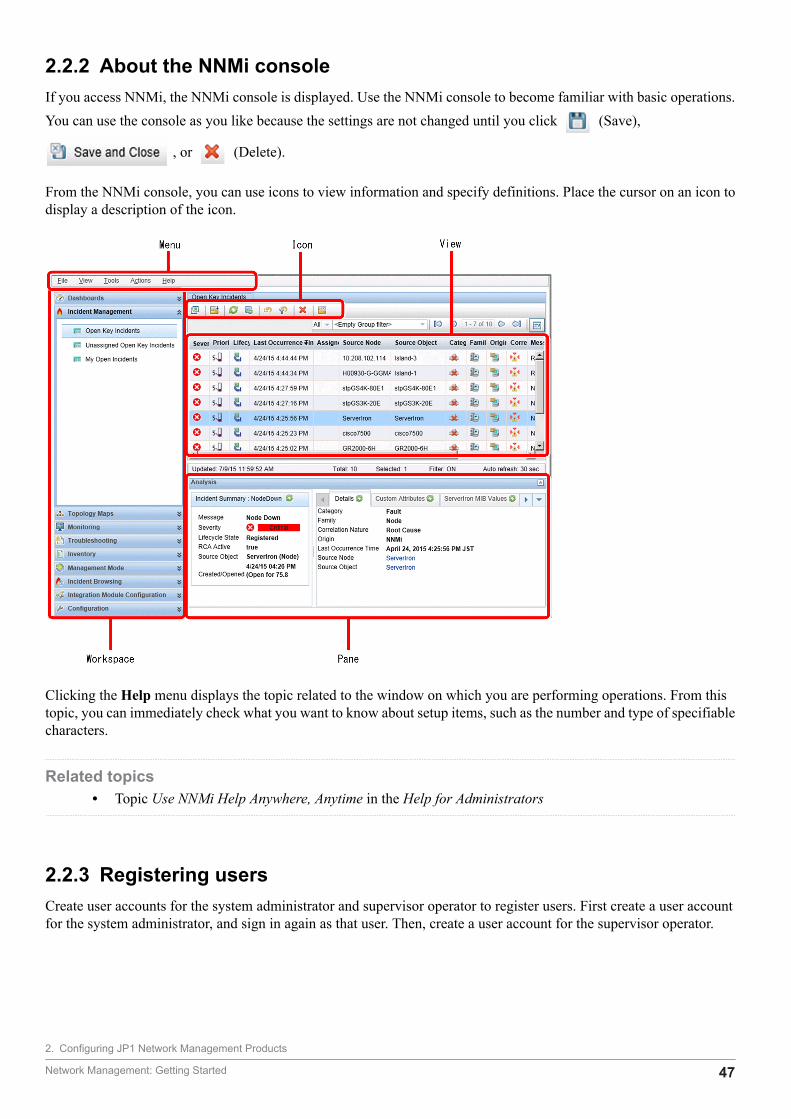
2.2.2 About the NNMi consoleIf you access NNMi, the NNMi console is displayed. Use the NNMi console to become familiar with basic operations.You can use the console as you like because the settings are not changed until you click (Save),
, or (Delete).
From the NNMi console, you can use icons to view information and specify definitions. Place the cursor on an icon todisplay a description of the icon.
Clicking the Help menu displays the topic related to the window on which you are performing operations. From thistopic, you can immediately check what you want to know about setup items, such as the number and type of specifiablecharacters.
Related topics• Topic Use NNMi Help Anywhere, Anytime in the Help for Administrators
2.2.3 Registering usersCreate user accounts for the system administrator and supervisor operator to register users. First create a user accountfor the system administrator, and sign in again as that user. Then, create a user account for the supervisor operator.
2. Configuring JP1 Network Management Products
Network Management: Getting Started 47
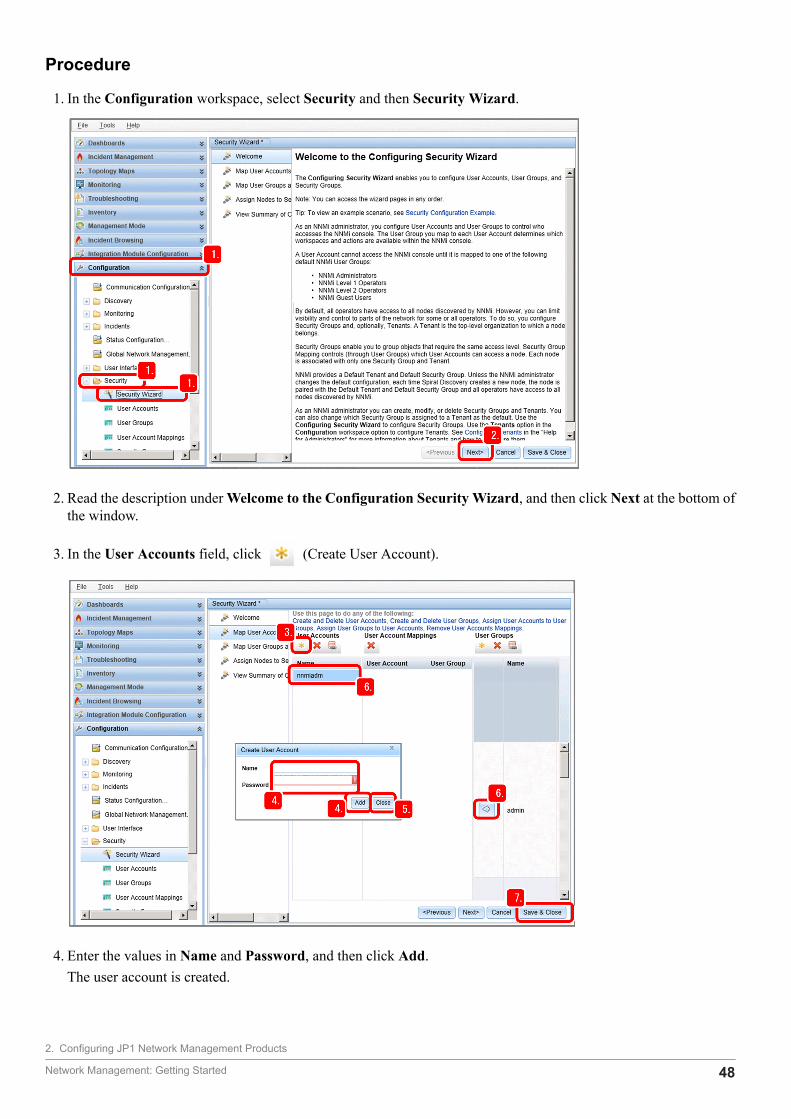
Procedure
1. In the Configuration workspace, select Security and then Security Wizard.
2. Read the description under Welcome to the Configuration Security Wizard, and then click Next at the bottom ofthe window.
3. In the User Accounts field, click (Create User Account).
4. Enter the values in Name and Password, and then click Add.The user account is created.
2. Configuring JP1 Network Management Products
Network Management: Getting Started 48
Example:System administrator Name: nnmiadm, password: passwordSupervisor operator Name: nnmiope, password: password
5. After adding the user, click Close.
6. Select the user account that you created, and then click of the user group to which you want to assign the
user.Example:nnmiadm: System administratornnmiope: Supervisor operator
7. Click Save & Close.
8. In the confirmation dialog box, click OK.The user account is configured.
Note
What to do if you forgot the password:For details about how to reset the password for a user account, see the topic Change Password,Name in the Help for Administrators.To reset the password for the system account, use the nnmchangesyspw.ovpl command. If youwant to change the password for a user account, you can change the password for the current userby clicking the File menu and then Change Password.
Next stepsYou have now successfully registered users. In the Configuration workspace, select Security, and then User AccountMappings, to make sure that the created user accounts are displayed.
Related topics• 1.3.4 Setting up NNMi (for Windows)• 1.4.3 Setting up NNMi (for Linux)• 2.2.4 Configuring communication protocols
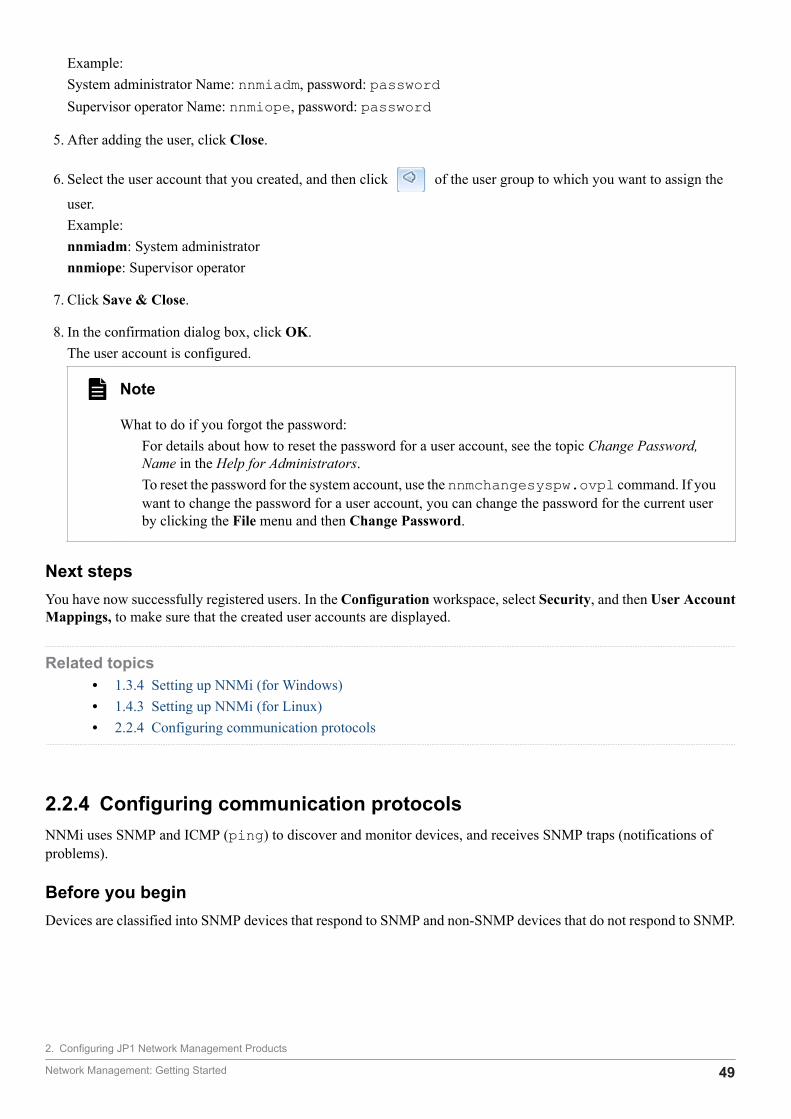
2.2.4 Configuring communication protocolsNNMi uses SNMP and ICMP (ping) to discover and monitor devices, and receives SNMP traps (notifications ofproblems).
Before you beginDevices are classified into SNMP devices that respond to SNMP and non-SNMP devices that do not respond to SNMP.
2. Configuring JP1 Network Management Products
Network Management: Getting Started 49
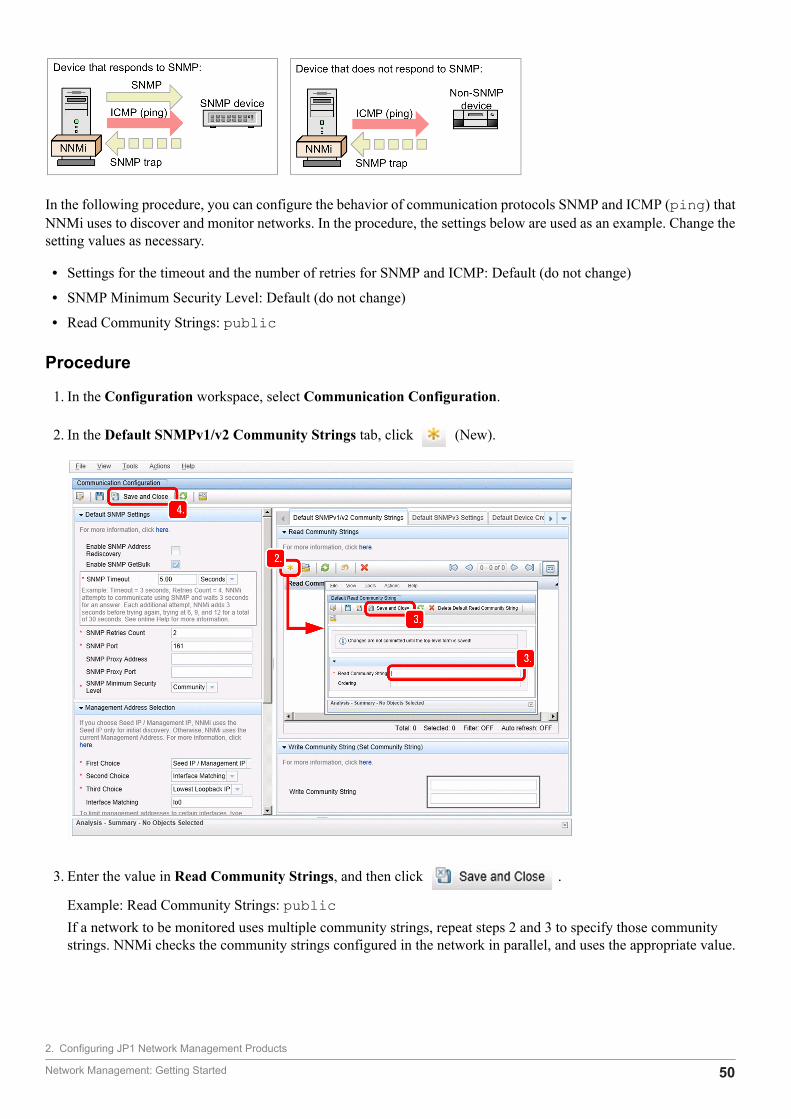
In the following procedure, you can configure the behavior of communication protocols SNMP and ICMP (ping) thatNNMi uses to discover and monitor networks. In the procedure, the settings below are used as an example. Change thesetting values as necessary.
• Settings for the timeout and the number of retries for SNMP and ICMP: Default (do not change)
• SNMP Minimum Security Level: Default (do not change)
• Read Community Strings: public
Procedure
1. In the Configuration workspace, select Communication Configuration.
2. In the Default SNMPv1/v2 Community Strings tab, click (New).
3. Enter the value in Read Community Strings, and then click .
Example: Read Community Strings: publicIf a network to be monitored uses multiple community strings, repeat steps 2 and 3 to specify those communitystrings. NNMi checks the community strings configured in the network in parallel, and uses the appropriate value.
2. Configuring JP1 Network Management Products
Network Management: Getting Started 50
4. In the Communication Configuration view, make sure that the configured settings are displayed, and then click
.
The configured settings are saved.
Next stepsYou have now successfully configured the communication protocols. Next, you will perform network discovery in thenetwork to be monitored.
Related topics• 2.2.5 Performing network discovery
2.2.5 Performing network discoveryNNMi collects information from devices on a network, and obtains the details of individual devices and the networkconfiguration (topology).
(1) About network discoveryNNMi discovers details of the entire network by collecting via SNMP, ARP cache information of each device andinformation about adjacent devices recognized by a protocol such as LLDP.
The following description uses an example of network discovery using an ARP cache.
2. Configuring JP1 Network Management Products
Network Management: Getting Started 51
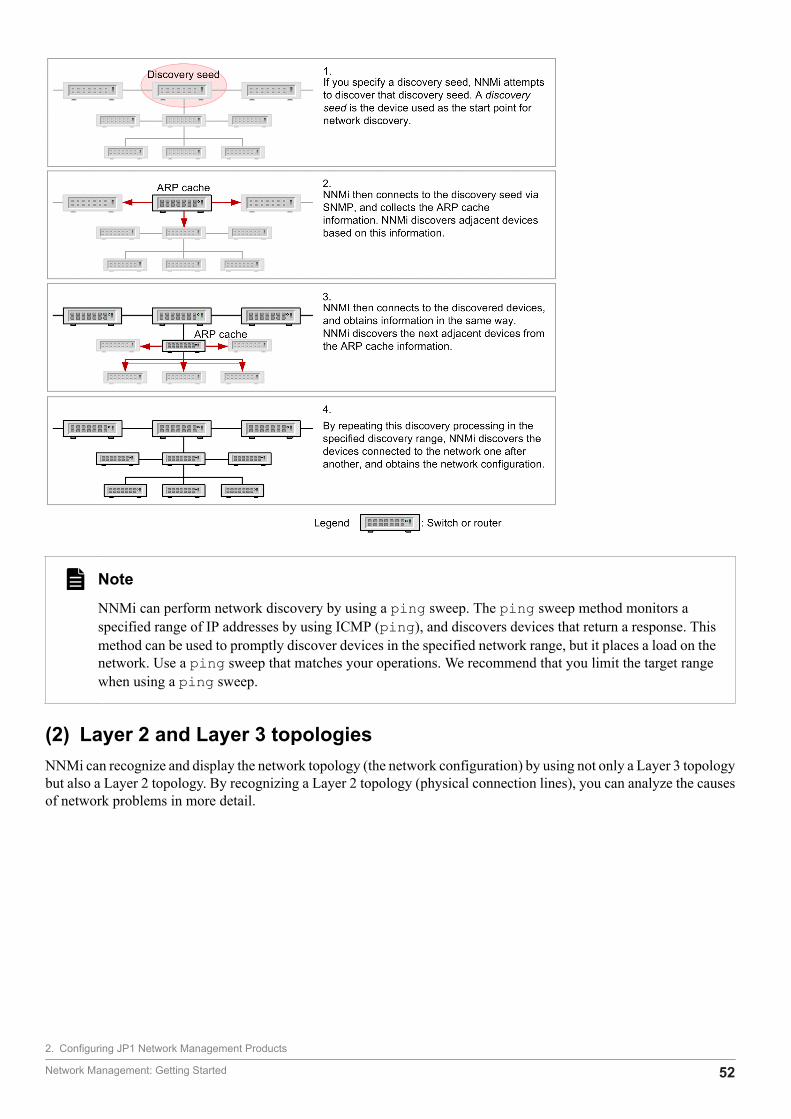
NoteNNMi can perform network discovery by using a ping sweep. The ping sweep method monitors aspecified range of IP addresses by using ICMP (ping), and discovers devices that return a response. Thismethod can be used to promptly discover devices in the specified network range, but it places a load on thenetwork. Use a ping sweep that matches your operations. We recommend that you limit the target rangewhen using a ping sweep.
(2) Layer 2 and Layer 3 topologiesNNMi can recognize and display the network topology (the network configuration) by using not only a Layer 3 topologybut also a Layer 2 topology. By recognizing a Layer 2 topology (physical connection lines), you can analyze the causesof network problems in more detail.
2. Configuring JP1 Network Management Products
Network Management: Getting Started 52
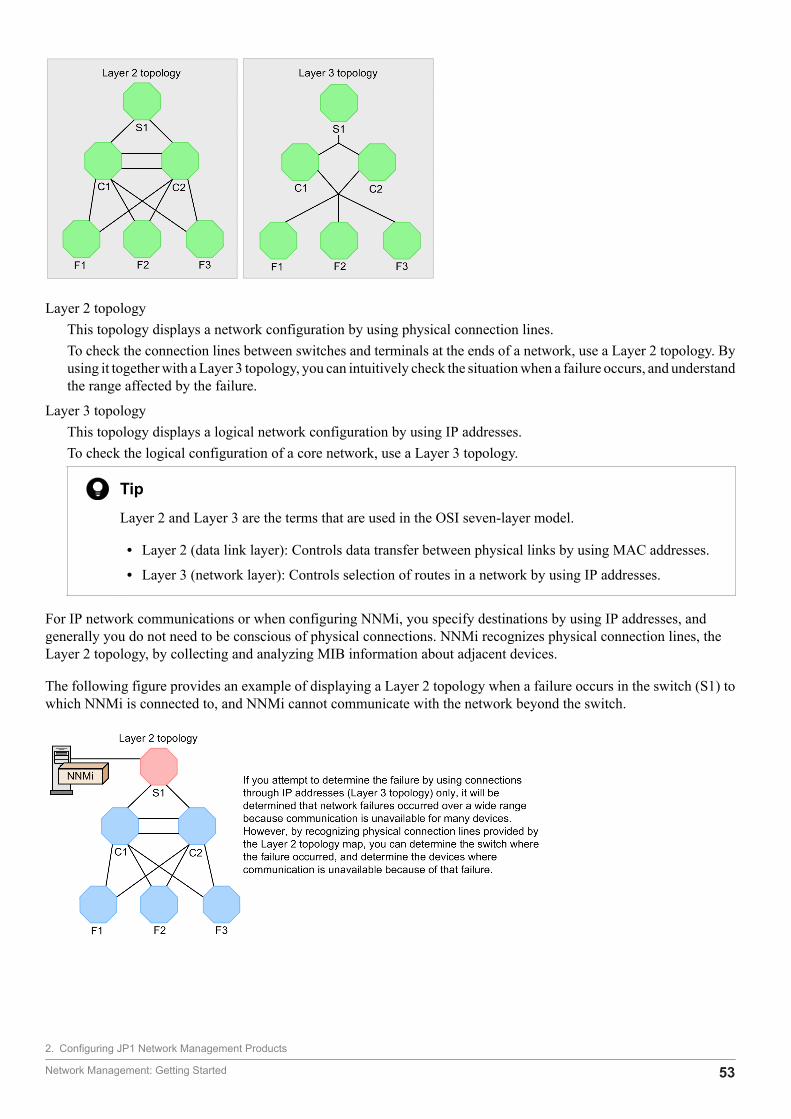
Layer 2 topologyThis topology displays a network configuration by using physical connection lines.To check the connection lines between switches and terminals at the ends of a network, use a Layer 2 topology. Byusing it together with a Layer 3 topology, you can intuitively check the situation when a failure occurs, and understandthe range affected by the failure.
Layer 3 topologyThis topology displays a logical network configuration by using IP addresses.To check the logical configuration of a core network, use a Layer 3 topology.
TipLayer 2 and Layer 3 are the terms that are used in the OSI seven-layer model.
• Layer 2 (data link layer): Controls data transfer between physical links by using MAC addresses.
• Layer 3 (network layer): Controls selection of routes in a network by using IP addresses.
For IP network communications or when configuring NNMi, you specify destinations by using IP addresses, andgenerally you do not need to be conscious of physical connections. NNMi recognizes physical connection lines, theLayer 2 topology, by collecting and analyzing MIB information about adjacent devices.
The following figure provides an example of displaying a Layer 2 topology when a failure occurs in the switch (S1) towhich NNMi is connected to, and NNMi cannot communicate with the network beyond the switch.
2. Configuring JP1 Network Management Products
Network Management: Getting Started 53
(3) Specifying how to perform network discoveryYou can discover network devices connected to the monitored network. Before you start network discovery, the systemadministrator needs to complete configuration of the Monitoring Agent.
Before you beginTo perform network discovery, you can use a method that performs network discovery automatically, or a method thatperforms network discovery of explicitly specified items. You can also use these methods in combination. The followingtable describes these methods, and gives examples of operations.
Discovery method Description Example of operation
Automatic discovery In this method, NNMi automaticallydiscovers devices according to theauto-discovery rules you specified.
• You want to automatically discover thechanges in a network.
• There are many devices connected to alarge-scale network.
Discovery of explicitly specified items In this method, you explicitlyspecify a device as a discovery seed.
• You want to strictly specify the targets tobe managed.
• The network configuration is fixed.
The following procedure describes how to discover explicitly specified items.
Procedure
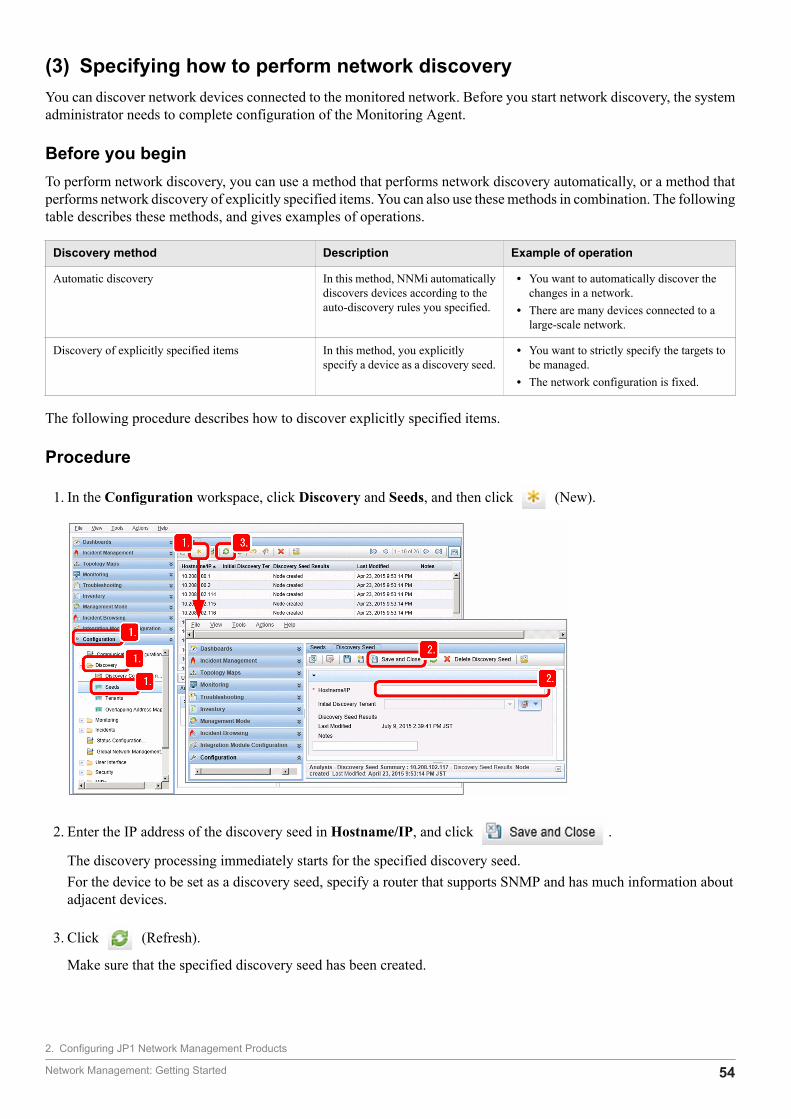
1. In the Configuration workspace, click Discovery and Seeds, and then click (New).
2. Enter the IP address of the discovery seed in Hostname/IP, and click .
The discovery processing immediately starts for the specified discovery seed.For the device to be set as a discovery seed, specify a router that supports SNMP and has much information aboutadjacent devices.
3. Click (Refresh).
Make sure that the specified discovery seed has been created.
2. Configuring JP1 Network Management Products
Network Management: Getting Started 54
NoteYou can also use the nnmloadseeds.ovpl command as shown below to register discovery seedsin a batch operation.
To directly specify seeds:Example: nnmloadseeds.ovpl -n 192.168.8.82 192.168.100.24
To specify a list of seeds:Example: nnmloadseeds.ovpl -f c:\jp1\seeds.txt
Example of describing a seed file:192.168.8.82 # node1192.168.100.24 # node2
For details about the nnmloadseeds.ovpl command, see the topic displayed by selecting the Helpmenu, NNMi Documentation Library, Reference Pages, and then nnmloadseeds.ovpl.
TipIf you want to perform network discovery automatically, in the Configuration workspace, selectDiscovery Configuration and then Auto-Discovery Rules. Also, when specifying IP Ranges, if youspecify the IP addresses that you do not want to discover and set the range type to Ignored by rule, theIP addresses are excluded from discovery.
Use the operation of selecting Discovery Configuration and then Excluded IP Addresses only whenexcluding specific IP addresses from the discovered nodes. If you use this operation to specify nodesto be excluded from monitoring, the IP addresses might disappear while the nodes still remain. Use themethod appropriate for your usage.
For details about automatic discovery, see the topic Setting up auto-discovery rules in the JP1/NetworkNode Manager i Setup Guide.
Related topics• 1.2.4 Storage location of the commands of each product
(4) Checking the discovered network and devicesYou can view a discovered network by using a topology map. Immediately after you configure the discovery settings,you can view the process of node discovery.
Procedure
1. Click the Topology Maps workspace and then Network Overview.In the Network Overview view, check the network status.
2. Configuring JP1 Network Management Products
Network Management: Getting Started 55
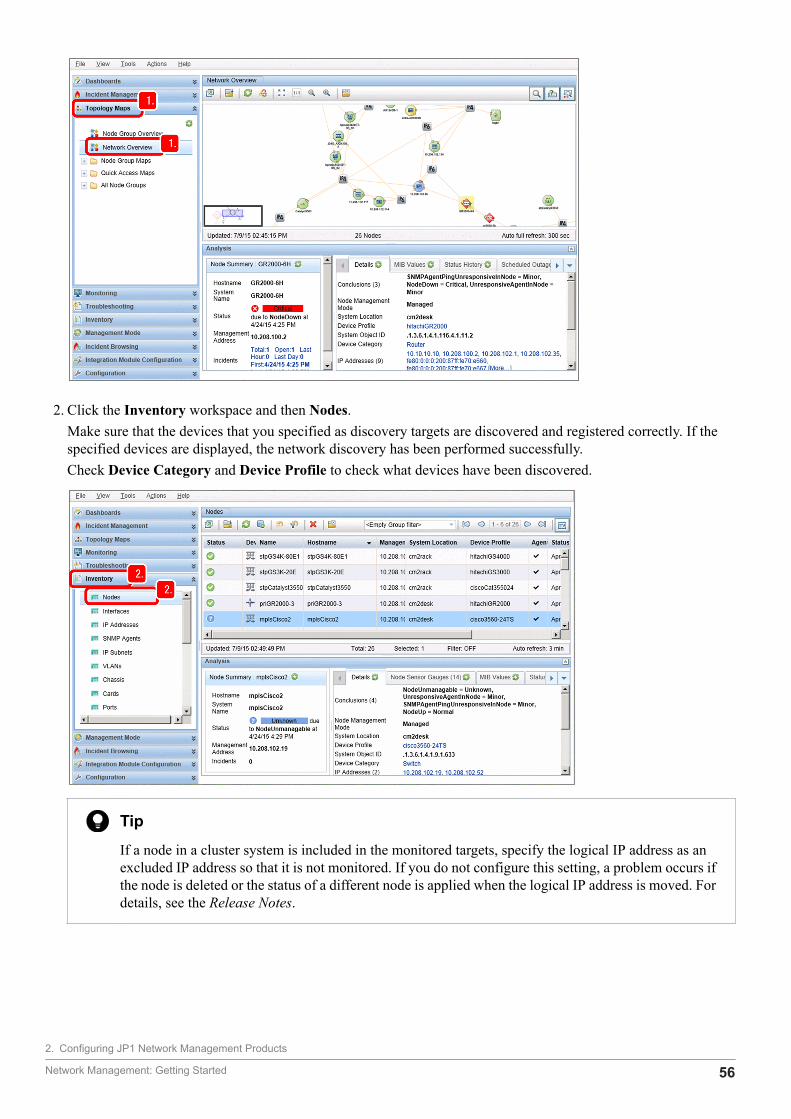
2. Click the Inventory workspace and then Nodes.Make sure that the devices that you specified as discovery targets are discovered and registered correctly. If thespecified devices are displayed, the network discovery has been performed successfully.Check Device Category and Device Profile to check what devices have been discovered.
TipIf a node in a cluster system is included in the monitored targets, specify the logical IP address as anexcluded IP address so that it is not monitored. If you do not configure this setting, a problem occurs ifthe node is deleted or the status of a different node is applied when the logical IP address is moved. Fordetails, see the Release Notes.
2. Configuring JP1 Network Management Products
Network Management: Getting Started 56
NoteIf a node that does not need to be monitored is discovered, you can either delete the node from themonitored targets or exclude it from the monitored targets.
To delete the node from the monitored targets:In the Topology Maps workspace, select Network Overview and then the icon for the node thatyou want to delete. Note that if the node is specified as a discovery seed, the node is not removedfrom the list displayed in the Seeds view even if you delete it. Delete the discovery seed.
To exclude the node from the monitored targets:In the Inventory workspace, select Nodes and then the target node. Select Actions, ManagementMode, and Note Managed. Use this method if you do not want to delete the node from a map, orwant to temporarily exclude the node from monitoring.
Related topics• (5) Deleting the discovery seeds for which discovery is complete
(5) Deleting the discovery seeds for which discovery is completeAfter the network discovery is complete, delete the discovery seeds.
Procedure
1. In the Configuration workspace, click Discovery and then Seeds.
2. Select all discovery seeds, and then click (Delete).
To select multiple rows, click the rows while pressing the Ctrl key.
3. Verify that the discovery seeds have been deleted.
Next stepsYou have now successfully performed network discovery. In the next section, you will configure node groups.
Related topics• 2.2.6 Configuring node groups
2.2.6 Configuring node groupsBy defining node groups, you can configure monitoring settings and perform filtering for each node group. You canalso display any of the defined node groups as the initial screen of the NNMi console.
(1) About node groupsA node group is a collection of discovered network devices that are put into a group in a hierarchy, based on conditionssuch as IP address or device type. NNMi provides, as standard, node groups for which appropriate settings are configured
2. Configuring JP1 Network Management Products
Network Management: Getting Started 57
for each of basic categories, such as Windows or routers. You can classify a node group into six hierarchies by definingchild node groups.
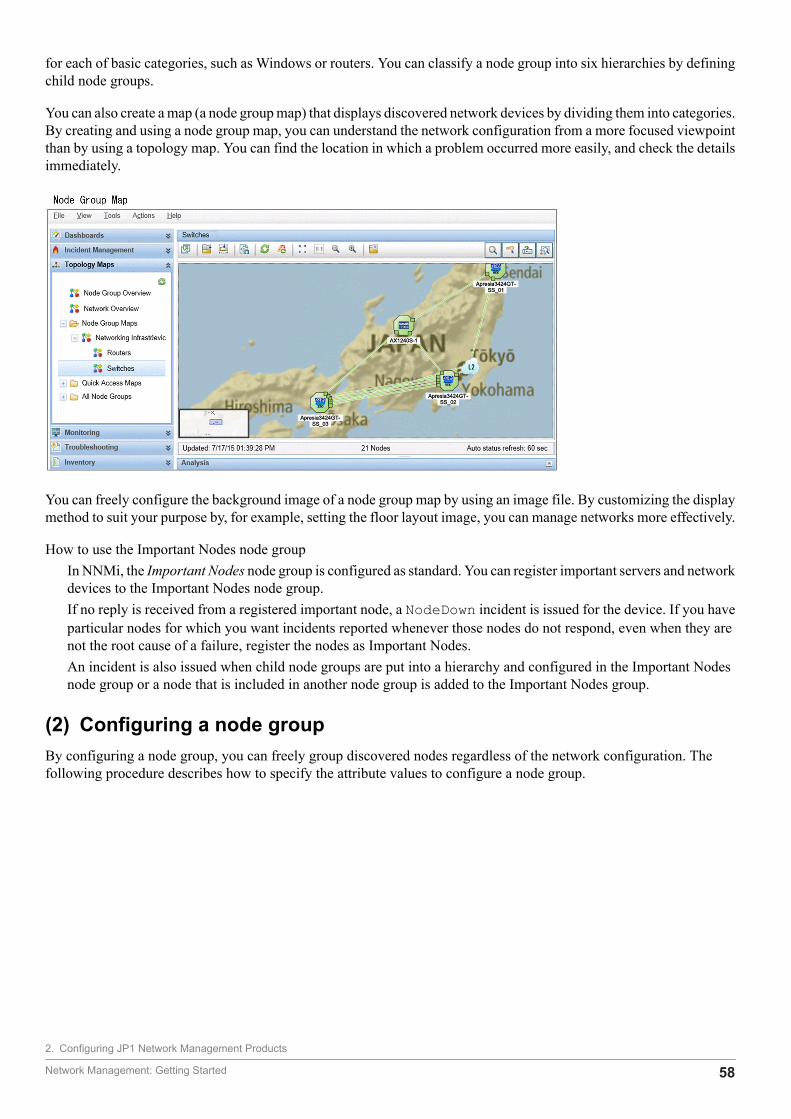
You can also create a map (a node group map) that displays discovered network devices by dividing them into categories.By creating and using a node group map, you can understand the network configuration from a more focused viewpointthan by using a topology map. You can find the location in which a problem occurred more easily, and check the detailsimmediately.
You can freely configure the background image of a node group map by using an image file. By customizing the displaymethod to suit your purpose by, for example, setting the floor layout image, you can manage networks more effectively.
How to use the Important Nodes node groupIn NNMi, the Important Nodes node group is configured as standard. You can register important servers and networkdevices to the Important Nodes node group.If no reply is received from a registered important node, a NodeDown incident is issued for the device. If you haveparticular nodes for which you want incidents reported whenever those nodes do not respond, even when they arenot the root cause of a failure, register the nodes as Important Nodes.An incident is also issued when child node groups are put into a hierarchy and configured in the Important Nodesnode group or a node that is included in another node group is added to the Important Nodes group.
(2) Configuring a node groupBy configuring a node group, you can freely group discovered nodes regardless of the network configuration. Thefollowing procedure describes how to specify the attribute values to configure a node group.
2. Configuring JP1 Network Management Products
Network Management: Getting Started 58
Procedure
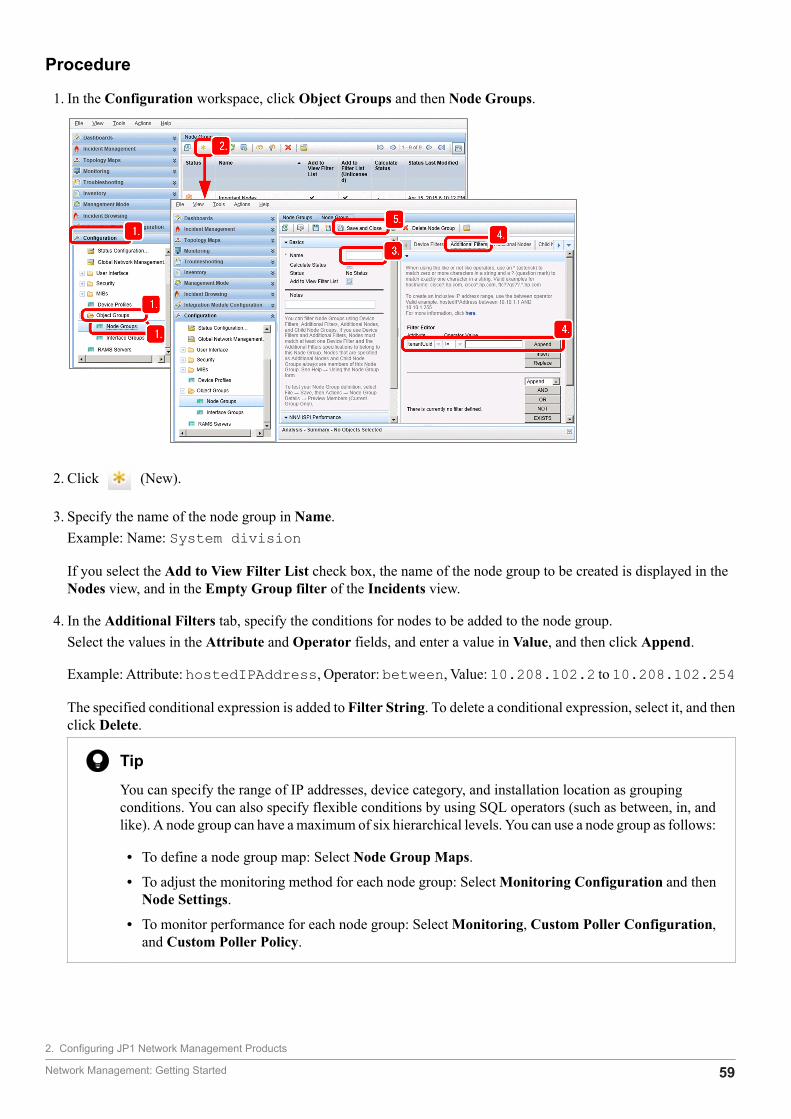
1. In the Configuration workspace, click Object Groups and then Node Groups.
2. Click (New).
3. Specify the name of the node group in Name.Example: Name: System division
If you select the Add to View Filter List check box, the name of the node group to be created is displayed in theNodes view, and in the Empty Group filter of the Incidents view.
4. In the Additional Filters tab, specify the conditions for nodes to be added to the node group.Select the values in the Attribute and Operator fields, and enter a value in Value, and then click Append.
Example: Attribute: hostedIPAddress, Operator: between, Value: 10.208.102.2 to 10.208.102.254
The specified conditional expression is added to Filter String. To delete a conditional expression, select it, and thenclick Delete.
TipYou can specify the range of IP addresses, device category, and installation location as groupingconditions. You can also specify flexible conditions by using SQL operators (such as between, in, andlike). A node group can have a maximum of six hierarchical levels. You can use a node group as follows:
• To define a node group map: Select Node Group Maps.
• To adjust the monitoring method for each node group: Select Monitoring Configuration and thenNode Settings.
• To monitor performance for each node group: Select Monitoring, Custom Poller Configuration,and Custom Poller Policy.
2. Configuring JP1 Network Management Products
Network Management: Getting Started 59
5. Click .
The Node Groups view closes, and the node group is created.
6. Select and right-click the row of the created node group, and then click Node Group Details and Show Members(Include Child Groups).Make sure that the nodes that you specified as targets are included in the node group.
7. Right-click the desired node group, and select Maps and then Node Group Maps.The node group is displayed in a map format.
NoteNNMi provides various grouping conditions other than those that are set by using operators. Thefollowing table describes the tabs used to set grouping conditions, and provides examples of operations.
Tab for configuring the settings Setup item Example of operation
Device Filters • DeviceCategory
• DeviceVendor
and others
• Perform monitoring according to the importance ofdevices.
• Set an appropriate monitoring method for each model.• Understand the situation immediately by reducing
conditions so that, for example, only routers are displayed.
Additional Filters • hostedIPAddress (IPaddress)
• sysLocation(location)
and others
Set monitoring conditions and filter the displayed items foreach installation location or organization.
Additional Nodes NodeHostname
• Set particularly important nodes individually.• Set the nodes for which it is difficult to specify conditions.
Child Node Groups Child NodeGroup(Set in thehierarchyorder)
Put node groups into a hierarchy for each workplace or region
(3) Configuring a node group mapBy configuring a node group map, you can specify an image for the background image. You can also display the creatednode group map in the list of map names under the Topology Maps workspace.
2. Configuring JP1 Network Management Products
Network Management: Getting Started 60
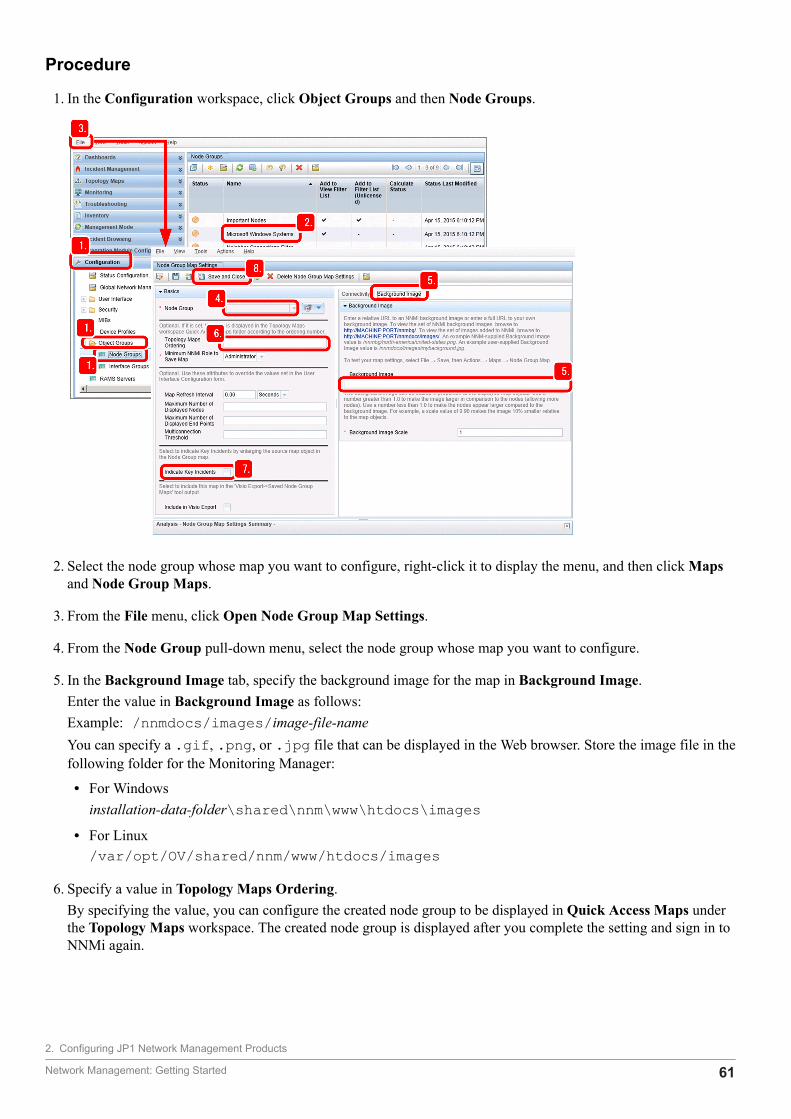
Procedure
1. In the Configuration workspace, click Object Groups and then Node Groups.
2. Select the node group whose map you want to configure, right-click it to display the menu, and then click Mapsand Node Group Maps.
3. From the File menu, click Open Node Group Map Settings.
4. From the Node Group pull-down menu, select the node group whose map you want to configure.
5. In the Background Image tab, specify the background image for the map in Background Image.Enter the value in Background Image as follows:Example: /nnmdocs/images/image-file-nameYou can specify a .gif, .png, or .jpg file that can be displayed in the Web browser. Store the image file in thefollowing folder for the Monitoring Manager:
• For Windowsinstallation-data-folder\shared\nnm\www\htdocs\images
• For Linux/var/opt/OV/shared/nnm/www/htdocs/images
6. Specify a value in Topology Maps Ordering.By specifying the value, you can configure the created node group to be displayed in Quick Access Maps underthe Topology Maps workspace. The created node group is displayed after you complete the setting and sign in toNNMi again.
2. Configuring JP1 Network Management Products
Network Management: Getting Started 61
7. Select the Indicate Key Incidents check box.If you select the check box, the icons in the map are enlarged if a key incident occurs, and you can easily find thelocation where the problem occurred.
8. After you complete the setting, click .
9. Adjust the icon positions, and then click (Save Map).
The icon positions are saved.
Next stepsYou have now successfully configured the node group map. In the next section, configure monitoring definitions.
Related topics• 2.2.7 Configuring monitoring settings
2.2.7 Configuring monitoring settingsNNMi periodically monitors devices discovered by network discovery.
(1) About monitoringMonitoring is a process to periodically monitor whether nodes on a discovered network work properly. NNMi monitorstarget devices by using SNMP or ICMP (ping). By default, monitoring is performed at five-minute intervals to checkthe status of the targets.
The following table describes the relationship between the settings for communication, discovery, and monitoring, andcommunication protocols SNMP and ICMP (ping).
Target ofconfiguration
Description Location for configuring the setting Setupitem
Defaultvalue
Protocol behavior Configure the timeout and retry count percommunication for SNMP or ICMP(ping). Communications for discoveryand monitoring are performed based onthese settings.
Select the Configuration workspace andthen Communication Configuration.
SNMP Five minutes(two retries)
ICMP(ping)
Behavior duringnetwork discovery
Configure the setting so that rediscoveryis performed on a daily basis becausegenerally the configuration of a network isnot changed frequently.
Select the Configuration workspace,Discovery, and DiscoveryConfiguration.
SweepInterval
One day
Behavior duringnetworkmonitoring
Configure the setting so that monitoring isperformed in a short cycle to immediatelydiscover a failure. However, configure thesetting so that polling is performed inminutes to keep a proper monitoring load.
Select the Configuration workspace,Monitoring, and MonitoringConfiguration.
FaultPollingInterval
Five minutes
Items that can be monitored by NNMi are displayed in the Inventory view. The following figure shows thecorrespondence between the items monitored by NNMi and a device.
2. Configuring JP1 Network Management Products
Network Management: Getting Started 62
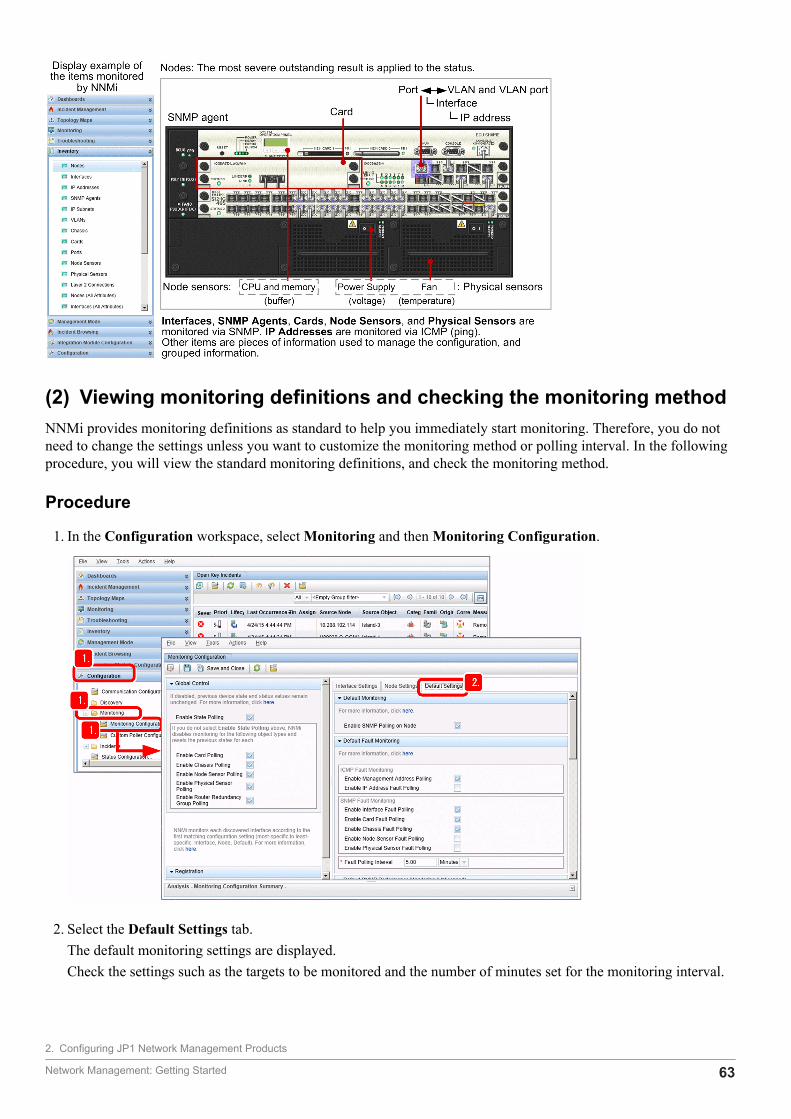
(2) Viewing monitoring definitions and checking the monitoring methodNNMi provides monitoring definitions as standard to help you immediately start monitoring. Therefore, you do notneed to change the settings unless you want to customize the monitoring method or polling interval. In the followingprocedure, you will view the standard monitoring definitions, and check the monitoring method.
Procedure
1. In the Configuration workspace, select Monitoring and then Monitoring Configuration.
2. Select the Default Settings tab.The default monitoring settings are displayed.Check the settings such as the targets to be monitored and the number of minutes set for the monitoring interval.
2. Configuring JP1 Network Management Products
Network Management: Getting Started 63
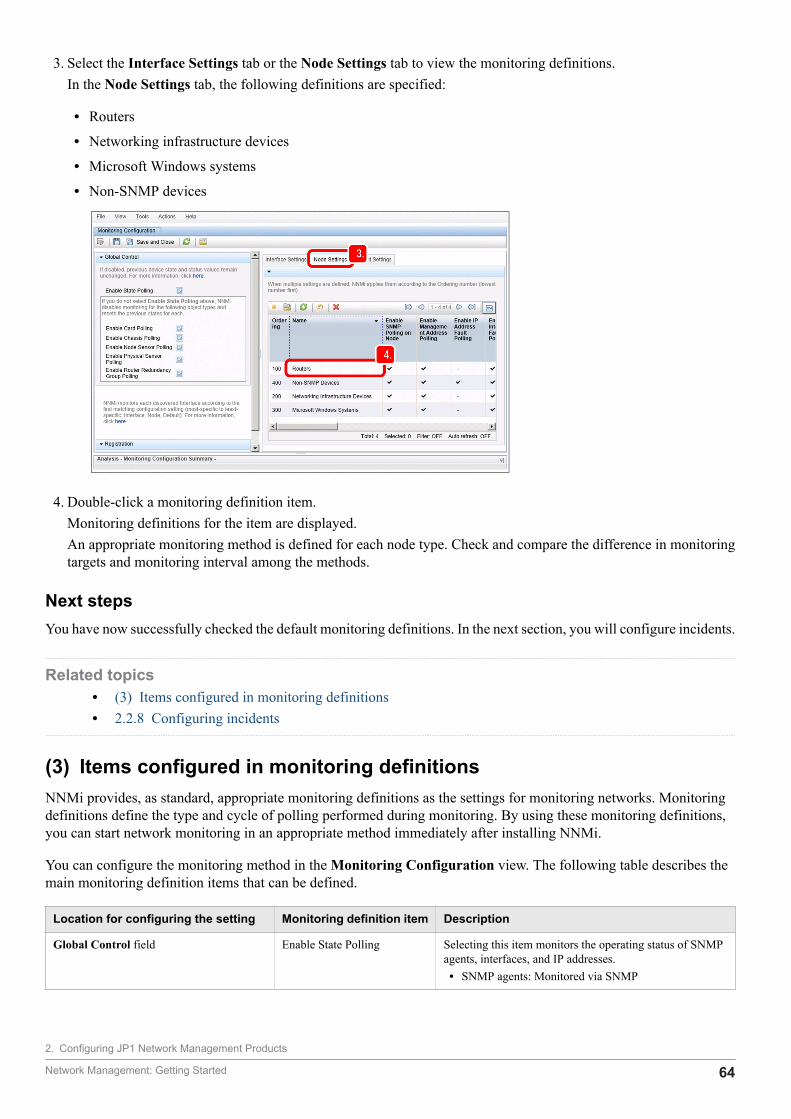
3. Select the Interface Settings tab or the Node Settings tab to view the monitoring definitions.In the Node Settings tab, the following definitions are specified:
• Routers
• Networking infrastructure devices
• Microsoft Windows systems
• Non-SNMP devices
4. Double-click a monitoring definition item.Monitoring definitions for the item are displayed.An appropriate monitoring method is defined for each node type. Check and compare the difference in monitoringtargets and monitoring interval among the methods.
Next stepsYou have now successfully checked the default monitoring definitions. In the next section, you will configure incidents.
Related topics• (3) Items configured in monitoring definitions• 2.2.8 Configuring incidents
(3) Items configured in monitoring definitionsNNMi provides, as standard, appropriate monitoring definitions as the settings for monitoring networks. Monitoringdefinitions define the type and cycle of polling performed during monitoring. By using these monitoring definitions,you can start network monitoring in an appropriate method immediately after installing NNMi.
You can configure the monitoring method in the Monitoring Configuration view. The following table describes themain monitoring definition items that can be defined.
Location for configuring the setting Monitoring definition item Description
Global Control field Enable State Polling Selecting this item monitors the operating status of SNMPagents, interfaces, and IP addresses.• SNMP agents: Monitored via SNMP
2. Configuring JP1 Network Management Products
Network Management: Getting Started 64
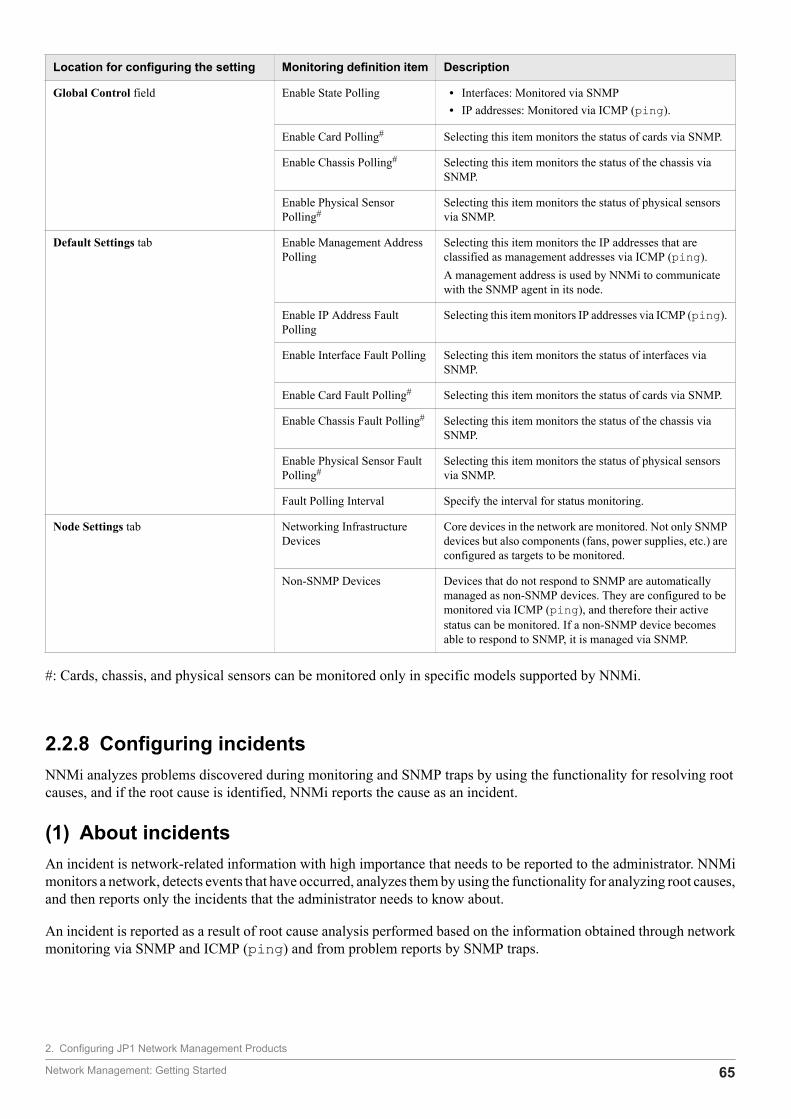
Location for configuring the setting Monitoring definition item Description
Global Control field Enable State Polling • Interfaces: Monitored via SNMP• IP addresses: Monitored via ICMP (ping).
Enable Card Polling# Selecting this item monitors the status of cards via SNMP.
Enable Chassis Polling# Selecting this item monitors the status of the chassis viaSNMP.
Enable Physical SensorPolling#
Selecting this item monitors the status of physical sensorsvia SNMP.
Default Settings tab Enable Management AddressPolling
Selecting this item monitors the IP addresses that areclassified as management addresses via ICMP (ping).A management address is used by NNMi to communicatewith the SNMP agent in its node.
Enable IP Address FaultPolling
Selecting this item monitors IP addresses via ICMP (ping).
Enable Interface Fault Polling Selecting this item monitors the status of interfaces viaSNMP.
Enable Card Fault Polling# Selecting this item monitors the status of cards via SNMP.
Enable Chassis Fault Polling# Selecting this item monitors the status of the chassis viaSNMP.
Enable Physical Sensor FaultPolling#
Selecting this item monitors the status of physical sensorsvia SNMP.
Fault Polling Interval Specify the interval for status monitoring.
Node Settings tab Networking InfrastructureDevices
Core devices in the network are monitored. Not only SNMPdevices but also components (fans, power supplies, etc.) areconfigured as targets to be monitored.
Non-SNMP Devices Devices that do not respond to SNMP are automaticallymanaged as non-SNMP devices. They are configured to bemonitored via ICMP (ping), and therefore their activestatus can be monitored. If a non-SNMP device becomesable to respond to SNMP, it is managed via SNMP.
#: Cards, chassis, and physical sensors can be monitored only in specific models supported by NNMi.
2.2.8 Configuring incidentsNNMi analyzes problems discovered during monitoring and SNMP traps by using the functionality for resolving rootcauses, and if the root cause is identified, NNMi reports the cause as an incident.
(1) About incidentsAn incident is network-related information with high importance that needs to be reported to the administrator. NNMimonitors a network, detects events that have occurred, analyzes them by using the functionality for analyzing root causes,and then reports only the incidents that the administrator needs to know about.
An incident is reported as a result of root cause analysis performed based on the information obtained through networkmonitoring via SNMP and ICMP (ping) and from problem reports by SNMP traps.
2. Configuring JP1 Network Management Products
Network Management: Getting Started 65
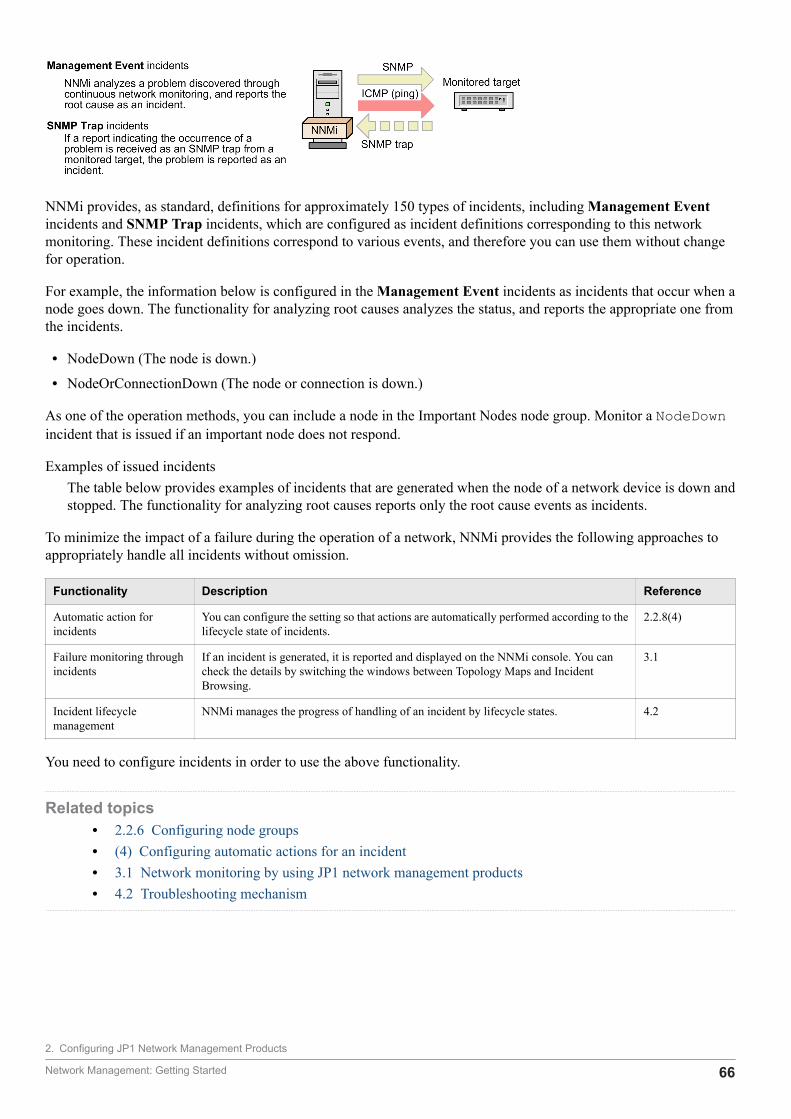
NNMi provides, as standard, definitions for approximately 150 types of incidents, including Management Eventincidents and SNMP Trap incidents, which are configured as incident definitions corresponding to this networkmonitoring. These incident definitions correspond to various events, and therefore you can use them without changefor operation.
For example, the information below is configured in the Management Event incidents as incidents that occur when anode goes down. The functionality for analyzing root causes analyzes the status, and reports the appropriate one fromthe incidents.
• NodeDown (The node is down.)
• NodeOrConnectionDown (The node or connection is down.)
As one of the operation methods, you can include a node in the Important Nodes node group. Monitor a NodeDownincident that is issued if an important node does not respond.
Examples of issued incidentsThe table below provides examples of incidents that are generated when the node of a network device is down andstopped. The functionality for analyzing root causes reports only the root cause events as incidents.
To minimize the impact of a failure during the operation of a network, NNMi provides the following approaches toappropriately handle all incidents without omission.
Functionality Description Reference
Automatic action forincidents
You can configure the setting so that actions are automatically performed according to thelifecycle state of incidents.
2.2.8(4)
Failure monitoring throughincidents
If an incident is generated, it is reported and displayed on the NNMi console. You cancheck the details by switching the windows between Topology Maps and IncidentBrowsing.
3.1
Incident lifecyclemanagement
NNMi manages the progress of handling of an incident by lifecycle states. 4.2
You need to configure incidents in order to use the above functionality.
Related topics• 2.2.6 Configuring node groups• (4) Configuring automatic actions for an incident• 3.1 Network monitoring by using JP1 network management products• 4.2 Troubleshooting mechanism
2. Configuring JP1 Network Management Products
Network Management: Getting Started 66
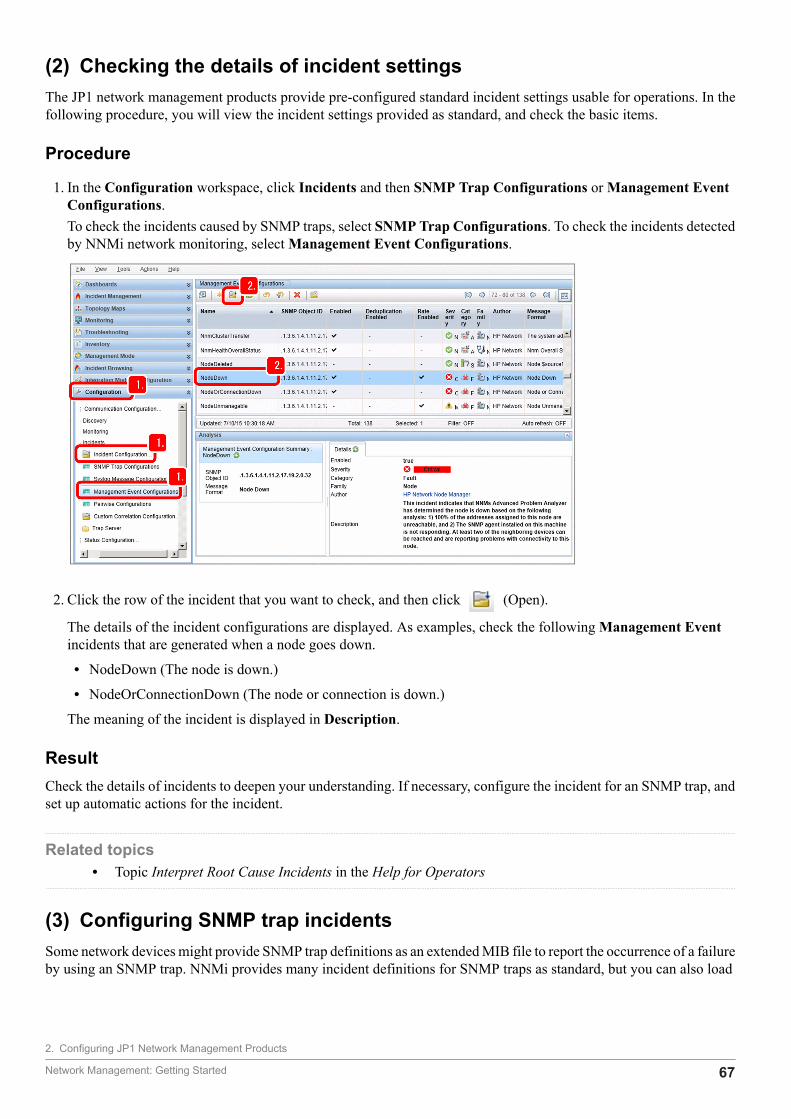
(2) Checking the details of incident settingsThe JP1 network management products provide pre-configured standard incident settings usable for operations. In thefollowing procedure, you will view the incident settings provided as standard, and check the basic items.
Procedure
1. In the Configuration workspace, click Incidents and then SNMP Trap Configurations or Management EventConfigurations.To check the incidents caused by SNMP traps, select SNMP Trap Configurations. To check the incidents detectedby NNMi network monitoring, select Management Event Configurations.
2. Click the row of the incident that you want to check, and then click (Open).
The details of the incident configurations are displayed. As examples, check the following Management Eventincidents that are generated when a node goes down.
• NodeDown (The node is down.)
• NodeOrConnectionDown (The node or connection is down.)
The meaning of the incident is displayed in Description.
ResultCheck the details of incidents to deepen your understanding. If necessary, configure the incident for an SNMP trap, andset up automatic actions for the incident.
Related topics• Topic Interpret Root Cause Incidents in the Help for Operators
(3) Configuring SNMP trap incidentsSome network devices might provide SNMP trap definitions as an extended MIB file to report the occurrence of a failureby using an SNMP trap. NNMi provides many incident definitions for SNMP traps as standard, but you can also load
2. Configuring JP1 Network Management Products
Network Management: Getting Started 67

a vendor-specific extended MIB file for a device such as a network device, and configure incident definitions for SNMPtraps that are unique for the device. General MIB files contain MIB definitions and SNMP trap definitions. For detailsabout MIB files for each vendor, see the vendor's manual. Many MIBs have already been loaded during installation ofNNMi. You can view a list of loaded MIBs by selecting the Configuration workspace, MIBs, and Loaded MIBs.
Before you beginTo receive an SNMP trap, the following conditions must be met. If the conditions are not met, the trap is discarded.
• The incident that corresponds to the SNMP trap is configured. In addition, the Enabled check box is selected.
• The source node that issued the SNMP trap is discovered. In addition, the management mode of the node is set toManaged.
For details, see the topic Manage Incoming SNMP Traps in the Help for Administrators. If you want to receive SNMPtraps from a node that has not been discovered, see the topic Handle Unresolved Incoming Traps in the Help forAdministrators.
Procedure
1. Execute the nnmloadmib.ovpl command of NNMi.Example of specification: nnmloadmib.ovpl -load MIB-file-nameExecuting this command loads the contents of the MIB file to NNMi. Specify the MIB file to be loaded for the -load option.
2. Execute the nnmincidentcfg.ovpl command of NNMi.Example of specification: nnmincidentcfg.ovpl -loadTraps MIB-module-nameExecuting this command creates the incident configuration from the MIB database of NNMi.Specify the MIB module name defined in the MIB file for the -loadTraps option.
3. In the Configuration workspace, click Incidents and then SNMP Trap Configurations.You can check the status of SNMP traps.
NoteYou can also use the nnmtrapdump.ovpl command to check the status of SNMP traps.
Example:nnmtrapdump.ovpl -source IP-addressExecuting this command displays traps received from the IP address.nnmtrapdump.ovpl -tExecuting this command continuously displays received traps. Use the command when you checkthe configuration.
For details, see the topic SNMP Traps view in the Help for Operators, and information displayed byclicking the Help menu, NNMi Documentation Library, Reference Pages, and nnmtrapdump.ovpl.
NoteTo find the MIB module name, open the MIB file, and check the area around the top of the file. Thename defined before DEFINITIONS ::= BEGIN is the MIB module name.
2. Configuring JP1 Network Management Products
Network Management: Getting Started 68
Example:Example of a MIB module name------ MIB Simple SampleSAMPLE-MIB DEFINITIONS ::= BEGINIn this example, the MIB module name is SAMPLE-MIB.
Related topics• 1.2.4 Storage location of the commands of each product
(4) Configuring automatic actions for an incidentIf you configure automatic actions for an incident, you can execute a specified command under a specific lifecycle state.
Context
NoteBy linking to JP1/IM, you can send an email when a failure occurs and use a signal light.
Procedure
1. In the Configuration workspace, click Incidents and then SNMP Trap Configurations or Management EventConfigurations.To configure automatic actions for incidents caused by SNMP traps, select SNMP Trap Configurations. Toconfigure automatic actions for incidents detected by NNMi network monitoring, select Management EventConfigurations.
2. Configuring JP1 Network Management Products
Network Management: Getting Started 69
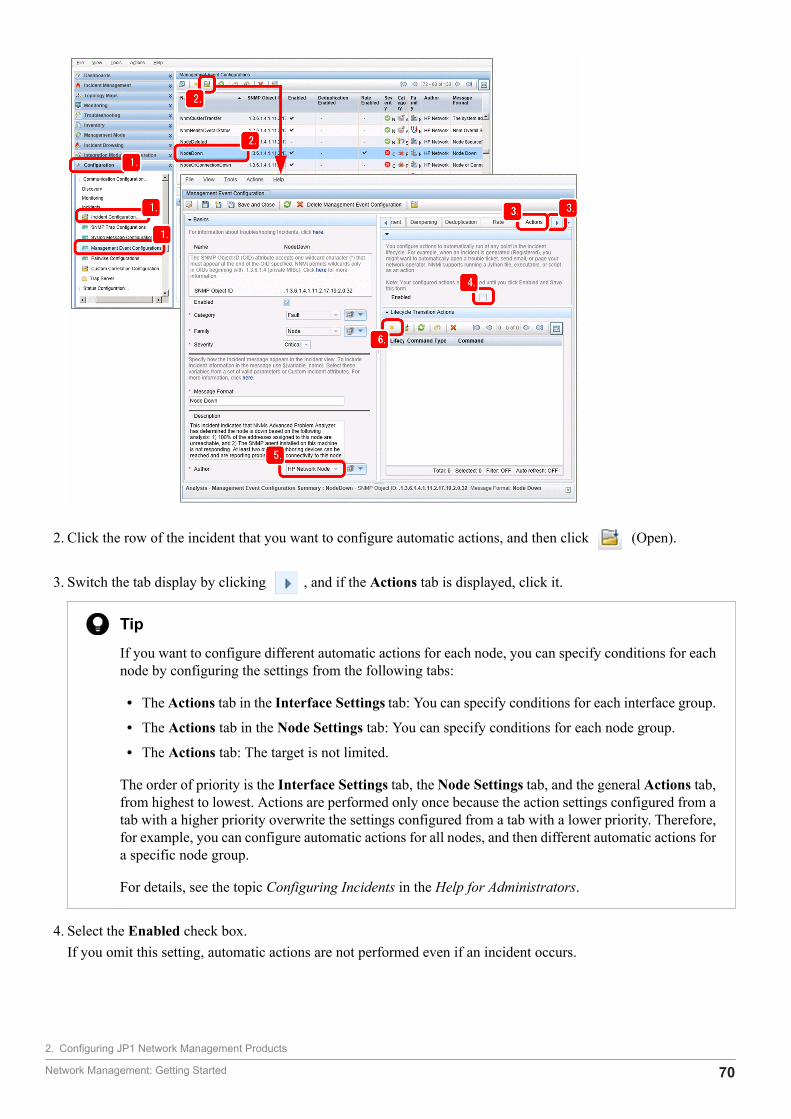
2. Click the row of the incident that you want to configure automatic actions, and then click (Open).
3. Switch the tab display by clicking , and if the Actions tab is displayed, click it.
TipIf you want to configure different automatic actions for each node, you can specify conditions for eachnode by configuring the settings from the following tabs:
• The Actions tab in the Interface Settings tab: You can specify conditions for each interface group.
• The Actions tab in the Node Settings tab: You can specify conditions for each node group.
• The Actions tab: The target is not limited.
The order of priority is the Interface Settings tab, the Node Settings tab, and the general Actions tab,from highest to lowest. Actions are performed only once because the action settings configured from atab with a higher priority overwrite the settings configured from a tab with a lower priority. Therefore,for example, you can configure automatic actions for all nodes, and then different automatic actions fora specific node group.
For details, see the topic Configuring Incidents in the Help for Administrators.
4. Select the Enabled check box.If you omit this setting, automatic actions are not performed even if an incident occurs.
2. Configuring JP1 Network Management Products
Network Management: Getting Started 70
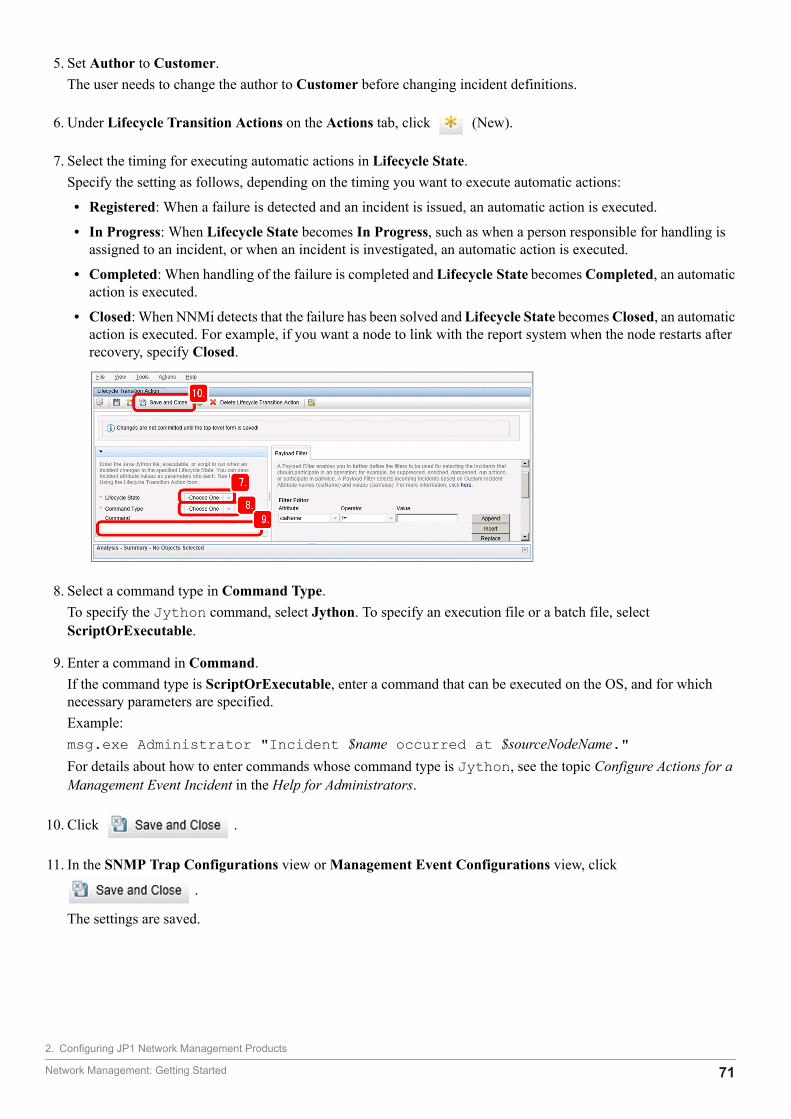
5. Set Author to Customer.The user needs to change the author to Customer before changing incident definitions.
6. Under Lifecycle Transition Actions on the Actions tab, click (New).
7. Select the timing for executing automatic actions in Lifecycle State.Specify the setting as follows, depending on the timing you want to execute automatic actions:
• Registered: When a failure is detected and an incident is issued, an automatic action is executed.
• In Progress: When Lifecycle State becomes In Progress, such as when a person responsible for handling isassigned to an incident, or when an incident is investigated, an automatic action is executed.
• Completed: When handling of the failure is completed and Lifecycle State becomes Completed, an automaticaction is executed.
• Closed: When NNMi detects that the failure has been solved and Lifecycle State becomes Closed, an automaticaction is executed. For example, if you want a node to link with the report system when the node restarts afterrecovery, specify Closed.
8. Select a command type in Command Type.To specify the Jython command, select Jython. To specify an execution file or a batch file, selectScriptOrExecutable.
9. Enter a command in Command.If the command type is ScriptOrExecutable, enter a command that can be executed on the OS, and for whichnecessary parameters are specified.Example:msg.exe Administrator "Incident $name occurred at $sourceNodeName."For details about how to enter commands whose command type is Jython, see the topic Configure Actions for aManagement Event Incident in the Help for Administrators.
10. Click .
11. In the SNMP Trap Configurations view or Management Event Configurations view, click
.
The settings are saved.
2. Configuring JP1 Network Management Products
Network Management: Getting Started 71
TipTo check the execution status of automatic actions, click the Tools menu and then Incident ActionsLog. You can also check the status by using the following log file:
• For WindowsNNMi-installation-data-folder\log\nnm\incidentActions.*.*.log
• For Linux/var/opt/OV/log/nnm/public/incidentActions.*.*.log
If you fail to select the Enabled check box of the action settings, automatic actions are not executedand the history is not output to the log file. If automatic actions are not performed, make sure that theEnabled check box is selected. For details, see the topic Configuring Incidents in the Help forAdministrators.
Next stepsYou have now successfully configured automatic actions for incidents. In the next section, access and configure SSO.
Related topics• 2.3 Configuring SSO
2. Configuring JP1 Network Management Products
Network Management: Getting Started 72
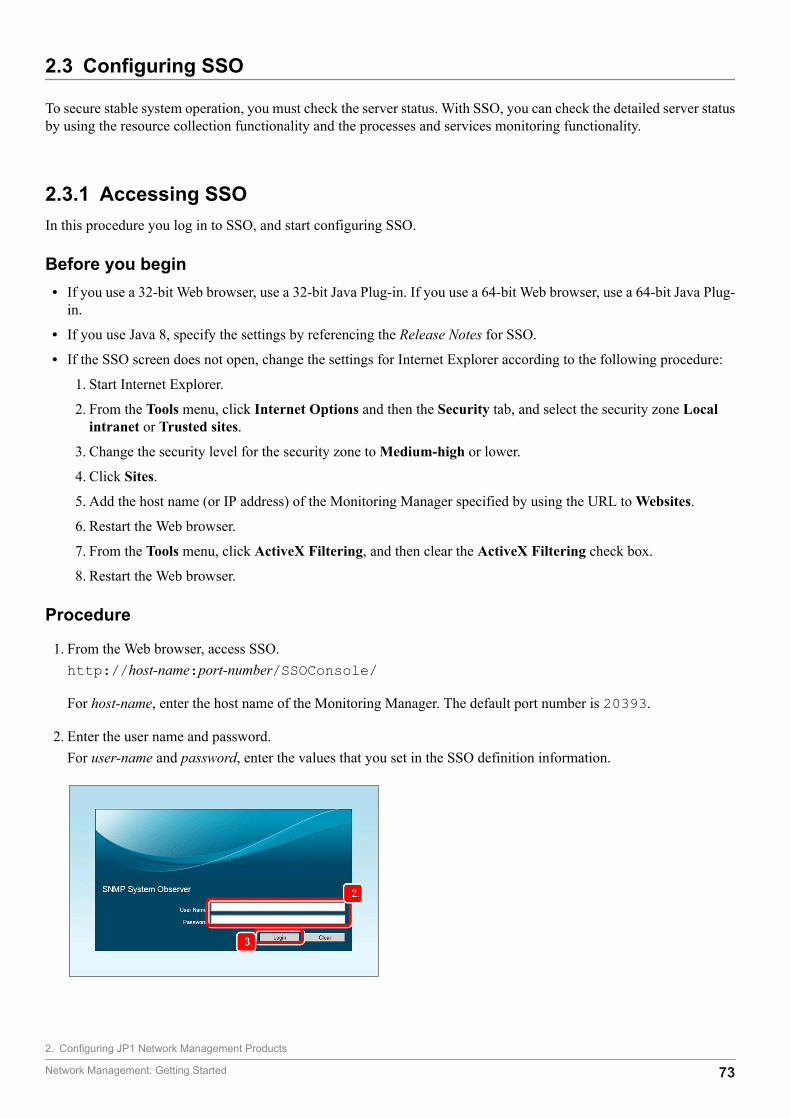
2.3 Configuring SSO
To secure stable system operation, you must check the server status. With SSO, you can check the detailed server statusby using the resource collection functionality and the processes and services monitoring functionality.
2.3.1 Accessing SSOIn this procedure you log in to SSO, and start configuring SSO.
Before you begin• If you use a 32-bit Web browser, use a 32-bit Java Plug-in. If you use a 64-bit Web browser, use a 64-bit Java Plug-
in.
• If you use Java 8, specify the settings by referencing the Release Notes for SSO.
• If the SSO screen does not open, change the settings for Internet Explorer according to the following procedure:
1. Start Internet Explorer.
2. From the Tools menu, click Internet Options and then the Security tab, and select the security zone Localintranet or Trusted sites.
3. Change the security level for the security zone to Medium-high or lower.
4. Click Sites.
5. Add the host name (or IP address) of the Monitoring Manager specified by using the URL to Websites.
6. Restart the Web browser.
7. From the Tools menu, click ActiveX Filtering, and then clear the ActiveX Filtering check box.
8. Restart the Web browser.
Procedure
1. From the Web browser, access SSO.http://host-name:port-number/SSOConsole/
For host-name, enter the host name of the Monitoring Manager. The default port number is 20393.
2. Enter the user name and password.For user-name and password, enter the values that you set in the SSO definition information.
2. Configuring JP1 Network Management Products
Network Management: Getting Started 73
3. Click Login.The SSO console is displayed.
NoteYou can also display the SSO console by selecting the Windows Start menu, Programs andFeatures, SNMP System Observer, and SSO.
Next stepsYou have now successfully logged in to SSO. In the next section, configure the settings to collect resources by usingSSO.
Related topics• (2) Setting the SSO definition information for NNMi• 2.3.2 Resource collection
2.3.2 Resource collectionBy using SSO, you can collect system resources from servers by installing an SNMP agent (ESA) on monitored servers.If you configure the time zone, interval, and period, you can collect resources at regular intervals, and view them.
(1) About resource collectionResource collection is a process for collecting system resources from the servers connected to a network and monitoringtarget resources that users arbitrarily configured.
With SSO, you can collect the user resources (resources that can be uniquely defined by a user) and system resources(performance information, statistical information, and operating information) of the network devices and various serverproducts that are supported on the OS (Windows or Linux) and SNMP, and monitor the resources in real time. Forexample, you can perform monitoring by which an incident is issued when CPU usage exceeds 90%. In addition toissuing incidents, any action can be executed automatically.
You can use SSO to collect the following resources:
• Resources related to CPU: CPU Utilization, Run Queue Length, System Calls, etc.
• Resources related to memory: Memory Utilization, Swap Utilization, etc.
• Resources related to file systems: File System Utilization, File System Available, etc.
• Resources related to networks: Interface Utilization, Interface Traffic, etc.
2. Configuring JP1 Network Management Products
Network Management: Getting Started 74
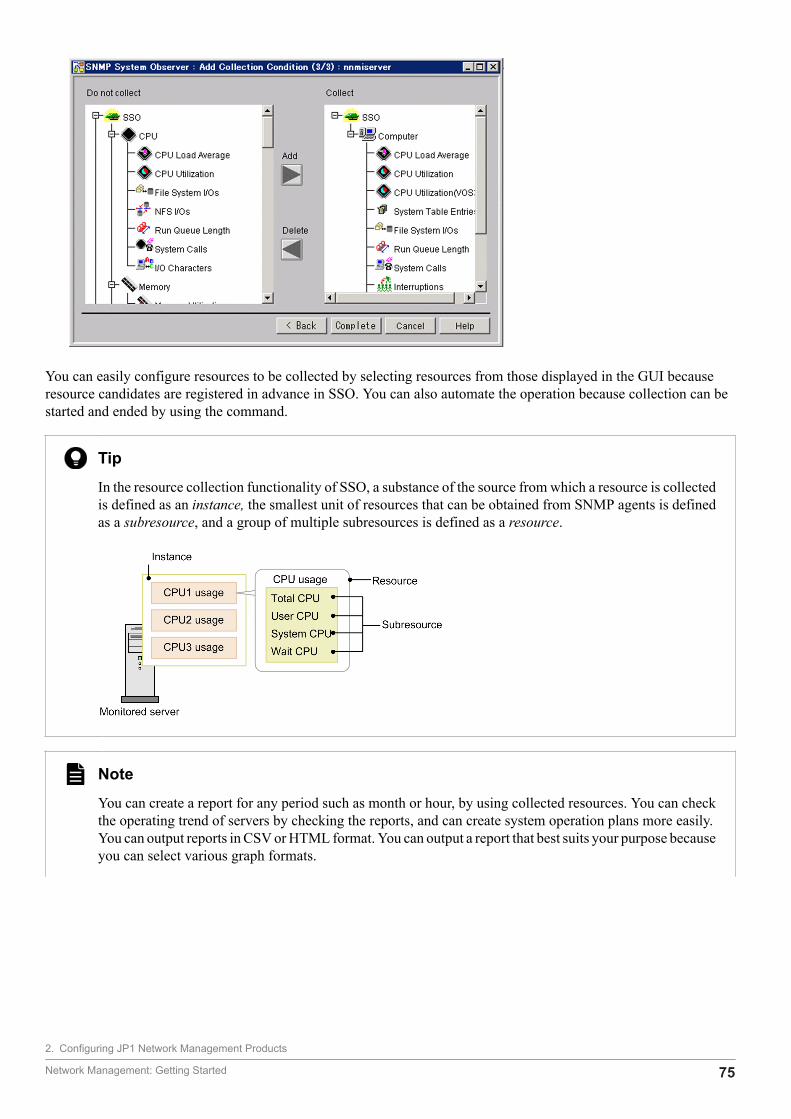
You can easily configure resources to be collected by selecting resources from those displayed in the GUI becauseresource candidates are registered in advance in SSO. You can also automate the operation because collection can bestarted and ended by using the command.
TipIn the resource collection functionality of SSO, a substance of the source from which a resource is collectedis defined as an instance, the smallest unit of resources that can be obtained from SNMP agents is definedas a subresource, and a group of multiple subresources is defined as a resource.
NoteYou can create a report for any period such as month or hour, by using collected resources. You can checkthe operating trend of servers by checking the reports, and can create system operation plans more easily.You can output reports in CSV or HTML format. You can output a report that best suits your purpose becauseyou can select various graph formats.
2. Configuring JP1 Network Management Products
Network Management: Getting Started 75
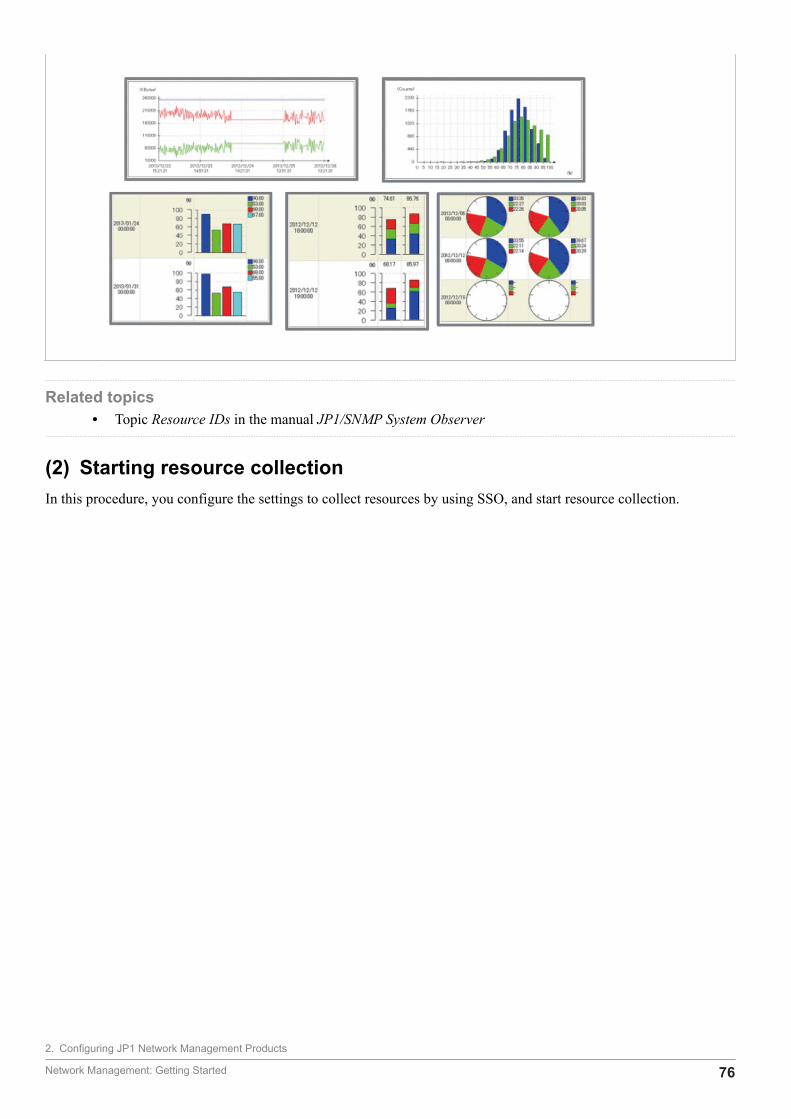
Related topics• Topic Resource IDs in the manual JP1/SNMP System Observer
(2) Starting resource collectionIn this procedure, you configure the settings to collect resources by using SSO, and start resource collection.
2. Configuring JP1 Network Management Products
Network Management: Getting Started 76
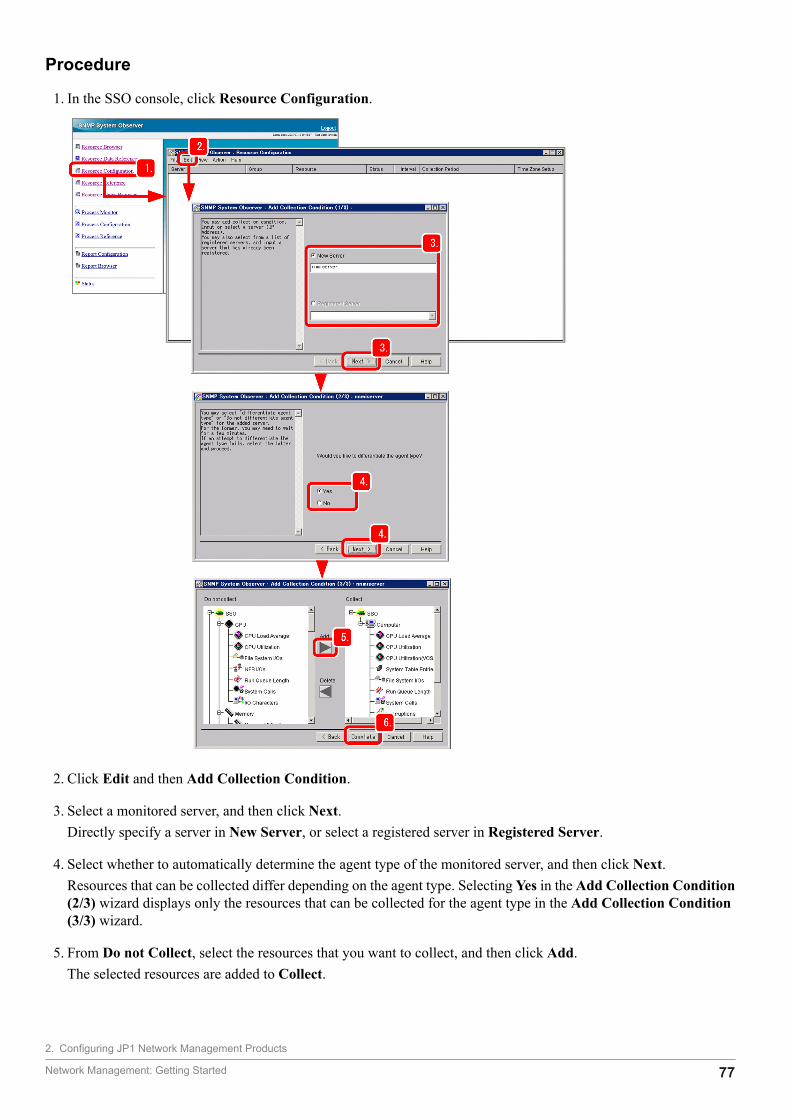
Procedure
1. In the SSO console, click Resource Configuration.
2. Click Edit and then Add Collection Condition.
3. Select a monitored server, and then click Next.Directly specify a server in New Server, or select a registered server in Registered Server.
4. Select whether to automatically determine the agent type of the monitored server, and then click Next.Resources that can be collected differ depending on the agent type. Selecting Yes in the Add Collection Condition(2/3) wizard displays only the resources that can be collected for the agent type in the Add Collection Condition(3/3) wizard.
5. From Do not Collect, select the resources that you want to collect, and then click Add.The selected resources are added to Collect.
2. Configuring JP1 Network Management Products
Network Management: Getting Started 77
6. Click Complete.Resources to be collected are configured.
7. Select the resource for which you want to set the collection conditions, and then click Edit and then ChangeCollection Detail Condition. Select the instance, subresource, and collection mode.If you do not set the collection conditions, all instances are subject to collection. For the collection mode, you canset whether to save the collected data and whether to monitor thresholds. To monitor thresholds, you also need toset the thresholds and commands that are executed when the thresholds are exceeded.
8. Click OK.Resource collection conditions are configured.
9. Click Edit and then Set Collection Time Zone.Configure the resource collection time zone if you want to collect resources in a fixed time zone every day.
10. Select the check box for the number in which you want to specify a time zone, and specify the start and stop times.For example, to collect resources during the period between 8:00 and 18:00, specify 08:00:00 for the start time,and 18:00:00 for the stop time.
11. Click OK.The resource collection time zone is configured.
TipYou can also configure collection intervals to suit your purpose. By configuring collection intervals,you can reduce the load on the system. To configure collection intervals, click Edit and then ChangeCollection Interval.
• To detect a sharp rise in the used amount or usage rate of resources, configure a short collectioninterval.
• To monitor the resource usage for a long period, configure a long collection interval.
12. From the Actions menu, click Start Collection.
13. Configure the period of time for collecting resources in Start Collection and Stop Collection fields, and then clickStart.Resource collection is started.
2. Configuring JP1 Network Management Products
Network Management: Getting Started 78
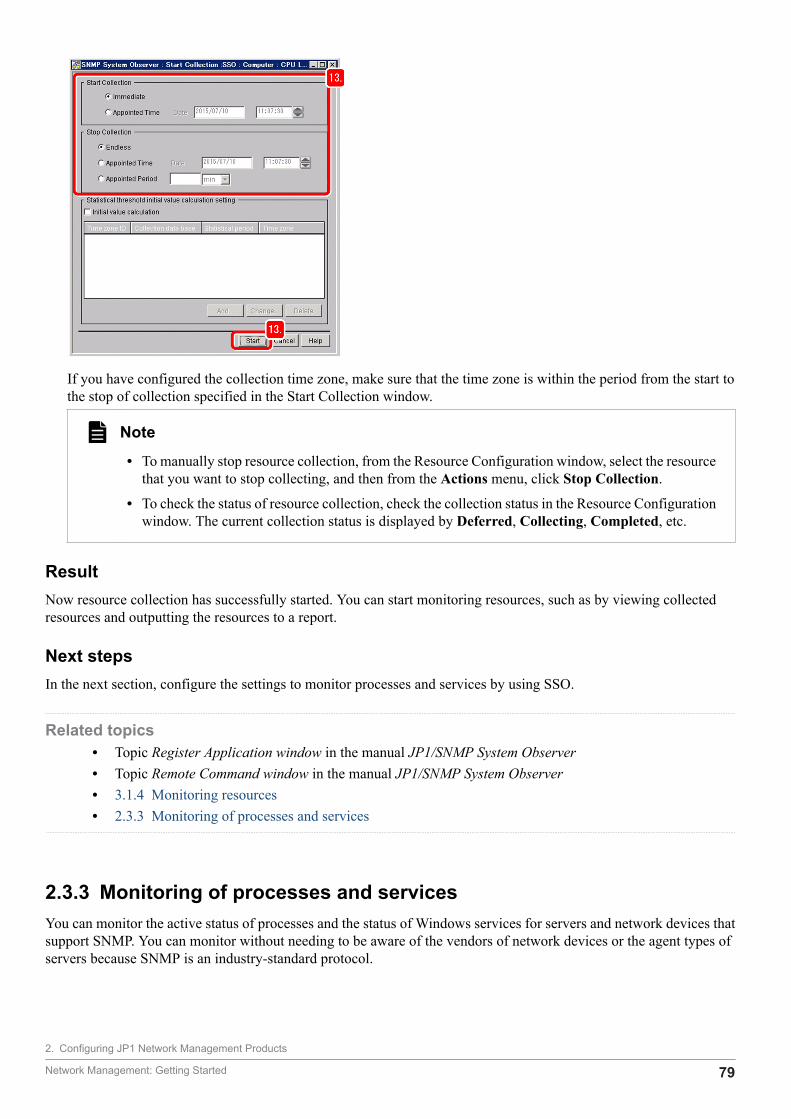
If you have configured the collection time zone, make sure that the time zone is within the period from the start tothe stop of collection specified in the Start Collection window.
Note• To manually stop resource collection, from the Resource Configuration window, select the resource
that you want to stop collecting, and then from the Actions menu, click Stop Collection.
• To check the status of resource collection, check the collection status in the Resource Configurationwindow. The current collection status is displayed by Deferred, Collecting, Completed, etc.
ResultNow resource collection has successfully started. You can start monitoring resources, such as by viewing collectedresources and outputting the resources to a report.
Next stepsIn the next section, configure the settings to monitor processes and services by using SSO.
Related topics• Topic Register Application window in the manual JP1/SNMP System Observer• Topic Remote Command window in the manual JP1/SNMP System Observer• 3.1.4 Monitoring resources• 2.3.3 Monitoring of processes and services
2.3.3 Monitoring of processes and servicesYou can monitor the active status of processes and the status of Windows services for servers and network devices thatsupport SNMP. You can monitor without needing to be aware of the vendors of network devices or the agent types ofservers because SNMP is an industry-standard protocol.
2. Configuring JP1 Network Management Products
Network Management: Getting Started 79
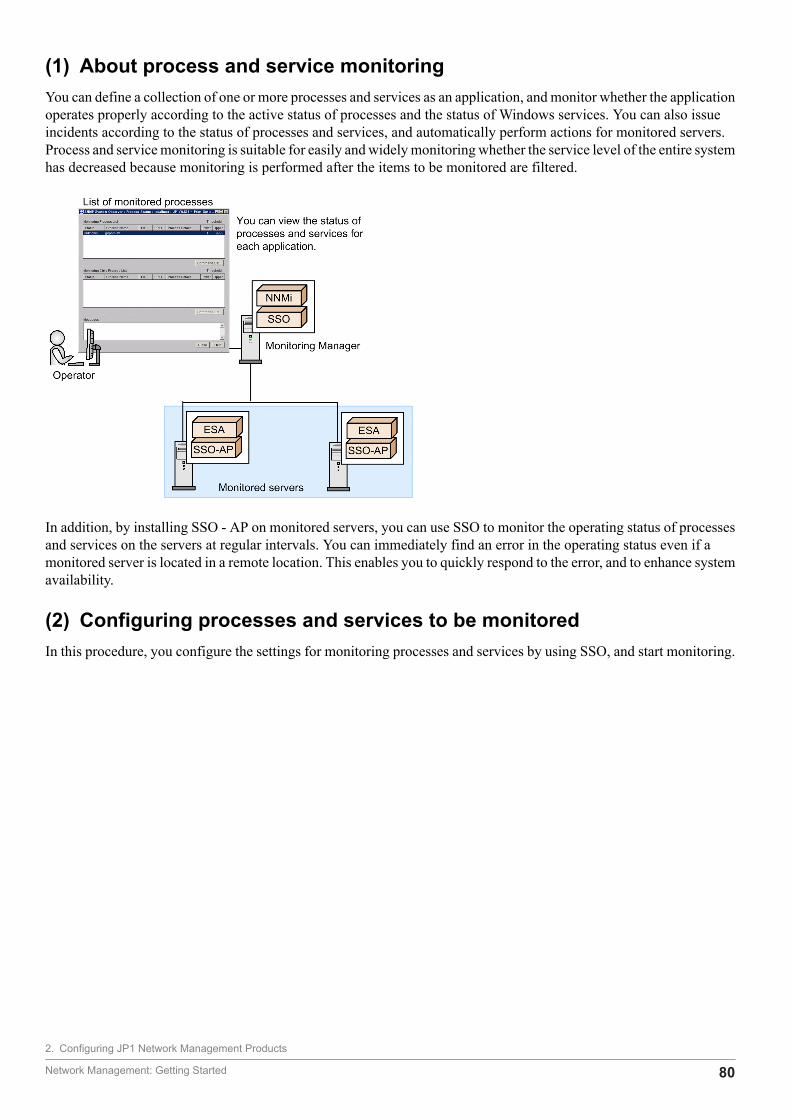
(1) About process and service monitoringYou can define a collection of one or more processes and services as an application, and monitor whether the applicationoperates properly according to the active status of processes and the status of Windows services. You can also issueincidents according to the status of processes and services, and automatically perform actions for monitored servers.Process and service monitoring is suitable for easily and widely monitoring whether the service level of the entire systemhas decreased because monitoring is performed after the items to be monitored are filtered.
In addition, by installing SSO - AP on monitored servers, you can use SSO to monitor the operating status of processesand services on the servers at regular intervals. You can immediately find an error in the operating status even if amonitored server is located in a remote location. This enables you to quickly respond to the error, and to enhance systemavailability.
(2) Configuring processes and services to be monitoredIn this procedure, you configure the settings for monitoring processes and services by using SSO, and start monitoring.
2. Configuring JP1 Network Management Products
Network Management: Getting Started 80
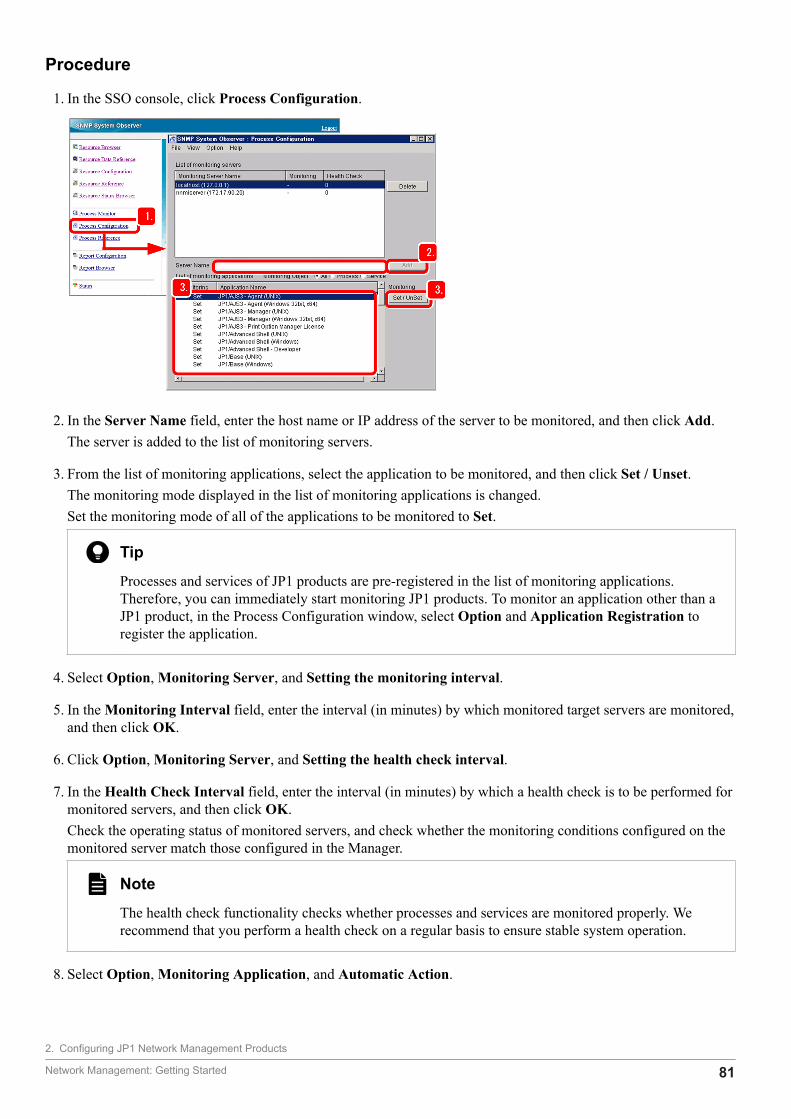
Procedure
1. In the SSO console, click Process Configuration.
2. In the Server Name field, enter the host name or IP address of the server to be monitored, and then click Add.The server is added to the list of monitoring servers.
3. From the list of monitoring applications, select the application to be monitored, and then click Set / Unset.The monitoring mode displayed in the list of monitoring applications is changed.Set the monitoring mode of all of the applications to be monitored to Set.
TipProcesses and services of JP1 products are pre-registered in the list of monitoring applications.Therefore, you can immediately start monitoring JP1 products. To monitor an application other than aJP1 product, in the Process Configuration window, select Option and Application Registration toregister the application.
4. Select Option, Monitoring Server, and Setting the monitoring interval.
5. In the Monitoring Interval field, enter the interval (in minutes) by which monitored target servers are monitored,and then click OK.
6. Click Option, Monitoring Server, and Setting the health check interval.
7. In the Health Check Interval field, enter the interval (in minutes) by which a health check is to be performed formonitored servers, and then click OK.Check the operating status of monitored servers, and check whether the monitoring conditions configured on themonitored server match those configured in the Manager.
NoteThe health check functionality checks whether processes and services are monitored properly. Werecommend that you perform a health check on a regular basis to ensure stable system operation.
8. Select Option, Monitoring Application, and Automatic Action.
2. Configuring JP1 Network Management Products
Network Management: Getting Started 81
9. Select whether to automatically execute the command when the operating status changes for each application, andthen click OK.If you select Set, in the Command field, enter the command to be automatically executed.
NoteYou can remotely execute the command on a monitored server when the operating status changes. Toremotely execute the command, in the Process Configuration window, click Option, MonitoringApplication, and Remote Command to configure the settings.
10. From the File menu, click Save.Monitoring is started for processes and services of the applications for which the monitoring mode is set to Set inthe list of monitoring applications.
NoteTo stop the monitoring of processes and services, from the list of monitoring applications in the ProcessConfiguration window, select the applications that you want to stop monitoring, and click Set / Unsetto change the mode to Unset. Clicking the File menu and then Save finishes the monitoring of processesand services.
ResultNow monitoring of processes and services has successfully started. In the SSO console, click Process Monitor to viewthe operating status of processes and services.
Next stepsYou have completed setup of the JP1 network management products. Now you need to start network monitoring byusing the JP1 network management products.
Related topics• Topic Register Application window in the manual JP1/SNMP System Observer• Topic Remote Command window in the manual JP1/SNMP System Observer• 3. Normal Operation by Using JP1 Network Management Products• 4. Troubleshooting by Using JP1 Network Management Products
2. Configuring JP1 Network Management Products
Network Management: Getting Started 82
After you start periodic monitoring of the network by using JP1 network management products, youcan view the map windows or collected resources to get an understanding of the status of the entirenetwork and start monitoring the network. In addition, to ensure continuous network management,periodically perform maintenance work.
3 Normal Operation by Using JP1 NetworkManagement Products
Network Management: Getting Started 83
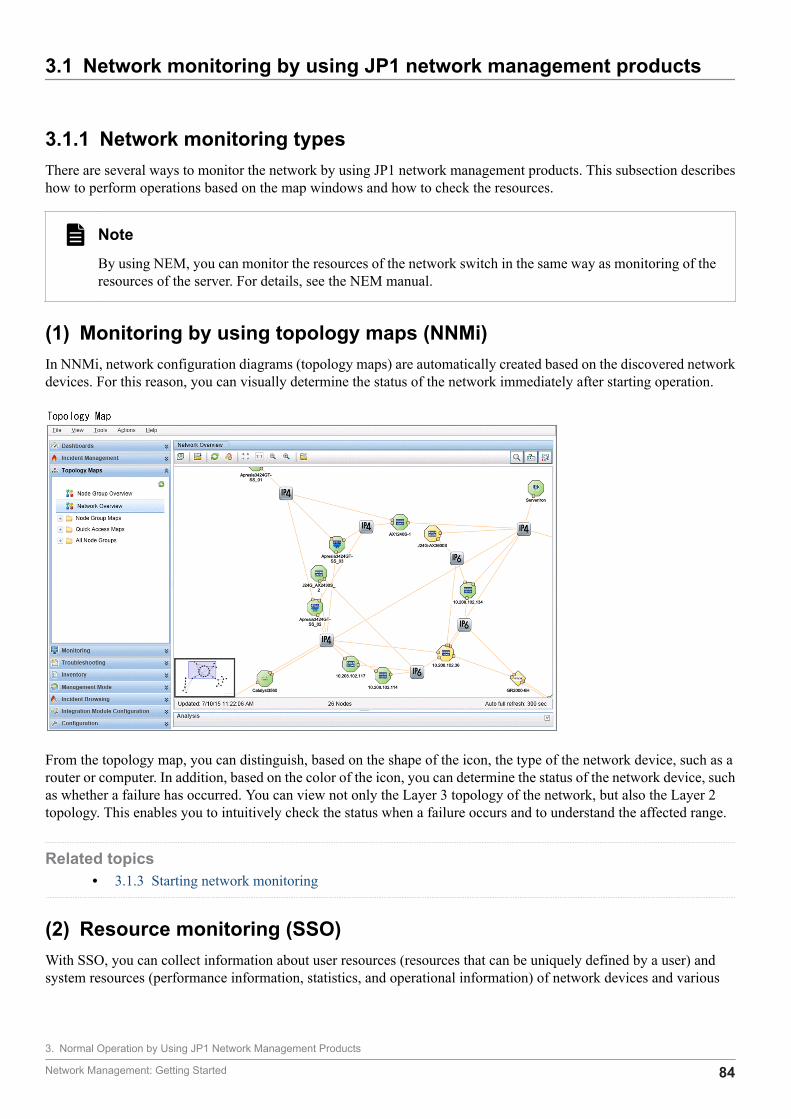
3.1 Network monitoring by using JP1 network management products
3.1.1 Network monitoring typesThere are several ways to monitor the network by using JP1 network management products. This subsection describeshow to perform operations based on the map windows and how to check the resources.
NoteBy using NEM, you can monitor the resources of the network switch in the same way as monitoring of theresources of the server. For details, see the NEM manual.
(1) Monitoring by using topology maps (NNMi)In NNMi, network configuration diagrams (topology maps) are automatically created based on the discovered networkdevices. For this reason, you can visually determine the status of the network immediately after starting operation.
From the topology map, you can distinguish, based on the shape of the icon, the type of the network device, such as arouter or computer. In addition, based on the color of the icon, you can determine the status of the network device, suchas whether a failure has occurred. You can view not only the Layer 3 topology of the network, but also the Layer 2topology. This enables you to intuitively check the status when a failure occurs and to understand the affected range.
Related topics• 3.1.3 Starting network monitoring
(2) Resource monitoring (SSO)With SSO, you can collect information about user resources (resources that can be uniquely defined by a user) andsystem resources (performance information, statistics, and operational information) of network devices and various
3. Normal Operation by Using JP1 Network Management Products
Network Management: Getting Started 84
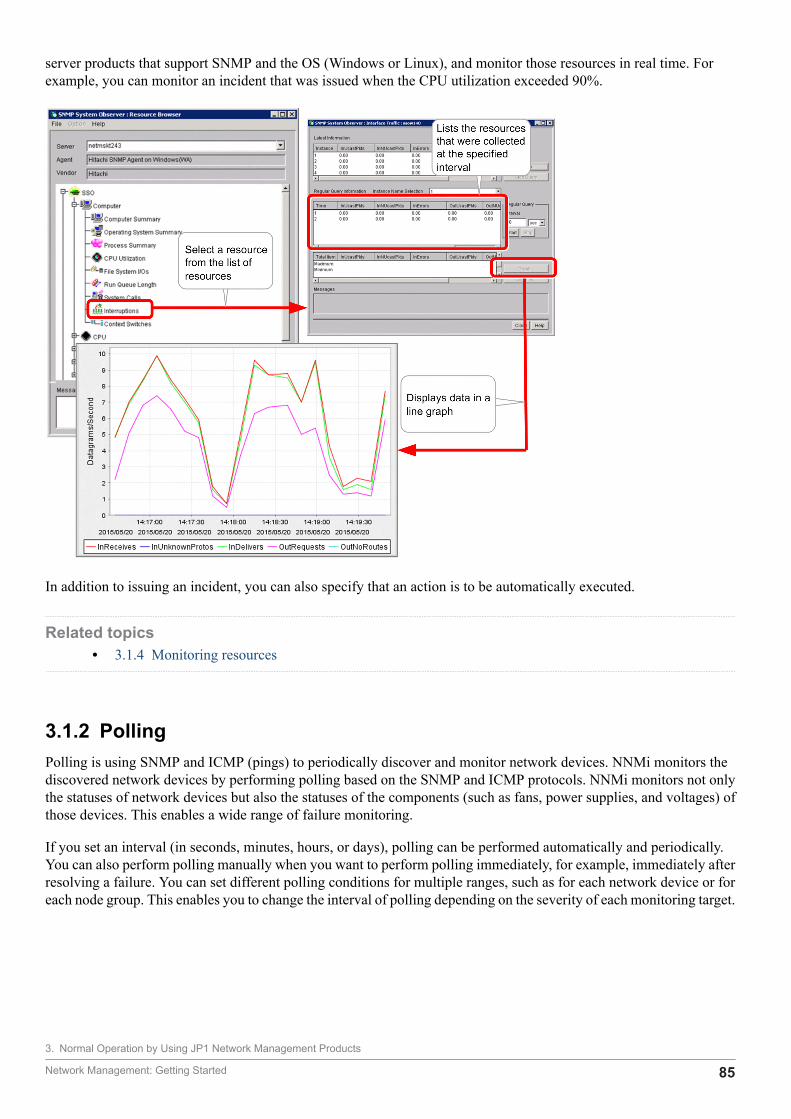
server products that support SNMP and the OS (Windows or Linux), and monitor those resources in real time. Forexample, you can monitor an incident that was issued when the CPU utilization exceeded 90%.
In addition to issuing an incident, you can also specify that an action is to be automatically executed.
Related topics• 3.1.4 Monitoring resources
3.1.2 PollingPolling is using SNMP and ICMP (pings) to periodically discover and monitor network devices. NNMi monitors thediscovered network devices by performing polling based on the SNMP and ICMP protocols. NNMi monitors not onlythe statuses of network devices but also the statuses of the components (such as fans, power supplies, and voltages) ofthose devices. This enables a wide range of failure monitoring.
If you set an interval (in seconds, minutes, hours, or days), polling can be performed automatically and periodically.You can also perform polling manually when you want to perform polling immediately, for example, immediately afterresolving a failure. You can set different polling conditions for multiple ranges, such as for each network device or foreach node group. This enables you to change the interval of polling depending on the severity of each monitoring target.
3. Normal Operation by Using JP1 Network Management Products
Network Management: Getting Started 85
NoteThere are two types of polling:
• Polling for discovery
• Polling for monitoring
The above two types of polling are referred to by the following names according to the purpose or situation:
Polling for discovery
• Discovery polling (polling performed immediately by selecting the Actions menu, Polling, and thenConfiguration Poll)
• Rediscovery polling (periodic polling to rediscover discovered nodes to check whether the configurationhas changed)
• Setting polling (polling for discovering settings)
• Finding polling (polling for finding nodes)
Polling for monitoring
• Status polling (polling performed immediately to monitor statuses by selecting the Actions menu,Polling, and then Status Poll)
• State polling (polling for monitoring states)
• Fault polling (polling for monitoring whether a failure has occurred)
• Demand polling (polling for immediate monitoring when a manual operation is performed)
3.1.3 Starting network monitoringThis subsection describes how to monitor a network by displaying the map windows (topology maps) of the networkconfiguration. NNMi performs network monitoring. For example, the operation management center always displaysthe most important map on a large screen to monitor the network. Immediately after specifying discovery settings, youcan check the progress of node discovery.
Before you beginBefore you can start monitoring the network, the person (operator) responsible for the monitoring operation must beregistered as a user.
Procedure
1. Access the NNMi console.
3. Normal Operation by Using JP1 Network Management Products
Network Management: Getting Started 86
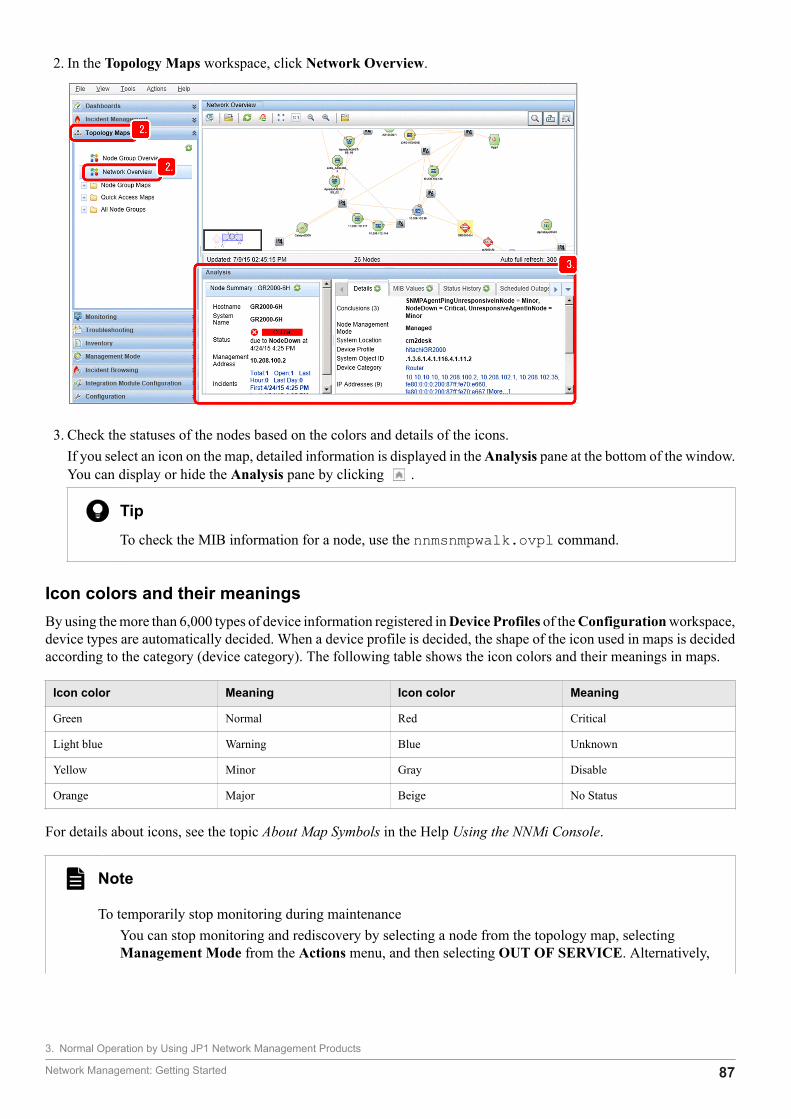
2. In the Topology Maps workspace, click Network Overview.
3. Check the statuses of the nodes based on the colors and details of the icons.If you select an icon on the map, detailed information is displayed in the Analysis pane at the bottom of the window.You can display or hide the Analysis pane by clicking .
TipTo check the MIB information for a node, use the nnmsnmpwalk.ovpl command.
Icon colors and their meaningsBy using the more than 6,000 types of device information registered in Device Profiles of the Configuration workspace,device types are automatically decided. When a device profile is decided, the shape of the icon used in maps is decidedaccording to the category (device category). The following table shows the icon colors and their meanings in maps.
Icon color Meaning Icon color Meaning
Green Normal Red Critical
Light blue Warning Blue Unknown
Yellow Minor Gray Disable
Orange Major Beige No Status
For details about icons, see the topic About Map Symbols in the Help Using the NNMi Console.
Note
To temporarily stop monitoring during maintenanceYou can stop monitoring and rediscovery by selecting a node from the topology map, selectingManagement Mode from the Actions menu, and then selecting OUT OF SERVICE. Alternatively,
3. Normal Operation by Using JP1 Network Management Products
Network Management: Getting Started 87
you can stop monitoring by using the nnmmanagementmode.ovpl command to change themanagement mode to out of service.
To resume monitoringTo resume monitoring, select the node from the topology map, select Management Mode from theActions menu, and then select Manage. Alternatively, you can resume monitoring by using thennmmanagementmode.ovpl command to change the management mode to managed.
To list the nodes that were removed from the nodes to be managedIn the Management Mode workspace, click Unmanaged Nodes.
TipIn general, a window times out if you do not perform any operations for a certain period of time. You canset the timeout time in the console timeout section that is displayed by clicking the Configurationworkspace, User Interface, and then User Interface Configuration. The default is 18 hours.
Note that a window that you open by specifying a URL will not time out. If you want to continuously displaya topology map for monitoring, specify the applicable URL.
• Network Overviewhttp://host-name:port-number/nnm/launch?cmd=showNetworkOverview
• Node Group Mapshttp://host-name:port-number/nnm/launch?cmd=showNodeGroup&name=node-group-name#
#: To include a multi-byte character in a URL, you need to URL-encode the character. Use UTF-8 encodingto URL-encode the node group name, and then specify the name.
Example: Important node%e9%87%8d%e8%a6%81%e3%81%aa%e3%83%8e%e3%83%bc%e3%83%89
In addition, to open multiple windows for monitoring, such as a topology map and an incident window,
click to display the view in a new window. Alternatively, you can display multiple windows by
entering a URL to open a window.
TipTo set the initial window that is displayed when you sign in, specify the setting in the initial view sectionthat is displayed by clicking User Interface Configuration. To display incidents, specify Open KeyIncidents. To display a map, specify Network Overview. Note that, although you can also set a node groupmap created by a user for the initial window, you can specify only the first or last item in the map list. Forthis reason, you need to adjust the Topology Maps Ordering setting in the Node Group Map Settingswindow. For details, see the Configuring the NNMi User Interface in the Help for Administrators.
Next stepsYou have now successfully displayed the topology map. Next, start monitoring the network.
3. Normal Operation by Using JP1 Network Management Products
Network Management: Getting Started 88
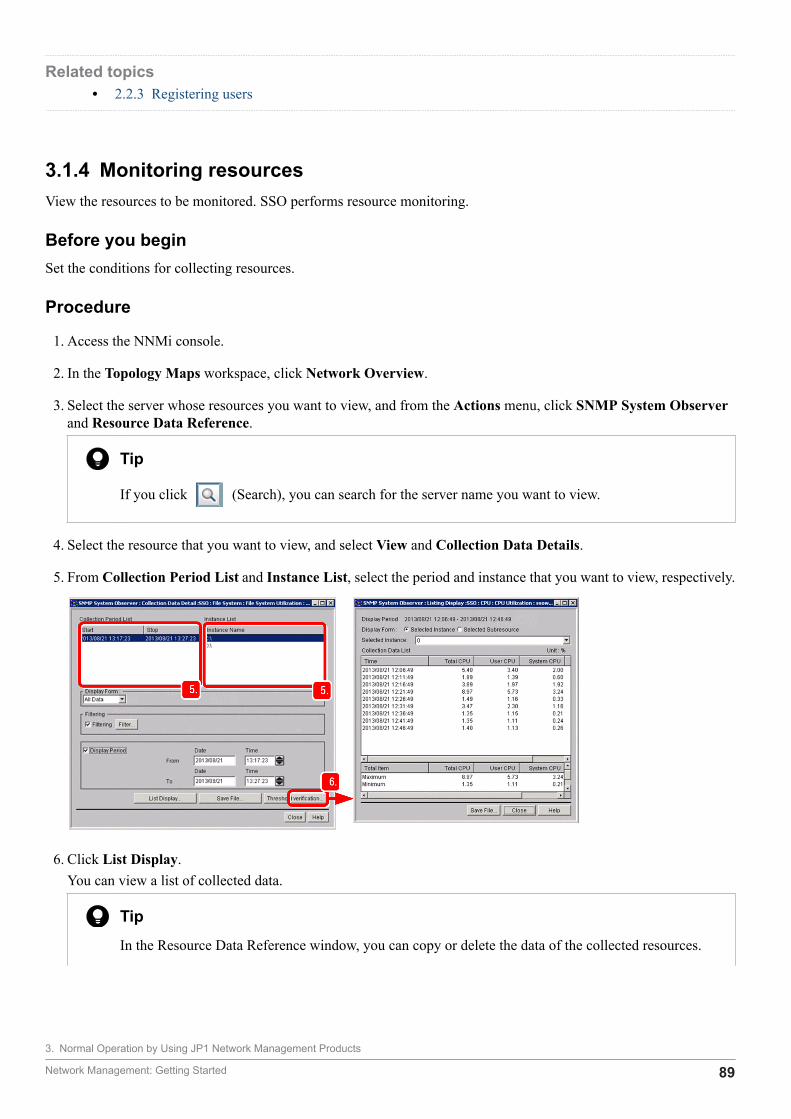
Related topics• 2.2.3 Registering users
3.1.4 Monitoring resourcesView the resources to be monitored. SSO performs resource monitoring.
Before you beginSet the conditions for collecting resources.
Procedure
1. Access the NNMi console.
2. In the Topology Maps workspace, click Network Overview.
3. Select the server whose resources you want to view, and from the Actions menu, click SNMP System Observerand Resource Data Reference.
Tip
If you click (Search), you can search for the server name you want to view.
4. Select the resource that you want to view, and select View and Collection Data Details.
5. From Collection Period List and Instance List, select the period and instance that you want to view, respectively.
6. Click List Display.You can view a list of collected data.
TipIn the Resource Data Reference window, you can copy or delete the data of the collected resources.
3. Normal Operation by Using JP1 Network Management Products
Network Management: Getting Started 89
For example, you can secure free space in the database by copying and retaining the resources only forthe period during which a problem occurred, and then deleting other unnecessary resources.
Next stepsYou have now successfully viewed information about the collected resources. If necessary, you can output informationabout the collected resources to a report to understand the operational trends of the server and to make system operationplans.
NoteYou can output information about the collected resources to a report by using Report Browser of the SSOconsole. To output a report, you need to configure the report settings in advance. For details about outputtingreports, see the topic Report Configuration window in the manual JP1/SNMP System Observer.
Related topics• 2.3.2 Resource collection• Topic Copy Collection Condition window in the manual JP1/SNMP System Observer
3. Normal Operation by Using JP1 Network Management Products
Network Management: Getting Started 90
3.2 Periodic maintenance of JP1 network management products
To continuously perform network management, periodic maintenance work is important. This section describes theoperational tasks of JP1 network management products.
3.2.1 Checking the NNMi operating statusTo manage the network, NNMi first needs to be operating normally. Make sure that NNMi is operating normally.
Procedure
1. From the Help menu, click System Information.
2. In the Product tab, check Status.Make sure the status is the normal level.
3. In the Health tab, check the detailed status of NNMi.
4. In the State Poller tab, check the operating status.
5. In the Database tab, check the number of discovered objects.
ResultYou were able to confirm that NNMi was operating normally.
TipIf a problem occurs in NNMi itself, a warning is displayed in yellow at the bottom of the NNMi console,and the NnmHealthOverallStatus incident is issued. If this incident is reported during operation, checkCustom Attributes of Incident.
Related topics• Topic Check NNMi Health in the Help for Administrators
3.2.2 Exporting or importing the NNMi settingsStoring the system settings for each important point and managing changed items are important operational tasks. WithNNMi, you can export and import system settings. This enables you to obtain a snapshot of the current system settings,and to restore settings that contain a mistake by importing settings.
Procedure
1. Execute the nnmconfigexport.ovpl command or the nnmconfigimport.ovpl command.The following table shows the execution examples of the nnmconfigexport.ovpl command and thennmconfigimport.ovpl command.
3. Normal Operation by Using JP1 Network Management Products
Network Management: Getting Started 91
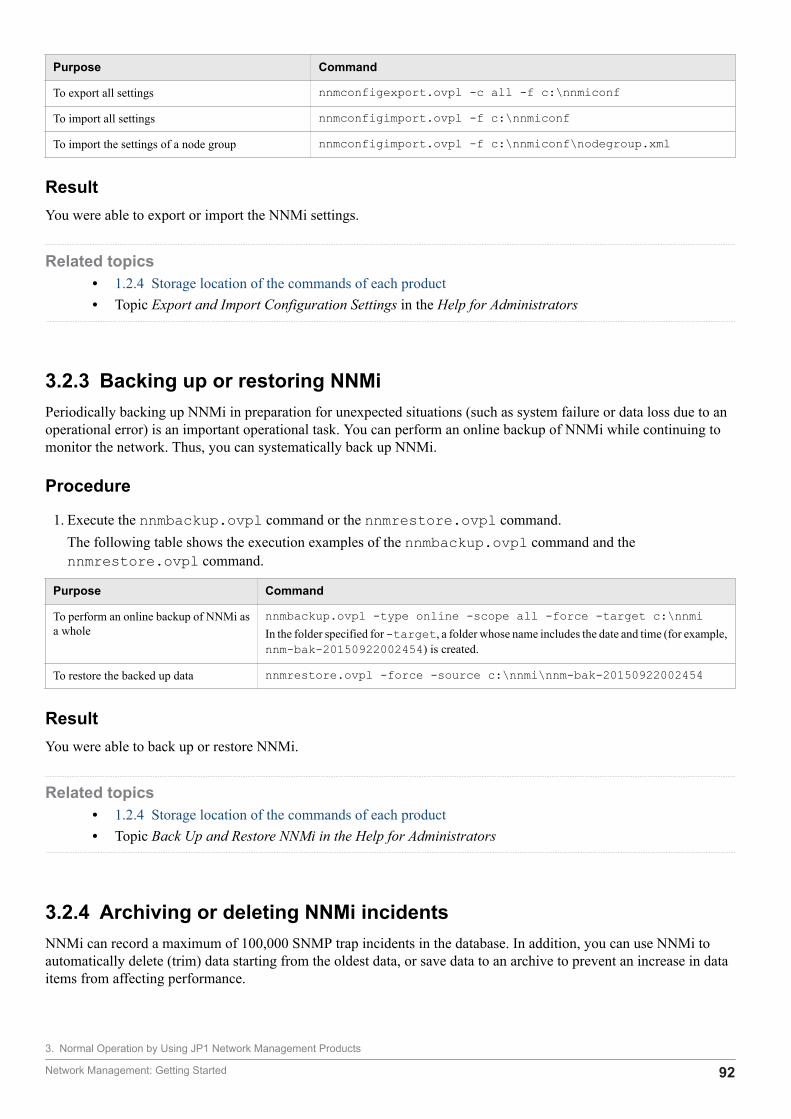
Purpose Command
To export all settings nnmconfigexport.ovpl -c all -f c:\nnmiconf
To import all settings nnmconfigimport.ovpl -f c:\nnmiconf
To import the settings of a node group nnmconfigimport.ovpl -f c:\nnmiconf\nodegroup.xml
ResultYou were able to export or import the NNMi settings.
Related topics• 1.2.4 Storage location of the commands of each product• Topic Export and Import Configuration Settings in the Help for Administrators
3.2.3 Backing up or restoring NNMiPeriodically backing up NNMi in preparation for unexpected situations (such as system failure or data loss due to anoperational error) is an important operational task. You can perform an online backup of NNMi while continuing tomonitor the network. Thus, you can systematically back up NNMi.
Procedure
1. Execute the nnmbackup.ovpl command or the nnmrestore.ovpl command.The following table shows the execution examples of the nnmbackup.ovpl command and thennmrestore.ovpl command.
Purpose Command
To perform an online backup of NNMi asa whole
nnmbackup.ovpl -type online -scope all -force -target c:\nnmiIn the folder specified for -target, a folder whose name includes the date and time (for example,nnm-bak-20150922002454) is created.
To restore the backed up data nnmrestore.ovpl -force -source c:\nnmi\nnm-bak-20150922002454
ResultYou were able to back up or restore NNMi.
Related topics• 1.2.4 Storage location of the commands of each product• Topic Back Up and Restore NNMi in the Help for Administrators
3.2.4 Archiving or deleting NNMi incidentsNNMi can record a maximum of 100,000 SNMP trap incidents in the database. In addition, you can use NNMi toautomatically delete (trim) data starting from the oldest data, or save data to an archive to prevent an increase in dataitems from affecting performance.
3. Normal Operation by Using JP1 Network Management Products
Network Management: Getting Started 92
(1) Checking the number of SNMP trap incidentsCheck the number of SNMP trap incidents.
Procedure
1. In the Incident Browsing workspace, click SNMP Traps.At the bottom of the displayed incident list, the number of SNMP trap incidents is displayed to the right of Total.
ResultYou were able to check the number of SNMP trap incidents.
NoteWhen the number of SNMP trap incidents is close to the upper limit, the following incidents are reported:
• 90% of the upper limit: SnmpTrapLimitWarning
• 95% of the upper limit: SnmpTrapLimitMajor
• Upper limit: SnmpTrapLimitCritical
Related topics• Topic Archive and Delete Incidents in the Help for Administrators
(2) Enabling the automatic trimming featureIf you enable the automatic trimming feature, data can be automatically deleted (trimmed) starting from the oldest dataor an archive can be automatically created during trimming when the number of SNMP trap incidents exceeds thespecified number. The automatic trimming feature is disabled by default. We recommend that you enable this featurefor operation.
Related topics• Topic Configuring the auto-trim oldest SNMP trap incidents feature in the JP1/Network Node Manager i
Setup Guide
3.2.5 Periodically deleting SSO collection dataThe amount of data in the SSO collection database monotonically increases because the database does not have aretention period. Thus, as SSO continues to collect data and the size of the database increases, the collection or deletionperformance of the database might decrease significantly. For this reason, we recommend that you periodically back upthe database or delete collection data to maintain the performance of the collection database. Set the retention period ofthe collection data to a maximum of one year.
3. Normal Operation by Using JP1 Network Management Products
Network Management: Getting Started 93

Procedure
1. Execute the ssodbdel command.The following shows an execution example of the command to delete collection data for which the retention periodhas expired:ssodbdel -all -stop BMONTH 13When you execute this command, of the data in the collection database, data for which the retention period (of oneyear) has expired is deleted. If you execute this command on the first day of every month, the collection databasewill store data only for about one year.
ResultYou were able to delete SSO collection data.
Related topics• 1.2.4 Storage location of the commands of each product• Topic ssodbdel in the manual JP1/SNMP System Observer
3. Normal Operation by Using JP1 Network Management Products
Network Management: Getting Started 94
This chapter describes how to use the incident management features of JP1 network managementproducts to quickly identify and solve failures.
4 Troubleshooting by Using JP1 NetworkManagement Products
Network Management: Getting Started 95

4.1 Analyzing the root cause of a failure
When a failure occurs, the Monitoring Manager uses the functionality for analyzing root causes to investigate and filterthe correlations among the large number of events that occur. The Monitoring Manager analyzes the failure based onthe Layer 2 topology and Layer 3 topology to identify the root cause, and then reports the root cause as an incident. TheMonitoring Manager manages the progress of incident handling (lifecycle state), from the occurrence of the problemto its solution.
The following uses an example of monitoring a network device (router) to check how to analyze the root cause.
1. If the Router03 node goes down, there is no response from a large number of interfaces and IP addresses that Router03has.
2. A large number of failure events occur due to interface failures and no response from IP addresses.
3. The Monitoring Manager decides that the lack of responses from IP addresses was caused by the interface failures,and then suppresses the corresponding incidents.
4. Based on the fact that communication was lost at neighboring nodes, the Monitoring Manager decides the root causeis the Router03 node going down. The Monitoring Manager also decides that the interface failures were caused bythe node going down, and associates the interface failures with the Router03 node going down.
5. The Router03 node going down is reported as the root-cause incident.
In addition, the Monitoring Manager effectively uses Layer 2 topology information to analyze the root cause even formultiple nodes that compose a network. The following table shows examples of analyzing the root cause by using aLayer 2 topology network configuration.
4. Troubleshooting by Using JP1 Network Management Products
Network Management: Getting Started 96
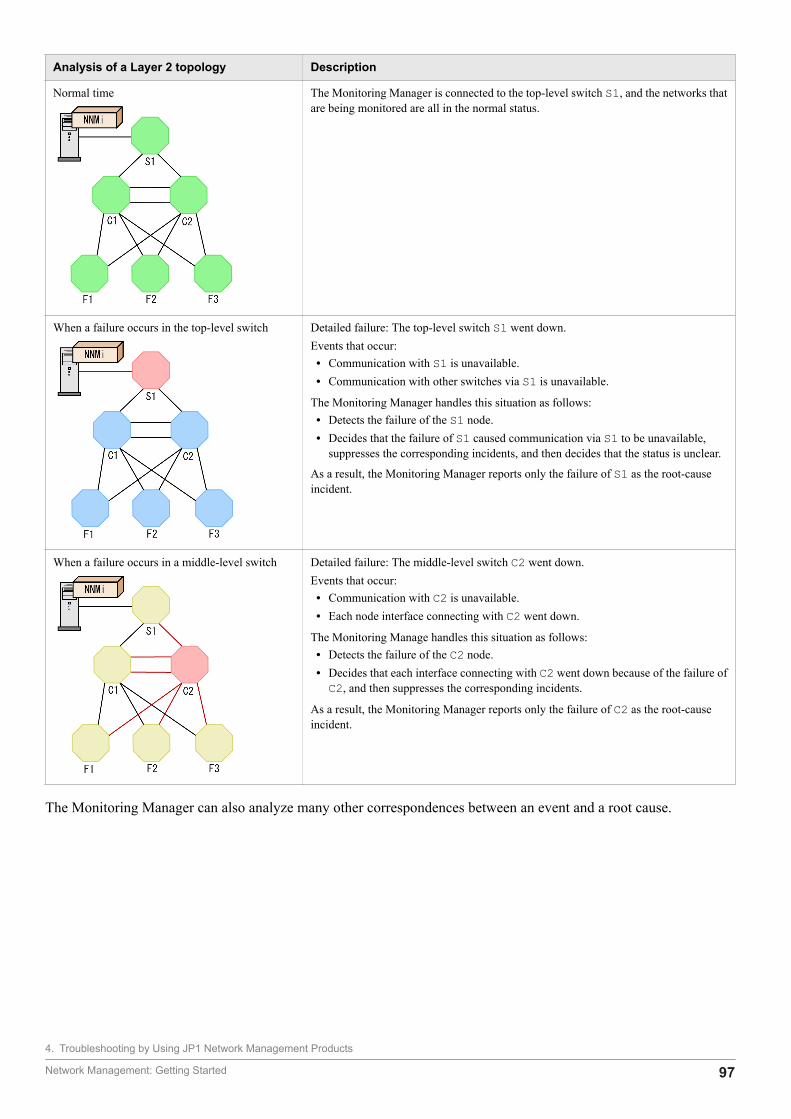
Analysis of a Layer 2 topology Description
Normal time The Monitoring Manager is connected to the top-level switch S1, and the networks thatare being monitored are all in the normal status.
When a failure occurs in the top-level switch Detailed failure: The top-level switch S1 went down.Events that occur:• Communication with S1 is unavailable.• Communication with other switches via S1 is unavailable.
The Monitoring Manager handles this situation as follows:• Detects the failure of the S1 node.• Decides that the failure of S1 caused communication via S1 to be unavailable,
suppresses the corresponding incidents, and then decides that the status is unclear.
As a result, the Monitoring Manager reports only the failure of S1 as the root-causeincident.
When a failure occurs in a middle-level switch Detailed failure: The middle-level switch C2 went down.Events that occur:• Communication with C2 is unavailable.• Each node interface connecting with C2 went down.
The Monitoring Manage handles this situation as follows:• Detects the failure of the C2 node.• Decides that each interface connecting with C2 went down because of the failure ofC2, and then suppresses the corresponding incidents.
As a result, the Monitoring Manager reports only the failure of C2 as the root-causeincident.
The Monitoring Manager can also analyze many other correspondences between an event and a root cause.
4. Troubleshooting by Using JP1 Network Management Products
Network Management: Getting Started 97
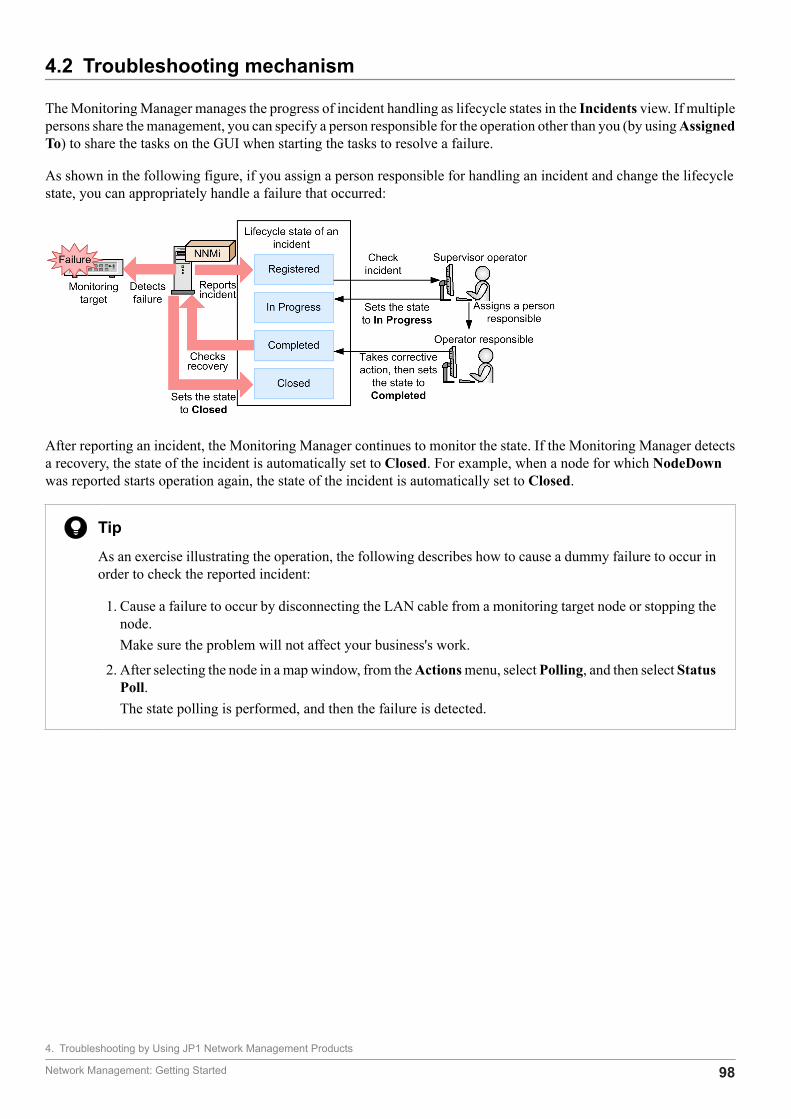
4.2 Troubleshooting mechanism
The Monitoring Manager manages the progress of incident handling as lifecycle states in the Incidents view. If multiplepersons share the management, you can specify a person responsible for the operation other than you (by using AssignedTo) to share the tasks on the GUI when starting the tasks to resolve a failure.
As shown in the following figure, if you assign a person responsible for handling an incident and change the lifecyclestate, you can appropriately handle a failure that occurred:
After reporting an incident, the Monitoring Manager continues to monitor the state. If the Monitoring Manager detectsa recovery, the state of the incident is automatically set to Closed. For example, when a node for which NodeDownwas reported starts operation again, the state of the incident is automatically set to Closed.
TipAs an exercise illustrating the operation, the following describes how to cause a dummy failure to occur inorder to check the reported incident:
1. Cause a failure to occur by disconnecting the LAN cable from a monitoring target node or stopping thenode.Make sure the problem will not affect your business's work.
2. After selecting the node in a map window, from the Actions menu, select Polling, and then select StatusPoll.The state polling is performed, and then the failure is detected.
4. Troubleshooting by Using JP1 Network Management Products
Network Management: Getting Started 98
4.3 Troubleshooting a network failure
You can use several methods to troubleshoot a network failure. This section describes how to handle a network devicenode going down, and how to handle an abnormal operating status of a process or service.
4.3.1 Handling a network device node that is going downIf an incident reports a network device node going down, you need to check the location that has the problem, and thentake corrective action.
Procedure
1. Use the topology map of the NNMi console to check the location in which a failure occurred.When a failure is detected, the color of an icon on the map changes.If you put maps into a hierarchy, open the child node group to check the status. For the status of a node group, themost critical status is displayed. The statuses of child node groups are applied to the parent node group.
2. Open the Incident Browsing workspace to check the incident that was reported as the root cause.Open the Open Key Incidents view or the All Incidents view to reference the content of the incident, and thencheck the location that has the problem. If you select the target node, and then open the Incident tab, you can checkoccurrence of the incidents in chronological order. First, check Source Node, Source Object, and CustomAttributes.
3. Double-click the incident to check detailed information about the incident.The Incident view is displayed. Use the message and name information to check the type of the incident. Use thesource node information to check the location where the failure occurred. Use the date and time information to checkthe time when the failure occurred.
NoteFor an SNMP trap incident, use the Custom Attributes tab to check the detailed information. In theCustom Attributes tab, the information reported by an SNMP trap is displayed. Check the content byreferring to the documentation of the devices that issued the SNMP trap.
4. Set Lifecycle State of the incident to In Progress.After you understand the details of the problem, from the Lifecycle State pull-down menu, select a state. Immediatelyafter an incident is registered, the state is set to Registered.
4. Troubleshooting by Using JP1 Network Management Products
Network Management: Getting Started 99
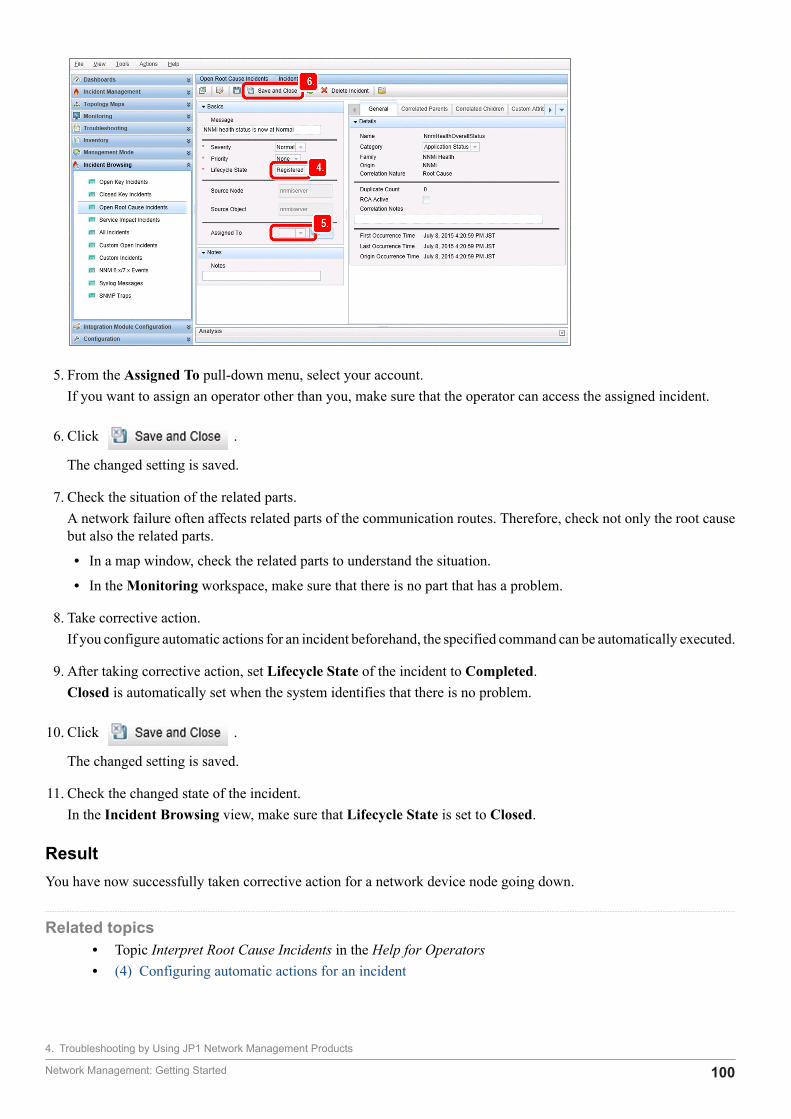
5. From the Assigned To pull-down menu, select your account.If you want to assign an operator other than you, make sure that the operator can access the assigned incident.
6. Click .
The changed setting is saved.
7. Check the situation of the related parts.A network failure often affects related parts of the communication routes. Therefore, check not only the root causebut also the related parts.
• In a map window, check the related parts to understand the situation.
• In the Monitoring workspace, make sure that there is no part that has a problem.
8. Take corrective action.If you configure automatic actions for an incident beforehand, the specified command can be automatically executed.
9. After taking corrective action, set Lifecycle State of the incident to Completed.Closed is automatically set when the system identifies that there is no problem.
10. Click .
The changed setting is saved.
11. Check the changed state of the incident.In the Incident Browsing view, make sure that Lifecycle State is set to Closed.
ResultYou have now successfully taken corrective action for a network device node going down.
Related topics• Topic Interpret Root Cause Incidents in the Help for Operators• (4) Configuring automatic actions for an incident
4. Troubleshooting by Using JP1 Network Management Products
Network Management: Getting Started 100
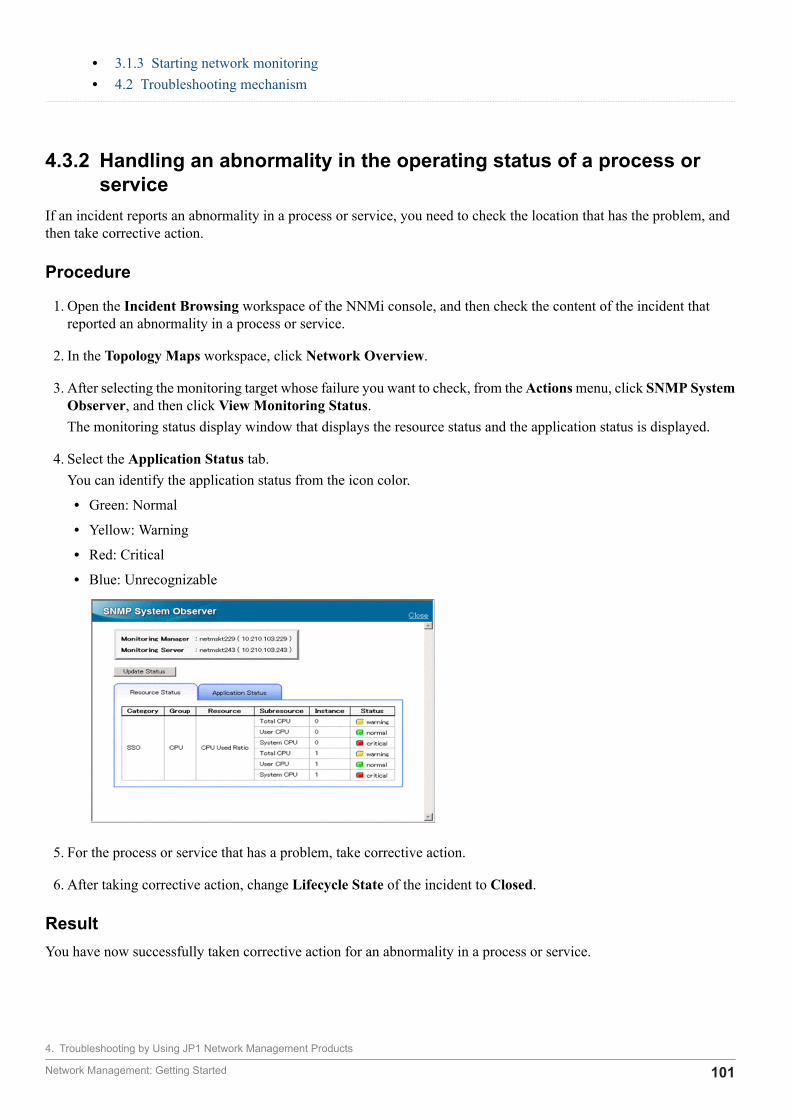
• 3.1.3 Starting network monitoring• 4.2 Troubleshooting mechanism
4.3.2 Handling an abnormality in the operating status of a process orservice
If an incident reports an abnormality in a process or service, you need to check the location that has the problem, andthen take corrective action.
Procedure
1. Open the Incident Browsing workspace of the NNMi console, and then check the content of the incident thatreported an abnormality in a process or service.
2. In the Topology Maps workspace, click Network Overview.
3. After selecting the monitoring target whose failure you want to check, from the Actions menu, click SNMP SystemObserver, and then click View Monitoring Status.The monitoring status display window that displays the resource status and the application status is displayed.
4. Select the Application Status tab.You can identify the application status from the icon color.
• Green: Normal
• Yellow: Warning
• Red: Critical
• Blue: Unrecognizable
5. For the process or service that has a problem, take corrective action.
6. After taking corrective action, change Lifecycle State of the incident to Closed.
ResultYou have now successfully taken corrective action for an abnormality in a process or service.
4. Troubleshooting by Using JP1 Network Management Products
Network Management: Getting Started 101

Related topics• 4.3.1 Handling a network device node that is going down
4. Troubleshooting by Using JP1 Network Management Products
Network Management: Getting Started 102

Appendixes
Network Management: Getting Started 103

A. Advanced Use
This appendix provides reference information for making full use of JP1 network management products.
Introduction to NNMi AdvancedAmong the JP1 network products, NNMi Advanced is provided as a higher-level version of NNMi and enablesmonitoring that supports advanced network technology. The following table describes the main functionalities of NNMiAdvanced.
Functionality Description
Global network management Enables central management by using a regional manager to monitor each site and a globalmanager to control the regional managers. A global manager can be used to manage a maximumof 65,000 nodes.
IPv6 network management Enables efficient and unified management of next-generation networks and existing networks,because NNMi Advanced can manage IPv6 and IPv4 networks at the same time.
VMware ESX server management Enables automatic identification of ESX hosts and virtual machines in the same way asautomatic identification of routers and switches, and enables you to manage inventoryinformation in a list.
Link aggregation management Automatically recognizes aggregated link configurations. In maps, aggregated links aredisplayed as thick lines.
Redundant router management Automatically recognizes the configuration of a redundant router group. In addition, thisfunctionality enables you to monitor whether a router group routes packets appropriately.
For details, see the JP1/Network Node Manager i Setup Guide.
Introduction to operational methodsThe following table provides examples of how to use the JP1 network management products. For details, see the locationslisted in the Reference column.
Case example Description Reference
I want to try out the product. Is it easy tostart using the products immediately?
To start using the products, perform the following three steps:1. In Communication Configuration, configure the SNMP
community strings.2. In Discovery Configuration, specify the range of IP addresses to
be automatically discovered, enable ping sweeps, and then enableSNMP node discovery.
3. In the Topology Maps work space, open Network Overview tostart operations.
2.2.42.2.53.1.3
No nodes were discovered. In Discovery Configuration, specify the range of IP addresses to bediscovered, and then specify the discovery seed used as the startingpoint of discovery. You can check the discovery status from TopologyMaps or Inventory. You can also check the status of the discoveryprocessing by clicking the Help menu, System Information, and thenState Poller.
2.2.5
Only routers and switches werediscovered.
By default, only routers and switches will be discovered.To change this setting, in Discovery Configuration, select Auto-Discovery Rules, and then select the Discover Any SNMP Device andDiscover Non-SNMP Devices check boxes as needed.
2.2.5
After node groups were defined, thetopology map became hard to read because
If you specify a blank for Topology Maps Ordering of a node groupmap, the topology map name of the node group map will not be
2.2.6
A. Advanced Use
Network Management: Getting Started 104

Case example Description Reference
too many topology map names weredisplayed.
displayed in the Quick Access Maps folder under the Topology Mapsworkspace.
2.2.6
It is impossible to communicate with anode, but the status is determined to beunrecognized (blue icon) instead ofcritical.
For example, if a failure occurs on a switch located in the middle of anetwork route and communication with a certain node becomesunavailable, NNMi determines the switch to be the root cause andreports an incident. In addition, the statuses of nodes with whichcommunication has become unavailable due to the failure aredetermined to be unrecognized. To report an incident whencommunication becomes unavailable, use important nodes.
2.2.62.2.8
How can I specify the IP address of theSNMP manager (NNMi)?
To specify the IP address of the SNMP manager (to permit a connection)in the SNMP settings on the SNMP agent side, specify all IP addressesof the NNMi manager, because an IP address that corresponds to thedestination IP address will be dynamically selected depending on thenetwork routing settings of the OS.To revise the IP address, specify the IP address for NNM_INTERFACEin the ov.conf file. Adjust the routing settings of the OS to enablecommunication by using the fixed IP address.
Release Notes
An SNMP trap was issued, but it was notreported as an incident.
To report an SNMP trap as an incident when NNMi receives the SNMPtrap, the node must have already been discovered and an incident forthe relevant SNMP trap must already be defined and enabled. To changea trap issued from an undiscovered node to an incident, from IncidentConfiguration, clear the Discard Unresolved SNMP Traps andSyslog Messages check box.
Topic HandleUnresolved IncomingTraps in the Help forAdministrators
I want to create a list of servers orincidents.
In a window (such as the inventory window) where data is displayedin table format, you can output the data to a file in CSV format. To dothis, for example, in the Inventory workspace, open Nodes, and thenperform the following operations:
1. Select the row that you want to output.2. Right-click the row, and then select Export to CSV from the
displayed menu.3. Perform operations according to the displayed information.
Import the output data into a spreadsheet application to create a list.You can create a list of nodes from data in the Nodes view, and a listof incidents from data in the Management Event Configuration view.
Topic Export TableInformation in theHelp Using the NNMiConsole
A. Advanced Use
Network Management: Getting Started 105

B. Version Changes
B.1 Changes in version 11-10
(1) Changes in manual 3021-3-A71-10(E)• Windows Server 2016 is now supported.
• The following browser is no longer supported:
• Internet Explorer 9
• Supported Firefox versions were changed.
B. Version Changes
Network Management: Getting Started 106
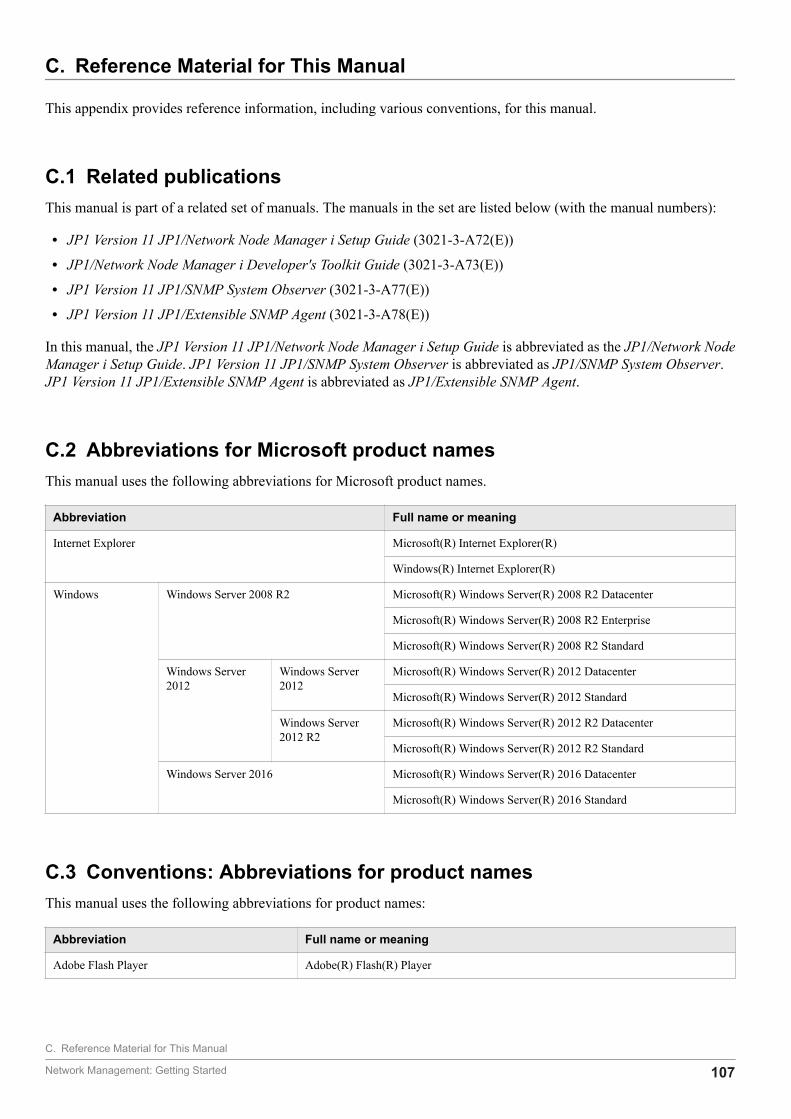
C. Reference Material for This Manual
This appendix provides reference information, including various conventions, for this manual.
C.1 Related publicationsThis manual is part of a related set of manuals. The manuals in the set are listed below (with the manual numbers):
• JP1 Version 11 JP1/Network Node Manager i Setup Guide (3021-3-A72(E))
• JP1/Network Node Manager i Developer's Toolkit Guide (3021-3-A73(E))
• JP1 Version 11 JP1/SNMP System Observer (3021-3-A77(E))
• JP1 Version 11 JP1/Extensible SNMP Agent (3021-3-A78(E))
In this manual, the JP1 Version 11 JP1/Network Node Manager i Setup Guide is abbreviated as the JP1/Network NodeManager i Setup Guide. JP1 Version 11 JP1/SNMP System Observer is abbreviated as JP1/SNMP System Observer.JP1 Version 11 JP1/Extensible SNMP Agent is abbreviated as JP1/Extensible SNMP Agent.
C.2 Abbreviations for Microsoft product namesThis manual uses the following abbreviations for Microsoft product names.
Abbreviation Full name or meaning
Internet Explorer Microsoft(R) Internet Explorer(R)
Windows(R) Internet Explorer(R)
Windows Windows Server 2008 R2 Microsoft(R) Windows Server(R) 2008 R2 Datacenter
Microsoft(R) Windows Server(R) 2008 R2 Enterprise
Microsoft(R) Windows Server(R) 2008 R2 Standard
Windows Server2012
Windows Server2012
Microsoft(R) Windows Server(R) 2012 Datacenter
Microsoft(R) Windows Server(R) 2012 Standard
Windows Server2012 R2
Microsoft(R) Windows Server(R) 2012 R2 Datacenter
Microsoft(R) Windows Server(R) 2012 R2 Standard
Windows Server 2016 Microsoft(R) Windows Server(R) 2016 Datacenter
Microsoft(R) Windows Server(R) 2016 Standard
C.3 Conventions: Abbreviations for product namesThis manual uses the following abbreviations for product names:
Abbreviation Full name or meaning
Adobe Flash Player Adobe(R) Flash(R) Player
C. Reference Material for This Manual
Network Management: Getting Started 107
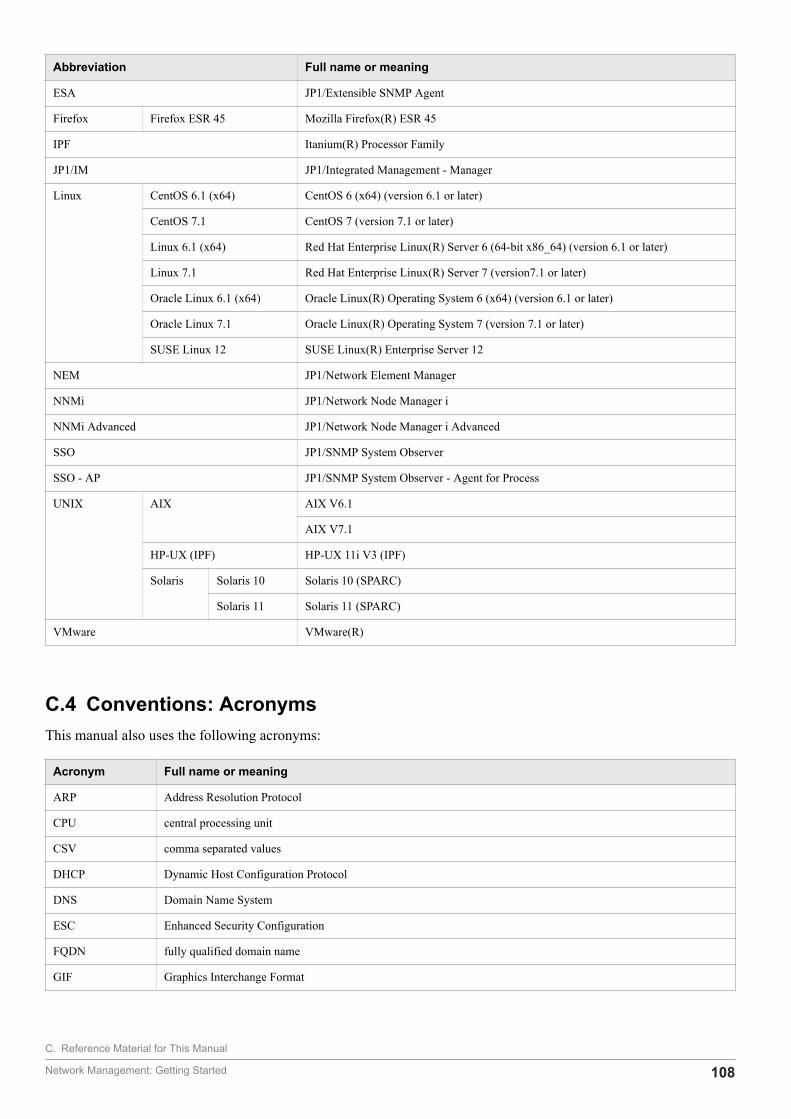
Abbreviation Full name or meaning
ESA JP1/Extensible SNMP Agent
Firefox Firefox ESR 45 Mozilla Firefox(R) ESR 45
IPF Itanium(R) Processor Family
JP1/IM JP1/Integrated Management - Manager
Linux CentOS 6.1 (x64) CentOS 6 (x64) (version 6.1 or later)
CentOS 7.1 CentOS 7 (version 7.1 or later)
Linux 6.1 (x64) Red Hat Enterprise Linux(R) Server 6 (64-bit x86_64) (version 6.1 or later)
Linux 7.1 Red Hat Enterprise Linux(R) Server 7 (version7.1 or later)
Oracle Linux 6.1 (x64) Oracle Linux(R) Operating System 6 (x64) (version 6.1 or later)
Oracle Linux 7.1 Oracle Linux(R) Operating System 7 (version 7.1 or later)
SUSE Linux 12 SUSE Linux(R) Enterprise Server 12
NEM JP1/Network Element Manager
NNMi JP1/Network Node Manager i
NNMi Advanced JP1/Network Node Manager i Advanced
SSO JP1/SNMP System Observer
SSO - AP JP1/SNMP System Observer - Agent for Process
UNIX AIX AIX V6.1
AIX V7.1
HP-UX (IPF) HP-UX 11i V3 (IPF)
Solaris Solaris 10 Solaris 10 (SPARC)
Solaris 11 Solaris 11 (SPARC)
VMware VMware(R)
C.4 Conventions: AcronymsThis manual also uses the following acronyms:
Acronym Full name or meaning
ARP Address Resolution Protocol
CPU central processing unit
CSV comma separated values
DHCP Dynamic Host Configuration Protocol
DNS Domain Name System
ESC Enhanced Security Configuration
FQDN fully qualified domain name
GIF Graphics Interchange Format
C. Reference Material for This Manual
Network Management: Getting Started 108

Acronym Full name or meaning
GUI graphical user interface
HTML Hypertext Markup Language
HTTP Hypertext Transfer Protocol
HTTPS Hypertext Transfer Protocol over SSL
ICMP Internet Control Message Protocol
IP Internet Protocol
IPv4 Internet Protocol version 4
IPv6 Internet Protocol version 6
LAN local area network
LLDP Link Layer Discovery Protocol
MAC media access control
MIB management information base
OS operating system
PC personal computer
SNMP Simple Network Management Protocol
TCP Transmission Control Protocol
UDP User Datagram Protocol
URL uniform resource locator
UTF Unicode Transformation Format
VPN virtual private network
WWW World Wide Web
C.5 Conventions: KB, MB, GB, and TBThis manual uses the following conventions:
• 1 KB (kilobyte) is 1,024 bytes.
• 1 MB (megabyte) is 1,0242 bytes
• 1 GB (gigabyte) is 1,0243 bytes.
• 1 TB (terabyte) is 1,0244 bytes.
C. Reference Material for This Manual
Network Management: Getting Started 109
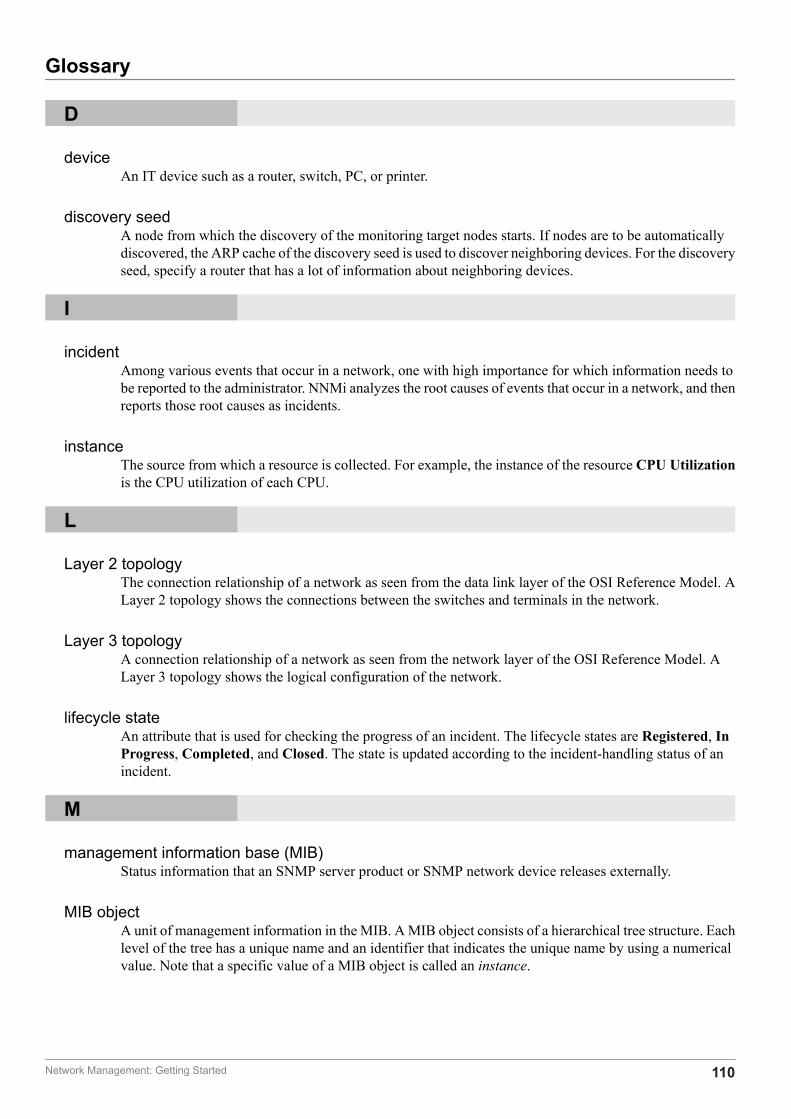
Glossary
deviceAn IT device such as a router, switch, PC, or printer.
discovery seedA node from which the discovery of the monitoring target nodes starts. If nodes are to be automaticallydiscovered, the ARP cache of the discovery seed is used to discover neighboring devices. For the discoveryseed, specify a router that has a lot of information about neighboring devices.
incidentAmong various events that occur in a network, one with high importance for which information needs tobe reported to the administrator. NNMi analyzes the root causes of events that occur in a network, and thenreports those root causes as incidents.
instanceThe source from which a resource is collected. For example, the instance of the resource CPU Utilizationis the CPU utilization of each CPU.
Layer 2 topologyThe connection relationship of a network as seen from the data link layer of the OSI Reference Model. ALayer 2 topology shows the connections between the switches and terminals in the network.
Layer 3 topologyA connection relationship of a network as seen from the network layer of the OSI Reference Model. ALayer 3 topology shows the logical configuration of the network.
lifecycle stateAn attribute that is used for checking the progress of an incident. The lifecycle states are Registered, InProgress, Completed, and Closed. The state is updated according to the incident-handling status of anincident.
management information base (MIB)Status information that an SNMP server product or SNMP network device releases externally.
MIB objectA unit of management information in the MIB. A MIB object consists of a hierarchical tree structure. Eachlevel of the tree has a unique name and an identifier that indicates the unique name by using a numericalvalue. Note that a specific value of a MIB object is called an instance.
D
I
L
M
Network Management: Getting Started 110
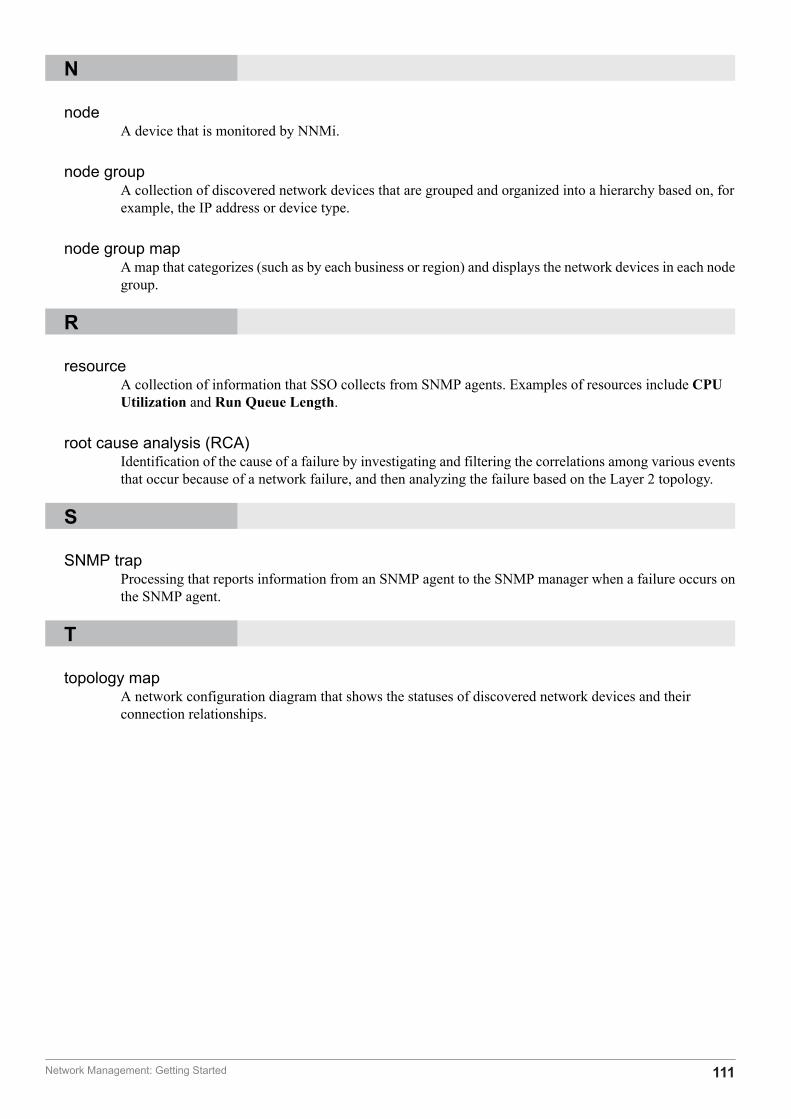
nodeA device that is monitored by NNMi.
node groupA collection of discovered network devices that are grouped and organized into a hierarchy based on, forexample, the IP address or device type.
node group mapA map that categorizes (such as by each business or region) and displays the network devices in each nodegroup.
resourceA collection of information that SSO collects from SNMP agents. Examples of resources include CPUUtilization and Run Queue Length.
root cause analysis (RCA)Identification of the cause of a failure by investigating and filtering the correlations among various eventsthat occur because of a network failure, and then analyzing the failure based on the Layer 2 topology.
SNMP trapProcessing that reports information from an SNMP agent to the SNMP manager when a failure occurs onthe SNMP agent.
topology mapA network configuration diagram that shows the statuses of discovered network devices and theirconnection relationships.
N
R
S
T
Network Management: Getting Started 111
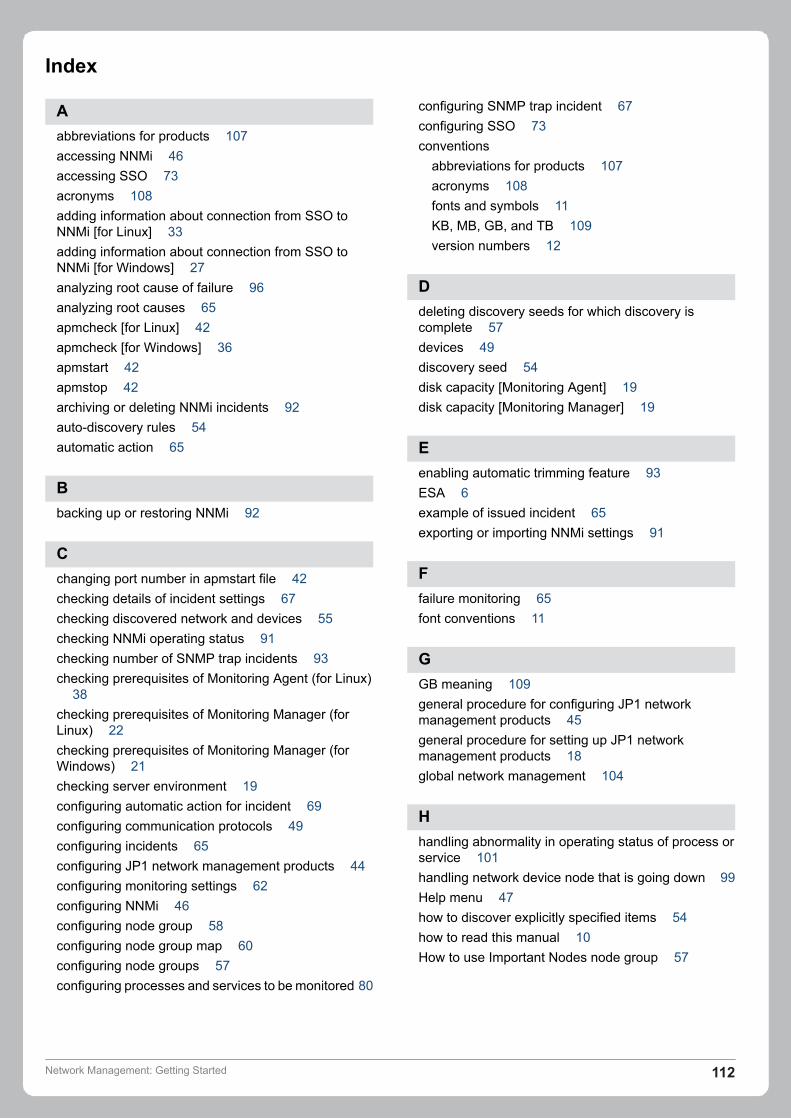
Index
Aabbreviations for products 107accessing NNMi 46accessing SSO 73acronyms 108adding information about connection from SSO toNNMi [for Linux] 33adding information about connection from SSO toNNMi [for Windows] 27analyzing root cause of failure 96analyzing root causes 65apmcheck [for Linux] 42apmcheck [for Windows] 36apmstart 42apmstop 42archiving or deleting NNMi incidents 92auto-discovery rules 54automatic action 65
Bbacking up or restoring NNMi 92
Cchanging port number in apmstart file 42checking details of incident settings 67checking discovered network and devices 55checking NNMi operating status 91checking number of SNMP trap incidents 93checking prerequisites of Monitoring Agent (for Linux)
38checking prerequisites of Monitoring Manager (forLinux) 22checking prerequisites of Monitoring Manager (forWindows) 21checking server environment 19configuring automatic action for incident 69configuring communication protocols 49configuring incidents 65configuring JP1 network management products 44configuring monitoring settings 62configuring NNMi 46configuring node group 58configuring node group map 60configuring node groups 57configuring processes and services to be monitored 80
configuring SNMP trap incident 67configuring SSO 73conventions
abbreviations for products 107acronyms 108fonts and symbols 11KB, MB, GB, and TB 109version numbers 12
Ddeleting discovery seeds for which discovery iscomplete 57devices 49discovery seed 54disk capacity [Monitoring Agent] 19disk capacity [Monitoring Manager] 19
Eenabling automatic trimming feature 93ESA 6example of issued incident 65exporting or importing NNMi settings 91
Ffailure monitoring 65font conventions 11
GGB meaning 109general procedure for configuring JP1 networkmanagement products 45general procedure for setting up JP1 networkmanagement products 18global network management 104
Hhandling abnormality in operating status of process orservice 101handling network device node that is going down 99Help menu 47how to discover explicitly specified items 54how to read this manual 10How to use Important Nodes node group 57
Network Management: Getting Started 112
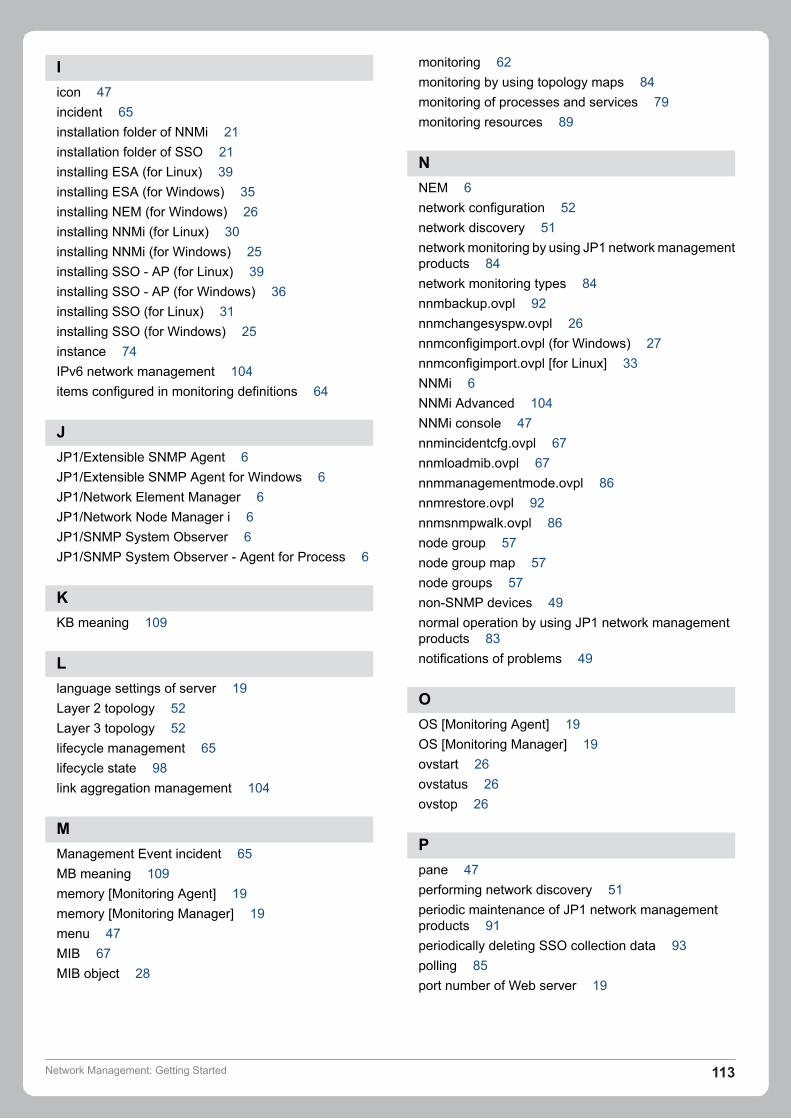
Iicon 47incident 65installation folder of NNMi 21installation folder of SSO 21installing ESA (for Linux) 39installing ESA (for Windows) 35installing NEM (for Windows) 26installing NNMi (for Linux) 30installing NNMi (for Windows) 25installing SSO - AP (for Linux) 39installing SSO - AP (for Windows) 36installing SSO (for Linux) 31installing SSO (for Windows) 25instance 74IPv6 network management 104items configured in monitoring definitions 64
JJP1/Extensible SNMP Agent 6JP1/Extensible SNMP Agent for Windows 6JP1/Network Element Manager 6JP1/Network Node Manager i 6JP1/SNMP System Observer 6JP1/SNMP System Observer - Agent for Process 6
KKB meaning 109
Llanguage settings of server 19Layer 2 topology 52Layer 3 topology 52lifecycle management 65lifecycle state 98link aggregation management 104
MManagement Event incident 65MB meaning 109memory [Monitoring Agent] 19memory [Monitoring Manager] 19menu 47MIB 67MIB object 28
monitoring 62monitoring by using topology maps 84monitoring of processes and services 79monitoring resources 89
NNEM 6network configuration 52network discovery 51network monitoring by using JP1 network managementproducts 84network monitoring types 84nnmbackup.ovpl 92nnmchangesyspw.ovpl 26nnmconfigimport.ovpl (for Windows) 27nnmconfigimport.ovpl [for Linux] 33NNMi 6NNMi Advanced 104NNMi console 47nnmincidentcfg.ovpl 67nnmloadmib.ovpl 67nnmmanagementmode.ovpl 86nnmrestore.ovpl 92nnmsnmpwalk.ovpl 86node group 57node group map 57node groups 57non-SNMP devices 49normal operation by using JP1 network managementproducts 83notifications of problems 49
OOS [Monitoring Agent] 19OS [Monitoring Manager] 19ovstart 26ovstatus 26ovstop 26
Ppane 47performing network discovery 51periodic maintenance of JP1 network managementproducts 91periodically deleting SSO collection data 93polling 85port number of Web server 19
Network Management: Getting Started 113
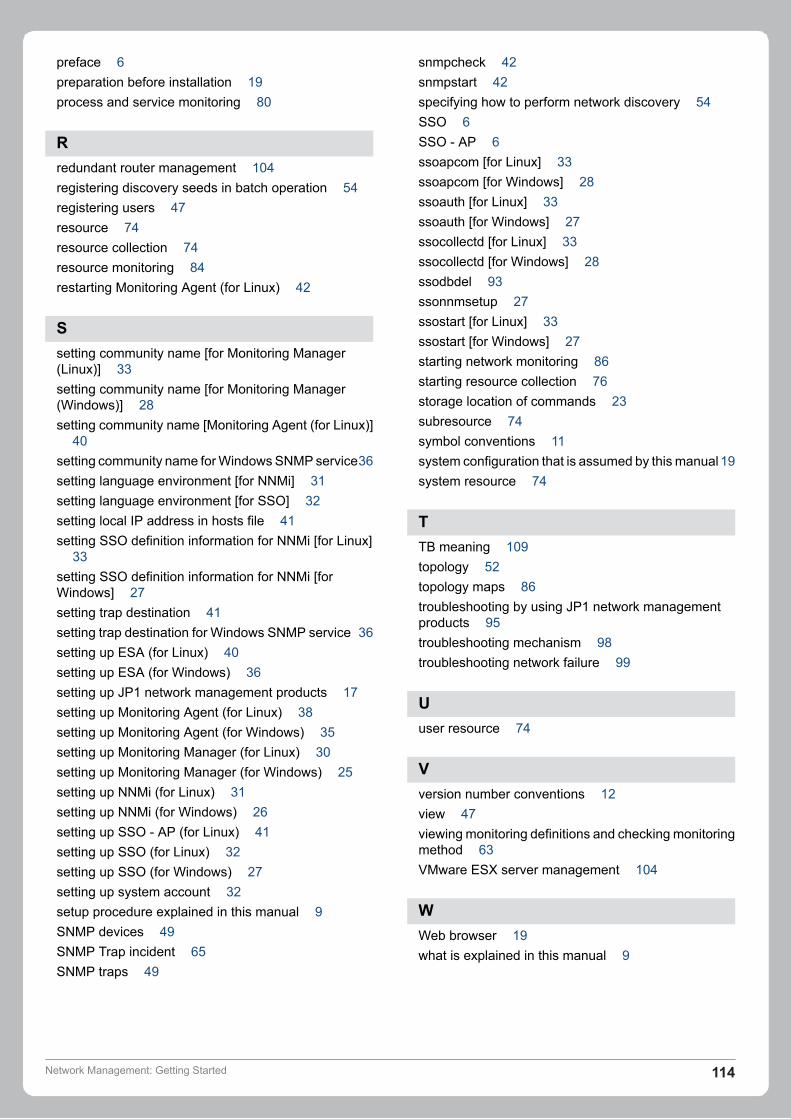
preface 6preparation before installation 19process and service monitoring 80
Rredundant router management 104registering discovery seeds in batch operation 54registering users 47resource 74resource collection 74resource monitoring 84restarting Monitoring Agent (for Linux) 42
Ssetting community name [for Monitoring Manager(Linux)] 33setting community name [for Monitoring Manager(Windows)] 28setting community name [Monitoring Agent (for Linux)]
40setting community name for Windows SNMP service36setting language environment [for NNMi] 31setting language environment [for SSO] 32setting local IP address in hosts file 41setting SSO definition information for NNMi [for Linux]
33setting SSO definition information for NNMi [forWindows] 27setting trap destination 41setting trap destination for Windows SNMP service 36setting up ESA (for Linux) 40setting up ESA (for Windows) 36setting up JP1 network management products 17setting up Monitoring Agent (for Linux) 38setting up Monitoring Agent (for Windows) 35setting up Monitoring Manager (for Linux) 30setting up Monitoring Manager (for Windows) 25setting up NNMi (for Linux) 31setting up NNMi (for Windows) 26setting up SSO - AP (for Linux) 41setting up SSO (for Linux) 32setting up SSO (for Windows) 27setting up system account 32setup procedure explained in this manual 9SNMP devices 49SNMP Trap incident 65SNMP traps 49
snmpcheck 42snmpstart 42specifying how to perform network discovery 54SSO 6SSO - AP 6ssoapcom [for Linux] 33ssoapcom [for Windows] 28ssoauth [for Linux] 33ssoauth [for Windows] 27ssocollectd [for Linux] 33ssocollectd [for Windows] 28ssodbdel 93ssonnmsetup 27ssostart [for Linux] 33ssostart [for Windows] 27starting network monitoring 86starting resource collection 76storage location of commands 23subresource 74symbol conventions 11system configuration that is assumed by this manual 19system resource 74
TTB meaning 109topology 52topology maps 86troubleshooting by using JP1 network managementproducts 95troubleshooting mechanism 98troubleshooting network failure 99
Uuser resource 74
Vversion number conventions 12view 47viewing monitoring definitions and checking monitoringmethod 63VMware ESX server management 104
WWeb browser 19what is explained in this manual 9
Network Management: Getting Started 114

what you can do with JP1 network managementproducts 6workspace 47
Network Management: Getting Started 115

6-6, Marunouchi 1-chome, Chiyoda-ku, Tokyo, 100-8280 Japan