
Network embeddedness and the exploration of novel technologies: Technological distance, betweenness...
16
This article appeared in a journal published by Elsevier. The attached copy is furnished to the author for internal non-commercial research and education use, including for instruction at the authors institution and sharing with colleagues. Other uses, including reproduction and distribution, or selling or licensing copies, or posting to personal, institutional or third party websites are prohibited. In most cases authors are permitted to post their version of the article (e.g. in Word or Tex form) to their personal website or institutional repository. Authors requiring further information regarding Elsevier’s archiving and manuscript policies are encouraged to visit: http://www.elsevier.com/copyright
-
Upload
tilburguniversity -
Category
Documents
-
view
0 -
download
0
Transcript of Network embeddedness and the exploration of novel technologies: Technological distance, betweenness...

This article appeared in a journal published by Elsevier. The attachedcopy is furnished to the author for internal non-commercial researchand education use, including for instruction at the authors institution
and sharing with colleagues.
Other uses, including reproduction and distribution, or selling orlicensing copies, or posting to personal, institutional or third party
websites are prohibited.
In most cases authors are permitted to post their version of thearticle (e.g. in Word or Tex form) to their personal website orinstitutional repository. Authors requiring further information
regarding Elsevier’s archiving and manuscript policies areencouraged to visit:
http://www.elsevier.com/copyright

Author's personal copy
Research Policy 37 (2008) 1717–1731
Contents lists available at ScienceDirect
Research Policy
journa l homepage: www.e lsev ier .com/ locate / respol
Network embeddedness and the exploration of novel technologies:Technological distance, betweenness centrality and density
Victor Gilsingb,∗, Bart Nooteboomb, Wim Vanhaverbekec,Geert Duystersd, Ad van den Oorda
a ECIS, Eindhoven University of Technology, The Netherlandsb Tilburg University, The Netherlandsc Hasselt University, Belgiumd UNU-Merit, The Netherlands
a r t i c l e i n f o
Article history:Available online 21 October 2008
Keywords:InnovationInterfirm collaborationTechnological explorationTechnological distanceAbsorptive capacity
a b s t r a c t
This paper aims to understand better the innovation potential of a firm’s alliance network.Here we analyze the role of an alliance network in terms of the technological distancebetween partners, a firm’s network position (centrality) and total network density. We studyhow these three elements of an alliance network, separately and in combination, affectthe ‘twin tasks’ in exploration, namely novelty creation on the one hand and its efficientabsorption on the other hand. For an empirical test, we study technology-based alliancenetworks in the pharmaceutical, chemical and automotive industries. Our findings indi-cate that successful exploration indeed seems to require a delicate balance between thesetwo exploration tasks. A second conclusion is that different network positions yield differ-ent pay-offs in terms of the number of explorative patents. In other words, success rates forexploration are not spread equally across firms. However, position alone does not tell the fullstory. Our empirical findings clearly indicate that exploration success also depends on theother two dimensions of embeddedness, namely technological distance and network den-sity. The three elements of network embeddedness need to be considered jointly in order tounderstand their complementary effects on both novelty creation and absorptive capacity.
© 2008 Published by Elsevier B.V.
1. Introduction
There is now increasing consensus in the academic liter-ature that a firm’s embeddedness in a network of interfirmrelations matters for its economic and innovative perfor-mance (Nooteboom, 1992; Hagedoorn, 1993; Powell et al.,1996; Rowley et al., 2000; Ahuja, 2000a; Owen-Smith andPowell, 2004). The empirical evidence has indicated thatthis relationship between embeddedness and innovationcan be found in industries as diverse as chemicals (Ahuja,
∗ Corresponding author at: Eindhoven Centre for Innovation Studies(ECIS), Eindhoven University of Technology, P.O. Box 513, 5600 MB Eind-hoven, The Netherlands. Tel.: +31 40 247 44 35.
E-mail address: [email protected] (V. Gilsing).
2000a), biotechnology (Baum et al., 2000; Powell et al.,1996), semiconductors (Stuart, 1998), textiles (Uzzi, 1997),personal computers (Hagedoorn and Duysters, 2002) andbanking (Zaheer and Bell, 2005). More recently, some stud-ies have started to unravel this notion of embeddedness inorder to understand in what specific ways it contributesto a firm’s innovation performance. Here, characteristicsof partners have been studied such as their degree ofinnovativeness (Stuart, 1998) as well as the properties ofalliances such as the role of formal governance mecha-nisms (Mowery et al., 1996), equity vs. non-equity alliances(Rowley et al., 2000) or the role of repeated contacts (Wuytset al., 2005). Beyond the dyad level, studies at the networklevel have shown that the properties of an alliance net-work also affect innovation. Here it has been shown thatapart from the number of direct ties (Ahuja, 2000a; Shan
0048-7333/$ – see front matter © 2008 Published by Elsevier B.V.doi:10.1016/j.respol.2008.08.010

Author's personal copy
1718 V. Gilsing et al. / Research Policy 37 (2008) 1717–1731
et al., 1994) also a firm’s indirect ties (Ahuja, 2000b) andthe redundancy among these ties (Ahuja, 2000b; Baum etal., 2000; McEvily and Zaheer, 1999) affect its innovationperformance.
In most of these studies an important function ofalliances is that they function as ‘pipelines’ through whichinformation and knowledge flows between firms (Owen-Smith and Powell, 2004). This focus on the diffusionpotential of alliances may not be surprising as moststudies on the role of embeddedness have been assum-ing conditions of relative environmental stability. Here,embeddedness refers to routinisation and stabilizationof linkages among members as a result of a history ofexchanges and relations within a group or community(Gulati, 1998). Under such structure-reinforcing conditions,the role of embeddedness is increasingly well under-stood (Gulati, 1998; Madhavan et al., 1998; Koka et al.,2006). These conditions connect with March’s category ofexploitation (1991) in which environmental uncertaintyis rather limited and the focus is on the refinement andextension of existing competences and technologies. Therationale for teaming up with partners then is formed bypossibilities to obtain complementary know-how (Teece,1986) and/or to speed up the R&D process in indus-tries where time-to-market is crucial. Here, cooperation isattractive as partners have a good understanding of the rel-evant issues at hand and alliances enable a rapid diffusion ofknowledge among partners, enhancing the efficiency andspeed of cooperation (Gilsing, 2005).
In this strand of literature, an implicit underlyingassumption is that similarity of partners is beneficial forlearning and innovation. This follows from Cohen andLevinthal’s (1990) influential notion of absorptive capac-ity, where the idea that the extent to which firms canlearn from external knowledge may be largely dependentupon the similarity of the partners’ knowledge bases. Ina similar vein, different studies have demonstrated thatlearning potential declines with an increase in dissimilar-ity of knowledge stocks (Hamel, 1991; Lane and Lubatkin,1998; Mowery et al., 1996; Fleming and Sorenson, 2001).So, for inter-organisational learning in exploitation, similar-ity is attractive and distances in knowledge and cognition(cognitive distance) constitute a liability.
This raises the question of how to understand the roleof network embeddedness in view of exploration thatcan be characterized by breaking away from the estab-lished way of doing things, with a focus on the discoveryand experimentation of new technologies (March, 1991;Nooteboom, 2000). By its very nature, exploration is notabout efficiency of current activities, but rather formsan uncertain process that deals with the search for new,technology-based business opportunities (Rowley et al.,2000; Nooteboom, 2000), requiring the production of newinsights and knowledge. This points to a different role ofa firm’s alliance network, namely its recombination poten-tial for new knowledge creation rather than its function as achannel for diffusion of existing information and knowledgefor exploitation. Existing literature has largely ignored thisrole of alliances for novelty creation and is therefore unableto explain the development of new knowledge and compe-tencies (Hagedoorn et al., 2000; Phelps, 2005). In contrast
to exploitation, in this process of exploration partner sim-ilarity is unattractive whereas cognitive distance betweenpartners forms an important asset.
The main aim of this paper is to develop an under-standing of the role of a firm’s alliance network in viewof exploration. To do so, we will first consider this role ofcognitive distance between firms in order to understandhow far dissimilarity between partners is attractive in viewof exploration. Second, we combine such a cognitive viewwith a social structural one. In this way we complementthe literature that has predominantly focused on the roleof economic and social factors regarding alliance forma-tion and the role of network embeddedness (Gulati, 1998).A cognition-based understanding of these processes, how-ever, is still in its infancy (Moran, 2005).
Combining the role of cognitive and social structural fac-tors may provide us with new insights into what constitutesan optimal network structure for exploration. As we willargue, for exploration firms are faced with a dual task. Onthe one hand, they need to develop access to heterogeneoussources of knowledge and in this way create a potential fornovel combinations. This requires an emphasis on diver-sity and disintegrated network structures, which is relatedto Burt’s argument (1992) stressing the benefits of access tonon-redundant contacts to obtain novel information (nov-elty value).
On the other hand, firms need to make sure that suchnovel knowledge, once accessed, is evaluated, and whenproven to be valuable is adequately absorbed. This processfavours more homogeneous network structures in view ofintegrating the diverse inputs obtained from distant part-ners (Hansen, 1999). This is more in line with Coleman’sview (1988) stressing the benefits of redundant networkstructures. Given these differences between the two tasks,we claim that a firm’s network will impact differently oneach task. So, an important contribution of this paper is thatit investigates how far optimal embeddedness for noveltycreation may form a burden for absorptive capacity and viceversa. In this way, we may shed new light on the ongoingdebate on the validity of the arguments by Burt, favour-ing structural holes, versus those of Coleman, favouringclosure.
This paper is structured as follows. In Section 2 we elab-orate our theoretical argument and formulate a number ofhypotheses. Then, in Section 3, we present details aboutthe data, the specification of variables, and the estimationmethod. In Section 4 we present our main findings. Finally,in Section 5, we provide a discussion of the results, the mainconclusions and some indications for further research.
2. Theory and hypotheses
As argued above, the central focus of this paper is on therole of a firm’s alliance network regarding the ‘twin tasks’of on the one hand creating novel combinations, and on theother hand the build-up of absorptive capacity for under-standing such novel combinations. To understand its role,we study a firm’s alliance network along three dimensions.First, following Nooteboom et al. (2005), we consider therole of cognitive distance among the firms making up suchan alliance network. Here, cognitive distance refers to the

Author's personal copy
V. Gilsing et al. / Research Policy 37 (2008) 1717–1731 1719
extent that firms differ in their technological knowledgeand expertise. Next we focus on the role of a firm’s posi-tion in a network. As a third element of a firm’s alliancenetwork we study the role of network density. By consid-ering cognitive distance as well as position and networkdensity we combine a cognitive view of a firm’s alliancenetwork with a social structural view. Whereas a cogni-tive view elucidates the potential for recombination dueto distances in cognition between firms, a social structuralview highlights how technology-based alliances serve asthe mechanism for crossing such distances and accessing(proximate and distant) partners. In this way, combiningthe two perspectives provides a complementary theoreti-cal foundation for understanding the role of a firm’s alliancenetwork in exploration.
2.1. Exploration
The distinction between exploration and exploitationgoes back to Holland (1975) and was later further devel-oped by March (1991). Exploitation can be characterizedas a process of routinisation, which adds to the exist-ing knowledge base and competence set of firms withoutchanging the nature of activities (March, 1991). This resem-bles ‘local search’ in which firms search for new knowledgethat is less likely to conflict with their existing cognitive andmental models (Nelson and Winter, 1982).1 They developmore and more competence in their particular field, furtherincreasing the chance of immediate and positive returns.Exploitation may therefore increase a firm’s innovativeperformance due to returns from specialization, howeverit may also lead to technological obsolescence and leavefirms locked out from new developments (March, 1991;Sorensen and Stuart, 2000). To escape from this lock-in sit-uation, firms need to engage in so-called exploration thatcan be characterized by breaking with an existing dominantdesign and shifting away from existing rules, norms, rou-tines and activities, in search of novel combinations. Henceexploration is not about efficiency of current activities andcannot be planned for. It is an uncertain process that ischaracterized by a constant search for new opportunities.2
Although the literature agrees on the fact that alliancenetworks form an important instrument in this process(Powell et al., 1996; Rowley et al., 2000), there is very lim-ited empirical evidence of how they facilitate the creationof new knowledge in this process of exploration.
An important issue here is that we take a firm’s per-spective on exploration. In other words, in this paperwe will focus on the creation of technological knowl-edge that is new to the firm. So, we consider knowledgeas novel and the activities to create such knowledge asexploratory if they fall outside a firm’s existing knowledgestock, even though they may have been in existence ear-
1 Underlying this is the idea of the relative inertia of firms, as advancedby population ecology that firms are better at doing more of the same thanat adapting to change (Carroll and Hannan, 2000).
2 Exploration and exploitation are related and build on each other:exploration develops into exploitation, and exploration emerges fromexploitation, in ways that go beyond the present paper (see for a furtherdiscussion Nooteboom, 2000; Gilsing and Nooteboom, 2006).
Fig. 1. Novelty and absorptive capacity.
lier elsewhere. This clearly differs from exploration thatyields knowledge that is new to the industry or perhapseven new to the world. These latter two form ‘newlyemerging’ and respectively ‘pioneering’ technologies, rep-resenting (much) more radical types of exploration (Ahujaand Lampert, 2001).
2.2. Role of technological distance
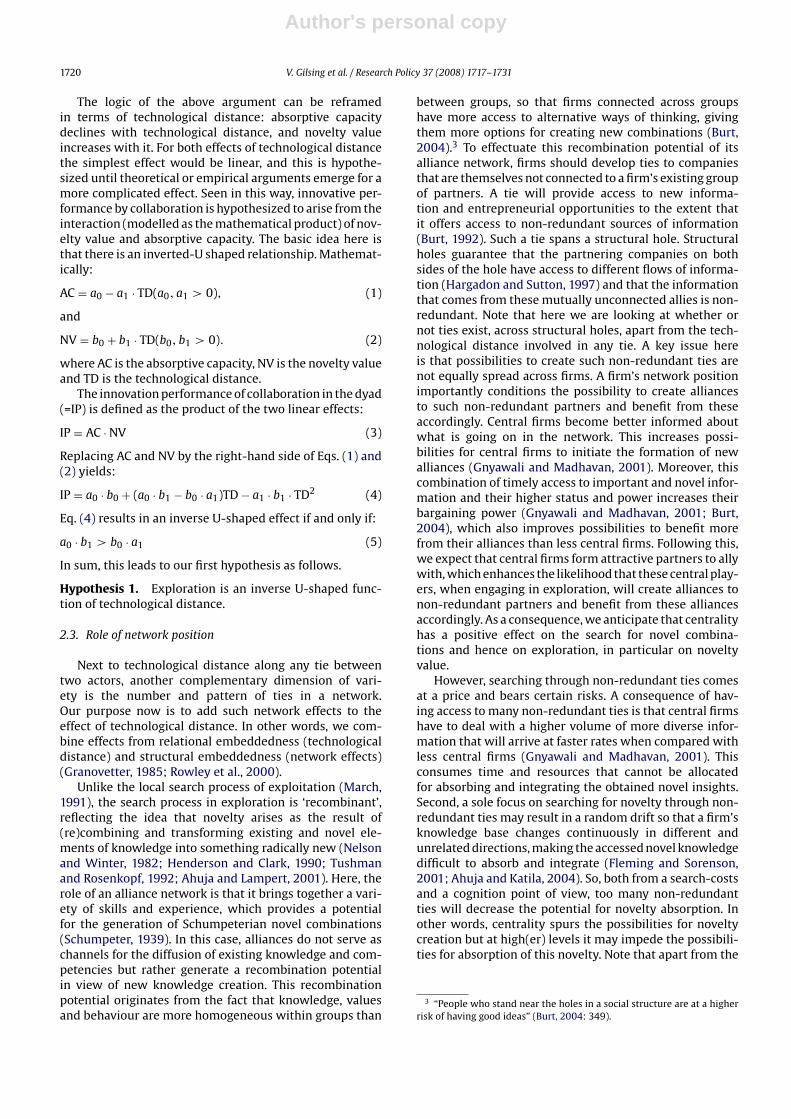
Regarding the role of cognitive distance, Nooteboom(1999) proposed a model, which was tested by Wuyts et al.(2005) and by Nooteboom et al. (2005). The key argumentin the model is that while larger distances in cognition havea negative effect on absorptive capacity, they have a positiveeffect on the potential for novelty creation. In first instance,as cognitive distance increases, it has a positive effect onlearning by interaction because it yields opportunities fornovel combinations of complementary resources. However,at a certain point cognitive distance becomes so large as topreclude sufficient mutual understanding needed to utilizethose opportunities (see also Fig. 1).
Of course, a certain degree of mutual understanding isneeded for collaboration, and familiarity certainly breedstrust (Gulati, 1995a), which facilitates successful collabo-ration. However, too much familiarity may take out theinnovative steam from collaboration. The challenge thenis to find partners at sufficient cognitive distance to learnsomething new, but not so distant as to preclude mutualunderstanding.
In general, cognitive distance entails more than justtechnological distance, although there is correlationbetween technological distance and distance in otherfunctional disciplines such as marketing, production andengineering. In this paper, we specify cognitive distance interms of technological distance, for two empirical reasons.First, our measure of innovative success will be based onpatents, and there technological knowledge is more dom-inant. A second, more pragmatic argument is that it is notclear precisely how other dimensions of cognitive distanceshould be measured (cf. Wuyts et al., 2005).
Author's personal copy
1720 V. Gilsing et al. / Research Policy 37 (2008) 1717–1731
The logic of the above argument can be reframedin terms of technological distance: absorptive capacitydeclines with technological distance, and novelty valueincreases with it. For both effects of technological distancethe simplest effect would be linear, and this is hypothe-sized until theoretical or empirical arguments emerge for amore complicated effect. Seen in this way, innovative per-formance by collaboration is hypothesized to arise from theinteraction (modelled as the mathematical product) of nov-elty value and absorptive capacity. The basic idea here isthat there is an inverted-U shaped relationship. Mathemat-ically:
AC = a0 − a1 · TD(a0, a1 > 0), (1)
and
NV = b0 + b1 · TD(b0, b1 > 0). (2)
where AC is the absorptive capacity, NV is the novelty valueand TD is the technological distance.
The innovation performance of collaboration in the dyad(=IP) is defined as the product of the two linear effects:
IP = AC · NV (3)
Replacing AC and NV by the right-hand side of Eqs. (1) and(2) yields:
IP = a0 · b0 + (a0 · b1 − b0 · a1)TD − a1 · b1 · TD2 (4)
Eq. (4) results in an inverse U-shaped effect if and only if:
a0 · b1 > b0 · a1 (5)
In sum, this leads to our first hypothesis as follows.
Hypothesis 1. Exploration is an inverse U-shaped func-tion of technological distance.
2.3. Role of network position
Next to technological distance along any tie betweentwo actors, another complementary dimension of vari-ety is the number and pattern of ties in a network.Our purpose now is to add such network effects to theeffect of technological distance. In other words, we com-bine effects from relational embeddedness (technologicaldistance) and structural embeddedness (network effects)(Granovetter, 1985; Rowley et al., 2000).
Unlike the local search process of exploitation (March,1991), the search process in exploration is ‘recombinant’,reflecting the idea that novelty arises as the result of(re)combining and transforming existing and novel ele-ments of knowledge into something radically new (Nelsonand Winter, 1982; Henderson and Clark, 1990; Tushmanand Rosenkopf, 1992; Ahuja and Lampert, 2001). Here, therole of an alliance network is that it brings together a vari-ety of skills and experience, which provides a potentialfor the generation of Schumpeterian novel combinations(Schumpeter, 1939). In this case, alliances do not serve aschannels for the diffusion of existing knowledge and com-petencies but rather generate a recombination potentialin view of new knowledge creation. This recombinationpotential originates from the fact that knowledge, valuesand behaviour are more homogeneous within groups than
between groups, so that firms connected across groupshave more access to alternative ways of thinking, givingthem more options for creating new combinations (Burt,2004).3 To effectuate this recombination potential of itsalliance network, firms should develop ties to companiesthat are themselves not connected to a firm’s existing groupof partners. A tie will provide access to new informa-tion and entrepreneurial opportunities to the extent thatit offers access to non-redundant sources of information(Burt, 1992). Such a tie spans a structural hole. Structuralholes guarantee that the partnering companies on bothsides of the hole have access to different flows of informa-tion (Hargadon and Sutton, 1997) and that the informationthat comes from these mutually unconnected allies is non-redundant. Note that here we are looking at whether ornot ties exist, across structural holes, apart from the tech-nological distance involved in any tie. A key issue hereis that possibilities to create such non-redundant ties arenot equally spread across firms. A firm’s network positionimportantly conditions the possibility to create alliancesto such non-redundant partners and benefit from theseaccordingly. Central firms become better informed aboutwhat is going on in the network. This increases possi-bilities for central firms to initiate the formation of newalliances (Gnyawali and Madhavan, 2001). Moreover, thiscombination of timely access to important and novel infor-mation and their higher status and power increases theirbargaining power (Gnyawali and Madhavan, 2001; Burt,2004), which also improves possibilities to benefit morefrom their alliances than less central firms. Following this,we expect that central firms form attractive partners to allywith, which enhances the likelihood that these central play-ers, when engaging in exploration, will create alliances tonon-redundant partners and benefit from these alliancesaccordingly. As a consequence, we anticipate that centralityhas a positive effect on the search for novel combina-tions and hence on exploration, in particular on noveltyvalue.
However, searching through non-redundant ties comesat a price and bears certain risks. A consequence of hav-ing access to many non-redundant ties is that central firmshave to deal with a higher volume of more diverse infor-mation that will arrive at faster rates when compared withless central firms (Gnyawali and Madhavan, 2001). Thisconsumes time and resources that cannot be allocatedfor absorbing and integrating the obtained novel insights.Second, a sole focus on searching for novelty through non-redundant ties may result in a random drift so that a firm’sknowledge base changes continuously in different andunrelated directions, making the accessed novel knowledgedifficult to absorb and integrate (Fleming and Sorenson,2001; Ahuja and Katila, 2004). So, both from a search-costsand a cognition point of view, too many non-redundantties will decrease the potential for novelty absorption. Inother words, centrality spurs the possibilities for noveltycreation but at high(er) levels it may impede the possibili-ties for absorption of this novelty. Note that apart from the
3 “People who stand near the holes in a social structure are at a higherrisk of having good ideas” (Burt, 2004: 349).

Author's personal copy
V. Gilsing et al. / Research Policy 37 (2008) 1717–1731 1721
number of non-redundant ties one has, there is the issue oftechnological distance along each tie.
Thus, we hypothesize that, next to effects of technologi-cal distance, centrality has a positive effect on novelty value(NV) and a negative effect on absorptive capacity (AC), andby the same logic as for the effects of technological distance,with innovative performance being a product of NV andAC), this yields an inverse U-shaped effect on exploration.
Hypothesis 2. Exploration is an inverse-U shaped func-tion of network centrality.
2.4. Role of network density
In contrast to the effects of centrality, we anticipate thatnetwork density limits the potential for novelty creationwhereas it enhances the build-up of absorptive capacity.As we will argue, both direct and indirect ties play a rolein building up absorptive capacity. Therefore we considerthe role of ‘global network density’, which considers bothtypes of ties as a property of the total network, rather thanthe density of ties surrounding a specific node. As we willargue, both direct and indirect ties play a role in buildingup absorptive capacity.
Novel knowledge from a direct partner, especially ata large technological distance, may not be readily under-standable for a firm. If one is not able to understand novelinformation from a given source adequately, one may needanother partner to complement one’s absorptive capacity(Gilsing and Nooteboom, 2005). In other words, the extentto which one’s partners are linked may help in dealing withtechnological distance to any of them. More precisely, if Aremains linked to both B and C, even if there is also a linkbetween B and C, this may help A to understand C by com-paring what A understands from C with what B understandsfrom C. This can matter especially when there is a largetechnological distance between A and C. In other words,even if a firm’s direct ties are known to be redundant foraccess to sources of information, they may be needed bothto understand and to absorb knowledge accessed in theother relation.
This is the case particularly when engaging in explo-ration, where new and distant knowledge is accessed, anddominant designs and standards may be lacking. Moreover,the often tacit and experimental nature of exploration fur-ther increases the difficulty of firms to recognize and valuethe technology of potential partners when they are not con-nected through a common alliance partner. In this way, notonly direct but also indirect ties can enhance the absorp-tive capacity of the firm by acting as device for screeningand interpreting novel information on its potential rele-vance and value (Leonard-Barton, 1984; Vanhaverbeke etal., 2008). In addition, even if one does understand a givensource, one may not be able to judge the reliability of infor-mation, so that, like researchers in gathering potentiallybiased data, one may need a third party as a source for trian-gulation (Gilsing and Nooteboom, 2005). In this way, firmsmay be able to develop a richer understanding and a betterevaluation of the acquired novelty (Rowley et al., 2000).
In addition, a dense network of direct and indirect tiesalso facilitates the build-up of trust, a reputation mech-
anism, and coalitions to constrain opportunism (Gulati,1995a,b; Hagedoorn and Duysters, 2002). These are theprime arguments for closure, introduced by Coleman(1988). They apply especially to exploration in view of theuncertainty surrounding it, which limits options for gover-nance by formal contracts (Nooteboom, 1999, 2002).
Now, density and its potential for trust building enablesa proliferation of triangulation, as follows. First, it is usefulfor neighbours of the focal firm to be mutually connectedfor triangulation. Next, information from any neighbour isricher and more reliable to the extent that the neighbouralso profits from triangulation among its neighbours.
So, density through direct ties and indirect ties playsan important role with regard to assessing the reliabilityof (technologically distant) sources of novelty as well asunderstanding and evaluating these sources. In sum, wepropose that density enhances the absorptive capacity ofeach individual firm in the network.
Let us now turn to the arguments against dense net-works. One argument entails that there are costs associatedwith establishing and maintaining contacts and that byshedding redundant ties, firms can create efficiency in theirnetwork (Burt, 1992). However, in exploration such costsof redundancy play a limited role as the key focus here ison finding and absorbing novelty, making considerations ofefficiency less of an issue (Hagedoorn and Duysters, 2002;Gilsing and Nooteboom, 2005).
The main argument against high density, however, isthat it inhibits the existence and the utilization of diver-sity, and hence of novelty value. When knowledge is moredensely spread across firms in the network, the benefits ofdirect ties and indirect ties in giving access to novelty willdecline, because ‘everyone knows what everyone knows’.Firms are less likely to gain new or additional informa-tion from their indirect ties, as the information that can beobtained from them will be very similar to the knowledgealready obtained from its direct contacts. As a consequence,the potential for creating novel combinations will diminish.
A dense network also increases the likelihood thatknowledge and information reaching the company throughits alliance network also reaches its partners. This may cre-ate a risk of undesirable spillovers. Such diffusion of noveltythroughout the network can put limits on its appropria-tion and make it less attractive for firms to search for suchnovelty (Gilsing and Nooteboom, 2005).
A final argument against density is, as indicated before,that it facilitates effective sanctions. As pointed outby Coleman (1988), dense networks enable reputationeffects, and yield opportunities for coalitions to constrainbehaviour. This is useful for the governance of relationalrisk, but may create strong behavioural pressures to con-form rather than to be radically different (Kraatz, 1998).Firms may also be pre-empted from entering into new,more innovative relationships, as the implicit expectationof loyalty to their existing partners and network may inhibitthem from allying with others (Buchko, 1994; Nooteboom,1999; Duysters and Lemmens, 2003; Gulati et al., 2000).
In sum, density supports the build-up of shared absorp-tive capacity but it may impede the possibilities for searchand novelty creation. These arguments lead to the followinghypothesis.
Author's personal copy
1722 V. Gilsing et al. / Research Policy 37 (2008) 1717–1731
Hypothesis 3. Exploration is an inverse-U shaped func-tion of density.
2.5. Combined effects
The effects of technological distance (TD) (Hypothesis1), betweenness centrality (BC) (Hypothesis 2) and networkdensity (D) (Hypothesis 3) apply simultaneously, and hencethere are interaction effects between them. Theoretically,the inverse U-shaped effects result from opposite effects onabsorptive capacity (AC) and novelty value (NV), which aremultiplied in their effects on exploration performance, asspecified previously for the effect of technological distance.
In Hypothesis 1 we posited that technological distancehas a negative effect on absorptive capacity and a positiveeffect on novelty value. In Hypothesis 2 we argued that cen-trality has a negative effect on absorptive capacity and apositive effect on novelty value. In Hypothesis 3 we assumethat network density has a positive effect on absorptivecapacity and a negative effect on novelty value.
For the combined effects, the full model then becomes:
AC = a0 − a1 · TD − a2 · BC + a3 · D (6)
NV = b0 + b1 · TD + b2 · BC − b3 · D,
a0, a1, a2, a3, b0, b1, b2, b3 > 0 (7)
Multiplying (6) and (7) provides the equation for explo-ration performance (IP):
IP = AC · NV = (a0 · b1 − b0 · a1) · TD + (a0 · b2 − b0 · a2)
·BC + (b0 · a3 − a0 · b3) · D − a1 · b1 · TD2
−a2 · b2 · BC2−a3 · b3 · D2−(a1 · b2+a2 · b1)
·TD · BC + (a1 · b3 + a3 · b1) · TD · D
+ (a2 · b3 + a3 · b2) · BC · D (8)
where
a0 · b1 > b0 · a1, a0 · b2 > b0 · a2 and b0 · a3 > a0 · b3
This mathematical model can be interpreted in the fol-lowing way. The interaction effect of two variables onexploration is negative when they have an effect in thesame direction on novelty value or on absorptive capac-ity. These yield alternative ways for achieving those effectsand here the variables can be considered as substitutes.This applies to the interaction effect between technologicaldistance and betweenness centrality, which both enhancenovelty value while decreasing absorptive capacity. Thus,such a combined increase in the potential for novelty valuewith a decrease of the ability to absorb this novelty hasa negative net effect on exploration. Interaction effectsare positive when variables have opposite effects on nov-elty value and on absorptive capacity. Here, the interactingeffects form complements. An increase in novelty valueis accompanied by an increase in the ability to absorb it.This applies to the interaction effects between technologi-cal distance and density as well as to the interaction effectbetween betweenness centrality and density. In both cases,an increase in novelty value, due to an increase of techno-logical distance or an increase of centrality, is accompanied
by an increase in absorptive capacity due to an increase ofnetwork density.
In other words, there are alternative strategies forthe maximization of exploration. High (low) technologi-cal distance would need to be compensated by low (high)betweenness centrality and/or high (low) density. High(low) betweenness centrality would have to be compen-sated by low (high) technological distance and/or high(low) density. High (low) density would have to be com-pensated by high (low) technological distance and/or high(low) betweenness centrality.
In sum, this leads to our final three hypotheses as fol-lows.
Hypothesis 4. The interaction between technological dis-tance and betweenness centrality has a negative effect onexploration.
Hypothesis 5. The interaction between technological dis-tance and density has a positive effect on exploration.
Hypothesis 6. The interaction between betweenness cen-trality and density has a positive effect on exploration.
3. Data and methods
3.1. Data
The sample set for this study consisted of panel dataon the alliance and patenting activities of 116 companiesin the chemicals, automotive and pharmaceutical indus-tries. The reason for choosing these three industries isthat they share the importance of investing in R&D andinnovation, but that they also reveal profound differencesregarding some key characteristics such as the stage ofindustry development (Walker et al., 1997), the importanceof exploration vis-à-vis exploitation (Rowley et al., 2000)and the importance of product versus process innovations(Tidd et al., 1997). Testing our hypotheses in different indus-tries enables us to assess how far the role of a firm’s alliancenetwork for exploration and exploitation remains invari-ant across industries, enhancing the generalization of theresults.
The focal firms that we study were observed over a 12-year period, from 1986 until 1997. The panel is unbalancedbecause of new start-ups and mergers and acquisitions.The 116 companies were selected to include public com-panies in these three industries that were also establishingtechnology-based strategic alliances. Information on theestablishment of alliances is hard to obtain for small orprivately owned companies. Previous studies on interfirmalliances also focused on leading companies in an industry(Ahuja, 2000b; Gulati, 1995b).
In total, 994 alliances were established in the period1986–1996 among these companies. Alliance data wereretrieved from the MERIT-CATI database, which containsinformation on nearly 15 thousand cooperative technol-ogy agreements and their ‘parent’ companies, covering theperiod 1970–1996 (see Hagedoorn and Duysters, 2002, fora further description). Combining financial data with theCATI data on strategic alliances further reduced the finalsample to 85 companies and 762 alliances.
Author's personal copy
V. Gilsing et al. / Research Policy 37 (2008) 1717–1731 1723
Exploration, the dependent variable, is based on patentcounts. All patenting data were retrieved from the US PatentOffice Database for all the companies in the sample, alsothose based outside the US. Working with US patents –the largest patent market – is preferable to the use of sev-eral national patent systems “. . .to maintain consistency,reliability and comparability, as patenting systems acrossnations differ in the application of standards, system ofgranting patents, and value of protection granted” (Ahuja,2000a, p. 434). Especially in industries where companiesoperate on an international or global scale US patents maybe a good proxy for companies’ worldwide innovative per-formance.
For companies in the three sectors the financial datawere derived from a combination of Worldscope, Compus-tat and data published in the companies’ annual reports.
3.2. Variables
3.2.1. Dependent variableThe different hypotheses test the effect of technological
distance, network position and overall network density onthe explorative innovation performance of companies inthe chemical, automotive and pharmaceutical industries.To derive the dependent variable, technological profiles ofall focal companies were computed to find out whethernew patents in the year of observation could be categorizedas ‘explorative’. These technological profiles were createdby adding up the number of patents a firm received ineach patent class during the 5 years prior to the year ofobservation. Different scholars have argued that a movingwindow of 5 years is an appropriate timeframe for assess-ing the technological impact of prior inventions (Podolnyand Stuart, 1995; Stuart and Podolny, 1996; Hendersonand Cockburn, 1996; Ahuja, 2000a). Studies of R&D depre-ciation (Griliches, 1979, 1984) suggest that knowledgecapital depreciates sharply, losing most of its economicvalue within 5 years. The USPTO classes were determinedat two-digit level, which resulted in approximately 400classes.
From these technology profiles we can distinguishbetween exploitative and explorative technology classes.Classes in which a company receives a patent in the yearof observation but had not received a patent in the previ-ous 5 years were considered ‘explorative’ patent classes.4
Since knowledge remains relatively new and unexploredfor a firm immediately after patenting, patent classes kepttheir explorative ‘status’ for three consecutive years, par-allel to Ahuja and Lampert’s (2001) concept of novel andemerging technologies.5 All the classes in which a com-pany had successfully applied for a patent the previous 5years and successfully applied for a patent in the year ofobservation were considered ‘exploitative’ patent classes.
4 We chose the year when the company filed for the patent rather thanthe year when it was granted, because the innovation in the companyalready has been realized when the company files for a patent.
5 In order to test the robustness of this measure, we also constructed a‘exploration patents’ variable where explorative patents could keep thisstatus for 5 years instead of 3 years.
3.2.2. Explanatory variablesTechnological distance, centrality and overall network
density are the three explanatory variables that have tobe operationalized. The first variable is based on USPTOpatent count data. The other two are calculated basedon the alliances that were established during the 5-yearperiod prior to the year of observation. This moving win-dow approach is considered to be an appropriate timeframeduring which the existing alliance portfolio is likely to havean influence on the current technological performance of afirm (Kogut, 1988, 1989; Gulati, 1995b).
Technological distance: Technological distance was mea-sured on the basis of CRTA, which is the Pearson correlationindex of the distribution across technological classes of therevealed technological advantages (RTA) of each firm rel-ative to the other sample firms. The RTA of a firm in aparticular technological field is given by the firm’s sharein that field of the US patents granted to all companiesin the study, relative to its overall share of all US patentsgranted to these companies. The RTA index varies aroundone, such that a value higher than one suggests that a firmis comparatively specialized in the technology in question,given its overall innovative performance. Positive valuesof CRTA indicate similarity of the pattern of relative tech-nological specialization of firms, as it appears from thedistribution of their patent activity across technologicalfields. For each firm and each year, a profile was constructedof its revealed technological advantage (RTA) in each patentclass.
A company’s RTA index in a patent class is defined as itsshare of patents in that class (compared to all its alliancepartners) divided by its share in all patent classes. Thecorrelation coefficient was computed pairwise betweenthe RTA profile of the focal firm and that of each of itsalliance partners. The CRTA variable is then calculated asthe average of these correlations. The values for CRTA cantheoretically vary from −1 to 1. As positive (negative) valuesindicate smaller (larger) technological distances, we choseto transform this variable into a new one (‘Technologicaldistance’) with a minimum value of zero and a maximum ofhundred, where higher values indicate larger technologicaldistance.
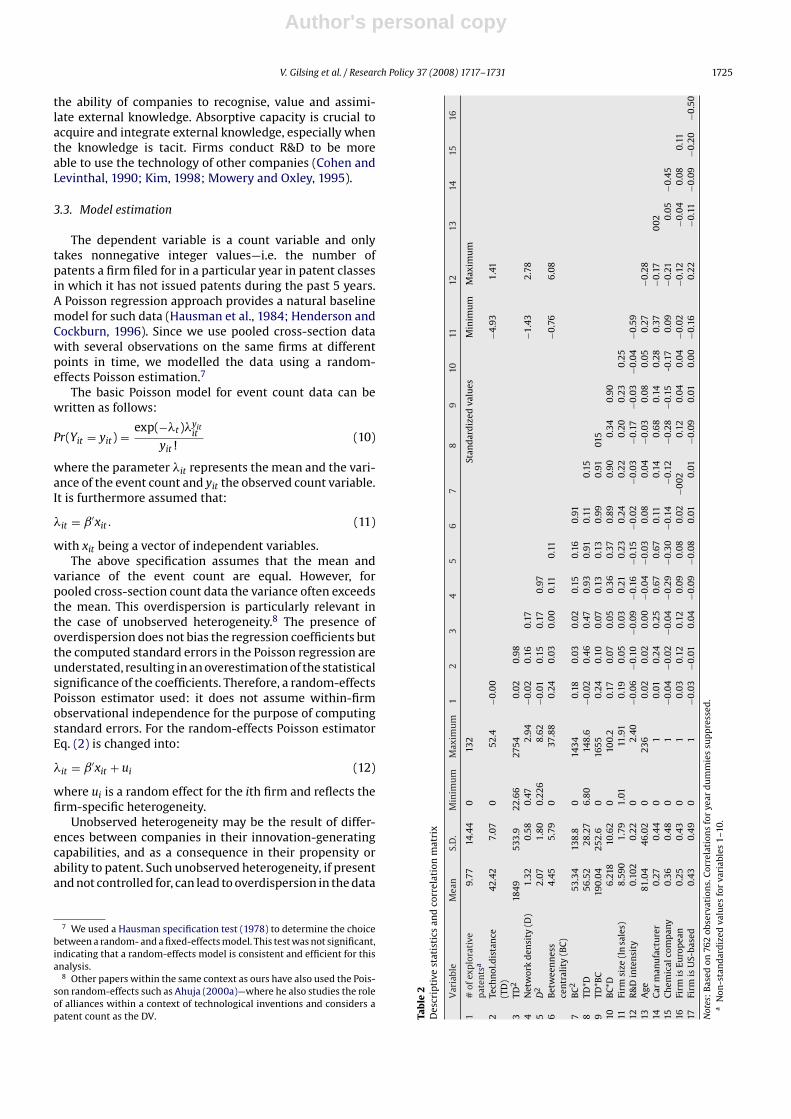
The values for this variable in Table 2 indicate thatthe average technological distance is 42.4 with a standarddeviation of 7.1. The maximum distance is 52.5 and theminimum 4.8.
Overall network density: This explanatory variable is acharacteristic of the overall alliance network in a partic-ular year for one of the three industries. This variableis “calculated as the number of all ties occurring in thematrix divided by the number of all possible ties” (Knokeand Kuklinski, 1982). Table 2 shows that the networks aresparse. The networks are calculated for each year and eachindustry: the density ranges from 0.5% to 2.9%. The averageis 1.3%.
Network centrality: The second variable related to afirm’s alliance network is its betweenness centrality.Betweenness centrality measures the centrality of a focalfirm in a network, and is calculated as the fraction of short-est paths between other companies that pass through thefocal firm. Betweenness is, in some sense, a measure of the

Author's personal copy
1724 V. Gilsing et al. / Research Policy 37 (2008) 1717–1731
Table 1Definitions of dependent and independent variables
Variable name Variable description
Dependent variableExplorative patents Number of patents a firm successfully filed for in year t within patent classes in which it has
not been active in the 5 years prior to the given year. The status of explorative patent’ is keptfor 3 years
Independent variablesTechnological distance The average of the correlations between the focal firm’s technology profile and that of each of
its alliance partners. The variable is transformed; the values range from 0 to 100, with highervalues implying increasing distances between the technology portfolio of the focal firm andthat of its alliance partners
Network density The number of technological alliances in the network divided by all possible alliances betweenthe networking firms
Betweenness centrality The fraction of shortest paths of alliances between other companies that pass through the focalfirm. We standardized this measure to compare the values across different alliance networks;values range from 0 to 100
Control variablesAge The number of years since a company was foundedFirm size (ln revenues) Natural logarithm of the total sales of the firm in t − 1 (×1000 Euro)R&D intensity R&D expenditures in t − 1 divided by total sales in t − 1Year Dummy variables for particular year, 1986–1997Chemical company Dummy variable set to one if the firm is a chemical company (default = pharmaceutical
company)Car manufacturer Dummy variable set to one if the firm is a car manufacturer (default = pharmaceutical
company)Europe Dummy variable set to one if the firm is headquartered in Europe (default = Asian company)US Dummy variable set to one if the firm is headquartered in the US (default = Asian company)
influence a focal firm has over the information through thealliance network. In other words, it also forms a network-wide (global) measure and takes direct and indirect ties intoaccount. This is important as this indicates how far a firmcan reach potentially all (including distant) parts of the net-work. This provides us with an indication of the potentialfor novel combinations that a firm may have.
We standardized this measure to compare betweennesscentralization of firms across different alliance networks –different years and industries. In theory, standardized val-ues can range from 0 to 100. Table 2 indicates that the valuesfor this variable range from 0 to 38. On average, firms havea network position with a low value for betweenness cen-trality, but there are a few companies that are in the midstof the action.
Furthermore, we included the interaction terms in theanalyses because the hypotheses predict that technologi-cal distance, network density and betweenness centralityinteract. Therefore, we standardize these three variablesprior to calculating their interaction terms, in order toavoid unnecessary multicollinearity (Aiken and West, 1991;Rothaermel and Deeds, 2004).
3.2.3. Control variablesOther variables can of course also affect the explorative
innovation performance of these firms. We included threetypes of dummy variables. A first indicates where the com-pany is headquartered geographically. Following the Triadconcept of the world economy, a company can be head-quartered in North America, Asia or Europe (Ohmae, 1985).Firms that are headquartered in different countries may dif-fer in their propensity to patent. Annual dummy variableswere included to capture changes over time in the propen-sity of companies to patent their innovations. Finally, we
included a dummy variable to indicate whether a com-pany is a car manufacturer or chemical firm (default is thepharmaceutical industry).
Furthermore, we included three organizational vari-ables as controls.6 The first is the age of the company. Olderfirms, with their accumulated experience, are expected tobe better at exploitation, and younger firms, with lowerstakes and habituation in old technologies, better at explo-ration. Hence, we expect a negative sign for the coefficientof this variable.
The natural logarithm of ‘corporate revenues’ – a proxyfor firm size – was included as a control variable. Firmsize is expected to enhance exploitative learning (Acs andAudretsch, 1991). Large firms have the financial meansand vast technological and other resources to invest heav-ily in R&D. However, they usually experience problemsin diversifying into new technological areas inhibitingexperimentation and favouring specialization along exist-ing technological trajectories (Levinthal and March, 1993;March, 1991; Ahuja and Lampert, 2001). As a result, largefirms are disadvantaged with respect to exploring newtechnological fields and will innovate proportionally lessthan smaller firms in new technological areas (Nooteboom,1991; Nooteboom and Vossen, 1995).
R&D intensity (R&D expenditures as a percentage ofsales) is expected to have a positive impact on exploration:firms that invest heavily in R&D will have a higher rateof innovation assuming that there exists a positive cor-relation between technological input and output (Pakesand Griliches, 1984). R&D investments also play a role in
6 Those variables were calculated for the year prior to the year of obser-vation.
Author's personal copy
V. Gilsing et al. / Research Policy 37 (2008) 1717–1731 1725
the ability of companies to recognise, value and assimi-late external knowledge. Absorptive capacity is crucial toacquire and integrate external knowledge, especially whenthe knowledge is tacit. Firms conduct R&D to be moreable to use the technology of other companies (Cohen andLevinthal, 1990; Kim, 1998; Mowery and Oxley, 1995).
3.3. Model estimation
The dependent variable is a count variable and onlytakes nonnegative integer values—i.e. the number ofpatents a firm filed for in a particular year in patent classesin which it has not issued patents during the past 5 years.A Poisson regression approach provides a natural baselinemodel for such data (Hausman et al., 1984; Henderson andCockburn, 1996). Since we use pooled cross-section datawith several observations on the same firms at differentpoints in time, we modelled the data using a random-effects Poisson estimation.7
The basic Poisson model for event count data can bewritten as follows:
Pr(Yit = yit) = exp(−�t)�yitit
yit!(10)
where the parameter �it represents the mean and the vari-ance of the event count and yit the observed count variable.It is furthermore assumed that:
�it = ˇ′xit . (11)
with xit being a vector of independent variables.The above specification assumes that the mean and
variance of the event count are equal. However, forpooled cross-section count data the variance often exceedsthe mean. This overdispersion is particularly relevant inthe case of unobserved heterogeneity.8 The presence ofoverdispersion does not bias the regression coefficients butthe computed standard errors in the Poisson regression areunderstated, resulting in an overestimation of the statisticalsignificance of the coefficients. Therefore, a random-effectsPoisson estimator used: it does not assume within-firmobservational independence for the purpose of computingstandard errors. For the random-effects Poisson estimatorEq. (2) is changed into:
�it = ˇ′xit + ui (12)
where ui is a random effect for the ith firm and reflects thefirm-specific heterogeneity.
Unobserved heterogeneity may be the result of differ-ences between companies in their innovation-generatingcapabilities, and as a consequence in their propensity orability to patent. Such unobserved heterogeneity, if presentand not controlled for, can lead to overdispersion in the data
7 We used a Hausman specification test (1978) to determine the choicebetween a random- and a fixed-effects model. This test was not significant,indicating that a random-effects model is consistent and efficient for thisanalysis.
8 Other papers within the same context as ours have also used the Pois-son random-effects such as Ahuja (2000a)—where he also studies the roleof alliances within a context of technological inventions and considers apatent count as the DV. Ta
ble
2D
escr
ipti
vest
atis
tics
and
corr
elat
ion
mat
rix
Var
iabl
eM
ean
S.D
.M
inim
um
Max
imu
m1
23
45
67
89
1011
1213
1415
16
1#
ofex
plo
rati
vep
aten
tsa
9.77
14.4
40
132
Stan
dar
diz
edva
lues
Min
imu
mM
axim
um
2Te
chn
ol.d
ista
nce
(TD
)42
.42
7.07
052
.4−0
.00
−4.9
31.
41
3TD
218
49
533.
922
.66
2754
0.02
0.98
4N
etw
ork
den
sity
(D)
1.32
0.58
0.47
2.94
−0.0
20.
160.
17−1
.43
2.78
5D
22.
071.
800.
226
8.62
−0.0
10.
150.
170.
976
Bet
wee
nn
ess
cen
tral
ity
(BC
)4.
455.
790
37.8
80.
240.
030.
00
0.11
0.11
−0.7
66.
08
7B
C2
53.3
413
8.8
014
340.
180.
030.
020.
150.
160.
918
TD*D
56.5
228
.27
6.80
148.
6−0
.02
0.46
0.47
0.93
0.91
0.11
0.15
9TD
*BC
190.
0425
2.6
016
550.
240.
100.
070.
130.
130.
990.
9101
510
BC
*D6.
218
10.6
20
100.
20.
170.
070.
050.
360.
370.
890.
900.
340.
9011
Firm
size
(ln
sale
s)8.
590
1.79
1.01
11.9
10.
190.
050.
030.
210.
230.
240.
220.
200.
230.
2512
R&
Din
ten
sity
0.10
20.
220
2.40
−0.0
6−0
.10
−0.0
9−0
.16
−0.1
5−0
.02
−0.0
3−0
.17
−0.0
3−0
.04
−0.5
913
Age
81.0
446
.02
023
60.
020.
020.
00
−0.0
4−0
.03
0.08
0.04
−0.0
30.
080.
050.
27−0
.28
14C
arm
anu
fact
ure
r0.
270.
44
01
0.01
0.24
0.25
0.67
0.67
0.11
0.14
0.6
80.
140.
280.
37−0
.17
002
15C
hem
ical
com
pan
y0.
360.
48
01
−0.0
4−0
.02
−0.0
4−0
.29
−0.3
0−0
.14
−0.1
2−0
.28
−0.1
5-0
.17
0.09
−0.2
10.
05−0
.45
16Fi
rmis
Euro
pea
n0.
250.
430
10.
030.
120.
120.
090.
080.
02−0
020.
120.
040.
04−0
.02
−0.1
2−0
.04
0.08
0.11
17Fi
rmis
US-
base
d0.
430.
49
01
−0.0
3−0
.01
0.04
−0.0
9−0
.08
0.01
0.01
−0.0
90.
010.
00
−0.1
60.
22−0
.11
−0.0
9−0
.20
−0.5
0
Not
es:
Bas
edon
762
obse
rvat
ion
s.C
orre
lati
ons
for
year
du
mm
ies
sup
pre
ssed
.a
Non
-sta
nd
ard
ized
valu
esfo
rva
riab
les
1–10
.

Author's personal copy1726
V.Gilsing
etal./Research
Policy37
(2008)1717–1731
Table 3Determinants of the patent rate of firms in explorative patent classes, 1986–1997
Variable Model 1 Model 2 Model 3 Model 4 Model 5 Model 6
Explanatory variablesTechnological distance 0.0631** (0.0282) 0.0441** (0.0208) 0.0634** (0.0291)(Technological
distance)2−0.0634** (0.0147) −0.0537*** (0.0152) −0.0412*** (0.0156)
Network density 0.1671*** (0.0308) 0.1877*** (0.0328) 0.1791*** (0.0331)(Network density)2 −0.1028*** (0.0132) −0.1087*** (0.0134) −0.1208*** (0.0142)Betweeness centrality 0.1258*** (0.0312) 0.1160*** (0.0376) 0.1209*** (0.0329)(Betweenness
centrality)2−0.0119* (0.0070) −0.0158** (0.0074) −0.0214** (0.0086)
(Technological distance)* (betweennesscentrality)
−0.0828*** (0.0282)
(Technological distance)* (density)
0.0293 (0.0191)
(Betweenesscentrality)* (density)
0.0299** (0.0128)
Control variablesFirm size (ln sales) 0.4351*** (0.0459) 0.4269*** (0.0460) 0.4036*** (0.0459) 0.4113*** (0.0458) 0.3745*** (0.0462) 0.3676*** (0.0465)R&D-intensity 1.1634*** (0.2452) 1.1325*** (0.2452) 1.0815*** (0.2467) 1.0779*** (0.2489) 0.9860*** (0.2472) 0.9430*** (0.2486)Age −0.0014 (0.0025) −0.0015 (0.0025) −0.0020 (0.0025) −0.0015 (0.0024) −0.0021 (0.0024) −0.0027 (0.0024)Car manufacturer −0.8821*** (0.3001) −0.8841*** (0.2980) −0.9476*** (0.3014) −0.8271*** (0.2904) −0.9402*** (0.2939) −0.9208*** (0.2972)Chemical industry −0.5303** (0.2705) −0.5570** (0.2698) −0.5387** (0.2700) −0.4364* (0.2648) −0.4907* (0.2665) −0.5205* (0.2680)Europe 0.4352 (0.2891) 0.3836 (0.2874) 0.3946 (0.2887) 0.3066 (0.2812) 0.2318 (0.2826) 0.2865 (0.2856)Asia 0.0698 (0.2658) 0.0185 (0.2652) 0.0878 (0.2671) 0.0355 (0.2588) 0.0137 (0.2617) 0.0711 (0.2651)Year dummy variablesa Included Included Included Included Included IncludedConstant −1.4792*** (0.5025) −1.321*** (0.5043) -0.8121 (0.5131) −1.2808** (0.4959) -0.4438 (0.5145) −0.3302 (0.5200)Alpha 0.9890***b (0.1457) 0.9935*** (0.1445) 0.9989*** (0.1445) 0.9359*** (0.1389) 0.9572*** (0.1403) 0.9773*** (0.1431)Number of firms 85 85 85 85 85 85Number of firms-years 762 762 762 762 762 762Log-Likelihood −3009.4 −2989.0 −2979.0 −2998.3 −2959.4 −2951.6Likelihood ratio test
(d.f.)c40.8*** 60.8*** 22.2*** 100.0*** 15.6***
d.f. (2) (2) (2) (6) (3)
Notes: Standard error between parentheses: *p < 0.10; **p < 0.05; ***p < 0.01.a Year dummy variables are included in the regressions but the coefficients and standard errors are not reported in the table.b Likelihood-ratio test of alpha = 0.c Likelihood-ratio test: model 2–5 vs. models 1 and 6 vs. model 5.

Author's personal copy
V. Gilsing et al. / Research Policy 37 (2008) 1717–1731 1727
or serial correlation. Differences in patenting behaviourbetween companies or between different years are cap-tured by including dummy variables in the model. First,the propensity to patent may be partly determined by thenationality of the companies or the industry to which theybelong. Similarly, we introduced annual dummy variablesto account for changes over time: they may capture theever-growing importance of intellectual capital or changingmacroeconomic conditions.
4. Results
Table 1 represents the description of the different vari-ables. Table 2 provides the descriptive statistics and thecorrelations between the variables for the 762 observationsin the sample. Although the sample represents the promi-nent firms in the three sectors, there is quite some variancein most of the key variables.
Table 3 represents the results of the regression anal-ysis using random-effects Poisson estimations to explainexplorative innovation performance of the firms in oursample. The estimated alpha coefficient is positive andsignificant. This indicates that important firm-level unob-served effects are present in the data and that a panelestimator is preferred above a pooled Poisson estimator.We focus on the full model (model 6) but also providethe basic model with only control variables (model 1) andmodels that include only one explanatory variable (models2–4), and a model including the three explanatory variablesbut without the interaction terms (model 5), to show thatthe coefficients are robust over the different models andthat multicollinearity is not a particular problem in theseregressions.
Models 2, 3 and 4 introduce respectively technologi-cal distance, network density and betweenness centralityas explanatory variables. The likelihood ratio tests indi-cate that the three models have more explanatory powerthan model 1. In model 2, the coefficients for the linear andquadratic term of the technological distance variable havethe expected sign and are significant. This result corrobo-rates Hypothesis 1.
Model 3 introduces the betweenness centrality of eachfocal firm and the overall network density as independentvariables. Hypothesis 2, claiming an inverse U-shaped rela-tion between the betweenness centrality and explorationis also corroborated. According to Hypothesis 3 we expectthat exploration is also an inverse-U shaped function of net-work density. The positive sign for the linear term and thenegative sign for the quadratic term indicate that we alsofind evidence for Hypothesis 3. The corroboration of thefirst three hypotheses also holds when the three explana-tory variables are simultaneously introduced in model 5.
Model 6 introduces the pairwise interaction termsbetween the three explanatory variables to test Hypotheses4–6. We expect a negative interaction effect between tech-nological distance and betweenness centrality (Hypothesis4), a positive interaction effect between technologicaldistance and density (Hypothesis 5), and a positive inter-action effect between betweenness centrality and density(Hypothesis 6). As Table 3 shows, the signs of these threeinteraction terms are correct but the coefficient for the
interaction term between technological distance and net-work density is not significant. As a result, Hypotheses 4 and6 are confirmed but there is no confirmation for Hypothesis5. The likelihood ratio test indicates that model 6 comparedto model 5 has more explanatory power. In other words, theintroduction of the three interaction terms is important inexplaining firms’ exploratory innovation performance.
There are also some interesting conclusions to drawfrom the control variables in Table 3. First, the coefficientsare stable over all the models, indicating the robustness ofthe results. Next, there are significant differences betweenthe three industries (chemical industry, car manufactur-ing and pharmaceutical industry) in their propensity toget involved in explorative innovation. The country of ori-gin of the different companies plays no role in explainingexploratory innovation.
Size has a positive and significant effect on the rateof innovation when firms are exploring new technologicalareas. Since this explanatory variable is in log form, its coef-ficient in the Poisson specification can be interpreted as theelasticity between firm size and the dependent variable.The coefficient is substantially smaller than one suggest-ing – ceteris paribus – that the frequency of patentingincreases with firm size but less than proportionately. Asa result, small firms are more innovative than larger firmswhen they explore new technologies. This is in line withthe results of previous research on the relation betweenfirm size and R&D (Nooteboom and Vossen, 1995), and withresearch showing that new and more radical inventions arelikely to originate within SMEs rather than in large firms(Leifer et al., 2000; Utterback, 1994; Christensen, 1997).This finding is also in line with the organizational learningliterature: large established organizations have difficul-ties in diversifying into new technological areas, inhibitingexperimentation and favouring specialization along exist-ing technological trajectories (Levinthal and March, 1993;March, 1991; Ahuja and Lampert, 2001).
As expected, R&D intensity has a positive and significanteffect on the innovation rate of the companies in the sam-ple. The age of the firm has a negative but non-significanteffect on exploratory patents. This result suggests thatestablished companies that had time to develop capabil-ities in particular technological fields do not necessarilyhave a competitive advantage over new entrants in theexploration of new technological fields. By contrast, thenegative coefficient for age indicates that newly establishedfirms might have a slight advantage in exploring new tech-nological fields (although the evidence is inconclusive asthe coefficient is not statistically significant), in line withprevious research on the role of new firms in the creationof new technologies (Methe et al., 1997).
5. Discussion and conclusions
The joint impact of the three explanatory variables isbest understood and consistent with the theoretical analy-sis (as specified in formulae 6–8), if we take all variables inmodel 6 – linear, quadratic and interaction terms – simulta-neously into consideration. To keep the analysis tractable,we start from the observation that firms can control orinfluence relations only with their direct partners and have

Author's personal copy
1728 V. Gilsing et al. / Research Policy 37 (2008) 1717–1731
Fig. 2. Explorative innovation performance at mean level of network den-sity.
virtually no possibilities to do so beyond their ego-network(Bae and Gargiulo, 2003). Therefore, it seems reasonableto consider global density as an exogenous variable forthe innovating firms. That leaves them with two variablesfor dealing with their alliance network when engaging inexploration endeavours, namely their network position andthe technological distance with their partners.
Consider Fig. 2 that represents the joint effect of tech-nological distance and network centrality, keeping networkdensity constant at the mean level.
As the figure shows, a (highly) central position in thenetwork yields ample potential for a high exploration per-formance, if one works with partners at a very limitedtechnological distance, and when supported by ‘sufficient’density (mean level). However, if working from such acentral position with partners that operate at a large(r)technological distance, performance drops rapidly. Theinterpretation of this finding may be as follows. Beinghighly central implies a higher chance of being faced withdifferent kinds of knowledge and information (Burt, 1992).This is beneficial for novelty value but also creates a needto understand and integrate potentially unrelated infor-mation. Therefore, being a highly central player requiresexploration at small technological distances in order to beable to absorb knowledge from all parts of the network.The price for not doing so is a sharp decrease in one’s inno-vation performance. Also note that the highest impact onexplorative innovation performance is found for firms witha central position especially at a very small technologicaldistance.
In contrast, a highly peripheral position (at very low orminimal BC) is a liability as it shows a much lower perfor-mance compared to more central positions, although suchpositions initially show an increase in innovation perfor-mance when technological distance increases. Moreover,being at the periphery can be advantageous at very highlevels of technological distance, where more central firmsperform comparatively less well. Being at the peripherygenerally implies that one is outside the immediate sight ofdominant and more central players. Because of this, selec-tion forces to comply with dominant designs and existing
Fig. 3. Explorative innovation performance at mean level of technologicaldistance.
systems of production, organization, technical standardsand so on, may be somewhat less stringent. Hence, deviat-ing from such prevailing ‘industry recipes’ (Spender, 1989)becomes easier (Gilsing and Nooteboom, 2005). As a con-sequence, firms at the periphery may enjoy more freedomto experiment with partners at a high technological dis-tance. It might be that this strategy yields more radicalinnovations with potentially more technological and eco-nomic value. However, the way we measure our dependentvariable (based on patent counts) does not take this intoaccount, an issue we come back to when discussing limita-tions and possibilities for future research.
Still, firms also need to consider the degree of over-all density and how it conditions their choices regardingposition and technological distance respectively. Considertherefore Fig. 3, showing the relation between density andbetweenness centrality while keeping technological dis-tance at its mean value.
Here we see that the effect of density on innovationperformance has a similar, curvilinear effect for both cen-tral and peripheral positions. In other words, irrespective ofone’s position, high density inhibits the existence and uti-lization of diversity, and hence of novelty value, while at lowlevels it does not support absorption sufficiently. We alsofind the highest impact on explorative innovation perfor-mance at intermediate levels of betweenness centrality (atleast when technological distance is kept at the mean level).However, a closer look at Fig. 3 reveals that high levels ofnetwork density in combination with high levels of central-ity also offer a fairly high impact on exploration. In short,we can say that at average technological distances, centralcompanies in (fairly) dense networks have an advantagedposition to develop explorative innovations.
Following our findings, we can conclude that our keyargument is confirmed, claiming that successful explo-ration requires a delicate balance between the ‘twin tasks’of novelty creation on the one hand and its efficient absorp-tion on the other hand. We found that highly centralfirms enjoy the strongest improvements of their explo-rative innovation performance and this effect declines
Author's personal copy
V. Gilsing et al. / Research Policy 37 (2008) 1717–1731 1729
steadily when centrality decreases, or alternatively whentechnological distance increases. Peripheral positions showthe least performance, although such positions can beattractive when cooperating with partners at a very largetechnological distance. In other words, success rates forexploration are not spread equally across network posi-tions.
However, position alone does not tell the full story. Ourempirical findings clearly indicate that exploration successalso depends on the two other dimensions of embedded-ness, namely technological distance and network density.Therefore, an important conclusion is that the three ele-ments of network embeddedness need to be consideredjointly in order to understand their complementary effectson both novelty creation and absorptive capacity. This isan important finding and contributes to the literature inseveral ways.
One is that it contrasts with the tradition in the literatureon alliances and interfirm networks with its bias towardsto the role of position (Powell et al., 2005). The message asconveyed from this study is that for exploration the valueof a position depends on the technological distance fromothers and on the degree of network density.
A second contribution is that the social network liter-ature specifically considers ‘social distance’ between anytwo nodes (here firms) in the network, in terms of thenumber of links on the shortest path between them. Herewe have added technological distance between any twofirms. This has enabled us to go beyond the dominantfocus on partners’ similarity and to understand the pos-itive role of technological distance in exploration. Such acognition-based view has been largely ignored by the lit-erature with its main focus on the role of economic andsocial factors regarding alliance formation and the role ofnetwork embeddedness (Gulati, 1998; Phelps, 2005).
It also contributes to the literature on learning andinnovation that stresses the recombination potential aris-ing from distances in cognition (Nelson and Winter, 1982;Nooteboom, 2000; Malerba, 2004), but leaves unexplainedwhat are the associated social structural implications.Moreover, considering the role of global density enablesone to go beyond the dyadic level, as has been mostly stud-ied in the literature (Salancik, 1995; Gulati, 1998; Powell etal., 2005). The focus on dyads reflects an undersocializedview of alliances and ignores how far positive effects of acentral or peripheral position can be mitigated or ampli-fied by the entire structure. We found that this structure, interms of its density, indeed plays an important role andconditions the potential benefits of different degrees ofcentrality for exploration. Both for central and peripheralpositions an intermediate degree of density seems to bemost effective. In contrast, high levels of density may inhibitthe existence and utilization of diversity, and hence of nov-elty value, while at low levels it does not support absorptionsufficiently.
This points to an interesting new insight that sheds a dif-ferent light on the validity of the arguments of Burt versusColeman. Success in exploration requires a dual empha-sis on the benefits of non-redundant contacts for potentialnovel combinations as well as on network density for inte-grating the diverse inputs obtained from such contacts. In
other words, it seems that both views convey some truthand may be seen as complements instead of oppositesas stressed in the literature (Hansen, 1999; McEvily andZaheer, 1999; Rowley et al., 2000; Ahuja, 2000b).
Limitations of this study, which may provide directionsfor future research, are as follows. One is that we have stud-ied exploration that is new to the firm. In other words,we cannot substantiate our claims and findings beyondthis relatively moderate degree of exploration. It thereforeseems useful in future studies to consider more radicaldegrees of exploration such as the discovery of ‘newlyemerging’ technologies (new to the industry) or ‘pioneer-ing’ technologies (new to the world), respectively (Ahujaand Lampert, 2001). For these kinds of exploration oneneeds partners at presumably (much) larger technologicaldistances than considered here and we anticipate that thiswill have major implications for the role of both between-ness centrality and density.
A second limitation relates to our dependent variable.We have counted the number of explorative patents foreach firm and in this way have treated all patents equally. Ofcourse, patents differ in technological and economic value,and taking this into account would definitely enrich futurework in this field. Weighing patents based on the numberof citations that they receive seems a straightforward wayto do this (Ahuja and Lampert, 2001). Such an approachwould also enable studying the validity of our conjecturethat peripheral firms have better possibilities for more rad-ical exploration when compared with central firms. A finallimitation is that we did not consider the effect of ‘tiestrength’ on exploration. Different types of alliances can beweighted according to the ‘strength’ of the relationship assome authors have done (see Contractor and Lorange, 1988;Gulati, 1995b; Nohria and Garcia-Pont, 1991). This wouldrequire additional research regarding which alliance type ismore instrumental for the exploration of new technologies.
Acknowledgements
We would like to thank the editors of this special issueand four anonymous reviewers for their extensive feed-back. The usual disclaimers apply.
References
Acs, Z., Audretsch, D.B., 1991. Innovation in large small firms: an empiricalanalysis. American Economic Review 78, 678–690.
Ahuja, G., 2000a. Collaboration networks, structural holes, and innovation:a longitudinal study. Administrative Science Quarterly 45, 425–455.
Ahuja, G., 2000b. The duality of collaboration: inducements and oppor-tunities in the formation of interfirm linkages. Strategic ManagementJournal 21 (3), 317–343.
Ahuja, G., Lampert, C.M., 2001. Entrepreneurship in the large corporation:a longitudinal study of how established firms create breakthroughinventions. Strategic Management Journal 22, 521–543.
Ahuja, G., Katila, R., 2004. Where do resources come from? The roleof idiosyncratic situations. Strategic Management Journal 25 (8/9),887–907.
Aiken, L.S., West, S.G., 1991. Multiple Regression: Testing and InterpretingInteractions. Sage Publications, Thousand Oaks, CA.
Bae, J., Gargiulo, M., 2003. Local action and efficient alliance strategies inthe telecommunications industry. INSEAD working paper.
Baum, J.A.C., Calabrese, T., Silverman, B.S., 2000. Don’t go it alone: alliancenetwork composition and startups’ performance in Canadian biotech-nology. Strategic Management Journal 21, 267–294.

Author's personal copy
1730 V. Gilsing et al. / Research Policy 37 (2008) 1717–1731
Buchko, A.A., 1994. Barriers to strategic transformation: interorgani-zational networks and institutional forces. Advances in StrategicManagement 10B, 81–106.
Burt, R.S., 1992. Structural Holes: The Social Structure of Competition.Harvard University Press, Cambridge, MA.
Burt, R.S., 2004. Structural holes and good ideas. American Journal of Soci-ology 110 (2), 349–399.
Carroll, G.R., Hannan, M.T., 2000. The Demography of Corporations andIndustries. Princeton University Press, Princeton.
Christensen, C., 1997. The Innovator’s Dilemma. Harvard Business SchoolPress, Boston.
Cohen, W.M., Levinthal, D.A., 1990. Absorptive capacity: a new perspec-tive on learning and innovation. Administrative Science Quarterly 35,128–152.
Coleman, J.S., 1988. Social capital in the creation of human capital. Amer-ican Journal of Sociology 94, S95–S120.
Contractor, F., Lorange, P. (Eds.), 1988. Cooperative Strategies in Interna-tional Business. Lexington Books, Lexington (Ma).
Duysters, G.M., Lemmens, C.E.A.V., 2003. Alliance group formation:enabling and constraining effects of embeddedness and social capi-tal in strategic technology alliance networks. International Studies ofManagement and Organization 33, 49–68.
Fleming, L., Sorenson, O., 2001. Technology as a complex adaptive system:evidence from patent data. Research Policy 30, 1019–1039.
Gilsing, V.A., 2005. The Dynamics of Innovation and Interfirm Net-works: Exploration, Exploitation and Co-evolution. Edward Elgar,Cheltenham.
Gilsing, V.A., Nooteboom, B., 2005. Density and strength of ties in innova-tion networks, an analysis of multimedia and biotechnology. EuropeanManagement Review 2, 179–197.
Gilsing, V.A., Nooteboom, B., 2006. Exploration and exploitation inbiotechnology. Research Policy 35, 1–23.
Gnyawali, D.R., Madhavan, R., 2001. Cooperative networks and competi-tive dynamics: a structural embeddedness perspective. Academy ofManagement Review 26, 431–445.
Granovetter, M.S., 1985. Economic action and social structure: the problemof embeddedness. American Journal of Sociology 91, 481–510.
Griliches, Z., 1979. Issues in assessing the contribution of research anddevelopment to productivity growth. Bell Journal of Economics 10 (1),92–116.
Griliches, Z. (Ed.), 1984. Patents and Productivity. NBER, Chicago.Gulati, R., 1995a. Does familiarity breed trust? The implications of repeated
ties for contractual choice in alliances. Academy of Management Jour-nal 30 (1), 85–112.
Gulati, R., 1995b. Social structure and alliance formation patterns: a lon-gitudinal analysis. Administrative Science Quarterly 40 (4), 619–652.
Gulati, R., 1998. Alliances and networks. Strategic Management Journal 19,293–317.
Gulati, R., Nohria, N., Zaheer, A., 2000. Strategic networks. Strategic Man-agement Journal 21, 203–215.
Hagedoorn, J., 1993. Understanding the rationale of strategic technologypartnering: interorganizational modes of cooperation and sectoral dif-ferences. Strategic Management Journal 14, 371–385.
Hagedoorn, J., Link, A.L., Vonortas, N., 2000. Research partnerships.Research Policy 29, 567–586.
Hagedoorn, J., Duysters, G.M., 2002. Learning in dynamic inter-firm net-works, the efficacy of quasi-redundant contacts. Organization Studies23, 525–548.
Hamel, G., 1991. Competition for competence and inter-partner learningwithin international strategic alliance. Strategic Management Journal12, 83–103 (Special issue).
Hansen, M.T., 1999. The search-transfer problem: the role of weak tiesin sharing knowledge across organization subunits. AdministrativeScience Quarterly 44, 82–111.
Hargadon, A., Sutton, R.I., 1997. Technology brokering and innovation ina product development firm. Administrative Science Quarterly 42,716–749.
Hausman, J., 1978. Specification tests in econometrics. Econometrica 46,1251–1271.
Hausman, J., Hall, B., Griliches, Z., 1984. Econometric models for count datawith an application to the patents—R&D relationship. Econometrica52, 909–938.
Henderson, R.M., Clark, K.B., 1990. Architectural innovation: the reconfig-uration of existing product technologies and the failure of establishedfirms. Administrative Science Quarterly 35, 9–30.
Henderson, R., Cockburn, I., 1996. Scale, scope and spillovers: the deter-minants of research productivity in drug discovery. Rand Journal ofEconomics 27 (1), 32–59.
Holland, J.H., 1975. Adaptation in Natural and Artificial Systems. The Uni-versity of Michigan Press, Ann Arbor, MI.
Kim, L., 1998. Crisis construction and organizational learning: capabil-ity building in catching-up at Hyundai Motor. Organization Science9, 506–521.
Knoke, D., Kuklinski, J.H., 1982. Network Analysis. Series: QuantitativeApplications in the Social Sciences. Sage, Beverly Hills and London.
Kogut, B., 1988. A study of the life cycle of joint ventures. In: Contractor,F., Lorange, P. (Eds.), Cooperative Strategies in International Business.Lexington Books, Lexington, MA, pp. 169–186.
Kogut, B., 1989. The stability of joint ventures: reciprocity and competitiverivalry. Journal of Industrial Economics 38, 183–198.
Koka, B.J., Madhavan, R., Prescott, J., 2006. The evolution of interfirmnetworks: environmental effects on patterns of network change.Academy of Management Review 31 (3), 721–737.
Kraatz, M.S., 1998. Learning by association? Interorganizational networksand adaptation to environmental change. Academy of ManagementJournal 41, 621–643.
Lane, P.J., Lubatkin, M., 1998. Relative absorptive capacity and interorga-nizational learning. Strategic Management Journal 19, 461–477.
Leifer, R., McDermott, C.M., Colarelli O’Connor, G., Peters, L.S., Rice, M.P.,Veryzer, R.W., 2000. Radical Innovation: How Mature Companies CanOutsmart Upstarts. Harvard Business School Press, Boston.
Leonard-Barton, D., 1984. Interpersonal communication patterns amongSwedish and Boston-area entrepreneurs. Research Policy 13, 101–114.
Levinthal, D.A., March, J.G., 1993. The myopia of learning. Strategic Man-agement Journal 14, 95–112 (Winter special issue).
March, J.G., 1991. Exploration and exploitation in organizational learning.Organization Science 2 (1), 71–87.
Madhavan, R., Koka, B.R., Prescott, J.E., 1998. Networks in transition: howindustry events (re)shape interfirm relationships. Strategic Manage-ment Journal 19 (5), 439–459.
Malerba, F. (Ed.), 2004. Sectoral Systems of Innovation. Cambridge Univer-sity Press, Cambridge.
McEvily, B., Zaheer, A., 1999. Bridging ties: a source of firm hetero-geneity in competitive capabilities. Strategic Management Journal 20,1133–1156.
Methe, D., Swaminathan, A., Mitchell, W., Toyama, R., 1997. The underem-phasized role of diversifying entrants and industry incumbents as thesources of major innovations. In: Thomas, H., O’Neal, D. (Eds.), StrategicDiscovery: Competing in New Arenas. Wiley, New York, pp. 99–116.
Moran, P., 2005. Structural versus relational embeddedness: social cap-ital and managerial performance. Strategic Management Journal 26,1129–1151.
Mowery, D.C., Oxley, J.E., 1995. Inward technology transfer and competi-tiveness: the role of national innovation systems. Cambridge Journalof Economics 19 (1), 67–93.
Mowery, D.C., Oxley, J.E., Silverman, B.S., 1996. Strategic alliances andinterfirm knowledge transfer. Strategic Management Journal 17, 77–91(Winter special issue).
Nelson, R., Winter, S., 1982. An Evolutionary Theory of Economic Change.Harvard University Press, Cambridge, MA.
Nohria, N., Garcia-Pont, G., 1991. Global strategic linkages and industrystructure. Strategic Management Journal 12, 105–124.
Nooteboom, B., 1991. Entry, spending and firm size in a stochastic R&Drace. Small Business Economics 3, 103–120.
Nooteboom, B., 1992. Towards a dynamic theory of transactions. Journalof Evolutionary Economics 2, 281–299.
Nooteboom, B., 1999. Inter-firm Alliances: Analysis and Design. Routledge,London.
Nooteboom, B., 2000. Learning and Innovation in Organizations and Eco-nomics. Oxford University Press, Oxford.
Nooteboom, B., 2002. Trust: Forms, Foundations, Functions, Failures andFigures. Edward Elgar, Cheltenham.
Nooteboom, B., Vanhaverbeke, W., Duysters, G.M., Gilsing, V.A., van denOord, A., 2005. Optimal cognitive distance and absorptive capacity.ECIS working paper 06-01.
Nooteboom, B., Vossen, R.W., 1995. Firm size and efficiency in R&D spend-ing. In: van Witteloostuijn, A. (Ed.), Competition and Cooperation.Kluwer, Deventer, pp. 69–86.
Ohmae, K., 1985. Triad Power: The Coming Shape of Global Competition.Free Press, New York.
Owen-Smith, J., Powell, W.W., 2004. Knowledge networks as channelsand conduits: the effects of spillovers in the Boston biotechnologycommunity. Organization Science 15, 5–21.
Pakes, A., Griliches, Z., 1984. Estimating distributed lags in shortpanels with an application to the specification of depreciation pat-terns and capital Stock constructs. Review of Economic Studies 51,243–262.
Phelps, C., June 2005. Technological exploration: a longitudinal study ofthe role of recombinatory search and social capital in alliance net-works. Working Paper. University of Washington, Seattle.

Author's personal copy
V. Gilsing et al. / Research Policy 37 (2008) 1717–1731 1731
Podolny, J.M., Stuart, T.A., 1995. A role-based ecology of technologicalchange. American Journal of Sociology 100 (5), 1224–1260.
Powell, W.W., Koput, K.W., Smith-Doerr, L., 1996. Interorganizationalcollaboration and the locus of innovation: networks of learning inbiotechnology. Administrative Science Quarterly 41, 116–145.
Powell, W.W., White, D.R., Koput, K.W., Owen-Smith, J., 2005. Networkdynamics and field evolution, the growth of interorganizational col-laboration in the life sciences. American Journal of Sociology 110,1132–1205.
Rothaermel, F.T., Deeds, D.L., 2004. Exploration and exploitation alliancesin biotechnology: a system of new product development. StrategicManagement Journal 25, 201–221.
Rowley, T., Behrens, D., Krackhardt, D., 2000. Redundant governance struc-tures: an analysis of structural and relational embeddedness in thesteel and semiconductor industries. Strategic Management Journal,Special Issue 21 (3), 369–386.
Salancik, G.R., 1995. Wanted: a good network theory of organization.Administrative Science Quarterly 40, 345–349.
Schumpeter, J., 1939. Business Cycles: A Theoretical, Historical, and Statis-tical Analysis of the Capitalist Process. McGraw Hill, New York.
Shan, W., Walker, G., Kogut, B., 1994. Interfirm cooperation and startupinnovation in the biotechnology industry. Strategic Management Jour-nal 15, 387–394.
Spender, J.C., 1989. Industry Recipes. Basil Blackwell, Oxford.Stuart, T.E., 1998. Network positions and propensities to collaborate:
an investigation of strategic alliance formation in a high-technologyindustry. Administrative Science Quarterly 43 (3), 668–698.
Stuart, T.E., Podolny, J.M., 1996. Local search and the evolution of techno-logical capabilities. Strategic Management Journal 17, 21–38 (Summerspecial issue).
Sorensen, J.B., Stuart, T.E., 2000. Aging, obsolescence and organi-zational innovation. Administrative Science Quarterly 45, 81–112.
Teece, D.J., 1986. Profiting from technological innovation: implications forintegration, collaboration, licensing and public policy. Research Policy15, 285–305.
Tidd, J., Bessant, J., Pavitt, K., 1997. Managing Innovation: Integrating Tech-nological, Market and Organisational Change. Wiley, Chichester.
Tushman, M.L., Rosenkopf, L., 1992. Organizational determinants of tech-nological change: toward a sociology of technological evolution.Research in Organizational Behavior 14, 311–347.
Utterback, J., 1994. Mastering the Dynamics of Innovation. Harvard Busi-ness School Press, Boston.
Uzzi, B., 1997. Social structure and competition in interfirm networks:the paradox of embeddedness. Administrative Science Quarterly 42,35–67.
Vanhaverbeke, W.P.A.M., Gilsing, V.A., Duysters, G.M., Beerkens, B., 2008.The role of alliance network redundancy in the creation of core andnon-core technologies: a local action approach. Journal of Manage-ment Studies (forthcoming).
Walker, G., Kogut, B., Shan, W., 1997. Social capital, structural holesand the formation of an industry network. Organization Science 8,109–125.
Wuyts, S., Colombo, M.G., Dutta, S., Nooteboom, B., 2005. Empirical test ofoptimal cognitive distance. Journal of Economic Behavior and Organi-zation 28, 277–302.
Zaheer, A., Bell, G.G., 2005. Benefiting from network position: firm capa-bilities, structural holes, and performance. Strategic ManagementJournal 26, 809–825.