
Network-based analysis of multivariate gene expression data
19
121 Andrei Y. Yakovlev et al. (eds.), Statistical Methods for Microarray Data Analysis: Methods and Protocols, Methods in Molecular Biology, vol. 972, DOI 10.1007/978-1-60327-337-4_8, © Springer Science+Business Media New York 2013 Chapter 8 Network-Based Analysis of Multivariate Gene Expression Data Wei Zhi, Jane Minturn, Eric Rappaport, Garrett Brodeur, and Hongzhe Li Abstract Multivariate microarray gene expression data are commonly collected to study the genomic responses under ordered conditions such as over increasing/decreasing dose levels or over time during biological processes, where the expression levels of a give gene are expected to be dependent. One important ques- tion from such multivariate gene expression experiments is to identify genes that show different expression patterns over treatment dosages or over time; these genes can also point to the pathways that are perturbed during a given biological process. Several empirical Bayes approaches have been developed for identifying the differentially expressed genes in order to account for the parallel structure of the data and to borrow information across all the genes. However, these methods assume that the genes are independent. In this paper, we introduce an alternative empirical Bayes approach for analysis of multivariate gene expression data by assuming a discrete Markov random field (MRF) prior, where the dependency of the differential expression patterns of genes on the networks are modeled by a Markov random field. Simulation studies indicated that the method is quite effective in identifying genes and the modified subnetworks and has higher sensitivity than the commonly used procedures that do not use the pathway information, with simi- lar observed false discovery rates. We applied the proposed methods for analysis of a microarray time course gene expression study of TrkA- and TrkB-transfected neuroblastoma cell lines and identified genes and subnetworks on MAPK, focal adhesion, and prion disease pathways that may explain cell differentia- tion in TrkA-transfected cell lines. Key words: Markov random field, Empirical Bayes, KEGG pathways Multivariate microarray gene expression data are commonly collected to investigate dose-dependent alterations in gene expression or time- dependent gene expression during a biological process. For example, dose-dependent gene expression data are often measured in the area of toxicology (1, 2) and time-course gene expression data are often 1. Introduction
Transcript of Network-based analysis of multivariate gene expression data

121
Andrei Y. Yakovlev et al. (eds.), Statistical Methods for Microarray Data Analysis: Methods and Protocols, Methods in Molecular Biology, vol. 972, DOI 10.1007/978-1-60327-337-4_8, © Springer Science+Business Media New York 2013
Chapter 8
Network-Based Analysis of Multivariate Gene Expression Data
Wei Zhi , Jane Minturn , Eric Rappaport , Garrett Brodeur , and Hongzhe Li
Abstract
Multivariate microarray gene expression data are commonly collected to study the genomic responses under ordered conditions such as over increasing/decreasing dose levels or over time during biological processes, where the expression levels of a give gene are expected to be dependent. One important ques-tion from such multivariate gene expression experiments is to identify genes that show different expression patterns over treatment dosages or over time; these genes can also point to the pathways that are perturbed during a given biological process. Several empirical Bayes approaches have been developed for identifying the differentially expressed genes in order to account for the parallel structure of the data and to borrow information across all the genes. However, these methods assume that the genes are independent. In this paper, we introduce an alternative empirical Bayes approach for analysis of multivariate gene expression data by assuming a discrete Markov random fi eld (MRF) prior, where the dependency of the differential expression patterns of genes on the networks are modeled by a Markov random fi eld. Simulation studies indicated that the method is quite effective in identifying genes and the modi fi ed subnetworks and has higher sensitivity than the commonly used procedures that do not use the pathway information, with simi-lar observed false discovery rates. We applied the proposed methods for analysis of a microarray time course gene expression study of TrkA- and TrkB-transfected neuroblastoma cell lines and identi fi ed genes and subnetworks on MAPK, focal adhesion, and prion disease pathways that may explain cell differentia-tion in TrkA-transfected cell lines.
Key words: Markov random fi eld , Empirical Bayes , KEGG pathways
Multivariate microarray gene expression data are commonly collected to investigate dose-dependent alterations in gene expression or time-dependent gene expression during a biological process. For example, dose-dependent gene expression data are often measured in the area of toxicology ( 1, 2 ) and time-course gene expression data are often
1. Introduction

122 W. Zhi et al.
collected during a dynamic biological process. For both the dose-dependent and time-course gene expression experiments, the data can be summarized as multivariate vectors, and one goal of such multivariate gene expression studies is to identify genes that have different overall expression patterns between two experiments; these genes can often lead to the identi fi cation of the pathways or subnet-works that are perturbed or activated during a given dose-dependent experiment or a dynamic biological process. Compared to gene expression studies of one single experimental condition, such multi-variate gene expression data can potentially identify more genes that are differentially expressed ( 3– 6 ) .
One important feature of the multivariate gene expression data is that the data are expected to be dependent across dosages or time points. Ef fi ciently utilizing such dependency can lead to a gain in ef fi ciency in identifying the differentially expressed genes. Yuan and Kendziorski in ( 3 ) and Wei and Li ( 6 ) developed the hid-den Markov model and hidden Markov random fi eld model to identify the differentially expressed genes at each time point for analysis of microarray time-course gene expression data. Instead of identifying genes that are differentially expressed at each time point during a biological process or at a given dosage level, the investiga-tors sometimes are only interested in identifying the genes that show different overall expression patterns during the experiments. Tai and Speed ( 4 ) developed an empirical Bayes method treating the observed time-course gene expression data as multivariate vec-tors. Hong and Li ( 5 ) developed a functional empirical Bayes method using B-splines. Both approaches treat the data as multi-variate vectors to account for possible correlations of gene expres-sions over different dosages or time points. These empirical Bayes have approved useful for identifying the relevant genes, they all make the assumptions that the genes are independent with respec-tive to their differential expression states. However, we expect that the differential expression states of genes with transcriptional regu-latory relationships are dependent.
The goal of this paper is to model such regulatory dependency by using the prior regulatory network information in order to increase the sensitivities of identifying the biologically relevant path-ways. Information about gene regulatory dependence has been accumulated from many years of biomedical experiments and is summarized in the form of pathways and networks and assembled into pathway databases. Some well-known pathway databases include KEGG, BioCarta ( www.biocarta.com ) and BioCyc ( www.biocyc.org ). The most common way of utilizing the known regula-tory network information in analysis of microarray gene expression data is to fi rst identify the differentially expressed genes using meth-ods, e.g., of ( 4 ) or ( 5 ) and then to map these genes to the network to visualize which subnetworks show differential expression or to perform some types of gene set enrichment analysis. One limitation of such an approach is that for many multivariate gene expression

1238 Network-Based Analysis of Multivariate Gene Expression Data
data sets, the sample sizes are usually small and therefore the approach often has limited power to identify the relevant subnet-works. Representing the known genetic regulatory network as an undirected graph, Wei and Li ( 7 ) and Wei and Pan ( 8 ) have recently developed hidden Markov random fi eld (MRF)-based models for identifying the subnetworks that show differential expression pat-terns between two conditions and have demonstrated using both simulations and applications to real data sets that the procedure is more sensitive in identifying the differentially expressed genes than those procedures that do not utilize the pathway structure informa-tion. However, neither of these explicitly models the multivariate expression data. Wei and Li in ( 6 ) extended the model of Wei and Li ( 7 ) and the HMM model of ( 3 ) to analyze the microarray time course gene expression in the framework of a hidden spatial–tem-poral MRF model. However, this approach aims to identify the dif-ferentially expressed genes at each time point and it assumes the same network dependency of the gene differential expression states at all the time points.
In this paper, to ef fi ciently identify the differentially expressed genes in the multivariate gene expression experiments, we develop the hidden MRF model of ( 7 ) further into a hidden MRF model for multivariate gene expression data in order to take into account potential dependency of gene expression over time and the known biological pathway information. We treat the multivariate gene expression data as multivariate data, allowing for dependency of the data across the dosage levels or over time points. Different from the popular empirical Bayes methods for analysis of multivari-ate gene expression data where genes and their differentially expres-sion states are assumed to be independent, this method models the dependency of the differentially expression states using a discrete Markov random fi eld and therefore enables the information of a known network of pathways to be ef fi ciently utilized in order to identify more biologically interpretable results. Although the for-mulation of the problem is similar to that of ( 7 ) , models for multi-variate gene expression data are more complicated and require new methods for estimating the model parameters. We propose to use both the moment estimate and maximum likelihood estimates in the iterative conditional mode (ICM) algorithm ( 9, 10 ) .
We fi rst introduce the hidden MRF model for multivariate expression data and present an ef fi cient algorithm for parameter estimation by the ICM algorithm. We then present results from simulation studies to demonstrate the application of the hidden MRF model, to compare with existing methods, and to evaluate the sensitivity of the method to misspeci fi cation of the network structure. For a case study, we apply the hidden MRF model to analyze the time-course gene expression data of TrkA- and TrkB-transfected neuroblastoma cell lines in order to identify the path-ways that are related to cell differentiation in TrkA-transfected cell lines. Finally, we present a brief discussion of the methods.

124 W. Zhi et al.
We fi rst introduce a hidden MRF model for multivariate gene expression data, where the network structure is represented as an undirected graph. The model is an extension of the model of ( 7 ) to multivariate gene expression data, where the distribution of latent differential states of the genes is modeled as a discrete MRF de fi ned on the prior network structure, and the empirical Bayes model of ( 4 ) are used for modeling the emission density for the observed multivariate gene expression data.
Consider the multivariate gene expression data measured under two different conditions over k dosage levels or time points, with n inde-pendent samples measured under one condition and m independent samples measured under another condition. For each experiment, we assume that the expression levels of p genes are measured. For a given gene g , we denote these data as i . i . d . k × 1 random vectors 1, ,g gn…Y Y for condition 1 and 1, ,g gm…Z Z for condition 2. We further assume that ~ ( , )gi kN μ Σgy gY and ~ ( , )gi kN μ Σgz gZ . For a given gene g , the null hypothesis of interest is
0 : .gH =gy gzμ μ (1)
De fi ne = −g gy gzμ μ μ . For a given gene g , let I g take the value of 1 if 0≠gμ and 0 if 0=gμ . We call the genes with I g = 1 the differ-entially expressed (DE) genes. Our goal is to identify these DE genes among the p genes.
Besides the gene expression data, suppose that we have a net-work of known pathways that can be represented as an undirected graph G = ( V , E ), where V is the set of nodes that represent genes or proteins coded by genes and E is the set of edges linking two genes with a regulatory relationship. Let p = | V | be the number of genes that this network contains. Note the gene set V is often a subset of all the genes that are probed on the gene expression arrays. If we want to include all the genes that are probed on the expression arrays, we can expand the network graph G to include isolated nodes, which are those genes that are probed on the arrays but are not part of the known biological network. For two genes g and g ¢ , if there is a known regulatory relationship, we write g ~ g ¢ . For a given gene g , let { : ~ }gN g g g E′ ′= ∈ be the set of genes that have a regulatory relationship with gene g and | |g gd N= be the degree for gene g .
Our goal is to identify the genes on the network G that are multi-variate differentially expressed between the two experimental con-ditions. Since two neighboring genes g and g ¢ have regulatory relationship on the network, we should expect that the DE states I g and
gI ′ are dependent. In order to model the dependency of I g
2. Statistical Models and Methods
2.1. Data Observed and Representation of Genetic Networks as Undirected Graphs
2.2. A Discrete Markov Random Field Model for Differential Expression States for Genes on the Network

1258 Network-Based Analysis of Multivariate Gene Expression Data
over the network, following Wei and Li ( 7 ) , we introduce a simple MRF model. Particularly, we assume the following auto-logistic model for the conditional distribution of I g ,
exp{ ( )}Pr( | , ) ,
1 exp{ ( )}g g
g gg
I F II I g g
F I′
′ ≠ =+
(2)
where
(2 1)( ) ,g gg N
gg
IF I
d
′′ ∈−
= γ + β∑
and g and b ³ 0 are arbitrary real numbers. Here the parameter b measures the dependency of the differential expression states of the neighboring genes. We assume that the true DE states * *( ) { , 1, , }g gI I g p= = … is a particular realization of this locally dependent MRF. Note that when b = 0, the model assumes that all the I g s are independent with the same prior probability exp( g )/(1 + exp( g )) of being a DE gene.
To relate the differential expression state I g to the observed gene expression data 1 1( , , ; , , )g g gn g gm= … …D Y Y Z Z , we follow the empirical Bayes approach of Tai and Speed ( 4 ) for multivariate gene expression data and use conjugate priors for gμ and gΣ , that is, an inverse Wishart prior for gΣ and a dependent multivariate normal prior for gμ . To make notation simple, we drop the gene subscript g when introducing the Bayesian model. Let
1 1
1
1
1 1
1
( ) / , ( ) / , ,
( 1) ( )( ) ,
( 1) ( )( ) , ( 2) (( 1) ( 1) ).
n m
n
i ii
m
i ii
n m
n
m n m n m
−
=
− −
=
= + + = + + = −
= − − − ′
= − − − = + − − + −′
∑
∑
y
z y z
Y Y Y Z Z Z X Y Z
S Y Y Y Y
S Z Z Z Z S S S
� �
Following ( 4 ) , we assign independent and identical inverse Wishart priors to S , 1 1~ (( ) , )W − −Σ νΛ ν . Given S , we assign multivariate normal priors for the gene-speci fi c mean difference m for the two cases ( I = 1) and ( I = 0):
1| , 1 ~ (0, ),| , 0 0.
kI NI
−μ Σ = η Σμ Σ = ≡
Since the statistics ( –X , S ) are the suf fi cient statistics for the param-
eters ( m , S ) (Tai and Speed ( 4 ) ), the conditional distribution of the data 1 1( , , , , , )n m= … …D Y Y Z Z can be written as
= … … =1 1( | ) ( , , , , , | ) ( , | ).-n mP I P I P ID Y Y Z Z SX
2.3. Emission Probabilities for Multivariate Gene Expression Data and the HMRF Model

126 W. Zhi et al.
Tai and Speed further derived in ( 4 )
−
− −− − −
− −−
+ ν− − − −
Γ + ν= =
Γ − Γ ν
× − ν π + + η
Λ×
+ + + η νΛ ′ +
( 1)1 1 12 2 2
( 2)2 2
( )1 1 1 1 2
(( ) / 2)( | 1)
(( 1) / 2) ( / 2)
( 1) ( ( ))
| | | |,
| (( ) ) * |
k
k k
k N kN k
N kN
N
k
NP I
N
N n m
n m S
D
S
I XX
(3)
where N = n + m − 1 and * 1( / ( 1))S N −νΛ − S . Thus, given I = 1, the probability density function of the data is a function of X and S only, which follows a Student-Siegel distribution ( see ref. 11 ) . Following ( 11 ) and ( 4 ) ’s notation, this distribution is denoted by 1 1 1 1( ,0,( ) , 1,( 1) )kStSi n m N N− − − −ν + + η Λ − − νΛ . Similarly, the distribution of P ( D | I = 0) follows 1 1( ,0,( ) ,kStSi n m− −ν + Λ
11,( 1) )N N −− − νΛ with the following density function
( 1)
1 12 2 2
2
1 2
2
1 1
2
(( ) / 2)( | 0)
(( 1) / 2) ( / 2)
( 1) ( ( ))
| | | |.
| (( ) ) *|
k
k k
k N kN k
N N k
N
k
NP I
N
N n m
n m S
− − −− −
− −−
+ν− − −
Γ + ν= =Γ − Γ ν
× − ν π +
Λ×+ + νΛ +′
D
S
I XX
(4)
Together the transition probability ( 2 ) and the emission probabili-ties ( 3 ) and ( 4 ) de fi ne a hidden MRF model for multivariate gene expression data with parameters in the emission probabilities Q = ( h , n , L ). De fi ne 1( ) { , , }g pI I I= … to be a vector of the differential expression states of the p genes on the network. By Bayes rule, Pr( | ) Pr( | ) Pr( )g g gI I I∝ ×D D . The estimate ˆ( )gI that maximizes Pr( | )gI D is a maximum a posterior (MAP) estimate under 0–1 loss. In order to estimate the parameters and ( I g ), we make the fol-lowing conditional independence assumption.
Assumption : Given any particular realization ( I g ), the random vari-ables 1 2( ) ( , , , )g= …D D D D are conditionally independent and each gD has the same unknown conditional density function ( | )g gP ID , dependent only on I g . The conditional density of the observed gene expression data D , given G and parameter Q = ( h , n , L ), is simply,
1
( | ( ) ( | )( ,) )p
g g g gg
L I P Iθ=
= ∏D D (5)
where ( | )g gP ID is de fi ned as ( 3 ) or ( 4 ).

1278 Network-Based Analysis of Multivariate Gene Expression Data
When inferring *( )gI , parameter estimation must be carried out simultaneously. We propose the following ICM algorithm of Besag ( 10 ) to simultaneously estimate the parameter Q = ( h , n , L ) with a positive de fi nite constraint on the covariance matrix L in the emission probability model and the parameter F = ( g , b ) in the auto-logistic model. Simultaneously estimating the covariance matrix L is dif fi cult due to the fact that its estimate has to be positive de fi nite. We propose to fi rst estimate L ¢ using the moment estimator in ( 4 ) . Speci fi cally, by the weak law of large numbers, S converges in probability to 1( 1)k −ν − − νΛ . Therefore, L can be estimated by 1ˆ ( 1)k′ −Λ = ν ν − − S , where ν = ν + = …ˆ ˆmax(mean( ), 6), 1, ,j k j k , and ˆ jν is the estimated prior degrees of freedom based on the j th diagonal elements of the gene-speci fi c sample variance–covariance matrices using the method proposed in Section 6.2 in ( 12 ) . We then fi x L at its estimate and estimate the other model parameters within the following ICM algorithm ( 10 ) , which involves the fol-lowing iterative steps:
S1 . Obtain an initial estimate ˆ( )gI of the true state *( )gI , using simple two sample Hotelling’s T 2 test.
S2 . Estimate Q by the value ̂θ which maximizes the likelihood ˆ(D | ( ))gL IΘ .
S3 . Estimate F by the value F which maximizes the following pseudo-likelihood
1
ˆexp{ (( )}ˆ(( ) .ˆ1 exp{ (( ))
}
)
)
Gg g
gg g
I F IL I
F I=
=+
∏Φ
S4 . Carry out a single cycle of ICM based on the current ˆ ˆ( ),gI θ and �Φ , to obtain a new ˆ( )gI : for g = 1 to p , update I g which maximizes
�ˆ ˆ ˆ( | , , ) ( | ; ) ( | , ; ).g g g gg g
P I I g g P I P I I g g′ ′′ ′≠ ∝ θ ≠D D Φ
S5 . Go to step 2 until there is convergence in the estimates. In step 2 , Q = ( h , n ) in the HMRF model and they can be esti-
mated using any numerical optimization procedure. After the con-vergence of the ICM algorithm and obtaining the parameter estimates, we can run the Gibbs sampling to obtain the estimate of the posterior probability of Pr( 1 | data)gI = for each of the gene g . These posterior probabilities can then be used for selecting the DE genes.
3. Estimation of the Model Parameters and the Posterior Probabilities of the DE States

128 W. Zhi et al.
We performed simulation studies to evaluate the proposed method and to compare results with other methods for identifying the DE genes. Following ( 7 ) , we fi rst obtained 33 human regulatory path-ways from the KEGG database (December 2006), where we retained only gene–gene regulatory relations. These 33 regulatory pathways are inter-connected and formed a network of regulatory pathways. We represent such a network as an undirected graph where each node is a gene and two nodes are connected by an edge if there is a regulatory relation between corresponding genes. Loops (nodes connected to themselves) were eliminated. This results in a graph with 1,668 nodes and 8,011 edges.
To simulate the differential expression states of the genes on this network, we initialized the genes in the K pathways to be DE and the rest genes to be EE, which gives us the initial G 0 . We then performed sampling fi ve times based on the current gene differen-tial expression states, according to the Markov random fi eld model with 0 1 1γ = γ = and b = 2 ( see ref. 7 ) . We chose K = 5, 9, 13, 17 to obtain different percentages of genes in DE states. After obtaining the differential expression states for the genes, we simulated the multivariate gene expression levels based on the empirical Bayes models, using the same parameters as in ( 4 ) : h = 0.5, n = 13 and L = A × 10 −3 , where
14.69 0.57 0.99 0.40 0.55 0.51 0.230.57 15.36 1.22 0.84 1.19 0.91 0.860.99 1.22 14.41 2.47 1.81 1.51 1.070.40 0.84 2.47 17.05 2.40 2.32 1.330.55 1.19 1.81 2.40 15.63 3.31 2.750.51 0.91 1.51 2.32 3.31 13.38 3.150.23 0.86 1.07 1.33 2 7 3
. 5
A
−
=
−
.
.15 12.90
⎛ ⎞⎜ ⎟⎜ ⎟⎜ ⎟⎜ ⎟⎜ ⎟⎜ ⎟⎜ ⎟⎜ ⎟⎜ ⎟⎝ ⎠
For each condition, we chose the number of independent replications to be 3 for each group and repeated the simulation 100 times.
We fi rst examined the parameter estimates of Q = ( h , n ) using three different methods: the empirical Bayes (EB) method of Tai and Speed ( 4 ) , the ICM algorithm incorporating the network struc-tures and the ICM algorithm assuming that all the nodes are singletons (i.e., no dependency of the differential expression states). The performance results are shown in Table 1 . We observed that both ICM algorithms provide better estimates of both h and n than the EB algorithm.
4. Simulation Study
4.1. Comparison with the Method of Tai and Speed

1298 Network-Based Analysis of Multivariate Gene Expression Data
Table 1 Comparison of parameter estimates of three different procedures for four sets of simulations with different percentages of DE genes ( q )
Method Parameter Percentage of DE genes ( q )
0.12 (0.005) 0.19 (0.008) 0.36 (0.009) 0.49 (0.008)
HMRF η̂ 0.38 (0.026) 0.40 (0.028) 0.41 (0.018) 0.44 (0.020) ν̂ 13.01 (0.061) 13.06 (90.061) 13.12 (0.059) 13.18 (0.057)
HMRF-I η̂ 0.31 (0.019) 0.34 (0.017) 0.37 (0.013) 0.39 (0.012) ν̂ 13.03 (0.060) 13.06 (0.060) 13.15 (0.057) 13.22 (0.056)
EB η̂ 0.067 (0.004) 0.053 (0.003) 0.042 (0.002) 0.039 (0.001) ν̂ 7.27 (0.21) 7.43 (0.21) 7.86 (0.23) 8.21 (0.25)
HMRF the proposed HMFR model and the ICM algorithm using the network structures, HMRF-I the proposed HMFR model and the ICM algorithm without using the network structures, EB the empirical Bayes method of of Tai and Speed (2006). Parameter estimates are averages over 100 simulations; standard error is shown in parentheses. The true parameters are ( h , n ) = (0.5, 13)
We then compare the sensitivity, speci fi city, and FDR in iden-tifying the DE genes with the EB method of ( 4 ) . Since the EB method only provides ranks of the genes and does not infer gene states, for the purpose of comparison, we chose a cutoff value to declare genes to be DE using their method so that their approach would have the closest observed FDR levels to our proposed method. We applied the HMRF model to the simulated data sets. The results are summarized in Table 2 , clearly showing that our approach obtained signi fi cant improvement in sensitivity compared to the other approaches making an independence assumption of genes. The smaller p was, the more improvements we obtained. At the same time, our approach also achieved lower FDRs and comparable speci fi city. Our proposed algorithm assuming that the genes are independent give very similar results to the EB method of ( 4 ) .
Due to the fact that our current knowledge of biological networks is not complete, in practice, it is possible that the network struc-tures that we use for network-based analysis are misspeci fi ed. The misspeci fi cation can be due to either the true edges of the networks being missed or the wrong edges being included in the network, or both of these scenarios. We performed simulation studies to evalu-ate how sensitive the results of the HMRF approach are to these three types of misspeci fi cations of the network structures. We used the same data sets of 100 replicates as in the previous section but used different misspeci fi ed network structures when we fi tted the hidden MRF model.
4.2. Sensitivity to Misspeci fi cation of the Network Structure

130 W. Zhi et al.
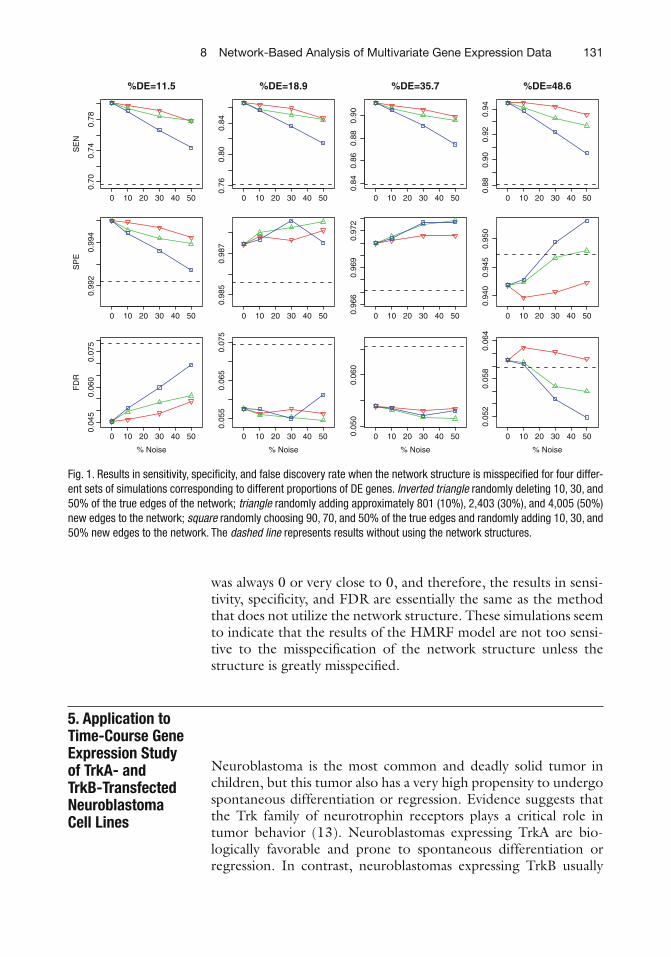
For the fi rst scenario, we randomly removed 801 (10%), 2,403 (30%) and 4,005 (50%), respectively, from the 8,011 true edges from the true KEGG networks when we fi t the hidden MRF model. For the second scenario, we randomly added approximately 801, 2,403, and 4,005 new edges to the KEGG network, respectively. Finally, for the third scenario, we randomly selected 90, 70, and 50% of the 8,011 true edges and also randomly added approxi-mately 801, 2,403, and 4,005 new edges to the network, respec-tively, so that the total number of edges remains approximately 8,011. The results of the simulations over 100 replications are summarized as Fig. 1 . First, as expected, since the true number of DE genes is small, the speci fi cities of the HMRF procedure remain very high and are similar when the true network structure is used. Second, we also observed that the FDR rates also remain almost the same as when the true structure is used. However, we observed some decreases in sensitivity in identifying the true DE genes. It is worth pointing out even when the network structure is largely misspeci fi ed as in scenario 3, the results from the HMRF model are still comparable to those obtained from the HMRF-I approach where the network structure is not utilized.
Finally, we also applied these simulated data with a randomly created network structure with the same number of nodes and edges. As expected, in this case, the estimate of the b parameter
Table 2 Comparison of performance in terms of sensitivity, speci fi city, and false discovery rate (FDR) of three different procedures based on 100 replications for four different scenarios with different percentages of DE genes ( q )
q Method Sensitivity Speci fi city FDR
0.115 (0.005) HMRF 0.80 (0.029) 1.00 (0.0023) 0.045 (0.019) HMRF-I 0.70 (0.042) 0.99 (0.0027) 0.079 (0.025) EB 0.69 (0.054) 0.99 (0.0027) 0.079 (0.05)
0.189 (0.008) HMRF 0.87 (0.033) 0.99 (0.0049) 0.058 (0.020) HMRF-I 0.76 (0.03) 0.99 (0.004) 0.074 (0.018) EB 0.75 (0.032) 0.99 (0.0041) 0.075 (0.018)
0.357 (0.009) HMRF 0.91 (0.016) 0.97 (0.0065) 0.054 (0.010) HMRF-I 0.84 (0.020) 0.97 (0.0063) 0.066 (0.011) EB 0.83 (0.022) 0.97 (0.0064) 0.066 (0.011)
0.486 (0.008) HMRF 0.95 (0.012) 0.94 (0.012) 0.061 (0.012) HMRF-I 0.88 (0.015) 0.95 (0.0086) 0.060 (0.0093) EB 0.88 (0.015) 0.95 (0.0087) 0.060 (0.0094)
HMRF the proposed HMFR model using the network structures, HMRF-I the proposed HMFR model without using the network structures, EB the empirical Bayes method of Tai and Speed ( 4 ) with FDRs matched to the HMRF algo-rithm. Summaries are averaged over 100 simulations; standard deviation is shown in parentheses
1318 Network-Based Analysis of Multivariate Gene Expression Data
was always 0 or very close to 0, and therefore, the results in sensi-tivity, speci fi city, and FDR are essentially the same as the method that does not utilize the network structure. These simulations seem to indicate that the results of the HMRF model are not too sensi-tive to the misspeci fi cation of the network structure unless the structure is greatly misspeci fi ed.
Neuroblastoma is the most common and deadly solid tumor in children, but this tumor also has a very high propensity to undergo spontaneous differentiation or regression. Evidence suggests that the Trk family of neurotrophin receptors plays a critical role in tumor behavior ( 13 ) . Neuroblastomas expressing TrkA are bio-logically favorable and prone to spontaneous differentiation or regression. In contrast, neuroblastomas expressing TrkB usually
5. Application to Time-Course Gene Expression Study of TrkA- and TrkB-Transfected Neuroblastoma Cell Lines
0.70
0.74
0.78
%DE=11.5S
EN
0.76
0.80
0.84
%DE=18.9
0.84
0.86
0.88
0.90
%DE=35.7
0 10 20 30 40 50 0 10 20 30 40 50 0 10 20 30 40 50 0 10 20 30 40 50
0.88
0.90
0.92
0.94
%DE=48.60.
992
0.99
4
SP
E
0.98
50.
987
0.96
60.
969
0.97
2
0 10 20 30 40 50 0 10 20 30 40 50 0 10 20 30 40 50 0 10 20 30 40 50
0.94
00.
945
0.95
0
0.04
50.
060
0.07
5
% Noise
FD
R
0.05
50.
065
0.07
5
% Noise
0.05
00.
060
% Noise
0 10 20 30 40 50 0 10 20 30 40 50 0 10 20 30 40 50 0 10 20 30 40 50
0.05
20.
058
0.06
4
% Noise
Fig. 1. Results in sensitivity, speci fi city, and false discovery rate when the network structure is misspeci fi ed for four differ-ent sets of simulations corresponding to different proportions of DE genes. Inverted triangle randomly deleting 10, 30, and 50% of the true edges of the network; triangle randomly adding approximately 801 (10%), 2,403 (30%), and 4,005 (50%) new edges to the network; square randomly choosing 90, 70, and 50% of the true edges and randomly adding 10, 30, and 50% new edges to the network. The dashed line represents results without using the network structures.

132 W. Zhi et al.
have MYCN ampli fi cation and are among the most aggressive and deadly tumors known. These tumors also express the TrkB ligand, resulting in an autocrine survival pathway. Unlike the TrkA-expressing tumors, exposure to ligand promotes survival under adverse conditions, but does not cause differentiation. In order to explore the biological basis for the very different behavior of neu-roblastomas expressing these highly homologous neurotrophin receptors, a microarray time-course gene expression study was conducted by transfecting TrkA and TrkB into SH-SY5Y cells, a neuronal subclone from the NB cell line SK-N-SH. In particular, full length TrkA and TrkB were cloned into the retroviral expres-sion vector pLNCX and transfected into SH-SY5Y cells. Cells were then serum starved overnight and treated with either nerve growth factor (NGF) and brain-derived neurotrophic factor (BDNF) at 37 °C for 0–12 h. Fifteen micrograms of total RNA were then col-lected from TrkA- and TrkB-SY5Y cells exposed to 0, 1.5, 4, and 12 h of NGF or BDNF and the gene expressions were pro fi led using the Affymetrix GeneChip 133A. Four and three replicates were performed for the TrkA and TrkB cells, respectively. The robust multiarray (RMA) procedure ( 14 ) was used to obtain the gene expression measures.
To perform network-based analysis of the data, we merged the gene expression data with the 33 KEGG regulatory pathways and identi fi ed 1,533 genes on the Hu133A chip that could be found in the 1668-node KEGG network of 33 pathways. Instead of consid-ering all the genes on the Hu133A chip, we only focused our anal-ysis on these 1,533 genes and aimed to identify which genes and which subnetworks of the KEGG network of 33 pathways are potentially related to the cell differentiation of TrkA-transfected cell lines. We analyzed the data using the HMRF model and obtained parameter estimates of a = −1.58 and b = 0.39, indicating that there are more genes with similar expression patterns than those with different expression patterns. Our method identi fi ed 210 DE genes out of the 1,533 KEGG genes with posterior prob-ability of being a DE gene greater than 0.5, among these 118 are connected on the KEGG pathways and 92 are isolated, not collect-ing to other DE genes. There is a large cluster of genes that are largely upregulated in the Trk A transfected cells but are down-regulated in the Trk B transfected cells. Similarly, there is a cluster of genes that are upregulated in the Trk B-transfected cells but are downregulated in the Trk A transfected cells ( see Fig. 2 ).
Among the 33 KEGG regulatory pathways, enrichment analy-sis using DAVID Tools ( 15 ) identi fi ed that the mitogen-activated protein kinase (MAPK) signaling pathway, focal adhesion path-way, and pathway related to prion diseases are enriched with p -val-ues of 0.012, 0.029, and 0.05, respectively, of which the MAPK signaling pathway and the focal adhesion pathway are inter-con-nected. The MAPK (Erk1/2) signal transduction pathway is
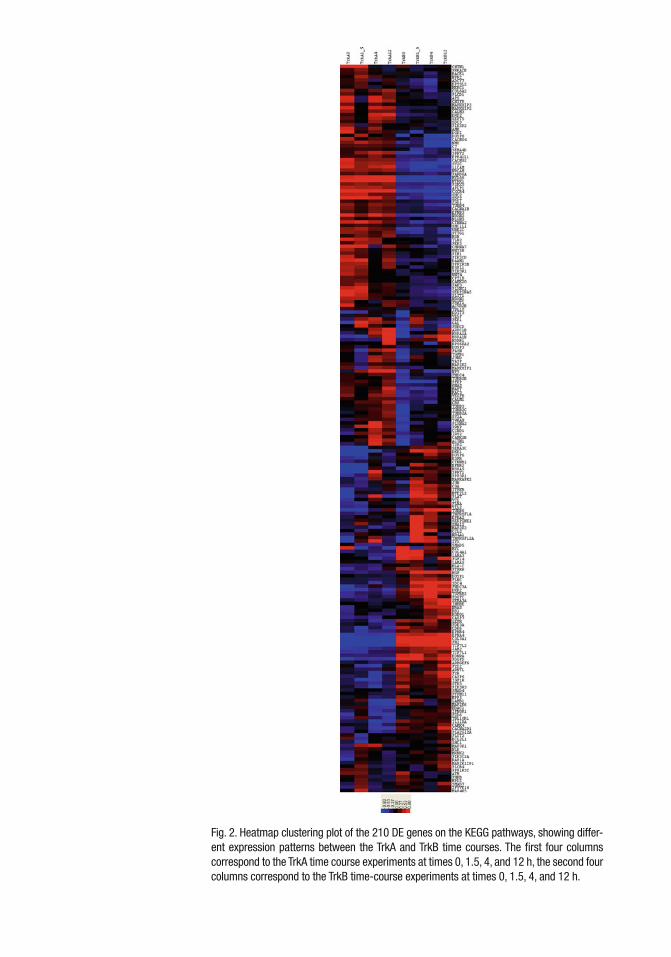
Fig. 2. Heatmap clustering plot of the 210 DE genes on the KEGG pathways, showing differ-ent expression patterns between the TrkA and TrkB time courses. The fi rst four columns correspond to the TrkA time course experiments at times 0, 1.5, 4, and 12 h, the second four columns correspond to the TrkB time-course experiments at times 0, 1.5, 4, and 12 h.
134 W. Zhi et al.
expressed and active in both TrkA and TrkB expressing NB cells after speci fi c ligand-mediated Trk receptor phosphorylation. The distinct role that this signaling pathway plays in the biologic het-erogeneity of NB is not well known; however, we have shown that the time course of pathway activation by phosphorylation of signal effector proteins is different between TrkA- and TrkB-expressing NB cells, and this may, in part, explain the biological differences between TrkA- vs. TrkB-expressing tumors. To give a detailed comparison of TrkA- and TrkB-mediated genomic responses, we present in Figs. 3 and 4 the DE genes on the MAPK signaling pathway and on the KEGG focal adhesion pathway. On the MAPK pathway, it is not surprising that the TrkA/B shows different expression patterns. We also observed that a cluster of genes (or a subnetwork) in the neighborhood of ERK shows different expres-sion patterns, including MEK2, MP1, PTP, MKP, Tau, cPLA2, MNK1/2, and c-Myc ( see Fig. 3 ). This subnetwork, leading to cell proliferation and differentiation, may partially explain the dif-ference in cell differentiation between the TrkA- and TrkB-infected NB cells. Another interesting subnetwork in the neighborhood of p38, including MKK3, MKK6, PTP, MKP, MAPKAPK, GADD153, and HSP27, also showed differential expression patterns. This subnetwork also related to cell proliferation and differentiation. Activation of these two subnetworks on the MAPK pathway may explain the different biological behaviors of these two types of NB cells, especially in terms of cell differentiation. MAPK signaling in the nervous system has been shown to promote a broad array of biologic activities including neuronal survival, differentiation, and plasticity. Regulating the duration of MAPK signaling is impor-tant in neurogenesis, and likely plays a similar role in the behavior of Trk-expressing neuroblastomas. Prolonged activation of MAPK is correlated with neurotrophin-dependent cell cycle arrest and terminal cellular differentiation in the PC12 pheochromocytoma cell line, whereas short-duration MAPK signaling is correlated with mitogenic and proliferative cell signaling in PC12 cells ( 15 – 19 ) . TrkA-expressing NB cells treated with NGF (which activates MAPK) increase the number and length of extended neurites and decrease cell proliferation resulting in a more mature neuronal appearing cell, while TrkB-expressing NB cells treated with ligand (BDNF) increase cell proliferation without morpho-logic differentiation.
Increasing evidence suggests an important role for the focal adhesion kinase (FAK) pathway ( see Fig. 4 ) in regulating cancer cell adhesion in response to extracellular forces or mechanical stress. Studies have demonstrated that tumor cells are able to reg-ulate their own adhesion by over-expression or alteration in activ-ity of elements within the FAK signaling pathway, which may have implications in the survival, motility, and adhesion of metastatic tumor cells ( 20 ) . While mechanotransduced stimulation of the

1358 Network-Based Analysis of Multivariate Gene Expression Data
Fig.
3. D
iffer
entia
l exp
ress
ion
stat
es fo
r gen
es o
n th
e KE
GG M
APK
path
way
, whe
re g
enes
col
ored
in d
ark
gray
are
mul
tivar
iate
diff
eren
tially
exp
ress
ed a
nd th
ose
colo
red
in li
ght g
reen
ar
e eq
ually
exp
ress
ed.

136 W. Zhi et al.
Fig.
4. D
iffer
entia
l exp
ress
ion
stat
es fo
r gen
es o
n th
e KE
GG F
ocal
Adh
esio
n pa
thw
ay, w
here
gen
es c
olor
ed in
dar
k ar
e m
ultiv
aria
te d
iffer
entia
lly e
xpre
ssed
and
thos
e co
lore
d in
ligh
t gr
een
are
equa
lly e
xpre
ssed
.

1378 Network-Based Analysis of Multivariate Gene Expression Data
FAK signaling pathway appears to be a cell surface receptor inde-pendent process, the FAK pathway also acts downstream of recep-tor tyrosine kinases and has been shown to be phosphorylated in response to external cytokine/ligand stimuli. The insulin-like growth factor-1 receptor (IGF-1R) and FAK physically interact in pancreatic adenocarcinoma cells resulting in activation of a com-mon signal transduction pathway that leads to increased cell pro-liferation and cell survival ( 21 ) . In neuroblastoma, MYCN regulates FAK expression by directly binding to the FAK pro-moter, and increasing transcription of FAK mRNA. Beierle et al. ( 22 ) have correlated FAK mRNA abundance with MYCN expres-sion in MYCN-ampli fi ed and non-ampli fi ed NB cell lines by real-time quantitative PCR, and their data suggest that MYCN regulation of FAK expression directly impacts cell survival and apoptosis. On the focal adhesive pathway, we observed a subnet-work of six genes, Actinin, Filamin, Talin, Zyxin, VASP, and Vinculin, that show differential expression patterns ( see Fig. 4 ). In addition, PI3K and its neighboring genes GF, RTK, Shc, and Ha-Ras show differential expression patterns. We have not yet explored the regulation of FAK pathway activity by TrkA or TrkB expression and activation in our NB cell lines, but the differential expression states for genes on the KEGG FAK pathway suggest differential mediation by TrkA vs. TrkB, that may have down-stream biological relevance.
Finally, on the pathway related to prion disease, we observed that Prion Protein (PrPc) and its neighboring genes HSPA5, APLP1, NRF2, and LAMB1 show differential expression patterns.
In this paper we have proposed a hidden MRF model and an ICM algorithm that utilizes the gene regulatory network information to identify multivariate differentially expressed genes. The method extended the approach of ( 7 ) for univariate to multivariate gene expression data such as time course data. Also different from the approach of ( 6 ) for network-based analysis of microarray time-course gene expression data, this new approach identi fi es the genes that show different expression patterns over time rather than identi fi es the differentially expressed genes at each time point. Instead of assuming that all genes are independent as in the empiri-cal Bayes approach of ( 4 ) , our method models the dependency of the latent differential expression states based on the prior regula-tory network structures. Simulation studies show that our methods outperform the methods that do not utilize network structure information. We applied our method to analyze the MTC data of TrkA- and TrkB-transfected neuroblastoma cell lines and identi fi ed
6. Conclusion and Discussion
138 W. Zhi et al.
the MAPK and focal adhesive pathways from the KEGG that are related to cell differentiation in TrkA-transfected cell lines. Note that the proposed methods can also be applied to other types of genomic data such as proteomic data and protein–protein interac-tion data.
In this paper, we analyzed the neuroblastoma MTC data using KEGG pathways and aimed to identify the KEGG pathways that may explain the differentiation states of the two different NB cell lines. However, the proposed methods can be applied to any other networks of pathways. If an investigator is only interested in a par-ticular pathway, the proposed method can be applied to that par-ticular pathway. If an investigator is interested in fully exploring his/her data and all available pathways, one should use a large col-lection of pathways, e.g., the pathways collected by Pathway Commons ( http://www.pathwaycommons.org/pc/ ). It should also be noted that our proposed methods can include all the genes probed on microarray by simply adding isolated nodes to the graphs. A related issue is that our knowledge of pathways is not complete and can potentially include errors or misspeci fi ed edges on the networks. Although our simulations demonstrate that our methods are not too sensitive to the misspeci fi cation of the net-work structures, the effects of misspeci fi cation of the network on the results deserve further research. One possible solution to this problem is to fi rst check the consistency of the pathway structure using the data available. For example, if the correlation in gene expression levels between two neighboring genes is very small, we may want to remove the edge from the pathway structure. Alternatively, one can build a set of new pathways using various data sources and compare these pathways with those in the path-way databases in order to identify the most plausible pathways for use in the proposed MRF method. For example, we can construct a large molecular network with the nodes being the gene products and the links extracted from the KEGG database, the Biomolecular Interaction Network Database (BIND) and Human Interactome Map (HIMAP) ( see ref. (23 ) ) . This will provide more comprehen-sive description of known biological pathways and networks than using data from only one source.
In summary, generation of high-throughput genomic data together with intensive biomedical research has generated more and more reliable information about regulatory pathways and net-works. It is very important to incorporate the network information into the analysis of genomic data in order to obtain more interpre-table results in the context of known biological pathways. Such integration of genetic network information with high-throughput genomic data can potentially be useful for identifying the key molecular modules and subnetworks that are related to complex biological processes.
1398 Network-Based Analysis of Multivariate Gene Expression Data
Acknowledgments
This research was supported by NIH grants R01-CA127334 and P01-CA097323. We thank Mr. Edmund Weisberg, MS at Penn CCEB for editorial assistance.
References
1. Lehmann KP, Phillips S, Sar M, Foster PMD, Gaido KW (2004) Dose-dependent alterations in gene expression and testosterone synthesis in the fetal testes of male rates exposed to Di ( n -butyl) phthalate. Toxicol Sci 81:60–68
2. Seidel S, Stott W, Kan H, Sparrow B, Gollapudi B (2006) Gene expression dose–response of liver with a genotoxic and nongenotoxic carcinogen. Int J Toxicol 25:57–64
3. Yuan M, Kendziorski C (2006) Hidden Markov models for microarray time course data under multiple biological conditions (with discussion). J Am Stat Assoc 101(476):1323–1340
4. Tai YC, Speed T (2006) A multivariate empiri-cal Bayes statistic for replicated microarray time course data. Ann Stat 34:2387–2412
5. Hong FX, Li H (2006) Functional hierarchical models for identifying genes with different time-course expression pro fi les. Biometrics 62:534–544
6. Wei Z, Li H (2008) A hidden spatial–temporal Markov random fi eld model for network-based analysis of time course gene expression data. Ann Appl Stat 2(1):408–429
7. Wei Z, Li H (2007) A Markov random fi eld model for network-based analysis of genomic data. Bioinformatics 23:1537–1544
8. Wei P, Pan W (2008) Incorporating gene net-works into statistical tests for genomic data via a spatially correlated mixture model. Bioinformatics 24:404–411
9. Besag J (1974) Spatial interaction and the sta-tistical analysis of lattice systems. J R Stat Soc Ser B 36:192–225
10. Besag J (1986) On the statistical analysis of dirty pictures. J R Stat Soc Ser B 48:259–302
11. Aitchison J, Dunsmore IR (1975) Statistical prediction analysis. Cambridge University Press, London
12. Smyth GK (2004) Linear models and empirical Bayes methods for assessing differential expres-sion in microarray experiments. Stat Appl Genet Mol Biol 3(1):Article 3
13. Brodeur GM (2003) Neuroblastoma: bio-logical insights into a clinical enigma. Nat Rev - Cancer 3:203–216
14. Irizarry RA, Hobbs B, Collin F, Beazer-Barclay YD, Antonellis KJ, Scherf U, Speed TP (2003) Exploration, normalization, and summaries of high density oligonucleotide array probe level data. Biostatistics 4:249–264
15. Dennis G, Sherman BT, Hosack DA, Yang J, Gao W, Lane HC, Lempicki RA (2003) DAVID: database for annotation, visualization and integrated discovery. Gen Biol 4:P3
16. Tombes RM, Auer KL, Mikkelsen R, et al (1998) The mitogenactivated protein (MAP) kinase cascade can either stimulate or inhibit DNA synthesis in primary cultures of rat hepatocytes depending upon whether its activation is acute/phasic or chronic. J biochemistry 330(Pt 3):1451–1460
17. Kao S, Jaiswal RK, Kolch W, Landreth GE (2001) Identi fi cation of the mechanisms regu-lating the differential activation of the MAPK cascade by epidermal growth factor and nerve growth factor in PC12 cells. J Biol Chem 276(21):18169–18177
18. Marshall CJ (1995) Speci fi city of receptor tyrosine kinase signaling: transient versus sustained extracellular signal-regulated kinase activation. Cell 80(2):179–185
19. Qui MS, Green SH (1992) PC12 cell neuronal differentiation is associated with prolonged p21ras activity and consequent prolonged ERK activity. Neuron 9(4):705–717
20. Basson MD (2008) An intracellular signal pathway that regulates cancer cell adhesion in response to extracellular forces. Cancer Res 68(1):2–4
21. Liu W, Bloom DA, Cance WG, Kurenova EV, Golubovskaya VM, Hochwald SN (2008) FAK and IGF-IR interact to provide survival signals in human pancreatic adenocarcinoma cells. Carcinogenesis 29(6):1096–1107
22. Beierle EA, Trujillo A, Nagaram A, Kurenova EV et al (2007) N-MYC regulates focal adhe-sion kinase expression in human neuroblas-toma. J Biol Chem 282(17):12503–12516
23. Alfarano C, Andrade CE, Anthony K, Hahroos N, Bajec M et al (2005) The bio-molecular interaction network database and related tools 2005 update. Nucleic Acids Res 33:D418–D424