Multivariate analysis of the spatial patterns of 8 trace elements using the French soil monitoring...
10
This article appeared in a journal published by Elsevier. The attached copy is furnished to the author for internal non-commercial research and education use, including for instruction at the authors institution and sharing with colleagues. Other uses, including reproduction and distribution, or selling or licensing copies, or posting to personal, institutional or third party websites are prohibited. In most cases authors are permitted to post their version of the article (e.g. in Word or Tex form) to their personal website or institutional repository. Authors requiring further information regarding Elsevier’s archiving and manuscript policies are encouraged to visit: http://www.elsevier.com/copyright
-
Upload
independent -
Category
Documents
-
view
1 -
download
0
Transcript of Multivariate analysis of the spatial patterns of 8 trace elements using the French soil monitoring...
This article appeared in a journal published by Elsevier. The attachedcopy is furnished to the author for internal non-commercial researchand education use, including for instruction at the authors institution
and sharing with colleagues.
Other uses, including reproduction and distribution, or selling orlicensing copies, or posting to personal, institutional or third party
websites are prohibited.
In most cases authors are permitted to post their version of thearticle (e.g. in Word or Tex form) to their personal website orinstitutional repository. Authors requiring further information
regarding Elsevier’s archiving and manuscript policies areencouraged to visit:
http://www.elsevier.com/copyright

Author's personal copy
Multivariate analysis of the spatial patterns of 8 trace elements using the French soilmonitoring network data
N.P.A. Saby a,⁎, J. Thioulouse b, C.C. Jolivet a, C. Ratié a, L. Boulonne a, A. Bispo c, D. Arrouays a
a INRA Orléans, InfoSol Unit, US 1106, CS 40001, Ardon, 45075, Orléans cedex 2, Franceb Université de Lyon CNRS; Université Lyon 1; CNRS UMR 5558, Biométrie et Biologie Evolutive, Villeurbanne F-69622 cedex, Francec ADEME, Département Animation de la Recherche Déchets et Sols, 20, Avenue du Grésillé, BP 90406, 49004, Angers cedex 01, France
a b s t r a c ta r t i c l e i n f o
Article history:Received 8 April 2009Received in revised form 1 July 2009Accepted 3 July 2009Available online 31 July 2009
Keywords:SoilTrace elementsMappingMultivariate analysisGeostatisticsFrance
Geostatistical and spatially constrained multivariate analysis methods (MULTISPATI-PCA) have been appliedat the scale of France to differentiate the influence of natural background from the pollution due to humanactivities on the content of 8 trace elements in the topsoil. The results of MULTISPATI-PCA evidence strongspatial structures attributed to different natural and artificial processes. The first axis can be interpreted as anaxis of global richness in trace elements. Axis 2 reflects geochemical anomalies in Tl and Pb. Axis 3 exhibitson one hand natural pedogeogenic anomalies and on the other hand, it shows high values attributable toanthropogenic contamination. Finally, axis 4 is driven by anthropogenic copper contamination. At the Frenchterritory scale, we show that the main factors controlling trace elements distribution in the topsoil are soiltexture, variations in parent material geology and weathering, and various anthropogenic sources.
© 2009 Elsevier B.V. All rights reserved.
1. Introduction
Concern about increasing levels of trace elements (TE) in theEuropean soils has led to the development and implementation ofnumerous national programmes to determine the baseline levels ofTE in the Earth's surface (see a review from Morvan et al., 2008). Theorigin of TE in soils can be studied using various techniques, such asisotope composition (Bacon et al., 1996; Erel et al., 1997), analysis ofspatial distribution (Atteia et al., 1994; Facchinelli et al., 2001;McGrath et al., 2004), statistical relationships with other soilcharacteristics (Basta et al., 1993), and topsoil to subsoil ratios(TSR) of TE concentrations defined as “relative topsoil enhancement”(RTE) (Colbourn and Thornton, 1978; Baize and Sterckeman, 2001;Saby et al., 2006). Multivariate techniques, that can includeinterpolation, have been used by numerous authors to reduce thedimensionality of datasets and to identify the processes governing theTE spatial distribution (Korre, 1999; Zhang et al., 1999; Rawlins et al.,2003; Lee et al., 2006; Zhao et al., 2007; Imrie et al., 2008; Wannazet al., 2008).
In this paper, we used data from the French national soilmonitoring network (Arrouays et al., 2002) to study the spatialdistribution and origin of 8 TE in soil at the national scale (Cd, Co, Cr,
Cu, Ni, Pb, Tl, Zn). TE content measurements from total and partialextraction were used because they can bring different insights in TEspatial distribution and origin. We use TE data alone to assess if theirspatial distributions and correlations, without confrontation withadditional data, can provide an interesting insight on their origin.
Detecting and mapping regional trends in TE distribution over theentire French metropolitan territory could have been done bymultivariate geostatistical techniques such as Factorial KrigingAnalysis (FKA) (Goovaerts, 1992; Bocchi et al., 2000; Bourennaneet al., 2003; Imrie et al., 2008). This technique is suitable to providequantitative measures of complex interactions between soil proper-ties but it is strongly dependent on the goodness-of-fit (in least squaresense) of the linear model of co-regionalization. Alternatively, we usea spatially constrained multivariate analysis method (MULTISPATI-PCA, Dray et al. (2008)), which is a generalization of Wartenberg's(1985) Multivariate Spatial Correlation Analysis (MSCA). This techni-que implies a compromise between the relations among manyvariables (multivariate analysis) and their spatial structure (auto-correlation). Moreover, MULTISPATI-PCA was combined with geosta-tistics to map effective displays of spatial patterns (Thioulouse et al.,1995) of the TE relationships in French soil and to analyse their origin.MULTISPATI-PCA is a purely descriptivemethod, based solely on linearalgebra and on geometrical properties. It does not rely on any modelfitting. The geostatistical interpolation technique (kriging) used todraw the geographical maps is used only as a graphical techniquehere, and this has no consequence on the validity of the MULTISPATI-
Science of the Total Environment 407 (2009) 5644–5652
⁎ Corresponding author. Tel.: +33 238414822; fax: +33 238417869.E-mail address: [email protected] (N.P.A. Saby).
0048-9697/$ – see front matter © 2009 Elsevier B.V. All rights reserved.doi:10.1016/j.scitotenv.2009.07.002
Contents lists available at ScienceDirect
Science of the Total Environment
j ourna l homepage: www.e lsev ie r.com/ locate /sc i totenv

Author's personal copy
PCA results. At the French territory scale, we show that the mainfactors controlling TE distribution in the topsoil are soil texture,variations in parent material geology and weathering, and variousanthropogenic sources.
2. Materials and methods
2.1. Study area
The French National Soil Quality Monitoring Network “Réseau deMesures de la Qualité des Sols” consists of observations of soilproperties on a 16 km regular grid across the French metropolitanterritory (550,000 km²). This network was designed to monitor soilevolutions and particularly to identify diffuse contamination eitherdue to atmospheric deposition of trace elements on soils or toagricultural practices (e.g. fertilizers, sludge amendments, inorganicpesticides). The complete inventory will consist of 2200 sites but inthis study we use measurements of TEs from the 2059 sites analysedat present (Fig. 1).
The sites are selected at the centre of each 16×16 km cell. In the caseof soil being unavailable at the centre of the cell (i.e. urban area, road,river, etc.), an alternative location is selected as close as possible to thecentre of the cell, within a 1 km radius, to find a natural (undisturbed orcultivated) soil. However, it is not always possible to find an alternativelocation. All land cover types are present in the dataset, except industrialsites which are not sampled. At each site, 25 individual core sampleswere taken from the topsoil (0–30 cm) layer, using a stratified randomsampling design within a 20×20m area. Core samples were bulked toobtain a composite sample for each site. Soil sampleswere air-dried andsieved to 2 mm before analysis (AFNOR, 1994). Topsoil sampled from 0to 30 cm was chosen because it corresponds in France to the maximaldepths affected by ploughing and because it is a quite conventionalthickness to report on topsoil properties (e.g. Arrouays et al., 2001;Arrouays et al., 2008).
Ononehand, total concentrationsof 8 TE (Cd, Co, Cr, Cu,Ni, Pb, Tl, Zn)were determined by inductively coupled plasma mass spectroscopyafter dissolutionwith hydrofluoric and perchloric acids (AFNOR, 2001).On the secondhand, 6 TE(Cd,Cr, Cu, Pb,Ni, Zn)were extractedby0.05 MEDTA solution (ammonium salt) at pH=7.0. The extraction wasperformed with a solid/solution ratio of 1/10. 2.5 g of soil, air-driedand sieved at 2 mm, and 25 ml of 0.05 M EDTA solution at pH 7.0 wereput in a tapedflask for a shake stepduring 1h at 20 °C. Then, themixturewas centrifuged at 3000 laps perminute for 10min. After centrifugation,the extract was filtered through 2 μm filter and transferred in a tapedflask before analysis of Cd, Cr, Cu,Ni, Pb andZnusing ICP-AES. Analysis ofsoil extracts were calibrated using standard solutions made with theextracting agent.
Analyseswere performed by the Soil Analysis Laboratory of INRA atArras, which is accredited for soil and sludge analysis.
2.2. MULTISPATI-PCA
Thematrix of the TE contents was analysed byMULTISPATI-PCA (Drayet al., 2008), which is a generalization of Multivariate Spatial CorrelationAnalysis (MSCA, Wartenberg 1985). This method allowed taking intoaccount the spatial position of sampling sites through a neighbouringrelationship between sites (the one-step chess queen's move).
As explained in Dray et al. (2008), the MULTISPATI analysisintroduces a spatial weighting matrix W in the Principal ComponentAnalysis (PCA) of the datamatrix X. HereX is thematrix of TE contents:it has n rows (soil samples) and p columns (TE). W is the row-sumstandardized connectivity matrix: if C=[cij] is the connectivity matrix(indicating the strength of interactions between units i and j), thenW = ½cij =∑n
j = 1cij�. LetD be a scalar product of Rn, and letQ be a scalarproduct of Rp. (X,Q ,D) is the statistical triplet associated to the PCA of X,and theMULTISPATI analysis is the co-inertia analysis (Dray et al., 2003)between X and the lag matrix X=WX. The lag matrix X is composed ofthe averages of neighbouring values weighted by the spatial connection
Fig. 1. Location of the study and of the sampling sites.
5645N.P.A. Saby et al. / Science of the Total Environment 407 (2009) 5644–5652

Author's personal copy
matrix (this means that only the neighbouring points are taken intoaccount). MULTISPATI maximizes the scalar product between a linearcombination of the original variables (a1=XQu1) and a linearcombination of the lagged variables (ã1=WXQu1). In practice, it isnecessary to diagonalize the Q-symmetric matrix H=(1/2)(Xt(WtD+DW)XQ) instead of matrix XtDWXQ, which is not symmetric.
The advantage of MULTISPATI over PCA is that MULTISPATI samplescores maximize spatial autocorrelation between sites, while conven-tional PCA scores maximize the inertia (i.e., the sum of variances).MULTISPATI scores are therefore “smooth” and show strong spatialstructures on the first few axes, while PCA scores can be rough,smooth, or mixed and can show spatial structures on any axis (evendistant ones). Moreover, the advantage of MULTISPATI over Warten-berg's classical Multivariate Spatial Correlation Analysis (MSCA,Wartenberg, 1985) is that MULTISPATI is not restricted to the case ofquantitative normalized variables, but can be applied to any type ofvariable and any type of analysis (for example, binary variables,counts, or qualitative variables and principal component analysis,correspondence analysis, or multiple correspondence analysis).
Finally, aMonte-Carlo testwas used to check the statistical significanceof the observed structures. This test is a multivariate permutation testagainst a random distribution of the values of the TE over the samplingsites. It does not rely on statistical distribution hypotheses.
Computationswere conductedwith the “ade4” (“multispati” function,Chessel et al., 2004) and “spdep” packages (Bivand et al., 2008) for the Rstatistical software (R Development Core Team, 20084).
2.3. Geostatistical interpolation
Kriging or geostatistical interpolation aims at predicting theunknown value of a variable Z at a non-observed location xi usingthe values zi at surrounding locations. To do this, we use a StochasticFunction (SF) as a model of spatial variation so that the actual butunknown value z(xi) and the values at the surrounding location arespatially dependent random variables. We assume that z is arealisation of a Gaussian random function with a covariance matrixV. If the assumption of Gaussian random realisation is not plausible fora particular data set then that data set should be transformed. Weapply the Box–Cox transform (Box and Cox, 1964).
z* =logðzÞ if t = 0
zt−1t
otherwise;
8><>:
ð1Þ
where t is the parameter of the transform.
The elements of V are expressed as function of the distanceseparating two observations (h). In the geostatistical literature thisfunction is commonly expressed in terms of the variogram
γðhÞ = 0:5E½fZðxÞ−Zðx + hÞg2�:
Full details are given in Webster et al. (2007) for the calculation ofV. A number of variogram functions have been suggested to ensurethat V is positive and definite. We retained the Matérn functionwhichhas a smoothness parameter ν that gives the flexibility for modellingthe spatial covariance, particularly in the decay of the function forsmall h. When ν is small the spatial process is rough whereas for largeν it is smooth. For particular values of ν the Matérn model isequivalent to other suggested variogram models. Minasny andMcBratney (2005) describe different forms the Matérn function cantake in greater detail.
The validity of the geostatistical model fitted by ordinary leastsquare may be confirmed by leave-one-out cross validation. For eachsampling site location i=1,…, n, the value of the property at site xi ispredicted by ordinary kriging upon z⁎(−i), the vector of observationsexcluding zi*. The statistic
θi =zi*− z*ð−iÞ
n o2
σ2ð−iÞ
;
where z⁎(−i) and σ (−i)2 denote the kriging prediction and kriging
variance at xi when zi* is omitted from the transformed observationvector, is calculated. If the fitted model is a valid representation of thespatial variation of the soil property then θ=(θ1…, θn) has a χ2
distribution with mean θ=1.0 and median θ=0.455 (Lark, 2002).At some sites, the interpolated map may not approximate the
behaviour of the property due to local contamination by secondaryprocess, also called contaminated process or quasi-point process.Nevertheless, metal concentrations in the soil may also show variationthat is a composite of a continuous background and a quasi-pointprocess. The former represents the natural origin of the metal contentand diffuse sources of pollution; the latter represents point sources ofpollution. To solve this problem, the effects of the background and ofthe local contamination processes must be separated. Lark (2000)describes three robust variograms. These are designed to estimate thevariogram of a background process in the presence of contamination.These include the Dowd variogram (Dowd, 1984). If an appropriatemodel of the background process is fitted by a robust variogramestimator θ is greater than 1.0 due to large θi at the contaminated sites.However θwill be close to 0.455 because the median is a more robuststatistic to outliers that may be present. The mean and the median
Table 1Descriptive statistics of the trace element metals content in soils.
Mean Median FOREGSmedian
Standarddeviation
10%percentile
90%percentile
FOREGS 90%percentile
Kurtosis Skewness Kurtosis(log(x))
Skewnesslog(x)
t (Box–Coxparameter)
Kurtosis(Box–Cox)
Skewness(Box–Cox)
cd_tot 0.294 0.190 0.284 0.365 0.06 0.61 0.48 45.137 5.165 1.268 −0.395 0.096 1.053 0.032co_tot 10.328 8.790 7.78 8.515 2.71 18.22 19.7 22.840 3.494 12.063 −3.264 0.440 2.520 0.169cr_tot 54.530 47.330 60 85.003 18.70 86.52 122.0 821.755 25.416 3.999 −0.911 0.173 7.145 0.216cu_tot 19.189 13.400 13 26.640 4.76 33.65 34.0 131.490 9.026 17.886 −3.058 0.246 4.541 0.366ni_tot 24.685 18.600 18 49.309 5.69 44.14 49.8 560.808 21.116 17.706 −3.339 0.277 9.138 0.553pb_tot 32.478 27.590 22.6 26.724 16.53 48.94 51.1 156.167 9.404 3.441 0.160 −0.044 3.323 −0.026tl_tot 0.673 0.534 0.66 0.630 0.27 1.19 1.38 235.934 10.863 2.894 −0.349 0.088 2.524 0.048zn_tot 72.069 61.400 52 58.049 25.64 125.00 111.0 102.337 6.805 36.868 −5.077 0.384 4.936 0.383cd_ext 0.155 0.099 – 0.201 0.04 0.30 − 47.399 5.492 0.832 0.045 −0.013 0.818 −0.003cr_ext 0.150 0.110 – 0.183 0.04 0.29 − 153.241 9.205 1.037 −0.394 0.109 1.150 0.033cu_ext 4.752 2.190 – 12.971 0.53 7.36 − 281.921 13.778 1.223 0.255 −0.052 1.055 −0.021ni_ext 1.200 0.720 – 2.591 0.25 2.36 − 486.948 19.303 3.606 −0.584 0.093 2.719 0.081pb_ext 7.423 5.570 – 9.021 2.54 13.04 − 120.678 8.953 4.955 −0.064 0.011 4.601 0.012zn_ext 3.155 2.080 – 5.803 0.88 5.57 − 290.794 14.260 1.911 0.565 −0.160 1.189 −0.047
FOREGS medians correspond to the published statistics from FOREGS database (Salminen et al., 2005).
5646 N.P.A. Saby et al. / Science of the Total Environment 407 (2009) 5644–5652

Author's personal copy
values of θ were also calculated for 1000 simulated realisations ofthe fitted model to determine the 90% confidence limits. We usedrobust variograms to remove the effect of local point-source
contamination (i.e. couple of isolated very high values obviouslylinked to very local anomalies) on variance. From the statistical pointof view, a robust estimator is used to identify background variation
Fig. 2. Graphical display of the first four axes of the MULTISPATI-PCA analysis. In each of the 2 graphs, the labels corresponding to the 14 columns of the data table are placed in thefactorial map of axes 1 and 2 and, 3 and 4. The scale (d) is the distance between vertical lines, and the thicker vertical line is the origin (x=0 or y=0).
Table 2Linear correlation matrix of the Box–Cox transformed data.
cd_tot co_tot cr_tot cu_tot ni_tot pb_tot tl_tot zn_tot cd_ext cr_ext cu_ext ni_ext pb_ext zn_ext
cd_tot 1.000 0.490 0.533 0.442 0.600 0.414 0.260 0.716 0.948 −0.057 0.465 0.458 0.339 0.548co_tot 0.490 1.000 0.830 0.578 0.867 0.391 0.317 0.700 0.421 −0.103 0.447 0.631 0.203 0.245cr_tot 0.533 0.830 1.000 0.579 0.928 0.352 0.297 0.717 0.486 0.114 0.476 0.634 0.230 0.290cu_tot 0.442 0.578 0.579 1.000 0.613 0.381 0.285 0.606 0.394 −0.083 0.852 0.381 0.241 0.390ni_tot 0.600 0.867 0.928 0.613 1.000 0.370 0.319 0.762 0.540 0.031 0.501 0.678 0.242 0.324pb_tot 0.414 0.391 0.352 0.381 0.370 1.000 0.696 0.607 0.439 0.119 0.313 0.309 0.724 0.443tl_tot 0.260 0.317 0.297 0.285 0.319 0.696 1.000 0.517 0.268 0.068 0.168 0.171 0.350 0.211zn_tot 0.716 0.700 0.717 0.606 0.762 0.607 0.517 1.000 0.668 0.008 0.479 0.507 0.413 0.543cd_ext 0.948 0.421 0.486 0.394 0.540 0.439 0.268 0.668 1.000 0.009 0.473 0.519 0.433 0.615cr_ext −0.057 −0.103 0.114 −0.083 0.031 0.119 0.068 0.008 0.009 1.000 −0.115 0.073 0.274 0.199cu_ext 0.465 0.447 0.476 0.852 0.501 0.313 0.168 0.479 0.473 −0.115 1.000 0.477 0.270 0.490ni_ext 0.458 0.631 0.634 0.381 0.678 0.309 0.171 0.507 0.519 0.073 0.477 1.000 0.397 0.448pb_ext 0.339 0.203 0.230 0.241 0.242 0.724 0.350 0.413 0.433 0.274 0.270 0.397 1.000 0.499zn_ext 0.548 0.245 0.290 0.390 0.324 0.443 0.211 0.543 0.615 0.199 0.490 0.448 0.499 1.000
Bold print indicates significant linear correlation coefficients at 1% level.
5647N.P.A. Saby et al. / Science of the Total Environment 407 (2009) 5644–5652
Author's personal copy
of a soil property with the minimum influence of quasi-pointprocess.
The spatial analysis GeoR package (Ribiero and Diggle, 2001) wasused for geostatistical interpolation.
2.3.1. Spatial analysis algorithmA MULTISPATI-PCA was calculated on the Box–Cox transformed
data of the TEmeasurements. The scores of the sites obtained from thefirst four axes of global MULTISPATI-PCA were then interpolated byrobust geostatistic and then geographically mapped to resolve thedistribution patterns of TE variability. Box–Cox transformationensured that both methods performed well.
3. Results
3.1. TE contents
Themedian observed values for total TE (Table 1) are close to thoseobserved by the FOREGS project (Salminen et al., 2005) in Europeantopsoils. 90% percentile values are also very similar, except forChromium for which most of the highest values in Europe wereobserved outside France (http://www.gsf.fi/publ/foregsatlas/maps/Topsoil/t_xrf_cr_edit.pdf). The ranges of observed values (Table 1) arealso of the same order ofmagnitude as those observed by Baize (2007)using a different dataset on the French territory. For the total TE forwhich national statistics are available in both databases, the medianvalues are very close [i.e. in bold median value for this study, initalic median value from Baize (2007), Cd 0.19–0.30; Cr 47.33–3.6;Cu 13.4–13.8; Ni 18.6–24.1; Pb 27.59–25.6; Zn 61.4–59.0]. However, forsome elements, the higher maximal values observed in the databasefrom Baize (2007) indicate the presence of some highly contaminated
sites. For Cd, the difference between the two median values is likelyattributable to an over-representation of some soils developed onJurassic calcareous in the database from Baize (2007).
3.2. MULTISPATI-PCA
Table 1 shows that the Box–Cox transformation has removed mostof the skewness of the raw data although log transform performsworst. Nearly all TE contents, both in their total and EDTA extractableforms, were positively correlated (Table 2), except for extractable Crthat appeared to have a distinct behaviour. Fig. 2 confirms thesepositive correlations between all TE, except for extractable Cr which isvery fairly correlated to total Cr and shows the best correlations withextractable Zn and Pb. Indeed extractable Cr seems to show a specialdistribution, in opposition with nearly all the other parametersmeasured. This is confirmed by the correlation of the variables withthe first 4 axes of the MULTISPATI-PCA accounting for over 80% of thetotal variance.
The Monte-Carlo permutation test of the MULTISPATI-PCA washighly significant (pb0.005), which showed that the spatial structuresexhibited by TEwere indeed very strong and could not be attributed torandom variations.
3.3. Cross validation results and variograms
The results of the cross-validations showed that the mean of θ forevery 4 axes is outside the 90% confidence limit although the median isinside. The median and themean of θ are respectively (0.460; 1.519) foraxis 1, (0.451; 1.343) for axis 2, (0.447; 1.342) for axis 3 and, (0.428;1.555) for axis 4. Variograms are shown in Fig. 4. The Dowd's variogramprovides a lower semi-variance than the one from the classical
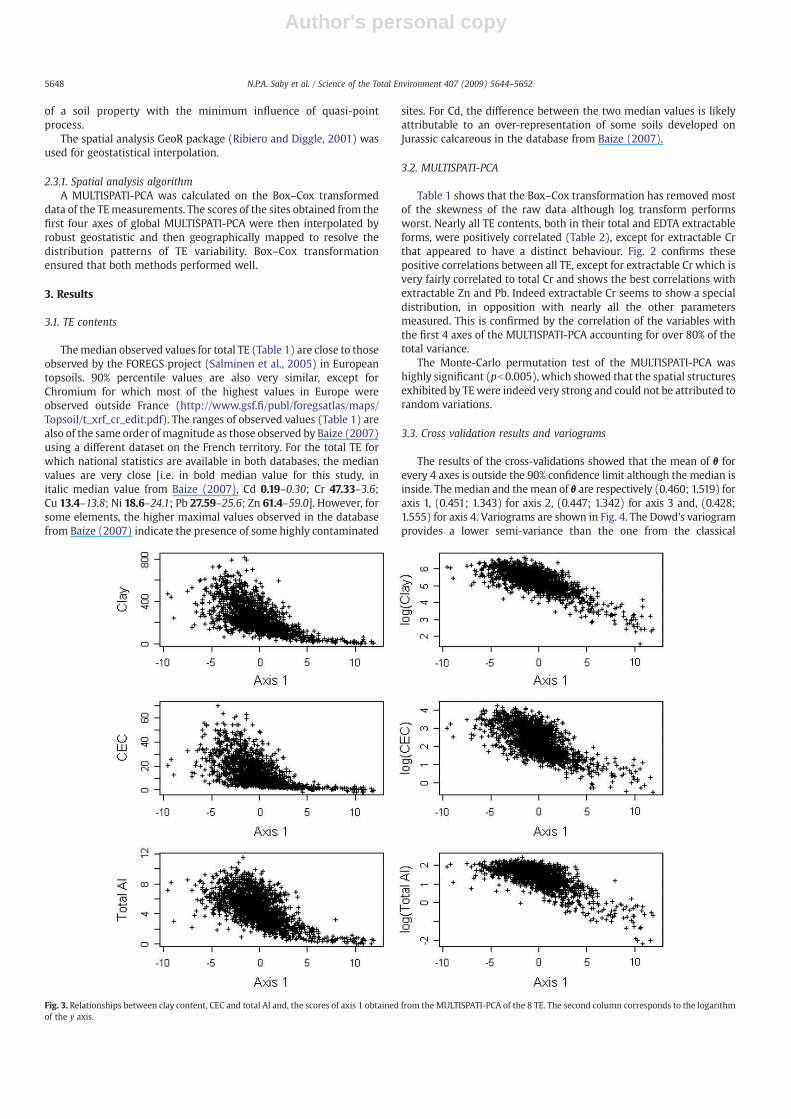
Fig. 3. Relationships between clay content, CEC and total Al and, the scores of axis 1 obtained from the MULTISPATI-PCA of the 8 TE. The second column corresponds to the logarithmof the y axis.
5648 N.P.A. Saby et al. / Science of the Total Environment 407 (2009) 5644–5652

Author's personal copy
Matheron variogram (Matheron, 1971) by removing the effects of localanomalies. This indicates that the outliers have led to large θi at somesites and Dowd variogram has then adequately modeled the spatialvariation of the background process and authorize us to interpret thefactorial map. Although the nugget effects of the fitted Matérnvariograms are rather high, they all exhibit a marked increase between0 and ca 100 km, indicating a strong autocorrelation at rather shortdistances. Moreover, axes 1, 3 and 4 show a small ν parameter of theMatérn function (0.25, 0.07, 0.15 respectively) indicating that the spatialprocess is rough at small distance h. Axis 2 shows a ν parameter close to0.5 (e.g. close to the exponential covariance function)with a continuousand sharp increase till ca 300 km. Finally the largest relative decrease invariance is observed for axis 4 indicating the large effect of quasi-pointprocess.
3.4. Interpretation of the MULTISPATI-PCA axes
The first axis (61.1%) (Fig. 2) can be interpreted as an axis of globalrichness in TE. The correlations between axis 1 and clay content,cation exchange capacity and Al content (Fig. 3) suggest that traceelements are specifically associated with phyllosilicates of the finestfraction as shown in Northern France by Sterckeman et al. (2006). Themap of the scores on axis 1 (Fig. 4) shows a spatial pattern similar toclay content distribution in French topsoil (Fig. 5A). We conclude thatthis map reveals the spatial trends in the natural abundance of
pedogeogenic trace elements in French topsoil. Axis 2 (13.44%) ismainly driven by total Pb and Tl. We investigated if this axis and Pb orTl concentrations could be linked to organic carbon content in soil andfound no significant relationships (Fig. 6). The pattern of the map isclearly linked to the geographical distribution of some specific parentmaterials (Fig. 5B) and is consistent with the shape of the variogram.The map of the scores of axis 2 shows a spatial distribution linked toold residual soils, developed from rocks highly mineralized by long-term geological processes. Tremel et al. (1997) have shown that veryhigh natural contents of Tl occurred in such soils in France, associatedwith mineralizations inducing also high natural Pb content. A set of244 samples, some of which have been collected in the vicinity ofpotential anthropogenic contamination sources, could not evidenceanthropogenic origin. The fact that this axis is mainly driven by totalforms of these TE also suggests a natural origin. We conclude that theaxis 2 reflects natural geochemical anomalies in Tl and Pb. Axis 3 (8%)is mainly driven by extractable TE, namely extractable Pb, Zn and Cd.Themap of axis 3 exhibits two different kinds of processes. It shows onone hand two well known natural pedogeogenic anomalies: the Juracalcareous mountain (Webster et al., 1994; Bourennane et al., 2003;Imrie et al., 2008), and the border of the Cévennes massif in southernFrance (Tremel et al., 1997). On the other hand, it shows high valuesaround the Paris area and the highly industrialized Northern part ofFrance that are likely to be of anthropogenic origin, as already shownfor Pb by Saby et al. (2006) around Paris, and for various TE by
Fig. 4. Variograms of the scores of 4 axis obtained from the MULTISPATI-PCA of the 8 TE. The lines show the fitted models on the Dowd's variograms. The crosses represent theclassical Matheron variograms.
5649N.P.A. Saby et al. / Science of the Total Environment 407 (2009) 5644–5652

Author's personal copy
Sterckeman et al. (2006) in Northern France. This anthropogenicorigin is confirmed by high values in extractable forms. Axis 4 (5.6%) ismainly driven by Cu, both in its total and EDTA extractable contents,and its spatial distribution clearly shows two different anthropogenicorigins, vine fungicide treatment by CuSO4 (area of Bordeaux, South ofFrance, some sites along the Loire and the Rhône valleys, Languedocregion, see the map of vineyards location in France, Fig. 5C) andindustrial origin (Paris region, Northern France). Indeed, in this case,relatively high quantities of the extractable form of Cu can beassociated with anthropogenic activity.
4. Discussion
4.1. Limitations due to the sampling scheme
The sampling scheme of the French soil monitoring network isbased on a 16×16 km grid, which provides a high nugget/sill ratio,producing smoothed map of PCA axes. Indeed, our sampling schemeand interpolation technique are not suited to detect point-sourcepollution, therefore local “hot spots” of high TE content could not bedetected by our study. The spatial structures we observed reflect only
medium range trends in natural or anthropogenic TE distribution.Therefore: (i) the total area of high anthropogenic TE concentration inthe topsoil might be underestimated (this is likely to be the case forsmall vineyard areas and Cu, for instance), (ii) risks due to “hot spots”of TE content cannot be assessed using this method.
4.2. Comparison with other studies
Using factorial kriging on a larger set of elements over Europe, Imrieet al. (2008) found a dominant effect of parent material on topsoilgeochemistry. Although soil texture was identified as a possiblecontrolling factor of topsoil geochemistry, its effectwas less pronouncedthan in our study. This difference is likely attributable both to thedifferent set of parameters used and to the different geographicalcoverage of the studies.
At the French territory scale, we show that the main factorscontrolling TE distribution in topsoil are soil texture, variations inparentmaterial chemistry andweathering, and various anthropogenicsources. Some of the anthropogenic patterns could not have beendetected using a looser sampling design, as suggested by the shape ofthe variograms. Indeed, some of the patterns that we identified are
Fig. 5.Maps of (A) dominant topsoil texture extracted for the French 1: 1,000,000 geographical soil database (King et al., 1995), (B) selected dominant parent materials extracted forthe French 1: 1,000,000 geographical soil database, (C) percentage of vineyards in land cover derived from agricultural census data and aggregated on the 16 km to 16 km grid.
Fig. 6. Plot of total organic carbon (TOC) against total Pb content, total Tl content and the score of axis 2 obtained from the MULTISPATI-PCA of the 8 TE.
5650 N.P.A. Saby et al. / Science of the Total Environment 407 (2009) 5644–5652

Author's personal copy
rather small (see for instance map of axis 4, Fig. 7) and therefore, alooser sampling design may not have captured them. As we stressabove, it is even likely that more local anthropogenic or naturalstructures exist and could not be detected.
5. Conclusion
Using the soil samples of a 16×16 km grid soil monitoring network,we performed an estimation of the distribution of TE contents over thewhole French territory. This study shows that the spacing of thesampling grid combined with MULTISPATI-PCA associated with robustgeostatistical interpolation techniques allows to detect and to mapregional trends in TE distribution. At the French territory scale, we showthat the main factors controlling TE distribution in the topsoil are soiltexture, variations in parent material geology and weathering, andvarious anthropogenic sources.
Acknowledgements
This study was supported by a French Scientific Group of Intereston soils: the “GIS Sol”, involving the French Ministry for Ecology andSustainable Development, the French Ministry of Agriculture, theFrench Agency for Energy and Environment (ADEME), the NationalInstitute for Agronomic Research (INRA), the Institute for Researchand Development (IRD) and the National Forest Inventory (IFN). Wethank all the soil surveyors and technical assistants involved in
sampling the sites. Thanks are expressed to the anonymous reviewersfor their suggestions and to Eva Lacarce for the help with English.
References
AFNOR. NF ISO 11464. Prétraitement des échantillons pour analyses physico-chimiques;1994. 8 pp.
AFNOR. NF ISO 14869-1. Qualité du sol. Mise en solution pour la détermination desteneurs élémentaires totales. Partie 1: Mise en solution par l'acide fluorhydriqueet l'acide perchlorique. 2001, 12 pp.
Arrouays D, Deslais W, Badeau V. The carbon content of topsoil and its geographicaldistribution in France. Soil Use Manag 2001;17:7-11.
Arrouays D, Jolivet C, Boulonne L, Bodineau G, Saby N, Grolleau E. A new initiative inFrance: a multi-institutional soil quality monitoring network. C R Acad Agric Fr2002;88:93-105.
Arrouays D, Morvan X, Saby NPA, Richer De Forges A, Le Bas C, Bellamy PH, et al.Environmental assessment of soil for monitoring: volume IIa inventory &monitoring.Luxembourg: Office for the Official Publications of the European Communities; 2008.p. 188. EUR 23490 EN/2A.
Atteia O, Dubois J, Webster R. Geostatistical analysis of soil contamination in the SwissJura. Environ. Environ Pollut 1994;86:315–27.
Bacon JR, Jones KC, McGrath SP, Johnston AE. Isotopic character of lead deposited fromthe atmosphere at a grassland site in the United Kingdom since 1860. Environ SciTechnol 1996;30:2511–8.
Baize D. Teneurs en huit éléments en traces (Cd, Cr, Cu, Hg, Ni, Pb, Se, Zn) dans les solsagricoles en France. Résultats d'une collecte de données à l'échelon national.Contrats n° 0375C0035 et 0575C0055. ADEME, Angers. 2007, 86.
Baize D, Sterckeman T. Of the necessity of knowledge of the natural pedo-geochemicalbackground content in the evaluation of the contamination of soils by trace elements.Sci Total Environ 2001;264:127–39.
Basta NT, Pantone DJ, Tabatabai MA. Path analysis of heavy metals adsorption by soil.Agron J 1993;85:1054–7.
Fig. 7. Interpolated maps of the first four axes of the MULTISPATI-PCA using robust geostatistics.
5651N.P.A. Saby et al. / Science of the Total Environment 407 (2009) 5644–5652

Author's personal copy
Bivand R, Anselin L, Assunçaõ R, Berke O, Bernat A, Carvalho M, et al. spdep: Spatialdependence: weighting schemes, statistics and models. R package version 0.4-29.In: http://cran.at.r-project.org/web/packages/spdep., 2008.
Bocchi S, CastrignanòA, Fornaro F, Maggiore T. Application of factorial kriging for mappingsoil variation at field scale. Eur J Agron 2000;13:295.
Bourennane H, Salvador-Blanes S, Cornu S, King D. Scale of spatial dependence betweenchemical properties of topsoil and subsoil over a geologically contrasted area (Massifcentral, France). Geoderma 2003;112:235–51.
Box GEP, Cox DR. An analysis of transformations. J R Stat Soc 1964;26:211–43.Chessel D, Dufour AB, Thioulouse J. The ade4 package—I: one-table methods. R news
2004;4:5-10.Colbourn P, Thornton I. Lead pollution in agricultural soils. J Soil Sci 1978;29:513–26.DowdPA. The variogramand kriging: robust and resistant estimators. In: Verly G, DavidM,
Journel AG, Marechal A, editors. Geostatistics for natural resources characterization.Dordercht, The Netherlands: D. Reidel; 1984. p. 91-106.
Dray S, Chessel D, Thioulouse J. Co-inertia analysis and the linking of ecological tables.Ecology 2003;84:3078–89.
Dray S, Said S, Debias F. Spatial ordination of vegetation data using a generalization ofWartenberg's multivariate spatial correlation. J Veg Sci 2008;19:45–56.
Erel Y, Veron A, Halicz L. Tracing the transport of anthropogenic Pb in the atmosphereand in soils using isotopic ratios. Geochim Cosmochim Acta 1997;61:4495–506.
Facchinelli A, Sacchi E, Mallen L. Multivariate statistical and GIS-based approach toidentify heavy metal sources in soils. Environ Pollut 2001;114:313–24.
Goovaerts P. Factorial kriging analysis: a useful tool for exploring the structure ofmultivariate spatial soil information. J Soil Sci 1992;43:597.
Imrie CE, Korre A, Munoz-Melendez G, Thornton I, Durucan S. Application of factorialkriging analysis to the FOREGS European topsoil geochemistry database. Sci TotalEnviron 2008;393:96-110.
King D, Burrill A, Daroussin J, Le Bas C, Tavernier R, Van Ranst E. The EU soil geographicdatabase. In: King D, Jones RJA, Thomasson AJ, editors. European land informationsystems for agro-environmental monitoring. Luxembourg: Office for Official Publica-tions of the European Communities; 1995. p. 43–60.
Korre A. Statistical and spatial assessment of soil heavy metal contamination in areas ofpoorly recorded, complex sources of pollution Part 1: factor analysis for contaminationassessment. Stoch. Environ. Res. Risk Assess. 1999;13:260–87.
Lark RM. A comparison of some robust estimators of the variogram for use in soil survey.Eur J Soil Sci 2000;51:137–57.
Lark RM. Modelling complex soil properties as contaminated regionalized variables.Geoderma 2002;106:173–90.
Lee CSL, Li X, ShiW, Cheung SCN, Thornton I.Metal contamination in urban, suburban, andcountry park soils of Hong Kong: a study based on GIS and multivariate statistics. SciTotal Environ 2006;356:45–61.
Matheron G. La théorie des variables régionalisées et ses applications. Les cahiers ducentre de morphologie mathématique, 5. Fontainebleau, 1971, 212 pp.
McGrath D, Zhang C, Cartin OT. Geostatistical analyses and hazard assessment on soillead in Silvermines area, Ireland. Environ Pollut 2004;127:239–48.
Minasny B, McBratney AB. The Matern function as a general model for soil variograms.Geoderma 2005;128:192–207.
MorvanX, SabyNPA, ArrouaysD, Le Bas C, Jones RJA,Verheijen FGA, et al. Soilmonitoring inEurope: a review of existing systems and requirements for harmonisation. Sci TotalEnviron 2008;391:1-12.
RDevelopmentCore Team.R: a language and environment for statistical computing http://www.R-project.org, R Foundation for Statistical Computing, 20084.
Rawlins BG, Webster R, Lister TR. The influence of parent material on topsoilgeochemistry in eastern England. Earth Surf Processes Landf 2003;28:1389–409.
Ribiero PJ, Diggle PJ. geoR: a package for geostatistical analysis. R-NEWS 2001;1:15–8.Saby N, Arrouays D, Boulonne L, Jolivet C, Pochot A. Geostatistical assessment of Pb in
soil around Paris, France. Sci Total Environ 2006;367:212–21.SalminenR, BatistaMJ, BidovecM,DemetriasdesA,DeVivo B,DeVosW.Geochemical atlas
of Europe. Part 1: background information,methodology andmaps. Espoo: Geologicalsurvey of Finland; 2005. p. 526.
Sterckeman T, Douay F, Baize D, Fourrier H, Proix N, Schvartz C, et al. Trace elementdistributions in soils developed in loess deposits from northern France. Eur J Soil Sci2006;57:392–410.
Thioulouse J, Chessel D, Champely S. Multivariate analysis of spatial patterns: a unifiedapproach to local and global structures. Environ Ecol Stat 1995;2:1.
Tremel A, Masson P, Sterckeman T, Baize D, Mench M. Thallium in French agrosystems—I.Thallium contents in arable soils. Environ Pollut 1997;95:293–302.
Wannaz ED, Harguinteguy CA, Jasan R, Pla RR, Pignata ML. Identification of atmospherictrace-element sources by passive biomonitoring employing PCA and variogramanalysis. Int J Environ Anal Chem 2008;88:229–43.
Wartenberg D. Multivariate spatial correlation: a method for exploratory geographicalanalysis. Geogr Anal 1985;17:263–83.
Webster R, Oliver M. Geostatistics for environmental scientists, 2nd edition. JohnWiley& Sons Ltd, Chichester UK, 2007.
Webster R, Atteia O, Dubois JP. Coregionalization of trace metals in the soil in the SwissJura. Eur J Soil Sci 1994;45:205–18.
Zhang CS, Selinus O, Kjellstrom G. Discrimination between natural background andanthropogenic pollution in environmental geochemistry — exemplified in an areaof south-eastern Sweden. Sci Total Environ 1999;244:129–40.
Zhao FJ, McGrath SP, Merrington G. Estimates of ambient background concentrations oftrace metals in soils for risk assessment. Environ Pollut 2007;148:221–9.
5652 N.P.A. Saby et al. / Science of the Total Environment 407 (2009) 5644–5652