Network-based analysis of metabolic regulation in the human red blood cell
10
Journal of Theoretical Biology 225 (2003) 185–194 Network-based analysis of metabolic regulation in the human red blood cell Nathan D. Price 1 , Jennifer L. Reed 1 , Jason A. Papin 1 , Sharon J. Wiback, Bernhard O. Palsson* Department of Bioengineering, University of California, San Diego, 9500 Gilman Drive, La Jolla, CA, 92093-0412 USA Received 10 December 2002; received in revised form 20 May 2003; accepted 3 June 2003 Abstract Reconstruction of cell-scale metabolic networks is now possible. A description of allowable metabolic network functions can be obtained using extreme pathways, which are the convex basis vectors of the solution space containing all steady state flux distributions. However, only a portion of these allowable network functions are physiologically possible due to kinetic and regulatory constraints. Methods are now needed that enable us to take a defined metabolic network and deduce candidate regulatory structures that control the selection of these physiologically relevant states. One such approach is the singular value decomposition (SVD) of extreme pathway matrices (P), which allows for the characterization of steady state solution spaces. Eigenpathways, which are the left singular vectors from the SVD of P, can be described and categorized by their biochemical function. SVD of P for the human red blood cell showed that the first five eigenpathways, out of a total of 23, effectively characterize all the relevant physiological states of red blood cell metabolism calculated with a detailed kinetic model. Thus, with five degrees of freedom the magnitude and nature of the regulatory needs are defined. Additionally, the dominant features of these first five eigenpathways described key metabolic splits that are indeed regulated in the human red blood cell. The extreme pathway matrix is derived directly from network topology and only knowledge of V max values is needed to reach these conclusions. Thus, we have implemented a network-based analysis of regulation that complements the study of individual regulatory events. This topological approach may provide candidate regulatory structures for metabolic networks with known stoichiometry but poorly characterized regulation. r 2003 Elsevier Ltd. All rights reserved. Keywords: Extreme pathways; Singular value decomposition; SVD; Constraint-based models; Elementary modes 1. Introduction It is now possible to construct cell-scale networks describing various cellular functions (Covert et al., 2001). A major challenge we are now faced with is to develop in silico modeling strategies that generate meaningful network-level analyses. Various modeling philosophies and approaches have been pursued, in- cluding deterministic kinetic models (Joshi and Palsson, 1989; Tomita et al., 1999; Werner and Heinrich, 1985), stochastic models (Arkin et al., 1998; Elowitz et al., 2002; McAdams and Arkin, 1997), and constraint-based models (Edwards et al., 2002; Palsson, 2000; Price et al., 2003a; Schuster et al., 2000). Constraint-based models use governing constraints, such as mass balance and maximum reaction rates, to restrict potential cellular behavior. This modeling approach has been applied to metabolism and results in a solution space in which all feasible steady state flux distributions reside (Covert et al., 2001; Palsson, 2000; Papin et al., 2003). The edges of this space, which form a convex cone, can be calculated and are called the extreme pathways (Fig. 1a). All valid steady state flux distributions through the metabolic network are nonnegative linear combinations of these extreme pathways. If all kinetic parameters are known, then kinetic models can be used to calculate a single solution that lies within the convex cone formed by the extreme pathways (Fig. 1a). If the kinetic constants are not fully known, then partial ARTICLE IN PRESS *Corresponding author. Tel.: +1-858-534-5668; fax: +1-858-822- 3120. E-mail address: [email protected] (B.O. Palsson). 1 These authors contributed equally to this work. 0022-5193/$ - see front matter r 2003 Elsevier Ltd. All rights reserved. doi:10.1016/S0022-5193(03)00237-6
Transcript of Network-based analysis of metabolic regulation in the human red blood cell
Journal of Theoretical Biology 225 (2003) 185–194
ARTICLE IN PRESS
*Correspondin
3120.
E-mail addres1These author
0022-5193/$ - see
doi:10.1016/S002
Network-based analysis of metabolic regulation inthe human red blood cell
Nathan D. Price1, Jennifer L. Reed1, Jason A. Papin1, Sharon J. Wiback,Bernhard O. Palsson*
Department of Bioengineering, University of California, San Diego, 9500 Gilman Drive, La Jolla, CA, 92093-0412 USA
Received 10 December 2002; received in revised form 20 May 2003; accepted 3 June 2003
Abstract
Reconstruction of cell-scale metabolic networks is now possible. A description of allowable metabolic network functions can be
obtained using extreme pathways, which are the convex basis vectors of the solution space containing all steady state flux
distributions. However, only a portion of these allowable network functions are physiologically possible due to kinetic and
regulatory constraints. Methods are now needed that enable us to take a defined metabolic network and deduce candidate
regulatory structures that control the selection of these physiologically relevant states. One such approach is the singular value
decomposition (SVD) of extreme pathway matrices (P), which allows for the characterization of steady state solution spaces.
Eigenpathways, which are the left singular vectors from the SVD of P, can be described and categorized by their biochemical
function. SVD of P for the human red blood cell showed that the first five eigenpathways, out of a total of 23, effectively characterize
all the relevant physiological states of red blood cell metabolism calculated with a detailed kinetic model. Thus, with five degrees of
freedom the magnitude and nature of the regulatory needs are defined. Additionally, the dominant features of these first five
eigenpathways described key metabolic splits that are indeed regulated in the human red blood cell. The extreme pathway matrix is
derived directly from network topology and only knowledge of Vmax values is needed to reach these conclusions. Thus, we have
implemented a network-based analysis of regulation that complements the study of individual regulatory events. This topological
approach may provide candidate regulatory structures for metabolic networks with known stoichiometry but poorly characterized
regulation.
r 2003 Elsevier Ltd. All rights reserved.
Keywords: Extreme pathways; Singular value decomposition; SVD; Constraint-based models; Elementary modes
1. Introduction
It is now possible to construct cell-scale networksdescribing various cellular functions (Covert et al.,2001). A major challenge we are now faced with is todevelop in silico modeling strategies that generatemeaningful network-level analyses. Various modelingphilosophies and approaches have been pursued, in-cluding deterministic kinetic models (Joshi and Palsson,1989; Tomita et al., 1999; Werner and Heinrich, 1985),stochastic models (Arkin et al., 1998; Elowitz et al.,2002; McAdams and Arkin, 1997), and constraint-based
g author. Tel.: +1-858-534-5668; fax: +1-858-822-
s: [email protected] (B.O. Palsson).
s contributed equally to this work.
front matter r 2003 Elsevier Ltd. All rights reserved.
2-5193(03)00237-6
models (Edwards et al., 2002; Palsson, 2000; Price et al.,2003a; Schuster et al., 2000). Constraint-based modelsuse governing constraints, such as mass balance andmaximum reaction rates, to restrict potential cellularbehavior. This modeling approach has been appliedto metabolism and results in a solution space inwhich all feasible steady state flux distributions reside(Covert et al., 2001; Palsson, 2000; Papin et al., 2003).The edges of this space, which form a convex cone, canbe calculated and are called the extreme pathways(Fig. 1a). All valid steady state flux distributionsthrough the metabolic network are nonnegative linearcombinations of these extreme pathways. If all kineticparameters are known, then kinetic models can be usedto calculate a single solution that lies within the convexcone formed by the extreme pathways (Fig. 1a). If thekinetic constants are not fully known, then partial
ARTICLE IN PRESS
Stoichiometric model of the topology of a reaction network
Extreme pathway analysis
Steady-state solution space for the reaction network
The effect of extreme pathway magnitude on the direction of the 1st
eigenpathway.
(a)
1st eigenpathway
(b)
The 2nd and 3rd eigenpathwayslie in the subspace perpendicular to the 1st eigenpathway.
3rd
eigenpathway
EP1
EP2
Extreme pathway
flux
v B
flux
v C
flux vA
(c)
EP3
EP3
EP4 2nd
eigenpathway
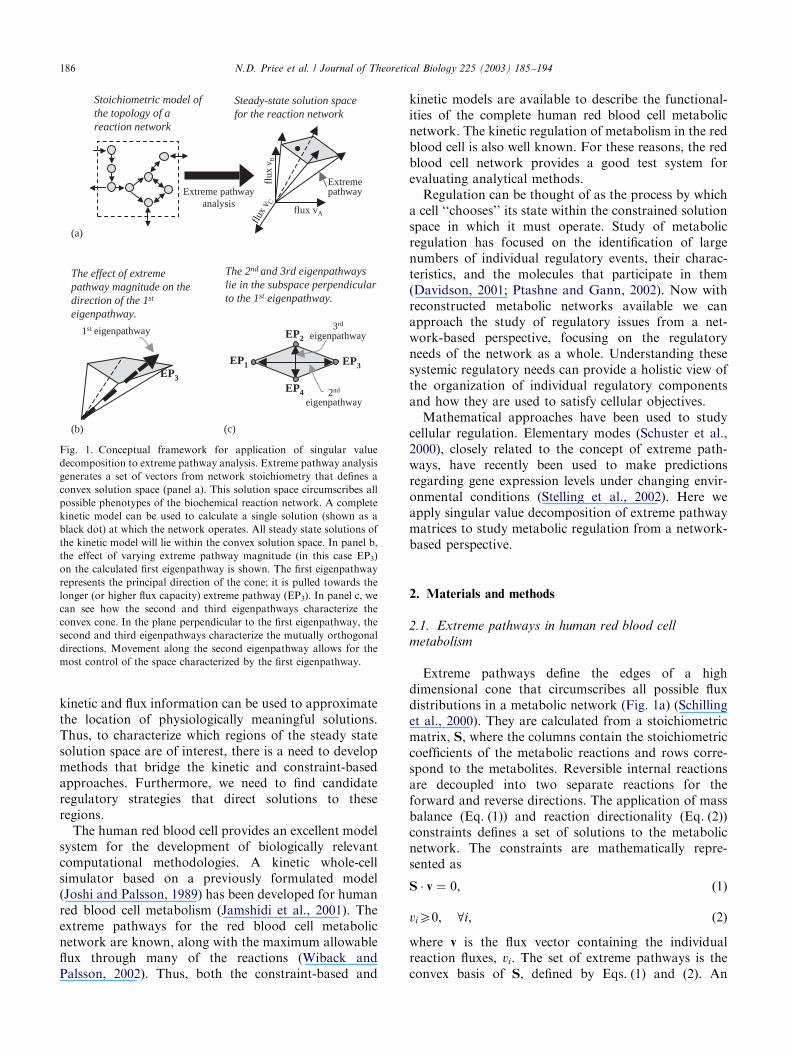
Fig. 1. Conceptual framework for application of singular value
decomposition to extreme pathway analysis. Extreme pathway analysis
generates a set of vectors from network stoichiometry that defines a
convex solution space (panel a). This solution space circumscribes all
possible phenotypes of the biochemical reaction network. A complete
kinetic model can be used to calculate a single solution (shown as a
black dot) at which the network operates. All steady state solutions of
the kinetic model will lie within the convex solution space. In panel b,
the effect of varying extreme pathway magnitude (in this case EP3)
on the calculated first eigenpathway is shown. The first eigenpathway
represents the principal direction of the cone; it is pulled towards the
longer (or higher flux capacity) extreme pathway (EP3). In panel c, we
can see how the second and third eigenpathways characterize the
convex cone. In the plane perpendicular to the first eigenpathway, the
second and third eigenpathways characterize the mutually orthogonal
directions. Movement along the second eigenpathway allows for the
most control of the space characterized by the first eigenpathway.
N.D. Price et al. / Journal of Theoretical Biology 225 (2003) 185–194186
kinetic and flux information can be used to approximatethe location of physiologically meaningful solutions.Thus, to characterize which regions of the steady statesolution space are of interest, there is a need to developmethods that bridge the kinetic and constraint-basedapproaches. Furthermore, we need to find candidateregulatory strategies that direct solutions to theseregions.
The human red blood cell provides an excellent modelsystem for the development of biologically relevantcomputational methodologies. A kinetic whole-cellsimulator based on a previously formulated model(Joshi and Palsson, 1989) has been developed for humanred blood cell metabolism (Jamshidi et al., 2001). Theextreme pathways for the red blood cell metabolicnetwork are known, along with the maximum allowableflux through many of the reactions (Wiback andPalsson, 2002). Thus, both the constraint-based and
kinetic models are available to describe the functional-ities of the complete human red blood cell metabolicnetwork. The kinetic regulation of metabolism in the redblood cell is also well known. For these reasons, the redblood cell network provides a good test system forevaluating analytical methods.
Regulation can be thought of as the process by whicha cell ‘‘chooses’’ its state within the constrained solutionspace in which it must operate. Study of metabolicregulation has focused on the identification of largenumbers of individual regulatory events, their charac-teristics, and the molecules that participate in them(Davidson, 2001; Ptashne and Gann, 2002). Now withreconstructed metabolic networks available we canapproach the study of regulatory issues from a net-work-based perspective, focusing on the regulatoryneeds of the network as a whole. Understanding thesesystemic regulatory needs can provide a holistic view ofthe organization of individual regulatory componentsand how they are used to satisfy cellular objectives.
Mathematical approaches have been used to studycellular regulation. Elementary modes (Schuster et al.,2000), closely related to the concept of extreme path-ways, have recently been used to make predictionsregarding gene expression levels under changing envir-onmental conditions (Stelling et al., 2002). Here weapply singular value decomposition of extreme pathwaymatrices to study metabolic regulation from a network-based perspective.
2. Materials and methods
2.1. Extreme pathways in human red blood cell
metabolism
Extreme pathways define the edges of a highdimensional cone that circumscribes all possible fluxdistributions in a metabolic network (Fig. 1a) (Schillinget al., 2000). They are calculated from a stoichiometricmatrix, S, where the columns contain the stoichiometriccoefficients of the metabolic reactions and rows corre-spond to the metabolites. Reversible internal reactionsare decoupled into two separate reactions for theforward and reverse directions. The application of massbalance (Eq. (1)) and reaction directionality (Eq. (2))constraints defines a set of solutions to the metabolicnetwork. The constraints are mathematically repre-sented as
S � v ¼ 0; ð1Þ
viX0; 8i; ð2Þ
where v is the flux vector containing the individualreaction fluxes, vi: The set of extreme pathways is theconvex basis of S, defined by Eqs. (1) and (2). An
ARTICLE IN PRESSN.D. Price et al. / Journal of Theoretical Biology 225 (2003) 185–194 187
algorithm for calculating extreme pathways has beenpreviously published (Schilling et al., 2000). The extremepathways for the red blood cell metabolic network(shown in Fig. 3) were previously calculated andanalysed (Wiback and Palsson, 2002). There are 55extreme pathways for the red blood cell metabolicnetwork; however, 19 of these extreme pathways areexcluded since they are internal loops that must havezero net flux based on thermodynamic principles (Beardet al., 2002; Price et al., 2002).
2.2. Normalization of the extreme pathways
The extreme pathways were scaled to the maximumallowable flux (Vmax) through the most limiting reactionin each extreme pathway, thus forming a closed solutionspace. The length of the pathways affects the resultsobtained from SVD. Scaling by the kinetic parameterVmax normalizes each pathway to its functional capacity,as opposed to normalizing each pathway to unit length,which is mathematically convenient but less physiologi-cally relevant. Vmax values for the reactions in the redblood cell metabolic network have been previouslypublished (Joshi and Palsson, 1990; Wiback andPalsson, 2002). The maximum glucose uptake flux wasset to 1.5 mM/h in accordance with the maximumobserved value in the human red blood cell model(Jamshidi et al., 2001; Joshi and Palsson, 1990). Allextreme pathways studied herein contained at least onereaction with a defined Vmax (Wiback and Palsson, 2002).
2.3. Singular value decomposition (SVD)
The extreme pathway matrix, P, is formed using theextreme pathway vectors, Pi, as its columns. Each rowcorresponds to a flux through a given reaction in themetabolic network. P can be decomposed into threematrices (U, R, and VT) using SVD:
P ¼ USVT: ð3Þ
The matrices U and V contain a basis set for each of thefour fundamental subspaces of the matrix, P (Lay,1997). The column space of P contains any steady stateflux vector, v, through the metabolic network. Thecolumns of U and V were ordered based uponmonotonically decreasing singular values (describedbelow). While this is not a mathematical necessity,results from SVD are typically arranged in this manner.The column space is described by the first r columns ofU, where r is the rank of P. The first r columns of U area set of unique orthonormal vectors, called the leftsingular vectors. The left singular vectors from the SVDof P are the eigenvectors of P �PT and are referred toherein as the eigenpathways.
The elements of the diagonal matrix R are called thesingular values and are ordered so that they decrease in
magnitude down the diagonal. The singular values, si;indicate the relative contribution of the columns of Uand V in reconstructing P (Lay, 1997). These singularvalues are the eigenvalues of P �PT (or, equivalently, ofPT �P) (Lay, 1997). Binary representations of the P �PT
and PT �P matrices have been studied in (Papin et al.,2002). The first eigenpathway corresponds to the largestsingular value and is thus the vector that mostcontributes to the reconstruction of P. Each subsequenteigenpathway also contains the next largest contributionto the reconstruction of P, subject to being orthogonalto all the other eigenpathways. If P were projected intom dimensions, the projection with the highest informa-tion content would be a projection onto the first m
eigenpathways.The fractional contribution of each eigenpathway to
the reconstruction of the space is the magnitude of thecorresponding singular value divided by the sum of allsingular values. Thus, the fractional contribution is ameasure of how much a particular eigenpathwaycontributes to the reconstruction of the space and notnecessarily how much it is used in reconstructing aparticular vector in the space. The cumulative fractionalcontribution is defined as the sum of the first n fractionalcontributions, where n varies from 1 to r. Note that inthis paper both the fractional contribution and thecumulative fractional contribution are reported as apercent.
2.4. Decomposition of steady state flux vectors into the
eigenpathways
Each steady state flux vector, v, which lies within thesolution space, can be written as a linear combination ofthe eigenpathways resulting from the SVD of theextreme pathway matrix as
v ¼Xr
i¼1
wi � ui; ð4Þ
where ui is the ith column vector of U (or the itheigenpathway), wi is the weight for that eigenpathway,and r is the rank of P. The inner product of v with eachone of the eigenpathways gives the correspondingweights
v � uj ¼Xr
i¼1
wi � ui
" #� uj ¼ wj ð5Þ
since the columns of U are orthonormal (i.e. ui � uj=0if iaj and ui � uj=1 if i ¼ j).
2.5. Relative error of the reconstructed solution
The weighting needed on each eigenpathway in orderto reconstruct the vector, v, can be calculated fromEq. (5). The weighted addition of kðprÞ eigenpathways
ARTICLE IN PRESS
30
40
50
60
70
80
90
Cumulative Fractional Contribution100
ive
Fra
ctio
nal C
ontr
ibut
ion
(%)
N.D. Price et al. / Journal of Theoretical Biology 225 (2003) 185–194188
brings the recomposed vector, vk; closer to v as kincreases. When k ¼ r; then vr ¼ v: The relative error(RE) was calculated to evaluate how much each ofthe eigenpathways contributed to reconstructing theoriginal steady state flux vector v:
EðkÞ ¼ v� vk ¼ v�Xk
i¼1
wi � ui; ð6Þ
REðkÞ ¼EðkÞT � EðkÞ
vT � v; ð7Þ
where E(k) is the difference between the actual vector, v,and the reconstructed vector, vk, made up by theweighted linear combination of the first k eigenpathways.
2.6. Calculating steady state flux vectors using the kinetic
human red blood cell metabolic model
Steady state flux distributions (v) for red blood cellmetabolism were obtained using an in silico kineticmodel (Jamshidi et al., 2001). The unstressed (nometabolic load applied) physiological steady state wascalculated. In addition, the flux distributions corre-sponding to three types of metabolic loads werecalculated to mimic maximal environmental stressesassociated with ATP (energy load), NADPH (oxidativeload), and NADH (methemoglobin load). These loadscorrespond to the primary metabolic demands placedupon the red blood cell based upon its physiologic rolein the human body. One other main metabolic functionof the red blood cell is control of the oxygen–hemoglobin binding curve by regulating the levels of2,3-diphosphoglycerate (23DPG). The effect of a23DPG load was studied, but because of low demandflux for 2,3-DPG, the results based on including thatload were very similar to the unloaded state (results notshown). Loads can be simulated in silico by assigningincreased fluxes to non-specific conversions of cofactors(which are zero in the unstressed state) (Jamshidi et al.,2001; Wiback and Palsson, 2002). The maximumenvironmental stress sustainable by red blood cellmetabolism was defined as the highest load the cellcould sustain based on results from the kinetic model.
0
10
20
1 3 5 7 9 11 13 15 17 19 21 23
Vmax Limited
Unit Length
Vmax-Limited
Unit LengthVmax Limited
Unit Length
Eigenpathway Number (n)
Cum
ulat Vmax Limited
Unit Length
Vmax-Limited
Unit Length
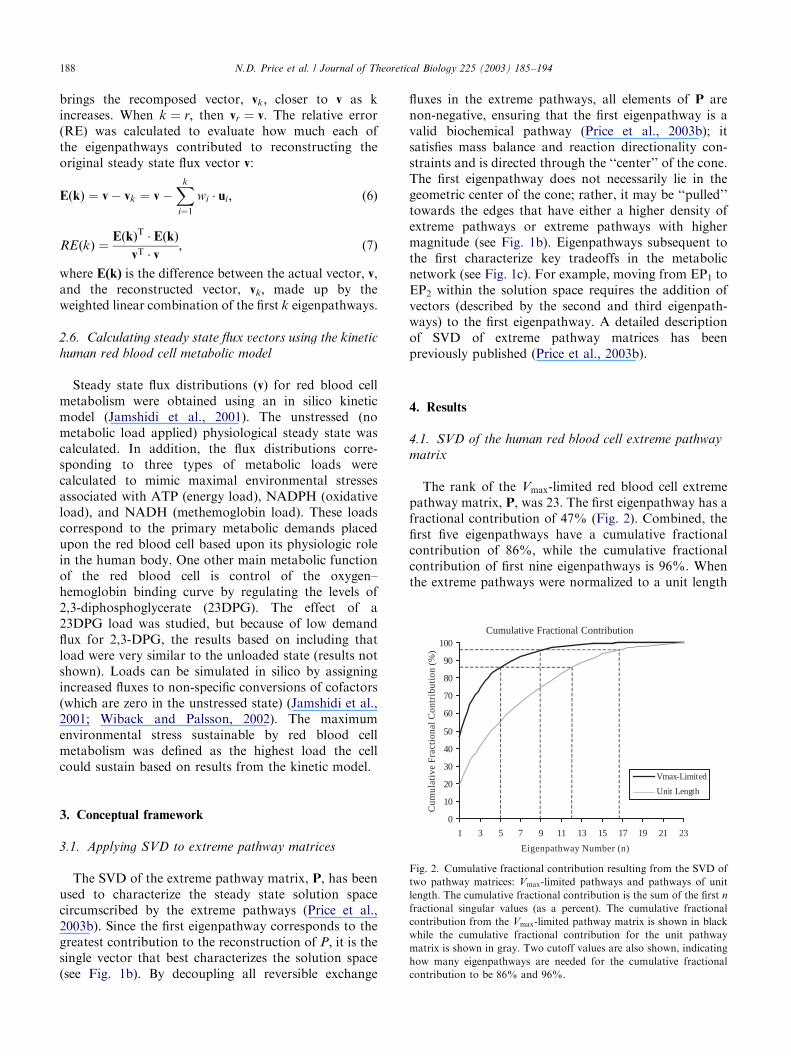
Fig. 2. Cumulative fractional contribution resulting from the SVD of
two pathway matrices: Vmax-limited pathways and pathways of unit
length. The cumulative fractional contribution is the sum of the first n
fractional singular values (as a percent). The cumulative fractional
contribution from the Vmax-limited pathway matrix is shown in black
while the cumulative fractional contribution for the unit pathway
matrix is shown in gray. Two cutoff values are also shown, indicating
how many eigenpathways are needed for the cumulative fractional
contribution to be 86% and 96%.
3. Conceptual framework
3.1. Applying SVD to extreme pathway matrices
The SVD of the extreme pathway matrix, P, has beenused to characterize the steady state solution spacecircumscribed by the extreme pathways (Price et al.,2003b). Since the first eigenpathway corresponds to thegreatest contribution to the reconstruction of P; it is thesingle vector that best characterizes the solution space(see Fig. 1b). By decoupling all reversible exchange
fluxes in the extreme pathways, all elements of P arenon-negative, ensuring that the first eigenpathway is avalid biochemical pathway (Price et al., 2003b); itsatisfies mass balance and reaction directionality con-straints and is directed through the ‘‘center’’ of the cone.The first eigenpathway does not necessarily lie in thegeometric center of the cone; rather, it may be ‘‘pulled’’towards the edges that have either a higher density ofextreme pathways or extreme pathways with highermagnitude (see Fig. 1b). Eigenpathways subsequent tothe first characterize key tradeoffs in the metabolicnetwork (see Fig. 1c). For example, moving from EP1 toEP2 within the solution space requires the addition ofvectors (described by the second and third eigenpath-ways) to the first eigenpathway. A detailed descriptionof SVD of extreme pathway matrices has beenpreviously published (Price et al., 2003b).
4. Results
4.1. SVD of the human red blood cell extreme pathway
matrix
The rank of the Vmax-limited red blood cell extremepathway matrix, P, was 23. The first eigenpathway has afractional contribution of 47% (Fig. 2). Combined, thefirst five eigenpathways have a cumulative fractionalcontribution of 86%, while the cumulative fractionalcontribution of first nine eigenpathways is 96%. Whenthe extreme pathways were normalized to a unit length
ARTICLE IN PRESS
1stE
igen
path
way
2ndE
igen
path
way
3rdE
igen
path
way
4thE
igen
path
way
5thE
igen
path
way
(e)
(b)
(f)
(c)
(d)
Unstressed Flux Map
(a)
GLU
HK
PGI *
PFK
ALD*
GAPDH*
PGK*
PGM LD*
DPGase
DPGM
TPI*
G6P
F6P
FDP
GA3PDHAP
23DPG
3PG 2PG
EN*
PEP PYR
PK
LAC
G6PDH PGL* PDGH
XPI*
TK1*
RL5P
R5PX5P
RPI*
TA*
S7PGA3P
F6PE4P
TK2*
NAD
Pi
CO2
H
NH3
NADP
NADPH
NADH
HGPRT
PRM*
AdPRT
ADA
AMPase
INO
IMP AMP
ADO
IMPase
AMPDAADP
ATP
ApK*
PNPase*
AK
HXR1P
PRPP
PRPPsyn
ADP
ATP
H2O
6PGL 6PGC
13DPG
ADE
*
*
*
*
*
*
*
*
*
*
*
**
**
*
*
*
*
*
*
*
*
*
*
*
*
**
**
*
*
*
*
*
*
*
*
*
*
*
*
**
**
*
*
*
*
*
*
*
*
*
*
*
*
**
**
*
*
*
*
*
*
*
*
*
*
*
*
**
**
*
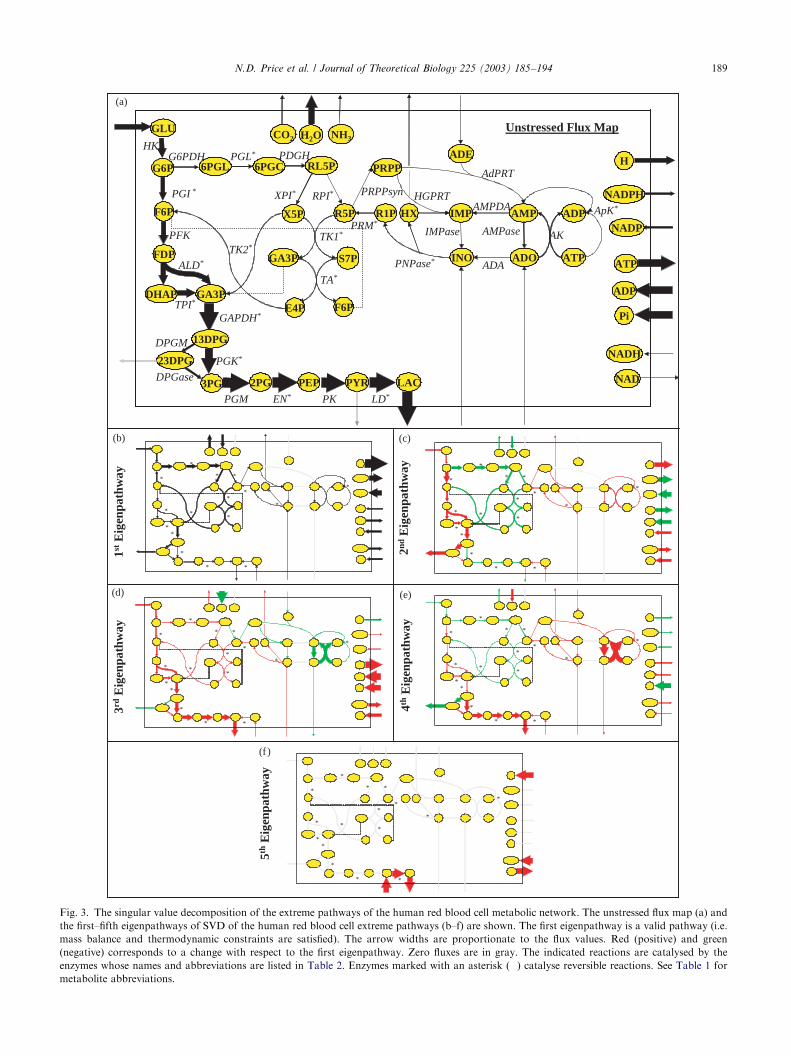
Fig. 3. The singular value decomposition of the extreme pathways of the human red blood cell metabolic network. The unstressed flux map (a) and
the first–fifth eigenpathways of SVD of the human red blood cell extreme pathways (b–f) are shown. The first eigenpathway is a valid pathway (i.e.
mass balance and thermodynamic constraints are satisfied). The arrow widths are proportionate to the flux values. Red (positive) and green
(negative) corresponds to a change with respect to the first eigenpathway. Zero fluxes are in gray. The indicated reactions are catalysed by the
enzymes whose names and abbreviations are listed in Table 2. Enzymes marked with an asterisk (�) catalyse reversible reactions. See Table 1 for
metabolite abbreviations.
N.D. Price et al. / Journal of Theoretical Biology 225 (2003) 185–194 189
ARTICLE IN PRESSN.D. Price et al. / Journal of Theoretical Biology 225 (2003) 185–194190
rather than the limiting Vmax; more eigenpathways wereneeded to describe the same cumulative fractionalcontribution in the network (Fig. 2). With the extremepathways normalized to unit length, the first eigenpath-way had a fractional contribution of 20%, while thecumulative fractional contribution of the first five andnine eigenpathways were 56% and 75%, respectively.This difference demonstrates the importance of the Vmax
parameters in shaping the solution space and describingphysiologically meaningful states. For the remainder ofthis paper the Vmax-limited P was used.
The first five eigenpathways resulting from the SVDof P are shown on the metabolic maps in Fig. 3(b–f).A list of metabolites and their abbreviations as used inFig. 3 can be found in Table 1. The associated enzymesand full reaction list that make up the network are foundin Table 2. The first eigenpathway shows low flux valuesthrough the adenosine reactions, higher fluxes throughthe glycolytic reactions, with an exit through theRapoport–Leubering (R/L) shunt, and the highest fluxlevels through the pentose phosphate pathway. Move-ment along one of the subsequent eigenpathways in thepositive direction (the first eigenpathway can only beused in a positive direction) corresponds to increasingthe fluxes shown in red and decreasing those shown ingreen. Since the eigenpathways are required to be
Table 1
Metabolite abbreviations used in Fig. 3
Abbr. Metabolite
13DPG 1,3-diphosphoglycerate
23DPG 2,3-diphosphoglycerate
2PG 2-phosphoglycerate
3PG 3-phosphoglycerate
6PGC Phosphogluconate
6PGL Phosphogluco-lactone
ADE Adenine
ADO Adenosine
DHAP Dihydroxyacetone phosphate
E4P Erythrose-4-phosphate
F6P Fructose-6-phosphate
FDP Fructose-1,6-bisphosphate
G6P Glucose-6-phosphate
GA3P Glyceraldehyde-3-phosphate
GLU Glucose
HX Hypoxanthine
IMP Inosine monophosphate
INO Inosine
LAC Lactate
PEP Phosphenolpyruvate
Pi Inorganic phosphate
PRPP 5-phosphoribosyl-1-pyrophosphate
PYR Pyruvate
R1P Ribose-1-phosphate
R5P Ribose-5-phosphate
RL5P Ribulose-5-phosphate
S7P Sedoheptulose-7-phosphate
X5P Xylulose-5-phosphate
orthogonal, they specifically describe the directions inthe cone that are independent from each other. Thesubsequent eigenpathways can be interpreted biochemi-cally as follows:
* The second eigenpathway describes the flux splitbetween glycolysis and the pentose phosphate reac-tions. If the contribution of this eigenpathway wereadded to the first eigenpathway it would lead todecreased flux through the pentose phosphate reac-tions and reduced production of NADPH. Theincreased glycolytic flux exits through the R/L shuntleading to decreased ATP production since ATP isused in upper glycolysis and not recovered in lowerglycolysis. The production of NADH increases.
* The third eigenpathway uses the glycolytic reactionsfrom glucose to pyruvate with production of ATPand NADH. It results in a lower dissipation of ATPas a consequence of a reduced use of the coupledactions of AMPase and AK. As a result thiseigenpathway has significant ATP production.
* The fourth eigenpathway describes the flux splitbetween lower glycolysis and the R/L shunt. Itfurther describes an increase in ATP dissipation viathe AMPase-AK cycle leading to little net productionof ATP, and counteracts the effects of the thirdeigenpathway with respect to ATP dissipation.
* The fifth eigenpathway is actually one of the extremepathways (Wiback and Palsson, 2002). It describesthe uptake of pyruvate and conversion to lactate,consuming NADH. It is thus important in balancingNADH redox metabolism.
As discussed below the first five eigenpathwaysaccount for most of the red blood cell’s physiologicalstates.
4.2. Reconstructing physiological steady states from
eigenpathways
The unstressed state of the red blood cell metabolicnetwork (defined as the steady state flux distributionwithout a metabolic load) was calculated using a fullkinetic model (Jamshidi et al., 2001; Joshi and Palsson,1989), and is shown on the metabolic map (Fig. 3a). Thevalues of the maximum sustainable loads for NADPH,ATP, and NADH were also calculated using the kineticmodel as well as their corresponding flux distributions.An NADPH load simulates the red blood cell’s responseto oxidative free radicals. The maximum NADPH loadis 2.5 mM/h, a very high value relative to glucose inputat 1.5 mM/h. The ATP load simulates conditions ofincreased energy loads, such as when the cell is in ahyperosmotic environment. The maximum ATP load is0.37 mM/h. A 1.7 mM/h NADH load, important formethemoglobin reduction in the human red blood cell,
ARTICLE IN PRESS
Table 2
Reaction abbreviations used in Fig. 3. The corresponding reaction stoichiometries are also included
Abbr. Enzyme name Metabolic reaction
ADA Adenosine deaminase ADO+H2O-INO+NH3
AdPRT Adenine phosphoribosyl transferase PRPP+ADE+H2O-AMP+2 Pi
AK Adenosine kinase ADO+ATP-ADP+AMP
ALD Aldolase FDP2GA3P+DHAP
AMPase Adenosine monophosphate phosphohydrolase AMP+H2O-ADO+Pi+H
AMPDA Adenosine monophosphate deaminase AMP+H2O-IMP+NH3
ApK Adenylate Kinase 2 ADP2ATP+AMP
DPGase Diphosphoglycerate phosphatase 23DPG+H2O-3PG+Pi
DPGM Diphosphoglyceromutase 13DPG-23DPG+H
EN Enolase 2PG2PEP+H2O
G6PDH Glucose-6-phosphate dehydrogenase G6P+NADP-6PGL+NADPH+H
GAPDH Glyceraldehyde phosphate dehydrogenase GA3P+NAD+Pi213DPG+NADH+H
HGPRT Hypoxanthine guanine phosphoryl transferase PRPP+HX+H2O-IMP+2 Pi
HK Hexokinase GLU+ATP-G6P+ADP+H
IMPase Inosine monophosphatase IMP+H2O-INO+Pi+H
LD Lactate dehydrogenase PYR+NADH+H2LAC+NAD
PDGH 6-phosphoglycononate dehydrogenase 6PGC+NADP-RL5P+NADPH+CO2
PFK Phosphofructokinase F6P+ATP-FDP+ADP+H
PGI Phosphoglucoisomerase G6P2F6P
PGK Phosphoglycerate kinase 13DPG+ADP23PG+ATP
PGL 6-phosphoglyconolactonase 6PGL+H2O26PGC+H
PGM Phosphoglyceromutase 3PG22PG
PK Pyruvate kinase PEP+ADP+H-PYR+ATP
PNPase Purine nucleoside phosphorylase INO+Pi2HX+R1P
PRM Phosphoribomutase R1P2R5P
PRPPsyn Phosphoribosyl pyrophosphate synthetase R5P+ATP-PRPP+AMP
RPI Ribose-5-phosphate isomerase RL5P2R5P
TA Transaldolase GA3P+S7P2E4P+F6P
TK1 Transketolase X5P+R5P2S7P+E4P
TK2 Transketolase X5P+E4P2F6P+GA3P
TPI Triose phosphate isomerase DHAP2GA3P
XPI Xylulose-5-phosphate epimerase RL5P2X5P
N.D. Price et al. / Journal of Theoretical Biology 225 (2003) 185–194 191
was also applied. These stressed flux vectors representextreme physiological states of the red blood cell, andhelp identify the limits of the kinetically attainablesolutions within the stoichiometrically defined solutionspace.
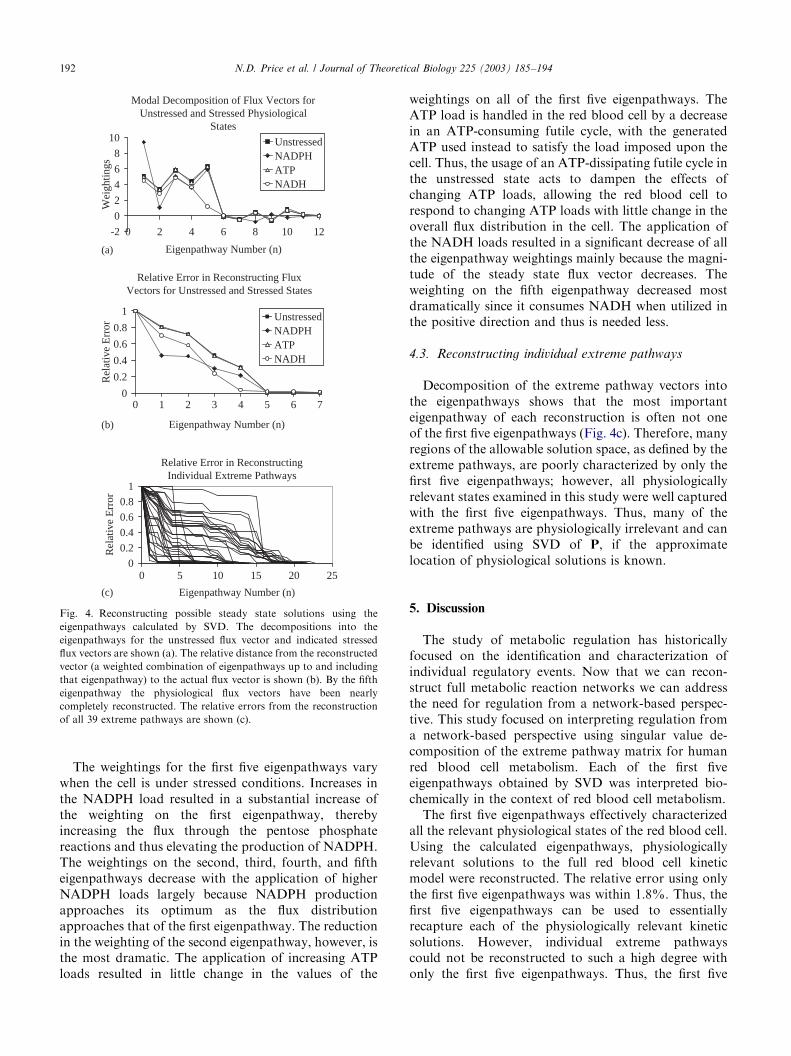
These four steady state solutions were uniquelydecomposed into the 23 eigenpathways (Fig. 4a). Thefirst five eigenpathways are weighted to different degreesin reconstructing the flux distributions for the fourmetabolic states. In addition, ‘‘fine tuning’’ occurs withthe addition of eigenpathways 6–11 to the reconstructedsolution. Eigenpathways 12–23 are essentially insignif-icant in reconstructing the four solutions to the redblood cell kinetic model. The weighted addition of eachsubsequent eigenpathway to each reconstructed steadystate solution (vk) reduced the relative error (Fig. 4b).After the inclusion of the first five eigenpathways, therelative error (RE(5)) of all the reconstructed kineticsolutions ranged from 0.005 to 0.018. Thus, in all fourcases, the first five eigenpathways essentially recon-structed each of the individual steady state solutions(Fig. 4b). Therefore, the physiologically relevant regionof the steady state solution space can be described usingonly five vectors and thus is only five dimensional.
Consequently, there are effectively only five degrees offreedom in the problem of regulating red blood cellmetabolism.
An inspection of the first five eigenpathways (Fig. 3b–f) demonstrates how together they reconstruct theunstressed steady state solution (Fig. 3a). Relative tothe first eigenpathway (Fig. 3b), adding the secondeigenpathway (Fig. 3c) increases the flux through thefirst half of glycolysis, decreases the flux through thepentose phosphate reactions, and decreases NADPHproduction, all of which moves the reconstructedsolution significantly towards the unstressed steady state(Fig. 3a). Adding the third eigenpathway (Fig. 3d)increases the flux through all of glycolysis, particularlythrough lower glycolysis. The addition of the fourtheigenpathway (Fig. 3e) appropriately decreases theamount of 23DPG that is produced and instead sendsthat flux through lower glycolysis. Finally, the additionof the fifth eigenpathway increases the flux frompyruvate to lactate, which leads essentially to the steadystate solution where lactate is the primary output ofglycolysis. Thus, the significant features of the un-stressed steady state can be reconstructed with only thefirst five eigenpathways.
ARTICLE IN PRESS
Relative Error in Reconstructing Individual Extreme Pathways
0
0.2
0.4
0.6
0.8
1
0 5 10 15 20 25
Eigenpathway Number (n)
Rel
ativ
e E
rror
Relative Error in Reconstructing Flux Vectors for Unstressed and Stressed States
0
0.2
0.4
0.6
0.8
1
0 1 2 3 4 5 6 7
Eigenpathway Number (n)
Rel
ativ
e E
rror
UnstressedNADPHATPNADH
Modal Decomposition of Flux Vectors for Unstressed and Stressed Physiological
States
-2
0
2
4
6
8
10
0 2 4 6 8 10 12
Eigenpathway Number (n)
Wei
ghtin
gs
UnstressedNADPHATPNADH
(a)
(b)
(c)
Fig. 4. Reconstructing possible steady state solutions using the
eigenpathways calculated by SVD. The decompositions into the
eigenpathways for the unstressed flux vector and indicated stressed
flux vectors are shown (a). The relative distance from the reconstructed
vector (a weighted combination of eigenpathways up to and including
that eigenpathway) to the actual flux vector is shown (b). By the fifth
eigenpathway the physiological flux vectors have been nearly
completely reconstructed. The relative errors from the reconstruction
of all 39 extreme pathways are shown (c).
N.D. Price et al. / Journal of Theoretical Biology 225 (2003) 185–194192
The weightings for the first five eigenpathways varywhen the cell is under stressed conditions. Increases inthe NADPH load resulted in a substantial increase ofthe weighting on the first eigenpathway, therebyincreasing the flux through the pentose phosphatereactions and thus elevating the production of NADPH.The weightings on the second, third, fourth, and fiftheigenpathways decrease with the application of higherNADPH loads largely because NADPH productionapproaches its optimum as the flux distributionapproaches that of the first eigenpathway. The reductionin the weighting of the second eigenpathway, however, isthe most dramatic. The application of increasing ATPloads resulted in little change in the values of the
weightings on all of the first five eigenpathways. TheATP load is handled in the red blood cell by a decreasein an ATP-consuming futile cycle, with the generatedATP used instead to satisfy the load imposed upon thecell. Thus, the usage of an ATP-dissipating futile cycle inthe unstressed state acts to dampen the effects ofchanging ATP loads, allowing the red blood cell torespond to changing ATP loads with little change in theoverall flux distribution in the cell. The application ofthe NADH loads resulted in a significant decrease of allthe eigenpathway weightings mainly because the magni-tude of the steady state flux vector decreases. Theweighting on the fifth eigenpathway decreased mostdramatically since it consumes NADH when utilized inthe positive direction and thus is needed less.
4.3. Reconstructing individual extreme pathways
Decomposition of the extreme pathway vectors intothe eigenpathways shows that the most importanteigenpathway of each reconstruction is often not oneof the first five eigenpathways (Fig. 4c). Therefore, manyregions of the allowable solution space, as defined by theextreme pathways, are poorly characterized by only thefirst five eigenpathways; however, all physiologicallyrelevant states examined in this study were well capturedwith the first five eigenpathways. Thus, many of theextreme pathways are physiologically irrelevant and canbe identified using SVD of P, if the approximatelocation of physiological solutions is known.
5. Discussion
The study of metabolic regulation has historicallyfocused on the identification and characterization ofindividual regulatory events. Now that we can recon-struct full metabolic reaction networks we can addressthe need for regulation from a network-based perspec-tive. This study focused on interpreting regulation froma network-based perspective using singular value de-composition of the extreme pathway matrix for humanred blood cell metabolism. Each of the first fiveeigenpathways obtained by SVD was interpreted bio-chemically in the context of red blood cell metabolism.
The first five eigenpathways effectively characterizedall the relevant physiological states of the red blood cell.Using the calculated eigenpathways, physiologicallyrelevant solutions to the full red blood cell kineticmodel were reconstructed. The relative error using onlythe first five eigenpathways was within 1.8%. Thus, thefirst five eigenpathways can be used to essentiallyrecapture each of the physiologically relevant kineticsolutions. However, individual extreme pathwayscould not be reconstructed to such a high degree withonly the first five eigenpathways. Thus, the first five
ARTICLE IN PRESSN.D. Price et al. / Journal of Theoretical Biology 225 (2003) 185–194 193
eigenpathways represented the space relevant to solu-tions of the full kinetic model better than they did to thespace as a whole, even though they were calculated froma description of the entire solution space. This factsuggests that developing constraint-based methods thattake into account kinetics and metabolomics (Palsson,2002) will result in defining a much reduced solutionspace. This new solution space will be a moreconstrained region within the space circumscribed bythe topologically based extreme pathways. The reducedsolution space will allow for more physiologicallyrelevant analyses, such as an evaluation of the effectsof SNPs on red blood cell network function (Jamshidiet al., 2002).
The singular value decomposition of P demonstratedthat the regulatory problem in red blood cell metabolismis essentially five dimensional. Hence, controlling thesefive eigenpathways would allow for control of thesystem. The question now becomes: does the humanred blood cell in fact control these eigenpathways? Whileno evidence exists that the red blood cell preciselycontrols each of the eigenpathways as a whole, byexamining known regulatory loops (Joshi and Palsson,1990), a case can be made that the human red blood celldoes in fact control the dominant features of theseeigenpathways (reaction splits with large changes in fluxlevels). For example, the dominant feature of the secondeigenpathway is the flux split between glycolysis and thepentose phosphate pathway and this split is known to beregulated in the red blood cell (Kirkman and Gaetani,1986). The third eigenpathway describes the glycolyticpathway from glucose to pyruvate with production ofATP and NADH, and this pathway is known to beregulated in the red blood cell through the regulation ofhexokinase (HK) and pyruvate kinase (PK) (Gerberet al., 1974; Holzh .utter et al., 1985). The dominantfeature of the fourth eigenpathway is the flux splitbetween lower glycolysis and the R/L shunt. This split isknown to be regulated in the red blood cell, primarilythrough regulation of diphosphoglycerate mutase(DPGM) (Heinrich et al., 1977). The fifth eigenpathwaydescribes uptake of pyruvate and conversion to lactate(dissipating one NADH) and is simply controlledthrough mass-action kinetics of lactate and pyruvateexchange (Halestrap, 1976). Thus, the dominant fea-tures of the first five eigenpathways are indeedcontrolled in the red blood cell. Control of the dominantfeatures of the first five eigenpathways, along withknowledge of the cofactor loads, is sufficient to controlred blood cell metabolism.
Taken together, this study presents a network-basedapproach to infer a regulatory network and to define thedegrees of freedom of the regulatory problem. Themethod used calculates the modalities needed forthe metabolic network to navigate its solution spaceand thus could be used to infer candidate regulatory
loops of metabolic systems for which the regulation islargely unknown. Further, based upon their contribu-tion to the steady state solution space, these regulatoryloops can potentially be ordered in terms of theirimportance to the reduction of the solution space totightly confine the physiological states of interest.Network-based approaches to studying regulation, suchas the one offered herein, complement component-basedstudies and provide a potential framework to betterunderstand the interaction of regulatory componentsneeded to achieve the regulatory demands of the cell.
Acknowledgements
The authors would like to thank Iman Famili and Dr.Radhakrishnan Mahadevan for insightful discussions,as well as Natalie Duarte for helpful feedback on thismanuscript. We would like to acknowledge the supportof the NIH (GM 57089) and the Whitaker Foundation(Graduate Research Fellowship to JP).
References
Arkin, A., Ross, J., McAdams, H.H., 1998. Stochastic kinetic analysis
of developmental pathway bifurcation in phage lambda-infected
Escherichia coli cells. Genetics 149, 1633–1648.
Beard, D.A., Liang, S.D., Qian, H., 2002. Energy balance for analysis
of complex metabolic networks. Biophys. J. 83, 79–86.
Covert, M.W., Schilling, C.H., Famili, I., Edwards, J.S., Goryanin,
I.I., Selkov, E., Palsson, B.O., 2001. Metabolic modeling of
microbial strains in silico. Trends Biochem. Sci. 26, 179–186.
Davidson, E.H., 2001. Genomic Regulatory Systems: Development
and Evolution. Academic Press, San Diego.
Edwards, J.S., Covert, M., Palsson, B., 2002. Metabolic modelling
of microbes: the flux-balance approach. Environ. Microbiol. 4,
133–140.
Elowitz, M.B., Levine, A.J., Siggia, E.D., Swain, P.S., 2002. Stochastic
gene expression in a single cell. Science 297, 1183–1186.
Gerber, G., Preissler, H., Heinrich, R., Rapoport, S.M., 1974.
Hexokinase of human erythrocytes. Purification, kinetic model
and its application to the conditions in the cell. Eur. J. Biochem. 45,
39–52.
Halestrap, A.P., 1976. Transport of pyruvate NAD lactate into human
erythrocytes. Evidence for the involvement of the chloride carrier
and a chloride-independent carrier. Biochem. J. 156, 193–207.
Heinrich, R., Rapaport, S.M., Rapaport, T.A., 1977. Metabolic
regulation and mathematical models. Prog. Biophys. Mol. Biol.
32, 1–82.
Holzh .utter, H.G., Jacobasch, G., Bisdorff, A., 1985. Mathematical
modelling of metabolic pathways affected by an enzyme deficiency.
A mathematical model of glycolysis in normal and pyruvate-
kinase-deficient red blood cells. Eur. J. Biochem. 149, 101–111.
Jamshidi, N., Edwards, J.S., Fahland, T., Church, G.M., Palsson,
B.O., 2001. Dynamic simulation of the human red blood cell
metabolic network. Bioinformaics 17, 286–287.
Jamshidi, N., Wiback, S.J., Palsson, B.O., 2002. In silico model-driven
assessment of the effects of single nucleotide polymorphisms
(SNPs) on human red blood cell metabolism. Genome Res. 12,
1687–1692.
ARTICLE IN PRESSN.D. Price et al. / Journal of Theoretical Biology 225 (2003) 185–194194
Joshi, A., Palsson, B.O., 1989. Metabolic dynamics in the human red
cell. Part I—A comprehensive kinetic model. J. Theor. Biol. 141,
515–528.
Joshi, A., Palsson, B.O., 1990. Metabolic dynamics in the human red
cell. Part III—metabolic reaction rates. J. Theor. Biol. 142, 41–68.
Kirkman, H.N., Gaetani, G.F., 1986. Regulation of glucose-6-
phosphate dehydrogenase in human erythrocytes. J. Biol. Chem.
261, 4033–4038.
Lay, D.C., 1997. Linear Algebra and Its Applications, 2nd Edition.
Addison Wesley Longman Inc, Reading, MA.
McAdams, H.H., Arkin, A., 1997. Stochastic mechanisms in gene
expression. Proc. Natl Acad. Sci. 94, 814–819.
Palsson, B.O., 2000. The challenges of in silico biology. Nat.
Biotechnol. 18, 1147–1150.
Palsson, B.O., 2002. In silico biology through ‘‘omics’’. Nat.
Biotechnol. 20, 649–650.
Papin, J.A., Price, N.D., Palsson, B.O., 2002. Extreme pathway lengths
and reaction participation in genome-scale metabolic networks.
Genome Res. 12, 1889–1900.
Papin, J.A., Price, N.D., Wiback, S.J., Fell, D., Palsson, B., 2003.
Metabolic pathways in the post-genome era. Trends Biochem. Sci.
28, 250–258.
Price, N.D., Famili, I., Beard, D.A., Palsson, B.O., 2002. Extreme
pathways and Kirchhoff’s second law. Biophys. J. 83, 2879–2882.
Price, N.D., Papin, J.A., Schilling, C.H., Palsson, B., 2003a. Genome-
scale microbial in silico models: the constraints-based approach.
Trends Biotechnol. 21, 162–169.
Price, N.D., Reed, J.L., Papin, J.A., Famili, I., Palsson, B.O., 2003b.
Analysis of metabolic capabilities using singular value decomposi-
tion of extreme pathway matrices. Biophys. J. 84, 794–804.
Ptashne, M., Gann, A., 2002. Genes and Signals. Cold Spring Harbor
Laboratory Press. Cold Spring Harbor, New York.
Schilling, C.H., Letscher, D., Palsson, B.O., 2000. Theory for the
systemic definition of metabolic pathways and their use in
interpreting metabolic function from a pathway-oriented perspec-
tive. J. Theor. Biol. 203, 229–248.
Schuster, S., Fell, D.A., Dandekar, T., 2000. A general definition
of metabolic pathways useful for systematic organization and
analysis of complex metabolic networks. Nature Biotechnol. 18,
326–332.
Stelling, J., Klamt, S., Bettenbrock, K., Schuster, S., Gilles, E.D., 2002.
Metabolic network structure determines key aspects of function-
ality and regulation. Nature 420, 190–193.
Tomita, M., Hashimoto, K., Takahashi, K., Shimizu, T.S., Matsuzaki,
Y., Miyoshi, F., Saito, K., Tanida, S., Yugi, K., Venter, J.C.,
Hutchison, C.A.I., 1999. E-CELL: software environment for
whole-cell simulation. Bioinformatics 15, 72–84.
Werner, A., Heinrich, R., 1985. A kinetic model for the interaction of
energy metabolism and osmotic states of human erythrocytes.
Analysis of the stationary ‘‘in vivo’’ state and of time dependent
variations under blood preservation conditions. Biomed. Biochim.
Acta 44, 185–212.
Wiback, S.J., Palsson, B.O., 2002. Extreme pathway analysis of human
red blood cell metabolism. Biophys. J. 83, 808–818.