Preoperative communication with anesthetists via anesthesia ...
Upload
independentCategory
view
1download
0
Anesthesiology 2005; 103:258–68 © 2005 American Society of Anesthesiologists, Inc. Lippincott Williams & Wilkins, Inc.
S-Ketamine Anesthesia Increases Cerebral Blood Flow inExcess of the Metabolic Needs in HumansJaakko W. Langsjo, M.D.,* Anu Maksimow, M.D.,* Elina Salmi, M.D.,* Kaike Kaisti, M.D.,† Sargo Aalto, M.Sc.,‡Vesa Oikonen, M.Sc.,§ Susanna Hinkka, Ph.Lic.,� Riku Aantaa, M.D.,# Hannu Sipila, M.Sc.,** Tapio Viljanen, M.Sc.,**Riitta Parkkola, M.D.,†† Harry Scheinin, M.D.‡‡
Background: Animal studies have demonstrated neuroprotec-tive properties of S-ketamine, but its effects on cerebral bloodflow (CBF), metabolic rate of oxygen (CMRO2), and glucosemetabolic rate (GMR) have not been comprehensively studiedin humans.
Methods: Positron emission tomography was used to quantifyCBF and CMRO2 in eight healthy male volunteers awake and dur-ing S-ketamine infusion targeted to subanesthetic (150 ng/ml) andanesthetic (1,500–2,000 ng/ml) concentrations. In addition, sub-jects’ GMRs were assessed awake and during anesthesia. Wholebrain estimates for cerebral blood volume were obtained usingkinetic modeling.
Results: The mean � SD serum S-ketamine concentration was159 � 21 ng/ml at the subanesthetic and 1,959 � 442 ng/ml atthe anesthetic levels. The total S-ketamine dose was 10.4 mg/kg.S-ketamine increased heart rate (maximally by 43.5%) andmean blood pressure (maximally by 27.0%) in a concentration-dependent manner (P � 0.001 for both). Subanesthetic S-ket-amine increased whole brain CBF by 13.7% (P � 0.035). Thegreatest regional CBF increase was detected in the anteriorcingulate (31.6%; P � 0.010). No changes were detected inCMRO2. Anesthetic S-ketamine increased whole brain CBF by36.4% (P � 0.006) but had no effect on whole brain CMRO2 orGMR. Regionally, CBF was increased in nearly all brain struc-tures studied (greatest increase in the insula 86.5%; P < 0.001),whereas CMRO2 increased only in the frontal cortex (by 15.7%;P � 0.007) and GMR increased only in the thalamus (by 11.7%;P � 0.010). Cerebral blood volume was increased by 51.9% (P �0.011) during anesthesia.
Conclusions: S-ketamine–induced CBF increases exceeded theminor changes in CMRO2 and GMR during anesthesia.
UNDERSTANDING the central nervous system effects ofanesthetic regimens is essential for optimal care of pa-tients with cerebral pathology. An ideal anestheticwould produce a safe, steady anesthesia with uniformdecrease in both cerebral blood flow (CBF) and metab-olism combined to neuroprotective properties.
The noncompetitive N-methyl-D-aspartate antagonistketamine is an intravenously administered anestheticagent possessing a short duration of action, a strongsupporting effect on the cardiovascular system, and amoderate analgesic property. Because of these uniqueand potentially beneficial characteristics, ketamine hasbeen deemed particularly suitable for anesthesia andsedation of trauma patients. In addition, ketamine hasbeen shown to block the excitotoxic effects of gluta-mate in vitro 1 and to reduce neuronal damage in ratsexperiencing cerebral ischemia2,3 or head trauma4 invivo.
Racemic ketamine has been proposed to possess manyof the required characteristics for neuroanesthesiologicuse.5 Regardless of the considerable amount of variableresults presented on its CBF and metabolic effects,6–12
subanesthetic doses of sole racemic ketamine seem toprincipally increase human CBF and glucose metabolicrate (GMR), with only minor effects on cerebral meta-bolic rate of oxygen (CMRO2).13–15 However, pure an-esthesia with racemic ketamine has been associated withincreased whole brain CBF with no changes in either ofthe metabolic components (CMRO2 and GMR) in hu-mans.16 Based on this information, at least the racemicmixture of ketamine would seem unsuitable for neuroan-esthesiologic use.
The S-enantiomer of ketamine, however, seems morepromising. In addition to not effecting cerebral autoreg-ulation when administered during propofol anesthesia inhumans,5 S-ketamine possesses an even stronger neuro-protective property in animals than the racemate.17 Al-though subanesthetic S-ketamine seems to increase ce-rebral GMR in humans,18 a recently published studyreported widespread GMR decreases in rats anesthetizedwith S-ketamine.19 The effects of S-ketamine on CBF orCMRO2 have not been studied.
The purpose of this study was to quantify the CBF andmetabolic effects of subanesthetic and anesthetic S-ket-amine, without other anesthetic agents, in healthy hu-man brain by using positron emission tomography (PET).Because subanesthetic racemic ketamine seems to in-crease CBF with divergent effect on the two metaboliccomponents (increase in GMR combined to minor effect
Additional material related to this article can be found on theANESTHESIOLOGY Web site. Go to http://www.anesthesiology.org, click on Enhancements Index, and then scroll down tofind the appropriate article and link. Supplementary materialcan also be accessed on the Web by clicking on the “Arti-clePlus” link either in the Table of Contents or at the top ofthe Abstract or HTML version of the article.
�
* Investigator, § Modeler, Turku PET Centre, � Statistician, Department of Biosta-tistics, ** Radiochemist, Radiopharmaceutical Chemistry Laboratory, Turku PET Cen-tre, ‡‡ Professor, Turku PET Centre and Department of Pharmacology and ClinicalPharmacology, University of Turku. † Staff Anesthesiologist, # Administrative Med-ical Chief, Department of Anesthesiology and Intensive Care, †† Staff Radiologist,Department of Radiology, Turku University Hospital. ‡ Investigator, Department ofPsychology, Abo Akademy University, Turku, Finland.
Received from the Turku PET Centre, University of Turku, Turku, Finland, andthe Department of Anesthesiology and Intensive Care, Turku University Hospital,Turku, Finland. Submitted for publication November 2, 2004. Accepted forpublication April 25, 2005. Supported by Turku University Hospital EVO-grantNo. 13323, Turku, Finland; The European Academy of Anaesthesiology, Hever-lee, Belgium; the Finnish-Norwegian Medical Foundation, Helsinki, Finland; theResearch Foundation of Orion Corporation, Espoo, Finland; and the ResearchInstitute for Military Medicine, Central Military Hospital, Helsinki, Finland.
Address correspondence to Dr. Langsjo: Turku PET Centre, P.O. Box 52,FIN-20521 Turku, Finland. Address electronic mail to: [email protected] article reprints may be purchased through the Journal Web site,www.anesthesiology.org.
Anesthesiology, V 103, No 2, Aug 2005 258

on CMRO2),13,14 we wanted to assess all of these threevariables within subjects during the awake state andduring S-ketamine anesthesia.
Materials and Methods
Subjects and Study DesignThe study protocol was approved by the Ethical Com-
mittee of the Hospital District of Southwest Finland(Turku, Finland). After giving written informed consent,eight healthy (American Society of Anesthesiologistsphysical status class I), nonsmoking, right-handed malevolunteers aged 20–27 yr with body mass index of24.1 � 1.8 (mean � SD) were recruited in this open,nonrandomized, dose-escalation study. All subjects un-derwent a detailed prestudy examination, including lab-oratory data and a 12-lead electrocardiogram. They con-firmed having no history of mental illness, drug allergies,or drug abuse, and none had ongoing medications. Thesubjects refrained from using alcohol or any medicationfor 48 h before the scans.
15O-labeled water and oxygen ([15O]O2) and 18F-la-beled fluorodeoxyglucose ([18F]FDG) were used as PET
tracers to assess regional CBF (rCBF), regional CMRO2
(rCMRO2), and regional GMR (rGMR), respectively, atbaseline (no drug) and during S-ketamine anesthesia.Additional assessments for rCBF and rCMRO2 were per-formed during subanesthetic S-ketamine before the in-duction of anesthesia. Because of the long half-life of 18F(110 min), the baseline [18F]FDG scan had to be per-formed on a separate day. This was scheduled approxi-mately 3 weeks apart from the other scans to secureproper wound healing for radial artery recannulation.Subjects fasted 6 h before the baseline [18F]FDG scanand overnight before anesthesia. The study design ispresented in figure 1.
Monitoring of the SubjectsThe left radial artery and two large veins in the right
forearm were cannulated for blood sampling and foradministration of 0.9% NaCl (50 ml/h), S-ketamine(25 mg/ml Ketanest-S; Pfizer Inc., New York, NY), 15O-labeled water, and [18F]FDG. After the cannulations, thesubjects were connected to a monitor (S/5TM AnesthesiaMonitor with M-CAiOVX and M-NESTPR plug-in mod-ules; Datex-Ohmeda Division, Instrumentarium Corp.,
Fig. 1. Study design showing the timing and order of the individual positron emission tomography measurements at baseline andduring target-controlled S-ketamine infusion aiming at subanesthetic (150 ng/ml) and anesthetic (1,500–2,000 ng/ml) concentra-tions. The baseline measurement for cerebral glucose metabolic rate was performed approximately 3 weeks apart from the otherassessments (for further details, see Materials and Methods). The mean durations of the subanesthetic and anesthetic levels were 50min and 2 h, respectively. The S-ketamine serum concentration measurements are indicated with Roman numerals (I–IV) andcorresponding arrows.
259EFFECTS OF S-KETAMINE ON CBF AND METABOLISM
Anesthesiology, V 103, No 2, Aug 2005

General Electric Company, Helsinki, Finland) recordingthe electrocardiogram, noninvasive mean blood pres-sure, heart rate, respiratory rate, state of muscle relax-ation (train-of-four), peripheral oxygen saturation, andend-tidal carbon dioxide (ETCO 2). A portable computerrunning the S/5 Collect software (Datex-Ohmeda S/5Collect Version 4.0; Datex-Ohmeda Division, Instrumen-tarium Corp.) was used for recording the individualvalues for vital signs, train-of-four, and ETCO 2 every 30 sand mean blood pressure every 5–10 min throughout thestudy. The arterial blood hematocrit, gas analysis, andacid–base status were determined before each rCMRO2
measurement. Subjects’ ETCO 2 values were maintainedstrictly at baseline level (particularly during rCBF assess-ments), with verbal breathing instructions during sub-anesthetic S-ketamine and with ventilator adjustmentsduring anesthesia.
Administration of S-ketamine and AnestheticConsiderationsNo premedication was given. A Harvard 22 syringe
pump (Harvard Apparatus, South Natick, MA) connectedto a portable computer running Stanpump software20§§was used to administer S-ketamine as a continuous intra-venous target-controlled infusion aiming at pseudo–ste-ady state serum drug concentrations for subanestheticand anesthetic S-ketamine. The kinetic parameters forracemic ketamine21 were used for S-ketamine in thecurrent study because of marginal differences in thekinetics of the ketamine enantiomers.22
The target concentration level for subanesthetic S-ket-amine was set to 150 ng/ml. A stabilization period of18 � 7 min was allowed to pass before the PET scanswere initiated. The subanesthetic S-ketamine infusionlasted approximately 50 min. Anesthesia was inducedwith a zero-order S-ketamine infusion of 0.15 mg ·kg�1 · min�1 after the PET scans at subanesthetic levelhad been completed. During the induction, the subjectswere repeatedly requested to squeeze the investigator’shand twice. Failure to comply with the request wasinterpreted as loss of consciousness. During the induc-tion, the subjects breathed 100% oxygen via facemask.As the subjects became clinically unresponsive, a 0.6- to1-mg/kg intravenous dose of rocuronium (10 mg/ml Es-meron; Oy Organon Ab, Helsinki, Finland) was adminis-tered to produce muscle relaxation, and the subjectswere tracheally intubated and connected to a Servo900C ventilator (Siemens Medical Solutions, Solna, Swe-den). For maintenance of anesthesia, the target concen-tration level of S-ketamine was initially set to 1,500–2,000 ng/ml based on the individual dose needed for lossof consciousness. The targeted concentration was then
adjusted with �250 ng/ml increments according to thesubjects’ clinical signs. Immediately after the induction,the ventilation was set to an oxygen–air mixture (30/70),100 ml · kg�1 · min�1, with respiration frequency at 15breaths/min. Ventilation was then adjusted to maintainthe individual ETCO 2 at baseline level during anesthesia.Muscle relaxation was maintained at one or two twitchesof train-of-four with additional intravenous bolus dosesof rocuronium (5–30 mg). After commencing the pseu-do–steady state S-ketamine anesthesia, a stabilization pe-riod of 33 � 2 min was allowed to pass before the PETscans were initiated. Steady state anesthesia lasted forapproximately 2 h.
After the PET scans during anesthesia had been com-pleted, the S-ketamine infusion was discontinued, andthe subjects were given a 4-mg bolus dose of ondanse-tron (2 mg/ml Zofran; GlaxoSmithKline Oy, Espoo, Fin-land) and a 1- to 2-mg bolus dose of midazolam (1 mg/mlDormicum; Roche Pharmaceuticals, Basel, Switzerland)intravenously. Residual muscle relaxation was reversedwith a neostigmine–glycopyrrolate (Glycostigmin; OyLeiras Finland Ab, Helsinki, Finland) combination, andthe subjects were extubated as they regained conscious-ness. Additional intravenous bolus doses of ondansetronand midazolam were given if necessary to treat emesisand ketamine-induced hallucinations, respectively. Afterthe anesthesia, the subjects were monitored until theirvital signs had been stable for at least an hour. The localroutine postanesthesia discharge criteria were appliedwhen the subjects were allowed to leave the study pre-mises. The next day and approximately 10 months afterthe anesthesia, the subjective S-ketamine–induced sen-sations and experiences were recorded, and a modifiedquestionnaire by Brice et al.23 was completed for deter-mination of possible awareness during anesthesia.
A 5-ml arterial blood sample was collected for deter-mination of serum S-ketamine concentration at the endof the subanesthetic level (sample I), at the momentsubjects lost consciousness (sample II), and after theCMRO2 (sample III) and GMR (sample IV) assessmentsduring anesthesia (fig. 1). Sera of the samples wereimmediately separated and kept frozen at �70°C untilanalyzed with high-performance liquid chromatography(Yhtyneet laboratoriot, Helsinki, Finland).24
PET Assessments15O-labeled water was used to assess rCBF, [15O]O2 to
assess rCMRO2 and [18F]FDG to assess rGMR. Assess-ments for rCBF and rCMRO2 were performed at baselineand during subanesthetic and anesthetic S-ketamine last-ing together approximately 22 min on each level. Assess-ment for rGMR was performed at baseline (approxi-mately 3 weeks apart from the other studies) and duringS-ketamine anesthesia. rGMR scans lasted 60 min each(fig. 1).
§§ STANPUMP program. Available at: http://anesthesia.stanford.edu/pkpd.Accessed July 2, 2005.
260 LANGSJO ET AL.
Anesthesiology, V 103, No 2, Aug 2005

Descriptions of tracer production and administration,image processing, and the PET scanner are given in ourprevious articles.13,14,25–27 Individual magnetic reso-nance images were acquired for anatomical referencewith a 1.5-T scanner (GE Signa Horizon LX CX; GeneralElectric Company, Milwaukee, WI) in a separate session.
Data AnalysisQuantitative Region-of-interest Analysis. Before
the region-of-interest (ROI) analysis, realignment of thePET images and the coregistration of the individual mag-netic resonance images (MRI) to the PET images wereperformed using Statistical Parametric Mapping (SPM)software (version 99; Wellcome Department of Cogni-tive Neurology, University College London, London,England).28
The realignment parameters were first obtained byrealigning the subject’s consecutive summation imagesseparately for each tracer. These parameters were thenused for the realignment of the individual parametric(rCBF) or dynamic ([15O]O2 and [18F]FDG) images. Be-cause the differences in head position between the in-dividual tracer activity acquisitions (15O-labeled water,[15O]O2, and [18F]FDG) obtained during anesthesia wereconsidered minimal, these scans were used as referenceimages in the realignment. The individual [18F]FDGmean summation image was calculated and used for thecoregistration and reslicing of the individual MRIs toachieve matching image planes.
Individual ROIs were drawn to the planes of the coreg-istered MRIs using Imadeus 1.15 (Forima Inc., Turku,Finland) to bilaterally outline the frontal (on 11- to 12-image planes), parietal (5 planes), temporal (5 planes),and occipital (3–4 planes) gray matter; the anterior (5planes) and posterior (2–3 planes) cingulate; the insula(3–4 planes); the thalamus (2–3 planes); the caudate (3planes); the putamen (2–3 planes); and the cerebellum(2–3 planes). The whole brain values were determinedby drawing a single ROI outlining all brain tissue insidethe skull on 3 planes superior to the lateral ventricles.The ROIs were then transferred to the correspondingplanes of the PET images to obtain individual values forrCBF, rCMRO2, and rGMR.
The kinetic modeling for rCBF and rGMR was per-formed similarly to our previous studies.14,25 To improvethe accuracy of CMRO2 modeling, the whole brain cere-bral blood volume (CBV) was first estimated from each[15O]O2 acquisition by using a multilinear model forarterial and tissue (the whole brain ROI) activity. TheseCBV estimates were then used in the modeling forrCMRO2. Otherwise, the modeling for rCMRO2 was per-formed as described in our previous article.26
The oxygen extraction fraction (OEF) was determinedfor each brain region as described in our previous arti-cle.26 For the calculation of the whole brain oxygen-to-
glucose index (OGI), the unit conversion was firstperformed using the molar volume of an ideal gas(22.4 l/mol) to obtain the individual whole brain CMRO2
values in �mol · 100 g�1 · min�1. These values were thendivided by the whole brain GMR.
Statistical Analysis of ROI and Monitoring Data.Quantitative CBF, CMRO2, GMR, OEF, OGI, and physio-logic variables were analyzed with repeated-measuresanalysis of variance having the drug concentration as awithin-factor. The subjects were treated as a randomeffect. Repeated measures analysis of variance was alsoused for models with two within-factors (side: left/right;level: baseline/subanesthetic/anesthetic) to study the dif-ferences in S-ketamine–induced effects between theright and left hemispheres. Because there were no sig-nificant side-by-level interactions, except for rCMRO2 inthe cerebellum, all PET results are presented as meanvalues. Statistical analyses were conducted with SAS(version 8.2; SAS Institute Inc., Cary, NC). A two-sided Pvalue of less than 0.05 was considered statistically signif-icant. To overcome multiplicity, the Tukey-Kramer cor-rection was applied to P values. Data are presented asmean � SD if not otherwise stated.
Voxel-based SPM Analysis. As an additional method,SPM software28 running under MATLAB (MATLAB 6.5;The MathWorks Inc., Natick, MA) was used to analyzethe absolute changes in rCBF, rCMRO2, and rGMR. SPMenables localization of statistically significant regionalchanges without having to define specific ROIs. Thus,changes outside the specified regions of the ROI analysiscould be detected.
The subject’s tissue tracer activity images were firstcomputed into quantitative parametric CBF, CMRO2, andGMR images as described in our previous articles.14,26
The estimated values for the whole brain CBV were usedin the calculations of the parametric images for CMRO2.The SPM preprocessing was performed as described inour previous articles.13,26,25 The images were smoothedusing an isotropic gaussian filter of 12 mm full-width athalf-maximum.
Subtraction analysis with T-contrasts was used to testS-ketamine–induced absolute changes between the con-ditions. The changes were considered significant at P �0.05 (corrected for multiple comparisons). The visualiza-tions (maximum intensity projections) were performedwith T-contrast (height threshold) values of 3 and 8. Thenonsignificant findings were discarded from the visual-izations by adjusting the minimum cluster size (extendthreshold, k).29
The Montreal Neurological Institute (McGill Univer-sity, Montreal, Quebec, Canada) coordinates receivedfrom the statistical analysis were converted to Talairachcoordinates30 with “mni2tal” conversion software (Med-ical Research Council, Cognition and Brain Sciences
261EFFECTS OF S-KETAMINE ON CBF AND METABOLISM
Anesthesiology, V 103, No 2, Aug 2005

Unit, Cambridge, England).�� For the localization, TheMontreal Neurological Institute Space utility## and Ta-lairach Daemon Software*** (University of Texas HealthScience Center at San Antonio, San Antonio, TX)31 wereused.
Results
The subjects remained fully cooperative during sub-anesthetic S-ketamine. Induction with zero-order infu-sion resulted in loss of consciousness (defined by failureto squeeze the investigators hand twice) in approxi-mately 3.4 � 1.1 min. However, two of the subjectsremained clinically awake and followed given breathinginstruction with occasional eye opening, although theydid not respond to requests for hand squeezing. Becauseof these two subjects, clinical unresponsiveness wasreached in 8.2 � 4.1 min. Excessive salivation and somespontaneous motor activity was observed during anes-thesia. Three of the subjects could be released home thesame evening. Five of the subjects, however, had tospend the night at the research unit because of slightnausea and dizziness and were released the next morning.
All subjects experienced many of the typical ketamine-induced hallucinations during the subanesthetic S-ket-amine, including sensations of traveling or floating(seven of eight), altered body-image (three of eight), anddifficulties in the perception of reality and the surround-ings (two of 8, for both). Two subjects reported thatthese sensations had been unpleasant. Squeezing theinvestigator’s hand was most often reported (six ofeight) as the last recollection before the loss of con-sciousness. The two most often reported first recollec-
tions after the anesthesia were the feeling of being sur-rounded by people (four of eight) and nausea (three ofeight). None of the subjects reported any awarenessduring anesthesia. All subjects experienced postanes-thetic emesis. Five subjects considered it the most un-pleasant experience according to the interview on thenext day and 10 months after the anesthesia. Three ofthe subjects reported that they would refuse to be anes-thetized again with S-ketamine. None of the subjectsexperienced any “flashback” sensations during the 10-month follow-up period.
The measured mean serum S-ketamine concentration atthe end of the subanesthetic infusion was 159 � 21 ng/ml(sample I). During the induction of S-ketamine anesthesia,the subjects lost their consciousness at 1084 � 144 ng/ml(sample II). The mean dose of S-ketamine needed for loss ofconsciousness was 1.1 � 0.4 mg/kg. The measured meanserum S-ketamine concentrations after the rCMRO2 (sam-ple III) and rGMR (sample IV) scans during anesthesia were1,931 � 410 and 1,986 � 518 ng/ml, respectively (fig. 1).The total S-ketamine dose was 10.4 � 1.0 mg/kg during thestudy.
The Monitoring ParametersHeart rate was increased from baseline by 22.8% (P �
0.001) during subanesthetic S-ketamine and by 43.5%(P � 0.001) during anesthetic S-ketamine. The meanblood pressure was increased by 16.3% during subanes-thetic S-ketamine and by 27.0% during anesthetic S-ket-amine (P � 0.001 for both). The partial pressure ofarterial blood carbon dioxide was not changed duringthe study, and there were no significant changes inETCO2 values during the CBF assessments. No changeswere detected in peripheral or arterial blood oxygensaturation or hematocrit during the study. S-ketamineanesthesia significantly increased plasma glucose con-centration by 20.1% (P � 0.014; table 1).
ROI-based Analysis of PET DataSubanesthetic S-ketamine. Whole brain CBF was
increased by 13.7% (P � 0.035; table 2 and fig. 2).
�� Brett M: 1999. Available at: http://www.mrc-cbu.cam.ac.uk/Imaging/Com-mon/mnispace.shtml. Accessed July 2, 2005.
## Pakhomov S, Steffener JR. 2001. Available at: http://www.ihb.spb.ru/
˜pet_lab/MSU/MSUMain.html. Accessed July 2, 2005.
*** Lancaster JL, Woldorff MG, Parsons LM, Liotti M, Freitas CS, Rainey L,Kochunov PV, Nickerson D, Mikiten SA, Fox PT. 2000. Available at: http://ric.uthscsa.edu/research/body.html. Accessed July 2, 2005.
Table 1. Summary of Hemodynamic, Respiratory, and Plasma Glucose Values during the Study
No Drug Subanesthetic S-ketamine Anesthetic S-ketamine Overall ANOVA, P Value
Mean arterial blood pressure, mmHg 93.3 � 6.5 108.3 � 5.5‡ 117.9 � 8.5‡§ 0.0002Heart rate, beats/min 56.7 � 7.8 69.7 � 10.8‡ 80.5 � 12.8† 0.0010Hematocrit, % 41.3 � 2.8 41.8 � 2.2 42.4 � 1.8 NSPeripheral oxygen saturation, % 99.0 � 0.4 99.3 � 0.3 98.4 � 0.5 NSArterial oxygen saturation, % 97.5 � 0.5 97.5 � 0.5 98.0 � 0.5 NSEnd-tidal CO2 during CBF scans, % 5.4 � 0.3 5.2 � 0.3 5.4 � 0.3 NSArterial CO2 partial pressure, mmHg 41.0 � 3.0 41.0 � 3.4 43.0 � 3.2 NSPlasma glucose concentration, mm 5.4 � 0.4 No data available 6.5 � 0.8 0.0139
Values are given as group mean � SD.
Statistically significant differences between S-ketamine vs. baseline (* P � 0.05, † P � 0.01, ‡ P � 0.001) and anesthetic vs. subanesthetic S-ketamine (§ P �0.05) are shown.
ANOVA � analysis of variance; CBF � cerebral blood flow; CO2 � carbon dioxide; NS � not significant.
262 LANGSJO ET AL.
Anesthesiology, V 103, No 2, Aug 2005

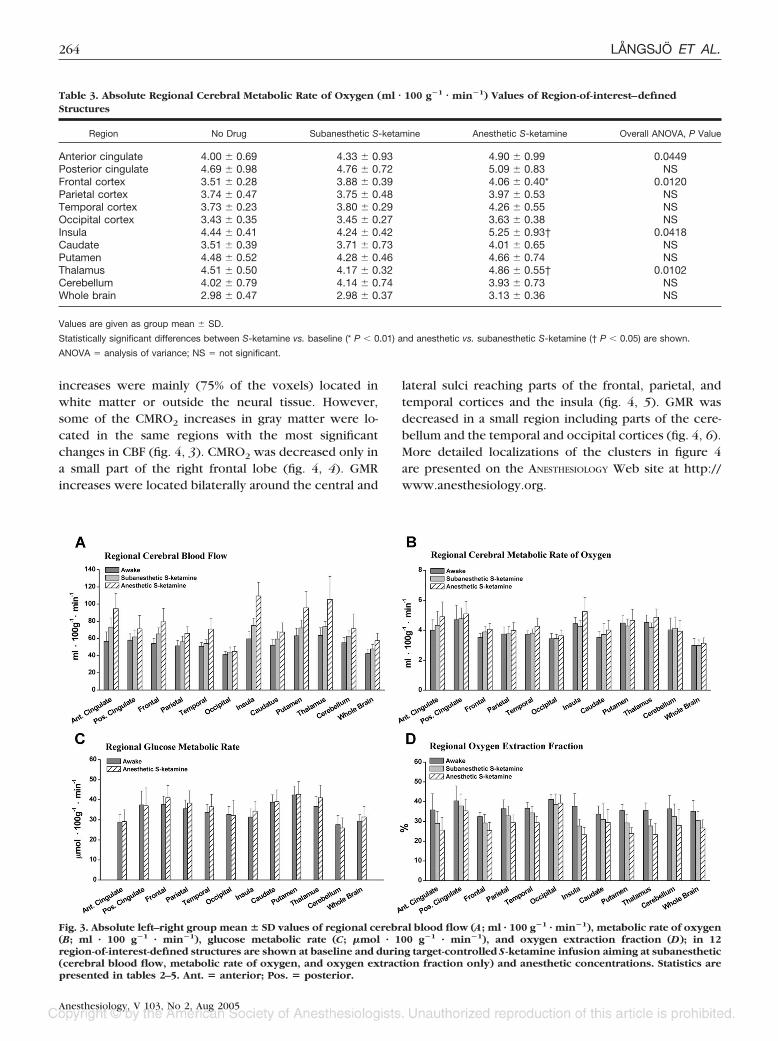
Regionally, CBF increased in the anterior cingulate, in-sula, frontal cortex, thalamus, putamen, and cerebellumby 14.1–31.6% (P � 0.05; table 2 and fig. 3A). Nochanges were detected in CMRO2 (table 3 and fig. 3B).
Anesthetic S-ketamine. Whole brain CBF was in-creased by 36.4% (P � 0.006) from baseline (table 2 andfig. 2). With the exception of the posterior cingulate,occipital cortex, and cerebellum, CBF was increased (by29.8–86.5%; P � 0.05) in all studied regions. In addition,CBF was increased from the subanesthetic values in theinsula, putamen, temporal cortex by 31.5–47.0% (P �0.05; table 2 and fig. 3A). Although CMRO2 was in-creased from baseline only in the frontal cortex by 15.7%(P � 0.007), it was in addition increased from the sub-anesthetic values in the insula by 24.2% and in the
thalamus by 16.6% (P � 0.05 for both; table 3 and fig.3B). GMR was increased from baseline only in the thal-amus by 11.7% (P � 0.010; table 4 and fig. 3C).
Calculated Variables (CBV, OGI, and OEF)Subanesthetic S-ketamine. The estimated mean
whole brain CBV was 3.3% (not significantly differentfrom the baseline value 2.9%). OEF was decreased in theinsula, thalamus, and putamen by 17.1–24.6% (P � 0.05;table 5 and fig. 3D).
Anesthetic S-ketamine. The estimated whole brainCBV was 4.2% during S-ketamine anesthesia. It was sig-nificantly increased from baseline by 51.9% (P � 0.011;fig. 2). The whole brain OEF was decreased from base-line by 23.5% (P � 0.005). With the exception of theposterior cingulate, occipital cortex, and caudate, OEFwas decreased (by 19.2–37.0%; P � 0.01) in all studiedregions (table 5 and fig. 3D). The mean whole brain OGIwas not significantly changed during S-ketamine anesthe-sia from the baseline value of 4.6.
Voxel-based SPM Analysis of PET DataSubanesthetic S-ketamine. The clusters represent-
ing CBF increases reached parts of the frontal cortex andinsula bilaterally, the temporal cortex and limbic lobe onthe right, and the claustrum on the left hemisphere (fig.4, 1). No changes in CMRO2 were detected. More de-tailed localizations of the clusters in figure 4 are pre-sented on the ANESTHESIOLOGY Web site at http://www.anesthesiology.org.
Anesthetic S-ketamine. Cerebral blood flow was in-creased in a global manner. The clusters of the mostsignificant (at a T threshold value of 8) CBF increaseswere located bilaterally around the central and lateralsulci reaching parts of the frontal, temporal, and parietalcortices and the insula and claustrum (fig. 4, 2). CMRO2
Fig. 2. The changes from baseline (%) in the whole brain valuesof glucose metabolic rate (GMR; anesthetic only), cerebral met-abolic rate of oxygen (CMRO2), cerebral blood flow (CBF),oxygen extraction fraction (OEF), estimate for cerebral bloodvolume (CBV), and mean blood pressure induced by target-controlled S-ketamine infusion aiming at subanesthetic(150 ng/ml) and anesthetic (1,500–2,000 ng/ml) concentrationsare shown. Significant changes: * P < 0.05, ** P < 0.01, *** P <0.001.
Table 2. Absolute Regional Cerebral Blood Flow (ml � 100 g�1 � min�1) Values of Region-of-interest–defined Structures
Region No Drug Subanesthetic S-ketamine Anesthetic S-ketamine Overall ANOVA, P Value
Anterior cingulate 56.68 � 10.96 73.17 � 10.54* 94.69 � 17.78† 0.0008Posterior cingulate 57.96 � 7.41 61.85 � 7.80 71.10 � 15.73 NSFrontal cortex 54.07 � 5.97 65.28 � 7.04* 79.38 � 15.54† 0.0022Parietal cortex 51.28 � 6.32 56.09 � 6.44 65.82 � 7.72* 0.0151Temporal cortex 50.84 � 4.54 54.16 � 4.42 70.91 � 12.52*§ 0.0225Occipital cortex 41.36 � 3.69 44.13 � 5.88 44.99 � 5.53 NSInsula 59.59 � 8.84 75.19 � 8.23‡ 109.42 � 15.81‡� 0.0002Caudate 52.18 � 6.45 59.28 � 8.49 67.38 � 10.77* 0.0276Putamen 63.11 � 8.74 72.18 � 9.25* 95.64 � 19.19†� 0.0075Thalamus 63.57 � 8.88 73.74 � 5.89† 105.43 � 26.57* 0.0039Cerebellum 55.03 � 6.26 62.57 � 6.24† 71.24 � 17.33 0.0125Whole brain 42.35 � 5.26 47.86 � 5.21* 57.42 � 8.62† 0.0032
Values are given as group mean � SD.
Statistically significant differences between S-ketamine vs. baseline (* P � 0.05, † P � 0.01, ‡ P � 0.001) and anesthetic vs. subanesthetic S-ketamine (§ P �0.05, � P � 0.01) are shown.
ANOVA � analysis of variance; NS � not significant.
263EFFECTS OF S-KETAMINE ON CBF AND METABOLISM
Anesthesiology, V 103, No 2, Aug 2005
increases were mainly (75% of the voxels) located inwhite matter or outside the neural tissue. However,some of the CMRO2 increases in gray matter were lo-cated in the same regions with the most significantchanges in CBF (fig. 4, 3). CMRO2 was decreased only ina small part of the right frontal lobe (fig. 4, 4). GMRincreases were located bilaterally around the central and
lateral sulci reaching parts of the frontal, parietal, andtemporal cortices and the insula (fig. 4, 5). GMR wasdecreased in a small region including parts of the cere-bellum and the temporal and occipital cortices (fig. 4, 6).More detailed localizations of the clusters in figure 4are presented on the ANESTHESIOLOGY Web site at http://www.anesthesiology.org.
Fig. 3. Absolute left–right group mean � SD values of regional cerebral blood flow (A; ml · 100 g�1 · min�1), metabolic rate of oxygen(B; ml · 100 g�1 · min�1), glucose metabolic rate (C; �mol · 100 g�1 · min�1), and oxygen extraction fraction (D); in 12region-of-interest-defined structures are shown at baseline and during target-controlled S-ketamine infusion aiming at subanesthetic(cerebral blood flow, metabolic rate of oxygen, and oxygen extraction fraction only) and anesthetic concentrations. Statistics arepresented in tables 2–5. Ant. � anterior; Pos. � posterior.
Table 3. Absolute Regional Cerebral Metabolic Rate of Oxygen (ml � 100 g�1 � min�1) Values of Region-of-interest–definedStructures
Region No Drug Subanesthetic S-ketamine Anesthetic S-ketamine Overall ANOVA, P Value
Anterior cingulate 4.00 � 0.69 4.33 � 0.93 4.90 � 0.99 0.0449Posterior cingulate 4.69 � 0.98 4.76 � 0.72 5.09 � 0.83 NSFrontal cortex 3.51 � 0.28 3.88 � 0.39 4.06 � 0.40* 0.0120Parietal cortex 3.74 � 0.47 3.75 � 0.48 3.97 � 0.53 NSTemporal cortex 3.73 � 0.23 3.80 � 0.29 4.26 � 0.55 NSOccipital cortex 3.43 � 0.35 3.45 � 0.27 3.63 � 0.38 NSInsula 4.44 � 0.41 4.24 � 0.42 5.25 � 0.93† 0.0418Caudate 3.51 � 0.39 3.71 � 0.73 4.01 � 0.65 NSPutamen 4.48 � 0.52 4.28 � 0.46 4.66 � 0.74 NSThalamus 4.51 � 0.50 4.17 � 0.32 4.86 � 0.55† 0.0102Cerebellum 4.02 � 0.79 4.14 � 0.74 3.93 � 0.73 NSWhole brain 2.98 � 0.47 2.98 � 0.37 3.13 � 0.36 NS
Values are given as group mean � SD.
Statistically significant differences between S-ketamine vs. baseline (* P � 0.01) and anesthetic vs. subanesthetic S-ketamine († P � 0.05) are shown.
ANOVA � analysis of variance; NS � not significant.
264 LANGSJO ET AL.
Anesthesiology, V 103, No 2, Aug 2005

Discussion
To be suitable for neurosurgical patients, an anestheticagent should reduce neuronal activity and result in par-allel and uniform decreases in cerebral metabolism andblood flow. An ideal anesthetic would also offer fastrecovery, unspoiled reactivity to carbon dioxide andblood pressure, intact CBF–metabolism coupling, andeffective neuroprotection without increasing intracra-nial pressure (or CBV).5,32 In addition to its neuropro-tective properties,17,33 S-ketamine is an anesthetic with arapid onset and short duration of action. Furthermore, itdoes not seem to affect cerebral autoregulation whenadministered during propofol anesthesia.5
In the current study, the whole brain CBF was signif-icantly increased during S-ketamine anesthesia, whereasthere were no corresponding changes in CMRO2 orGMR. This resulted in a decrease in the whole brain OEFbut no change in OGI. Also subanesthetic S-ketamineincreased the whole brain CBF but did not effect
CMRO2. Although the estimated whole brain CBV wasnot changed during subanesthetic S-ketamine, it wassignificantly increased during anesthesia. The meanblood pressure was increased in a concentration-depen-dent manner.
The effects of subanesthetic S-ketamine on humanCBF, CMRO2, and CBV seem to be quite similar to thoseof racemic ketamine observed in our previous PETstudy.13 There seems to be only one previous study onthe CBF and metabolic effects of sole anesthetic ket-amine in humans.16 By using the Kety-Schmidt methodfor the whole brain CBF and appropriate arteriovenouscontent difference values for metabolic substances, theracemate (intravenous bolus of 2 mg/kg followed byanother 1-mg/kg bolus after 5 min) was shown to in-crease CBF, with no significant changes in CMRO2 orGMR. In addition, decreased cerebral vascular resistancewas observed. Although Takeshita et al. 16 could notpresent any regional data at the time, their findings on
Table 4. Absolute Regional Cerebral Glucose Metabolic Rate (�mol � 100 g�1 � min�1) Values of Region-of-interest–definedStructures
Region No Drug Anesthetic S-ketamine Overall ANOVA, P Value
Anterior cingulate 28.88 � 3.68 29.10 � 5.86 NSPosterior cingulate 37.41 � 6.95 37.03 � 8.85 NSFrontal cortex 37.77 � 4.01 41.04 � 6.08 NSParietal cortex 35.50 � 4.37 38.30 � 6.15 NSTemporal cortex 33.74 � 3.97 36.50 � 6.21 NSOccipital cortex 32.74 � 3.94 32.22 � 7.60 NSInsula 31.38 � 4.04 34.36 � 4.93 NSCaudate 38.76 � 3.76 39.07 � 5.78 NSPutamen 42.40 � 4.43 42.68 � 6.49 NSThalamus 36.73 � 4.96 41.01 � 6.27 0.0100Cerebellum 27.63 � 4.59 25.92 � 5.04 NSWhole brain 29.35 � 3.25 31.38 � 5.34 NS
Values are given as group mean � SD.
Statistically significant differences between S-ketamine anesthesia vs. baseline are shown.
ANOVA � analysis of variance; NS � not significant.
Table 5. Absolute Regional Cerebral Oxygen Extraction Fraction (%) Values of Region-of-interest–defined Structures
Region No Drug Subanesthetic S-ketamine Anesthetic S-ketamine Overall ANOVA, P Value
Anterior cingulate 35.80 � 8.19 29.06 � 6.01 25.58 � 6.43† 0.0064Posterior cingulate 40.39 � 7.59 37.81 � 6.03 35.33 � 5.95 NSFrontal cortex 32.44 � 2.11 29.20 � 4.27 25.32 � 4.13† 0.0021Parietal cortex 36.44 � 4.47 32.85 � 4.93 29.34 � 3.94† 0.0024Temporal cortex 36.64 � 2.95 34.31 � 3.13 29.35 � 3.19†§ 0.0033Occipital cortex 41.20 � 2.57 38.61 � 5.22 39.28 � 4.17 NSInsula 37.71 � 6.34 27.64 � 3.54* 23.28 � 3.62†# 0.0016Caudate 33.67 � 4.18 31.03 � 7.89 29.39 � 6.71 NSPutamen 35.50 � 3.07 29.23 � 4.40* 23.88 � 2.93‡§ 0.0008Thalamus 35.51 � 3.84 27.70 � 3.23† 23.36 � 5.74† 0.0002Cerebellum 36.40 � 6.70 32.44 � 6.35 27.99 � 8.17† 0.0011Whole brain 35.11 � 5.47 30.55 � 4.51 26.69 � 4.09† 0.0085
Values are given as group mean � SD.
Statistically significant differences between S-ketamine vs. baseline (* P � 0.05, † P � 0.01, ‡ P � 0.001) and anesthetic vs. subanesthetic S-ketamine (§ P �0.05) are shown.
ANOVA � analysis of variance; NS � not significant.
265EFFECTS OF S-KETAMINE ON CBF AND METABOLISM
Anesthesiology, V 103, No 2, Aug 2005

the global effects of racemic ketamine are now sup-ported by our results on the effects of S-ketamine anes-thesia assessed with more sophisticated methodology.
The oxygen-to-glucose index is defined as a relation ofoxygen and glucose consumption. In normal conditions,approximately six oxygen molecules are consumed foreach glucose molecule, yielding a stoichiometric OGIvalue close to 6.34,35 If glucose is consumed more thanoxygen, OGI is decreased, suggesting anaerobic glycol-ysis. Because OGI was not changed from baseline duringS-ketamine anesthesia, it is unlikely that anaerobic gly-colysis occurred.
Positron emission tomography and functional MRI areboth widely used for detecting neuronal activation. InPET, activation is represented as regionally increasedCBF. Functional MRI, however, detects changes in oxy-gen availability as blood oxygen level–dependent sig-nal is increased in the activated region.36 Nevertheless,neither of these measurements reveals the whole phe-nomenon underneath. In the activated brain region, theincreases in CBF and GMR transiently exceed the in-crease in CMRO2, resulting in an increase in oxygenavailability (supply exceeds the demand).36,37 The wholephenomenon can, however, be detected with PET if allof these three variables are assessed during one studysession.35 In PET, increased oxygen availability is re-flected as a decrease in OEF.
In the current study, OEF was decreased in nearly allregions during S-ketamine anesthesia. However, the ma-jority of these decreases probably do not represent S-ketamine–induced neuronal activation because GMRwas increased only in the thalamus.36,37 Similarly, themajority of observed increases in CBF most likely do notindicate neuronal activation. Therefore, GMR assessmentis of vital importance when studying the effects of S-ketamine on neuronal activation.
In addition to S-ketamine–induced effects on thewhole brain, some regional changes were also observed.The only significant anesthesia-induced GMR increase inthe ROI analysis was located in the thalamus. Neuronalactivation in this brain region would, in fact, seem logi-cal because anesthetic doses of racemic ketamine havebeen associated with increased electrophysiologic activ-ity in the human thalamus.38 Although S-ketamine anes-thesia increased CMRO2 from baseline only in the frontalcortex, CMRO2 was in addition increased from the sub-anesthetic values in the thalamus and insula. Further-more, even though the ROI analysis revealed no GMRchanges in the frontal cortex or insula during S-ketamineanesthesia, the clusters representing the anesthesia-in-duced GMR increases in the voxel-analysis partlyreached these brain regions as well. Thus, the metaboliccomponents were increased in the corresponding brainregions.
Although CBF was increased in excess to both meta-bolic components (i.e., CMRO2 and GMR), it is interest-ing that some of the most significant anesthesia-inducedincreases in all these three variables were located aroundthe central and lateral sulci in the voxel analysis. Similarlocalization of these changes could imply that in thisparticular small cortical region, CBF was, in fact, in-creased to serve the needs for increased metabolism. Ingeneral, this fronto-parieto-temporal region, includingthe primary motor and sensory cortices and the superiortemporal gyrus, is involved in proprioception and motorperformance.39 The activation of the superior temporalgyrus has particularly been associated with the recogni-tion of seen body movements and speech-associatedfacial expressions.40–42
The voxel-based analysis revealed increased CBF,CMRO2, and GMR in the insula during S-ketamine anes-thesia. Electrical stimulation of this brain region has been
Fig. 4. The results of the voxel-based (Sta-tistical Parametric Mapping [SPM]) analy-sis. Regions of statistically significant(P < 0.05, corrected for multiple compar-isons) absolute changes from baseline incerebral blood flow (CBF), metabolic rateof oxygen (CMRO2), and glucose meta-bolic rate (GMR) induced by target-con-trolled S-ketamine infusion aiming atsubanesthetic (150 ng/ml) and anesthetic(1,500–2,000 ng/ml) concentrations areshown at statistical criteria levels (heightthreshold, T) of 3 and 8. The nonsignifi-cant clusters (with P values > 0.05) werediscarded from the visualizations by ad-justing the minimum cluster size (extendthreshold, k). The circled numbers (1–6)correspond to the tables of stereotaxiclocalizations presented on the ANESTHESI-OLOGY Web site at http://www.anesthesi-ology.org. For details, see Materials andMethods, Data Analysis, Voxel-based SPMAnalysis.
266 LANGSJO ET AL.
Anesthesiology, V 103, No 2, Aug 2005

associated with changes in blood pressure and heartrate,43,44 heart rhythm,45 respiration, gastric motility,salivation, and norepinephrine secretion.46 In addition,the insula has been suggested to participate in painprocessing.47,48 It is therefore possible that many of theketamine-induced secondary effects (analgesia, hemody-namic effects, salivation, emesis, and others) are linkedto this brain area. Although ketamine-induced stimula-tion on the cardiovascular system has been proposed tobe unrelated to baroreceptor desensitization,49,50 it is ofinterest that the brain regions most often associated withbaroreceptor control are the insula and thalamus.51,52
It has recently been demonstrated that both isoflurane-and halothane-induced unconsciousness are associatedwith decreased GMR in the thalamus and disruptedthalamocortical connection to the primary and supple-mentary motor association cortices.53 Therefore, it issomewhat surprising that S-ketamine was found to in-crease GMR in both the thalamus and the cortical re-gions associated with motor function. The possiblechanges in thalamocortical connectivity during ket-amine-induced unconsciousness remain to be studied.
Subanesthetic S-ketamine induced more localized,smaller increases in CBF, with no changes in CMRO2 orCBV. Because of the long half-life (110 min) of the18F-isotope, we could not perform a GMR measurementduring subanesthetic S-ketamine. However, the effectsof subanesthetic S-ketamine on human cerebral GMRhave been studied previously using a zero-order S-ket-amine infusion and PET.18 In that study, widespreadGMR increases (19.6–27.4%) were associated with a379-ng/ml plasma concentration of S-ketamine. Whenthese GMR results are compared with the CBF increasesinduced by subanesthetic S-ketamine in the currentstudy, the changes are of similar magnitude. Still, cautionis needed when these results are compared because theinfusion schemes were different and S-ketamine concen-tration was 138% higher in the study by Vollenweider etal. 18 Because S-ketamine has a propensity to increaseCBF in a concentration-dependent manner, it would betempting to speculate that CBF increases would proba-bly exceed the increases in GMR if the same drug con-centrations were used.
The S-enantiomer of ketamine has been estimated topossess approximately twice the anesthetic potency ofthe racemate in humans.54,55 Thus, Vollenweider et al. 18
were able to perform their GMR study under a surpris-ingly high and yet subanesthetic concentration of S-ketamine. The target concentration level (150 ng/ml) forthe subanesthetic S-ketamine in the current study waschosen based on our previous studies where the targetconcentration level of 300 ng/ml racemic ketamine in-duced significant changes in CBF and GMR while stillmaintaining full cooperation of the subjects.13,14
Estimation of anesthetic depth is difficult with ket-amine. Vital signs are mostly useless because increased
blood pressure or heart rate may well be suggestive ofeither insufficient anesthetic depth or too high a con-centration of ketamine. Therefore, awareness during an-esthesia was one of the primary concerns in the currentstudy. The minimum anesthetic serum concentration ofS-ketamine in healthy adults has been demonstrated tobe approximately 1,200 ng/ml.54 Slow recovery of thesubjects was somewhat surprising and suggests that aslightly excessive target concentration level was used.Importantly, none of the subjects reported any aware-ness during anesthesia.
In the kinetic modeling for CMRO2, CBV is normallyassumed to be constant (approximately 3%). This is a fairassumption under normal awake conditions and duringsubanesthetic doses of racemic ketamine, which havebeen demonstrated to induce only negligible effects onregional CBV.13 Decreased cerebral vascular resistancehas, however, been observed in humans anesthetizedwith racemic ketamine.16 Therefore, anesthetic doses ofketamine may have an effect on cerebral vascular tone.Brain imaging with PET and 15O-labeled carbon monox-ide is a well-established method for measuring cerebralblood volume. However, it was not possible to includethis assessment into the current study without exposingthe subjects to unacceptably large doses of radiation. Asan alternative, the whole brain estimate for CBV wasobtained as a kinetic modeling parameter from eachdynamic [15O]O2 activity acquisition image using thewhole brain ROIs. Although not as accurate as a separate15O-carbon monoxide PET measurement, this estimationenabled more precise kinetic modeling for rCMRO2 asblood volume was no longer assumed to be constant.
To meet the demanding requirements for neuroanes-thesiologic use, S-ketamine should have induced paralleland uniform decreases in CBF, CMRO2, and GMR. How-ever, anesthetic S-ketamine greatly increased CBF andblood volume with only minor changes in metabolism.Regardless of its suggested neuroprotective properties,pure S-ketamine anesthesia hardly offers the optimalconditions for a neurosurgical patient.
The authors thank Steven L. Shafer, M.D. (Professor, Department of Anesthe-sia, Stanford University, Stanford, California), for the free use of his STANPUMPcomputer program.
References
1. Himmelseher S, Pfenninger E, Georgieff M: The effects of ketamine-isomerson neuronal injury and regeneration in rat hippocampal neurons. Anesth Analg1996; 83:505–12
2. Hoffman WE, Pelligrino D, Werner C, Kochs E, Albrecht RF, Schulte amEsch J: Ketamine decreases plasma catecholamines and improves outcome fromincomplete cerebral ischemia in rats. ANESTHESIOLOGY 1992; 76:755–62
3. Church J, Zeman S, Lodge D: The neuroprotective action of ketamine andMK-801 after transient cerebral ischemia in rats. ANESTHESIOLOGY 1988; 69:702–9
4. Shapira Y, Lam AM, Eng CC, Laohaprasit V, Michel M: Therapeutic timewindow and dose response of the beneficial effects of ketamine in experimentalhead injury. Stroke 1994; 25:1637–43
5. Engelhard K, Werner C, Mollenberg O, Kochs E: S(�)-ketamine/propofolmaintain dynamic cerebrovascular autoregulation in humans. Can J Anaesth2001; 48:1034–9
267EFFECTS OF S-KETAMINE ON CBF AND METABOLISM
Anesthesiology, V 103, No 2, Aug 2005

6. Herrschaft H, Schmidt H, Gleim F, Albus G: The response of human cerebralblood flow to anesthesia with thiopentone, methohexitone, propanidid, ket-amine, and etomidate. Adv Neurosurg 1975; 3:120–33
7. Sakai K, Cho S, Fukusaki M, Shibata O, Sumikawa K: The effects of propofolwith and without ketamine on human cerebral blood flow velocity and CO2
response. Anesth Analg 2000; 90:377–828. Strebel S, Kaufmann M, Maitre L, Schaefer HG: Effects of ketamine on
cerebral blood flow velocity in humans: Influence of pretreatment with midazo-lam or esmolol. Anaesthesia 1995; 50:223–8
9. Mayberg TS, Lam AM, Matta BF, Domino KB, Winn HR: Ketamine does notincrease cerebral blood flow velocity or intracranial pressure during isoflurane/nitrous oxide anesthesia in patients undergoing craniotomy. Anesth Analg 1995;81:84–9
10. Crosby G, Crane AM, Sokoloff L: Local changes in cerebral glucose utili-zation during ketamine anesthesia. ANESTHESIOLOGY 1982; 56:437–43
11. Hawkins R, Hass WK, Ransohoff J: Measurement of regional brain glucoseutilization in vivo using [2-14C] glucose. Stroke 1979; 10:690–703
12. Nelson SR, Howard RB, Cross RS, Samson F: Ketamine-induced changes inregional glucose utilization in the rat brain. ANESTHESIOLOGY 1980; 52:330–4
13. Langsjo JW, Kaisti KK, Aalto S, Hinkka S, Aantaa R, Oikonen V, Sipila H,Kurki T, Silvanto M, Scheinin H: Effects of subanesthetic doses of ketamine onregional cerebral blood flow, oxygen consumption, and blood volume in hu-mans. ANESTHESIOLOGY 2003; 99:614–23
14. Langsjo JW, Salmi E, Kaisti KK, Aalto S, Hinkka S, Aantaa R, Oikonen V,Viljanen T, Kurki T, Silvanto M, Scheinin H: Effects of subanesthetic ketamine onregional cerebral glucose metabolism in humans. ANESTHESIOLOGY 2004; 100:1065–71
15. Vollenweider FX, Leenders KL, Scharfetter C, Antonini A, Maguire P,Missimer J, Angst J: Metabolic hyperfrontality and psychopathology in the ket-amine model of psychosis using positron emission tomography (PET) and[18F]fluorodeoxyglucose (FDG). Eur Neuropsychopharmacol 1997; 7:9–24
16. Takeshita H, Okuda Y, Sari A: The effects of ketamine on cerebral circu-lation and metabolism in man. ANESTHESIOLOGY 1972; 36:69–75
17. Proescholdt M, Heimann A, Kempski O: Neuroprotection of S(�) ket-amine isomer in global forebrain ischemia. Brain Res 2001; 904:245–51
18. Vollenweider FX, Leenders KL, Oye I, Hell D, Angst J: Differential psycho-pathology and patterns of cerebral glucose utilisation produced by (S)- and(R)-ketamine in healthy volunteers using positron emission tomography (PET).Eur Neuropsychopharmacol 1997; 7:25–38
19. Freo U, Ori C: Effects of anesthesia and recovery from ketamine racemateand enantiomers on regional cerebral glucose metabolism in rats. ANESTHESIOLOGY
2004; 100:1172–820. Shafer SL, Siegel LC, Cooke JE, Scott JC: Testing computer-controlled
infusion pumps by simulation. ANESTHESIOLOGY 1988; 68:261–621. Domino EF, Domino SE, Smith RE, Domino LE, Goulet JR, Domino KE,
Zsigmond EK: Ketamine kinetics in unmedicated and diazepam-premedicatedsubjects. Clin Pharmacol Ther 1984; 36:645–53
22. Persson J, Hasselstrom J, Maurset A, Oye I, Svensson JO, Almqvist O,Scheinin H, Gustafsson LL, Almqvist O: Pharmacokinetics and non-analgesiceffects of S- and R-ketamines in healthy volunteers with normal and reducedmetabolic capacity. Eur J Clin Pharmacol 2002; 57:869–75
23. Brice DD, Hetherington RR, Utting JE: A simple study of awareness anddreaming during anaesthesia. Br J Anaesth 1970; 42:535–42
24. Gross AS, Nicolay A, Eschalier A: Simultaneous analysis of ketamine andbupivacaine in plasma by high-performance liquid chromatography. J Chro-matogr B 1999; 728:107–15
25. Kaisti KK, Metsahonkala L, Teras M, Oikonen V, Aalto S, Jaaskelainen S,Hinkka S, Scheinin H: Effects of surgical levels of propofol and sevofluraneanesthesia on cerebral blood flow in healthy subjects studied with positronemission tomography. ANESTHESIOLOGY 2002; 96:1358–70
26. Kaisti KK, Langsjo JW, Aalto S, Oikonen V, Sipila H, Teras M, Hinkka S,Metsahonkala L, Scheinin H: Effects of sevoflurane, propofol, and adjunct nitrousoxide on regional cerebral blood flow, oxygen consumption, and blood volumein humans. ANESTHESIOLOGY 2003; 99:603–13
27. Kaisti KK, Makitalo J, Sipila HT, Teras MI, Scheinin H: Ventilator add-on fordelivering PET tracer gases. J Nucl Med Technol 2004; 32:79–82
28. Friston KJ, Holmes AP, Worsley KJ, Poline J-P, Frith CD, Frackowiak RS:Statistical parametric maps in functional imaging: A general linear approach.Hum Brain Mapp 1995; 2:189–210
29. Friston KJ, Holmes A, Poline JB, Price CJ, Frith CD: Detecting activationsin PET and fMRI: levels of inference and power. Neuroimage 1996; 4:223–35
30. Talairach J, Tournoux P: Co-planar Stereotaxic Atlas of the Human Brain,1st edition. Stuttgart, Germany, Georg Thieme Verlag, 1988
31. Lancaster JL, Woldorff MG, Parsons LM, Liotti M, Freitas CS, Rainey L,Kochunov PV, Nickerson D, Mikiten SA, Fox PT: Automated Talairach atlas labelsfor functional brain mapping. Hum Brain Mapp 2000; 10:120–31
32. Reinstrup P, Uski TK: Inhalational anaesthetics in neurosurgery. Curr OpinAnaesthesiol 1994; 7:421–5
33. Reeker W, Werner C, Mollenberg O, Mielke L, Kochs E: High-dose S(�)-ketamine improves neurological outcome following incomplete cerebral isch-emia in rats. Can J Anaesth 2000; 47:572–8
34. Shulman RG, Hyder F, Rothman DL: Cerebral energetics and the glycogenshunt: Neurochemical basis of functional imaging. Proc Natl Acad Sci U S A 2001;98:6417–22
35. Fox PT, Raichle ME, Mintun MA, Dence C: Nonoxidative glucose con-sumption during focal physiologic neural activity. Science 1988; 241:462–4
36. Raichle ME: Cognitive neuroscience: Bold insights. Nature 2001; 412:128–30
37. Gusnard DA, Raichle ME: Searching for a baseline: Functional imaging andthe resting human brain. Nat Rev Neurosci 2001; 2:685–94
38. Ferrer-Allado T, Brechner VL, Dymond A, Cozen H, Crandall P: Ketamine-induced electroconvulsive phenomena in the human limbic and thalamic re-gions. ANESTHESIOLOGY 1973; 38:333–44
39. Matsumoto E, Misaki M, Miyauchi S: Neural mechanisms of spatial stimu-lus-response compatibility: The effect of crossed-hand position. Exp Brain Res2004; 158:9–17
40. Vaina LM, Gross CG: Perceptual deficits in patients with impaired recog-nition of biological motion after temporal lobe lesions. Proc Natl Acad Sci U S A2004; 101:16947–51
41. Campbell R, MacSweeney M, Surguladze S, Calvert G, McGuire P, SucklingJ, Brammer MJ, David AS: Cortical substrates for the perception of face actions:An fMRI study of the specificity of activation for seen speech and for meaninglesslower-face acts (gurning). Brain Res Cogn Brain Res 2001; 12:233–43
42. MacSweeney M, Woll B, Campbell R, McGuire PK, David AS, Williams SC,Suckling J, Calvert GA, Brammer MJ: Neural systems underlying British SignLanguage and audio-visual English processing in native users. Brain 2002; 125:1583–93
43. Oppenheimer SM, Cechetto DF: Cardiac chronotropic organization of therat insular cortex. Brain Res 1990; 533:66–72
44. Oppenheimer SM, Gelb A, Girvin JP, Hachinski VC: Cardiovascular effectsof human insular cortex stimulation. Neurology 1992; 42:1727–32
45. Oppenheimer SM, Wilson JX, Guiraudon C, Cechetto DF: Insular cortexstimulation produces lethal cardiac arrhythmias: A mechanism of sudden death?Brain Res 1991; 550:115–21
46. Cheung RT, Hachinski V: The insula and cerebrogenic sudden death. ArchNeurol 2000; 57:1685–8
47. Coghill RC, Sang CN, Maisog JM, Iadarola MJ: Pain intensity processingwithin the human brain: A bilateral, distributed mechanism. J Neurophysiol 1999;82:1934–43
48. Derbyshire SW, Jones AK, Gyulai F, Clark S, Townsend D, Firestone LL:Pain processing during three levels of noxious stimulation produces differentialpatterns of central activity. Pain 1997; 73:431–45
49. Slogoff S, Allen GW: The role of baroreceptors in the cardiovascularresponse to ketamine. Anesth Analg 1974; 53:704–7
50. McGrath JC, MacKenzie JE, Millar RA: Effects of ketamine on centralsympathetic discharge and the baroreceptor reflex during mechanical ventila-tion. Br J Anaesth 1975; 47:1141–7
51. Zhang ZH, Rashba S, Oppenheimer SM: Insular cortex lesions alter barore-ceptor sensitivity in the urethane-anesthetized rat. Brain Res 1998; 813:73–81
52. Zhang ZH, Oppenheimer SM: Baroreceptive and somatosensory conver-gent thalamic neurons project to the posterior insular cortex in the rat. Brain Res2000; 861:241–56
53. White NS, Alkire MT: Impaired thalamocortical connectivity in humansduring general-anesthetic-induced unconsciousness. Neuroimage 2003;19:402–11
54. White PF, Schuttler J, Shafer A, Stanski DR, Horai Y, Trevor AJ: Compar-ative pharmacology of the ketamine isomers: Studies in volunteers. Br J Anaesth1985; 57:197–203
55. White PF, Ham J, Way WL, Trevor AJ: Pharmacology of ketamine isomersin surgical patients. ANESTHESIOLOGY 1980; 52:231–9
268 LANGSJO ET AL.
Anesthesiology, V 103, No 2, Aug 2005
Copyright © 2022 FDOKUMEN