NDC TechTown 2018 - man7.org
28
NDC TechTown 2018 System Call Tracing with strace Michael Kerrisk, man7.org c 2018 [email protected] 29 August 2018, Kongsberg, Norway
-
Upload
khangminh22 -
Category
Documents
-
view
4 -
download
0
Transcript of NDC TechTown 2018 - man7.org
NDC TechTown 2018
System Call Tracing with straceMichael Kerrisk, man7.org c© 2018
29 August 2018, Kongsberg, Norway
Outline
1 Getting started 32 Tracing child processes 103 Filtering strace output 144 System call tampering 205 Further strace options 24
Outline
1 Getting started 32 Tracing child processes 103 Filtering strace output 144 System call tampering 205 Further strace options 24
strace(1)
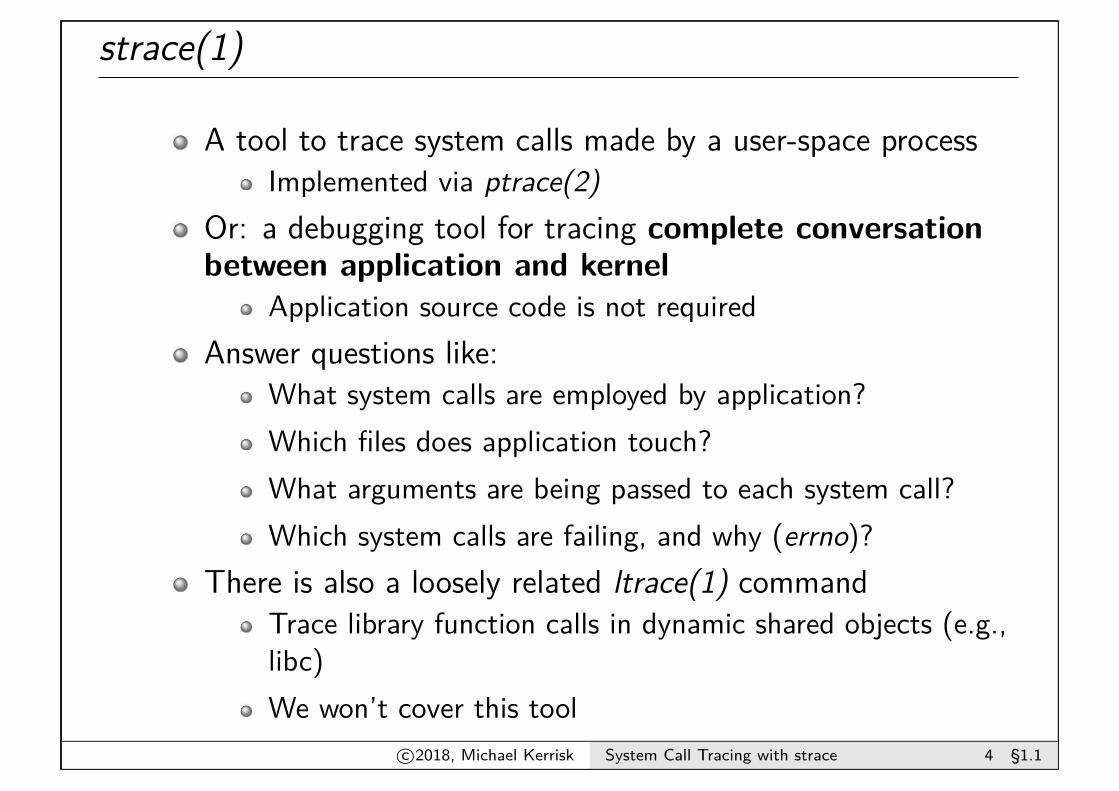
A tool to trace system calls made by a user-space processImplemented via ptrace(2)
Or: a debugging tool for tracing complete conversationbetween application and kernel
Application source code is not requiredAnswer questions like:
What system calls are employed by application?Which files does application touch?What arguments are being passed to each system call?Which system calls are failing, and why (errno)?
There is also a loosely related ltrace(1) commandTrace library function calls in dynamic shared objects (e.g.,libc)We won’t cover this tool
c©2018, Michael Kerrisk System Call Tracing with strace 4 §1.1
strace(1)
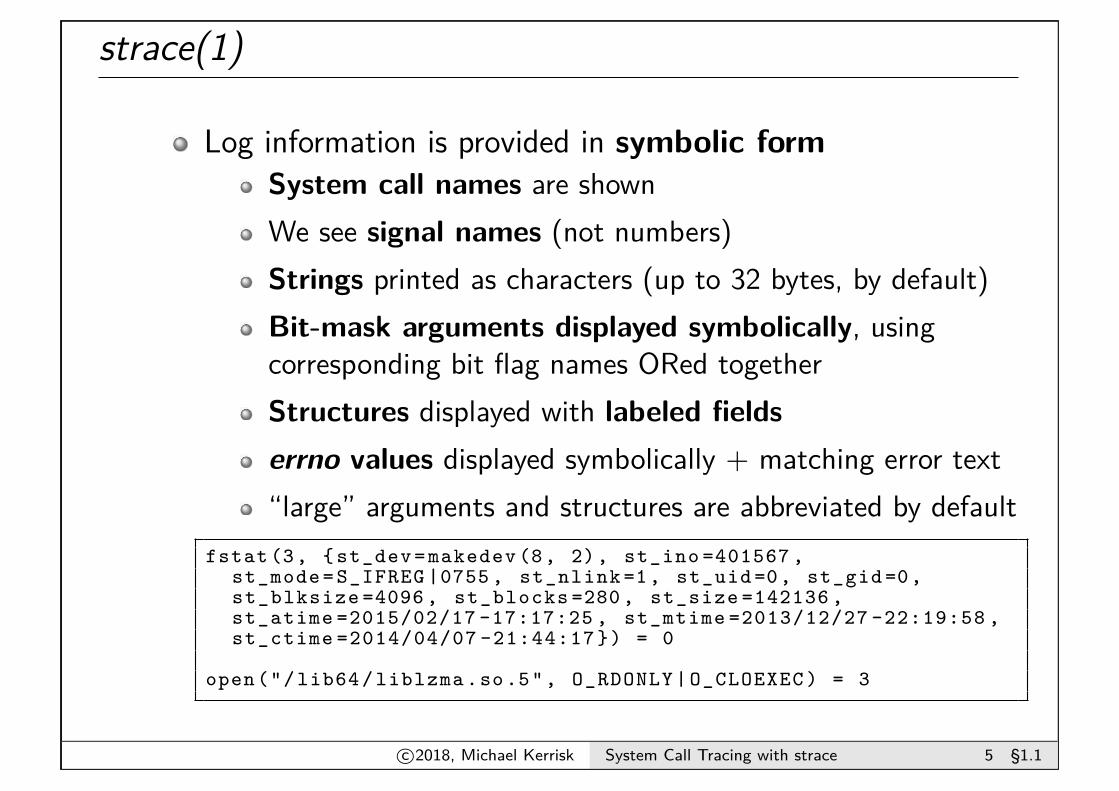
Log information is provided in symbolic formSystem call names are shownWe see signal names (not numbers)Strings printed as characters (up to 32 bytes, by default)Bit-mask arguments displayed symbolically, usingcorresponding bit flag names ORed togetherStructures displayed with labeled fieldserrno values displayed symbolically + matching error text“large” arguments and structures are abbreviated by default
fstat (3, { st_dev = makedev (8, 2), st_ino =401567 ,st_mode = S_IFREG |0755 , st_nlink =1, st_uid =0, st_gid =0,st_blksize =4096 , st_blocks =280 , st_size =142136 ,st_atime =2015/02/17 -17:17:25 , st_mtime =2013/12/27 -22:19:58 ,st_ctime =2014/04/07 -21:44:17 }) = 0
open("/ lib64 / liblzma .so .5", O_RDONLY | O_CLOEXEC ) = 3
c©2018, Michael Kerrisk System Call Tracing with strace 5 §1.1
Simple usage: tracing a command at the command line
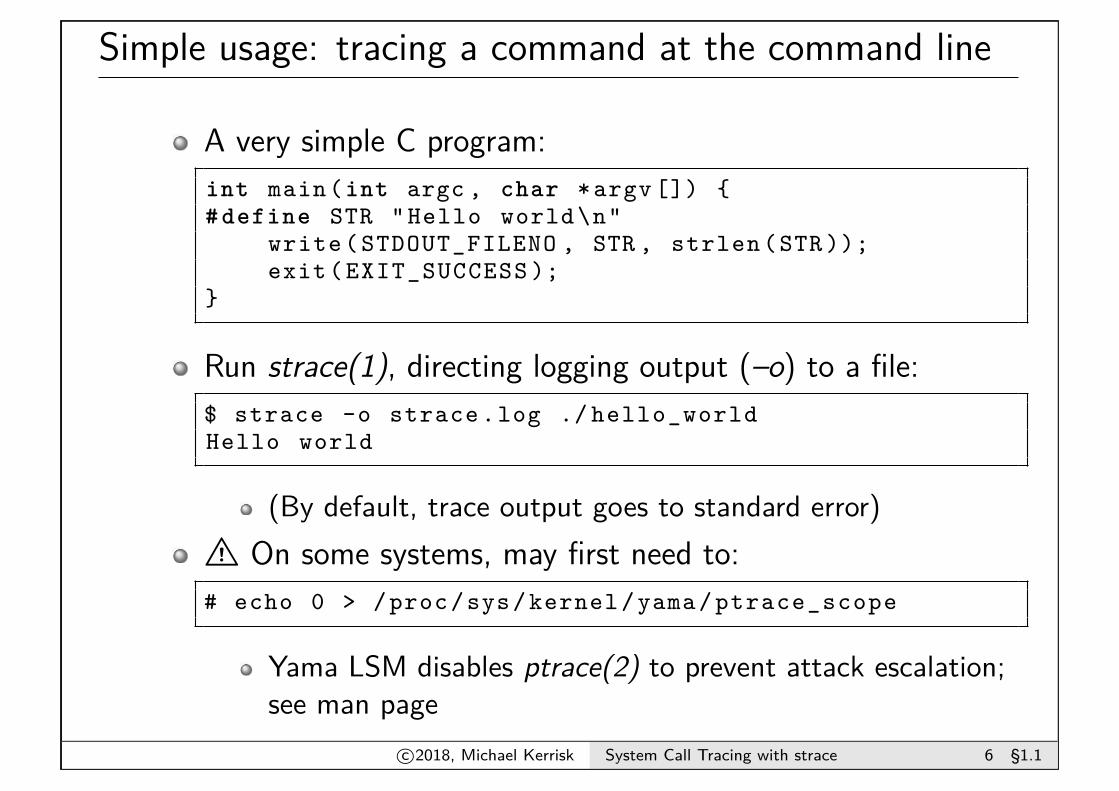
A very simple C program:int main(int argc , char *argv []) {# define STR "Hello world\n"
write( STDOUT_FILENO , STR , strlen (STR ));exit( EXIT_SUCCESS );
}
Run strace(1), directing logging output (–o) to a file:$ strace -o strace .log ./ hello_worldHello world
(By default, trace output goes to standard error)B On some systems, may first need to:# echo 0 > /proc/sys/ kernel /yama/ ptrace_scope
Yama LSM disables ptrace(2) to prevent attack escalation;see man page
c©2018, Michael Kerrisk System Call Tracing with strace 6 §1.1
Simple usage: tracing a command at the command line
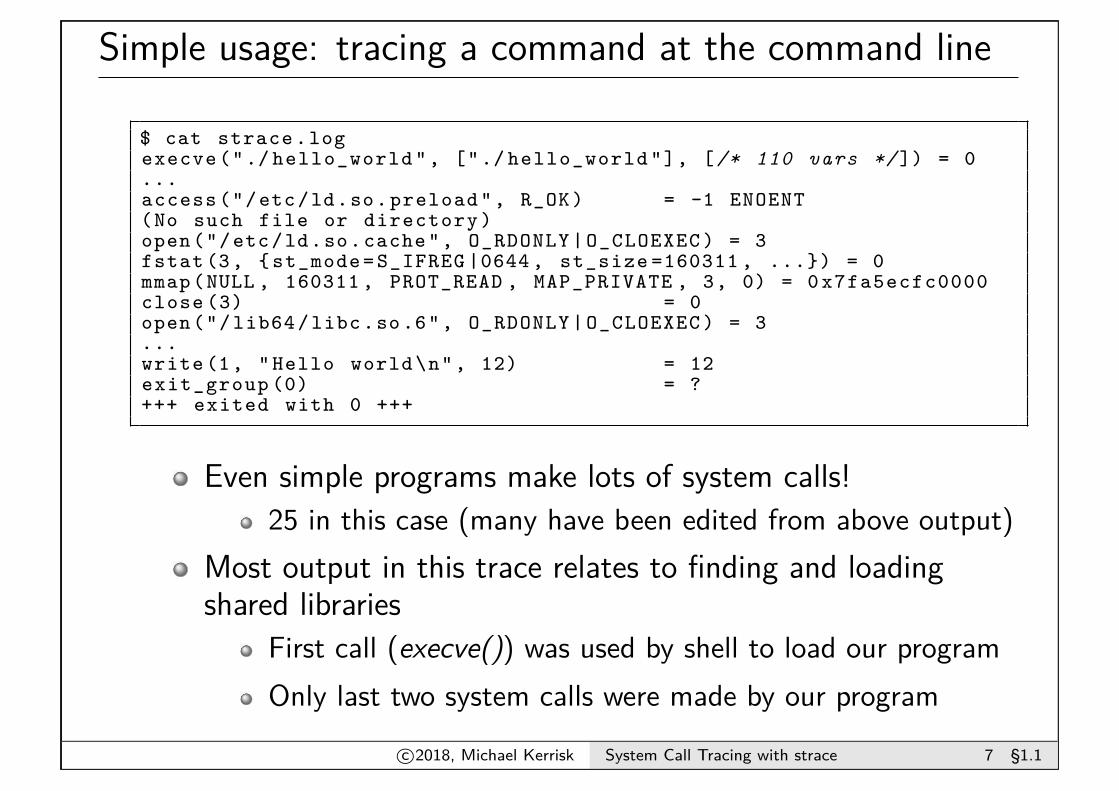
$ cat strace .logexecve ("./ hello_world ", ["./ hello_world "], [/* 110 vars */ ]) = 0...access ("/etc/ld.so. preload ", R_OK) = -1 ENOENT(No such file or directory )open("/etc/ld.so. cache ", O_RDONLY | O_CLOEXEC ) = 3fstat (3, { st_mode = S_IFREG |0644 , st_size =160311 , ...}) = 0mmap(NULL , 160311 , PROT_READ , MAP_PRIVATE , 3, 0) = 0 x7fa5ecfc0000close (3) = 0open("/ lib64 /libc.so .6", O_RDONLY | O_CLOEXEC ) = 3...write (1, " Hello world \n", 12) = 12exit_group (0) = ?+++ exited with 0 +++
Even simple programs make lots of system calls!25 in this case (many have been edited from above output)
Most output in this trace relates to finding and loadingshared libraries
First call (execve()) was used by shell to load our programOnly last two system calls were made by our program
c©2018, Michael Kerrisk System Call Tracing with strace 7 §1.1
Simple usage: tracing a command at the command line
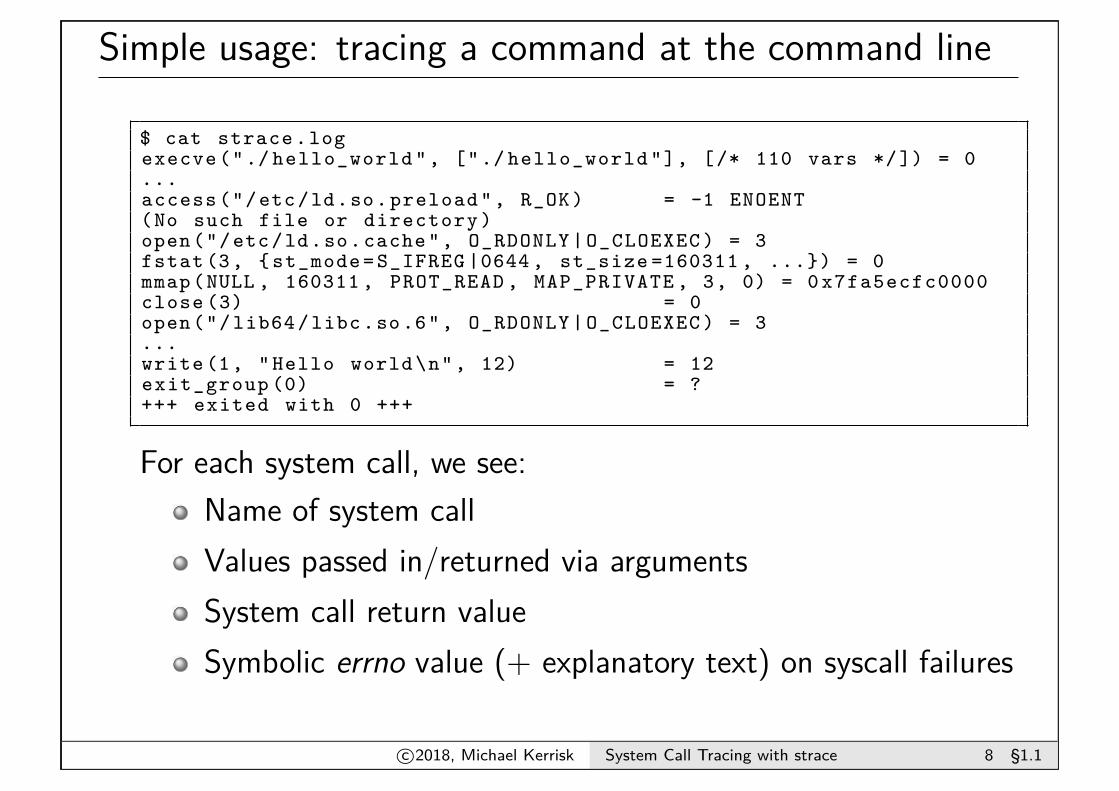
$ cat strace .logexecve ("./ hello_world ", ["./ hello_world "], [/* 110 vars */ ]) = 0...access ("/etc/ld.so. preload ", R_OK) = -1 ENOENT(No such file or directory )open("/etc/ld.so. cache ", O_RDONLY | O_CLOEXEC ) = 3fstat (3, { st_mode = S_IFREG |0644 , st_size =160311 , ...}) = 0mmap(NULL , 160311 , PROT_READ , MAP_PRIVATE , 3, 0) = 0 x7fa5ecfc0000close (3) = 0open("/ lib64 /libc.so .6", O_RDONLY | O_CLOEXEC ) = 3...write (1, " Hello world \n", 12) = 12exit_group (0) = ?+++ exited with 0 +++
For each system call, we see:Name of system callValues passed in/returned via argumentsSystem call return valueSymbolic errno value (+ explanatory text) on syscall failures
c©2018, Michael Kerrisk System Call Tracing with strace 8 §1.1
A gotcha...
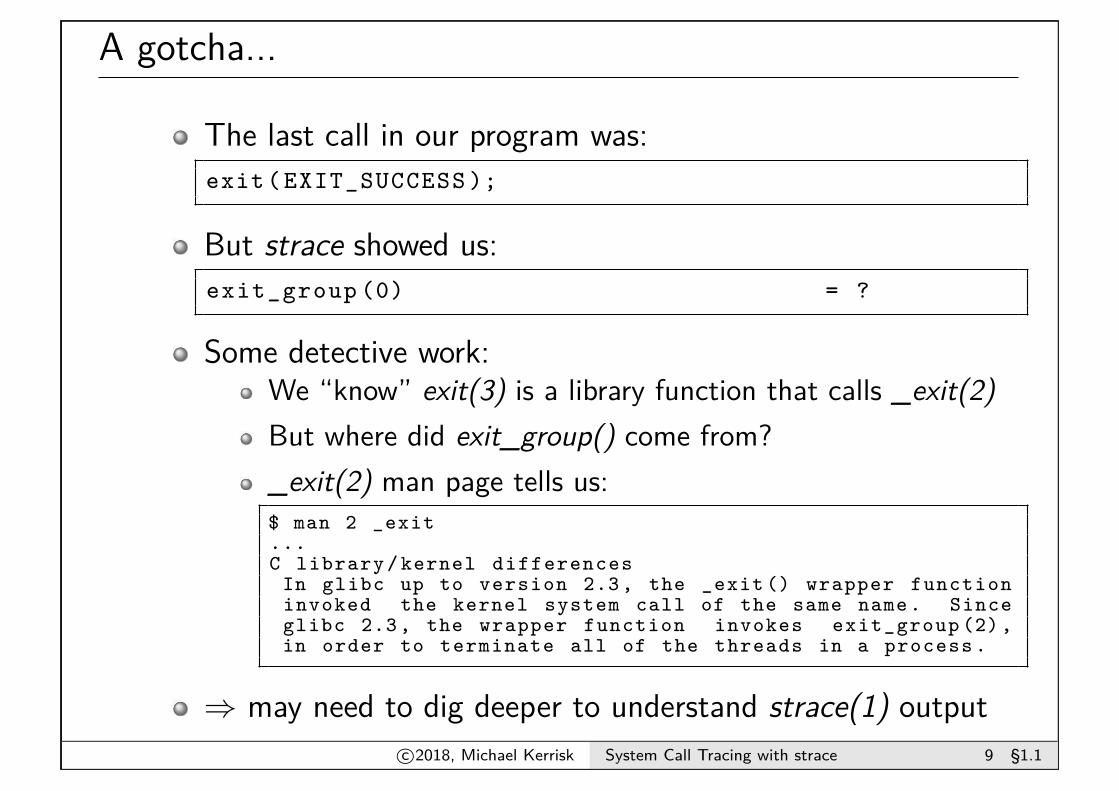
The last call in our program was:exit( EXIT_SUCCESS );
But strace showed us:exit_group (0) = ?
Some detective work:We “know” exit(3) is a library function that calls _exit(2)But where did exit_group() come from?_exit(2) man page tells us:$ man 2 _exit...C library / kernel differences
In glibc up to version 2.3 , the _exit () wrapper functioninvoked the kernel system call of the same name. Sinceglibc 2.3 , the wrapper function invokes exit_group (2) ,in order to terminate all of the threads in a process .
⇒ may need to dig deeper to understand strace(1) outputc©2018, Michael Kerrisk System Call Tracing with strace 9 §1.1
Outline
1 Getting started 32 Tracing child processes 103 Filtering strace output 144 System call tampering 205 Further strace options 24
Tracing child processes
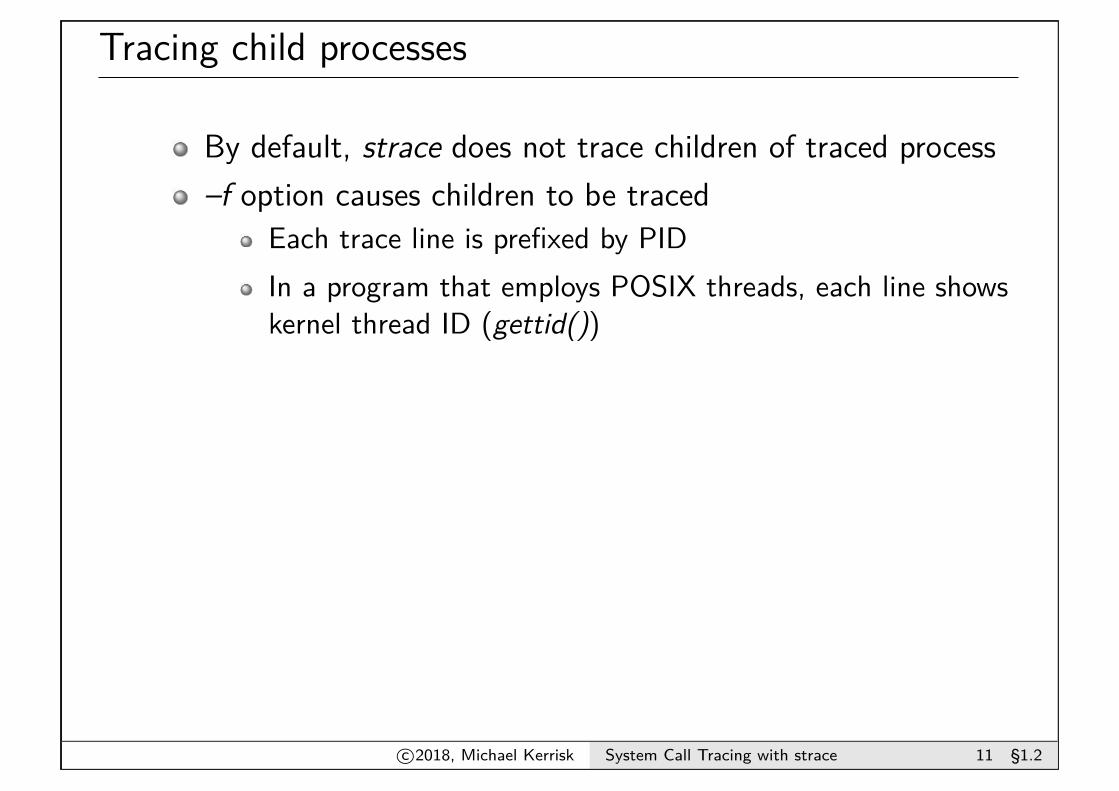
By default, strace does not trace children of traced process–f option causes children to be traced
Each trace line is prefixed by PIDIn a program that employs POSIX threads, each line showskernel thread ID (gettid())
c©2018, Michael Kerrisk System Call Tracing with strace 11 §1.2
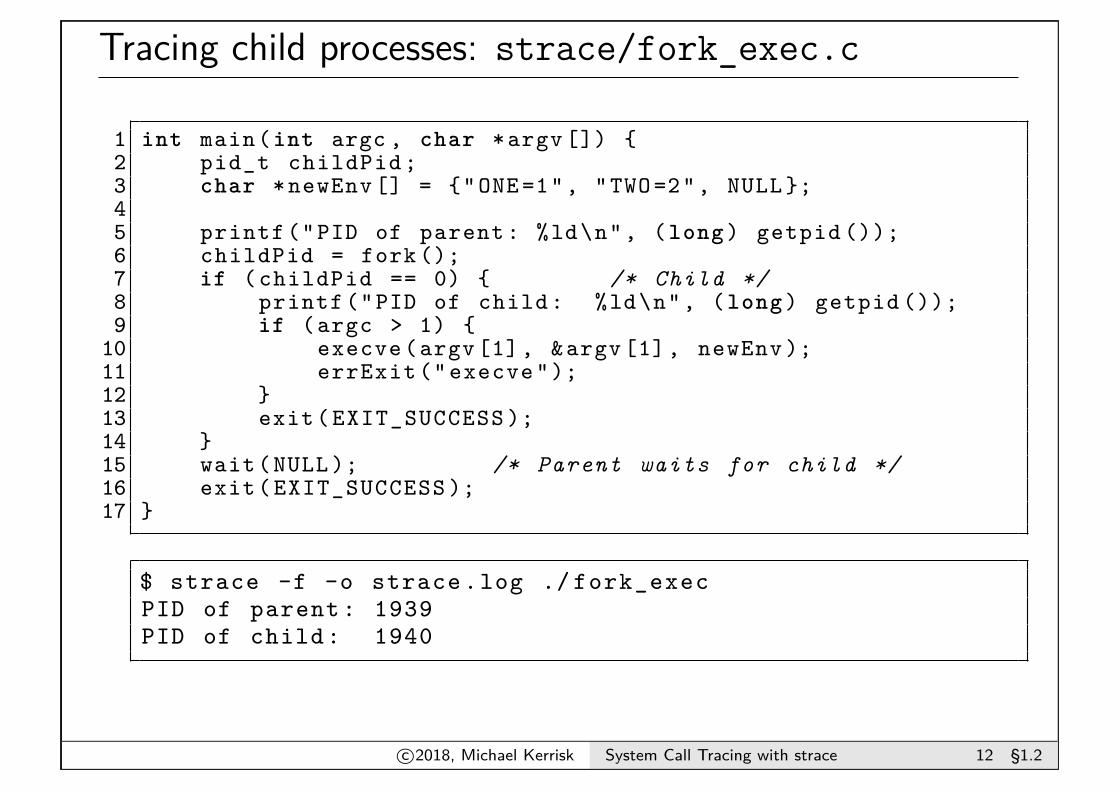
Tracing child processes: strace/fork_exec.c
1 int main(int argc , char *argv []) {2 pid_t childPid ;3 char * newEnv [] = {"ONE =1", "TWO =2", NULL };45 printf ("PID of parent : %ld\n", (long) getpid ());6 childPid = fork ();7 if ( childPid == 0) { /* Child */8 printf ("PID of child: %ld\n", (long) getpid ());9 if (argc > 1) {
10 execve (argv [1], &argv [1], newEnv );11 errExit (" execve ");12 }13 exit( EXIT_SUCCESS );14 }15 wait(NULL ); /* Parent waits for child */16 exit( EXIT_SUCCESS );17 }
$ strace -f -o strace .log ./ fork_execPID of parent : 1939PID of child: 1940
c©2018, Michael Kerrisk System Call Tracing with strace 12 §1.2
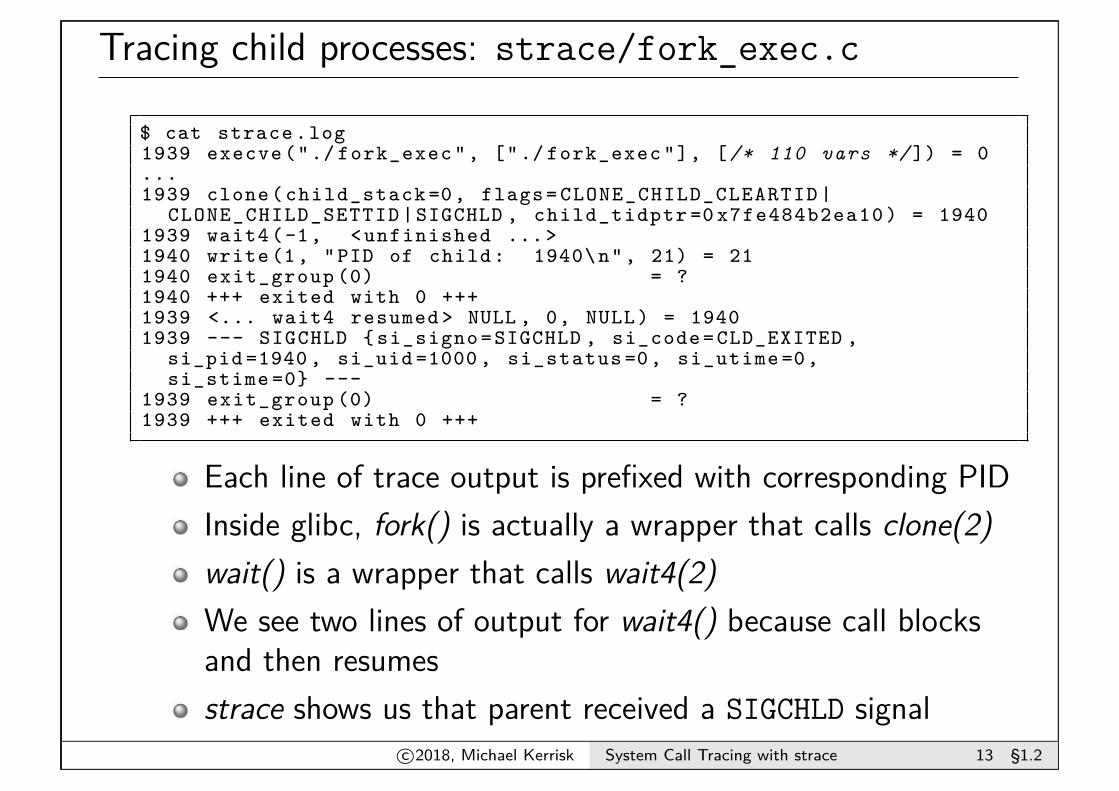
Tracing child processes: strace/fork_exec.c
$ cat strace .log1939 execve ("./ fork_exec ", ["./ fork_exec "], [/* 110 vars */ ]) = 0...1939 clone ( child_stack =0, flags = CLONE_CHILD_CLEARTID |
CLONE_CHILD_SETTID |SIGCHLD , child_tidptr =0 x7fe484b2ea10 ) = 19401939 wait4 (-1, <unfinished ... >1940 write (1, "PID of child : 1940\ n", 21) = 211940 exit_group (0) = ?1940 +++ exited with 0 +++1939 <... wait4 resumed > NULL , 0, NULL) = 19401939 --- SIGCHLD { si_signo =SIGCHLD , si_code = CLD_EXITED ,
si_pid =1940 , si_uid =1000 , si_status =0, si_utime =0,si_stime =0} ---
1939 exit_group (0) = ?1939 +++ exited with 0 +++
Each line of trace output is prefixed with corresponding PIDInside glibc, fork() is actually a wrapper that calls clone(2)wait() is a wrapper that calls wait4(2)We see two lines of output for wait4() because call blocksand then resumesstrace shows us that parent received a SIGCHLD signal
c©2018, Michael Kerrisk System Call Tracing with strace 13 §1.2
Outline
1 Getting started 32 Tracing child processes 103 Filtering strace output 144 System call tampering 205 Further strace options 24
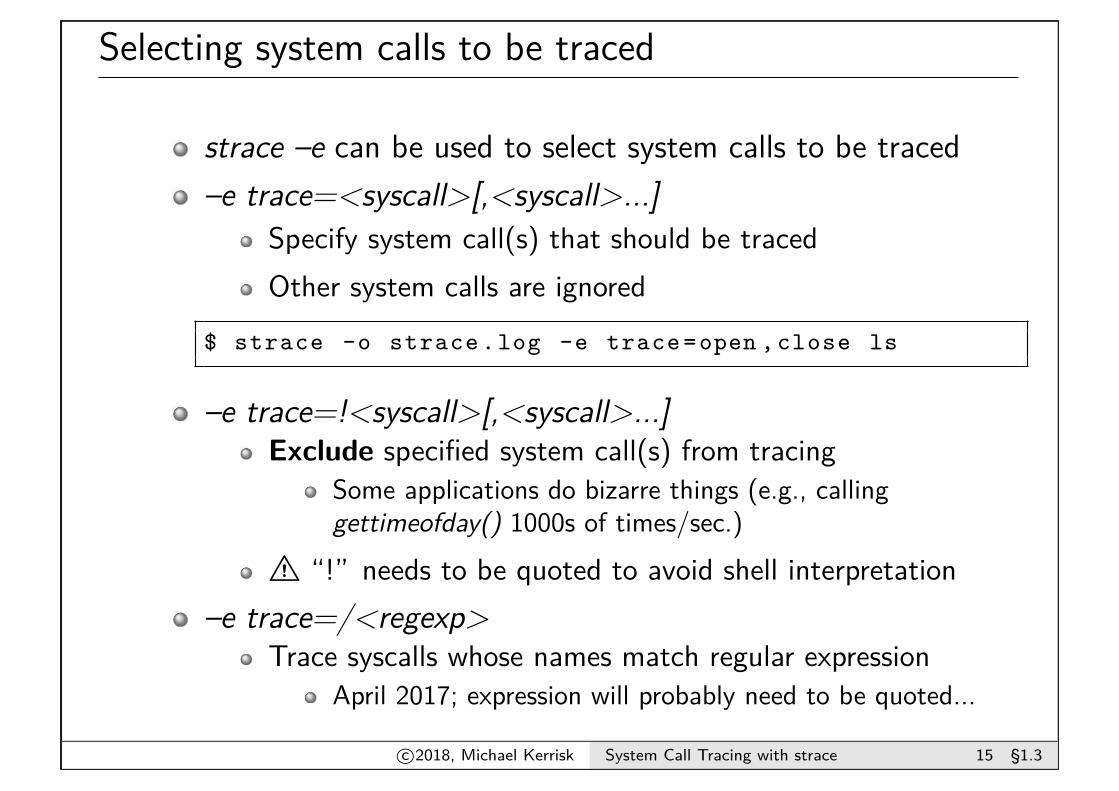
Selecting system calls to be traced
strace –e can be used to select system calls to be traced–e trace=<syscall>[,<syscall>...]
Specify system call(s) that should be tracedOther system calls are ignored
$ strace -o strace .log -e trace=open ,close ls
–e trace=!<syscall>[,<syscall>...]Exclude specified system call(s) from tracing
Some applications do bizarre things (e.g., callinggettimeofday() 1000s of times/sec.)
B “!” needs to be quoted to avoid shell interpretation–e trace=/<regexp>
Trace syscalls whose names match regular expressionApril 2017; expression will probably need to be quoted...
c©2018, Michael Kerrisk System Call Tracing with strace 15 §1.3
Selecting system calls by category
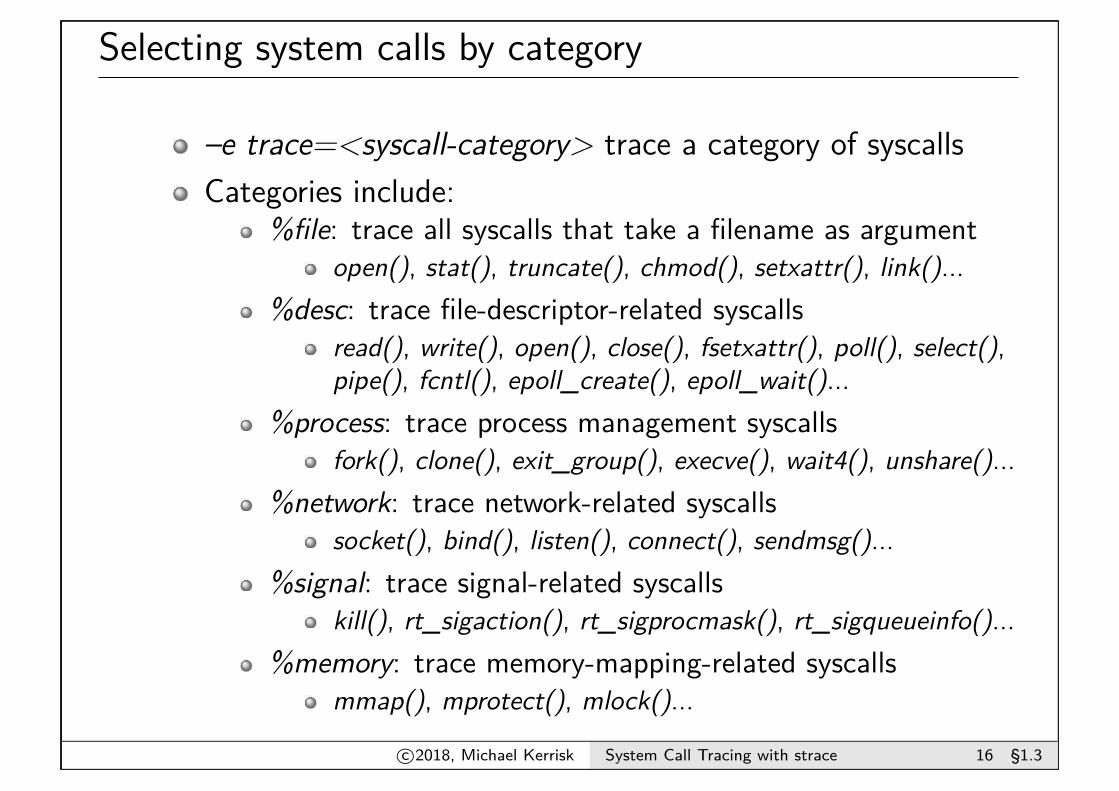
–e trace=<syscall-category> trace a category of syscallsCategories include:
%file: trace all syscalls that take a filename as argumentopen(), stat(), truncate(), chmod(), setxattr(), link()...
%desc: trace file-descriptor-related syscallsread(), write(), open(), close(), fsetxattr(), poll(), select(),pipe(), fcntl(), epoll_create(), epoll_wait()...
%process: trace process management syscallsfork(), clone(), exit_group(), execve(), wait4(), unshare()...
%network: trace network-related syscallssocket(), bind(), listen(), connect(), sendmsg()...
%signal: trace signal-related syscallskill(), rt_sigaction(), rt_sigprocmask(), rt_sigqueueinfo()...
%memory: trace memory-mapping-related syscallsmmap(), mprotect(), mlock()...
c©2018, Michael Kerrisk System Call Tracing with strace 16 §1.3
Filtering signals
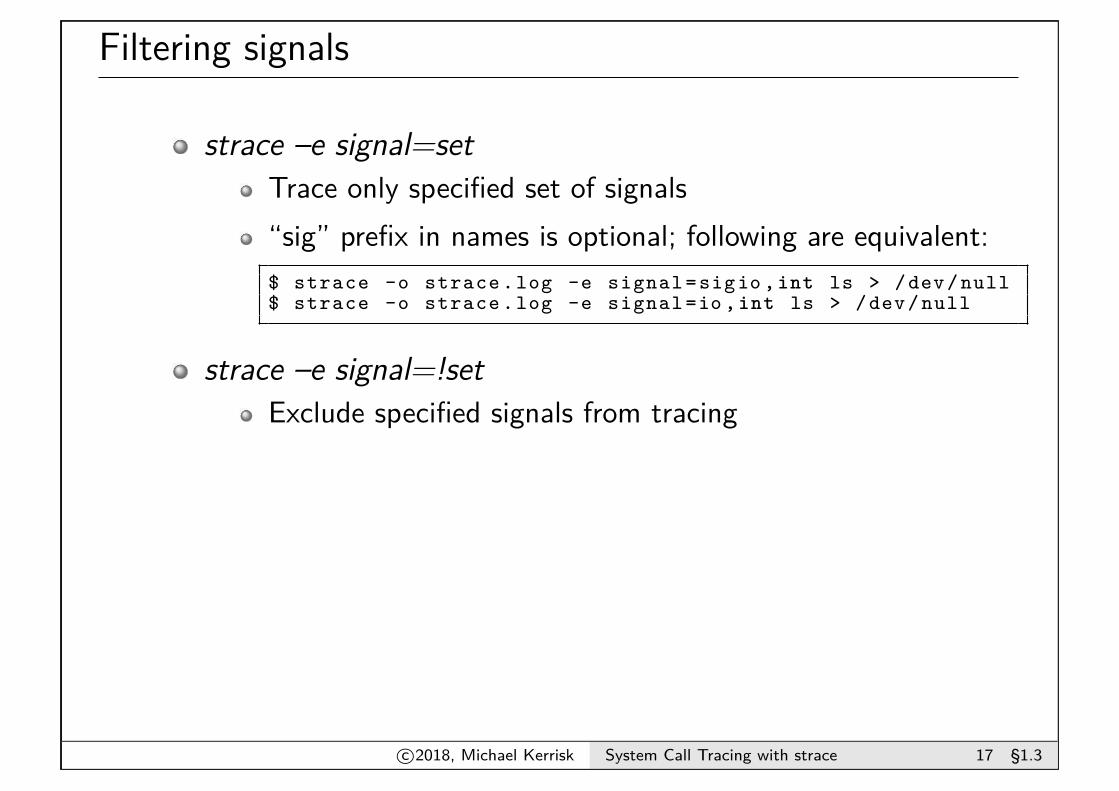
strace –e signal=setTrace only specified set of signals“sig” prefix in names is optional; following are equivalent:$ strace -o strace .log -e signal =sigio ,int ls > /dev/null$ strace -o strace .log -e signal =io ,int ls > /dev/null
strace –e signal=!setExclude specified signals from tracing
c©2018, Michael Kerrisk System Call Tracing with strace 17 §1.3
Filtering by pathname
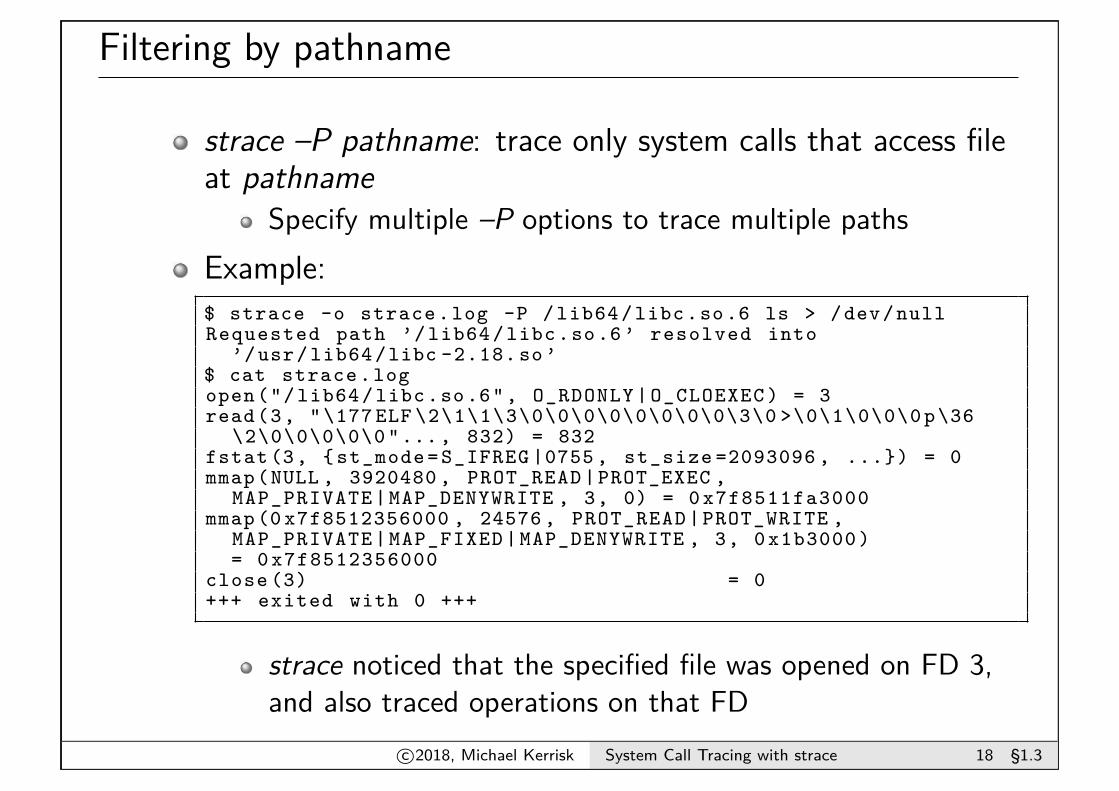
strace –P pathname: trace only system calls that access fileat pathname
Specify multiple –P options to trace multiple pathsExample:$ strace -o strace .log -P / lib64 /libc.so .6 ls > /dev/nullRequested path ’/ lib64 /libc.so .6 ’ resolved into
’/usr/ lib64 /libc -2.18. so ’$ cat strace .logopen("/ lib64 /libc.so .6", O_RDONLY | O_CLOEXEC ) = 3read(3, "\177 ELF \2\1\1\3\0\0\0\0\0\0\0\0\3\0 >\0\1\0\0\0 p\36
\2\0\0\0\0\0 "... , 832) = 832fstat (3, { st_mode = S_IFREG |0755 , st_size =2093096 , ...}) = 0mmap(NULL , 3920480 , PROT_READ |PROT_EXEC ,
MAP_PRIVATE | MAP_DENYWRITE , 3, 0) = 0 x7f8511fa3000mmap (0 x7f8512356000 , 24576 , PROT_READ | PROT_WRITE ,
MAP_PRIVATE | MAP_FIXED | MAP_DENYWRITE , 3, 0 x1b3000 )= 0 x7f8512356000
close (3) = 0+++ exited with 0 +++
strace noticed that the specified file was opened on FD 3,and also traced operations on that FD
c©2018, Michael Kerrisk System Call Tracing with strace 18 §1.3
Mapping file descriptors to pathnames
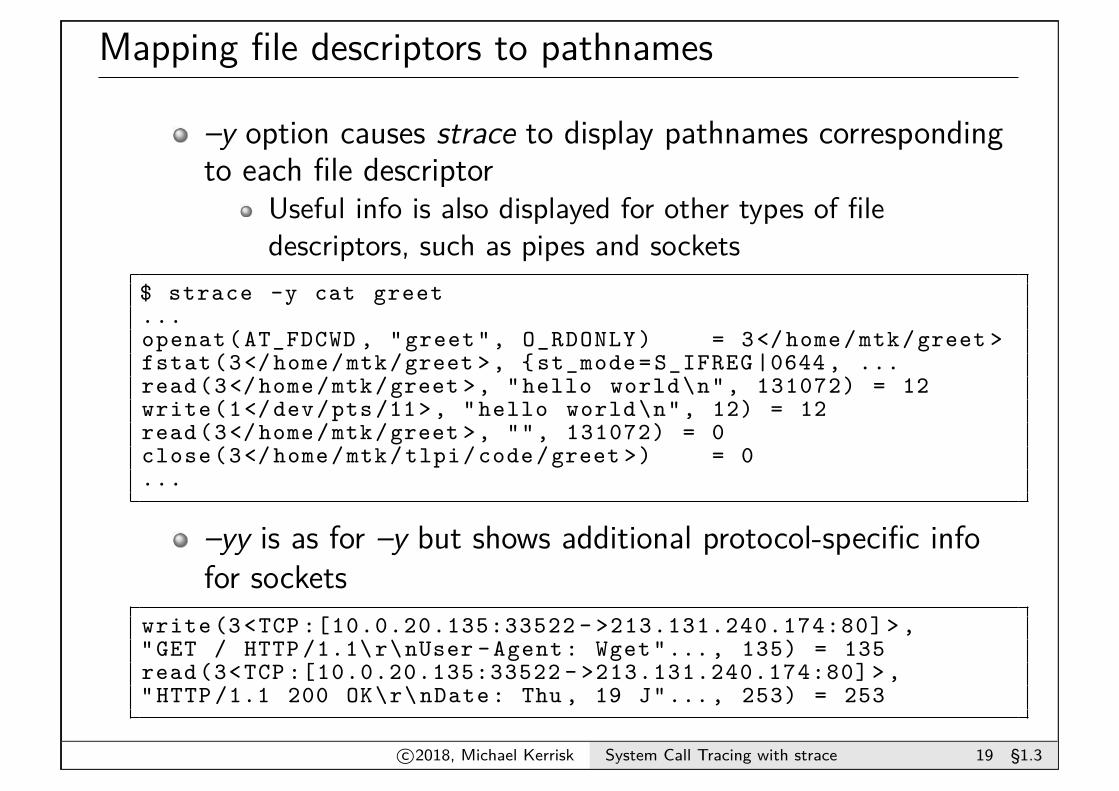
–y option causes strace to display pathnames correspondingto each file descriptor
Useful info is also displayed for other types of filedescriptors, such as pipes and sockets
$ strace -y cat greet...openat (AT_FDCWD , "greet", O_RDONLY ) = 3</ home/mtk/greet >fstat(3</ home/mtk/greet >, { st_mode = S_IFREG |0644 , ...read(3</ home/mtk/greet >, "hello world\n", 131072) = 12write(1</ dev/pts /11>, "hello world\n", 12) = 12read(3</ home/mtk/greet >, "", 131072) = 0close(3</ home/mtk/tlpi/code/greet >) = 0...
–yy is as for –y but shows additional protocol-specific infofor sockets
write (3<TCP :[10.0.20.135:33522 - >213.131.240.174:80] > ,"GET / HTTP /1.1\r\nUser -Agent: Wget"..., 135) = 135read(3<TCP :[10.0.20.135:33522 - >213.131.240.174:80] > ,"HTTP /1.1 200 OK\r\nDate: Thu , 19 J"... , 253) = 253
c©2018, Michael Kerrisk System Call Tracing with strace 19 §1.3
Outline
1 Getting started 32 Tracing child processes 103 Filtering strace output 144 System call tampering 205 Further strace options 24
System call tampering
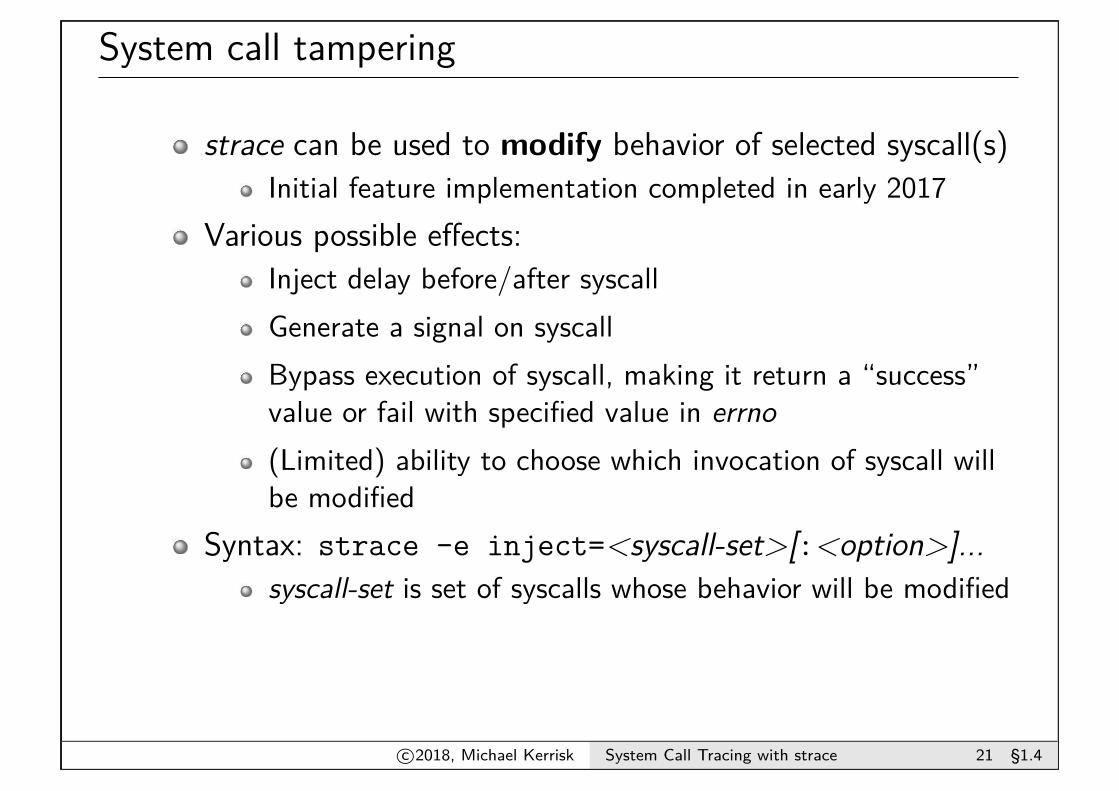
strace can be used to modify behavior of selected syscall(s)Initial feature implementation completed in early 2017
Various possible effects:Inject delay before/after syscallGenerate a signal on syscallBypass execution of syscall, making it return a “success”value or fail with specified value in errno(Limited) ability to choose which invocation of syscall willbe modified
Syntax: strace -e inject=<syscall-set>[:<option>]...syscall-set is set of syscalls whose behavior will be modified
c©2018, Michael Kerrisk System Call Tracing with strace 21 §1.4
strace -e inject options
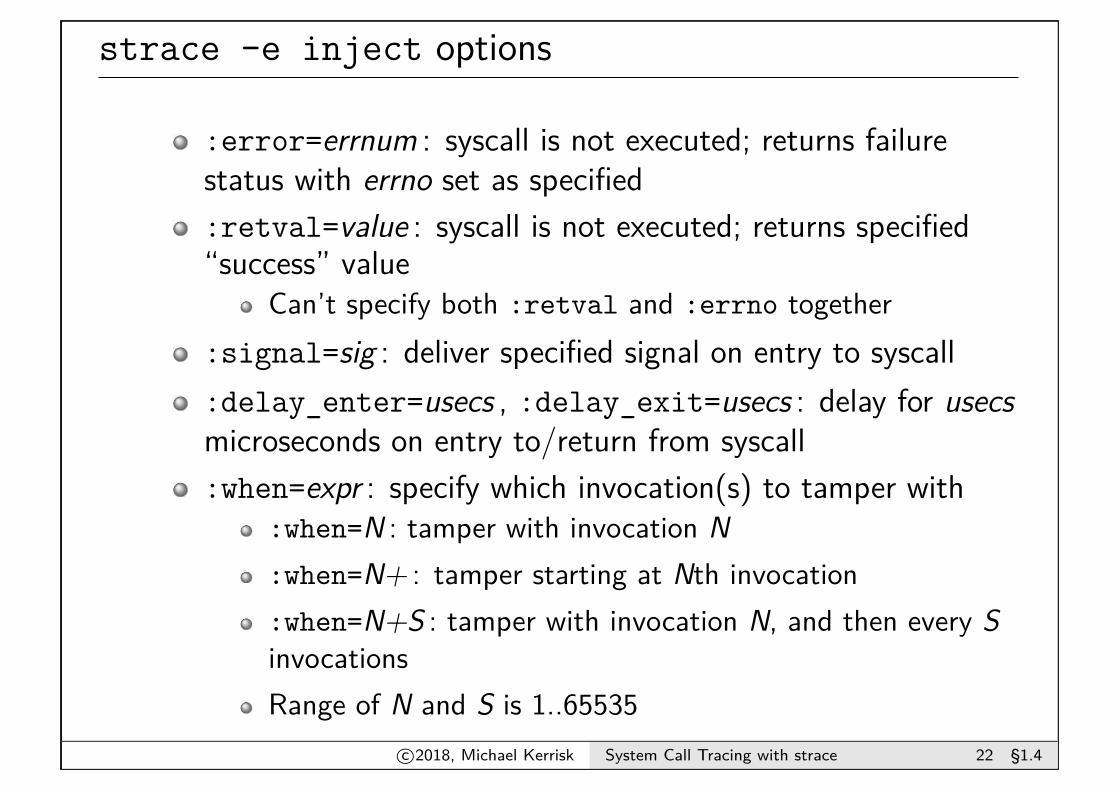
:error=errnum : syscall is not executed; returns failurestatus with errno set as specified:retval=value : syscall is not executed; returns specified“success” value
Can’t specify both :retval and :errno together:signal=sig : deliver specified signal on entry to syscall:delay_enter=usecs , :delay_exit=usecs : delay for usecsmicroseconds on entry to/return from syscall:when=expr : specify which invocation(s) to tamper with
:when=N : tamper with invocation N:when=N+ : tamper starting at Nth invocation:when=N+S : tamper with invocation N, and then every SinvocationsRange of N and S is 1..65535
c©2018, Michael Kerrisk System Call Tracing with strace 22 §1.4
Example
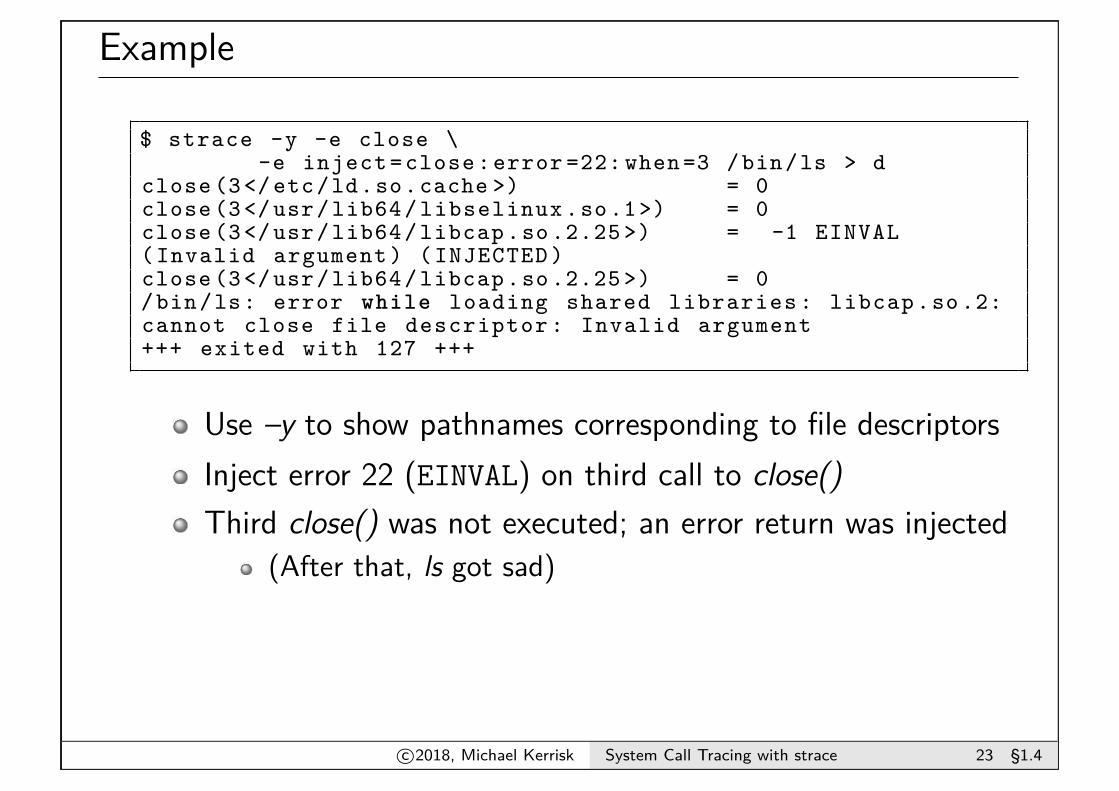
$ strace -y -e close \-e inject =close:error =22: when =3 /bin/ls > d
close (3</ etc/ld.so.cache >) = 0close (3</ usr/lib64/ libselinux .so.1>) = 0close (3</ usr/lib64/ libcap .so .2.25 >) = -1 EINVAL( Invalid argument ) ( INJECTED )close (3</ usr/lib64/ libcap .so .2.25 >) = 0/bin/ls: error while loading shared libraries : libcap .so .2:cannot close file descriptor : Invalid argument+++ exited with 127 +++
Use –y to show pathnames corresponding to file descriptorsInject error 22 (EINVAL) on third call to close()Third close() was not executed; an error return was injected
(After that, ls got sad)
c©2018, Michael Kerrisk System Call Tracing with strace 23 §1.4
Outline
1 Getting started 32 Tracing child processes 103 Filtering strace output 144 System call tampering 205 Further strace options 24
Obtaining a system call summary
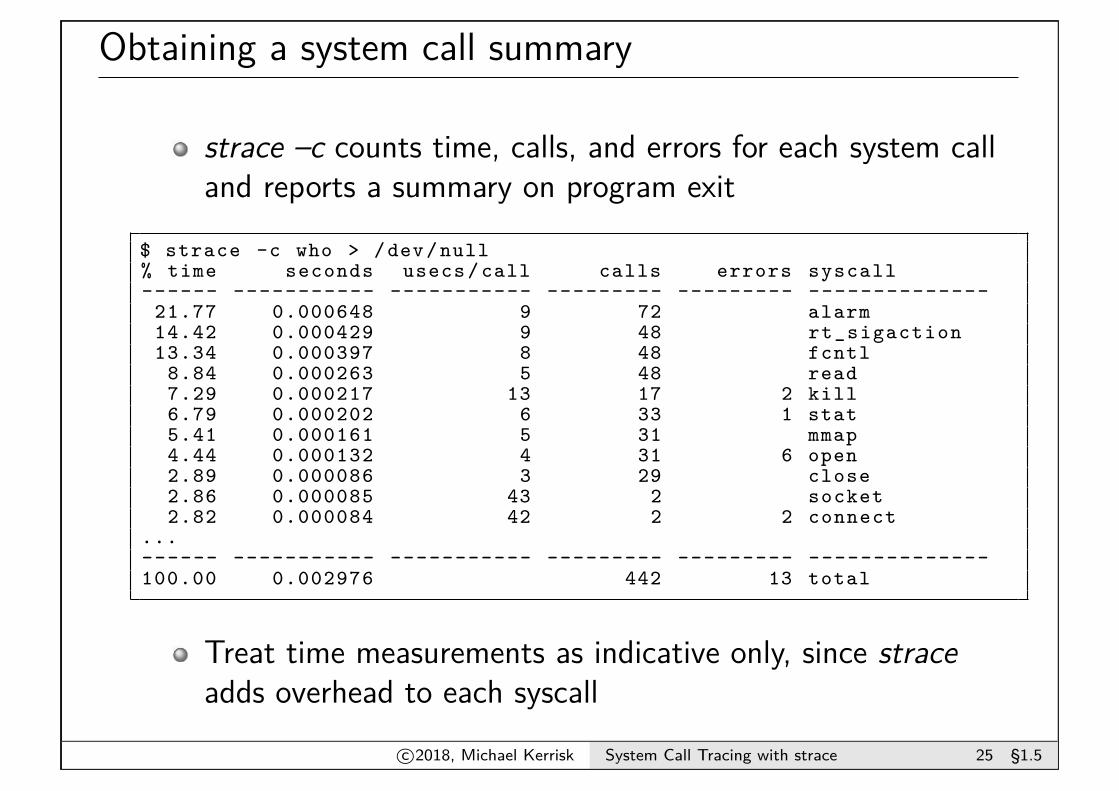
strace –c counts time, calls, and errors for each system calland reports a summary on program exit
$ strace -c who > /dev/null% time seconds usecs /call calls errors syscall------ ----------- ----------- --------- --------- --------------
21.77 0.000648 9 72 alarm14.42 0.000429 9 48 rt_sigaction13.34 0.000397 8 48 fcntl
8.84 0.000263 5 48 read7.29 0.000217 13 17 2 kill6.79 0.000202 6 33 1 stat5.41 0.000161 5 31 mmap4.44 0.000132 4 31 6 open2.89 0.000086 3 29 close2.86 0.000085 43 2 socket2.82 0.000084 42 2 2 connect
...------ ----------- ----------- --------- --------- --------------100.00 0.002976 442 13 total
Treat time measurements as indicative only, since straceadds overhead to each syscall
c©2018, Michael Kerrisk System Call Tracing with strace 25 §1.5
Tracing live processes
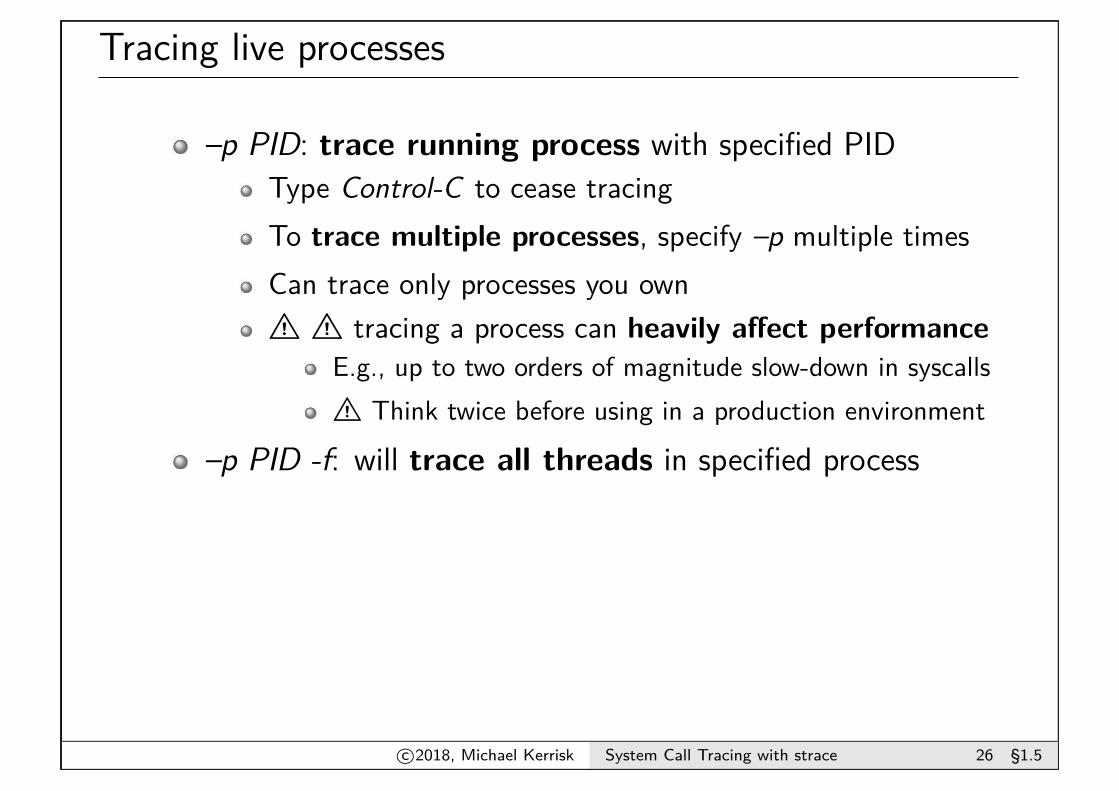
–p PID: trace running process with specified PIDType Control-C to cease tracingTo trace multiple processes, specify –p multiple timesCan trace only processes you ownB B tracing a process can heavily affect performance
E.g., up to two orders of magnitude slow-down in syscallsB Think twice before using in a production environment
–p PID -f: will trace all threads in specified process
c©2018, Michael Kerrisk System Call Tracing with strace 26 §1.5
Further strace options
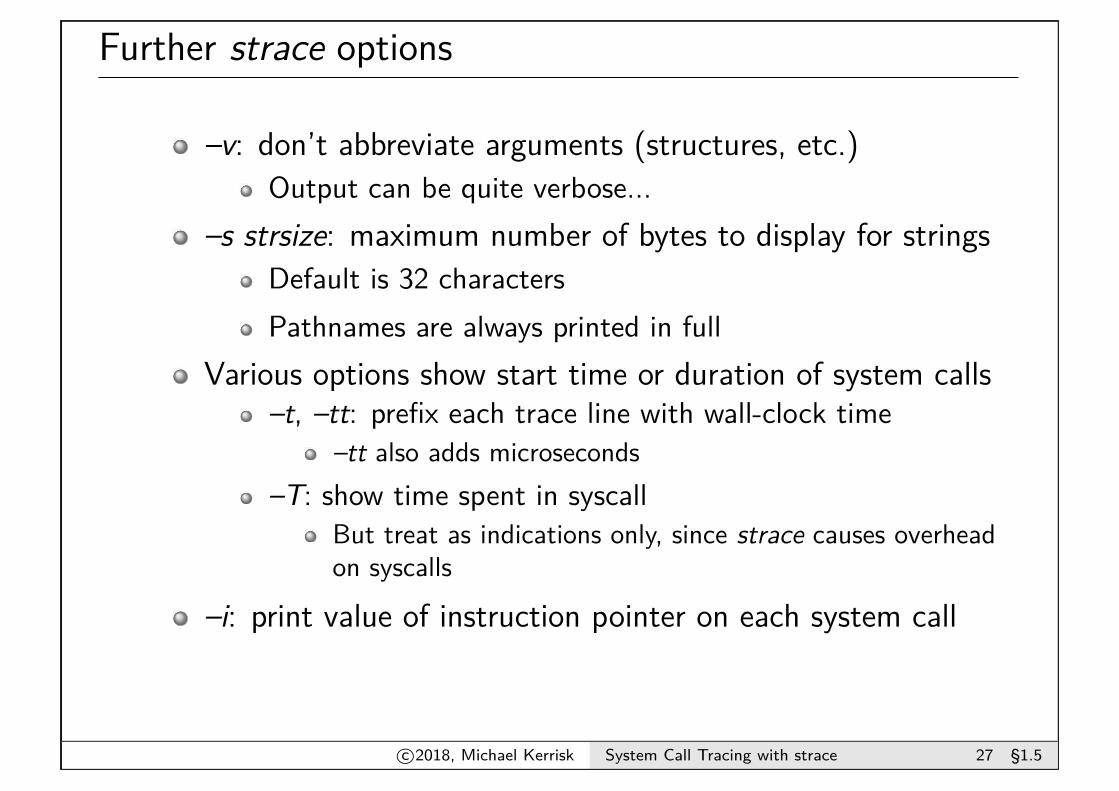
–v: don’t abbreviate arguments (structures, etc.)Output can be quite verbose...
–s strsize: maximum number of bytes to display for stringsDefault is 32 charactersPathnames are always printed in full
Various options show start time or duration of system calls–t, –tt: prefix each trace line with wall-clock time
–tt also adds microseconds–T: show time spent in syscall
But treat as indications only, since strace causes overheadon syscalls
–i: print value of instruction pointer on each system call
c©2018, Michael Kerrisk System Call Tracing with strace 27 §1.5
Thanks!Michael Kerrisk [email protected] @mkerrisk
Slides at http://man7.org/conf/Source code at http://man7.org/tlpi/code/
Training: Linux system programming, security and isolation APIs,and more; http://man7.org/training/
The Linux Programming Interface, http://man7.org/tlpi/