nCode GlyphWorks® 11.0 Specification
28
nCode GlyphWorks® 11.0 Specification NC-SP-GW 11.00.027 nCode GlyphWorks® 11.0 Specification
-
Upload
khangminh22 -
Category
Documents
-
view
33 -
download
0
Transcript of nCode GlyphWorks® 11.0 Specification

nCode GlyphWorks® 11.0 SpecificationNC-SP-GW 11.00.027
nCode GlyphWorks® 11.0 Specification

2
About this Document
Copyright Notice
All of this documentation, and the software it describes, are copyrighted with all rights reserved. Under copyright laws, neither the documentation or the software may be copied, photocopied, reproduced in any way, translated, or converted into any machine-readable form or any electronic medium, in whole or in part, without express written permission from HBM United Kingdom Limited (HBM). Failure to obtain such permission may result in prosecu-tion. The software suite that comprises nCode 11.0 (including GlyphWorks®, Automation and DesignLife™) and their component programs and files are the property of HBM. Please refer to the About screen in the software and the About folder in the nCode 11.0 installation and in the docs\licenses folder in nCode Automation installation for details on third party software used and respective licenses and/or copyright notices.
nCode 11.0 is protected under copyright law and is licensed for use only by a user who has obtained the necessary license, or in the case of a multi-user license may only be used by up to the maximum number of users specified in the license agreement. The sale, lease, hire rental, or any other reassignment of the product to, or by, a third party without the prior writ-ten consent of HBM is expressly forbidden.
© 2015 HBM United Kingdom Limited. All worldwide rights reserved.
GlyphWorks® is a registered trademark of HBM.
nCode 11.0 includes Adobe Reader®. Adobe Reader is a registered trademark of Adobe Systems Incorporated in the United States and/or other countries.
All other trademarks are the property of their respective owners.
Warranty Notice
While HBM makes the product as reliable as is reasonably possible, HBM does not warrant that the product will function properly under all hardware platforms or software environ-ments. Certain combinations of third party software and/or manufacturers modifications to hardware and software may impact upon the operation of HBM software.
HBM has tested the software and reviewed the documentation but HBM makes no warranty, implicit or explicit, with respect to the product, its quality, performance, merchantability, or fit-ness for a specific usage. This software and documentation are licensed “as is” and you—the licensee—assume the entire risk as to their quality and performance when you use the prod-uct.
Liability Notice
HBM will not be liable for damages arising from the results, direct or indirect, special, inciden-tal, or consequential, of the licensee's usage or misusage of the product, even if advised of the possibility of such damages. In particular, and without prejudice to the foregoing, HBM has no liability for any programs or data stored or used with HBM software, including the costs of recovering such programs or data.

3
Feedback
We value your feedback. If you have any documentation questions, comments, or concerns, please e-mail us at:
Customer Support
For issues involving the installation or use of your software, please e-mail us at:
or use the nCode website, www.ncode.com, to find support information for your country.

Contents
Product Overview ......................................................................................................................................................... 5
GlyphWorks Fundamentals package: ............................................................................................................... 6
Signal option: ..............................................................................................................................................................11
Frequency option: .....................................................................................................................................................12
GPS Display option: ...................................................................................................................................................14
Media Display option: ..............................................................................................................................................15
IMSL Statistics option: ..............................................................................................................................................16
ASAM ODS option: ....................................................................................................................................................16
Accelerated Testing option: ...................................................................................................................................17
Fatigue option: ...........................................................................................................................................................18
Fatigue Editing option: ...........................................................................................................................................20
GlyphBuilder option: ...............................................................................................................................................20
Optimized Testing option: .....................................................................................................................................21
nCode Automation Personal Edition .................................................................................................................21
Supported File Formats ...........................................................................................................................................22
Supported Platforms ................................................................................................................................................25
Languages .....................................................................................................................................................................25
Free Viewer ...................................................................................................................................................................26

nCode GlyphWorks® 11.0 Specification 5NC-SP-GW 11.00.027
1 Product Overview
nCode GlyphWorks is a powerful data processing system for engineering test data analysis with specific application to durability and fatigue analysis. Designed to han-dle huge amounts of data, GlyphWorks provides a graphical, process-oriented envi-ronment. Users can simply create an analysis workflow by ‘drag and dropping’ analysis building blocks. This easy-to-use environment enables users to see what the data is telling them at each stage in the process.
GlyphWorks provides the power to process gigabytes of data, taking data directly from a wide range of formats and creating results or a finished report. Processes cre-ated in GlyphWorks can be locked-down and distributed, thus improving the consis-tency and speed of analysis without requiring manually created scripts.
GlyphWorks provides a wide range of data processing and visualization capabilities with specialized options for durability such as fatigue analysis, accelerated testing, and frequency domain tool such as ride quality and rotating machinery analysis.
Additional functionality can be added by using GlyphBuilder glyphs including the Python programming language or MATLAB within a Scripting glyph.
New nCode 11.0 features are indicated by red italics.

6 nCode GlyphWorks® 11.0 Specification NC-SP-GW 11.00.027
2 GlyphWorks Fundamentals package:
GlyphWorks Fundamentals is an entry-level product option which provides visualiza-tion and basic manipulation, frequency spectrum analysis and filtering capability. Automated reporting is also available using the Studio Display glyph.
Desktop environment
Studio module for viewing data and creating report templates
GlyphWorks environment
Flowproc batch processing of GlyphWorks processes
ASCIITranslate module for converting ASCII data to binary time series and multi-col-umn formats.
ScheduleCreate module to define duty cycle combinations of time series, histogram or multi-column data.
Table 1 Glyphs included in GlyphWorks Fundamentals
Glyph Description
Input Glyphs
Excel Input Accesses Microsoft Excel data directly
Histogram Input Accesses Histogram data type
Automation Query Uses Query Templates defined in nCode Automation to find data automatically and associate with other input glyphs.
Burst Input Accesses both time-series and multi-column burst data for-mats.
Metadata Input Accesses XML format metadata files for the purpose of add-ing or changing metadata. Also enables metadata to be directly edited or created using a table view.
Metadata Generator Creates standard property entries to generate new metadata
Multi-column Input Accesses Multi-column data which is an ‘n’ x ‘m’ table of data
Time Series Input Accesses Time Series (constant x-axis increment) data
Time Series Generator Defines a channel of data. Functions include:Square waveSine waveSwept sineWhite noiseTriangular waveSine-on-Random
Vibration Generator Enables vibration tests for RandomPSD, swept sine, sine dwell and sine on random to be defined. Multi-column input data can also be used to define vibration data (moved in fundamentals)

nCode GlyphWorks® 11.0 Specification 7NC-SP-GW 11.00.027
Function Glyphs
Arithmetic Performs basic mathematical functions on time series or his-togram data (including variable bin width histograms). Functions include: Add Subtract Multiply Divide Powers of Square root Sine Cosine Tangent Secant Cosecant Cotangent Equivalent anti trigonometric Equivalent Hyperbolic Absolute Log Base E Log Base 10 Anti Log Base E Anti Log Base 10
Butterworth Filter Butterworth low, high, band pass and band stop filters for up to 8th order forwards or forwards/backwards.
Channel Reassignment Re-numbers channels of data based on interactive selection, metadata or alphabetic sequence.
Concatenation Appends time series data together
Amplitude Distribution Probability density, time at level and point count distribu-tions
Graphical Editor Deletes, extracts or overwrites marked sections in a graphical display: Section extraction Delete sections Deletion joining functions Deletion taper functions Scale/offset overwrite sections Ramp or Half sine wave overwrite sections Also provides for interactive shifting of sections, drift removal and Butterworth filtering.
Differentiation Performs differentiation on time series data (including auto-mated units updating).
Extraction Extracts a section of time series data
Fast Fourier Filter Frequency domain FIR low, high, band pass and band stop filters.
Table 1 Glyphs included in GlyphWorks Fundamentals

8 nCode GlyphWorks® 11.0 Specification NC-SP-GW 11.00.027
Frequency Spectrum PSD, Amplitude or ESD frequency spectrums from time series data.
Histogram Manipulation Performs functions on histogram data such as:ExceedanceCumulativeSum to 2DRainflow conversion - From To > Range OnlyClosing residuals in rainflow histograms
Integration Performs integration on time series data (including auto-mated units updating).
Metadata Manipulation Combines and copies metadata from one set of data to another. Also can delete metadata.
Metadata Calculator Creates or edits metadata though calculator interface
Metadata To Histogram Creates a histogram from user selected metadata item
Multi-column Calculator Performs mathematical operations on columns of multi-col-umn data.
Multi-column Filter Enables rows or columns to be automatically removed from multi-column data.
Multi-column Manipulation Performs specific functions on multi-column data including aggregation based on specified statistic, and splitting and combining tables.
Multi-column Sort Performs column based sorting of tables.
Multi-column To Time Series Converts multi-column to time series data.
Rainflow Cycle Counting Performs rainflow cycle counting and range-pair counting to create 2D or 3D histogram of cycles.
Position Based Resampling Uses speed channel to convert from time to distance or angle domain.
Running Stats Calculates requested statistic on a sliding window of data. Also enables periodic calculations for rotating machinery.
Sample Rate Adjust Adjusts sample rate of time series data.
Simultaneous Values Finds simultaneous values across multiple channels at maxi-mums, minimums and abs max.
Statistics Calculates time series and multicolumn statistics including Min, MaxMeanRangeRMSStandard deviation (based on sample or population)Variance (based on sample or population)Skewness (based on sample or population)Kurtosis (based on sample or population)Crest factor (based on SD or RMS)Rank statistics (median, mode, percentiles)
Table 1 Glyphs included in GlyphWorks Fundamentals

nCode GlyphWorks® 11.0 Specification 9NC-SP-GW 11.00.027
Strain Rosette Calculates from strain rosette data derived stress or strain results including: Max principal Min principal Abs Max principal Max shear Von Mises Strain/stress at angle Biaxiality ratio Angle Critical Plane
Test Combination Combines channels from two to 16 tests
Test Splitter Uses logical functions to extract channels from a test
Time Series Calculator Creates derived time series channels through mathematical operations including bitwise functions. Also performs logical operations to identify regions of interest and outputs feature lists.
Time Series To Multi-column Converts time series to multi-column data
Type Conversion Converts between different data (pipe) types. It currently supports conversion from time series to histogram, and his-togram to time series.
Units Conversion Converts time series data and labels using configurable units system
Super Glyph
Super Glyph Creates a single glyph from a sub-process of multiple glyphs which can be saved and re-used
SG Input Defines input connections for Super Glyph
SG Output Defines output connections for Super Glyph
SG Loop Control Enables multiple iterations to be performed within a Super Glyph based on a set or table of values to loop through.
Display Glyphs
Audit Display Views and exports audit report file which shows a configu-rable trace of data processed, version numbers and glyph properties.
Chart Display Creates report quality charts (bar, pie, polar, line, bubble etc) from tables of data (multi-column). JPEG images can be automatically generated and included in Studio reports.
Data Values Display Views the all data values of time series, histogram and multi-column data and optionally exports ASCII CSV files.
Table 1 Glyphs included in GlyphWorks Fundamentals

10 nCode GlyphWorks® 11.0 Specification NC-SP-GW 11.00.027
Histogram Display Provides dynamic 3D plotting of histogram data including colour mapped tower and surface plots.
Metadata Display Metadata viewed as tree or configurable table and option-ally outputs to ASCII CSV files.
XY Display 2D plotting of time series, histogram and multi-column data. Export of cursor values.
XYZ Display 3D scatter plots of time series or multicolumn data. The size and colour of the symbols can be set using 2 additional data sets.
Studio Display Report creation based on Studio templates including output to Word, HTML, PowerPoint, PDF and image formats JPEG, PNG, BMP.
Output Glyphs
Automation Instruction Defines actions to be performed on output data when pro-cess is run as part of Data Processing in nCode Automation product.
Histogram Output Writes out histogram data type.
Metadata Output Writes out metadata data type.
Multi-column Output Writes out multi-column data type.
Time Series Output Writes out time series data type.
Table 1 Glyphs included in GlyphWorks Fundamentals

nCode GlyphWorks® 11.0 Specification 11NC-SP-GW 11.00.027
3 Signal option:
Signal provides additional signal processing tools for durability test applications. It also includes methods for detecting anomalies in signals (flat-lines, spikes, drift etc). The Rainflow module provides a specialized tool for the combination and extrapola-tion of rainflow matrices.
Signal also includes Rainflow module to perform advanced duty cycle combinations of rainflow
histograms and extrapolations of rainflow histograms based on duration or percentile usage.
KAMTranslate module for converting ACRA KAM-500 data.
Table 2 Signal glyphs
Glyph Description
Joint Distribution Performs amplitude distributions with respect to 2 or 3 channels simultaneously.
Block Cycle Input Converts block cycle xml definition file into time series data.
Level Crossing Level crossing counting.
Potential Damage Performs damage calculations for comparing tests including relative damage and damage intensity combinations.
Peak Valley Slice Shortens data by peak valley slicing across multiple channels at turning points.
Markov Count Performs peak-valley and transition from-to histogram bin-ning.
Channel Comparison Compares statistics between channels.
Drift Detection Finds drifting mean levels in data.
Flat Line Detection Finds flat lines and drop out in data.
Limit Detection Finds where data crosses defined limits.
Spike Detection Finds spikes in data.
Relative Damage Spec-trum
Performs relative damage calculation for a range of fre-quency bands using SN approach. It is well suited for calcu-lating input for proving ground optimization using Test Match glyph.
PSD to Rainflow Calculates a rainflow cycle histogram from a PSD input, enabling fatigue analysis from frequency domain data. Scal-ing, integration, and differentiation can be applied and also included in the output PSD.
Trend Removal Performs drift or offset corrections on time series data. Sig-nal drift can be removed using linear or polynomial curve fits for either the whole signal or a section within the data.

12 nCode GlyphWorks® 11.0 Specification NC-SP-GW 11.00.027
4 Frequency option:
Frequency provides a range of noise and vibration analysis capability with particular application to rotating machinery, octave analysis and frequency response. Specific functionality is also provided to assess vehicle ride quality analysis to ISO 2631 stan-dard and hand-arm vibration assessment to ISO 5349 standard.
Table 3 Frequency glyphs
Glyph Description
Auto/Cross Correlation This glyph analyses time series data and carries out an auto-corre-lation or cross correlation on the data. Two algorithms can be used, Direct: time based process that can deal with any size of data but can be slow with large data sets, FFT-based: quicker fre-quency domain process limited to 2^23-1 points.
Convolution The glyph takes in time series data and performs a convolution between the primary data, and the secondary data (the secondary data is usually an impulse or a filter response.
Custom Fourier Filter Enables user specified filter characteristics to be applied
Waterfall Display Provides dynamic 3D plotting of complex frequency data includ-ing active cursors, waterfall slices, colour surface plots, colour waterfall plots. An additional 2D plot of time series can also be overlaid.
Campbell Plot Display Provides a Campbell plot for complex frequency data by showing peaks in the data as circles or other shapes where the size of the shape is proportional to magnitude of the peak. Options are pro-vided to control the number of peak values displayed. This enables order relationships between frequency and speed to be identified in a 2D plot and is commonly used for rotating machin-ery analysis.
Complex Frequency Input Accesses Complex Frequency data type
Complex Frequency Out-put
Writes out complex frequency data type
Complex Frequency Manipulation
Extracts data sets from complex frequency data including:Order cutsWaterfall X-sliceWaterfall Y-sliceWaterfall Sum to 2D
Frequency Response Calculates linear transfer functions for single input and single out-put systems including: Auto spectrum of input Auto spectrum of response Cross Spectrum Gain Coherence

nCode GlyphWorks® 11.0 Specification 13NC-SP-GW 11.00.027
Joint Time Frequency Analyzes frequency content as it varies with time using methods including: Short Time Fourier Gabor
Octave Analysis Calculates octave bands with optional noise and ride weighting functions: Full, 1/3, 1/6, 1/12, 1/24 Octave bands Octave analysis with ISO 2631 vibration weighting Octave analysis with dB(A), dB(B), dB(C) noise weightingInputs can be time series, PSD histograms or waterfall data.
Order Tracking Filter The Order Tracking Filter glyph performs a Butterworth filter on time series data using a rotational speed channel to extract a specified order from the signal. The cut-off frequencies track the speed channel to provide an adaptive band-pass or band-stop fil-ter that changes with speed.
Pulse To Speed Creates smoothed speed data from tachometer pulse signals
Spectrum Weighting Adjusts frequency spectrum data based on built-in dB(A), dB(B), dB(C) weightings or user-defined functions.
Waterfall Analysis Calculates frequency content with respect to speed for rotating machinery analysis and creates waterfall data. Without speed defined, this glyph will also calculate frequency content at fixed time intervals.
Weighting Filter Applies built-in noise and vibration weighting filters to time series data including: ISO2631/UIC 513 – Wk, Wd, Wf, Wc, We, Wj, Wb ISO5349 - Wh A, B, C noise
Table 3 Frequency glyphs

14 nCode GlyphWorks® 11.0 Specification NC-SP-GW 11.00.027
5 GPS Display option:
GPS Display glyph enables latitude and longitude GPS data to be plotted on a map or grid background (optionally using an image file). Mapping capability can use Micro-soft® MapPoint® 2006 or 2009. Also can use Internet-based mapping using Map-Quest Open for both mapping and satellite imagery. Direct export to Google KML file is also provided to use data in Google Earth. Mapping is only supported on Windows platforms. The GPS Display option also enables this display capability within Studio for inclusion in report layouts. GPS data can be time series format (e.g. SoMat SIF) or any supported multi-column format (e.g. CSV file from Excel). The GPS Display also supports feature lists to enable locations of interest on the data lines to be automati-cally marked using logical conditions.
Regions can be defined in the GPS Display glyph and are displayed as semi-transpar-ent polygons with points defined by their latitude and longitude. Processing regions creates an output feature list for when the time series data on the first input pipe enters and leaves a region. The feature list can be used as input to a Graphical Editor glyph to enable time series data to be edited based on geographical regions.
The GPS display can also use a channel to colour a data line in order to correlate a parameter with location and shows a corresponding colour legend.
The GPS Processing glyph reads GPS time series data and creates calculated channels and test metadata. The calculated channels that are made depend on the channels in the input file, and the glyph's property settings. Latitude and Longitude channels are required. Speed, Altitude, and Heading can be optionally provided. Calculated chan-nels include speed, percent gradient, yaw rate and lateral acceleration. If additional vehicle parameters are provided, further calculations can be performed including esti-mates of braking power, engine power and steering angle. A Kalman smoothing option in included based on an internal physics model.
Table 4 GPS glyphs
Glyph Description
GPS Display Enables latitude and longitude GPS data to be plotted on a map or grid background. Mapping can use Microsoft 2006 or 2009 to be installed. A live internet connection can access MapQuest Open for maps and satellite imagery. Regions can be defined interactively using polygons to edit time series data based on geographical location. The GPS display can use a chan-nel to colour a data line with a colour map in order to correlate a parameter with location.
GPS Processing Enables vehicle performance data to be estimated from low sample rate GPS data.Takes as input longitude, latitude, speed, heading, and altitude GPS time series channels, and produces conditioned versions of those inputs, and a set of calculated channels.

nCode GlyphWorks® 11.0 Specification 15NC-SP-GW 11.00.027
GPS Display also includes: Studio GPS Display plugin for use in Studio report templates.
6 Media Display option:
Media Display glyph enables video and audio signals to be played using Windows Media player embedded in the glyph. It also enables cursor synchronization with other data displays to gain insight on what was occurring in other signals. This is available on Windows-32bit and 64-bit (not XP 64) platforms. Windows Media Player 11 or later is recommended and all video formats supported by the Windows Media Player can be used. Video from SoMat SIE files can also be viewed directly with the Media Display glyph.
A Gauge Display glyph enables synchronized values to be displayed during playback in a variety of styles. Gauge Display is available on Windows 32-bit platforms only.
Table 5 Media Display glyph options
Glyph Description
Media Display
Media Display Embeds Windows Media Player in a glyph to play and synchro-nize video and audio. Specific capability provided for viewing video from SoMat SIE files.
Gauge Display Provides configurable angular, linear, thermometer and digital numeric gauges to display data values synchronized to media playback.

16 nCode GlyphWorks® 11.0 Specification NC-SP-GW 11.00.027
7 IMSL Statistics option:
IMSL Statistics includes a Curve Fitting glyph for linear regression, polynomial regres-sion up to 9th order and spline fitting. This glyph uses statistical routines of the IMSL® C Numerical Library. (IMSL is a registered trademark of Visual Numerics, Inc in the U.S. and other countries.) Curve Fitting glyph is supported on all platforms. Weibull Analysis glyph enables 2-parameter Weibull distribution curve fitting. The IMSL math and statistic functions are also accessible from within the Scripting glyph by using special PyIMSL Python functions (Windows 32-bit only at this release) .
8 ASAM ODS option:
This ASAM ODS connectivity capability enables users to browse, search and select data from ASAM ODS database from within GlyphWorks. The ASAM (Association for Standardization of Automation and Measuring System) family of standards originated in the European automobile industry in the early 1990’s as a method to increase stan-dardization in the field of automated testing. ASAM ODS (Open Data Structures) is a part of the ASAM family of standards responsible for storing and maintaining persis-tent testing data (see www.asam.net). The ASAMConfig utility defines the connection to the available ASAM ODS systems. The data is accessed with GlyphWorks and Stu-dio through the File > Open ASAM Data… menu option. The interface to the ASAM ODS data enables interactive browsing, editing of metadata and searching based on metadata. Supported on 32-bit and 64-bit Windows platforms.
Table 6 IMSL Statistics options
Glyph Description
IMSL Statistics
Curve Fitting Enables linear regression, polynomial regression up to 9th order and spline fitting. Uses statistical routines of the IMSL™ C Numeri-cal Library and also enables PyIMSL in Scripting glyph.
Weibull Analysis Performs Weibull analysis on multi-column input using a 2-param-eter Weibull distribution.

nCode GlyphWorks® 11.0 Specification 17NC-SP-GW 11.00.027
9 Accelerated Testing option:
Accelerated Testing provides the ability to create a representative PSD or swept sine shaker vibration test based on measured data. It enables the combination of multi-ple time or frequency domain data sets into representative test spectra that acceler-ates the test without exceeding realistic levels.
Table 7 Accelerated Testing glyphs
Glyph Description
Accelerated Testing Glyphs
Extreme Response Spectrum Calculates extreme response and fatigue damage spectra from PSDs.
Shock Response Spectrum Calculates shock response and fatigue damage spectra from time series data.
Test Synthesis Calculates representative PSD or swept sine data from fatigue damage spectra.

18 nCode GlyphWorks® 11.0 Specification NC-SP-GW 11.00.027
10 Fatigue option:
The Fatigue product option provides methods to cover two main approaches for fatigue life prediction from measured data:
Stress-life (SN) to use nominal stress approach for high-cycle conditions or non-metallic applications. Capability is provided to directly calculate fatigue for complete schedules of multiple events.
Strain-life (EN) for more severe loading conditions (low-cycle fatigue) where plasticity is more significant. Capability is provided to directly calculate fatigue for complete schedules of multiple events.
Crack Growth provides linear elastic fracture mechanics in the GlyphWorks environment and is also open architecture into which algorithms can be added.
Creep Analysis for high temperatures applications enables creep calculations for time in hours to rupture from time histories of stress and temperature.
Table 8 Fatigue glyphs
Glyph Description
Material Input Accesses data from Materials databases
Strain Life Performs strain-life fatigue analysis including:Damage calculationKf back calculationScale factor back calculationComplete schedule calculationsMean stress corrections – Interpolation, Smith-Watson-Topper and Morrow methods Surface treatment correctionsSurface finish correctionsLarge pre-defined material database
Stress Life Performs stress-life fatigue analysis including:Damage calculationKf back calculationBS7608 weld fatigueScale factor back calculationComplete schedule calculationsSmall cycle correctionsMean stress corrections – Interpolation, Goodman, Gerber, Goodman-TensionOnly,GerberTensionOnly, FKM methods Surface treatment correctionsSurface finish correctionsLarge pre-defined material databaseDefine custom methods using Python scripting
Crack Growth Performs linear elastic fracture mechanics analysis and provides configu-rable architecture to add custom models.

nCode GlyphWorks® 11.0 Specification 19NC-SP-GW 11.00.027
Fatigue also includes:
MaterialsManager module provides ability to enter, edit and view materials data. Up to 16 material curves can be overlaid for graphical comparison. Data can be imported and exported via XML files. Data can be filtered to only display materials that meet certain criteria.
Materials Databases: nCode 10 introduced a new nCode Premium Materi-als database for fatigue properties. It is distributed as part of the standard software as nCode_Premium.mxd in the mats folder. This database is licensed and is accessible by CDS license users. Each analysis job referencing this database draws an additional 150 CDS units. This data is based on mate-rials tested in HBM nCode's own ISO 9001 certified Advanced Materials Characterization facility. Many of these material tests were performed spe-cifically for this brand new database.
The supplied standard material database iceflow_standard.mxd has been expanded to include material data from the AISI bar steel database (SAE Paper Hot Rolled Steel Bar Low Cycle, Strain Controlled Fatigue Data for Automotive Applications, 1999- 01-0599) and both Stress Life and Dang Van design curves from the FKM Guideline Analytical Strength Assessment of Components, 5th Edition.
Creep Analysis Performs creep calculation for time in hours to rupture. Inputs can be time series data for stress and temperature; Stress and/or temperature can also be defined as constants. Output includes metadata results and creep dam-age time histories. The supported methods are Larson-Miller and Chaboche and materials data from creep rupture tests is required for each method.
Table 8 Fatigue glyphs
20 nCode GlyphWorks® 11.0 Specification NC-SP-GW 11.00.027
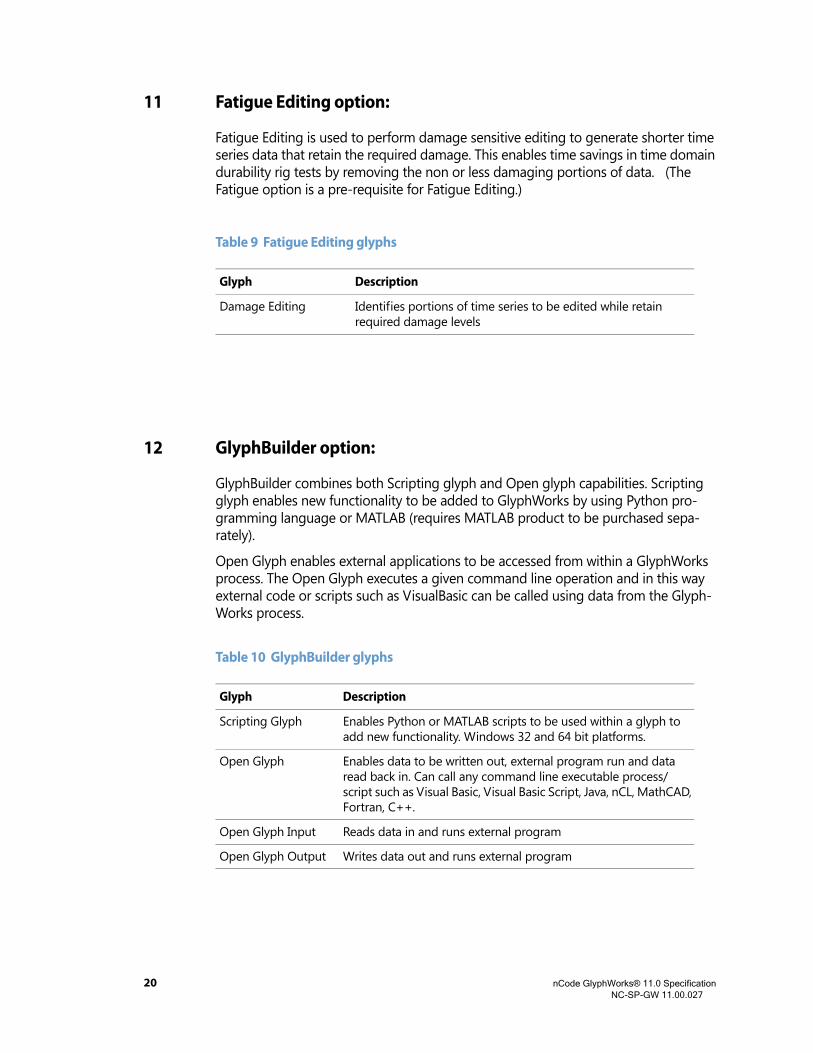
11 Fatigue Editing option:
Fatigue Editing is used to perform damage sensitive editing to generate shorter time series data that retain the required damage. This enables time savings in time domain durability rig tests by removing the non or less damaging portions of data. (The Fatigue option is a pre-requisite for Fatigue Editing.)
12 GlyphBuilder option:
GlyphBuilder combines both Scripting glyph and Open glyph capabilities. Scripting glyph enables new functionality to be added to GlyphWorks by using Python pro-gramming language or MATLAB (requires MATLAB product to be purchased sepa-rately).
Open Glyph enables external applications to be accessed from within a GlyphWorks process. The Open Glyph executes a given command line operation and in this way external code or scripts such as VisualBasic can be called using data from the Glyph-Works process.
Table 9 Fatigue Editing glyphs
Glyph Description
Damage Editing Identifies portions of time series to be edited while retain required damage levels
Table 10 GlyphBuilder glyphs
Glyph Description
Scripting Glyph Enables Python or MATLAB scripts to be used within a glyph to add new functionality. Windows 32 and 64 bit platforms.
Open Glyph Enables data to be written out, external program run and data read back in. Can call any command line executable process/script such as Visual Basic, Visual Basic Script, Java, nCL, MathCAD, Fortran, C++.
Open Glyph Input Reads data in and runs external program
Open Glyph Output Writes data out and runs external program

nCode GlyphWorks® 11.0 Specification 21NC-SP-GW 11.00.027
13 Optimized Testing option:
Optimized Testing provides both linear and non-linear least squares optimization to find the best mix of tests to match a target test. The optimization methods can either give the closest match of optimized proving ground schedules to match cus-tomer data.
14 nCode Automation Personal Edition
nCode Automation Personal Edition (Automation PE) takes the power of nCode Automation and applies it to local data on your laptop or shared drive. It is fully integrated with and is an ideal addition to GlyphWorks. Data that is analyzed using GlyphWorks can be managed with Automation PE. It enables you to search, organize and analyze data that is directly accessible from your computer. Automa-tion PE does not use a remote filestore for this data. Instead, it “indexes” the data that is available locally and is therefore easy to install and helps you to rapidly gain more value from your data.
With Automation PE you can quickly find the data you need, automate analyses and learn from huge amounts of information. For more details see the nCode Automa-tion product details sheet.
Table 11 Optimized Testing glyph
Glyph Description
Test Match Linear and non-linear least squares optimization to find the best mix of tests to match a target test.

22 nCode GlyphWorks® 11.0 Specification NC-SP-GW 11.00.027
15 Supported File Formats
Table 12 Time Series Formats
Time Series Read Write Windows 32
Windows 64
Linux 64
Additional Comments
ASCII via ASCIITrans-late
• • • • •
Altair MotionSolve .plt • • • •
B&K Pulse PTI • •
dAtagate MUX • • •
DEWEsoft .d7d • • • Some data read as multi-column
DSPCon DATX • • • Including data across multiple acquisition files.
EdasWin EDT • • • • •
ETAS mdf3 • • • Some data read as multi-column
HBM catman .bin • • • • •
HBM MEA • • • Additional sample rates supported
I-DEAS Test ATI • •
imc FAMOS RAW • • •
KAMTranslate module for Acra Control KAM-500 hardware
• • •
Kyowa KS2 • • •
LDS PNRF • • •
Lexade SIG • • •
MATLAB (Specific format, V5 and V7 compressed.)
• • • • • General reading of MAT-files requires Scripting glyph and MATLAB license
Microsoft Waves files • • • •
MSC Adams .req • • • •
Moog SmarTEST ACS_DUMP
• • •

nCode GlyphWorks® 11.0 Specification 23NC-SP-GW 11.00.027
MTS RPC3 • • • • • Including floating point format (PC Format-Little Endian).
National Instruments DIAdem DAT
• • • •
National Instruments TDM/TDMS
• • • •
nCode DAC • • • • •
nCode s3t • • • • •
nVision Signal • • • • •
OROS oxf • •
Prosig DATS • • •
Saginomiya RFC • • • • •
Schenck-Pegasus SPG • • •
SoMat 2100 DAT • • •
SoMat SIE • • • Now contains TCESetup file in metadata
SoMat SIF • • • • •
Sony PCScanII & III • • •
Sony PCScanIV XMX • • •
TEAC TAFFmat • • •
UFF • • • • • I-DEAS Universal Type 58
Vector 3.1 mdf • • • Some data read as multi-column
Table 12 Time Series Formats
Time Series Read Write Windows 32
Windows 64
Linux 64
Additional Comments
Table 13 Histogram Formats
Histogram Read Write Windows 32
Windows 64
Linux 64 Additional Comments
LMS XML • • • •
nCode DAC • • • • •
nCode s3h • • • • •
nCode XML • • • • •

24 nCode GlyphWorks® 11.0 Specification NC-SP-GW 11.00.027
SoMat 2100 DAT • • •
SoMat SIE • • •
SoMat SIF • • •
Table 13 Histogram Formats
Table 14 Multi-column Formats
Multi-column Read Write Windows 32
Windows 64
Linux 64 Additional Comments
ASCII via ASCIITranslate • • • • •
CSV with header • • • • • Comma, tab or space separated
IPETRONIK TESTdrive CAN
• • • •
Microsoft Excel • • • •
Moog AeroTEST dat, hdr
• • • Suite 2011 Release 2.0 (and above) sin-gle dat file is also supported
nCode s3m • • • • •
Table 15 Video Formats
Video Read Write Windows 32
Windows 64
Linux 64 Additional Comments
Formats supported by Windows Media Player
• • • Not supported on XP 64
SoMat SIE • • •

nCode GlyphWorks® 11.0 Specification 25NC-SP-GW 11.00.027
16 Supported Platforms
nCode 10.0 is supported on the following platforms and operating systems:
Platform O/S Level
Pentium (IA-32) Windows 7
Pentium (IA-64) Windows 7 64-bit, 8.1
Pentium (IA-64) Red Hat Enterprise 6 (Linux)
Pentium (IA-64) Suse Linux 11.1
17 Languages
In addition the default English interface, the following language options are avail-able for GlyphWorks 11.0.
German
French
Japanese
Chinese
Some aspects of the software (such as glyph properties, keywords) remain in English regardless of language setting. Please refer to installation guide for more details. GlyphWorks User Guide is provided in English, French and German.

26 nCode GlyphWorks® 11.0 Specification NC-SP-GW 11.00.027
18 Free Viewer
nCode Viewer is a free to use viewer for time series, histogram, multi-column and complex frequency data using the XY Display, Histogram Display, Table Display, Waterfall Display and XYZ Display. On installing GlyphWorks, the nCode Viewer is associated with nCode data file formats so that data can be double-clicked in Win-dows Explorer to be viewed. Other formats can be associated with nCode Viewer.
A standalone zip of nCode Viewer is also available so that other uses can view nCode data without installing GlyphWorks.
If a valid license of GlyphWorks is not available, the user also has the choice to run GlyphWorks in Free Viewer mode.
In Free Viewer mode, the following glyphs are available for unlimited use:
TSInput
Histogram Input
Multi-column Input
XYDisplay
Histogram Display
Data Values Display
Metadata Display
Copy to clipboard from displays contains watermark.


© HBM United Kingdom Limited. All rights reserved. All details describe our products in general form only. They are not to be understood as express war-ranty and do not constitute any liability whatsoever.
HBM - nCode
26555 Evergreen Road - Suite 700 -Southfield, MI 48076 - USATel. +1 248 350 8300 - Fax: +1 248 350 1678Email: [email protected] - www.ncode.com
measure and predict with confidence