Nationalization, privatization, and the allocation of financial property rights
21
Public Choice 75: 317-337, 1993. © 1993 Kluwer Academic Publishers. Printed in the Netherlands. Nationalization, privatization, and the allocation of financial property rights* JEAN-JACQUES ROSA lnstitut d'Etudes Politiques, 174, Boulevard Saint-Germain, F-75006 Paris Accepted 23 May 1991 1. Introduction All contemporary economies are "mixed" in that the property rights over firms are distributed, however unequally, between private shareholders and the State, 1 whether directly or through State agencies. Relative shares of private and public equity holdings vary substantially across countries and through time. However, this evolution is usually too slow to attract attention, except during so-called "revolutions" that affect political and property systems. The recent worldwide privatization wave, arguably, con- stitutes such a revolution, z Whereas public policies of the 60s and 70s continu- ously extended the scope of public sectors, 3 a reversal in political priorities in the early 80s has led to a significant selling of state assets on financial markets. The new policy was adopted by governments of very different political persua- sion and seems immune to political change.4 The last quarter of the century thus appears to be an era of privatization, whereas the third quarter was characterized by Vernon and Aharoni (1981) as the "public enterprise era." It is all the more puzzling that, as noted by Pryor (1973: 36), "... no one has yet advanced a general positive economic theory of public ownership that can be used for explaining differences in the relative degree of nationalization within and between nations." * Previous versions of this paper have been presented at Simon Fraser University (Spring 1986), AFFI annual meeting (December 1980, International Seminar on Privatization (Tunis, April 1987), OECD Development Center (May 1989), and have been accepted for presentation at the meeting of the European Public Choice Society (Konstanz, i990), and the CIRIEC conference (Lirge, 1991). My thanks go to Michel Picot, Violaine Monod and Olivier Colso~ for excellent research assistance, to John Chant, Steve Easton, Isaac Ehrlich, Ronald Jones and Zane Spindler for help- ful suggestions, to two anonymous referees of the Revue Finance where a part of this work has been published, and to a referee to this Journal for very useful criticism.
-
Upload
sciencespo -
Category
Documents
-
view
0 -
download
0
Transcript of Nationalization, privatization, and the allocation of financial property rights

Public Choice 75: 317-337, 1993. © 1993 Kluwer Academic Publishers. Printed in the Netherlands.
Nationalization, privatization, and the allocation of financial property rights*
JEAN-JACQUES ROSA lnstitut d'Etudes Politiques, 174, Boulevard Saint-Germain, F-75006 Paris
Accepted 23 May 1991
1. Introduction
All contemporary economies are "mixed" in that the property rights over firms are distributed, however unequally, between private shareholders and the State, 1 whether directly or through State agencies.
Relative shares of private and public equity holdings vary substantially across countries and through time. However, this evolution is usually too slow to attract attention, except during so-called "revolutions" that affect political and property systems. The recent worldwide privatization wave, arguably, con- stitutes such a revolution, z Whereas public policies of the 60s and 70s continu- ously extended the scope of public sectors, 3 a reversal in political priorities in the early 80s has led to a significant selling of state assets on financial markets. The new policy was adopted by governments of very different political persua- sion and seems immune to political change. 4
The last quarter of the century thus appears to be an era of privatization, whereas the third quarter was characterized by Vernon and Aharoni (1981) as the "public enterprise era." It is all the more puzzling that, as noted by Pryor (1973: 36), " . . . no one has yet advanced a general positive economic theory of public ownership that can be used for explaining differences in the relative degree of nationalization within and between nations."
* Previous versions of this paper have been presented at Simon Fraser University (Spring 1986), AFFI annual meeting (December 1980, International Seminar on Privatization (Tunis, April 1987), OECD Development Center (May 1989), and have been accepted for presentation at the meeting of the European Public Choice Society (Konstanz, i990), and the CIRIEC conference (Lirge, 1991).
My thanks go to Michel Picot, Violaine Monod and Olivier Colso~ for excellent research assistance, to John Chant, Steve Easton, Isaac Ehrlich, Ronald Jones and Zane Spindler for help- ful suggestions, to two anonymous referees of the Revue Finance where a part of this work has been published, and to a referee to this Journal for very useful criticism.
318
More recently McGuire, Ohsfeldt and Van Cott (1987: 212) made the same observation:
Failing to explain the persistence of public production (rather than govern- ment contracting with private firms) in the face of extensive evidence about the superiority of private sector performance is an important omission in the literature.
• . . To our knowledge, there is no commonly accepted theoretical explana- tion of this question. And no one has empirically investigated the issue.
Neither does the extensive literature on property rights tackle the problem of the personal distribution of these rights (see also Kay and Thompson, 1986; and Furubotn and Pejovich, 1974). As a consequence the extent of the public sector is theoretically indeterminate. 5
My aim in this paper is to propose a positive and general theory of privatiza- tion and nationalization. In other terms, a theory of the scope of the public sec- tor explaining the net movement of shares between private and public inves- tors. This new theory is based on, and integrates, recent explanations of the role of the public firm, public choice theory, analyses of the social costs of tax- ation, and of the cost of capital. It is a financial-fiscal-political theory of the public sector.
The underlying theoretical framework consists of a very general optimiza- tion model of rational government behavior in a political equilibrium setting, with or without franchise. The basic idea is that any government, whether or not a formal democratic constitution exists, tries to maximize political (elector- al) support by redistributing wealth among citizens (voters), according to the intensity of political pressure, as explained by Becker (1983), and according to the opportunity costs of alternative means of raising revenues.
Public firms are one means of raising revenues and distributing or transfer- ring them, alternative to explicit subsidies and tax raising (and/or debt financ- ing), a third way being regulation. Depending on the relative costs of these three different ways of pursuing political advantage, I show how a rational government (whether democratic or not) will extend or restrict the scope of the public sector at the margin.
At any time, the optimal extent of the public sector will be determined by a "property rights equilibrium" between private and public owners of firms'
equity. In this theory, private shareholders and the government compete for the
ownership of firms. Both have an interest in the monopoly rents that these firms obtain from their market power in a monopolisti c competition setting. Private shareholders seek to increase their financial wealth while governments try to improve their political advantage through the distribution of political
319
benefits via state-owned enterprises (SOEs). The cost of capital, however, differs for private agents and for the state, because of the latter's ability to raise taxes.
Given a common expected flow of monopoly rents, the value of a firm will differ for private investors and for the government in so far as the cost of capital differs for the two kinds of agents. This is the mainspring of the theory. The divergent evolution of the determinants of both costs of capital will lead, depending on the circumstances, to nationalization or privatization. Ideology plays no role so far since the government and private agents are equally rational investors.
In the following section, I briefly recall the present state of the debate on public enterprise rationale in an economy with political markets and costly redistribution. In Section 3, I shall turn to the marginal conditions for the op- timal financing of political transfers. These conditions define the property rights equilibrium. In the concluding section the possible ways to submit this theory to empirical verification are explored and some results presented.
2. State-owned enterprises in a theory of political and fiscal equilibrium
There is no rationale for state enterprise in traditional public economics. Obviously, pure Samuelsonian collective goods are the exception rather than the rule. The same is true of natural monopolies. Coase (1974), for instance, has convincingly argued, and provides historical evidence, that the archetype of the public good, the lighthouse, could operate equally well under private ownership. There is also abundant evidence that most firms in the public sector could perform as - or even more - efficiently under private property. 6
Many authors of the Public Choice school have tried to show that, on purely cost-efficiency grounds, private ownership dominates public ownership. The evidence, however, is still controversial, especially when political and other so- cial constraints on public firms are taken into account. Moreover, many firms, in countries with an experience of alternate privatization and nationalization programs, such as France and Great Britain for instance, have been moving from one sector to the other without noticeable differences in performance.
Even more, if the efficiency argument for privatization is strictly true, what then could be the positive explanation for nationalization? And what are the reasons usually suggested to justify the continuing existence, and possible ex- tension, of the public sector?
The specialized literature exhibits long lists of ad hac justifications for state ownership. Pryor (1973) summarizes some of them such as, a) economies of scale, b) external effects, c) m0nopsony or quasi-monopsony position of the public sector vis-ft-vis a single firm, d) the existence of rents in some sectors or
320
firms, and e) the large impact of a particular firm on the sovereignty and in- dependence of the State.
According to Sheperd (1982), determinants of nationalization include also, a) "social preference," b) insufficient private supply, c) the rescuing of lame ducks, d) antitrust policies, e) the will to give employees a say in management, f) external effects, g) defense of the country's sovereignty, and h) the promo- tion of merit goods.
Lewin (1982) compiles an even longer list of such motives, more as a matter of historical record than economic rationale.
All these motives for state ownership could be true. But they do not make for an economic explanation. Rather, they describe likely objectives of a government, or the expected benefits from nationalization. In short, they represent arguments in a postulated State utility function. They do not take into consideration nor explain privatizations either. These motives are no eco- nomic explanations in the sense that they do not trace the nationalization or privatization decision to opportunity costs and relative prices.
A n economic theory of the allocation of financial property rights should link the expected benefits of buying (or selling) assets to the relative costs incurred by governments in pursuing their (mainly redistributive) objectives.
The modern economic theory of politics recognizes that governments op- timize (see Mueller, 1990). They maximize political support under financing constraints. This theory originates from the public choice tradition and the theory of regulation and transfers developed by Posner (1971), Stigler (1971), Peltzman (1976) and Becker (1983). All political activities have to do with redis- tribution of wealth, either as a goal in itself or as by-product of public goods production.
Transfers can be financed by tax (and debt) money, through regulation, or by the management of cross-subsidies via state-owned firms. In so far as they are not constrained by stock market discipline and competition to make profits, public enterprises can easily cross-subsidize various categories of cus- tomers through price discrimination. It is especially easy when they possess market power, as they often do.
All the nationalization objectives listed above, however, could be reached as well by regulations or explicit monetary subsidies. This conclusion is empha- sized by Borcherding (1983) in his extensive survey of public sector supply ar- rangements.
It follows that the rationale for nationalization is to be found in the basic business of politics, the transfer motive. 7 In this perspective, the rational government decides to expand the public sector when the benefit/cost ratio of transfers managed through public firms exceeds that of transfers through cur- rent taxes-subsidies, or of regulations. The public demand for private firm
321
equity will increase when the opportunity cost of taxes and regulation in- creases. And vice versa.
Proceeding from a similar perspective, Borcherding 0983) attempts to clas- sify these costs into three categories: a) Monitoring costs. They differ between a public enterprise, a regulated private firm, and a private firm selling to a government; b) Financial costs. They are not the same for a public firm, a procurement contract, and the financing of a regulatory bureaucracy; c) Transaction costs.
Borcherding (1983), as well as McGuire, Ohsfeldt and Van Cott (1987), try to determine in which cases each method should be chosen. For instance, regu- lation should be used when the number of target groups is small, while explicit subsidies with private procurement would be the rule when transfers benefit a large number of people and command ample political support.
Such conclusions are interesting but give a "permanent," "once and for all," o r ' 'structural" explanation of the relative use of different redistribution financing methods, as a function of their basic characteristics. This analysis thus cannot explain reversion between nationalization and privatization poli- cies within short-term or medium-term time periods. On the contrary, in what follows I shall put the emphasis on compared financial costs that can sharply fluctuate in the short run and thus explain opinion and policy reversals without recourse to unexplained ideology fluctuations, or once and for all "learning" of the best institutional solution.
3. An optimum allocation theory of financial property rights
In order to finance current transfers the government must rely on taxes today or taxes tomorrow, s These resources can be used for transfers in any one of three ways: directly subsidizing beneficiaries, paying civil servants managing regulatory bureaucracies, or buying the equity capital of private firms to cross- subsidize different categories of customers.
Of course the political profits to be reaped by each method are not neces- sarily equal. Cash subsidies are transparent. They entail management expenses, but one dollar given is one dollar received. On the other hand, their cost is also politically transparent - and thus high - for favored pressure groups, as non- beneficiaries can readily detect these subsidies and try accordingly to get them repealed.
Regulations costs are more difficult to evaluate. Existing literature empha- sizes management costs and economic distortion costs (welfare losses). How- ever, they are difficult to assess and, due to imperfect information, regulation often appears "costless" on the political market.
State firms provide a convenient and not-too-obvious means of operating
322
transfers between political clienteles of customers. This "political" cash flow of SOEs can replace explicit taxes and subsidies. Its cost for the State is that of buying a private firm (preferably 100°70 of it, which is costly and politically highly visible), or of keeping in the public sector a firm's equity that could be sold in the capital market. Once bought, however, the SOE's flow of transfers can be used as long as the firm is kept in the public sector.
The amount of transfers depends on the extent of the public sector, and the amount of consumers' surplus reaped by each public firm, which is a function of the price (and income) elasticities of the demand. When the firm has strong monopoly power the State can, "h la Niskanen," confiscate the whole con- sumer surplus. In an interest group equilibrium perspective, however, instead of using it exclusively to maximize the size of the bureaucracy, it should chan- nel it toward several political "clienteles" (including bureaucrats themselves) by price discrimination (see Orzechowski's (1977) critique of Niskanen).
Nevertheless, we assume for simplicity that the political benefits of these different transfer techniques are equal. One dollar of transfer is one dollar is one dollar, irrespective of the method chosen. A less stringent hypothesis is that differential benefits between the three techniques are stable through time, thus giving no explanation of the changing structure of government redistribution 'instruments.
Along these lines, a simplified theory of the instrumental choice is described i n the following section, conditional on some assumptions derived from recent analysis and knowledge.
3.1. Assumptions
1. Governments optimize, in the political market, the distribution of taxes (or quasi-taxes like social security premiums) and benefits, in order to maximize political support or reelection probability (depending on the political regime because the analysis is also valid for non-democratic political systems).
Given such an optimal outcome we do not need to explicitly model it and can limit ourselves to comparing the costs of alternative methods of raising revenues for redistribution at the relevant margins.
2. In order to simplify the analysis and because of the difficulty of evaluating the benefits and costs of regulation, ! shall limit the comparison to two o f the three methods for redistributing revenues: cash subsidies and subsidies through the operations of state firms. As I show later, it is possible to pre- cisely compare the cost of one dollar of budget subsidy and the cost of one dollar of public firm transfer. It is not yet possible, however, to do so for the costs of regulations.
3. All firms have some market power.
323
4. The political cost o f taxes to the government is measured by the marginal
social cost o f these taxes. Macroeconomic estimates of the tax burden have been calculated for the United States and Sweden by Browning (1976, 1987) and Stuart (1984). Voters are supposed to value equally one dollar of cash subsidy and one dollar of surplus lost through the marginal deadweight losses.
5. We consider an economy without risk. The oppo~unity cost of borrowed capital is the rate of interest. This rate is the same for private borrowers and for the State. It is identical for equity and bonds. Absent inflation in the model, the nominal rate is equal to the real rate.
6. Capital markets are open and competitive. Private investors and the State compete at every moment for the equity capital of firms.
Given the above assumptions, the problem of the State regarding nationaliza- tion or privatization is embedded in a wider one, the simultaneous choice of its political activity level and instrument use: how far to develop transfers be- tween voters and how to finance them through the substitutable means of taxa- tion and state firms ownership.
As usual in general equilibrium problems, it is possible to consider only "local" marginal conditions, when all other equilibrium conditions are met on all margins. We thus assume that equilibrium of demand and supply of trans- fers obtains in the political market, and we concentrate the analysis on the op- timal extent of the public sector, given the amount of taxes and debt already chosen by the government (which is determined by the underlying political equilibrium).
3.2. States as asset market operators
The optimal extent of the public sector is thus determined ha the capital market, the market for firms' equity. It is often incorrectly assumed, that a government can freely increase the size of the public sector, without incurring a cost as far as nationalization without adequate compensation is possible. Even if this were the case, the state as asset holder is inevitably confronted with the opportunity cost of detaining equity, that is the return foregone on alternative assets such as bonds (domestic or foreign), land, gold, and others depending on their yields. It follows that, even if the initial taking of firms were for free, it does not imply that the state should keep the ownership of nationalized firms. It could be preferable to arbitrage for other assets yielding higher returns.
Moreover, in open economies shareholders cannot be spoliated without capi- tal outflows imposing substantial costs to the country and the government. In that case we assume that a"valuepari ty condition" prevails. The public buyer

324
must pay the same price for the control of the firm as the private investor. Under both circumstances the government, as a potential operator in asset
markets, has to compare the expected return, and thus the present value of the SOE, to its resale value on the equity market, that is the value of the SOE to private investors.
Nevertheless, even if its price should be the same for both parties in a perfect capital market, the value of the firm is different to each, both because of differ- ences in the benefits that government and private owners can extract and be- cause of differences the cost of capital of government and of private investors .9
The cost of capital, for the State, is the weighted average of the social cost of taxes and the cost of borrowed funds, in the same way as the cost of capital of the firm in finance theory is the weighted average of the costs of equity and debt capital. In our theory, however, equity and debt are not distinct, so the private cost of capital is simply the interest rate. The cost of tax capital for the State is the marginal social cost of taxes.
The marginal social cost of taxes is measured by increases of the Harberger triangles. Since these costs grow more rapidly than tax rates, there is a finite demand for transfers when individual voters are rational (Becker, 1983), exact- ly as there is in general a finite demand for borrowing in capital markets due to the rising cost of debt.
Discounting the firm's profits by the interest rate gives the value of the firm for private investors, while discounting the profits (or the consumer's surplus in the extreme case of government as a discriminating monopolist) by the weighted average of the marginal social cost of taxes and the interest rate, gives the value of the same firm for the State. The highest of both values gives the identity of the winner in this auction, which results in the nationalization or privatization of the firm.
3.3. Absence o f corner equilibrium
So far, our analysis is quite general. Relying on macroeconomic determinants or public/private bidding behavior, it gives a yes or no answer to the question which firms should be privatized and which nationalized. How can we explain, then, that we do not observe totally private or totally public economies in the real world?
A first reason, at the aggregate level, is that the exchange of shares will pro- ceed up to a limit when the buying and selling of smaller and smaller firms in- volves transaction costs that become "tOO expensive" relative to expected benefits for the State (political advantage reaped by increased transfer capaci- ty), due to fixed acquisition and liquidation costs. This supposes that the State buys (or sells) big firms first. Not an unreasonable behavior when "big" firms have more market power.
325
Moreover, when selling public firms, the State is going to use receipts to reduce public debt and/or cut taxes. In the process the social marginal cost of taxes and the financial structure of the budget are altered, thus affecting the "property rights equilibrium condition" as stated below.
On the other hand, when selling their shares to the State, private equity holders face an excess liquidity inducing them to buy other assets until their prices are boosted and their returns depressed relative to share prices and returns. The structure of assets' returns thus creates a limit to the total amount of shares sold by private investors. And vice versa when the State is selling and private investors buying.
There is also, as hinted above, a ranking of firms (independent of sheer size) by a decreasing order of desirability for nationalization purposes (and reversely for privatization). This ranking should rest upon the ratio of "transfer capaci- ty" to profit.
In particular, according to the shape of the demand curve, the ratio of profit to consumer surplus differs between firms. Thus the ratio of private to public value of firms also differs across firms and industries.
The marginal firm for which property could be equivalently public or private is then defined by its demand function, the prevailing interest rate, and the marginal social cost of taxes. Moreover, since all these parameters fluctuate substantially with growth and business cycles, the optimal frontier of the public sector will keep changing through time.
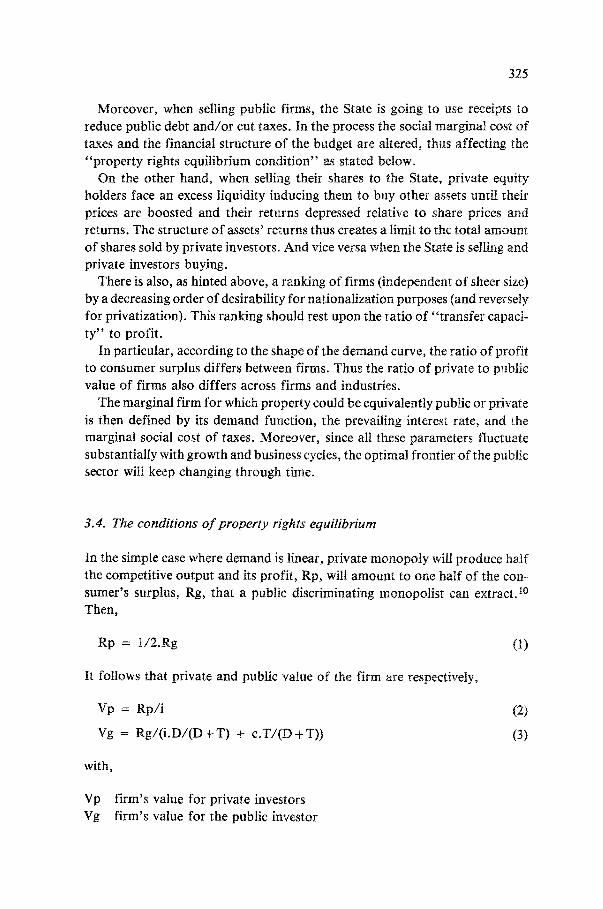
3.4. The conditions of property rights equilibrium
In the simple case where demand is linear, private monopoly will produce half the competitive output and its profit, Rp, will amount to one half of the con- sumer's surplus, Rg, that a public discriminating monopolist can extract, t° Then,
Rp = 1 / 2 . g g (1)
It follows that private and public value of the firm are respectively,
Vp = Rp/i
Vg = Rg/(i.D/(D+T) + c.T/(D+T))
(2)
(3)
with,
Vp firm's value for private investors Vg firm's value for the public investor

326
i interest rate c marginal social cost of taxes D public debt T total tax revenues
The value parity condition states that,
Vg = Vp (5)
It follows that,
c = (1 + 1/a).i (6)
with a = T/(D + T) the " tax ratio."
Equation (6) defines the property equilibrium condition. When the property equilibrium condition is valid, there is no movement of
privatization or nationalization. On the other hand, if
c < (1 + 1/a).i Vg > Vp which leads to nationalization.
and if,
c = ( l + l / a ) . i Vg < Vp which leads to privatization.
We thus end up with a macroeconomic theory of the allocation of financial property rights between public and private agents since the relevant explana- tory variables are at the macro level, i.e., interest rates, public debt, and aggregate marginal social cost of taxes.
This new theory generates some conditional predictions of privatization- nationalization movements, depending on the fluctuations of the three exo- geneous variables above.
1. A modification of interest rate levels, given the government's financial structure, alters the optimal pubhc-private mix.
2. Increased marginal social cost of taxes, given interest rates and financial structure, leads to privatization.
3. Changed financial structure alters the equilibrium allocation of property rights.
This can happen, for instance, when exceptional public spending is
327
needed, as in war. Barro (1979) shows that the government chooses debt over taxes to minimize tax distortions, that is the marginal social cost of taxes.
4. Changes in the allocation of property rights come in "waves" or " fads ," because of their macroeconomic determinants.
5. These changes affect primarily industries and firms detaining market power. An allocation reversal will always affect the same firms, in both directions.
These implications of the model lend some rationality to apparently irrational transfers of firms from the public to the private sectors, and back again. They also show that the scope of the public sector should vary from country to coun- try and through time, according to the changing efficiency of fiscal structures, the evolving financial structure of the government budget, and to interest rates tevel changes. The model should thus explain a vast array of observable phenomena.
Is this theory empirically testable? The implications of the model derive directly from the property rights equilibrium condition. The exact derivation of some of them, in the simplified case of linear demand schedules and homogeneous firms, is as follows:
A movement of privatization or nationalization, or in other terms a displace- ment of the public-private frontier, will take place each time the property equilibrium condition is violated, that is, whenever Vp > Vg or Vg > Vp. Thus a displacement of the private-public limit is linked to the movement of the Vp/Vg ratio.
When Vp/Vg > 1, a privatization movement will occur. When Vp/Vg < 1, a nationalization movement will occur.
In order to link these movements to the evolution of economic variables through the property equilibrium condition, let us develop its expression as a Taylor series around the equilibrium point.
The public sector frontier is defined by:
Vp/Vg = [i - a ( i - c)]/[2i]
then, around the unit value:
Vp/Vg = 1 + da .1/2(c / i - 1) + d i . ( - I/2.ac/i 2) + dc. 1/2(a/i) + e
(7)
From (7) the signs of influence of the economic variables on privatizafion or nationalization are obvious.
328
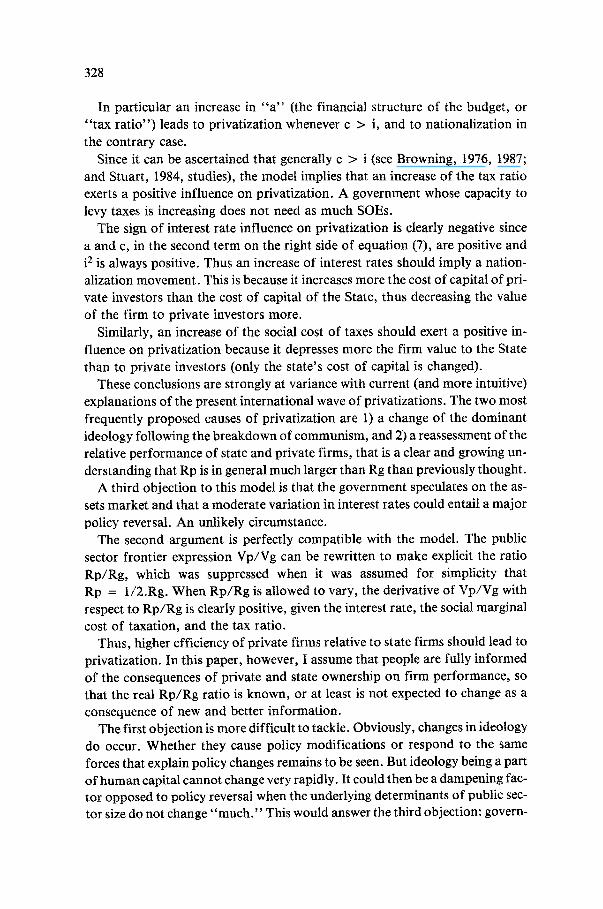
In particular an increase in " a " (the financial structure of the budget, or " tax ra t io") leads to privatization whenever c > i, and to nationalization in the contrary case.
Since it can be ascertained that generally c > i (see Browning, 1976, 1987; and Stuart, 1984, studies), the model implies that an increase of the tax ratio exerts a positive influence on privatization. A government whose capacity to levy taxes is increasing does not need as much SOEs.
The sign of interest rate influence on privatization is clearly negative since a and c, in the second term on the right side of equation (7), are positive and i 2 is always positive. Thus an increase of interest rates should imply a nation- alization movement. This is because it increases more the cost of capital of pri- vate investors than the cost of capital of the State, thus decreasing the value of the firm to private investors more.
Similarly, an increase of the social cost of taxes should exert a positive in- fluence on privatization because it depresses more the firm value to the State than to private investors (only the state's cost of capital is changed).
These conclusions are strongly at variance with current (and more intuitive) explanations of the present international wave of privatizations. The two most frequently proposed causes of privatization are 1) a change of the dominant ideology following the breakdown of communism, and 2) a reassessment of the relative performance of state and private firms, that is a clear and growing un- derstanding that Rp is in general much larger than Rg than previously thought.
A third objection to this model is that the government speculates on the as- sets market and that a moderate variation in interest rates could entail a major
policy reversal. An unlikely circumstance. The second argument is perfectly compatible with the model. The public
sector frontier expression Vp/Vg can be rewritten to make explicit the ratio Rp/Rg, which was suppressed when it was assumed for simplicity that Rp = 1/2.Rg. When Rp/Rg is allowed to vary, the derivative of Vp/Vg with respect to Rp/Rg is clearly positive, given the interest rate, the social marginal
cost of taxation, and the tax ratio. Thus, higher efficiency of private firms relative to state firms should lead to
privatization. In this paper, however, I assume that people are fully informed of the consequences of private and state ownership on firm performance, so that the real Rp/Rg ratio is known, or at least is not expected to change as a consequence of new and better information.
The first objection is more difficult to tackle. Obviously, changes in ideology do occur. Whether they cause policy modifications or respond to the same forces that explain policy changes remains to be seen. But ideology being a part of human capital cannot change very rapidly. It could then be a dampening fac- tor opposed to policy reversal when the underlying determinants of public sec- tor size do not change" much ." This would answer the third objection: govern-
329
merits do not change the extent of the public sector with each and every fluctua- tion in interest rates and social cost of taxes. The changes should be sufficient (and permanent in a multiperiodic framework) to compensate the ideological inertia.
The present model can be extended to incorporate such factors. But first, some empirical testing of the simpler version should be tried in order to under- stand if a more complete model is necessary.
4. Empirical evidence
The simple model of equation (7) lends itself to a straightforward empirical verification. Some difficulties arise, however, in data collection. Overall series on nationalization and privatization are not readily available, and even data on the size of public sectors are scarce. On the other hand, measures of the ag- gregate marginal social cost of taxes for different countries over long periods of time simply do not exist.
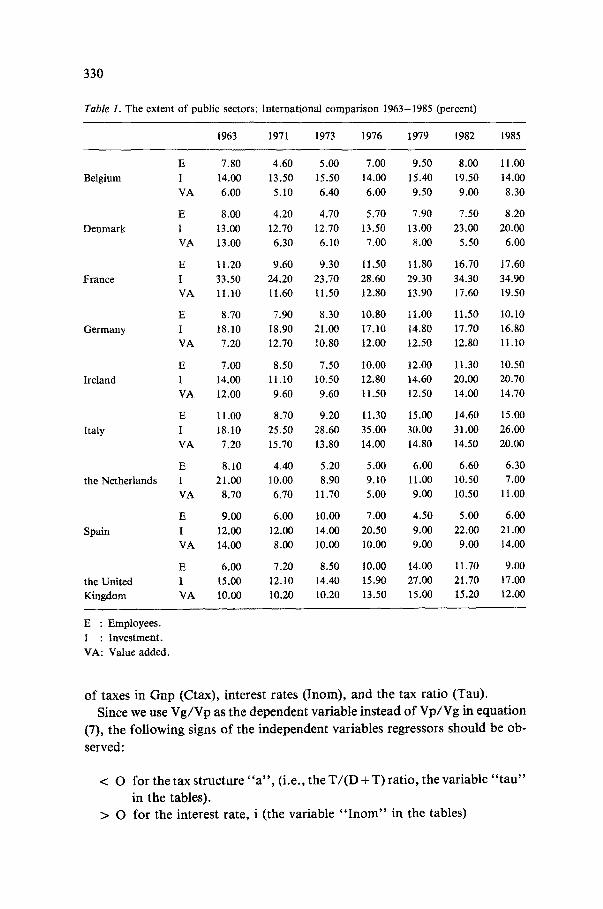
Nevertheless, empirical tests can be devised as long as we use proxies for these two variables in pooled cross-section and times series regressions in order to get a sufficient number of observations. Indeed, there are some comparable data on the extent of the public sectors in a few European countries for various years between 1963 and 1985, collected by t h e " Centre europ6en des entreprises publiques", i1 They are available for nine countries (Belgium, Denmark, Eire, France, Germany, Italy, the Netherlands, Spain, and the United Kingdom) and seven years (1963, 1971, 1973, 1976, 1979, 1982, 1985).
The size of public sectors is measured by the number of employees, level of investment, and value added. These measures are presented in Table 1, as a percentage of the same variables for the economy as a whole.
In cross-section regression we consider that differences in the extent of the public sector are the equivalent of movements of privatization or nationaliza- tion within a single country through time. This is an even better way to test the model than on time series since the complex tags between changes in Vp/Vg and effective policy decisions do not enter the picture in cross-section.
Regarding the measurement of the social marginal cost of taxes, since there is a monotonic, although non-linear, relationship between tax rates and social welfare losses, we simply choose the overall tax rate (Taxes/GNP) as a proxy for the unavailable marginal social cost of taxation. Higher tax rates determine higher marginal welfare losses. But this should introduce a non-linearity in the regression equation, while the basic theoretical relation in equation (7) is linear in welfare losses.
Given these assumptions we regress the three measures of public sector shares for various countries at different dates (a proxy for Vg/Vp) on the share
330
Table 1. The extent of public sectors: International comparison 1963-1985 (percent)
1963 1971 1973 1976 1979 1982 1985
E 7.80 4.60 5.00 7.00 9.50 8.00 11.00 Belgium I 14.00 13,50 15.50 14.00 15.40 19.50 14.00
VA 6.00 5.10 6.40 6.00 9.50 9.00 8.30
E 8.00 4.20 4.70 5.70 7.90 7.50 8.20 Denmark I 13.00 12.70 12.70 13.50 13.00 23.00 20.00
VA 13.00 6.30 6.10 7.00 8.00 5.50 6.00
E 11.20 9.60 9.30 11.50 1 t .80 16.70 17.60 France I 33.50 24.20 23.70 28.60 29.30 34.30 34,90
VA 11,10 11.60 11.50 12.80 13.90 17.60 19.50
E 8.70 7,90 8.30 10.80 1 1 . 0 0 11.50 I0.10 Germany I 18.10 18.90 21,00 17.t0 14.80 17.70 16.80
VA 7,20 12,70 10.80 12.00 12.50 12.80 11.10
E 7.00 8.50 7.50 10.00 12.00 tt.30 t0.50 Ireland I 14.00 11.10 10.50 12.80 14.60 20.00 20.70
VA 12,00 9.60 9.60 11.50 12.50 14.00 14.70
E 11,00 8.70 9.20 11.30 15.00 14.60 15.00 Italy 1 18,10 25,50 28.60 35.00 30.00 31.00 26.00
VA 7,20 15.70 13.80 14.00 14.80 14.50 20.00
E 8,10 4.40 5.20 5.00 6.00 6.60 6.30 the Netherlands I 21.00 10.00 8.90 9.10 11.00 10.50 7.00
VA 8.70 6.70 11.70 5.00 9.00 10.50 11.00
E 9.00 6.00 10.00 7.00 4.50 5.00 6.00 Spain I 12.00 12,00 14.00 20.50 9.00 22.00 21.00
VA 14.00 8.00 10.00 10.00 9.00 9.00 14.00
E 6,00 7.20 8.50 10.00 14.00 11.70 9.00 the United 1 15,00 12.10 14.40 15.90 27.00 21.70 17.00 Kingdom VA 10.00 10.20 10.20 13.50 15,00 15.20 12.00
E : Employees. I : Investment. VA: Value added.
of taxes in Gnp (Ctax), interest rates (Inorn), and the tax ratio (Tau). Since we use Vg/Vp as the dependent variable instead of Vp/Vg in equation
(7), the following signs of the independent variables regressors should be ob- served:
< O for the tax structure " a " , (i.e., the T/(D + T) ratio, the variable " tau" in the tables).
> O for the interest rate, i (the variable " Inom" in the tables)
331
< 0 for the proxy of the marginal social cost of taxes, " c " (i.e., the Taxes/GNP ratio, the variable "Ctax" in the tables).
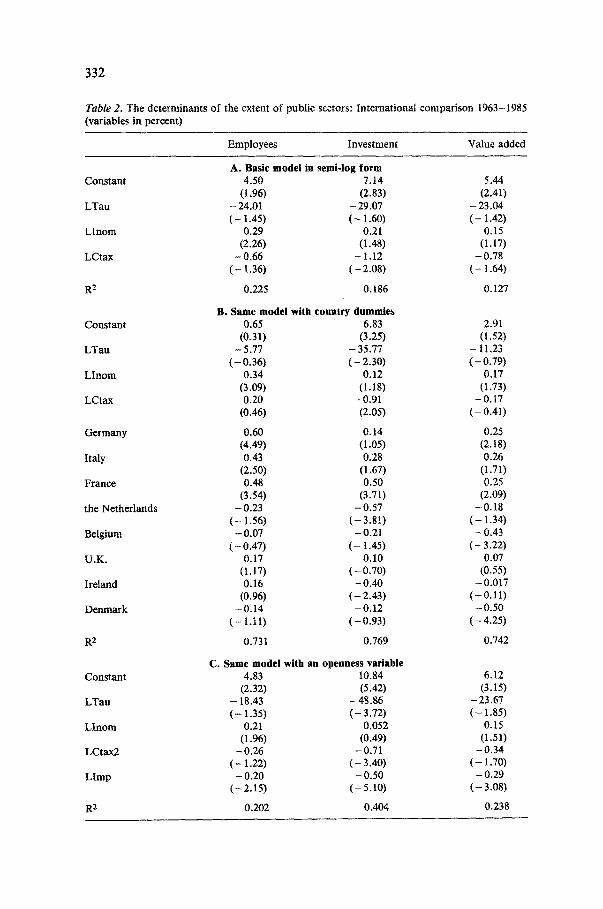
Various specifications of equation (7) have been tested, in "levels" of the vari- ables (percentage points), in logs, semi-logs, and first differences. Some of the results are presented in Tables 2, 3 and 4. But all of them present the same general characteristics of coefficient signs and statistical significance.
Regressions on variables in levels are presented in Table 2. Specifications in- clude the basic model in which the three measures of the public sector share are regressed on the explicit independent variables of the model (Tau, Inom, Ctax). Country dummies are introduced to express other possible influences not taken into account in the model. One of these influences could be the degree of openness of the economy (measured by the import to gnp ratio, Imp) as far as it is linked to the average degree of market power of firms. In a widely open economy firms are supposed to detain less market power, thus constitut- ing a less desirable target for nationalization, other things equal. As a conse- quence, we expect a negative correlation between openness and the share of the public sector.
Interestingly this is what appears from the results, and, moreover, the open- ness variable seems to be a substitute for the country dummies. This could mean that the industrial structure (a"structural" factor) explains intercountry ("structural") differences in public sector shares, that do not depend on the explicit model variables (interest rates, tax ratio and tax rates).
The signs are almost always right, and more significant in semi-log or log-log regressions. The open economy variable (Imp) does improve substantially the fit.
Attempts are made to better model the non-linearities theoretically present in the marginal social cost of taxes variable, both through the use of logs and the squared expression Ctax 2.
The general conclusion to be drawn from Table 2 is that the model is not refuted by the data. Signs are as theoretically expected, although regression coefficients are not always significantly different from zero. Given the better fit obtained with specifications in logs and with the squared expression of Ctax, it is quite possible that some of the results weaknesses are due to mismeasure- ment of the marginal social cost of taxes.
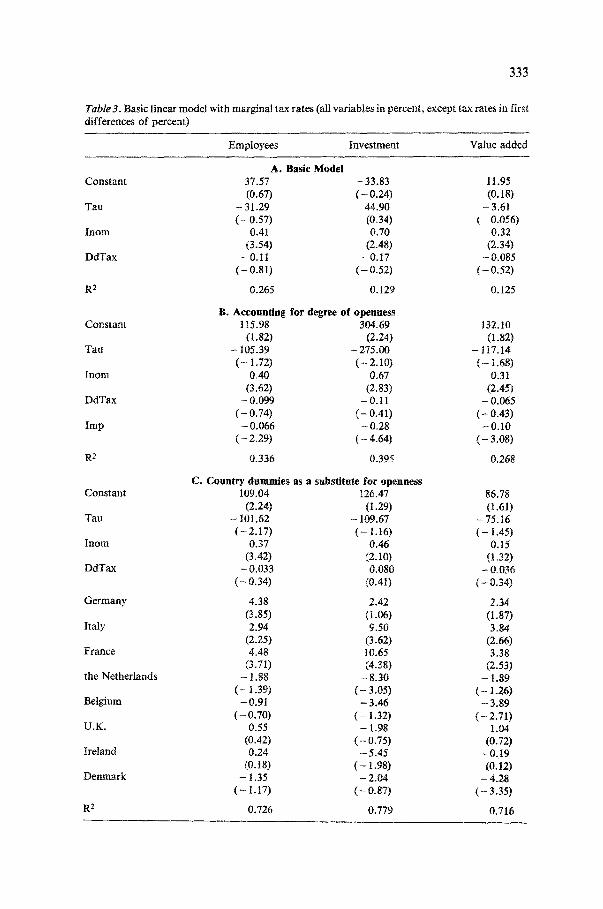
To alleviate this difficulty, regressions with all variables in levels, but with the tax rate in first differences, are presented in Table 3. The best results obtain when the degree of openness is also included (Table 3-B).
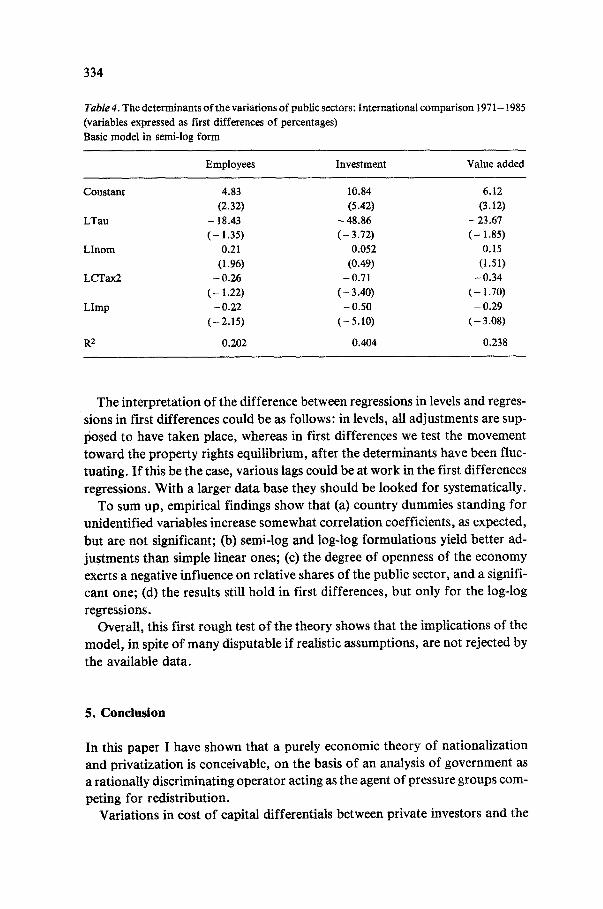
Lastly, regressions with all variables in first differences are presented. As usual the explanatory power (measured by Ras) is lowered, but coefficients re- tain the right signs. They do not however significantly differ from zero, except in semi-log form (Table 4).
332
Table 2. The determinants o f the extent o f public sectors: International comparison 1963-1985 (variables in percent)
Employees Investment Value added
Constant
LTan
L l n o m
LCtax
R2
Constant
L T a u
L l n o m
LCtax
Germany
Italy
France
the Netherlands
Belgium
U.K.
Ireland
Denmark
R 2
Constant
L T a u
L l n o m
LCtax2
L i m p
R 2
A . Basic model in semi-log form 4.50 7.14 5.44
(t .96) (2.83) (2.41) - 24.01 - 29.07 - 23.04 ( - 1.45) ( - 1.60) ( - 1.42)
0.29 0.21 0.15 (2.26) (1.48) (1.17)
- 0.66 - 1.12 - 0.78 ( - 1.36) ( - 2.08) ( - t .64)
0.225 0.186 0.127
B. Same model with country dummies 0.65 6.83 2.91
(0.31) (3.25) (1.52) - 5.77 - 35.77 - 11.23
( - 0.36) ( - 2.30) ( - 0.79) 0.34 0.12 0.17
(3.09) (1.18) (1.73) 0.20 - 0.91 - 0.17
(0.46) (2.05) ( - 0.41)
0.60 0.14 0.25 (4.49) (1.05) (2.18) 0.43 0.28 0.26
(2.50) (1.67) (1.71) 0.48 0.50 0.25
(3.54) (3.71) (2.09) - 0 . 2 3 - 0 . 5 7 - 0 . 1 8
( - 1.56) ( - 3.81) ( - 1.34) - 0.07 - 0.21 - 0.43
( - 0.47) ( - 1.45) ( - 3.22) 0.17 0.10 0.07
(1.17) ( - 0 . 7 0 ) (0.55) 0.16 - 0 . 4 0 - 0 . 0 1 7
(0.96) ( - 2.43) ( - 0.11) - 0 . 1 4 - 0 . 1 2 - 0 . 5 0
( - 1.11) ( - 0 . 9 3 ) ( - 4 . 2 5 )
0.731 0.769 0.742
C. Same model with an openness variable 4.83 10.84 6.12
(2.32) (5.42) (3.15) - 18.43 - 4 8 . 8 6 - 2 3 . 6 7 ( - 1.35) ( - 3.72) ( - 1.85)
0.2t 0.052 0. t5 (1.96) (0.49) (1.51)
- 0 . 2 6 - 0 . 7 1 - 0 . 3 4 ( - 1.22) ( - 3.40) ( - 1.70)
- 0.20 - 0.50 - 0.29 ( - 2 . 1 5 ) ( - 5 . 1 0 ) ( - 3 . 0 8 )
0.202 0.404 0.238
333
Table 3. Basic linear model with marginal tax rates (all variables in percent, except tax rates in first differences of percent)
Employees Investment Value added
Constant
Tau
Inom
DdTax
R 2
Constant
Tau
Inom
DdTax
Imp
R2
Constant
Tau
Inom
DdTax
Germany
Italy
France
the Netherlands
Belgium
U.K.
Ireland
Denmark
R 2
A . Bas i c M o d e l
37.57 - 33.83 11.95 (0.67) ( - 0.24) (0.18)
- 31.29 44.90 - 3.61 ( - 0.57) (0.34) ( - 0.056)
0.41 0.70 0.32 (3.54) (2.48) (2.34)
-0 .11 - 0 . i 7 -0 .085 ( - 0 . 8 i ) ( - 0 .52 ) ( - 0.52)
0.265 0.129 0.125
B. A c c o u n t i n g f o r d e g r e e o f o p e n n e s s
115.98 304.69 132.10 (I .82) (2.24) (1.82)
- 105.39 -275.00 - 117.14 ( - t.72) ( - 2 . 10 ) ( - 1.68)
0.40 0.67 0.31 (3.62) (2.83) (2.45)
- 0.099 - 0.11 - 0.065 ( - 0.74) ( - 0.41) ( - 0.43)
- 0.066 - 0.28 - O. 10 ( - 2.29) ( - 4.64) ( - 3.08)
0.336 0.395 0.268
C. C o u n t r y d u m m i e s as a subs t i tu te f o r o p e n n e s s
109.04 126.47 86.78 (2.24) (I .29) (1.61)
- 101.62 - 109.67 -75.16 ( - 2 . 1 7 ) ( - 1.16) ( - 1.45)
0.37 0.46 0.15 (3.42) (2.10) (1.32)
- 0.033 0.080 - 0.036 ( - 0.34) (0.41) ( - 0.34)
4.38 2.42 2.34 (3.85) (1.06) (1.87) 2.94 9.50 3.84
(2.25) (3.62) (2.66) 4.48 t0.65 3.38
(3.71) (4.38) (2.53) - 1.88 - 8 . 3 0 - 1.89
( - 1.39) ( - 3.05) ( - 1.26) - 0 .91 - 3 .46 - 3 .89
( - 0.70) ( - 1.32) ( - 2.71) 0.55 - 1.98 1.04
(0.42) ( - 0.75) (0.72) 0.24 -5 .45 -0 .19
(0.18) ( - 1.98) (0.12) - 1.35 - 2.04 - 4.28
( - t.17) ( - 0 . 87 ) ( - 3.35)
0.726 0.779 0.716
334
Table 4. The d e t e r m i n a n t s o f the va r i a t i ons o f publ ic sectors : I n t e rna t i ona l c o m p a r i s o n 1971-1985
(var iab les expressed as f irst d i f fe rences o f percentages)
Basic model in semi-log form
E m p l o y e e s Inves tmen t Va lue a d d e d
C o n s t a n t 4.83 10.84 6.12
(2.32) (5.42) (3.12)
L T a u - 18.43 - 48.86 - 23.67
( - 1.35) ( - 3.72) ( - 1.85)
L I n o m 0.21 0.052 0.15
(1.96) (0.49) (1.51)
L C T a x 2 - 0.26 - 0.71 - 0.34
( - 1.22) ( - 3.40) ( - 1.70)
L i m p - 0.22 - 0.50 - 0.29
( - 2.15) ( - 5.10) ( - 3.08)
R 2 0.202 0.404 0.238
The interpretation of the difference between regressions in levels and regres- sions in first differences could be as follows: in levels, all adjustments are sup- 15osed to have taken place, whereas in first differences we test the movement toward the property rights equilibrium, after the determinants have been fluc- tuating. If this be the case, various lags could be at work in the first differences regressions. With a larger data base they should be looked for systematically.
To sum up, empirical findings show that (a) country dummies standing for unidentified variables increase somewhat correlation coefficients, as expected, but are not significant; (b) semi-log and log-log formulations yield better ad- justments than simple linear ones; (c) the degree of openness of the economy exerts a negative influence on relative shares of the public sector, and a signifi- cant one; (d) the results still hold in first differences, but only for the log-log regressions.
Overall, this first rough test of the theory shows that the implications of the model, in spite of many disputable if realistic assumptions, are not rejected by the available data.
5. Conclusion
In this paper I have shown that a purely economic theory of nationalization and privatization is conceivable, on the basis of an analysis of government as a rationally discriminating operator acting as the agent of pressure groups com- peting for redistribution.
Variations in cost of capital differentials between private investors and the
335
state (essentially due to the existence of taxation) explain alternate policies of taking over privately owned corporations and divesting from state enterprises (SOEs).
Some initial empirical results are encouraging. Consequently I cannot reject the hypothesis that, through nationalization and privatization episodes, politi- cians, after all, do behave according to economic rationalffy.
Notes
1. For a summary description see Pryor (1973: Ch. 2) and (1985: especially Ch. 9); and Short (1984).
2. Leading economists to wonder about "sources of government growth." See Borcherding 1977. 3. Balassa (1987) notes that there are no indications that socialists intend to reverse recent privati-
zations, either in Great Britain or in France. Similarly, the socialist government of Australia decided to privatize 30% of the Australian Industry Development Corporation (AIDC), (Financial Times, 17 August 1988), while Mikael Gorbachev reintroduced some private property of means of production in USSR when he decided to lease the land to private agricul- tural producers for periods of up to 50 years.
4. There is no overall description of privatizations in the world economy to date, but see Hanke (1987), Balassa (1987), Berg and Shirley (1987), and Hemming and Mansoor (1988). See also Parris, Pestieau and Saynor (1987: 14): who write: " . . . the development of public enterprise in Western Europe cannot be related to any single political philosophy consistently applied, and in fact turns out to be a haphazard affair, with a variety of motives involved. However, in examining these motives the role of political movements should certainly not be ignored."
5. As evidenced by Mueller's (1990) text. See also the survey by Kay and Thompson (1986), as well as the Yarrow (1986) study and the Vickers and Yarrow (1988) monograph.
6. Van Doel (1979) traces that idea to more distant predecessors, namely Walras (1896), Wagner (1883), and Pigour (1920, 1932).
7. Gallais-Hamonno (1978) and Lafay (t985) also suggest a redistributive rationale for the exis- tence of public firms. They fail however to explain why income redistribution implies public ownership, since regulation of private firms can produce transfers as well.
8. In the present model the ricardian equivalence problem is not introduced. Whether or not con- sumers consider debt and taxes as equivalent is irrelevant for our purpose. We do obselve that governments opt for a mix of debt issues and taxes to finance public expenditures. We take this mix as given in the analysis. The ratio of taxes to total government spending, the tax ratio " a ' , is deemed exogeneous in what follows.
9. According to Aliber (1970), foreign direct investment results from differences in domestic and foreign investors evaluations of a local firm, due to cost of capital differentials. Such an expla- nation follows from the general principle that markets allocate resources to the agents that value them most. I suggest here that the same principle applies to the competition for the use of a firm's cashflow between a political market operator (the Government) and private market investors.
10. No change in the conclusions occur when it is assumed that the government cannot perfectly discriminate between consumers. In that case the public owner gets the usual monopoly profit Rp and not the complete consumer surplus Rg. Both numerators in the property equilibrium condition are then identical.
11. These data have been published in Annales du Centre Europden des Entreprises Publiques (1976, 1978, 1981, 1984, 1987).

336
References
Aliber, R.Z. (1970). A theory of foreign direct investment. In C.P. Kindleberger (Ed.), The inter- national corporation. Cambridge: MIT Press.
Balassa, B. (1987, May). Public enterprise in developing countries: Issues in privatization. Washington: World Bank Discussion Paper.
Barro, R.J. (1979). On the determination of the public debL Journal o f Political Economy 87 (October): 940-971.
Becket, G.S. (1983). A theory of competition among pressure groups for political influence. Quarterly Journal o f Economics 98 (August): 371-400.
Berg, E. and Shirley, M.M. (1987, June). Divestiture in developing countries. Washington: World Bank Discussion Paper.
Borcherding, T.E. (Ed.) (1977). Budgets and bureaucrats: The sources of government growth. Durham: Duke University Press.
Borcherding, T.E. (1983). Toward a positive theory of public sector supply arrangements. In J.R.S. Pritehard (Ed.), Crown corporations in Canada: The calculus o f instrument choice. Toronto: Butterworths.
Browning, E.K. (1976). The marginal cost of public funds. Journal of Political Economy 84 (April): 283-298.
Browning, E.K. (1987). On the marginal wdfare cost of taxation. American Economic Review 77 (March): 1t-23.
Coase, R.H. (1974). The lighthouse in economics. Journal o f L a w and Economics 17 (October): 357-376.
Van Den Doel, H. (1979). Democracy and welfare economics. Cambridge: Cambridge University Press.
Floyd, R.H., Gray, C.S. and Short, R.P. (1984). Public enterprise in mixed economies: Some macroeconomic aspects. Washington: International Monetary Fund.
Furubotn, E. and Pejovich, S. (Eds.) (1974). The economics o f property rights. Cambridge: Ballinger.
Gallais-Hamonno, G. (1978). Les nationalisations, pour quoifaire? Paris: Presses universitaires de France.
Hanke, S.S. (Ed). (1987). Privatization and development. San Francisco: Institute for Contem- porary Studies.
Hemming, R. and Mansoor, A. (1988, January). Privatization and public enterprises. Washing- ton: IMF Occasional Paper.
Kay, J.A. and Thompson, D.J. (1986). Privatization: A theory in search of a rationale. Economic
Journal 96 (March): 18-32. Lafay, J.D. (1985). Les entreprises publiques selon la th6orie 6eonomique de la politique. Poli-
tiques et Management Public (June): 115-140. Lewin, A.Y. (1982). Public enterprise, purposes and performance: A survey of Western European
experience. In W.T. Stanbury and F. Thompson (Eds.), Managing public enterprises, 51-78. New York: Praeger.
McGuire, R.C., Ohsfeldt, R.L. and Van Cott, T.N. (1987). The determinants of the choice be- tween public and private production of a publicly funded service. Public Choice 54 (August): 211-230.
Mueller, D.C. (1990). Public choice II. Cambridge: Cambridge Ulfiversity Press. Niskanen, W. (1971). Bureaucracy and representative government. Chicago: Aldine. Orzechowski, W. (1977). Economic models of bureaucracy: Survey, extension, and evidence. In
T.E. Borcherding (Ed.), Budgets and bureaucrats: The sources o f government growth, 229-259. Durham: Duke University Press.
337
Parris, H., Pestieau, P. and Saynor, P. (1987). Public enterprise in Western Europe. London: Croom Helm.
Peltzman, S. (1976). Toward a more general theory of regulation. Journal o f L a w and Economics 19 (August): 211-240.
Pigou, A. (1932). The economics o f welfare, 4th edition. London: Macmillan. Posner, R.A. (1971)o Taxation by regulation. Bell Journal o f Economics 2 (Spring): 22-50. Pryor, F.L. (1973). Property and industrial organization in communist and capitalist nations.
Bloomington and London: Indiana University Press. Pryor, F.L. (1985). A guidebook to the comparative study of economic systems. Englewood Cliffs:
Prentice-Hall. Rosa, J.J. (1985). Th6orie 6conomique de la nationalisation et de la privatisation. Politique
Economique (Juillet-Aofit et Septembre): 3-19 and 15-324 Rosa, J.J. (1988). Th6orie £'conomique de la nationalisation et de la privatisation. Finance 9
(D~cembre): 9 t - 109. Sheperd, W.G. (1982). Public enterprises: Purposes and performance. In W.T. Stanbury and
F. Thompson (Eds.), Managing public enterprises, 13-50. New York: Praeger. Short, R.P. (1984). The role of public enterprises: An international statistical comparison. In R.H.
Floyd, C.S. Gray and R.P. Short (Eds.), Public enterprise and mixed economies: Some macro- economic aspects, 110-194. Washington: International Monetary Fund.
Stanbury, W.T. and Thompson, F. (Eds.) (1982). Managing public enterprises. New York: Praeger.
Stigler, G.J. (1971). The theory of economic regulation. Bell Journal o f Economics 2 (Spring): 3-21.
Stuart, C. (1984). Welfare cost per dollar of additional tax revenue in the United States. American Economic Review 74 (June): 352-362.
Vernon, R. (1981). Introduction. In R. Vernon and Y. Aharoni (Eds.), State-ownedenterprise in Western economies, 7-22. New York: St. Martin's Press.
Vernon, R. and Aharoni, Y. (Eds.) (1981). State-owned enterprise in Western economies. New York: St. Martin's Press.
Vickers~ J. and Yarrow, G. (1988). Privatization: An economic analysis. Cambridge and London: MIT Press.
Wagner, A. (1883). Finanzwissenschaft. Walras, L. (1896). Etudes d'dconomie sociale. Weidenbaum, M. (1975). Government-mandatedprice increases. Washington: American Enter-
prise Institute. Yarrow, G. (1986). Privatization in theory and practice. Economic Policy 2 (April): 324-377.