National exports Increase by 29.3% and Imports Increase by ...
6
PRESS/Jan.2022 The Hashemite Kingdom of Jordan Date: 3.Apr.2022 National exports Increase by 29.3% and Imports Increase by 22.5% during January 2022 compared with the same period of 2021 The monthly report of the external trade issued by the Department of Statistics indicates that the value of total exports reached 577.0 million JDs during January 2022 with an increase by 27.3% compared with the same period of 2021. Meanwhile, the national exports value reached 523.5 million JDs during January 2022 with an increase by 29.3% compared with the same period of 2021. The value of re-exports reached 53.5 million JDs during January 2022 with an increase by 10.8% compared with the same period of 2021. The imports value reached 1347.8 million JD January 2022 with an increase by 22.5% compared with the same period of 2021. The deficit in the trade balance, which is calculated by deducting the value of imports from the value of total exports, has reached 770.8 million JD; therefore, the deficit has increased during January 2022 by 19.1% compared with the same period of 2021. The imports coverage by total exports has become 42.8% during January 2022, while it was 41.2% for the same period of 2021, which means an increase by 1.6 percentage points.
-
Upload
khangminh22 -
Category
Documents
-
view
2 -
download
0
Transcript of National exports Increase by 29.3% and Imports Increase by ...

PRESS/Jan.2022 The Hashemite Kingdom of Jordan
Date: 3.Apr.2022
National exports Increase by 29.3% and Imports Increase by 22.5% during
January 2022 compared with the same period of 2021
The monthly report of the external trade issued by the Department of Statistics indicates that
the value of total exports reached 577.0 million JDs during January 2022 with an increase by
27.3% compared with the same period of 2021. Meanwhile, the national exports value reached
523.5 million JDs during January 2022 with an increase by 29.3% compared with the same
period of 2021. The value of re-exports reached 53.5 million JDs during January 2022 with an
increase by 10.8% compared with the same period of 2021. The imports value reached 1347.8
million JD January 2022 with an increase by 22.5% compared with the same period of 2021.
The deficit in the trade balance, which is calculated by deducting the value of imports from
the value of total exports, has reached 770.8 million JD; therefore, the deficit has increased
during January 2022 by 19.1% compared with the same period of 2021. The imports coverage
by total exports has become 42.8% during January 2022, while it was 41.2% for the same
period of 2021, which means an increase by 1.6 percentage points.

As for commodities, the main exported items that witnessed an increase in their export value
were export value of Fertilizers by 131.7%, crude potash by 57.3%, crude phosphate by
164.9% and non-organic chemical products by 42.9%. Meanwhile, there was a decrease in the
export value of clothes and its related knitted accessories by 33.5% and pharmaceutical
products by 4.8%. As for imports, there was an increase in the imports value of vehicles,
motorcycle and their parts by 7.5%, machines, machinery and their parts by 14.2%, machinery
and electrical appliances and their parts by 6.4%, Jewelry and precious metals by 632.6%.
Meanwhile, there was a decrease in the export value of crude oil and its products by 11.6%
and Iron and its products by 15.9%.
Regarding trade with the main partners, there was an increase in the national exports to the
Greater Arab Trade Zone countries by 20.5% part of which Saudi Arabia by 7.8% and the
non-Arab Asian Countries by 105.2% part of which India by 82.8%. Meanwhile, there was a
decrease in the national exports to the North America Free Trade Agreement (NAFTA) by
21.2% part of which USA by 20.7%, and the European Union countries by 29.1% part of
which Belgium by 63.6%. As for the imports, there was an increase in the imports value from

the Greater Arab Trade Zone countries by 19.4% part of which UAE by 243.5%, the North
America Free Trade Agreement (NAFTA) by 29.5% part of which USA by 37.7%, the non-
Arab Asian Countries by 33.2% part of which China by 42.0% and the European Union
countries by 13.2% part of which Germany by 14.7%.
The main reason behind this increase is attributed to the increase of the value of national
exports of the following commodities during January 2022 compared with same month of
2021:
1. Nitrogenous or Chemical Fertilizers from 38.2 million JD to 88.5 million JD - an increase
by 131.7%.
2. Crude Phosphate from 18.8 million JD to 49.8 million JD - an increase by 164.9%.
3. Crude Potash from 48.9 million JD to 76.9 million JD - an increase by 57.3%.
4. Non-organic chemical products from 20.3 million JD to 29.0 million JD - an increase by
42.9%.
In addition, there was an increase in the value of national exports of Aluminum and its
products, Electrical Equipment, Paper, Wood Paste, Iron and its products, Plastic and its products,
Vegetables and their products, clothes and their related non- knitted accessories, Carpets, Electric
Power, Sugar and its products, Coffee Beans and Spices. These exports constituted 64.3% of the
total value of the national exports during January 2022 compared with 43.2% in the same
month of 2021.
During January 2022, Data indicate a decrease in the national exports value of clothes and its
related knitted accessories by 33.5%, pharmaceutical products by 5.0%, Livestock by 96.3%
and Organic Chemical products by 96.3%.
Table 1: The most important exported and imported commodities during
January of 2021 & 2022

Value in (JD Million)
National Exports Imports
Commodities *2021 *2022 Growth
Average
%
Commodities *2021 *2022
Growth
Average
%
Fertilizers 38.2 88.5 131.7 Crude Oil and its
products
141.7 125.2 11.6-
Crude potash 48.9 76.9 57.3 Jewelry and
Precious metals
14.1 103.3 632.6
Clothes and their
Knitted accessories 112.8 75.0 33.5- Vehicles,
Motorcycle and
their parts
92.3 99.2 7.5
Crude Phosphate 18.8 49.8 164.9 Machines,
Machinery and
their parts
76.3 87.1 14.2
Non-organic
Chemical
Products
20.3 29.0 42.9 Machinery,
electrical
appliances and
their parts
59.0 62.8 6.4
Pharmaceutical
products
29.2 27.8 4.8- Iron and its
products
56.6 47.6 15.9-
Other items 136.6 176.5 29.2
Other items 660.2 822.6 24.6
National
Exports
404.8 523.5 29.3 Total of Imports
(2)
1100.2 1347.8 22.5
Re-exports 48.3 53.5 10.8
Sum of total
Exports (1)
453.1 577.0 27.3 Trade Deficit (1)-(2)
-647.1 -770.8 19.1
Source: Department of Statistics / External Trade Section/ External Trade Statistics Report during January 2022
*Preliminary figures
Table 2: Main Trade Partners and Economic Cartels during
January of 2021 and 2022
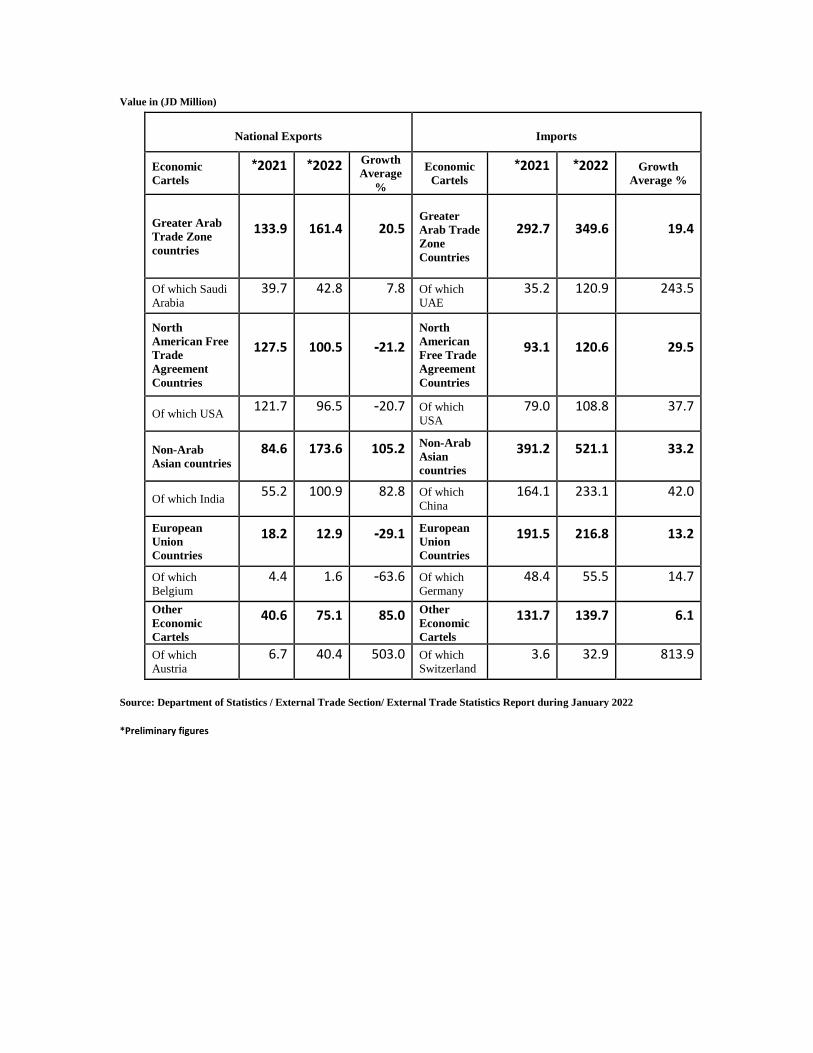
Value in (JD Million)
National Exports Imports
Economic
Cartels
2021* 2022* Growth
Average
%
Economic
Cartels
2021* 2022* Growth
Average %
Greater Arab
Trade Zone
countries
133.9 161.4 20.5 Greater
Arab Trade
Zone
Countries
292.7 349.6 19.4
Of which Saudi
Arabia
39.7 42.8 7.8 Of which
UAE
35.2 120.9 243.5
North
American Free
Trade
Agreement
Countries
127.5 100.5 21.2-
North
American
Free Trade
Agreement
Countries
93.1 120.6 29.5
Of which USA 121.7 96.5 20.7- Of which
USA
79.0 108.8 37.7
Non-Arab
Asian countries
84.6 173.6 105.2 Non-Arab
Asian
countries
391.2 521.1 33.2
Of which India 55.2 100.9 82.8 Of which
China
164.1 233.1 42.0
European
Union
Countries
18.2 12.9 29.1- European
Union
Countries
191.5 216.8 13.2
Of which
Belgium
4.4 1.6 63.6- Of which
Germany
48.4 55.5 14.7
Other
Economic
Cartels
40.6 75.1 85.0 Other
Economic
Cartels
131.7 139.7 6.1
Of which
Austria
6.7 40.4 503.0 Of which
Switzerland
3.6 32.9 813.9
Source: Department of Statistics / External Trade Section/ External Trade Statistics Report during January 2022
*Preliminary figures

For further Information please contact Alaa’ Khasawneh, External Trade Dep. / Tel. +962-6-5300700