Nanoparticle formation through solid-fed flame synthesis: Experiment and modeling
11
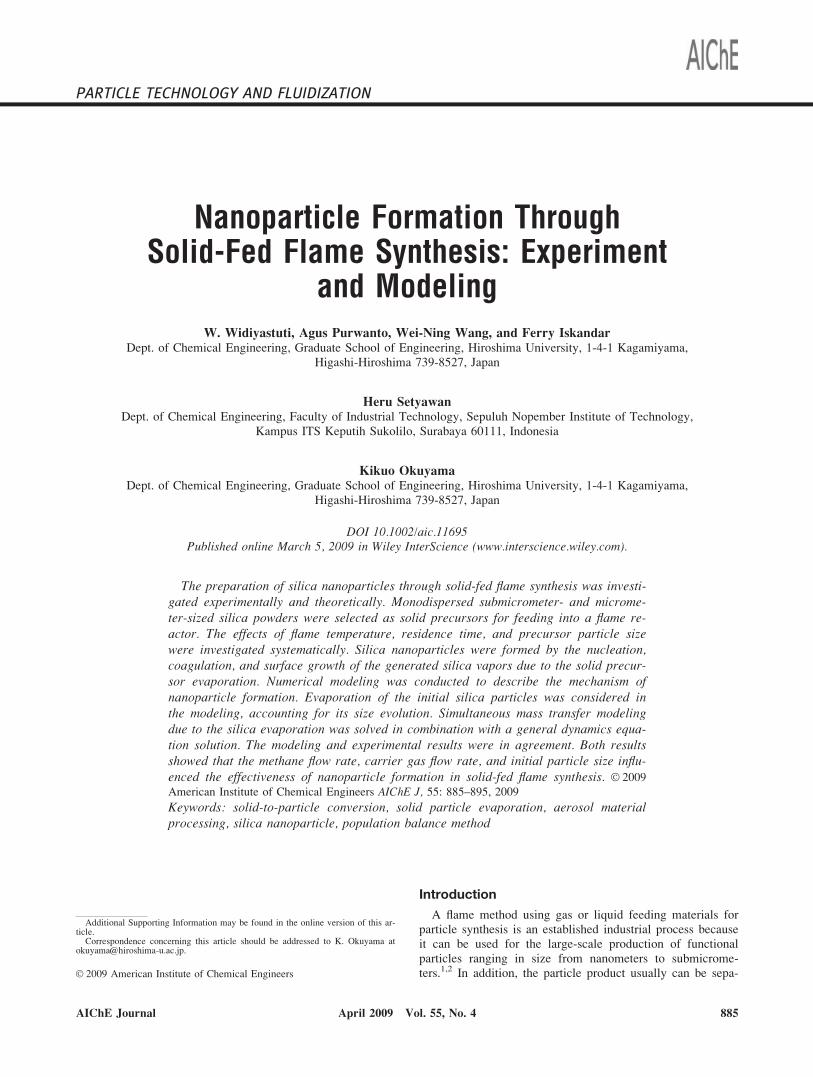
PARTICLE TECHNOLOGY AND FLUIDIZATION Nanoparticle Formation Through Solid-Fed Flame Synthesis: Experiment and Modeling W. Widiyastuti, Agus Purwanto, Wei-Ning Wang, and Ferry Iskandar Dept. of Chemical Engineering, Graduate School of Engineering, Hiroshima University, 1-4-1 Kagamiyama, Higashi-Hiroshima 739-8527, Japan Heru Setyawan Dept. of Chemical Engineering, Faculty of Industrial Technology, Sepuluh Nopember Institute of Technology, Kampus ITS Keputih Sukolilo, Surabaya 60111, Indonesia Kikuo Okuyama Dept. of Chemical Engineering, Graduate School of Engineering, Hiroshima University, 1-4-1 Kagamiyama, Higashi-Hiroshima 739-8527, Japan DOI 10.1002/aic.11695 Published online March 5, 2009 in Wiley InterScience (www.interscience.wiley.com). The preparation of silica nanoparticles through solid-fed flame synthesis was investi- gated experimentally and theoretically. Monodispersed submicrometer- and microme- ter-sized silica powders were selected as solid precursors for feeding into a flame re- actor. The effects of flame temperature, residence time, and precursor particle size were investigated systematically. Silica nanoparticles were formed by the nucleation, coagulation, and surface growth of the generated silica vapors due to the solid precur- sor evaporation. Numerical modeling was conducted to describe the mechanism of nanoparticle formation. Evaporation of the initial silica particles was considered in the modeling, accounting for its size evolution. Simultaneous mass transfer modeling due to the silica evaporation was solved in combination with a general dynamics equa- tion solution. The modeling and experimental results were in agreement. Both results showed that the methane flow rate, carrier gas flow rate, and initial particle size influ- enced the effectiveness of nanoparticle formation in solid-fed flame synthesis. Ó 2009 American Institute of Chemical Engineers AIChE J, 55: 885–895, 2009 Keywords: solid-to-particle conversion, solid particle evaporation, aerosol material processing, silica nanoparticle, population balance method Introduction A flame method using gas or liquid feeding materials for particle synthesis is an established industrial process because it can be used for the large-scale production of functional particles ranging in size from nanometers to submicrome- ters. 1,2 In addition, the particle product usually can be sepa- Additional Supporting Information may be found in the online version of this ar- ticle. Correspondence concerning this article should be addressed to K. Okuyama at [email protected]. Ó 2009 American Institute of Chemical Engineers AIChE Journal April 2009 Vol. 55, No. 4 885
-
Upload
independent -
Category
Documents
-
view
0 -
download
0
Transcript of Nanoparticle formation through solid-fed flame synthesis: Experiment and modeling
PARTICLE TECHNOLOGY AND FLUIDIZATION
Nanoparticle Formation ThroughSolid-Fed Flame Synthesis: Experiment
and ModelingW. Widiyastuti, Agus Purwanto, Wei-Ning Wang, and Ferry Iskandar
Dept. of Chemical Engineering, Graduate School of Engineering, Hiroshima University, 1-4-1 Kagamiyama,Higashi-Hiroshima 739-8527, Japan
Heru SetyawanDept. of Chemical Engineering, Faculty of Industrial Technology, Sepuluh Nopember Institute of Technology,
Kampus ITS Keputih Sukolilo, Surabaya 60111, Indonesia
Kikuo OkuyamaDept. of Chemical Engineering, Graduate School of Engineering, Hiroshima University, 1-4-1 Kagamiyama,
Higashi-Hiroshima 739-8527, Japan
DOI 10.1002/aic.11695Published online March 5, 2009 in Wiley InterScience (www.interscience.wiley.com).
The preparation of silica nanoparticles through solid-fed flame synthesis was investi-gated experimentally and theoretically. Monodispersed submicrometer- and microme-ter-sized silica powders were selected as solid precursors for feeding into a flame re-actor. The effects of flame temperature, residence time, and precursor particle sizewere investigated systematically. Silica nanoparticles were formed by the nucleation,coagulation, and surface growth of the generated silica vapors due to the solid precur-sor evaporation. Numerical modeling was conducted to describe the mechanism ofnanoparticle formation. Evaporation of the initial silica particles was considered inthe modeling, accounting for its size evolution. Simultaneous mass transfer modelingdue to the silica evaporation was solved in combination with a general dynamics equa-tion solution. The modeling and experimental results were in agreement. Both resultsshowed that the methane flow rate, carrier gas flow rate, and initial particle size influ-enced the effectiveness of nanoparticle formation in solid-fed flame synthesis. � 2009
American Institute of Chemical Engineers AIChE J, 55: 885–895, 2009
Keywords: solid-to-particle conversion, solid particle evaporation, aerosol materialprocessing, silica nanoparticle, population balance method
Introduction
A flame method using gas or liquid feeding materials forparticle synthesis is an established industrial process becauseit can be used for the large-scale production of functionalparticles ranging in size from nanometers to submicrome-ters.1,2 In addition, the particle product usually can be sepa-
Additional Supporting Information may be found in the online version of this ar-ticle.Correspondence concerning this article should be addressed to K. Okuyama at
� 2009 American Institute of Chemical Engineers
AIChE Journal April 2009 Vol. 55, No. 4 885
rated directly from the gas stream without any postprocess-ing. The commercial process leads to a flame reactor scale-up, which requires a fundamental understanding of operatingparameters and particle formation mechanisms.2–5 Thisknowledge has been expanded through simulation and model-ing processes.2,6,7
Most of the reported flame syntheses used gas or liquid asfeeding materials.8 In the case of gas-fed flame synthesis, themechanism follows gas-to-solid conversion in which particlesform by vapor nucleation and grow by particle coagulationand surface growth. Many investigators have reported themodeling of nanoparticle formation following gas-to-solidconversion. A simple approach for the simulation of aerosoldynamics solves the population-balance equation by neglect-ing the spread of the size distribution.9–11 A more complexequation, the general dynamic equation (GDE), is a nonlinearpartial integro-differential equation developed to calculateparticle growth by considering the polydispersity of particlesize distribution.7,12–14 Many previous studies have focusedon solving the GDE, with approaches such as the momentmethod,15 the sectional method,16 the discrete sectionalmethod,17 and the nodal method.14,18
A liquid-to-solid conversion in flame synthesis using com-bustible or volatile precursors has been studied experimen-tally and theoretically by many groups, including the Pratsi-nis group.11,19 A gas-to-particle route usually was applied tothe modeling because combustible or volatile precursors leadto extremely fast combustion reactions and evaporation.1,20
Vapor formation in a liquid-to-solid conversion mechanismhas been treated as a ‘‘black box’’ by assuming vapor forma-tion occurs immediately after spraying.11 In the case of a liq-uid-fed flame reactor, the liquid precursor in droplet formwas sprayed into the reactor. Droplet evaporation and particledynamics modeling were used to model the flame synthesisprocess using a volatile precursor.21 However, the productvapors were treated as the smallest stable particles thatformed instantaneously.
Recently, a liquid-fed flame process using nonvolatile pre-cursors, such as aqueous salt solutions, was also reported.Our group reported that YAG:Ce31 submicron-sized particlescould be prepared by a liquid-fed flame reactor using sprayeddroplets as the precursor.22 The drying of the droplets due tosolvent evaporation and intraparticle reaction occurred duringthis process. The process was assumed to be analogous toconventional spray pyrolysis (CSP), except that the thermalenergy was supplied by a flame rather than an electrical tu-bular furnace.20 However, BaTiO3 nanoparticles can be pro-duced in a flame reactor using a droplet precursor, whichcould not be explained by the mechanism that occurs duringthe CSP process.23 Chemical and physical processes accom-panying liquid-fed flame synthesis lead to complex analysisof nanoparticle formation.
Even though vapor or volatile liquid-fed flame syntheseshave been used in industry, their use is limited to a fewmaterials due to relatively expensive precursors, usually me-tallic organic chemicals. Nonvolatile liquid-fed flame synthe-sis is also versatile due to low-cost inorganic salt precursors.8
Inorganic salt is diluted in a solvent, usually water, before itis sprayed into a flame reactor. However, the energy suppliedby the flame is also used to evaporate the solvent, which hasa solvent fraction that is higher than that of inorganic salt in
the precursor. The present study proposes a one-step processthat uses an inexpensive and easy-to-handle bulk material togenerate nanoparticles, that is, solid-fed flame synthesis. Asolid precursor might be evaporated by a high flame tempera-ture. The generated vapors could result in particle growth bynucleation and coagulation due to a nonisothermal tempera-ture in the flame reactor. To the best our group’s knowledge,no published paper has reported a flame synthesis using solidparticles as the feeding material sprayed directly into theflame. In addition, the mechanistic analysis is simplifiedbecause only physical processes are involved.
In this article, experimental and theoretical silica nanopar-ticle preparation using solid-fed flame synthesis is reported.Submicrometer- and micrometer-sized silica powders wereused as precursors. Theoretical modeling was used to explainthe mechanism of nanoparticle formation. Silica solid evapo-ration is considered before silica vapor nucleation, coagula-tion, and surface growth, producing silica nanoparticles. Thetemperature profile and flow field in the flame reactor wereincluded in the dynamics calculation. Parameters, such asmethane flow rate, carrier gas flow rate and initial solid silicaparticles that influence the effectiveness of nanoparticle for-mation are explained.
Experimental
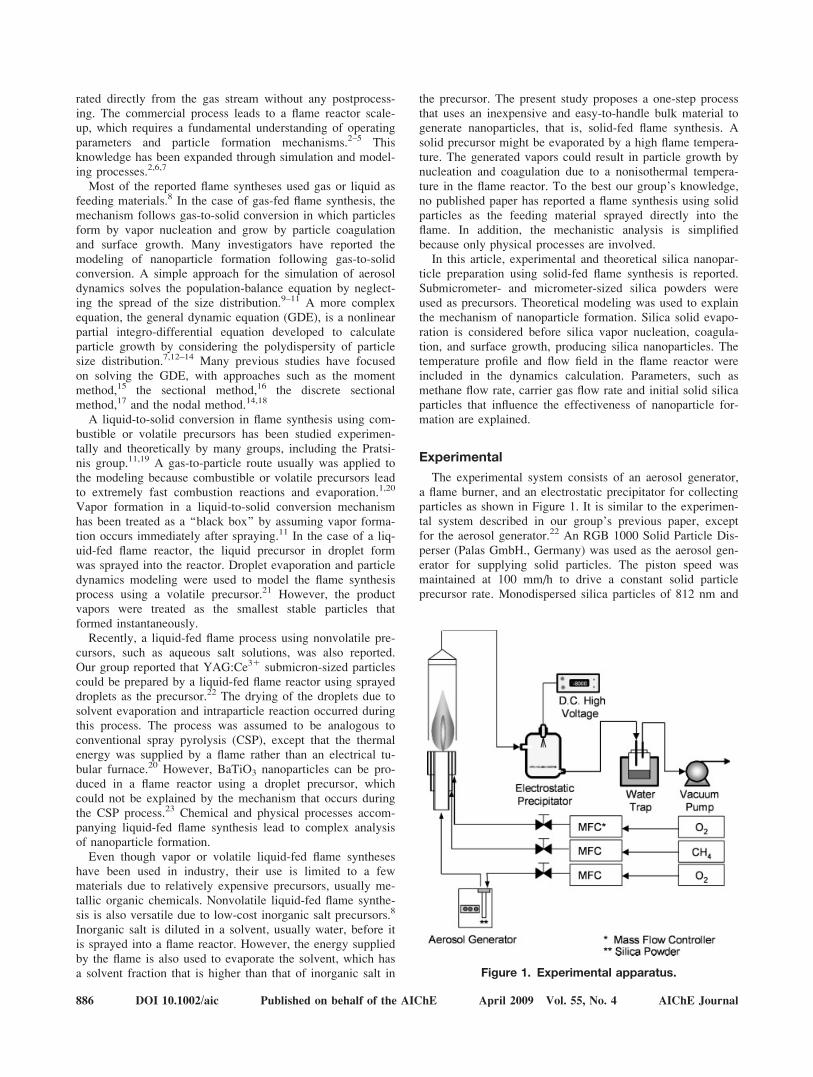
The experimental system consists of an aerosol generator,a flame burner, and an electrostatic precipitator for collectingparticles as shown in Figure 1. It is similar to the experimen-tal system described in our group’s previous paper, exceptfor the aerosol generator.22 An RGB 1000 Solid Particle Dis-perser (Palas GmbH., Germany) was used as the aerosol gen-erator for supplying solid particles. The piston speed wasmaintained at 100 mm/h to drive a constant solid particleprecursor rate. Monodispersed silica particles of 812 nm and
Figure 1. Experimental apparatus.
886 DOI 10.1002/aic Published on behalf of the AIChE April 2009 Vol. 55, No. 4 AIChE Journal
1912 nm were used (Tokuyama, Tsukuba, Japan). Based onmass balance calculation, 1.67 3 1024 m3 s21 of oxygen asa carrier gas can carry 1.4 3 1011 and 1.1 3 1010 particlesper m3 for particles with 812 nm and 1912 nm in diameter,respectively, in the inner flame burner, which is 16 mm indiameter. Methane as a fuel, with a flow rate ranging from1.67 3 1025 m3 s21 to 6.67 3 1025 m3 s21 went to the firstannular gap of the burner with a thickness of 1.5 mm. Theflow rate ratio of oxygen, an oxidizer, to methane was 2.5 toensure complete combustion. Oxygen, an oxidizer, passedthrough the second annular gap of the burner. Methane andoxygen flow rates contributed to controlling the temperaturedistribution in the flame reactor. The flame reactor was cov-ered by a Pyrex glass cylinder that was 96 mm in diameterand 1 m in height.
The generated particles were examined using a field-emis-sion scanning electron microscope (FE-SEM, S-5000, HitachiCorp., Tokyo, Japan) operated at 20 kV. Random samplingof at least 1000 particles from FE-SEM photographs wereexamined to reduce limit errors to 2–3% while determiningthe size distribution of the generated particles.24
Numerical Method
First, an appropriate diffusion flame combustion modelwas selected to obtain the temperature distribution and resi-dence time using computational fluid dynamics (CFD). Thisresult was used to calculate solid evaporation followed by agas-to-particle conversion calculation using a GDE solution.Modeling is described in detail in the following subsections.
Flame combustion model
Together with continuity, momentum, and energy transportequations, a species transport equation describing the reactionrate in flame combustion was solved. These equations weresolved using a commercial CFD code, FLUENT 6.3 (FluentAsia Pacific, Tokyo, Japan) based on a finite volume tech-nique on a two-dimensional axis-symmetry computationaldomain. Flame combustion was modeled using a one-stepreaction mechanism, assuming complete conversion of themethane as a fuel to CO2 and H2O. The turbulence-chemistryinteraction was modeled using a generalized eddy-dissipationmodel.25 The chemical reaction rate is governed by thelarge-eddy mixing scale, k/e. The net rate of the productionof species i due to reaction r, Ri,r, is given by the limitingvalue of the two expressions below:
Ri;r ¼ v0i;rMw;iAqekminR
YRv0R;rMw;R
!(1)
Ri;r ¼ v0i;rMw;iABqek
PPYPPN
j v00j;rMw;j
(2)
YP and YR are the mass fractions of any product species, Pand the mass fraction of a particular reactant, R, respectively.A and B are empirical constants equaling 4.0 and 0.5, respec-tively. The stoichiometric coefficient for reactant i in reactionr is v0i;r, and Mw,i is the molecular weight of species i.
The standard k-e model was selected to model turbulencethat consists of two transport equations for the turbulence ki-
netic energy, k, and its dissipation rate, e, which is stated asfollows.25
@
@tðqkÞ þ @
@xiðqkuiÞ ¼ @
@xjlþ lt
rk
� �@k
@xj
� �þ Gk � qe (3)
@
@tðqeÞ þ @
@xiðqeuiÞ
¼ @
@xjlþ lt
re
� �@e@xj
� �þ C1e
ekGk � C2eq
e2
kð4Þ
Gk is the generation of turbulence kinetic energy due tomean velocity gradients. The turbulent viscosity (lt) isdefined by lt 5 qCl k2/e. The values of the model parame-ters are C1e 5 1.44, C2e 5 1.92, Cl 50.09, rk 5 1.0, and re5 1.3. This calculation generated temperature profiles andflow fields in the flame reactor that were used to calculateparticle evaporation, and regeneration or growth. Particleevolution was assumed following a symmetric four-path lineflow beginning from the precursor inlet in the burner surface.The silica particle fraction in each path line was calculatedbased on the assumption that a homogenous solid precursorwas distributed in the precursor inlet.
The temperature profile obtained from the CFD simulationwas validated using thermocouple measurements taken alongthe axis line, as shown in Figure S1 of the supporting infor-mation. The methane flow rate as fuel was 3.33 3 1025 m3
s21. The flow rate ratio of oxygen (oxidizer) to methane was2.5. Nitrogen at a flow rate of 3.33 3 1025 m3 s21 was usedas the carrier gas.
Evaporation of silica solid particles
Silica particle evaporation modeling was treated in a similarmanner to metal oxide evaporation in which vapor pressurewas substantial enough to cause metal oxide to evaporate.26
The modeling also was similar to the droplet evaporationwhich was used in our group’s previous studies to explain thedecrease in droplet size due to solvent evaporation in spraypyrolysis processes.27,28 The change in particle diameter, dp,and silica vapor number concentration, N(1), were calculatedbased on material balance equations. These equations are usedwhen the saturation ratio is less than 1. The change of thesilica particle diameter, due to particle evaporation, is:
ddpdt
¼ 4Dvm1
qpdpðNð1Þ � nsÞ (5)
The change of silica vapor concentration in the surround-ing gas is:
dNð1Þdt
¼ �2pdpDvNoðNð1Þ � nsÞ (6)
Particle reforming is due to the nucleation process of silicavapor when its concentration is greater than its saturationconcentration, ns, which is shown by:
ns ¼ Ps
kBT(7)
where ps is saturated vapor pressure. The required data prop-erties were taken from Perry’s chemical engineering hand-book.29
AIChE Journal April 2009 Vol. 55, No. 4 Published on behalf of the AIChE DOI 10.1002/aic 887
Silica nanoparticle formation
Modeling of gas-to-particle conversion involves nucleation,condensation of vapors onto the particles and coagulationbetween the particles. Vapors nucleate when the saturationcondition is surpassed either by decreasing the temperatureor increasing the vapor concentration.9 If the saturation ratio,N(1)/ns is greater than or equals to 1, the calculation basedon the gas-to-particle conversion mechanism is initiated.Supersaturation occurs when the saturation ratio is sufficientfor vapors to nucleate. According to the classical nucleationtheory, nucleation occurs, forming stable clusters at a suffi-cient supersaturation value that results when the critical parti-cle volume, v*, is greater than the monomer volume, v1.
20
The supersaturation value also influences the rate of nuclea-tion, J(k).
In the modeling, the particles are assumed to be sphericaland electrically neutral. Particles collision is assumed, form-ing a single new spherical particle. The simplified model ofthe sectional approach to discretize the particle size distribu-tion, called the nodal method, was used to model the gas-to-particle conversion in flame synthesis.14,18 It evolves nuclea-tion, coagulation, and surface growth of supersaturated vapor,which is written in the population balance equation as fol-lows:
dNðkÞdt
¼ dNðkÞdt
����nucl
þdNðkÞdt
����coag
þdNðkÞdt
����evap=cond
(8)
dNðkÞdt
����nucl
¼ JðkÞnðkÞ (9)
dNð1Þdt
����nucl
¼ �JðkÞk� (10)
nðkÞ ¼v�vðkÞ ; if vðk � 1Þ � v� � vðkÞv�vð2Þ ; if v� � v10; otherwise
8<: (11)
v� ¼ p6
4rv1kBT ln S
� �3
(12)
n(k) is the size operator that puts the nucleated particle atthe node just larger than its critical size node, k*, which isdefined as:
k� ¼ 2s1r3kBT ln S
� �3
(13)
The classical homogenous nucleation theory with self-con-sistent correction (SCC) was applied as follows:
JðkÞ ¼ n2sSv12rpm1
� �0:5
exps1rkBT
�4 s1r=kBT
� �327 log2 S
0B@
1CA (14)
Coagulation refers to the collision of two particles largerthan the critical size node k*. The correlation for collisionfrequency function, b(i,j), was determined by:
bði;jÞ¼ 3
4p
� �1=66kBT
qp
!1=21
vðiÞþ1
vðjÞ� �1=2
vðiÞ1=3þvðjÞ1=3� �2
(15)
The rate of change of the particle size distribution due tocoagulation is shown by:
dNðkÞdt
����coag
¼ 1
2
Xi¼2j¼2
vði; j; kÞbði; jÞNðiÞNðjÞ � NðkÞXi¼2
bði; jÞNðiÞ
(16)
where v(i,j,k) is a size operator due to coagulation, which isdefined as follows:
vijk ¼vðkþ1Þ� vðiÞþvðjÞð Þ
vkþ1�vk; if vðkÞ � vðiÞ þ vðjÞ � vðkþ 1Þ
vðiÞþvðjÞð Þ�vðk�1Þvðkþ1Þ�vðkÞ ; if vðk� 1Þ � vðiÞ þ vðjÞ � vðkÞ
0; otherwise
8><>:
(17)
Particles can grow due to the condensation of monomersto the particle surface called surface growth. They also canevaporate from the surface depending on the vapor pressuredifference and the Kelvin effect. The change in particle sizedistribution due to surface growth can be stated as:
dNðkÞdt
����evap=cond
¼
vð1ÞvðkÞ�vðk�1Þ bð1; k � 1Þ Nð1Þ � Nð1; k � 1Þsð ÞNðk � 1Þ
if Nð1Þ > Nð1; k � 1Þs� vð1Þ
vðkþ1Þ�vðkÞ bð1; k þ 1Þ Nð1Þ � Nð1; k þ 1Þsð ÞNðk þ 1Þif Nð1Þ<Nð1; k þ 1Þs
� vð1Þvðkþ1Þ�vðkÞ bð1; kÞ Nð1Þ � Nð1; kÞsð ÞNðkÞ
if Nð1Þ > Nð1; kÞsvð1Þ
vðkÞ�vðk�1Þ bð1; kÞ Nð1Þ � Nð1; kÞsð ÞNðkÞif Nð1Þ < Nð1; kÞs
8>>>>>>>>>>>>><>>>>>>>>>>>>>:
(18)
dNð1Þdt
����evap=cond
¼
�bð1; k � 1Þ Nð1Þ � Nð1; k � 1Þsð ÞNðk � 1Þif Nð1Þ > Nð1; k � 1Þs
�bð1; k þ 1Þ Nð1Þ � Nð1; k þ 1Þsð ÞNðk þ 1Þif Nð1Þ<Nð1; k þ 1Þs
�bð1; kÞ Nð1Þ � Nð1; kÞsð ÞNðkÞif Nð1Þ > Nð1; kÞs
�bð1; kÞ Nð1Þ � Nð1; kÞsð ÞNðkÞif Nð1Þ < Nð1; kÞs
8>>>>>>>>>><>>>>>>>>>>:
(19)
All variables, such as N(1) and N(k), were calculated asfunctions of temperature and time along the flame reactorobtained from the temperature and velocity profiles measuredusing CFD. Temperature profile as a function of position, x,
888 DOI 10.1002/aic Published on behalf of the AIChE April 2009 Vol. 55, No. 4 AIChE Journal
was obtained from the CFD simulation. The correlationbetween time, t, and distance, x, is described by dx ¼ vðxÞdtor dt ¼ 1
vðxÞ dx, where v(x) also is obtained from the CFD sim-ulation.
Results and Discussion
Temperature distribution and particle path lines
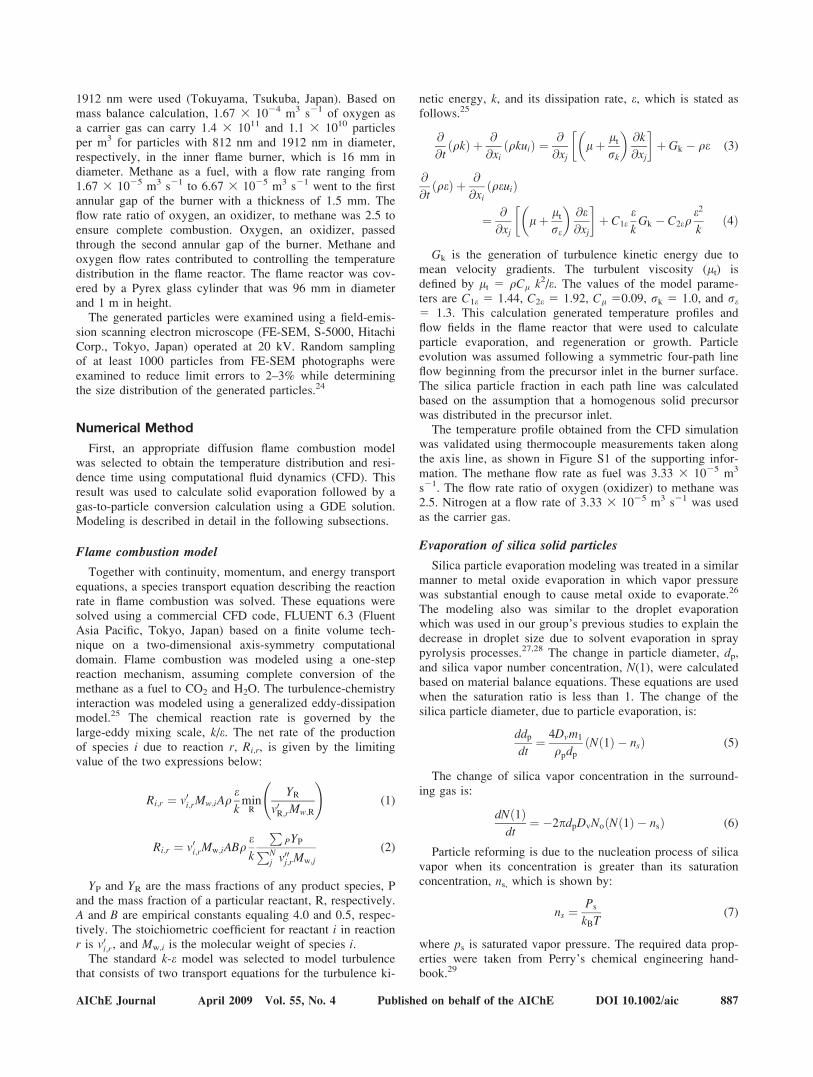
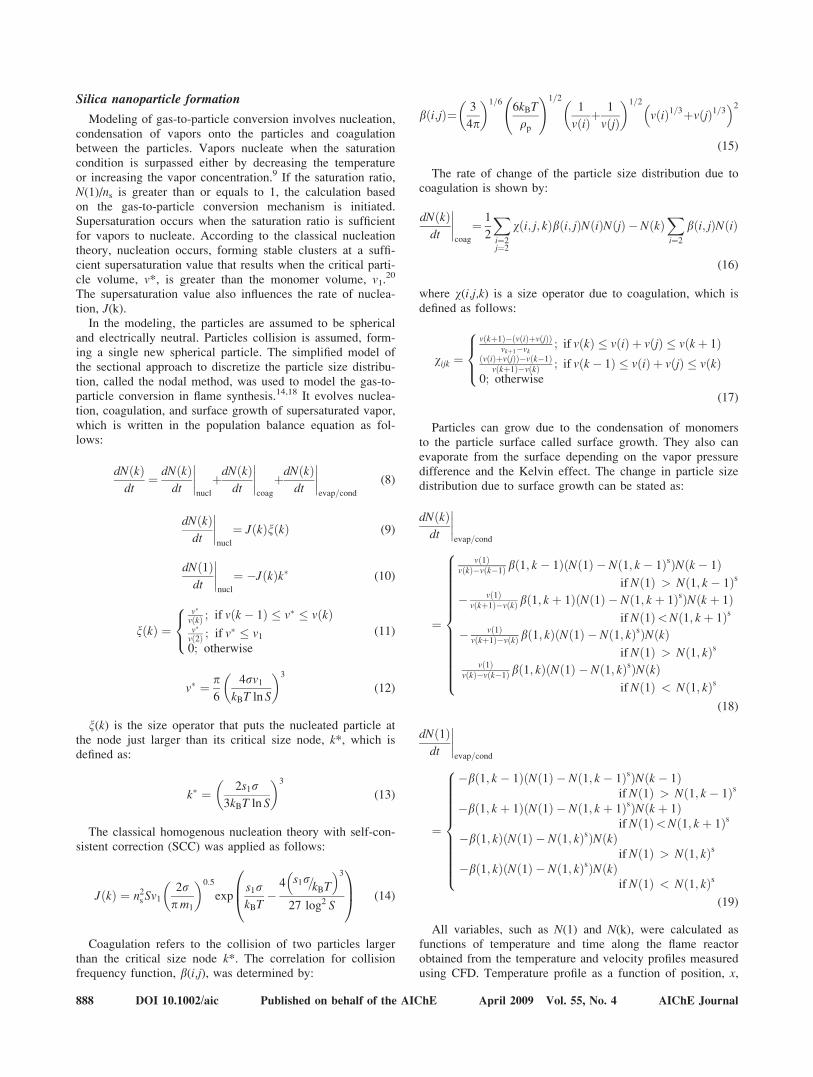
Based on the CFD calculations, two-dimensional tempera-ture profiles and flow fields can be obtained. Figure 2a–dshows the temperature profiles for methane flow rates rang-ing from 1.67 3 1025 to 6.67 3 1025 m3 s21 along theflame reactor. The temperature increased with an increasedin methane flow rate, producing a larger flame region. Thisresult was consistent with experimental results of our previ-ous study.30 The flow field was stated as path lines of carriergas flow entering the flame reactor through the precursorinlet. The carrier gas flow dispersed to the flame reactorundergoes a translation flow in both the axial and the radialdirection, as shown by each path line in Figure 2e. Each pathhas a slightly different temperature distribution, dependingon its distance from the reactor axis, as shown in Figure 3.Silica particles were assumed following these paths withnumber fractions in proportion to the surface area of eachpath in the precursor inlet. The path that is farthest from thereactor axis (e.g., path line 4) has a higher temperature andfaster cooling rate than those of the path nearest the reactoraxis (e.g., path line 1). This result is similar to Johannesen’ssimulation result, which also used a particle trajectoryapproach.31 The temperature distribution in the flame reactorcan be divided into two zones that characterize heating andcooling. Heating and cooling zones contributed to the evapo-ration stage and the transformation of vapor to particles,respectively. It can be shown that the heating zone has a
much shorter length than the cooling zone. For example, thelengths of the heating zones following path line 1 for a meth-ane flow rate of 1.67 3 1025, 3.33 3 1025, 5.00 3 1025
and 6.67 3 1025 m3 s21 are about 0.05, 0.1, 0.15, and 0.2m, respectively, from the burner surface. The increase inmethane flow rate was followed by an increase in maximaltemperature at approximately 1000, 1500, 1900, and 2200 K.It is possible the initial silica particles cannot fully evaporate,resulting in final particles with an unchanged size. This willbe discussed in the following subsection.
The effect of methane flow rate
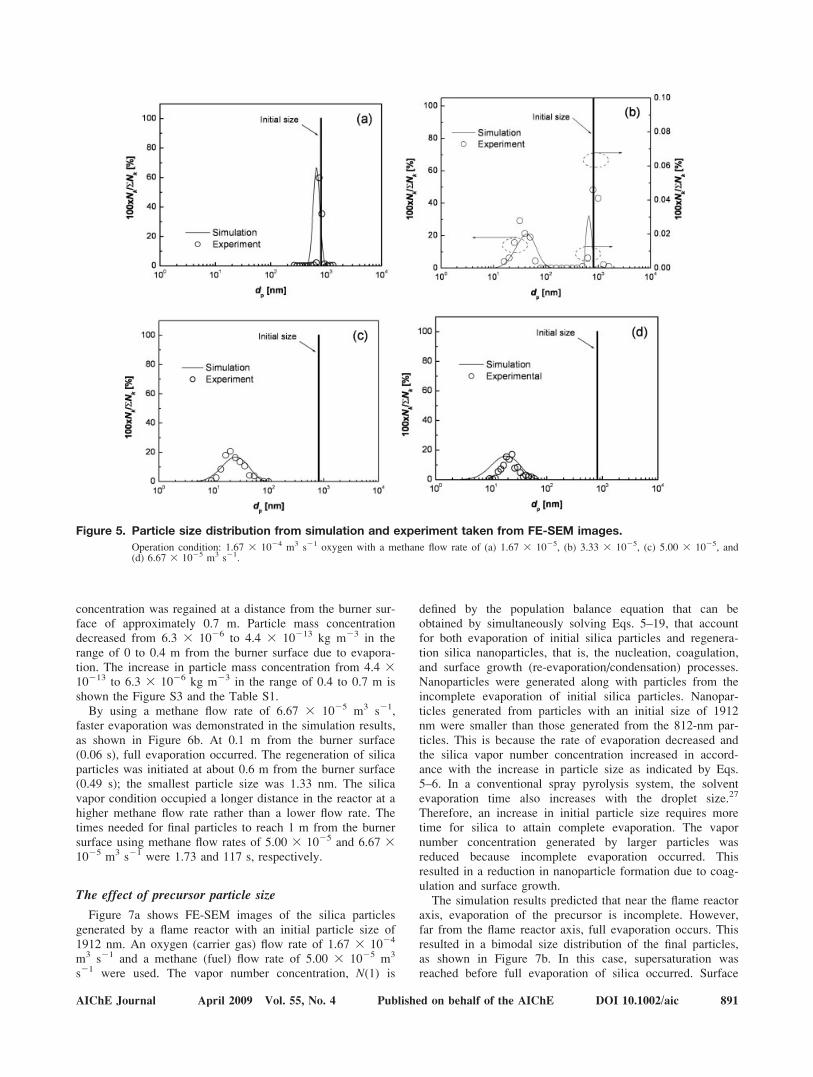
Figure 4a shows FE-SEM images of monodispersed pre-cursor particles 812 nm in diameter. The evolution of particlesize from submicron-sized particles to nanoparticles dependson the methane flow rate, which is influenced by the temper-ature distribution in the flame reactor. Using a methane flowrate of 1.67 3 1025 m3 s21, the initial particle size slightlydecreased, and the condensation of silica vapor on the silicasurface was observed as shown in Figure 4b. The simulationresult, as shown in Figure 5a, was in accordance with themeasurement. The initial particles barely evaporated, and theproduct particle size was very similar to the initial particlesize. In the case of the methane flow rate of 3.33 3 1025
m3 s21, most submicrometer silica particles fully evaporatedto generate nanoparticles as shown in Figure 4c. Some par-ticles could not fully evaporate because of the inhomogene-ous temperature distribution in both the axial and radial posi-tions, as explained above. The simulation result agreed withthe particle size distribution measurement, as shown in Fig-ure 5b. The bimodal size distribution can be explained bythe simulation result. From the simulation, the evolution par-ticle size that followed the outer path line of the temperaturedistribution (path line 4) evaporated completely. However, atother path lines, the initial silica particles evaporated incom-pletely. This is because the temperature in the outer path lineis higher than the center. In the case of the methane flow
Figure 2. Temperature distribution along the flame re-actor calculated by CFD for a methane flowrate of (a) 1.67 3 1025, (b) 3.33 3 1025, (c)5.00 3 1025, and (d) 6.67 3 1025 m3 s21, (e)temperature path line of condition (a).
[Color figure can be viewed in the online issue, which isavailable at www.interscience.wiley.com.]
Figure 3. Temperature distribution along the flame re-actor at each path line with a methane flowrate of 1.67 3 1025, 3.33 3 1025, 5.00 3 1025,and 6.67 3 1025 m3 s21.
AIChE Journal April 2009 Vol. 55, No. 4 Published on behalf of the AIChE DOI 10.1002/aic 889
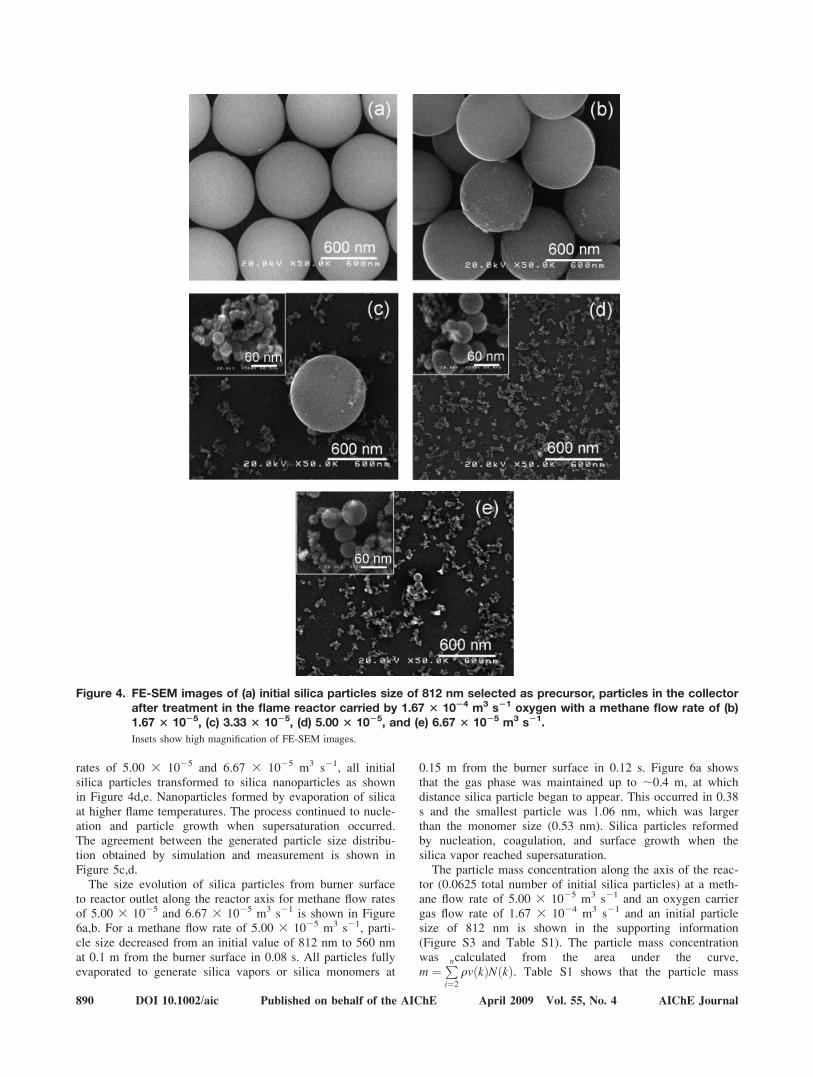
rates of 5.00 3 1025 and 6.67 3 1025 m3 s21, all initialsilica particles transformed to silica nanoparticles as shownin Figure 4d,e. Nanoparticles formed by evaporation of silicaat higher flame temperatures. The process continued to nucle-ation and particle growth when supersaturation occurred.The agreement between the generated particle size distribu-tion obtained by simulation and measurement is shown inFigure 5c,d.
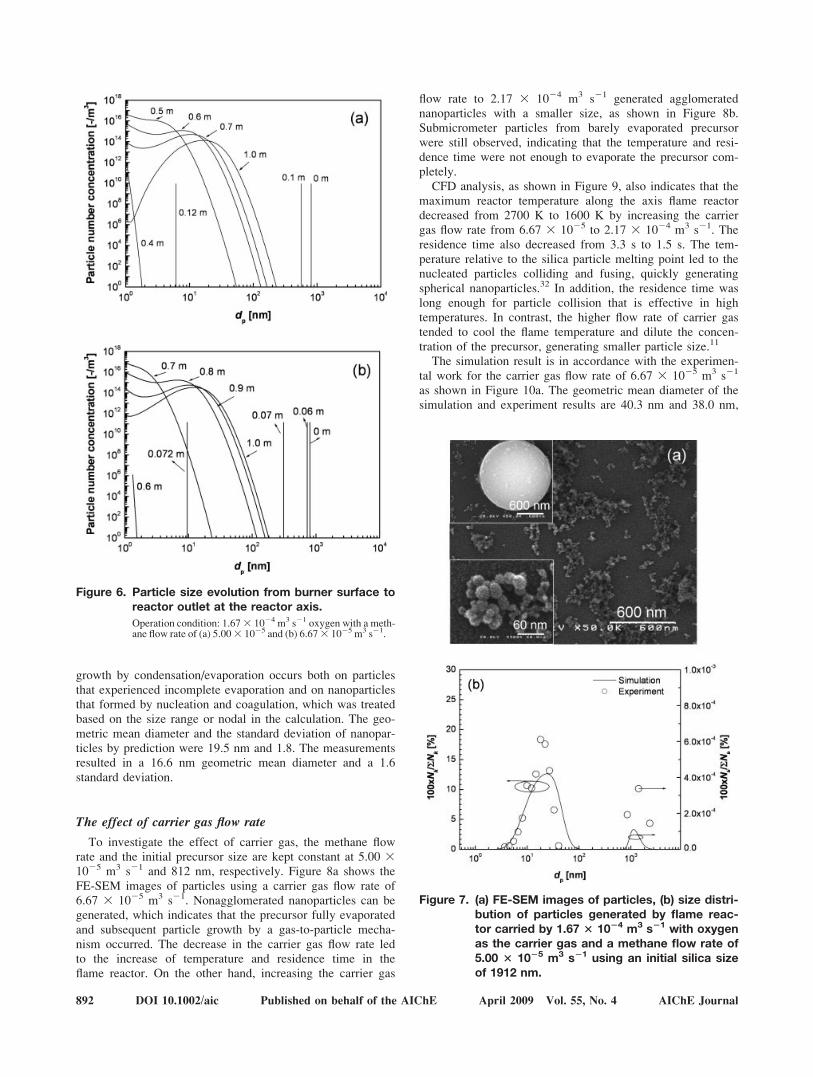
The size evolution of silica particles from burner surfaceto reactor outlet along the reactor axis for methane flow ratesof 5.00 3 1025 and 6.67 3 1025 m3 s21 is shown in Figure6a,b. For a methane flow rate of 5.00 3 1025 m3 s21, parti-cle size decreased from an initial value of 812 nm to 560 nmat 0.1 m from the burner surface in 0.08 s. All particles fullyevaporated to generate silica vapors or silica monomers at
0.15 m from the burner surface in 0.12 s. Figure 6a showsthat the gas phase was maintained up to ;0.4 m, at whichdistance silica particle began to appear. This occurred in 0.38s and the smallest particle was 1.06 nm, which was largerthan the monomer size (0.53 nm). Silica particles reformedby nucleation, coagulation, and surface growth when thesilica vapor reached supersaturation.
The particle mass concentration along the axis of the reac-tor (0.0625 total number of initial silica particles) at a meth-ane flow rate of 5.00 3 1025 m3 s21 and an oxygen carriergas flow rate of 1.67 3 1024 m3 s21 and an initial particlesize of 812 nm is shown in the supporting information(Figure S3 and Table S1). The particle mass concentrationwas calculated from the area under the curve,m ¼Pn
i¼2
qvðkÞNðkÞ. Table S1 shows that the particle mass
Figure 4. FE-SEM images of (a) initial silica particles size of 812 nm selected as precursor, particles in the collectorafter treatment in the flame reactor carried by 1.67 3 1024 m3 s21 oxygen with a methane flow rate of (b)1.67 3 1025, (c) 3.33 3 1025, (d) 5.00 3 1025, and (e) 6.67 3 1025 m3 s21.
Insets show high magnification of FE-SEM images.
890 DOI 10.1002/aic Published on behalf of the AIChE April 2009 Vol. 55, No. 4 AIChE Journal
concentration was regained at a distance from the burner sur-face of approximately 0.7 m. Particle mass concentrationdecreased from 6.3 3 1026 to 4.4 3 10213 kg m23 in therange of 0 to 0.4 m from the burner surface due to evapora-tion. The increase in particle mass concentration from 4.4 310213 to 6.3 3 1026 kg m23 in the range of 0.4 to 0.7 m isshown the Figure S3 and the Table S1.
By using a methane flow rate of 6.67 3 1025 m3 s21,faster evaporation was demonstrated in the simulation results,as shown in Figure 6b. At 0.1 m from the burner surface(0.06 s), full evaporation occurred. The regeneration of silicaparticles was initiated at about 0.6 m from the burner surface(0.49 s); the smallest particle size was 1.33 nm. The silicavapor condition occupied a longer distance in the reactor at ahigher methane flow rate rather than a lower flow rate. Thetimes needed for final particles to reach 1 m from the burnersurface using methane flow rates of 5.00 3 1025 and 6.67 31025 m3 s21 were 1.73 and 117 s, respectively.
The effect of precursor particle size
Figure 7a shows FE-SEM images of the silica particlesgenerated by a flame reactor with an initial particle size of1912 nm. An oxygen (carrier gas) flow rate of 1.67 3 1024
m3 s21 and a methane (fuel) flow rate of 5.00 3 1025 m3
s21 were used. The vapor number concentration, N(1) is
defined by the population balance equation that can beobtained by simultaneously solving Eqs. 5–19, that accountfor both evaporation of initial silica particles and regenera-tion silica nanoparticles, that is, the nucleation, coagulation,and surface growth (re-evaporation/condensation) processes.Nanoparticles were generated along with particles from theincomplete evaporation of initial silica particles. Nanopar-ticles generated from particles with an initial size of 1912nm were smaller than those generated from the 812-nm par-ticles. This is because the rate of evaporation decreased andthe silica vapor number concentration increased in accord-ance with the increase in particle size as indicated by Eqs.5–6. In a conventional spray pyrolysis system, the solventevaporation time also increases with the droplet size.27
Therefore, an increase in initial particle size requires moretime for silica to attain complete evaporation. The vapornumber concentration generated by larger particles wasreduced because incomplete evaporation occurred. Thisresulted in a reduction in nanoparticle formation due to coag-ulation and surface growth.
The simulation results predicted that near the flame reactoraxis, evaporation of the precursor is incomplete. However,far from the flame reactor axis, full evaporation occurs. Thisresulted in a bimodal size distribution of the final particles,as shown in Figure 7b. In this case, supersaturation wasreached before full evaporation of silica occurred. Surface
Figure 5. Particle size distribution from simulation and experiment taken from FE-SEM images.
Operation condition: 1.67 3 1024 m3 s21 oxygen with a methane flow rate of (a) 1.67 3 1025, (b) 3.33 3 1025, (c) 5.00 3 1025, and(d) 6.67 3 1025 m3 s21.
AIChE Journal April 2009 Vol. 55, No. 4 Published on behalf of the AIChE DOI 10.1002/aic 891
growth by condensation/evaporation occurs both on particlesthat experienced incomplete evaporation and on nanoparticlesthat formed by nucleation and coagulation, which was treatedbased on the size range or nodal in the calculation. The geo-metric mean diameter and the standard deviation of nanopar-ticles by prediction were 19.5 nm and 1.8. The measurementsresulted in a 16.6 nm geometric mean diameter and a 1.6standard deviation.
The effect of carrier gas flow rate
To investigate the effect of carrier gas, the methane flowrate and the initial precursor size are kept constant at 5.00 31025 m3 s21 and 812 nm, respectively. Figure 8a shows theFE-SEM images of particles using a carrier gas flow rate of6.67 3 1025 m3 s21. Nonagglomerated nanoparticles can begenerated, which indicates that the precursor fully evaporatedand subsequent particle growth by a gas-to-particle mecha-nism occurred. The decrease in the carrier gas flow rate ledto the increase of temperature and residence time in theflame reactor. On the other hand, increasing the carrier gas
flow rate to 2.17 3 1024 m3 s21 generated agglomeratednanoparticles with a smaller size, as shown in Figure 8b.Submicrometer particles from barely evaporated precursorwere still observed, indicating that the temperature and resi-dence time were not enough to evaporate the precursor com-pletely.
CFD analysis, as shown in Figure 9, also indicates that themaximum reactor temperature along the axis flame reactordecreased from 2700 K to 1600 K by increasing the carriergas flow rate from 6.67 3 1025 to 2.17 3 1024 m3 s21. Theresidence time also decreased from 3.3 s to 1.5 s. The tem-perature relative to the silica particle melting point led to thenucleated particles colliding and fusing, quickly generatingspherical nanoparticles.32 In addition, the residence time waslong enough for particle collision that is effective in hightemperatures. In contrast, the higher flow rate of carrier gastended to cool the flame temperature and dilute the concen-tration of the precursor, generating smaller particle size.11
The simulation result is in accordance with the experimen-tal work for the carrier gas flow rate of 6.67 3 1025 m3 s21
as shown in Figure 10a. The geometric mean diameter of thesimulation and experiment results are 40.3 nm and 38.0 nm,
Figure 6. Particle size evolution from burner surface toreactor outlet at the reactor axis.
Operation condition: 1.673 1024 m3 s21 oxygen with a meth-ane flow rate of (a) 5.003 1025 and (b) 6.673 1025 m3 s21.
Figure 7. (a) FE-SEM images of particles, (b) size distri-bution of particles generated by flame reac-tor carried by 1.67 3 1024 m3 s21 with oxygenas the carrier gas and a methane flow rate of5.00 3 1025 m3 s21 using an initial silica sizeof 1912 nm.
892 DOI 10.1002/aic Published on behalf of the AIChE April 2009 Vol. 55, No. 4 AIChE Journal
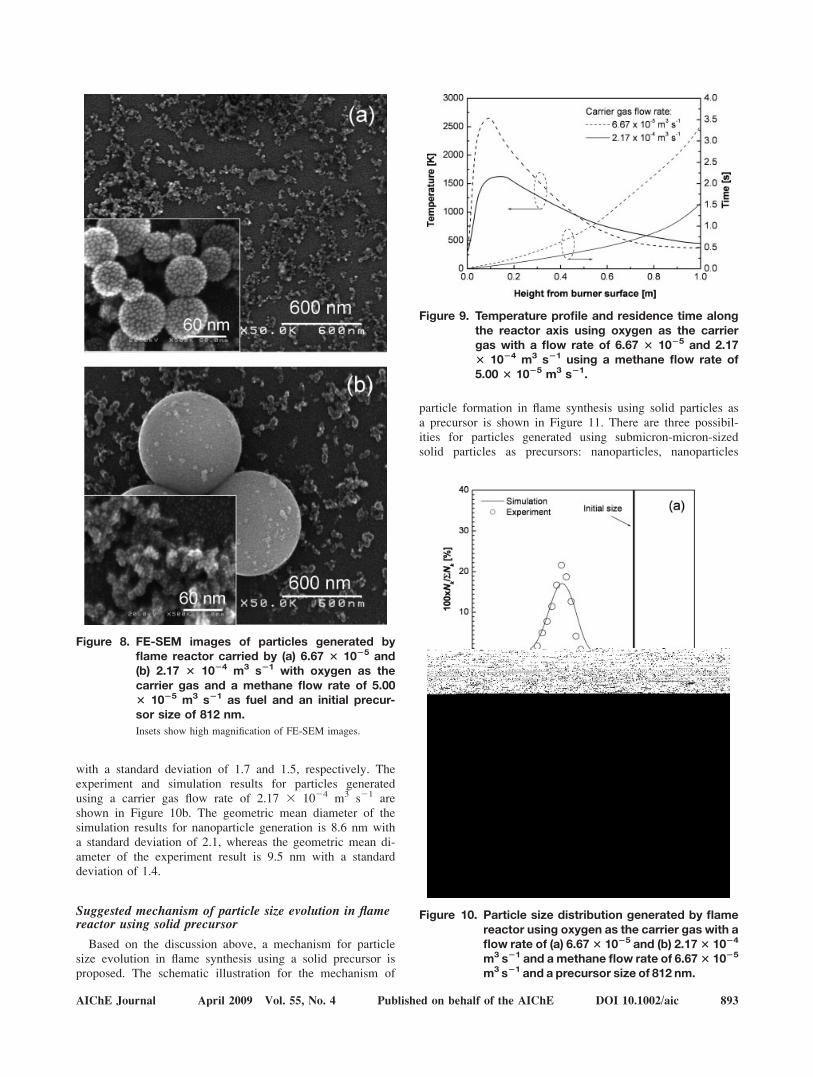
with a standard deviation of 1.7 and 1.5, respectively. Theexperiment and simulation results for particles generatedusing a carrier gas flow rate of 2.17 3 1024 m3 s21 areshown in Figure 10b. The geometric mean diameter of thesimulation results for nanoparticle generation is 8.6 nm witha standard deviation of 2.1, whereas the geometric mean di-ameter of the experiment result is 9.5 nm with a standarddeviation of 1.4.
Suggested mechanism of particle size evolution in flamereactor using solid precursor
Based on the discussion above, a mechanism for particlesize evolution in flame synthesis using a solid precursor isproposed. The schematic illustration for the mechanism of
particle formation in flame synthesis using solid particles asa precursor is shown in Figure 11. There are three possibil-ities for particles generated using submicron-micron-sizedsolid particles as precursors: nanoparticles, nanoparticles
Figure 8. FE-SEM images of particles generated byflame reactor carried by (a) 6.67 3 1025 and(b) 2.17 3 1024 m3 s21 with oxygen as thecarrier gas and a methane flow rate of 5.003 1025 m3 s21 as fuel and an initial precur-sor size of 812 nm.
Insets show high magnification of FE-SEM images.
Figure 9. Temperature profile and residence time alongthe reactor axis using oxygen as the carriergas with a flow rate of 6.67 3 1025 and 2.173 1024 m3 s21 using a methane flow rate of5.00 3 1025 m3 s21.
Figure 10. Particle size distribution generated by flamereactor using oxygen as the carrier gas with aflow rate of (a) 6.673 1025 and (b) 2.173 1024
m3 s21 and amethane flow rate of 6.673 1025
m3 s21 and a precursor size of 812 nm.
AIChE Journal April 2009 Vol. 55, No. 4 Published on behalf of the AIChE DOI 10.1002/aic 893

combined with particles relatively unchanged in size and par-ticles relatively unchanged in size. The generated particlesdepend on the parameters discussed above. Nanoparticle gen-eration is started by evaporating a solid precursor to producevapors or monomers (molecules). Particle reformation iscaused by nucleation of vapors when supersaturation occurseither by increasing vapor concentration or decreasing thetemperature. The first particles generated by the nucleationprocess are called clusters. The clusters can grow further bycoagulation with other clusters or particles and condensationwith monomers. This mechanism is known as gas-to-particleconversion.20 Occasionally, supersaturation occurs when theevaporation of solid precursor is not complete, producing abimodal size distribution. This occurs when the submicrome-ter-micrometer sized particles are smaller than the originalparticles and nanoparticles arise from gas phase particle syn-thesis. Particle size remains relatively unchanged when theinitial particles barely evaporate. This is due to the surround-ing temperature being low enough to evaporate the initialparticles. The generated particles can be obtained throughmodeling by considering both solid evaporation and gas-to-particle conversion.
Conclusions
Silica nanoparticles were generated through submicrome-ter-micrometer sized solid-fed flame synthesis. The modelexplaining the proposed mechanism also was presented. Thesuggested modeling involved two routes: solid evaporationfor silica vapor generation and a gas-to-particle conversion togenerate silica nanoparticles from vapor nucleation, coagula-tion and surface growth mechanisms. The results showed thatthe flame temperature increased with an increasing methaneflow rate as fuel that can control the evaporation stage andthe gas-to-particle conversion stage. For a methane flow rateof 1.67 3 1025 m3 s21, the initial particle size was mini-mally reduced. However, using a methane flow rate of 6.673 1025 m3 s21, silica nanoparticles can be produced.Increasing the carrier gas flow rate leads to the decreasingtemperature flame and residence time, producing smallernanoparticles together with an incompletely evaporated pre-cursor. Nonagglomerated and larger nanoparticles wereobtained using a carrier gas flow rate as low as 6.67 3 1025
m3 s21. By increasing the precursor particle size from 812nm to 1912 nm, while other conditions remained constant,
the evaporation rate decreased, producing smaller nanopar-ticles together with barely evaporated particles. The model-ing results describe the mechanism of nanoparticle synthesisin a flame reactor using a solid precursor, which was sup-ported by experimental work.
Acknowledgments
The authors wish to thank Nguyen Thi My Diep for assistance in ex-perimental work and Tokuyama Co. Ltd., Tsukuba, Japan, for providingsilica particles. The Ministry of Education, Culture, Sports, Science, andTechnology (MEXT) of Japan (W.W. and A. P.) are acknowledged forproviding doctoral scholarships.
Notation
A5 an empirical constant equal to 4.0B5 an empirical constant equal to 0.5
C1e5 the first constant in the dissipation energy equationC2e5 the second constant in the dissipation energy equationCl5 the constant of the turbulent viscositydp5particle diameter, mGk5 the generation of turbulence kinetic energy due to mean veloc-
ity gradients, J m23 s21
J(k)5nucleation rate, m23 s21
k5 turbulence kinetic energy, m2 s22
k*5 the critical size nodekB5Boltzmann constant, J K21
Mw,i5molecular weight of species i, kg mol21
m15mass of a silica molecule, kgN(1)5 silica vapor number concentration, m23
N(k)5number concentration of silica particles at the kth node, m23
Ns1;k 5 number concentration of monomers over a k sized particle at
saturation, m23
No5 initial silica particle number concentration, m23
ns5 saturated silica vapor concentration, molecules m23
ps5 saturated pressure, N m22
Ri,r5 the net rate of production of species i due to reaction r, kgm23 s21
S5 saturation ratios15 surface of a silica molecule, m2
T5 temperature, Kt5 time, sui5velocity components, m s21
v(k)5volume of particles at the kth node, m3
v*5 critical volume of particle, m3
v15volume of a silica molecule, m3
v0i, r5 stoichiometric coefficient for reactant i in the reaction rv@j, r5 stoichiometric coefficient for product j in the reaction r
xi5 coordinate direction, mYP5 the mass fraction of any product species PYR5 the mass fraction of particular reactant R
Greek letters
B5 collision frequency functionv(i,j,k)5 size operator due to coagulation at the kth node
e5dissipation rate of turbulent kinetic energy, m2 s23
l5gas viscosity, kg m21 s21
lt5 the turbulent viscosity, kg m21 s21
q5gas density, kg m23
qp5particle density, kg m23
r5 surface tension, N m21
rk5 turbulent Prandtl number for kre5 turbulent Prandtl number for e
n(k)5 size operator due to nucleation at the kth node
Literature Cited
1. Pratsinis SE. Flame aerosol synthesis of ceramic powders. ProgEnergy Combust Sci. 1998;24:197–219.
Figure 11. Particle formation illustration of solid-fedflame synthesis.
894 DOI 10.1002/aic Published on behalf of the AIChE April 2009 Vol. 55, No. 4 AIChE Journal
2. Roth P. Particle synthesis in flame. Proc Combust Inst.2007;31:1773–1788.
3. Dittmann R, Richter J, Vital A, Piazza D, Aneziris C, Graule T.Influence of burner scale-up on characteristics of flame-synthesizedtitania and silica nanoparticles. Adv Eng Mater. 2005;7:354–360.
4. Wegner K, Pratsinis SE. Scale-up of nanoparticle synthesis in diffu-sion flame reactors. Chem Eng Sci. 2003;58:4581–4589.
5. Mueller R, Madler L, Pratsinis SE. Nanoparticle synthesis at highproduction rates by flame spray pyrolysis. Chem Eng Sci.2003;58:1969–1976.
6. Kammler HK, Madler L, Pratsinis SE. Flame synthesis of nanopar-ticles. Chem Eng Technol. 2001;24:583–596.
7. Schild A, Gutsch A, Muhlenweg H, Pratsinis SE. Simulation ofnanoparticle production in premixed aerosol flow reactors by inter-facing fluid mechanics and particle dynamics. J Nanoparticle Res.1999;1:305–315.
8. Strobel R, Pratsinis SE. Flame aerosol synthesis of smart nanostruc-tured materials. J Mater Chem. 2007;17:4743–4756.
9. Panda S, Pratsinis SE. Modeling the synthesis of aluminum particlesby evaporation-condensation in an aerosol flow reactor. NanostructMater. 1995;5:755–767.
10. Kruis FE, Kusters KA, Pratsinis SE, Scarlett B. A simple model forthe evolution of the characteristics of aggregate particles undergoingcoagulation and sintering. Aerosol Sci Technol. 1993;19:514–526.
11. Mueller R, Jossen R, Kammler HK, Pratsinis SE. Growth of zirconiaparticles made by flame spray pyrolysis. AIChE J. 2004;50:3085–3094.
12. Muhlenweg H, Gutsch A, Schild A, Pratsinis SE. Process simulationof gas-to-particle-synthesis via population balances: investigation ofthree models. Chem Eng Sci. 2002;57:2305–2322.
13. Gutsch A, Muhlenweg H, Kramer M. Tailor-made nanoparticles viagas-phase synthesis. Small. 2005;1:30–46.
14. Prakash A, Bapat AP, Zachariah MR. A simple numerical algorithmand software for solution of nucleation, surface growth, and coagula-tion problems. Aerosol Sci Technol. 2003;37:892–898.
15. Pratsinis SE. Simultaneous nucleation, condensation, and coagulationin aerosol reactors. J Colloid Interface Sci. 1988;124:416–427.
16. Gelbard F, Seinfeld H. Simulation of multicomponent aerosol dy-namics. J Colloid Interface Sci. 1980;78:485–501.
17. Okuyama K, Kousaka Y, Tohge N, Yamamoto S, Wu JJ, FlaganRC, Seinfeld JH. Production of ultrafine metal oxide aerosol par-ticles by thermal decomposition of metal alkoxide vapors. AIChE J.1986;32:2010–2019.
18. Lehtinen KEJ, Zachariah MR. Self-preserving theory for the volumedistribution of particles undergoing brownian coagulation. J ColloidInterface Sci. 2001;242:314–318.
19. Madler L, Kammler HK, Mueller R, Pratsinis SE. Controlled synthe-sis of nanostructured particles by flame spray pyrolysis. J AerosolSci. 2002;33:369–389.
20. Kodas TT, Hampden-Smith MJ. Aerosol Processing of Materials.New York: Wiley-VCH, 1999.
21. Heine MC, Pratsinis SE. Droplet and particle dynamics during flamespray synthesis of nanoparticles. Ind Eng Chem Res. 2005;44:6222–6232.
22. Purwanto A, Wang WN, Lenggoro IW, Okuyama K. Formation andluminescence enhancement of agglomerate-free YAG:Ce31 submi-crometer particles by flame-assisted spray pyrolysis. J ElectrochemSoc. 2007;154:J91–J96.
23. Purwanto A, Wang WN, Lenggoro IW, Okuyama K. Formation ofBaTiO3 nanoparticles from an aqueous precursor by flame-assistedspray pyrolysis. J Eur Ceram Soc. 2007;27:4489–4497.
24. Yen WM, Shionoya S, Yamamoto H. Phosphor Handbook, 2nd ed.Boca Raton: CRC Press Taylor & Francis Group, LLC, 2007.
25. FLUENT 6.3 User’s Guide. Lebanon: FLUENT Inc., 1996.26. Xiong Y, Lyons SW, Kodas TT, Pratsinis SE. Volatile metal oxide
evaporation during aerosol decomposition. J Am Ceram Soc.1995;78:2490–2496.
27. Lenggoro IW, Hata T, Iskandar F, Lunden MM, Okuyama K. An ex-perimental and modeling investigation of particle production byspray pyrolysis using a laminar flow aerosol reactor. J Mater Res.2000;15:733–743.
28. Widiyastuti W, Wang WN, Lenggoro IW, Iskandar F, Okuyama K.Simulation and experimental study of spray pyrolysis of polydis-persed droplets. J Mater Res. 2007;22:1888–1898.
29. Perry HP, Green DW, Green D. Perry’s Chemical Engineers’ Hand-book. USA: McGraw-Hill Companies Inc., 1999.
30. Purwanto A, Lenggoro IW, Chang H, Okuyama K. Preparation ofsubmicron- and nanometer-sized particles of Y2O3:Eu
31 by flamespray pyrolysis using ultrasonic and two-fluid atomizers. J ChemEng Jpn. 2006;39:68–76.
31. Johannessen T, Pratsinis SE, Livbjerg H. Computational fluid-parti-cle dynamics for the flame synthesis of alumina particles. Chem EngSci. 2000;55:177–191.
32. Seto T, Hirota A, Fujimoto T, Shimada M, Okuyama K. Sintering ofpolydisperse nanometer-sized agglomerates. Aerosol Sci Technol.1997;27:422–438.
Manuscript received Dec. 10, 2007, and revision received Sept. 8, 2008.
AIChE Journal April 2009 Vol. 55, No. 4 Published on behalf of the AIChE DOI 10.1002/aic 895