Nanocrystalline MgB4O7:Dy for high dose measurement of gamma radiation
10
phys. stat. sol. (a) 204, No. 7, 2416 – 2425 (2007) / DOI 10.1002/pssa.200622487 © 2007 WILEY-VCH Verlag GmbH & Co. KGaA, Weinheim Nanocrystalline MgB 4 O 7 :Dy for high dose measurement of gamma radiation S. P. Lochab *, 1 , A. Pandey *, 2 , P. D. Sahare 3 , R. S. Chauhan 4 , Numan Salah 5 , and Ranju Ranjan 3 1 Inter-University Accelerator Centre, Aruna Asaf Ali Marg, New Delhi-110067, India 2 Department of Physics, Sri Venkateswara College, University of Delhi, Benito Juarez Road, Dhaula Kuan, New Delhi-110021, India 3 Department of Physics & Astrophysics, University of Delhi, Delhi-110007, India 4 Department of Physics, RBS College, B. R. Ambedkar University, Agra-282002, India 5 Department of Physics, Faculty of Applied Sciences, Thamar University, Thamar, Yemen Received 5 October 2006, revised 13 February 2007, accepted 6 March 2007 Published online 19 April 2007 PACS 78.55.Hx, 78.60.Kn, 78.67.Bf, 81.20.Ka Magnesium borate activated by dysprosium (MgB 4 O 7 : Dy) is a low-Z eff , tissue-equivalent material that is commonly used for medical dosimetry of ionizing radiations such as gamma and X-rays using the ther- moluminescence (TL) technique. Nanocrystals of the same material are produced and their TL characte- ristics are studied. It is found that the nanocrystalline MgB 4 O 7 : Dy with a dopant concentration of 1000 ppm is the most sensitive amongst varying dopant concentrations, with its sensitivity equal to 0.025 times that of the standard phosphor CaSO 4 : Dy. The glow curve has two peaks at 154 °C and 221 °C. The nanophosphor has very poor sensitivity for low doses up to 10 Gy but beyond this dose the phosphor ex- hibits a linear response up to 5000 Gy. On increasing the dose further the response first becomes suprali- near and then sublinear, finally resulting into saturation. Considering also its low fading particularly under post-irradiation annealing and excellent reusability features, this nanophosphor may be used for high dose (10 – 5000 Gy) measurements of ionizing radiations. © 2007 WILEY-VCH Verlag GmbH & Co. KGaA, Weinheim 1 Introduction For purposes of personnel dosimetry, a thermoluminescent phosphor is expected to show certain features such as: a relatively simple glow curve having ideally a single peak with its temperature at about 200 °C; high sensitivity that includes both a high efficiency of light emission and a low threshold dose; low fad- ing; good linearity of the TL signal in the specific useful range of radiation dose; and apart from other such features, an effective atomic number Z eff , which is close to that of the biological tissue in order to deal with a tissue equivalent material. Few materials have been found to possess all the above features and thus a search in this area is in constant progress. The presently available TL dosimetric materials can be grouped into two main categories: (i) tissue equivalent phosphors that in general show poor sensitiv- ity, such as Li 2 B 4 O 7 , LiF, MgB 4 O 7 etc. [1 – 7] and (ii) compounds with high sensitivity but no tissue equi- valence, such as CaSO 4 , CaF 2 , K 2 Ca 2 (SO 4 ) 3 etc. [8 – 11]. There exists only a single TL material, which is a particular type of LiF, doped with Mg, Cu, P (TLD-700H) that combines together tissue equivalence and high sensitivity properties [12]. * Corresponding authors: e-mail: [email protected], [email protected]
Transcript of Nanocrystalline MgB4O7:Dy for high dose measurement of gamma radiation

phys. stat. sol. (a) 204, No. 7, 2416–2425 (2007) / DOI 10.1002/pssa.200622487
© 2007 WILEY-VCH Verlag GmbH & Co. KGaA, Weinheim
Nanocrystalline MgB4O7:Dy for high dose measurement
of gamma radiation
S. P. Lochab*, 1, A. Pandey*, 2, P. D. Sahare3, R. S. Chauhan4, Numan Salah5,
and Ranju Ranjan3
1 Inter-University Accelerator Centre, Aruna Asaf Ali Marg, New Delhi-110067, India 2 Department of Physics, Sri Venkateswara College, University of Delhi, Benito Juarez Road,
Dhaula Kuan, New Delhi-110021, India 3 Department of Physics & Astrophysics, University of Delhi, Delhi-110007, India 4 Department of Physics, RBS College, B. R. Ambedkar University, Agra-282002, India 5 Department of Physics, Faculty of Applied Sciences, Thamar University, Thamar, Yemen
Received 5 October 2006, revised 13 February 2007, accepted 6 March 2007
Published online 19 April 2007
PACS 78.55.Hx, 78.60.Kn, 78.67.Bf, 81.20.Ka
Magnesium borate activated by dysprosium (MgB4O
7:Dy) is a low-Z
eff, tissue-equivalent material that is
commonly used for medical dosimetry of ionizing radiations such as gamma and X-rays using the ther-
moluminescence (TL) technique. Nanocrystals of the same material are produced and their TL characte-
ristics are studied. It is found that the nanocrystalline MgB4O
7:Dy with a dopant concentration of
1000 ppm is the most sensitive amongst varying dopant concentrations, with its sensitivity equal to 0.025
times that of the standard phosphor CaSO4:Dy. The glow curve has two peaks at 154 °C and 221 °C. The
nanophosphor has very poor sensitivity for low doses up to 10 Gy but beyond this dose the phosphor ex-
hibits a linear response up to 5000 Gy. On increasing the dose further the response first becomes suprali-
near and then sublinear, finally resulting into saturation. Considering also its low fading particularly under
post-irradiation annealing and excellent reusability features, this nanophosphor may be used for high dose
(10–5000 Gy) measurements of ionizing radiations.
© 2007 WILEY-VCH Verlag GmbH & Co. KGaA, Weinheim
1 Introduction
For purposes of personnel dosimetry, a thermoluminescent phosphor is expected to show certain features such as: a relatively simple glow curve having ideally a single peak with its temperature at about 200 °C; high sensitivity that includes both a high efficiency of light emission and a low threshold dose; low fad-ing; good linearity of the TL signal in the specific useful range of radiation dose; and apart from other such features, an effective atomic number Zeff, which is close to that of the biological tissue in order to deal with a tissue equivalent material. Few materials have been found to possess all the above features and thus a search in this area is in constant progress. The presently available TL dosimetric materials can be grouped into two main categories: (i) tissue equivalent phosphors that in general show poor sensitiv-ity, such as Li2B4O7, LiF, MgB4O7 etc. [1–7] and (ii) compounds with high sensitivity but no tissue equi-valence, such as CaSO4, CaF2, K2Ca2(SO4)3 etc. [8–11]. There exists only a single TL material, which is a particular type of LiF, doped with Mg, Cu, P (TLD-700H) that combines together tissue equivalence and high sensitivity properties [12].
* Corresponding authors: e-mail: [email protected], [email protected]
phys. stat. sol. (a) 204, No. 7 (2007) 2417
www.pss-a.com © 2007 WILEY-VCH Verlag GmbH & Co. KGaA, Weinheim
Original
Paper
Recently, interest of researchers towards nanomaterials has increased because of the enhanced optical, electronic and structural properties of these materials. We have in fact even reported some TL character-istics of a couple of nanomaterials [13, 14]. In the present paper we are presenting the TL response to gamma radiations of nanocrystalline MgB4O7 :Dy, a near tissue equivalent phosphor whose effective atomic number for photoelectric absorption is equal to 8.4 (sufficiently close to that of the biological tissue having effective atomic number 7.4). It is found that the concerned nanomaterial prepared by combustion method is 0.025 times less sensitive than the standard TL phosphor CaSO4 :Dy and quite less (~0.05 times) compared to its corresponding microcrystalline material [15]. Reduction in TL sensitivity on decreasing the particle size from the order of micrometers to nanometers gives an insight into the TL emission mechanism of the material. PL emission spectrum of the nanomaterial has also been taken and the result is presented and discussed in this paper. Moreover, it is seen that the TL response of this nano-phosphor is linear for higher doses. An explanation for a peculiar TL response of the nanophosphor has also been done in this paper.
2 Experimental procedure
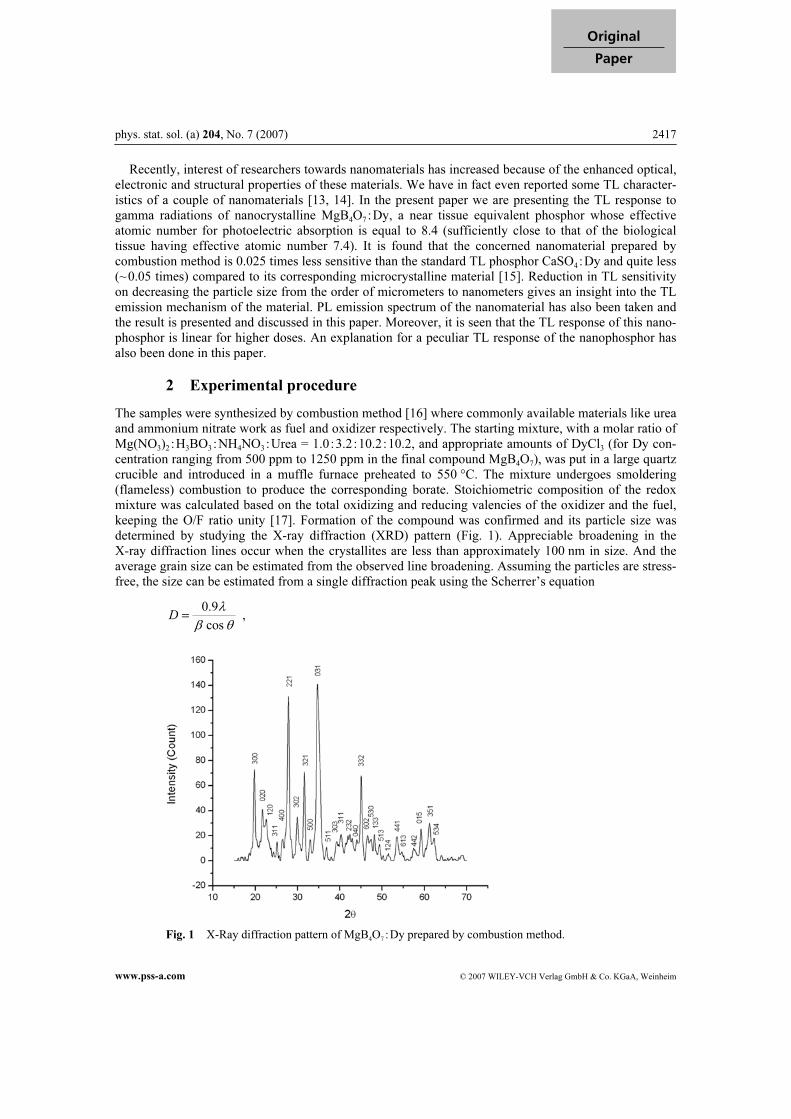
The samples were synthesized by combustion method [16] where commonly available materials like urea and ammonium nitrate work as fuel and oxidizer respectively. The starting mixture, with a molar ratio of Mg(NO3)2 :H3BO3 :NH4NO3 :Urea = 1.0:3.2:10.2:10.2, and appropriate amounts of DyCl3 (for Dy con-centration ranging from 500 ppm to 1250 ppm in the final compound MgB4O7), was put in a large quartz crucible and introduced in a muffle furnace preheated to 550 °C. The mixture undergoes smoldering (flameless) combustion to produce the corresponding borate. Stoichiometric composition of the redox mixture was calculated based on the total oxidizing and reducing valencies of the oxidizer and the fuel, keeping the O/F ratio unity [17]. Formation of the compound was confirmed and its particle size was determined by studying the X-ray diffraction (XRD) pattern (Fig. 1). Appreciable broadening in the X-ray diffraction lines occur when the crystallites are less than approximately 100 nm in size. And the average grain size can be estimated from the observed line broadening. Assuming the particles are stress-free, the size can be estimated from a single diffraction peak using the Scherrer’s equation
0.9
cosD
λ
β θ= ,
Fig. 1 X-Ray diffraction pattern of MgB4O
7:Dy prepared by combustion method.

2418 S. P. Lochab et al.: Nanocrystalline MgB4O
7:Dy for high dose measurement of gamma radiation
© 2007 WILEY-VCH Verlag GmbH & Co. KGaA, Weinheim www.pss-a.com
where D is the average grain size of the crystallites, λ, the incident wavelength, θ, the Bragg angle and β, the diffracted full-width at half-maximum (in radians) caused by the crystallites. Using the xrd pattern, the average grain size of the concerned phosphor was calculated to be approximately 22 nm. Figure 1 shows the X-ray diffraction patterns with hkl values. When the data is fitted with the Powder X-ray Data Analysis System it is found that the compound exhibits an orthogonal structure. The XRD pattern is fitted well with orthogonal structure having lattice parameters a = 13.475, b = 8.200, c = 7.952 with lattice volume = 878.38 Å and χ2 = 0.22210. The shape and size of the particles of the concerned phosphor have also been determined by TEM. The TEM photograph as shown in Fig. 2 shows that the particles are of tubular shape with their approximate diameter ranging between 19 to 36 nm. However, the difference in the estimation of the particle size by the two different methods i.e. XRD and TEM is within the experimental limits. Samples were exposed to gamma rays from a Co60 source for various exposures at room temperature. After the exposure, TL glow curves were recorded at a heating rate of 1 °C s–1 under nitrogen atmosphere on a Harshaw TLD Reader (Model 3500). For comparison, glow curves were also recorded for dosimetry
Fig. 3 TL glow curves of nanocrystalline MgB4O
7:Dy exposed to 1 kGy of gamma rays. Dy concentra-
tion varies as (a) 500 ppm, (b) 750 ppm, (c) 1000 ppm and (d) 1250 ppm.
Fig. 2 TEM photograph of nanocrystalline
MgB4O
7:Dy.

phys. stat. sol. (a) 204, No. 7 (2007) 2419
www.pss-a.com © 2007 WILEY-VCH Verlag GmbH & Co. KGaA, Weinheim
Original
Paper
grade TLD-100 chips irradiated for various exposures. Photoluminescence spectra of the samples were recorded using Aminco Bowman Spectrophotofluorometer for excitation wavelength 365 nm.
3 Results and discussions
3.1 Dopant concentration
Figure 3 shows the TL glow curves of the nanocrystalline MgB4O7 :Dy with varying dopant concentra-tions exposed to 1 kGy of gamma rays. As can be seen in the figure the TL intensity increases as the Dy concentration increases from 500 to 1000 ppm. But for a concentration of 1250 ppm the intensity falls indicating that the concerned phosphor is most sensitive with 1000 ppm concentration of the dopant. Similar results were obtained for different doses of gamma radiation and thus all further experiments were performed with the sample having 1000 ppm dopant concentration.
3.2 TL response
Figure 4 shows TL glow curves of the nanocrystalline MgB4O7 :Dy and the standard phosphor CaSO4 :Dy exposed to gamma rays (100 Gy). It is seen that the peak intensity of the nanophosphor is 1/40 times that of the standard phosphor. When a comparison of this nanophosphor is made with its corresponding microcrystalline material [15, 18], it is found that the nanophosphor has two peaks: one at 154 °C and the other at 221 °C whereas the microphosphor has just a single peak at 223 °C. In addition to this the sensitivity of the nanomaterial is also found to be reduced (approximately 0.05 times that of the microcrystalline material). This may be related to the decrease in the volume to surface ratio on de-creasing the particle size leading to a decrease in the number of defects formed within the volume of the crystals by the ions doped in it. Since TL sensitivity is related to the defects formed in the crystal by the doped ions under irradiation, a decrease in their number might be the reason for its reduction. Moreover, in the case of nanoparticles the surface to volume ratio is high which results into a high surface barrier energy. Therefore the low doses of gamma radiation are unable to create enough defect states to produce TL. On increasing the dose the total energy density will overcome the surface barrier to produce more defects states and enhance the TL intensity.
Fig. 4 TL glow curves of CaSO4:Dy (curve a) and nanocrystalline MgB
4O
7:Dy (curve b).

2420 S. P. Lochab et al.: Nanocrystalline MgB4O
7:Dy for high dose measurement of gamma radiation
© 2007 WILEY-VCH Verlag GmbH & Co. KGaA, Weinheim www.pss-a.com
Fig. 5 TL response of nanophosphor MgB4O
7:Dy.
The appearance of two peaks in the glow curve of the nanophosphor indicates that there are possibly two kinds of trapping sites, one which is shallower leading to the peak at lower temperature and the other which is deeper (similar to the one present in the corresponding microphosphor) leading to the peak at higher temperature. Appearance of the additional peak at lower temperature corresponding to a lower activation energy trapping sites seems to be a typical characteristic feature of this material since no such low temperature peak was observed in case of the nanocrystalline K2Ca2(SO4)3 :Eu that has been reported earlier [13]. The most striking feature of this nanophosphor is its linear response at high doses. On the other hand the microcrystalline phosphor exhibits a linear response over a lower dose range 10–5 to 10 Gy [15]. As can be seen in Fig. 5 the TL sensitivity of the nanophosphor is very poor for low doses of gamma rays (0.1 to 10 Gy). However, the TL response becomes linear in the range 10 Gy to 5 kGy. On further in-creasing the dose the response initially becomes supralinear (5 to 10 kGy) and then sublinear finally resulting into saturation (over 15 kGy). An explanation for such a behavior of the nanophosphor can be made on the basis of the Track Inter-action Model (TIM) [19], a model that is used to explain a similar behavior of TL materials when irradi-ated to swift heavy ions (SHI) having energies in the order of MeV [19–22]. According to this model a densely ionized region created mainly through inelastic collisions surrounds an SHI track in the TL ma-terial. Figure 6 shows a geometrical representation of two SHI tracks according to the TIM. At low flu-ences of SHI the distance between nearest neighbor tracks (R) is large and therefore the recombination leading to TL occurs entirely within the track. The electrons escaping from the track are captured by the non-radiative centers in the inter-track region and do not yield TL. Thus the TL signal is simply propor-tional to the number of SHI tracks. As the fluence increases, the average distance between nearest neighbor tracks decreases and electrons escaping the parent track can reach the luminescent center in neighboring tracks, thus resulting in increased production of light leading to supralinearity. At very high fluence the tracks overlap each other as a result of which the effective ionization is reduced leading to sublinearity and saturation. Since in the present nanophosphor a similar behavior is obtained on irradiat-ing it with gamma radiation, gamma photons may be thought of as creating a densely ionized region surrounding their tracks similar to the swift heavy ions. Now, the nanophosphor has a grain size of just 22 nm. Thus even at higher doses when the distance between nearest neighbor tracks is small it is less probable for electrons of one track to recombine at another track since the possibility of the neighboring track to be in a different grain altogether would be

phys. stat. sol. (a) 204, No. 7 (2007) 2421
www.pss-a.com © 2007 WILEY-VCH Verlag GmbH & Co. KGaA, Weinheim
Original
Paper
Fig. 6 Geometric representation of two SHI tracks according to the Track Interaction Model.
very high as a result of the smaller grain size of the nanoparticles. Therefore the TL response is linear even at higher doses. And thus this nanophosphor can be used for accurately measuring high doses of gamma radiation. The Track Interaction Model that has been proposed here is only speculative and a model better than this may be put up. However, in the light of the TL response of the nanophosphor being very similar to that of the TLD material exposed to heavy charged particles it is found to be appropriate to use this mo-del to explain the TL response of the nanophosphor to gamma radiation since this model explains very well the similar TL response to heavy charged particles. However, it is very important to note here, that in case of the gamma radiation the tracks do not pro-duce any densely ionized regions, and in fact only the average ionization density within each nanoparti-cle should be considered. So, in case of low doses, the average ionization density is poor and therefore the electrons do not recombine with luminescence centers that are generated far away within the same particle itself to produce TL. On increasing the dose the average ionization density increases and there-fore the electrons easily recombine with luminescence centers that are now generated more in number and hence are closer to the electron traps. Moreover, the electrons of one “track” (i.e. average ionization in one nanoparticle) will not recombine with the luminescent centers of the other neighboring “track” (i.e. average ionization in another nanoparticle) and therefore the nanophosphor gives a linear response even at higher doses. However, the supralinearity of the TL response can still only be explained using the Track Interaction Model and thus rejecting this model entirely, for explaining the TL response of the nanophosphor, would not be justified.
3.3 PL and other characteristics
PL emission spectrum of the gamma irradiated nanocrystalline MgB4O7 :Dy with excitation wavelength 365 nm is shown in Fig. 7. Two peaks are obtained, one at around 485 nm and the other at around 575 nm. These peaks may be assigned to the Dy3+ emission due to the transitions 4F9/2 → 6H15/2 and 4F9/2 →
6H13/2 respectively [23, 24]. A similar spectrum is obtained in case of the unirradiated sample which indicates that Dy enters the material in its tri-valent form and retains this form even after irradia-tion. A simple glow curve structure that does not change with exposure, a simple method of preparation and a linear response over a wide range of radiation dose is not enough for a material to be well suited for radiation dosimetry. Stability and reusability is a couple of other factors that a material should be good at

2422 S. P. Lochab et al.: Nanocrystalline MgB4O
7:Dy for high dose measurement of gamma radiation
© 2007 WILEY-VCH Verlag GmbH & Co. KGaA, Weinheim www.pss-a.com
Fig. 7 PL emission spectrum of gamma irradiated nanocrystalline MgB4O
7:Dy with excitation wave-
length 365 nm.
to be of any use in radiation dosimetry. Thus the concerned nanomaterial was checked for these features too. A sample of the nanomaterial was stored for a few days without taking any precautions to shield it from light and humidity and it was found that the high temperature glow peak was quite stable. However, as can be seen in Fig. 8 which shows the TL glow curves of the irradiated nanophosphor after several days of irradiation (25 and 50 days), fading in the phosphor is primarily due to the lower temperature peak and thus the higher temperature peak may be regarded as the dosimetric peak whose fading is quite less (~7%). A further study of the post irradiation annealing effect on the nanophosphor is also done.
Fig. 8 TL glow curves of gamma irradiated nanocrystalline MgB4O
7:Dy taken: soon after irradiation
(curve a); after 25 days of irradiation (curve b); and after 50 days of irradiation (curve c).
phys. stat. sol. (a) 204, No. 7 (2007) 2423
www.pss-a.com © 2007 WILEY-VCH Verlag GmbH & Co. KGaA, Weinheim
Original
Paper
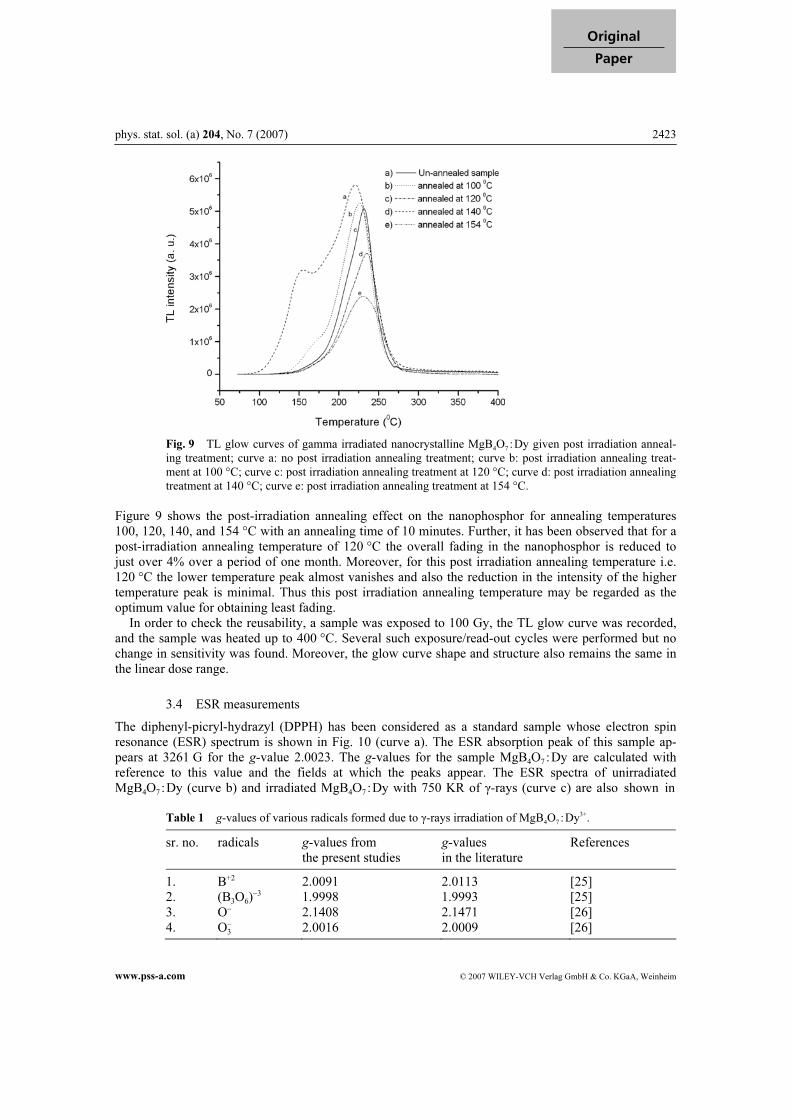
Fig. 9 TL glow curves of gamma irradiated nanocrystalline MgB4O
7:Dy given post irradiation anneal-
ing treatment; curve a: no post irradiation annealing treatment; curve b: post irradiation annealing treat-
ment at 100 °C; curve c: post irradiation annealing treatment at 120 °C; curve d: post irradiation annealing
treatment at 140 °C; curve e: post irradiation annealing treatment at 154 °C.
Figure 9 shows the post-irradiation annealing effect on the nanophosphor for annealing temperatures 100, 120, 140, and 154 °C with an annealing time of 10 minutes. Further, it has been observed that for a post-irradiation annealing temperature of 120 °C the overall fading in the nanophosphor is reduced to just over 4% over a period of one month. Moreover, for this post irradiation annealing temperature i.e. 120 °C the lower temperature peak almost vanishes and also the reduction in the intensity of the higher temperature peak is minimal. Thus this post irradiation annealing temperature may be regarded as the optimum value for obtaining least fading. In order to check the reusability, a sample was exposed to 100 Gy, the TL glow curve was recorded, and the sample was heated up to 400 °C. Several such exposure/read-out cycles were performed but no change in sensitivity was found. Moreover, the glow curve shape and structure also remains the same in the linear dose range.
3.4 ESR measurements
The diphenyl-picryl-hydrazyl (DPPH) has been considered as a standard sample whose electron spin resonance (ESR) spectrum is shown in Fig. 10 (curve a). The ESR absorption peak of this sample ap-pears at 3261 G for the g-value 2.0023. The g-values for the sample MgB4O7 :Dy are calculated with reference to this value and the fields at which the peaks appear. The ESR spectra of unirradiated MgB4O7 :Dy (curve b) and irradiated MgB4O7 :Dy with 750 KR of γ-rays (curve c) are also shown in
Table 1 g-values of various radicals formed due to γ-rays irradiation of MgB
4O
7:Dy3+.
sr. no. radicals g-values from the present studies
g-values in the literature
References
1. B+2 2.0091 2.0113 [25] 2. (B3O6)
−3 1.9998 1.9993 [25] 3. O– 2.1408 2.1471 [26] 4. O3
– 2.0016 2.0009 [26]

2424 S. P. Lochab et al.: Nanocrystalline MgB4O
7:Dy for high dose measurement of gamma radiation
© 2007 WILEY-VCH Verlag GmbH & Co. KGaA, Weinheim www.pss-a.com
DPPH
H = 3261 G0
Unirradiated
750KR
H = 3300 Gs
(a)
(b)
(c)
g = 2.00230
100 G
SCALE
Fig. 10 ESR spectrum of MgB4O
7:Dy3+.
Fig. 10. The ESR signal of the unirradiated sample is very weak possibly due to the annealing of defects by heating. However on γ-rays irradiation of the phosphor some radicals such as (B3O6)
3−, O−, O3−, B2+,
etc. could be formed and thus peaks though not very prominent do appear in the ESR spectrum of the sample. Assignments of the peaks to the various radicals formed have been given in Table 1. On comparing the ionic radii of the ions B2+, Mg2+ and Dy3+ (0.85, 0.86 and 1.52 Å, respectively), it can be said that the impurity Dy3+ may settle near B2+ or Mg2+ but it can never replace either of them because of its larger size. Thus Dy3+ can get incorporated only as an interstitial, distorting the orthogonal structure of the crystal itself. However, since the concentration of Dy in MgB4O7 is only 1000 ppm which is by all means quite a small amount, no such change in the orthogonal structure of the crystal is observed through the XRD pattern of the material. On irradiation of the sample with γ-rays, more and more electrons may get trapped near the B2+ ions. These electrons may come from the adjoining oxygen ions. Thus electron traps and hole (luminescence) centers are formed. During the readouts, the emissions resulting from the recombinations of these traps and hole centers may excite Dy3+ ions thus giving rise to TL. The two TL peaks in the glow curve might be arising from the traps near B2+ or Mg2+ sites respec-tively. However, it is extremely speculative to attribute the two TL peaks to these defect traps. More studies, such as ESR at LNT, TL emission spectra, UV–visible spectra, etc. are needed for a further understanding.
4 Conclusion
Nanocrystalline MgB4O7 :Dy has been prepared by combustion method. It is found that the nanomaterial has a lower sensitivity compared to its corresponding microcrystalline material. However, it has a linear TL response for high doses, poor fading and excellent reusability features. Its preparation is also quite simple and inexpensive and thus it can be used for accurately measuring high doses of gamma radiation using the TL technique.

phys. stat. sol. (a) 204, No. 7 (2007) 2425
www.pss-a.com © 2007 WILEY-VCH Verlag GmbH & Co. KGaA, Weinheim
Original
Paper
Acknowledgements We are grateful to Dr Amit Roy, Director, Inter-University Accelerator Centre, New Delhi
for providing necessary facilities to carry out this work. We are also thankful to Dr Ravi Kumar, Dr D Kanjilal, and
Mr Pawan Kularia from IUAC, New Delhi and Dr Pratik Kumar, AIIMS, New Delhi for providing help in carrying
out the experimental work.
References
[1] J. R. Cameron, personal communication (University of Wisconsin, Madison WI, 1982).
[2] Patent Harshaw Chemical Co., USA.
[3] J. H. Schulman, R. D. Kirk, and E. J. West, Proc. 1st Internat. Conf. Luminescence Dosimetry (Stanford, USA,
1967), p. 113.
[4] M. Takenaga, O. Yamamoto, and T. Yamashita, Nucl. Instrum. Methods 175, 77 (1980).
[5] M. Takenaga, O. Yamamoto, and T. Yamashita, Health Phys. 44, 387 (1983).
[6] V. A. Kazanskaya, V. V. Kuzmin, E. E. Minaeva, and A. D. Sokolov, Proc. 4th Internat. Conf. Luminescence
Dosimetry (Krakow, Poland, 1974), p. 581.
[7] V. Barbina, G. Contento, C. Furetta, M. Malisan, and R. Padovani, Radiat. Eff. Lett. 67(1–2), 55 (1981).
[8] E. Wiedemann and G. C. Schmidt, Ann. Phys. Chem. 54, 604 (1895).
[9] T. Yamashita, N. Nada, H. Onishi, and S. Kitamura, Proc. 2nd Internat. Conf. Luminescence Dosimetry (Gat-
linburg, USA, 1968), p. 4.
[10] C. Furetta and Lee Yi-Kang, Radiat. Prot. Dosim. 5, 57 (1983).
[11] P. D. Sahare, S. V. Moharil, and B. D. Bhasin, J. Phys. D, Appl. Phys. 22, 971 (1989).
[12] W. Da-Ke, S. Fu-Yin, and D. Hong-Chen, Health Phys. 46(5), 1063 (1984).
[13] A. Pandey, R. G. Sonkawade, and P. D. Sahare, J. Phys. D, Appl. Phys. 35, 2744 (2002).
[14] A. Pandey, P. D. Sahare, J. S. Bakare, S. P. Lochab, F. Singh, and D. Kanjilal, J. Phys. D, Appl. Phys. 36, 2400
(2003).
[15] J. Azorin, C. Furetta, and A. Scacco, phys. stat. sol. (a) 138, 9 (1993).
[16] T. Mimani and K. C. Patil, Mater. Phys. Mech. 4, 134 (2001).
[17] K. C. Patil, S. T. Aruna, and S. Ekambaram, Curr. Opin. Solid State Mater. Sci. 2, 158 (1997).
[18] M. Prokic, Nucl. Instrum. Methods 175, 83 (1980).
[19] Y. S. Horowitz, O. Avila, and M. Rodriguez-Villafuerte, Nucl. Instrum. Methods B 184, 85 (2001).
[20] M. Rodriguez-Villafuerte, A. E. Buenfil, I. Gamboa-deBuen, C. Ruiz-Trejo, M. E. Brandan, D. Yossian,
D. Satinger, and Y. S. Horowitz, Nucl. Instrum. Methods B 160, 377 (2000).
[21] Th. Loncol, S. Vynckier, and A. Wambersie, Radiat. Prot. Dosim. 1, 299 (1996).
[22] P. Fattibene, A. Calicchia, F. d’Errico, C. De Angelis, E. Eggers, and S. Onori, Radiat. Prot. Dosim. 1, 305
(1996).
[23] R. J. Matthews and T. G. Stoebe, J. Phys. C, Solid State Phys. 15, 6271 (1982).
[24] G. Blasse and A. Bril, Philips Tech. Rev. 31, 304 (1970).
[25] Wei Hong and L. E. Halliburton, J. Appl. Phys. 94(4), 2510 (2003).
[26] J. R. Byberg, J. Chem. Phys. 75(6), 2667 (1981).