Measurement of the cross-section for the process gamma*gamma*-- >hadrons at LEP
22
EUROPEAN ORGANIZATION FOR NUCLEAR RESEARCH CERN-EP/2002-056 17-July-2002 Measurement of the Cross-Section for the Process γγ → p¯ p at √ s ee = 183 - 189 GeV at LEP The OPAL Collaboration Abstract The exclusive production of proton-antiproton pairs in the collisions of two quasi-real pho- tons has been studied using data taken at √ s ee = 183 GeV and 189 GeV with the OPAL detector at LEP. Results are presented for p¯ p invariant masses, W , in the range 2.15 <W< 3.95 GeV. The cross-section measurements are compared with previous data and with recent analytic calculations based on the quark-diquark model. (To be submitted to Eur. Phys. J. C.)
-
Upload
independent -
Category
Documents
-
view
1 -
download
0
Transcript of Measurement of the cross-section for the process gamma*gamma*-- >hadrons at LEP

EUROPEAN ORGANIZATION FOR NUCLEAR RESEARCH
CERN-EP/2002-05617-July-2002
Measurement of the Cross-Section forthe Process γγ → pp at√
see = 183 − 189 GeV at LEP
The OPAL Collaboration
Abstract
The exclusive production of proton-antiproton pairs in the collisions of two quasi-real pho-tons has been studied using data taken at
√see = 183 GeV and 189 GeV with the OPAL detector
at LEP. Results are presented for pp invariant masses, W , in the range 2.15 < W < 3.95 GeV.The cross-section measurements are compared with previous data and with recent analyticcalculations based on the quark-diquark model.
(To be submitted to Eur. Phys. J. C.)

The OPAL Collaboration
G.Abbiendi2, C.Ainsley5, P.F. Akesson3, G.Alexander22, J. Allison16, P.Amaral9,G.Anagnostou1, K.J.Anderson9, S.Arcelli2, S.Asai23, D.Axen27, G.Azuelos18,a, I. Bailey26,
E. Barberio8, T.Barillari2, R.J. Barlow16, R.J. Batley5, P. Bechtle25, T.Behnke25, K.W.Bell20,P.J. Bell1, G.Bella22, A.Bellerive6, G.Benelli4, S. Bethke32, O.Biebel31, I.J. Bloodworth1,
O.Boeriu10, P. Bock11, D.Bonacorsi2, M.Boutemeur31, S. Braibant8, L. Brigliadori2,R.M.Brown20, K.Buesser25, H.J. Burckhart8, S. Campana4, R.K.Carnegie6, B.Caron28,A.A.Carter13, J.R.Carter5, C.Y.Chang17, D.G.Charlton1,b, A.Csilling8,g , M.Cuffiani2,
S.Dado21, G.M.Dallavalle2, S.Dallison16, A.De Roeck8, E.A.De Wolf8, K.Desch25,B.Dienes30, M.Donkers6, J.Dubbert31, E.Duchovni24, G.Duckeck31, I.P.Duerdoth16,
E. Elfgren18, E. Etzion22, F. Fabbri2, L. Feld10, P. Ferrari8, F. Fiedler31, I. Fleck10, M.Ford5,A. Frey8, A. Furtjes8, P.Gagnon12, J.W.Gary4, G.Gaycken25, C.Geich-Gimbel3,
G.Giacomelli2, P.Giacomelli2, M.Giunta4, J.Goldberg21, E.Gross24, J.Grunhaus22,M.Gruwe8, P.O.Gunther3, A.Gupta9, C.Hajdu29, M.Hamann25, G.G.Hanson4, K.Harder25,
A.Harel21, M.Harin-Dirac4, M.Hauschild8, J. Hauschildt25, C.M.Hawkes1, R.Hawkings8,R.J.Hemingway6, C.Hensel25, G.Herten10, R.D.Heuer25, J.C.Hill5, K.Hoffman9,
R.J.Homer1, D.Horvath29,c, R.Howard27, P.Huntemeyer25, P. Igo-Kemenes11, K. Ishii23,H. Jeremie18, P. Jovanovic1, T.R. Junk6, N.Kanaya26, J.Kanzaki23, G.Karapetian18,
D.Karlen6, V.Kartvelishvili16, K.Kawagoe23, T.Kawamoto23, R.K.Keeler26, R.G.Kellogg17,B.W.Kennedy20, D.H.Kim19, K.Klein11, A.Klier24, S.Kluth32, T.Kobayashi23, M.Kobel3,
S.Komamiya23, L.Kormos26, R.V.Kowalewski26, T.Kramer25, T.Kress4, P.Krieger6,l, J. vonKrogh11, D.Krop12, K.Kruger8, M.Kupper24, G.D. Lafferty16, H. Landsman21, D. Lanske14,
J.G. Layter4, A. Leins31, D. Lellouch24, J. Letts12, L. Levinson24, J. Lillich10, S.L. Lloyd13,F.K. Loebinger16, J. Lu27, J. Ludwig10, A.Macpherson28,i, W.Mader3, S.Marcellini2,
T.E.Marchant16, A.J.Martin13, J.P.Martin18, G.Masetti2, T.Mashimo23, P.Mattigm,W.J.McDonald28, J.McKenna27, T.J.McMahon1, R.A.McPherson26, F.Meijers8,
P.Mendez-Lorenzo31, W.Menges25, F.S.Merritt9, H.Mes6,a, A.Michelini2, S.Mihara23,G.Mikenberg24, D.J.Miller15, S.Moed21, W.Mohr10, T.Mori23, A.Mutter10, K.Nagai13,
I. Nakamura23, H.A.Neal33, R.Nisius8, S.W.O’Neale1, A.Oh8, A.Okpara11, M.J.Oreglia9,S.Orito23, C. Pahl32, G. Pasztor4,g, J.R. Pater16, G.N.Patrick20, J.E. Pilcher9, J. Pinfold28,D.E. Plane8, B. Poli2, J. Polok8, O. Pooth14, M.Przybycien8,n, A.Quadt3, K.Rabbertz8,C.Rembser8, P.Renkel24, H.Rick4, J.M.Roney26, S. Rosati3, Y.Rozen21, K.Runge10,
K. Sachs6, T. Saeki23, O. Sahr31, E.K.G. Sarkisyan8,j , A.D. Schaile31, O. Schaile31,P. Scharff-Hansen8, J. Schieck32, T. Schoerner-Sadenius8, M. Schroder8, M. Schumacher3,
C. Schwick8, W.G. Scott20, R. Seuster14,f , T.G. Shears8,h, B.C. Shen4,C.H. Shepherd-Themistocleous5 , P. Sherwood15, G. Siroli2, A. Skuja17, A.M. Smith8, R. Sobie26,
S. Soldner-Rembold10,d, S. Spagnolo20, F. Spano9, A. Stahl3, K. Stephens16, D. Strom19,R. Strohmer31, S. Tarem21, M.Tasevsky8 , R.J. Taylor15, R.Teuscher9, M.A.Thomson5,E.Torrence19, D.Toya23, P.Tran4, T.Trefzger31, A.Tricoli2, I. Trigger8, Z. Trocsanyi30,e,E.Tsur22, M.F.Turner-Watson1, I. Ueda23, B.Ujvari30,e, B.Vachon26, C.F.Vollmer31,
P.Vannerem10, M.Verzocchi17, H.Voss8, J. Vossebeld8,h, D.Waller6, C.P.Ward5, D.R.Ward5,P.M.Watkins1, A.T.Watson1, N.K.Watson1, P.S.Wells8, T.Wengler8, N.Wermes3,
D.Wetterling11 G.W.Wilson16,k, J.A.Wilson1, G.Wolf24, T.R.Wyatt16, S.Yamashita23,D. Zer-Zion4, L. Zivkovic24
1

1School of Physics and Astronomy, University of Birmingham, Birmingham B15 2TT, UK2Dipartimento di Fisica dell’ Universita di Bologna and INFN, I-40126 Bologna, Italy3Physikalisches Institut, Universitat Bonn, D-53115 Bonn, Germany4Department of Physics, University of California, Riverside CA 92521, USA5Cavendish Laboratory, Cambridge CB3 0HE, UK6Ottawa-Carleton Institute for Physics, Department of Physics, Carleton University, Ottawa,Ontario K1S 5B6, Canada8CERN, European Organisation for Nuclear Research, CH-1211 Geneva 23, Switzerland9Enrico Fermi Institute and Department of Physics, University of Chicago, Chicago IL 60637,USA10Fakultat fur Physik, Albert-Ludwigs-Universitat Freiburg, D-79104 Freiburg, Germany11Physikalisches Institut, Universitat Heidelberg, D-69120 Heidelberg, Germany12Indiana University, Department of Physics, Swain Hall West 117, Bloomington IN 47405,USA13Queen Mary and Westfield College, University of London, London E1 4NS, UK14Technische Hochschule Aachen, III Physikalisches Institut, Sommerfeldstrasse 26-28, D-52056Aachen, Germany15University College London, London WC1E 6BT, UK16Department of Physics, Schuster Laboratory, The University, Manchester M13 9PL, UK17Department of Physics, University of Maryland, College Park, MD 20742, USA18Laboratoire de Physique Nucleaire, Universite de Montreal, Montreal, Quebec H3C 3J7,Canada19University of Oregon, Department of Physics, Eugene OR 97403, USA20CLRC Rutherford Appleton Laboratory, Chilton, Didcot, Oxfordshire OX11 0QX, UK21Department of Physics, Technion-Israel Institute of Technology, Haifa 32000, Israel22Department of Physics and Astronomy, Tel Aviv University, Tel Aviv 69978, Israel23International Centre for Elementary Particle Physics and Department of Physics, Universityof Tokyo, Tokyo 113-0033, and Kobe University, Kobe 657-8501, Japan24Particle Physics Department, Weizmann Institute of Science, Rehovot 76100, Israel25Universitat Hamburg/DESY, Institut fur Experimentalphysik, Notkestrasse 85, D-22607 Ham-burg, Germany26University of Victoria, Department of Physics, P O Box 3055, Victoria BC V8W 3P6, Canada27University of British Columbia, Department of Physics, Vancouver BC V6T 1Z1, Canada28University of Alberta, Department of Physics, Edmonton AB T6G 2J1, Canada29Research Institute for Particle and Nuclear Physics, H-1525 Budapest, P O Box 49, Hungary30Institute of Nuclear Research, H-4001 Debrecen, P O Box 51, Hungary31Ludwig-Maximilians-Universitat Munchen, Sektion Physik, Am Coulombwall 1, D-85748Garching, Germany32Max-Planck-Institut fur Physik, Fohringer Ring 6, D-80805 Munchen, Germany33Yale University, Department of Physics, New Haven, CT 06520, USA
a and at TRIUMF, Vancouver, Canada V6T 2A3b and Royal Society University Research Fellowc and Institute of Nuclear Research, Debrecen, Hungaryd and Heisenberg Fellowe and Department of Experimental Physics, Lajos Kossuth University, Debrecen, Hungaryf and MPI Munchen
2

g and Research Institute for Particle and Nuclear Physics, Budapest, Hungaryh now at University of Liverpool, Dept of Physics, Liverpool L69 3BX, UKi and CERN, EP Div, 1211 Geneva 23j and Universitaire Instelling Antwerpen, Physics Department, B-2610 Antwerpen, Belgiumk now at University of Kansas, Dept of Physics and Astronomy, Lawrence, KS 66045, USAl now at University of Toronto, Dept of Physics, Toronto, Canadam current address Bergische Universitat, Wuppertal, Germanyn and University of Mining and Metallurgy, Cracow, Poland
1 Introduction
The exclusive production of proton-antiproton (pp) pairs in the collision of two quasi-realphotons can be used to test predictions of QCD. At LEP the photons are emitted by the beamelectrons1 and the pp pairs are produced in the process e+e− → e+e−γγ → e+e−pp.
The application of QCD to exclusive photon-photon reactions is based on the work ofBrodsky and Lepage [1]. According to their formalism the process is factorized into a non-perturbative part, which is the hadronic wave function of the final state, and a perturbativepart. Calculations based on this ansatz [2, 3] use a specific model of the proton’s three-quarkwave function by Chernyak and Zhitnitsky [4]. This calculation yields cross-sections about oneorder of magnitude smaller than the existing experimental results [5, 6, 7, 8, 9, 10], for ppcentre-of-mass energies W greater than 2.5 GeV.
To model non-perturbative effects, the introduction of quark-diquark systems has beenproposed [11]. Within this model, baryons are viewed as a combination of a quark and adiquark rather than a three-quark system. The composite nature of the diquark is taken intoaccount by form factors.
Recent studies [12] have extended the systematic investigation of hard exclusive reactionswithin the quark-diquark model to photon-photon processes [13, 14, 15, 16]. In these studiesthe cross-sections have been calculated down to W values of 2.2 GeV below which the quark-diquark model is no longer expected to be valid. Most of the experimental data, however, havebeen taken at such low energies.
The calculations of the integrated cross-section for the process γγ → pp in the angularrange | cos θ∗| < 0.6 (where θ∗ is the angle between the proton’s momentum and the electronbeam direction in the pp centre-of-mass system) and for W > 2.5 GeV are in good agreementwith experimental results [9, 10], whereas the pure quark model predicts much smaller cross-sections [2, 3].
In this paper, we present a measurement of the cross-section for the exclusive process e+e− →e+e−pp in the range 2.15 < W < 3.95 GeV, using data taken with the OPAL detector at√
see = 183 GeV and 189 GeV at LEP. The integrated luminosities for the two energies are62.8 pb−1 and 186.2 pb−1.
1In this paper positrons are also referred to as electrons.
3
2 The OPAL detector
The OPAL detector and trigger system are described in detail elsewhere [17]. We brieflydescribe only those features particularly relevant to this analysis. The tracking system forcharged particles is inside a solenoid that provides a uniform axial magnetic field of 0.435 T.The system consists of a silicon micro-vertex detector, a high-resolution vertex drift chamber,a large-volume jet chamber and surrounding z-chambers. The micro-vertex detector surroundsthe beam pipe covering the angular range of | cos θ| < 0.9 and provides tracking information inthe r-φ and z directions2. The jet chamber records the momentum and energy loss of chargedparticles over 98% of the solid angle. In the range of | cos θ| < 0.73, up to 159 points aremeasured along each track. The energy loss, dE/dx, of a charged particle in the chamber gasis measured from the integrated charges of each hit at both ends of each signal wire with aresolution of about 3.5% for isolated tracks with the maximum of 159 points. The z-chambersare used to improve the track measurement in the z direction.
The barrel time-of-flight (TOF) scintillation counters are located immediately outside thesolenoid at a mean radius of 2.36 m, covering the polar angle range | cos θ| < 0.82. The outerparts of the detector, in the barrel and endcaps, consist of lead-glass electromagnetic calorime-try (ECAL) followed by an instrumented iron yoke for hadron calorimetry and four layers ofexternal muon chambers. Forward electromagnetic calorimeters complete the acceptance forelectromagnetically interacting particles down to polar angles of about 24 mrad.
The trigger signatures required for this analysis are based on a combination of time-of-flightand track trigger information.
3 Kinematics
The production of proton-antiproton pairs in photon-photon interactions proceeds via the pro-cess
e+(p1) + e−(p2) → e+(p′1) + e−(p′2) + γ(q1) + γ(q2) → e+(p′1) + e−(p′2) + p(q′1) + p(q′2) (1)
where qi, pi denote the four-momenta (i = 1, 2). Each of the two incoming electrons emits aphoton and the final state produced by the two colliding photons consists of one proton (p)and one antiproton (p). The four-momentum squared of the two photons is (i = 1, 2)
q2i = −Q2
i = (pi − p′i)2. (2)
Since the electrons are scattered at small angles and they remain undetected, the four-momentasquared of each of the two photons are small, i.e. the photons are quasi-real. In this case thetransverse3 component of the momentum sum of the proton and the antiproton in the laboratorysystem is expected to be small whereas the longitudinal component of the momentum sum can
2In the OPAL right-handed coordinate system the z-axis points along the e− beam direction, and the x-axispoints towards the centre of the LEP ring. The polar angle θ is defined with respect to the z-axis, and theazimuthal angle φ with respect to the x-axis.
3In this paper transverse momenta are always defined with respect to the z axis.
4

be large. The photon-photon centre-of-mass system is generally boosted along the beam axis.The larger the boost, the closer the produced (anti) protons are to the beam direction. Thisfeature, combined with the typically low mass of the final state pp, and the low efficiency fortracking at small angles, leads to significant acceptance losses for these types of events.
4 Monte Carlo generators
The e+e− → e+e−pp events are simulated with the PC Monte Carlo generator which has beendeveloped to study exclusive photon-photon processes [18]. The PC Monte Carlo generatorhas been expanded for use in this analysis to simulate the kinematics of exclusive baryon-antibaryon final states, e+e− → e+e−pp, e+e− → e+e−ΛΛ, and e+e− → e+e−Ξ−Ξ+. A totalof 20 000 e+e− → e+e−pp Monte Carlo events have been generated as a control sample for theevent selection described in the next section. Similarly, for the trigger and detection efficiencydetermination, a total of 360 000 e+e− → e+e−pp Monte Carlo events have been generatedin the range of 2.15 < W < 3.95 GeV. The background coming from e+e− → e+e−π+π− isgenerated with the PC Monte Carlo program, as is the feed-down background from proton-antiproton pairs coming from the reaction e+e− → e+e−ΛΛ → ppπ+π− where the pions are notdetected (200 000 events).
The leptonic photon-photon background processes e+e− → e+e−µ+µ−, e+e− → e+e−e+e−
and e+e− → e+e−τ+τ− are simulated with the Vermaseren generator [19]. The KORALZgenerator [20] is used to simulate the background processes e+e− → µ+µ−, and e+e− → τ+τ−.The e+e− → e+e− background process is simulated with the BHWIDE [21] generator. Table 1lists all the generated background Monte Carlo samples.
Monte Carlo events are generated at√
see = 189 GeV only, since the change in acceptancebetween
√see = 183 and 189 GeV is small compared to the statistical uncertainty of the
measurement. They have been processed through a full simulation of the OPAL detector [22]and have been analysed using the same reconstruction algorithms that are used for the data.
5 Event selection
The e+e− → e+e−pp events are selected by the following set of cuts:
1. The sum of the energies measured in the barrel and endcap sections of the electromagneticcalorimeter must be less than half the beam energy.
2. Exactly two oppositely charged tracks are required with each track having at least 20 hitsin the central jet chamber to ensure a reliable determination of the specific energy lossdE/dx. The point of closest approach to the interaction point must be less than 1 cm inthe rφ plane and less than 50 cm in the z direction.
5
3. For each track the polar angle must be in the range | cos θ| < 0.75 and the transversemomentum p⊥ must be larger than 0.4 GeV. These cuts ensure a high trigger efficiencyand good particle identification.
4. The invariant mass W of the pp final state must be in the range 2.15 < W < 3.95 GeV.The invariant mass is determined from the measured momenta of the two tracks usingthe proton mass.
5. The events are boosted into the rest system of the measured pp final state. The scatteringangle of the tracks in this system has to satisfy | cos θ∗| < 0.6.
6. All events must fulfil the trigger conditions defined in Section 6.
7. The large background from other exclusive processes, mainly the production of e+e−,µ+µ−, and π+π− pairs, is reduced by particle identification using the specific energy lossdE/dx in the jet chamber and the energy in the electromagnetic calorimeter. The dE/dxprobabilities of the tracks must be consistent with the p and p hypothesis.
- Events where the ratio E/p for each track lies in the range 0.4 < E/p < 1.8 4 areregarded as possible e+e− → e+e−e+e− candidates. These events are rejected if thedE/dx probabilities of the two tracks are consistent with the electron hypothesis.
- Events where the ratio E/p for each track is less than 0.8, as expected for a mini-mum ionizing particle, are regarded as possible background from e+e− → e+e−µ+µ−
events. This background is reduced by rejecting events where the dE/dx probabilityfor both tracks is consistent with the muon hypothesis. This cut is also effective inreducing the π+π− background.
- The dE/dx probability for the proton hypothesis has to be greater than 0.1% for eachtrack and it has to be larger than the probabilities for the pion and kaon hypotheses.The product of the dE/dx probabilities for both tracks to be (anti) protons has tobe larger than the product of the dE/dx probabilities for both tracks to be electrons.
8. Cosmic ray background is eliminated by applying a muon veto [23].
9. Exclusive two-particle final states are selected by requiring the transverse component ofthe momentum sum squared of the two tracks, |∑ ~p⊥|2, to be smaller than 0.04 GeV2. Byrestricting the maximum value of Q2
i , this cut also ensures that the interacting photonsare quasi-real. Therefore no further cut rejecting events with scattered electrons in thedetector needs to be applied. Fig. 1 shows the |∑ ~p⊥|2 distribution obtained after applyingall cuts except the cut on |∑ ~p⊥|2.
After all cuts 163 data events are selected, 35 events at√
see = 183 GeV and 128 events at√see = 189 GeV. The distribution of measured dE/dx values versus the particle momentum for
the selected data events is shown in Fig. 2a. Background from events containing particles otherthan (anti-)protons is negligible due to the good rejection power of the dE/dx cuts. Since noevent remains after applying the event selection to the background Monte Carlo samples, the95% confidence level upper limits for the number of background events expected to contributeto the selected data sample are given in Table 1.
4E here is the energy of the ECAL cluster associated with the track with momentum p.
6

Since the pp final state is fully reconstructed, the experimental resolution for W (determinedwith Monte Carlo simulation) is better than 1%. The experimental resolution for | cos θ∗| isabout 0.014. Fig. 2b shows the W distribution for data and Monte Carlo signal events afterthe final selection. The Monte Carlo distributions agree well with the data.
6 Trigger and detection efficiencies
The e+e− → e+e−pp events contain only two tracks with momenta in the range 0.4 GeVto 2 GeV. Special triggers are required to select such low multiplicity events with only lowmomentum particles and the efficiencies of these triggers must be well known. The e+e− →e+e−pp events are mainly triggered by a combination of triggers using hits in the time-of-flightcounters and tracks. The track trigger takes data on the z coordinate of hits from the vertexdrift chamber, and from three groups of 12 wires in the jet chamber. The selected events mustsatisfy at least one of the following trigger conditions:
A Two tracks in the barrel region from the track-trigger (TT). This corresponds to anangular acceptance of approximately | cos θ| < 0.75.
B A coincidence of at least one barrel track from the track trigger and a θ − φ coincidenceof a track from the track trigger with hits from the time-of-flight detector (TOF). Thebarrel track and the track forming the θ − φ coincidence are not necessarily identical.The angular acceptance of the track trigger is approximately | cos θ| < 0.75, whereas theacceptance of the θ − φ coincidence is | cos θ| < 0.82.
Condition A is highly efficient for events within its geometrical acceptance but it triggers ontwo tracks. Condition B is used to trigger on a single track and to measure the trigger efficiencyin combination with condition A.
It was checked that the trigger efficiency does not depend on φ. Under this conditionand assuming the efficiency of each trigger component for each track to be independent, thecombined event trigger can be written as:
εTRIG = ε2TT + 2εTT−TOFεTT(1− εTT). (3)
Here εTT is the efficiency for one track to be triggered by the track trigger and εTT−TOF isthe efficiency for one track to be triggered by the TT-TOF coincidence. The first term in (3)gives the efficiency for both tracks to be triggered by the track trigger (condition A) and thesecond term gives the efficiency for the events not triggered by condition A to be triggered bycondition B for either of the two tracks.
Data events are used to calculate the trigger efficiency. The trigger efficiency is determinedby considering events in which one track detected in one half of the rφ plane (e.g. 0 < φ <180 degrees) satisfies the required track trigger and time-of-flight θ − φ matching hit while theother track in the other half plane (e.g. 180 < φ < 360 degrees) is used to measure the efficiencyof the track and time-of-flight triggers.
7

The efficiencies measured from the 163 selected events are εTT = (93.7±1.7)% and εTT−TOF =(58.5± 2.3)%, where the uncertainties are statistical only. This yields an overall event triggerefficiency of εTRIG = (94.7± 1.5)%, determined from data only.
To study the efficiency with a large event sample, events from photon-photon processeswith two tracks in the final state such as e+e− and µ+µ− are used together with the pp eventsto determine the track trigger efficiency as a function of p⊥. This efficiency exceeds 90% forp⊥ > 0.4 GeV and the observed dependence of the track trigger efficiency on p⊥ is found to beconsistent between electrons and muons.
In a second step, e+e− → e+e−pp Monte Carlo events in the range 2.15 < W < 3.95 GeVare used to obtain the trigger efficiencies as a function of W , εTRIG(W ). The Monte Carloevents are reweighted here according to the trigger efficiency which has been determined asa function of the transverse momentum p⊥ using (3). These reweighted Monte Carlo eventshave been used only to determine the trigger efficiency as function of W . Finally the valuesobtained for εTRIG(W ) are normalized to give the overall trigger efficiency εTRIG = 94.7% abovethe threshold p⊥ > 0.4 GeV as already determined from data only. The region W < 2.15 GeVis excluded from the analysis because the trigger efficiency drops rapidly below 70%.
The detection efficiency is determined by comparing the number of Monte Carlo eventspassing all cuts with the total number of Monte Carlo events generated within a polar angle| cos θ∗GEN| < 0.6 in the pp centre-of-mass system:
εDET =dσ/dW (| cos θ∗|)
dσ/dW (| cos θ∗GEN|), (4)
where | cos θ∗| refers to the reconstructed polar angle in the pp centre-of-mass system. Thedetection efficiency is about 2% at high W and about 4% at low W . To be able to compare themeasured cross-section with any given model in bins of | cos θ∗| and W , the detection efficiencyhas been determined from the signal Monte Carlo in bins of W and | cos θ∗|.
7 Cross-section measurements
The differential cross-section for the process e+e− → e+e−pp is given by
d2σ(e+e− → e+e−pp)
dW d| cos θ∗| =Nev(W, | cos θ∗|)
Le+e−εTRIG εDET (W, | cos θ∗|) ∆W ∆| cos θ∗| (5)
where Nev is the number of events selected in each (W, | cos θ∗|) bin, εTRIG is the trigger effi-ciency, εDET is the detection efficiency, Le+e− is the measured integrated luminosity, and ∆Wand ∆| cos θ∗| are the bin widths in W and in | cos θ∗|.
The total cross-section σ(γγ → pp) for a given value of√
see is obtained from the differentialcross-section dσ(e+e− → e+e−pp)/dW using the luminosity function dLγγ/dW [24]:
σ(γγ → pp) =dσ(e+e− → e+e−pp)
dW
/dLγγ
dW. (6)
8
The luminosity function dLγγ/dW is calculated by the Galuga program [25]. The resultingdifferential cross-sections for the process γγ → pp in bins of W and | cos θ∗| are then summedover | cos θ∗| to obtain the total cross-section as a function of W for | cos θ∗| < 0.6.
8 Systematic uncertainties
The following sources of systematic uncertainties have been taken into account (Table 5):
Luminosity function: The accuracy of the photon-photon luminosity function used in (6)has been estimated by taking into account different models such as the ρ-pole model [26],the Equivalent Photon Approximation (EPA) [27], the Generalized Vector DominanceModel (GVMD) [25], the luminosity functions given in [28], and in [29, 30]. Each of theresulting numbers has then been compared with the VDM form-factor model [25] whichis used for the final result. We take the largest deviation resulting from these comparisonsas the uncertainty in the luminosity functions which is about ±5%.
Trigger efficiency: The trigger efficiency model of (3) has been tested by making a compar-ison between the measured relative frequencies of the four different sub-combinations,(NTT, NTT−TOF) = (1,1), (2,0), (2,1), (2,2), which can trigger the events, and the pre-dicted values, by using fitted efficiencies for TT and TT-TOF (Section 6). Here NTT
denotes the number of tracks triggered by the TT and NTT−TOF the number of trackstriggered by the TT-TOF trigger. Table 2 gives the measured and predicted fractions forevents with W > 2.15 GeV. The fit of the two efficiencies εTT and εTT−TOF yields a χ2
of 9.6 over 2 degrees of freedom. Although the fit is poor the overall efficiency result isconsistent with the other determination. An additional systematic uncertainty of 5.0%is therefore assigned to the trigger efficiency. This value is obtained by increasing theuncertainties to obtain a normalized χ2 of one.
Monte Carlo statistics: The statistical uncertainty on the detection efficiency due to thenumber of simulated Monte Carlo events varies from 4.5% at low W to 6% at high W .
dE/dx cuts: The systematic uncertainties due to the dE/dx cuts are determined by recalcu-lating the Monte Carlo detection efficiency after varying the dE/dx values:
- The measured values are shifted by ±1σ, where σ is the theoretical uncertainty ofthe measurement.
- The measured values are smeared with a Gaussian distribution of width 0.1σ, whichis the typical systematic uncertainty of each individual dE/dx measurement, asfound for pions from K0 decays [31].
The modified dE/dx values are transformed into weights and the new detection efficiencyis calculated by applying the event selection on the modified Monte Carlo events. Thesystematic uncertainty assigned to each (W, | cos θ∗|) bin is the quadratic sum of the fulldeviation of the detection efficiency with smearing and the average absolute deviationvalue of the ±1σ shifted values with respect to the original values.
The systematic uncertainties due to the variation of the dE/dx cuts are larger at highvalues of W . They vary between 0.1% for W < 2.6 GeV and up to 5% for W > 2.6 GeV.
9

Residual background: Residual background can come from non-exclusive production of pppairs in processes like e+e− → e+e−ppππ if the pions are not detected. The |∑ ~p⊥|2cut eliminates most of this background. The data events are almost coplanar, i.e. nodata event has an acoplanarity of more than 0.262 rad. To estimate the contribution ofthis background, the shape of the acoplanarity distribution for pp pairs in Monte Carloe+e− → e+e−ΛΛ and e+e− → e+e−pp events has been fitted to the data. This yieldsan upper limit of 10 events for this background contribution. An additional systematicuncertainty of 6% is therefore taken into account.
Additional uncertainties due to the measured integrated e+e− luminosity, the track reconstruc-tion efficiency and the momentum resolution for the protons are negligible. The total systematicuncertainty is obtained by adding all systematic uncertainties in quadrature.
9 Results and Discussion
The measured cross-sections in bins of W are given in Table 3. The average 〈W 〉 in each binhas been determined by applying the procedure described in [32]. The measured cross-sectionsσ(γγ → pp) for 2.15 < W < 3.95 GeV and for | cos θ∗| < 0.6 are compared with the resultsobtained by ARGUS [8], CLEO [9] and VENUS [10] in Fig. 3a and to the results obtained byTASSO [5], JADE [6] and TPC/2γ [7] in Fig. 3b. The quark-diquark model predictions [12]are also shown. Reasonable agreement is found between this measurement and the resultsobtained by other experiments for W > 2.3 GeV. At lower W our measurements agree with themeasurements by JADE [6] and ARGUS [8], but lie below the results obtained by CLEO [9],and VENUS [10]. The cross-section measurements reported here extend towards higher valuesof W than previous results.
Fig. 3a-b show the measured γγ → pp cross-section as a function of W together withsome predictions based on the quark-diquark model [11, 12, 15]. There is good agreementbetween our results and the older quark-diquark model predictions [11, 15]. The most recentcalculations [12] lie above the data, but within the estimated theoretical uncertainties thepredictions are in agreement with the measurement.
An important consequence of the pure quark hard scattering picture is the power law whichfollows from the dimensional counting rules [33, 34]. The dimensional counting rules state thatan exclusive cross-section at fixed angle has an energy dependence connected with the numberof hadronic constituents participating in the process under investigation. We expect that forasymptotically large W and fixed | cos θ∗|
dσ(γγ → pp)
dt∼ W 2(2−n) (7)
where n = 8 is the number of elementary fields and t = −W 2/2(1−| cos θ∗|). The introductionof diquarks modifies the power law by decreasing n to n = 6. This power law is compared to thedata in Fig. 3c with σ(γγ → pp) ∼ W−2(n−3) using three values of the exponent n: fixed valuesn = 8, n = 6, and the fitted value n = 7.5 ± 0.8 obtained by taking into account statistical
10

uncertainties only. More data covering a wider range of W would be required to determine theexponent n more precisely.
The measured differential cross-sections dσ(γγ → pp)/d| cos θ∗| in different W ranges andfor | cos θ∗| < 0.6 are given in Table 4 and in Fig. 4. The differential cross-section in therange 2.15 < W < 2.55 GeV lies below the results reported by VENUS [10] and CLEO [9](Fig. 4a). Since the CLEO measurements are given for the lower W range 2.0 < W < 2.5 GeV,we rescale their results by a factor 0.635 which is the ratio of the two CLEO total cross-sectionmeasurements integrated over the W ranges 2.0 < W < 2.5 GeV and 2.15 < W < 2.55 GeV.This leads to a better agreement between the two measurements but the OPAL results are stillconsistently lower. The shapes of the | cos θ∗| dependence of all measurements are consistentapart from the highest | cos θ∗| bin, where the OPAL measurement is significantly lower thanthe measurements of the other two experiments.
In Fig. 4b-c the differential cross-sections dσ(γγ → pp)/d| cos θ∗| in the W ranges 2.35 <W < 2.85 GeV and 2.55 < W < 2.95 GeV are compared to the measurements by TASSO,VENUS and CLEO in similar W ranges. The measurements are consistent within the uncer-tainties.
The comparison of the differential cross-section as a function of | cos θ∗| for 2.55 < W <2.95 GeV with the calculation of [12] at W = 2.8 GeV for different distribution amplitudes (DA)is shown in Fig. 5a. The pure quark model [2, 3] and the quark-diquark model predictions liebelow the data, but the shapes of the curves are consistent with those of the data.
In Fig. 5b the differential cross-section dσ(γγ → pp)/d| cos θ∗| is shown versus | cos θ∗| for2.15 < W < 2.55 GeV. The cross-section decreases at large | cos θ∗|; the shape of the angulardistribution is different from that at higher W values. This indicates that for low W theperturbative calculations of [2, 3] are not valid.
Another important consequence of the hard scattering picture is the hadron helicity con-servation rule. For each exclusive reaction like γγ → pp the sum of the two initial helicitiesequals the sum of the two final ones [35]. According to the simplification used in [11], onlyscalar diquarks are considered, and the (anti) proton carries the helicity of the single (anti)quark. Neglecting quark masses, quark and antiquark and hence proton and antiproton haveto be in opposite helicity states. If the (anti) proton is considered as a point-like particle,simple QED rules determine the angular dependence of the unpolarized γγ → pp differentialcross-section [29]:
dσ(γγ → pp)
d| cos θ∗| ∝ (1 + cos2 θ∗)(1− cos2 θ∗)
. (8)
This expression is compared to the data in two W ranges, 2.55 < W < 2.95 GeV (Fig. 5a) and2.15 < W < 2.55 GeV (Fig. 5b). The normalisation in each case is determined by the best fitto the data. In the higher W range, the prediction (8) is in agreement with the data withinthe experimental uncertainties. In the lower W range this simple model does not describe thedata. At low W soft processes such as meson exchange are expected to introduce other partialwaves, so that the approximations leading to (8) become invalid [36].
11
10 Conclusions
The cross-section for the process e+e− → e+e−pp has been measured in the pp centre-of-mass energy range of 2.15 < W < 3.95 GeV using data taken with the OPAL detector at√
see = 183 and 189 GeV. The measurement extends to slightly larger values of W than inprevious measurements.
The total cross-section σ(γγ → pp) as a function of W is obtained from the differentialcross-section dσ(e+e− → e+e−pp)/dW using a luminosity function. For the high pp centre-of-mass energies, W > 2.3 GeV, the measured cross-section is in good agreement with otherexperimental results [5, 7, 8, 9, 10]. At lower W the OPAL measurements lie below the resultsobtained by CLEO [9], and VENUS [10], but agree with the JADE [6] and ARGUS [8] mea-surements. The cross-section as a function of W is in agreement with the quark-diquark modelpredictions of [11, 12].
The power law fit yields an exponent n = 7.5± 0.8 where the uncertainty is statistical only.Within this uncertainty, the measurement is not able to distinguish between predictions for theproton to interact as a state of three quasi-free quarks or as a quark-diquark system. Thesepredictions are based on dimensional counting rules [33, 34].
The shape of the differential cross-section dσ(γγ → pp)/d| cos θ∗| agrees with the results ofprevious experiments in comparable W ranges, apart from in the highest | cos θ∗| bin measuredin the range 2.15 < W < 2.55 GeV. In this low W region contributions from soft processessuch as meson exchange are expected to complicate the picture by introducing extra partialwaves, and the shape of the measured differential cross-section dσ(γγ → pp)/d| cos θ∗| doesnot agree with the simple model that leads to the helicity conservation rule. In the highW region, 2.55 < W < 2.95 GeV, the experimental and theoretical differential cross-sectionsdσ(γγ → pp)/d| cos θ∗| agree, indicating that the data are consistent with the helicity conser-vation rule.
Acknowledgements
We want to thank Mauro Anselmino, Wolfgang Schweiger, Carola F. Berger, Maria NovellaKienzle-Focacci and Sven Menke for important and fruitful discussions. We particularly wishto thank the SL Division for the efficient operation of the LEP accelerator at all energies andfor their close cooperation with our experimental group. In addition to the support staff at ourown institutions we are pleased to acknowledge theDepartment of Energy, USA,National Science Foundation, USA,Particle Physics and Astronomy Research Council, UK,Natural Sciences and Engineering Research Council, Canada,Israel Science Foundation, administered by the Israel Academy of Science and Humanities,Benoziyo Center for High Energy Physics,Japanese Ministry of Education, Culture, Sports, Science and Technology (MEXT) and a grantunder the MEXT International Science Research Program,
12
Japanese Society for the Promotion of Science (JSPS),German Israeli Bi-national Science Foundation (GIF),Bundesministerium fur Bildung und Forschung, Germany,National Research Council of Canada,Hungarian Foundation for Scientific Research, OTKA T-029328, and T-038240,Fund for Scientific Research, Flanders, F.W.O.-Vlaanderen, Belgium.
References
[1] G.P. Lepage and S.J. Brodsky, Phys. Rev. D22 (1980) 2157.
[2] G.R. Farrar, E. Maina and F. Neri, Nucl. Phys. B259 (1985) 702.
[3] D. Millers and J.F. Gunion, Phys. Rev. D34 (1986) 2657.
[4] V.L. Chernyak and I.R. Zhitnitsky, Nucl. Phys. B246 (1984) 52.
[5] TASSO Collaboration, M. Althoff et al., Phys. Lett. B130 (1983) 449.
[6] JADE Collaboration, W. Bartel et al., Phys. Lett. B174 (1986) 350.
[7] TPC/Two Gamma Collaboration, H. Aihara et al., Phys. Rev. D36 (1987) 3506.
[8] ARGUS Collaboration, H. Albrecht et al., Z. Phys. C42 (1989) 543.
[9] CLEO Collaboration, M. Artuso et al., Phys. Rev. D50 (1994) 5484.
[10] VENUS Collaboration, H. Hamasaki et al., Phys. Lett. B407 (1997) 185.
[11] M. Anselmino, P. Kroll and B. Pire, Z. Phys. C36 (1987) 89.
[12] C.F. Berger, B. Lechner and W. Schweiger, Fizika B8 (1999) 371.
[13] M. Anselmino, F. Caruso, P. Kroll and W. Schweiger, Int. J. Mod. Phys. A4 (1989) 5213.
[14] P. Kroll, M. Schurmann and W. Schweiger, Int. J. Mod. Phys. A6 (1991) 4107.
[15] P. Kroll, Th. Pilsner, M. Schurmann and W. Schweiger, Phys. Lett. B316 (1993) 546.
[16] P. Kroll, M. Schurmann and P.A.M. Guichon, Nucl. Phys. A598 (1996) 435.
[17] OPAL Collaboration, K. Ahmet et al., Nucl. Instr. Meth. A305 (1991) 275;M. Hauschild et al., Nucl. Instr. Meth. A314 (1992) 74;H.M. Fischer et al., Nucl. Instr. Meth. A252 (1986) 331;R.D. Heuer and A. Wagner, Nucl. Instr. Meth. A265 (1988) 11;H.M. Fischer et al., Nucl. Instr. Meth. A283 (1989) 492;M. Arignon et al., Nucl. Instr. Meth. A313 (1992) 103.
[18] F. Linde, Charm Production in Two-Photon Collisions, Ph. D. Thesis, Leiden University(1988).
13
[19] J.A.M. Vermaseren, Nucl. Phys. B229 (1983) 347.
[20] S. Jadach, B.F.L. Ward and Z. Was, Comp. Phys. Comm. 79 (1994) 503.
[21] S. Jadach, B.F.L. Ward and W. Placzek, Phys. Lett. B390 (1997) 298.
[22] J. Allison et al., Nucl. Instr. Meth. A317 (1992) 47.
[23] R. Akers et al., Z. Phys. C65 (1995) 47.
[24] F.E. Low, Phys. Rev. 120 (1960) 582.
[25] G.A. Schuler, Comp. Phys. Comm. 108 (1998) 279.
[26] A. Buijs, W.G.J. Langeveld, M.H. Lehto and D.J. Miller, Comp. Phys. Comm. 79 (1994)523.
[27] E. Fermi, Z. Phys. 29 (1924) 315;E.J. Williams, Proc. Roy. Soc. A139 (1933) 163;C.F. von Weizsacker, Z. Phys. 88 (1934) 612.
[28] J.H. Field, Nucl. Phys. B168 (1980) 477.
[29] V.M. Budnev, I.F. Ginzburg, G.V. Meledin and V.G. Serbo, Phys. Rep. 15 (1974) 181.
[30] S.J. Brodsky, T. Kinoshita and H. Terazawa, Phys. Rev. D4 (1971) 1532.
[31] OPAL Collaboration, G. Abbiendi et al., Eur. Phys. J. C21 (2001) 23.
[32] G.D. Lafferty, T.R. Wyatt, Nucl. Instr. Meth. A355 (1995) 541.
[33] S.J. Brodsky and G.R. Farrar, Phys. Rev. Lett. 31 (1973) 1153.
[34] V.A. Matveev, R.M. Muradian and A.N. Tavkhelidze, Nuovo Cim. Lett. 7 (1973) 719.
[35] S.J. Brodsky and G.P. Lepage, Phys. Rev. D24 (1981) 2848.
[36] S.J. Brodsky, F.C. Erne, P.H. Damgaard and P.M. Zerwas, Contribution to ECFA Work-shop LEP200, Aachen, Germany, Sep 29 - Oct 1, 1986.
14
Monte Carlo Number of events Luminosity upper limitbackground process generated (fb−1) at 95 % CLe+e− → e+e−e+e− [19] 800 000 1.0 < 0.75e+e− → e+e−µ+µ− [19] 600 000 1.0 < 0.75e+e− → e+e−τ+τ− [19] 430 000 1.0 < 0.76e+e− → e+e−π+π− [18] 149 000 0.6 < 1.29e+e− → τ+τ− [20] 80 000 1.0 < 0.74e+e− → µ+µ− [20] 80 000 10.0 < 0.07e+e− → e+e− [21] 600 000 1.0 < 0.74
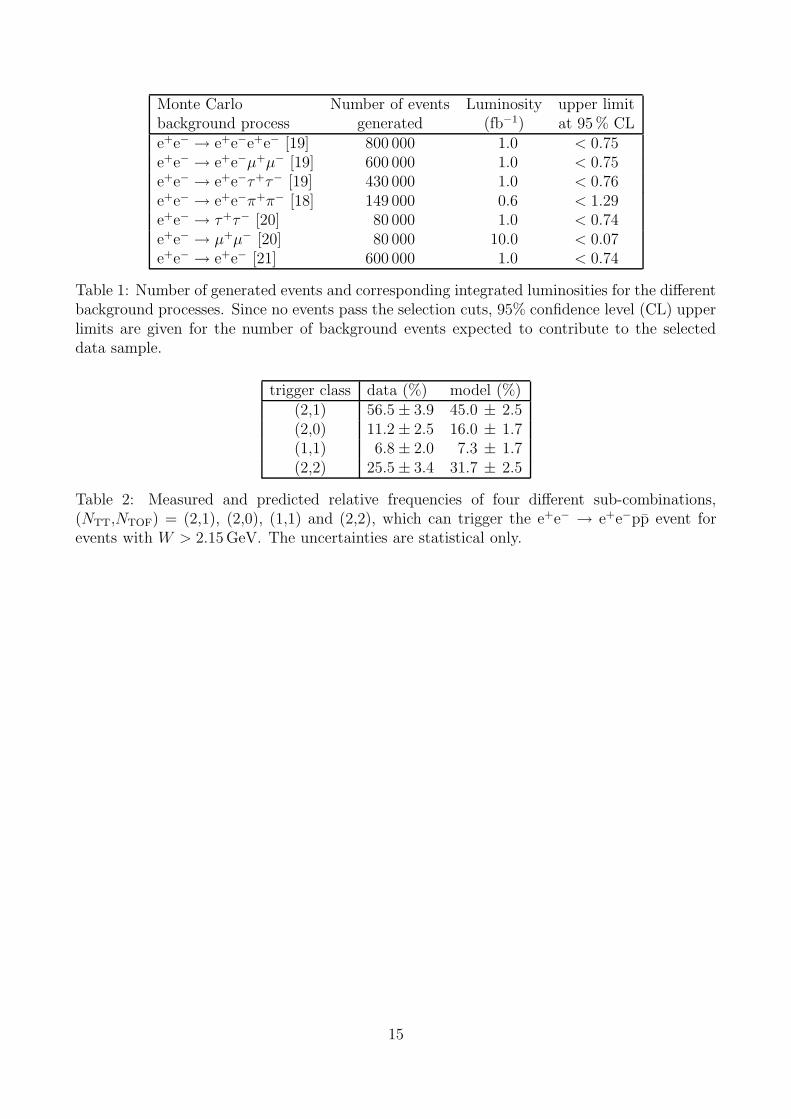
Table 1: Number of generated events and corresponding integrated luminosities for the differentbackground processes. Since no events pass the selection cuts, 95% confidence level (CL) upperlimits are given for the number of background events expected to contribute to the selecteddata sample.
trigger class data (%) model (%)(2,1) 56.5± 3.9 45.0 ± 2.5(2,0) 11.2± 2.5 16.0 ± 1.7(1,1) 6.8± 2.0 7.3 ± 1.7(2,2) 25.5± 3.4 31.7 ± 2.5
Table 2: Measured and predicted relative frequencies of four different sub-combinations,(NTT,NTOF) = (2,1), (2,0), (1,1) and (2,2), which can trigger the e+e− → e+e−pp event forevents with W > 2.15 GeV. The uncertainties are statistical only.
15
W range 〈W 〉 Events dσ(e+e− → e+e−pp)/dW σ(γγ → pp)(GeV) (GeV) (pb/GeV) (nb)
2.15-2.25 2.20 52 5.46± 0.76 2.69± 0.39± 0.282.25-2.35 2.30 33 2.95± 0.51 1.53± 0.27± 0.162.35-2.45 2.40 32 2.53± 0.45 1.39± 0.26± 0.142.45-2.55 2.50 20 1.69± 0.38 0.96± 0.22± 0.102.55-2.75 2.65 18 1.01± 0.24 0.62± 0.22± 0.082.75-2.95 2.85 6 0.28± 0.12 0.19± 0.11± 0.022.95-3.45 3.14 1 0.26± 0.26 0.05 +0.11
−0.04 ± 0.013.45-3.95 3.64 1 0.28± 0.28 0.05 +0.11
−0.04 ± 0.01
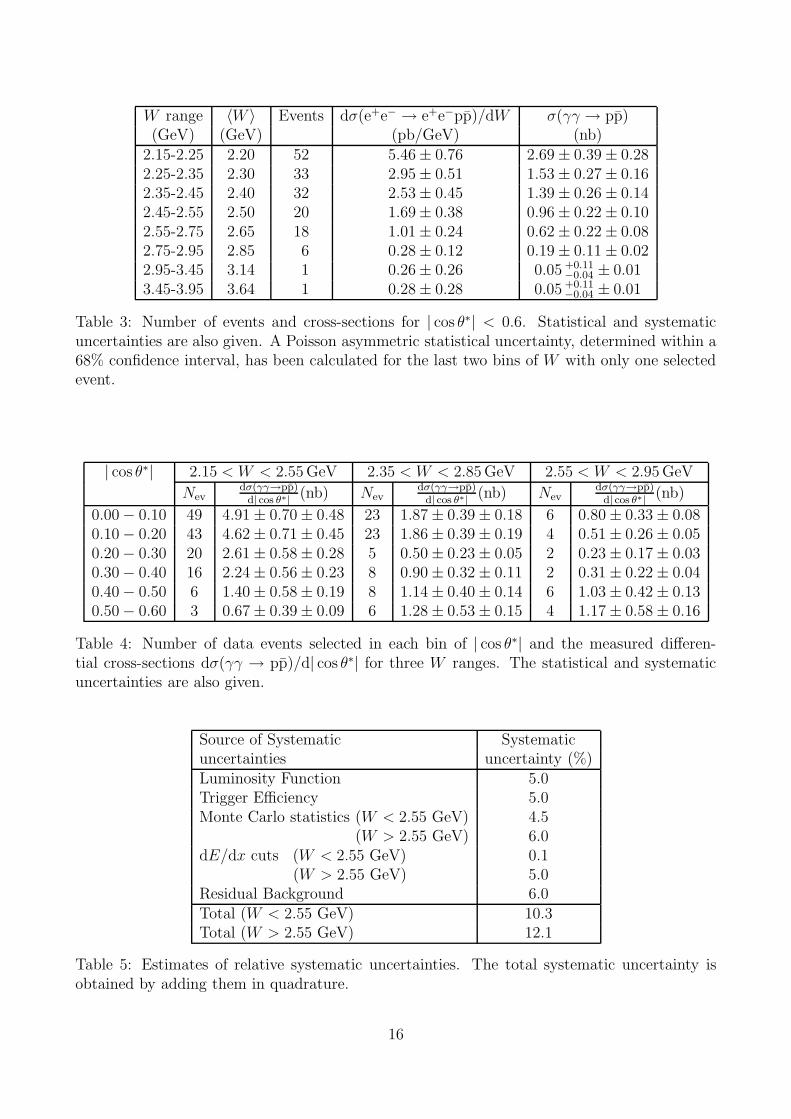
Table 3: Number of events and cross-sections for | cos θ∗| < 0.6. Statistical and systematicuncertainties are also given. A Poisson asymmetric statistical uncertainty, determined within a68% confidence interval, has been calculated for the last two bins of W with only one selectedevent.
| cos θ∗| 2.15 < W < 2.55 GeV 2.35 < W < 2.85 GeV 2.55 < W < 2.95 GeV
Nevdσ(γγ→pp)
d| cos θ∗| (nb) Nevdσ(γγ→pp)
d| cos θ∗| (nb) Nevdσ(γγ→pp)
d| cos θ∗| (nb)
0.00− 0.10 49 4.91± 0.70± 0.48 23 1.87± 0.39± 0.18 6 0.80± 0.33± 0.080.10− 0.20 43 4.62± 0.71± 0.45 23 1.86± 0.39± 0.19 4 0.51± 0.26± 0.050.20− 0.30 20 2.61± 0.58± 0.28 5 0.50± 0.23± 0.05 2 0.23± 0.17± 0.030.30− 0.40 16 2.24± 0.56± 0.23 8 0.90± 0.32± 0.11 2 0.31± 0.22± 0.040.40− 0.50 6 1.40± 0.58± 0.19 8 1.14± 0.40± 0.14 6 1.03± 0.42± 0.130.50− 0.60 3 0.67± 0.39± 0.09 6 1.28± 0.53± 0.15 4 1.17± 0.58± 0.16
Table 4: Number of data events selected in each bin of | cos θ∗| and the measured differen-tial cross-sections dσ(γγ → pp)/d| cos θ∗| for three W ranges. The statistical and systematicuncertainties are also given.
Source of Systematic Systematicuncertainties uncertainty (%)Luminosity Function 5.0Trigger Efficiency 5.0Monte Carlo statistics (W < 2.55 GeV) 4.5
(W > 2.55 GeV) 6.0dE/dx cuts (W < 2.55 GeV) 0.1
(W > 2.55 GeV) 5.0Residual Background 6.0Total (W < 2.55 GeV) 10.3Total (W > 2.55 GeV) 12.1
Table 5: Estimates of relative systematic uncertainties. The total systematic uncertainty isobtained by adding them in quadrature.
16
OPALe+e− → e+e− pp
_
Data at √s = 183 and 189 GeVMC at √s =189 GeV
| cos(Θ) | ≤ 0.75 | cos(Θ∗) | ≤ 0.6cut
| Σp→
⊥ | 2 (GeV2)
Num
ber
of E
vent
s
1
10
10 2
0 0.02 0.04 0.06 0.08 0.1 0.12 0.14 0.16 0.18 0.2
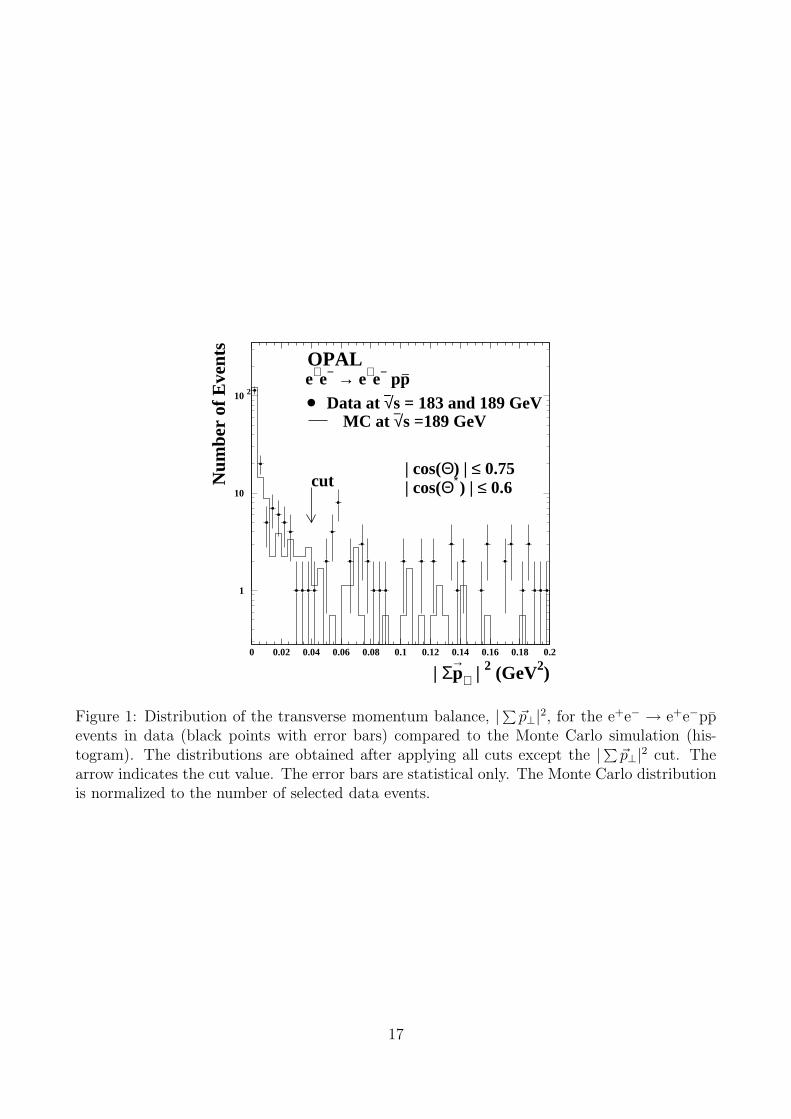
Figure 1: Distribution of the transverse momentum balance, |∑ ~p⊥|2, for the e+e− → e+e−ppevents in data (black points with error bars) compared to the Monte Carlo simulation (his-togram). The distributions are obtained after applying all cuts except the |∑ ~p⊥|2 cut. Thearrow indicates the cut value. The error bars are statistical only. The Monte Carlo distributionis normalized to the number of selected data events.
17

π
e
µ
pK
OPAL a)e+e− → e+e−pp
_
√s = 183 and 189 GeV
| cos(Θ) | ≤ 0.75 | cos(Θ∗) | ≤ 0.6
p (GeV)
dE/d
x (k
eV/c
m)
6
7
8
910
20
30
40
50
10-1
1
OPAL b)e+e− → e+e−pp
_
Data at √s = 183 and 189 GeVMC at √s = 189 GeV
| cos(Θ) | ≤ 0.75
| cos(Θ∗) | ≤ 0.6
W (GeV)
Num
ber
of e
vent
s/0.
1GeV
0
10
20
30
40
50
60
70
2 2.5 3 3.5 4 4.5 5 5.5
Figure 2: a) Distribution of the specific energy loss, dE/dx, versus the particle momentum p forthe proton and antiproton tracks selected by applying the final selection. The curves indicatethe expected mean values for different particle species. b) Invariant mass distribution for the163 selected e+e− → e+e−pp events. The dots with error bars are the data, the histogramdenotes Monte Carlo events. Errors bars are statistical only. The Monte Carlo distribution isnormalized to the number of selected data events.
18

10-2
10-1
1
10
2 2.5 3 3.5 4
a) OPALVENUSCLEOARGUS
W (GeV)
σ(γγ
→pp
_ )(nb
)
10-2
10-1
1
10
2 2.5 3 3.5 4
b) OPALTPC/2γTASSOJADE
W (GeV)
σ(γγ
→pp
_ )(nb
)
10-2
10-1
1
10
2 2.5 3 3.5 4
c)
Standard DAStandard DA,mp neglected
n=7.5 ± 0.8 (fit)n=8n=6
OPAL | cos(Θ∗) | ≤ 0.6
W (GeV)
σ(γγ
→pp
_ )(nb
)
Figure 3: Cross-sections σ(γγ → pp) as a function of W . The data and the theoreticalpredictions cover a range of | cos θ∗| < 0.6. The data points are plotted at the value of 〈W 〉.a,b) The data are compared to other experimental results [7, 8, 9, 10] and to the quark-diquarkmodel prediction [12]. The error bars include statistical and systematic uncertainties, exceptfor TASSO [5] where the uncertainties are statistical only. c) The data are compared to thequark-diquark model of [11] (dash-dotted line), and of [12] (solid line), using the standarddistribution amplitude (DA) with and without neglecting the mass mp of the proton, and withthe predictions of the power law with fixed and with fitted exponent n. The inner error barsare the statistical uncertainties and the outer error bars are the total uncertainties.
19
0
2
4
6
8
10
12
14
16
0 0.2 0.4 0.6
a)
CLEO scaledVENUS 2.15<W<2.55 GeVOPAL 2.15<W<2.55 GeV
| cos(Θ∗) |
dσ(γ
γ →
pp_ )/
d| c
os(Θ
∗ ) |(
nb)
0
0.5
1
1.5
2
2.5
3
3.5
4
0 0.2 0.4 0.6
b)
TASSO 2.4<W<2.8 GeVOPAL 2.35<W<2.85 GeV
|cos(Θ∗)|
dσ(γ
γ →
pp_ )/
d|co
s(Θ∗ )|
(nb)
0
0.5
1
1.5
2
2.5
3
0 0.2 0.4 0.6
c)
CLEO 2.5<W<3.0 GeVVENUS 2.55<W<3.05 GeVOPAL 2.55<W<2.95 GeV
|cos(Θ∗) |
dσ(γ
γ →
pp_ )/
d|co
s(Θ∗ )|
(nb)
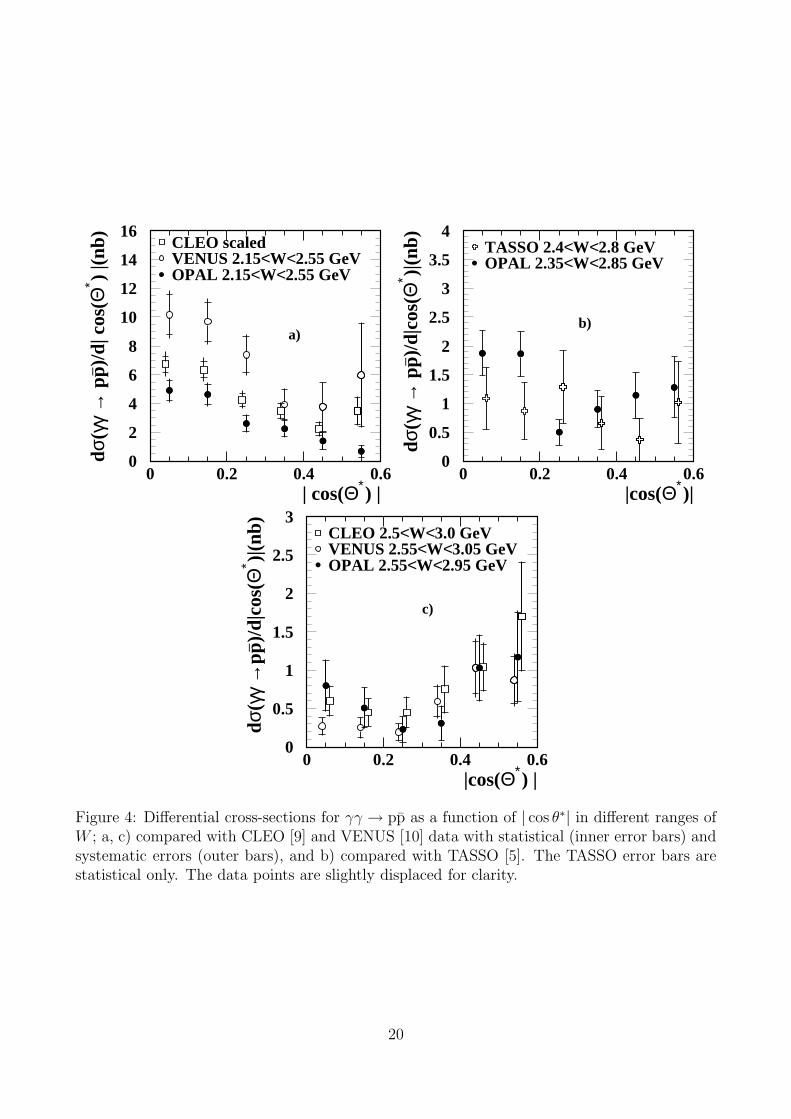
Figure 4: Differential cross-sections for γγ → pp as a function of | cos θ∗| in different ranges ofW ; a, c) compared with CLEO [9] and VENUS [10] data with statistical (inner error bars) andsystematic errors (outer bars), and b) compared with TASSO [5]. The TASSO error bars arestatistical only. The data points are slightly displaced for clarity.
20

0
0.5
1
1.5
2
2.5
3
0 0.2 0.4 0.6
Standard DAAsymptotic DADZ-DAPure Quark ModelPointlike protons
a) OPAL 2.55<W<2.95 GeV
| cos(Θ∗) |
dσ(γ
γ →
pp_ )/
d| c
os(Θ
∗ ) |(
nb)
0
2
4
6
8
10
12
14
0 0.2 0.4 0.6
b) OPAL 2.15<W<2.55 GeV
Pointlike protons
| cos(Θ∗) |
dσ(γ
γ →
pp_ )/
d| c
os(Θ
∗ ) |(
nb)
Figure 5: Measured differential cross-section, dσ(γγ → pp)/d| cos θ∗|, with statistical (innerbars) and total uncertainties (outer bars) for a) 2.55 < W < 2.95 GeV and b) 2.15 < W <2.55 GeV. The data are compared with the point-like approximation for the proton (8) scaledto fit the data. The other curves show the pure quark model [2], the diquark model of [11]with the Dziembowski distribution amplitudes (DZ-DA), and the diquark model of [12] usingstandard and asymptotic distribution amplitudes.
21