Nanocomposite silica surfactant microcapsules by evaporation induced self assembly: tuning the...
9
Nanocomposite silica surfactant microcapsules by evaporation induced self assembly: tuning the morphological buckling by modifying viscosity and surface charge D. Sen, * a J. Bahadur, a S. Mazumder, a G. Verma, b P. A. Hassan, b S. Bhattacharya, c K. Vijai d and P. Doshi d Received 14th October 2011, Accepted 14th November 2011 DOI: 10.1039/c1sm06964k Nanocomposite microcapsules of silica and surfactants have been synthesized using evaporation induced self-assembly through spray drying. It was established using electron microscopy and small- angle neutron/X-ray scattering experiments that the viscosity of the virgin dispersion and surface charge of colloidal components play a significant role in the buckling of spray droplets during drying. Hollow spherical grains are realized at relatively low viscosity and higher surface charge while mushroom like grains manifest at higher viscosity and lower surface charge. In the intermediate conditions, deformed doughnut shaped microcapsules are obtained. Scattering experiments establish the presence of the organization of micelle like aggregates of surfactants in the dried grains and also corroborate with the observations from electron microscopy. A plausible mechanism regarding the chronological pathways of morphological transformation is illustrated. Computer simulation, based on buckling of an elastic shell using a surface evolver, has been attempted in order to corroborate the experimental results. Introduction In recent years, porous and hollow microcapsules have attracted continuous interest 1–8 in science and technology. This is because of the fact that such hollow capsules are potential candidates for various applications such as, drug delivery, catalysis, photonic crystals, chromatography, protection of biologically active agents, pigments, coatings, waste removal, dye-sensitized solar cells etc. Several strategies, such as, hetero phase polymerization, self-assembly, layer-by-layer assembly, spray drying etc. have been adopted to synthesize 9,10 hollow capsules comprising of polymeric or ceramic materials. In this regard, spray drying has been proven to be an efficient, fast and one step process to realize micrometric and sub- micrometric capsules/grains. 11–20 However, controlling the morphology of such capsules for respective applications remains an important issue. It has been established 14–18,21–23 that depending on several physico-chemical parameters of the drying process, buckling of spray droplets may occur because of total force balance across the air–water interface, which in turn leads to morphological transformation of the droplets during the course of drying. Interesting non-spherical morphologies such as, doughnut, deformed-doughnut with multi invagination zones, mushroom etc., have been observed. It is worthy to mention at this juncture that in everyday life, sudden alteration in object morphology due to buckling is ubiquitous in a macroscopic length scale. This phenomenon is of practical importance too in various architectural design such as, tough pressurized vessels, fluid transporting pipes, bridges etc. Although, the phenomenon of buckling in macroscopic bodies is understood from the behavior of bifurcation in the solution to the equations of static equilibrium, the same phenomenon in a micrometric drying droplet still remains a complex issue. This is primarily because of the interplay between various forces originating from hydrodynamics, inter-particle interaction, capillary forces, visco-elastic transformation etc., and is yet to be understood in detail. In the recent past, 21,23 it has been observed that a drying sessile colloidal droplet, in millimetre length scale, may get transformed from most symmetric spherical geometry to less symmetric buckled geometry. More recently, in micrometre length scale, a sphere to deformed doughnut like morphological trans- formation during evaporation induced self assembly (EISA) of nanoparticles by spray drying has been observed 15,17,18 for free falling colloidal spray droplets. It has been pointed out 16 that interparticle interaction plays an important role in controlling the morphological transformation during EISA of mixed colloids comprising hard silica particles and E. Coli as soft colloids. Recently, it has been demonstrated 16 a Solid State Physics Division, Bhabha Atomic Research Centre, Mumbai, 400085, India. E-mail: [email protected] b Chemistry Division, Bhabha Atomic Research Centre, Mumbai, 400085, India c Technical Physics Division, Bhabha Atomic Research Centre, Mumbai, 400085, India d National Chemical Laboratory, Pune, 411008, India This journal is ª The Royal Society of Chemistry 2012 Soft Matter , 2012, 8, 1955–1963 | 1955 Dynamic Article Links C < Soft Matter Cite this: Soft Matter , 2012, 8, 1955 www.rsc.org/softmatter PAPER Downloaded by Bhabha Atomic Research Centre on 15 February 2012 Published on 23 December 2011 on http://pubs.rsc.org | doi:10.1039/C1SM06964K View Online / Journal Homepage / Table of Contents for this issue
-
Upload
independent -
Category
Documents
-
view
1 -
download
0
Transcript of Nanocomposite silica surfactant microcapsules by evaporation induced self assembly: tuning the...
Dynamic Article LinksC<Soft Matter
Cite this: Soft Matter, 2012, 8, 1955
www.rsc.org/softmatter PAPER
Dow
nloa
ded
by B
habh
a A
tom
ic R
esea
rch
Cen
tre
on 1
5 Fe
brua
ry 2
012
Publ
ishe
d on
23
Dec
embe
r 20
11 o
n ht
tp://
pubs
.rsc
.org
| do
i:10.
1039
/C1S
M06
964K
View Online / Journal Homepage / Table of Contents for this issue
Nanocomposite silica surfactant microcapsules by evaporation induced selfassembly: tuning the morphological buckling by modifying viscosity andsurface charge
D. Sen,*a J. Bahadur,a S. Mazumder,a G. Verma,b P. A. Hassan,b S. Bhattacharya,c K. Vijaid and P. Doshid
Received 14th October 2011, Accepted 14th November 2011
DOI: 10.1039/c1sm06964k
Nanocomposite microcapsules of silica and surfactants have been synthesized using evaporation
induced self-assembly through spray drying. It was established using electron microscopy and small-
angle neutron/X-ray scattering experiments that the viscosity of the virgin dispersion and surface
charge of colloidal components play a significant role in the buckling of spray droplets during drying.
Hollow spherical grains are realized at relatively low viscosity and higher surface charge while
mushroom like grains manifest at higher viscosity and lower surface charge. In the intermediate
conditions, deformed doughnut shaped microcapsules are obtained. Scattering experiments establish
the presence of the organization of micelle like aggregates of surfactants in the dried grains and also
corroborate with the observations from electron microscopy. A plausible mechanism regarding the
chronological pathways of morphological transformation is illustrated. Computer simulation, based on
buckling of an elastic shell using a surface evolver, has been attempted in order to corroborate the
experimental results.
Introduction
In recent years, porous and hollow microcapsules have attracted
continuous interest1–8 in science and technology. This is because
of the fact that such hollow capsules are potential candidates for
various applications such as, drug delivery, catalysis, photonic
crystals, chromatography, protection of biologically active
agents, pigments, coatings, waste removal, dye-sensitized solar
cells etc. Several strategies, such as, hetero phase polymerization,
self-assembly, layer-by-layer assembly, spray drying etc. have
been adopted to synthesize9,10 hollow capsules comprising of
polymeric or ceramic materials.
In this regard, spray drying has been proven to be an efficient,
fast and one step process to realize micrometric and sub-
micrometric capsules/grains.11–20 However, controlling the
morphology of such capsules for respective applications remains
an important issue. It has been established14–18,21–23 that
depending on several physico-chemical parameters of the drying
process, buckling of spray droplets may occur because of total
force balance across the air–water interface, which in turn leads
to morphological transformation of the droplets during the
aSolid State Physics Division, Bhabha Atomic Research Centre, Mumbai,400085, India. E-mail: [email protected] Division, Bhabha Atomic Research Centre, Mumbai, 400085,IndiacTechnical Physics Division, Bhabha Atomic Research Centre, Mumbai,400085, IndiadNational Chemical Laboratory, Pune, 411008, India
This journal is ª The Royal Society of Chemistry 2012
course of drying. Interesting non-spherical morphologies such
as, doughnut, deformed-doughnut with multi invagination
zones, mushroom etc., have been observed. It is worthy to
mention at this juncture that in everyday life, sudden alteration
in object morphology due to buckling is ubiquitous in
a macroscopic length scale. This phenomenon is of practical
importance too in various architectural design such as, tough
pressurized vessels, fluid transporting pipes, bridges etc.
Although, the phenomenon of buckling in macroscopic bodies
is understood from the behavior of bifurcation in the solution to
the equations of static equilibrium, the same phenomenon in
a micrometric drying droplet still remains a complex issue. This
is primarily because of the interplay between various forces
originating from hydrodynamics, inter-particle interaction,
capillary forces, visco-elastic transformation etc., and is yet to
be understood in detail.
In the recent past,21,23 it has been observed that a drying sessile
colloidal droplet, in millimetre length scale, may get transformed
from most symmetric spherical geometry to less symmetric
buckled geometry. More recently, in micrometre length scale,
a sphere to deformed doughnut like morphological trans-
formation during evaporation induced self assembly (EISA) of
nanoparticles by spray drying has been observed15,17,18 for free
falling colloidal spray droplets.
It has been pointed out16 that interparticle interaction plays an
important role in controlling the morphological transformation
during EISA of mixed colloids comprising hard silica particles
and E. Coli as soft colloids. Recently, it has been demonstrated16
Soft Matter, 2012, 8, 1955–1963 | 1955
Dow
nloa
ded
by B
habh
a A
tom
ic R
esea
rch
Cen
tre
on 1
5 Fe
brua
ry 2
012
Publ
ishe
d on
23
Dec
embe
r 20
11 o
n ht
tp://
pubs
.rsc
.org
| do
i:10.
1039
/C1S
M06
964K
View Online
that morphological transformation of mixed colloidal suspen-
sion droplets during EISA can be arrested through an effective
coverage of the bigger and softer colloidal components by the
smaller and harder components by suitable tuning of surface
charge. Without the consideration of the effect of surface charge,
the above observation could not be explained solely on the basis
of existing buckling hypothesis.21 Such intriguing results
prompted us to investigate the role of surface charge of colloids
and viscosity of the formulation during EISA of mixed colloids
comprising of both hard and soft colloids. Surfactants, in
aqueous solutions, have the ability to modify the surface charge
of inorganic materials via adsorption and at the same time these
molecules self assemble to form soft colloidal structures such as
micelles, worm-like micelles, vesicles etc. Here, we used micelles,
formed by anionic surfactant SDS, as the soft matrix. The size of
these micelles is smaller than the harder component, i.e. silica
particles. Microstructural transitions in micellar solutions can be
achieved via surface charge modulation, which in turn affects the
macroscopic properties of the fluid, such as viscosity. In the
recent past, it was observed that24 hydrotropic electrolyte, in low
concentration, significantly modifies the surface charge of
anionic micelles and also imparts substantial changes in the
rheological behavior of the fluid. Further, it has been shown25
that such addition of hydrotropic electrolyte, even at low
concentrations, to anionic micelles promotes a transition from
spherical to worm-like micelles through strong binding of
hydrophobic cation to anionic micelles.
The present investigation is a step to improvise the under-
standing on how inter-particle interaction/surface charge and
viscosity of the medium affect the morphological transformation
during drying of spray colloidal droplets.
It is worth mentioning that combined use of an imaging
technique like electron microscopy and neutron or X-ray scat-
tering techniques provide complementary information about the
microstructural features26–30 over a wide length scale. On one
hand, scanning electron microscopy (SEM) provides direct
visualization of the morphology and on the other hand,
scattering techniques such as small-angle neutron/X-ray scat-
tering (SANS/SAXS) allows a quantitative measure of statisti-
cally averaged information of structure over a length scale
10–10 000 �A.
Experimental section
Silica dispersion (40%) was obtained from VISA Chemicals,
Mumbai, India. Sodium dodecyl sulfate (SDS) was obtained
from Sisco Research Labs, Mumbai, India. Hydrotropic elec-
trolyte aniline hydrochloride (AHC) was obtained from Fluka.
Deionized water from a Millipore-MilliQ system (resistivity
�18M U cm) was used in all cases to prepare aqueous disper-
sions. Initially a silica dispersion of 2 wt % was prepared for
spray drying using a LU 228 (LABULTIMA, India) spray dryer.
Mixed dispersions of 2 wt% silica, 2 wt% SDS for varying
concentration of AHC (0, 10, 20, 30 and 50 mM) were prepared
for spray drying. Spray dried grains were also washed carefully
with methanol or calcined in order to expel the organic moieties
from the grains.
SEMmicrographs of the assembled grains were obtained using
a VEGA, TeScan instrument. Rheological properties of the
1956 | Soft Matter, 2012, 8, 1955–1963
dispersions have been measured by a rheometer (Anton Parr
Physica MCR 101) using a double gap concentric cylinder
geometry (DG 26.7) with a Peltier temperature control. The
shear rate was varied from 0.1 to 200 s�1. pH value of the
dispersions prior to spray drying was also measured. The pH
values for the silica dispersion and mixed silica-SDS dispersion
were 9.7 and 9.4, respectively. With addition of AHC, the value
of pH decreases. The pH values for the dispersions with 10, 20, 30
and 40 mM AHC concentration were 7.8, 5.7, 5.2 and 4.5,
respectively.
To obtain small-angle neutron scattering (SANS) data of the
spray dried specimens over a wide scattering-vector (q) range, an
essential requirement to probe microstructure of such hierar-
chically structured grains, scattering experiments were per-
formed at JCNS, FRM-II, Garching, Germany, using two
different instruments namely, KWS-131 and KWS-332 after per-
forming some initial experiments at two SANS facilities33–35 at
the Dhruva reactor, Mumbai, India. Scattering data over a wide
range of wave vector transfer (0.0002–0.2 �A�1) were obtained
from combined facilities KWS-1 and KWS-3. We have also
performed SAXS measurements using a laboratory based SAXS
instrument.
Results and discussion
Hollow nano-composite capsules, comprising inorganic silica
and organic surfactant (SDS) have been synthesized by spray
drying technique. The size and the shape of the organicmatrix has
beenmodulated by the addition of hydrotropic additive, AHC. In
this section, we will discuss the issues related to the effects of
viscosity and surface charge on the buckling behavior. Before
proceeding further, let us describe the spray drying process in
brief. In this process, colloidal spray droplets are generated from
a dilute colloidal dispersion. These droplets are passed through
a hot chamber where the solvent gets evaporated. The nano-
particles come closer, get jammed and form self-assembled grains
because of the attractive capillary forces. Various physico-
chemical conditions during drying decide the buckling phenom-
enon vis-�a-vis the final morphology of the grains. We will discuss
this issue in detail in the later part of this section.
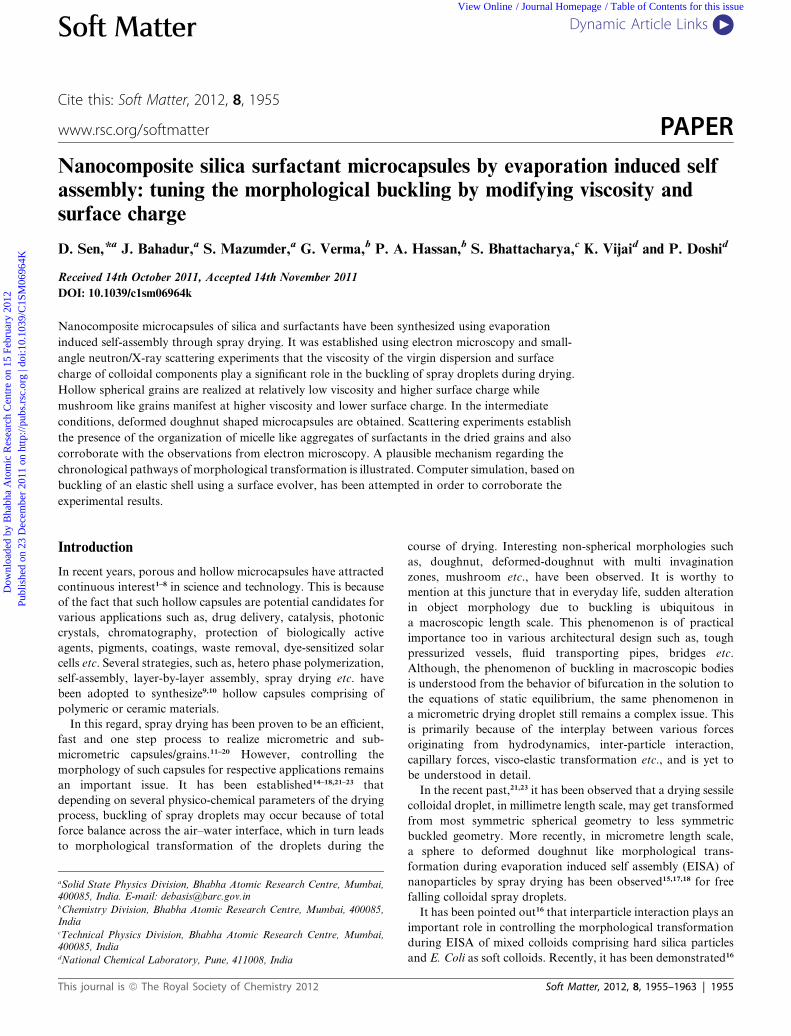
SEMmicrographs of the typical morphology of the assembled
capsules are shown in Fig. 1.
It is worthy to mention here that neither the individual
nanoparticles nor the micelles are visible directly from the SEM
micrographs due to constraints of the microscope resolution.
However, it will be shown later how small-angle scattering can
provide information about the constituent nanoparticles and
their correlation in such assembled grains/capsules. It is evident
from the SEM micrographs (Fig. 1a, 1b) that the assembled
microcapsules, as obtained from spray drying of silica dispersion
alone, are smooth doughnuts with a prominent central hole.
However, just the sole addition of SDS micelles in the disper-
sions, prior to spray drying, results in a sudden change and nearly
spherical microcapsules are realized. Further, from Fig. 1d it is
observed that after removal of SDS, these microcapsules become
hollow with a relatively thin shell. Interestingly, significant
deformation in the grain morphology starts when AHC is added
to the silica-SDS dispersion. At 50 mM AHC concentration, the
spherical droplets during drying get deformed significantly and
This journal is ª The Royal Society of Chemistry 2012
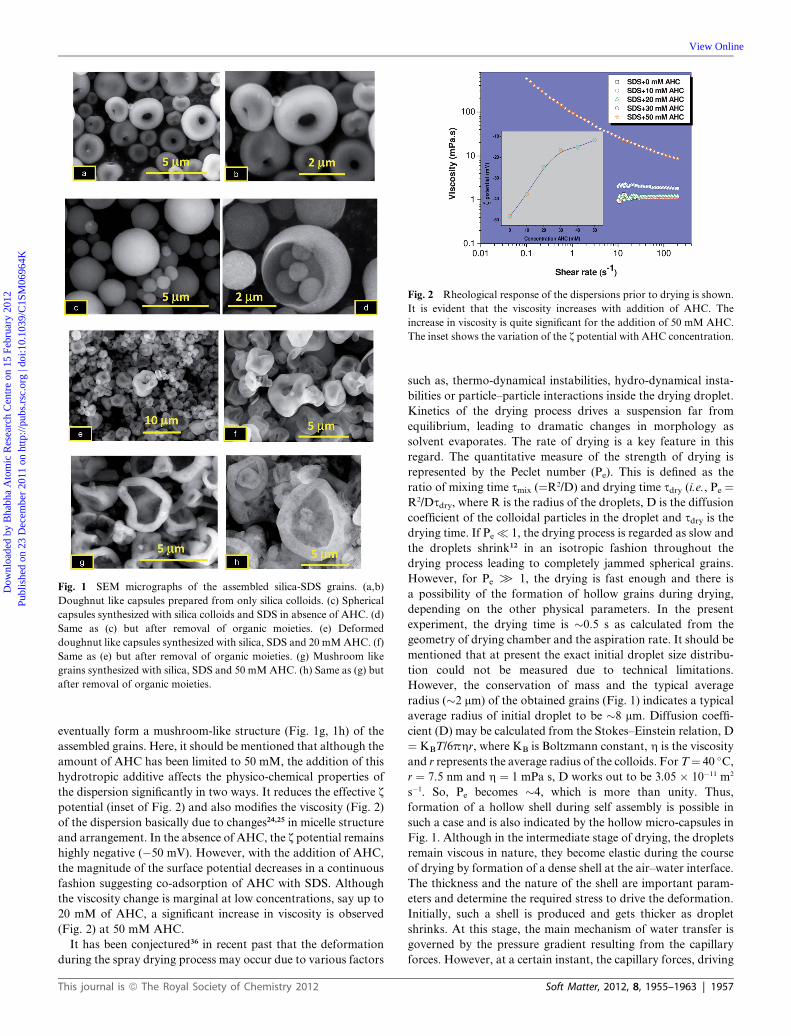
Fig. 1 SEM micrographs of the assembled silica-SDS grains. (a,b)
Doughnut like capsules prepared from only silica colloids. (c) Spherical
capsules synthesized with silica colloids and SDS in absence of AHC. (d)
Same as (c) but after removal of organic moieties. (e) Deformed
doughnut like capsules synthesized with silica, SDS and 20 mMAHC. (f)
Same as (e) but after removal of organic moieties. (g) Mushroom like
grains synthesized with silica, SDS and 50 mMAHC. (h) Same as (g) but
after removal of organic moieties.
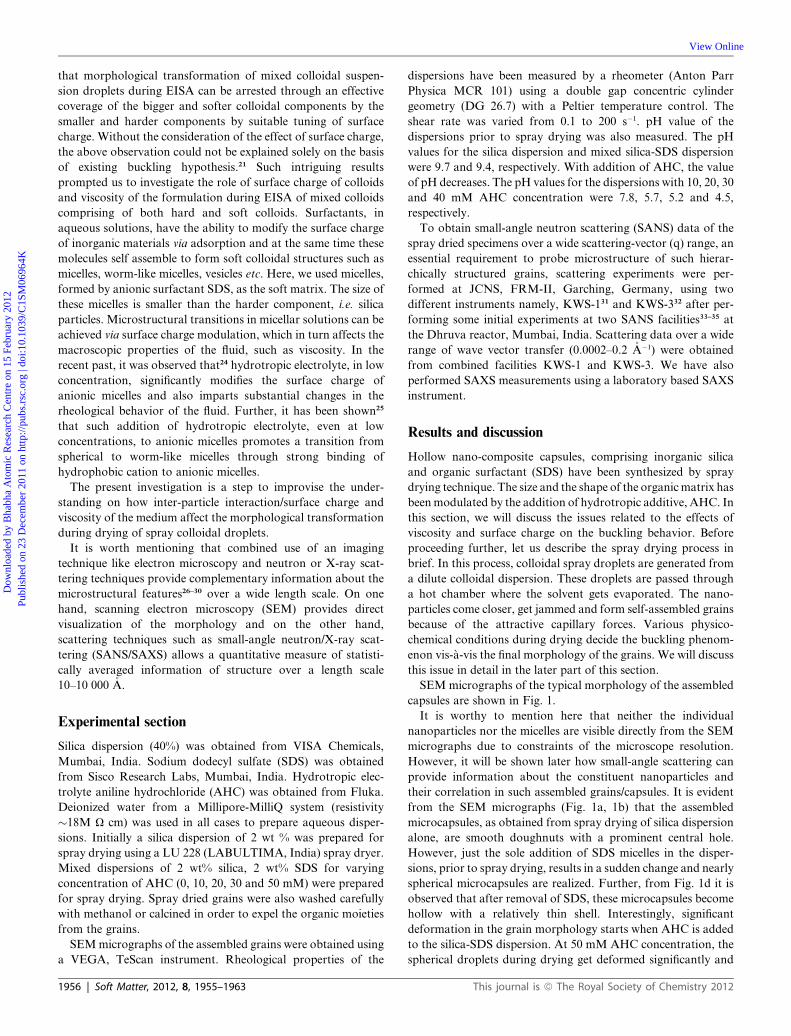
Fig. 2 Rheological response of the dispersions prior to drying is shown.
It is evident that the viscosity increases with addition of AHC. The
increase in viscosity is quite significant for the addition of 50 mM AHC.
The inset shows the variation of the z potential with AHC concentration.
Dow
nloa
ded
by B
habh
a A
tom
ic R
esea
rch
Cen
tre
on 1
5 Fe
brua
ry 2
012
Publ
ishe
d on
23
Dec
embe
r 20
11 o
n ht
tp://
pubs
.rsc
.org
| do
i:10.
1039
/C1S
M06
964K
View Online
eventually form a mushroom-like structure (Fig. 1g, 1h) of the
assembled grains. Here, it should be mentioned that although the
amount of AHC has been limited to 50 mM, the addition of this
hydrotropic additive affects the physico-chemical properties of
the dispersion significantly in two ways. It reduces the effective z
potential (inset of Fig. 2) and also modifies the viscosity (Fig. 2)
of the dispersion basically due to changes24,25 in micelle structure
and arrangement. In the absence of AHC, the z potential remains
highly negative (�50 mV). However, with the addition of AHC,
the magnitude of the surface potential decreases in a continuous
fashion suggesting co-adsorption of AHC with SDS. Although
the viscosity change is marginal at low concentrations, say up to
20 mM of AHC, a significant increase in viscosity is observed
(Fig. 2) at 50 mM AHC.
It has been conjectured36 in recent past that the deformation
during the spray drying process may occur due to various factors
This journal is ª The Royal Society of Chemistry 2012
such as, thermo-dynamical instabilities, hydro-dynamical insta-
bilities or particle–particle interactions inside the drying droplet.
Kinetics of the drying process drives a suspension far from
equilibrium, leading to dramatic changes in morphology as
solvent evaporates. The rate of drying is a key feature in this
regard. The quantitative measure of the strength of drying is
represented by the Peclet number (Pe). This is defined as the
ratio of mixing time smix (¼R2/D) and drying time sdry (i.e., Pe ¼R2/Dsdry, where R is the radius of the droplets, D is the diffusion
coefficient of the colloidal particles in the droplet and sdry is thedrying time. If Pe � 1, the drying process is regarded as slow and
the droplets shrink12 in an isotropic fashion throughout the
drying process leading to completely jammed spherical grains.
However, for Pe [ 1, the drying is fast enough and there is
a possibility of the formation of hollow grains during drying,
depending on the other physical parameters. In the present
experiment, the drying time is �0.5 s as calculated from the
geometry of drying chamber and the aspiration rate. It should be
mentioned that at present the exact initial droplet size distribu-
tion could not be measured due to technical limitations.
However, the conservation of mass and the typical average
radius (�2 mm) of the obtained grains (Fig. 1) indicates a typical
average radius of initial droplet to be �8 mm. Diffusion coeffi-
cient (D) may be calculated from the Stokes–Einstein relation, D
¼ KBT/6phr, where KB is Boltzmann constant, h is the viscosity
and r represents the average radius of the colloids. ForT¼ 40 �C,r ¼ 7.5 nm and h ¼ 1 mPa s, D works out to be 3.05 � 10�11 m2
s�1. So, Pe becomes �4, which is more than unity. Thus,
formation of a hollow shell during self assembly is possible in
such a case and is also indicated by the hollow micro-capsules in
Fig. 1. Although in the intermediate stage of drying, the droplets
remain viscous in nature, they become elastic during the course
of drying by formation of a dense shell at the air–water interface.
The thickness and the nature of the shell are important param-
eters and determine the required stress to drive the deformation.
Initially, such a shell is produced and gets thicker as droplet
shrinks. At this stage, the main mechanism of water transfer is
governed by the pressure gradient resulting from the capillary
forces. However, at a certain instant, the capillary forces, driving
Soft Matter, 2012, 8, 1955–1963 | 1957
Fig. 3 SANS data (from facilities at Dhruva reactor, India) for the
assembled silica-SDS microcapsules are depicted. Data from double
crystal based MSANS and pinhole collimation SANS are merged to
access a wide q range.
Dow
nloa
ded
by B
habh
a A
tom
ic R
esea
rch
Cen
tre
on 1
5 Fe
brua
ry 2
012
Publ
ishe
d on
23
Dec
embe
r 20
11 o
n ht
tp://
pubs
.rsc
.org
| do
i:10.
1039
/C1S
M06
964K
View Online
the deformation, of the shell overcome the electrostatic forces
stabilizing the colloidal particles. Then the shell becomes elastic
and undergoes a sol–gel type transition and buckles. Once
buckling occurs, it becomes energetically favourable to force
plastic deformation of the shell through the tip of the invagina-
tion. This gives rise to doughnut like particles with a central hole.
It has been pointed out earlier that the buckling of such hollow
elastic20,21 shell during drying results in formation of doughnut
grains as shown in Fig. 1a, 1b.
However, it has also been observed that the addition of just 2wt
% SDS arrests the buckling and produces the microcapsules with
nearly spherical shape. At the same time, it is revealed from the
SEM investigations that these spherical grains are hollow in
nature. This implies that the addition of SDS in silica dispersion
somehow hinders or retards the buckling process. It is to be
mentioned that SDS in water forms nearly-globular micelles at
concentration of 1.4% (i.e., 50mM) inwater. In the absence of any
hydrotropic electrolyte, these micelles are spherical in nature.
With the addition of hydrotropic electrolyte, like AHC, PTHC
etc., themicelles become elongated24,25 and rod/worm likemicelles
are manifested. Typical sizes of the spherical SDSmicelles remain
in the range 3–4 nm, which is smaller than the size18 of the silica
particles (�10–15 nm) used in the present experiment. As the
micelles are significantly smaller than the silica particles, the
micelles could diffuse faster towards the core away from the air
water interface than the silica particles. This results in formation
of microcapsules with silica rich outer shell and micelle rich inner
shell. Thus, the Peclet number corresponding to the micelles
remains smaller than that of the silica particles. The reduction in
effective Peclet number, vis-�a-vis formation of relatively thick
shell (silica mostly at outer shell and micelles at inner shell)
hinders/slows down the buckling deformation resulting spherical
grains, which otherwise become doughnut-shaped after buckling
when only silica particles are present. Here, it should be
mentioned that after assembly during drying, the dry micelles get
locked and this assembly of micelles should not be confused with
conventional micelles in solutions. Upon removal of the trapped
surfactant aggregates, this gives rise to hollow microcapsules (as
evident from the SEM micrograph in Fig. 1(c)).
With addition of AHC, the rheological properties of the
dispersion get altered and deformation of the grains creeps in.
Further, the internal structure and correlation also get modified.
It has already been mentioned earlier that very recently an arrest
of morphological transformation of mixed colloidal suspension
droplets during EISA has been shown through effective coverage
of larger and softer colloidal components by smaller and harder
components by proper tuning of the surface charges. However,
the opposite scenario i.e., the morphological transformation in
the case where the smaller particles are softer compared to the
bigger one is yet to be investigated. In the present investigation, we
try to improvise such understanding i.e., how inter-particle
interaction/surface charge and viscosity affect the morphological
transformation during spray drying.Here, it should bementioned
that a larger Peclet number implies more buckling and vis-�a-vis
smaller shell thickness. Increase in viscosity is associated with an
enhancement in the Peclet number that leads to a relatively thin
elastic shell at the time of buckling. Later on, we will show in the
simulation how a small relative thickness (i.e., the ratio of shell
thickness to radius) leads to more deformed microcapsules.
1958 | Soft Matter, 2012, 8, 1955–1963
The modifications in the structure and the correlation were
apprehended through the scattering experiments. Scattering data
from facilities33–35 at Dhruva reactor are presented in Fig. 3. The
combined scattering data from KWS-1 and KWS-3 are shown in
Fig. 4. Although the basic features in the scattering profiles were
almost similar, combined data from KWS-1 and KWS-3 were
used for further analysis purpose because of better statistics and
resolution. It is evident from Fig. 4 that, the SANS profiles
primarily contain three distinct zones: Zone-I, Zone-II and
Zones-III. Zone-I bears the signature of the scattering contri-
bution from overall morphology of the assembled grains (i.e., the
largest length scale). Zone-II is primarily due to scattering by
correlated silica particles (i.e., the intermediate length scale) in
the grains. Zone-III reflects the scattering contribution from the
micellar arrangement (smallest length scale) in the assembled
grains. The functionality of Zone-I gets significantly modified
beyond the addition of 20 mM AHC.
As the functionality of the Zone-I is primarily determined by
the scattering from overall grain, it is discernible that the
morphology of the microcapsules change drastically at higher
AHC concentration. This suggests that addition of AHC not
only alters the microstructure of micelles at small length scales
but also affects the overall morphology. Interestingly, a prom-
inent peak in Zone-III appears due to the inter micellar inter-
ference when SDS is added along-with silica. The peak height
gets modified with an increase in AHC concentration, particu-
larly with addition of 50 mM of AHC. These modifications are
also supported by the SAXS data (Fig. 5). In addition, SAXS
data also show the appearance of a second peak at highest AHC
concentration, which arises from the ordered arrangement of
micelles. A reduction in height of the first peak, at highest AHC
concentration, was observed from both SAXS and SANS data.
It is worthy to mention that due to the presence of density
fluctuations in multi length-scale, complexity in analysis of scat-
tering data is quite evident. However, when the length scales in the
hierarchical density fluctuations are widely separated, an analysis
method has been proposed13,37 earlier. Based on this model, the
shape of the scattering profile has been analyzed using an additive
hierarchical model for the spray dried grains. In brief, the
This journal is ª The Royal Society of Chemistry 2012
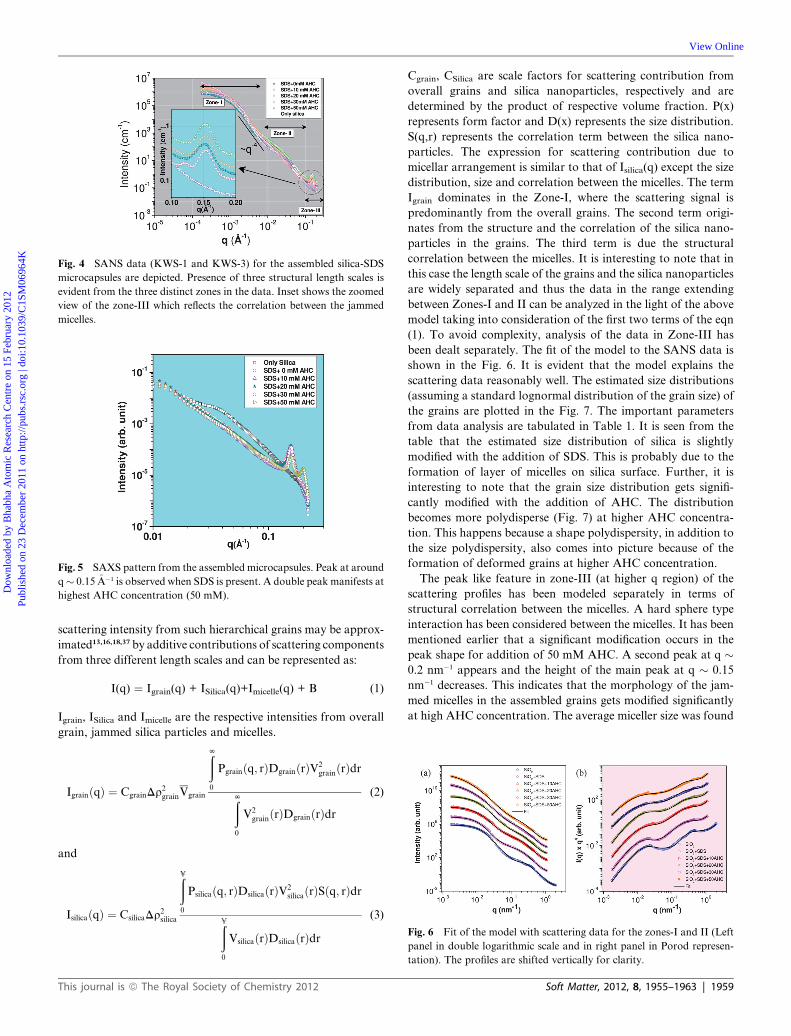
Fig. 4 SANS data (KWS-1 and KWS-3) for the assembled silica-SDS
microcapsules are depicted. Presence of three structural length scales is
evident from the three distinct zones in the data. Inset shows the zoomed
view of the zone-III which reflects the correlation between the jammed
micelles.
Fig. 5 SAXS pattern from the assembled microcapsules. Peak at around
q� 0.15�A�1 is observed when SDS is present. A double peak manifests at
highest AHC concentration (50 mM).
Fig. 6 Fit of the model with scattering data for the zones-I and II (Left
panel in double logarithmic scale and in right panel in Porod represen-
tation). The profiles are shifted vertically for clarity.
Dow
nloa
ded
by B
habh
a A
tom
ic R
esea
rch
Cen
tre
on 1
5 Fe
brua
ry 2
012
Publ
ishe
d on
23
Dec
embe
r 20
11 o
n ht
tp://
pubs
.rsc
.org
| do
i:10.
1039
/C1S
M06
964K
View Online
scattering intensity from such hierarchical grains may be approx-
imated13,16,18,37 by additive contributions of scattering components
from three different length scales and can be represented as:
I(q) ¼ Igrain(q) + ISilica(q)+Imicelle(q) + B (1)
Igrain, ISilica and Imicelle are the respective intensities from overall
grain, jammed silica particles and micelles.
IgrainðqÞ ¼ CgrainDr2grainVgrain
ðN
0
Pgrainðq; rÞDgrainðrÞV2grainðrÞdr
ðN
0
V2grainðrÞDgrainðrÞdr
(2)
and
IsilicaðqÞ ¼ CsilicaDr2silica
ðU
0
Psilicaðq; rÞDsilicaðrÞV2silicaðrÞSðq; rÞdr
ðU
0
VsilicaðrÞDsilicaðrÞdr(3)
This journal is ª The Royal Society of Chemistry 2012
Cgrain, CSilica are scale factors for scattering contribution from
overall grains and silica nanoparticles, respectively and are
determined by the product of respective volume fraction. P(x)
represents form factor and D(x) represents the size distribution.
S(q,r) represents the correlation term between the silica nano-
particles. The expression for scattering contribution due to
micellar arrangement is similar to that of Isilica(q) except the size
distribution, size and correlation between the micelles. The term
Igrain dominates in the Zone-I, where the scattering signal is
predominantly from the overall grains. The second term origi-
nates from the structure and the correlation of the silica nano-
particles in the grains. The third term is due the structural
correlation between the micelles. It is interesting to note that in
this case the length scale of the grains and the silica nanoparticles
are widely separated and thus the data in the range extending
between Zones-I and II can be analyzed in the light of the above
model taking into consideration of the first two terms of the eqn
(1). To avoid complexity, analysis of the data in Zone-III has
been dealt separately. The fit of the model to the SANS data is
shown in the Fig. 6. It is evident that the model explains the
scattering data reasonably well. The estimated size distributions
(assuming a standard lognormal distribution of the grain size) of
the grains are plotted in the Fig. 7. The important parameters
from data analysis are tabulated in Table 1. It is seen from the
table that the estimated size distribution of silica is slightly
modified with the addition of SDS. This is probably due to the
formation of layer of micelles on silica surface. Further, it is
interesting to note that the grain size distribution gets signifi-
cantly modified with the addition of AHC. The distribution
becomes more polydisperse (Fig. 7) at higher AHC concentra-
tion. This happens because a shape polydispersity, in addition to
the size polydispersity, also comes into picture because of the
formation of deformed grains at higher AHC concentration.
The peak like feature in zone-III (at higher q region) of the
scattering profiles has been modeled separately in terms of
structural correlation between the micelles. A hard sphere type
interaction has been considered between the micelles. It has been
mentioned earlier that a significant modification occurs in the
peak shape for addition of 50 mM AHC. A second peak at q �0.2 nm�1 appears and the height of the main peak at q � 0.15
nm�1 decreases. This indicates that the morphology of the jam-
med micelles in the assembled grains gets modified significantly
at high AHC concentration. The average miceller size was found
Soft Matter, 2012, 8, 1955–1963 | 1959
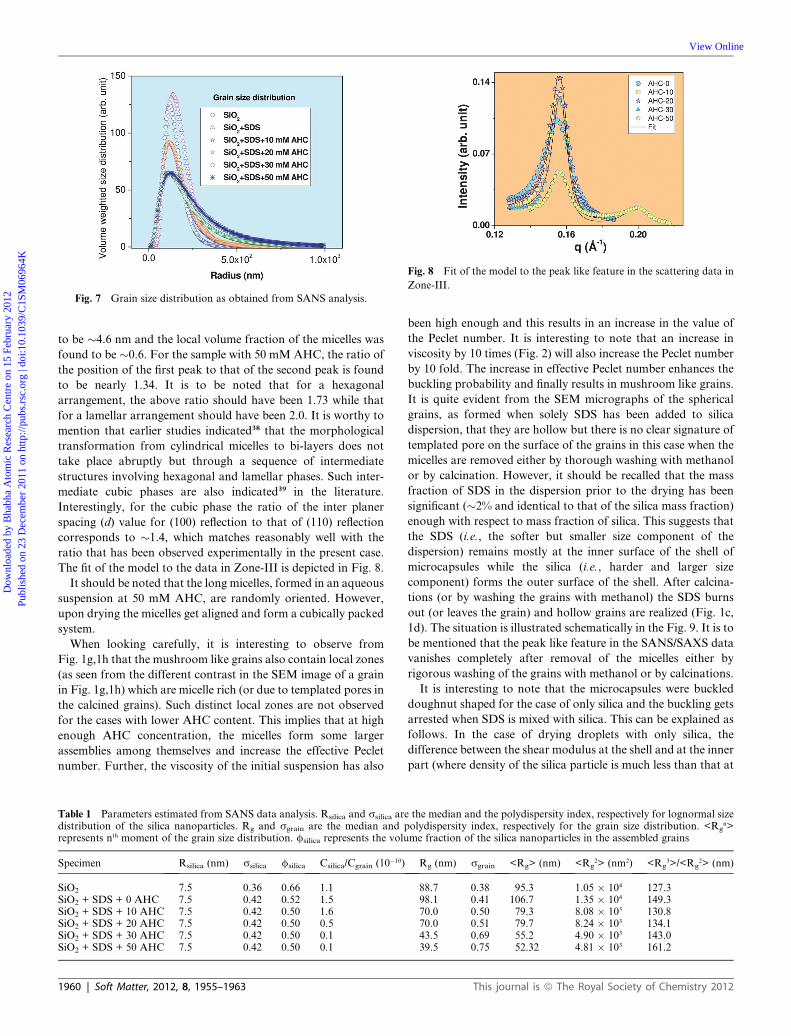
Fig. 7 Grain size distribution as obtained from SANS analysis.
Fig. 8 Fit of the model to the peak like feature in the scattering data in
Zone-III.
Dow
nloa
ded
by B
habh
a A
tom
ic R
esea
rch
Cen
tre
on 1
5 Fe
brua
ry 2
012
Publ
ishe
d on
23
Dec
embe
r 20
11 o
n ht
tp://
pubs
.rsc
.org
| do
i:10.
1039
/C1S
M06
964K
View Online
to be �4.6 nm and the local volume fraction of the micelles was
found to be �0.6. For the sample with 50 mM AHC, the ratio of
the position of the first peak to that of the second peak is found
to be nearly 1.34. It is to be noted that for a hexagonal
arrangement, the above ratio should have been 1.73 while that
for a lamellar arrangement should have been 2.0. It is worthy to
mention that earlier studies indicated38 that the morphological
transformation from cylindrical micelles to bi-layers does not
take place abruptly but through a sequence of intermediate
structures involving hexagonal and lamellar phases. Such inter-
mediate cubic phases are also indicated39 in the literature.
Interestingly, for the cubic phase the ratio of the inter planer
spacing (d) value for (100) reflection to that of (110) reflection
corresponds to �1.4, which matches reasonably well with the
ratio that has been observed experimentally in the present case.
The fit of the model to the data in Zone-III is depicted in Fig. 8.
It should be noted that the long micelles, formed in an aqueous
suspension at 50 mM AHC, are randomly oriented. However,
upon drying the micelles get aligned and form a cubically packed
system.
When looking carefully, it is interesting to observe from
Fig. 1g,1h that the mushroom like grains also contain local zones
(as seen from the different contrast in the SEM image of a grain
in Fig. 1g,1h) which are micelle rich (or due to templated pores in
the calcined grains). Such distinct local zones are not observed
for the cases with lower AHC content. This implies that at high
enough AHC concentration, the micelles form some larger
assemblies among themselves and increase the effective Peclet
number. Further, the viscosity of the initial suspension has also
Table 1 Parameters estimated from SANS data analysis. Rsilica and ssilica aredistribution of the silica nanoparticles. Rg and sgrain are the median and prepresents nth moment of the grain size distribution. fsilica represents the volu
Specimen Rsilica (nm) ssilica fsilica Csilica/Cgrain (10�10)
SiO2 7.5 0.36 0.66 1.1SiO2 + SDS + 0 AHC 7.5 0.42 0.52 1.5SiO2 + SDS + 10 AHC 7.5 0.42 0.50 1.6SiO2 + SDS + 20 AHC 7.5 0.42 0.50 0.5SiO2 + SDS + 30 AHC 7.5 0.42 0.50 0.1SiO2 + SDS + 50 AHC 7.5 0.42 0.50 0.1
1960 | Soft Matter, 2012, 8, 1955–1963
been high enough and this results in an increase in the value of
the Peclet number. It is interesting to note that an increase in
viscosity by 10 times (Fig. 2) will also increase the Peclet number
by 10 fold. The increase in effective Peclet number enhances the
buckling probability and finally results in mushroom like grains.
It is quite evident from the SEM micrographs of the spherical
grains, as formed when solely SDS has been added to silica
dispersion, that they are hollow but there is no clear signature of
templated pore on the surface of the grains in this case when the
micelles are removed either by thorough washing with methanol
or by calcination. However, it should be recalled that the mass
fraction of SDS in the dispersion prior to the drying has been
significant (�2% and identical to that of the silica mass fraction)
enough with respect to mass fraction of silica. This suggests that
the SDS (i.e., the softer but smaller size component of the
dispersion) remains mostly at the inner surface of the shell of
microcapsules while the silica (i.e., harder and larger size
component) forms the outer surface of the shell. After calcina-
tions (or by washing the grains with methanol) the SDS burns
out (or leaves the grain) and hollow grains are realized (Fig. 1c,
1d). The situation is illustrated schematically in the Fig. 9. It is to
be mentioned that the peak like feature in the SANS/SAXS data
vanishes completely after removal of the micelles either by
rigorous washing of the grains with methanol or by calcinations.
It is interesting to note that the microcapsules were buckled
doughnut shaped for the case of only silica and the buckling gets
arrested when SDS is mixed with silica. This can be explained as
follows. In the case of drying droplets with only silica, the
difference between the shear modulus at the shell and at the inner
part (where density of the silica particle is much less than that at
the median and the polydispersity index, respectively for lognormal sizeolydispersity index, respectively for the grain size distribution. <Rg
n>me fraction of the silica nanoparticles in the assembled grains
Rg (nm) sgrain <Rg> (nm) <Rg2> (nm2) <Rg
3>/<Rg2> (nm)
88.7 0.38 95.3 1.05 � 104 127.398.1 0.41 106.7 1.35 � 104 149.370.0 0.50 79.3 8.08 � 103 130.870.0 0.51 79.7 8.24 � 103 134.143.5 0.69 55.2 4.90 � 103 143.039.5 0.75 52.32 4.81 � 103 161.2
This journal is ª The Royal Society of Chemistry 2012
Fig. 9 Schematic diagram showing the two different situations with no
AHC and with large amount of AHC. At large AHC concentration, the
ordering of cylindrical micelles during self-assembly occurs through an
intermediate cubic phase between hexagonal and lamellar.
Dow
nloa
ded
by B
habh
a A
tom
ic R
esea
rch
Cen
tre
on 1
5 Fe
brua
ry 2
012
Publ
ishe
d on
23
Dec
embe
r 20
11 o
n ht
tp://
pubs
.rsc
.org
| do
i:10.
1039
/C1S
M06
964K
View Online
shell) of the grains is relatively larger than the situation where
SDS micelles reside at the core of the grain and silica at the air–
water interface. Relatively less difference in the shear modulus
between the shell and core retards the buckling phenomenon in
the latter case. In addition, the slight enhancement in repulsive
zeta potential (z ¼ �50 mV for silica + SDS and z ¼ �44 mV for
only silica) slows down the buckling process to some extent.
Further, the doughnut shape in case of only silica was signifi-
cantly smoother than in the case of increased AHC concentra-
tion. This is because of the appearance of heterogeneity of the
shear modulus at the shell surface. At larger concentrations of
AHC, i.e., when the surface charge is reduced, the micelles
deviate from spherical shape and tend to be arranged as elon-
gated cylinders which effectively reduce their diffusion coeffi-
cient. Because of lesser rate of diffusion, some fraction of the
micelles resides at the shell. This leads to heterogeneity in shear
modulus at the shell. Micelle rich zones, being softer than silica,
will be more prone to forming invagination zones on the surface
and thus deformed doughnuts with multi invagination zones are
formed. Further, according to Darcy’s law, larger viscosity
values at high AHC concentration will increase the pressure
gradient (DPf h) across the shell, which leads to easier defor-
mation. At this juncture, it may be worthy to mention that such
a kind of surface wrinkling, as also often seen in nature in
dehydrated peas, dried raisins etc., may be a nuisance to be
avoided in many engineering applications on one hand but on the
other hand is a useful way of achieving unusual physical prop-
erties in the micrometric scale based on larger surface areas.
The buckling instabilities as observed in the present case have
been interpreted and have been attempted to explain using the
thin elastic shell theory.21,22 Mathematically, the total energy of
thin elastic shell can be written as follows:
F ¼ð�
1
2kðC1 þ C2 � C0Þ2 þ 1
23ij Kijkl3kl
�dA (4)
The first term in the expression stands for the bending energy.
Here k is the bending modulus, C1 and C2 are two principal
curvatures of the surface and C0 is the spontaneous curvature.
This journal is ª The Royal Society of Chemistry 2012
The second term stands for the stretching energy along a plane
and Kijkl and the 3 stands for the elasticity and strain tensors. The
deformation of a homogenous thin elastic shell of thickness h is
essentially governed by the interplay of stretching and bending
components of total energy. The ratio of these two components is
represented by a non-dimensional number called the F€oppl–von
Karman number as shown below:
g ¼ AR2
k(5)
Here A is two-dimensional (2D) Young’s modulus given by
Yh, with Y the (3D) Young’s modulus, R is the shell radius and k
is the 2D bending modulus given by Yh3/[12(1�n2)].
The same number (g) is also related to the shell thickness/
radius ratio (h/R) and the Poisson ratio (n) as
g ¼ 12ð1� v2Þðh=RÞ2 (6)
This relationship shows that in thin shell theory, relative shell
thickness (h/R) and Poisson ratio (i.e., the ratio of transverse
strain to the axial strain for a body under applied load) are the
two parameters which control the shape of the elastic shell.
The elastic shell configurations, which minimize the energy
functional given by eqn (4), were found using freely available
software, Surface Evolver.40 The following procedure, which is
based on earlier works by Jie et al.41 and Quilliet et al.,42 is used to
simulate the deformation and buckling of thin elastic shells. A
regular cubic polyhedron is assumed as the initial shape. This
cube is evolved into a sphere by minimizing the surface area while
keeping its volume fixed at Vo. The surface tension is later
removed and the surface area of the shell is made fixed. The
required named methods are then applied on the thin elastic shell
and the completely evolved sphere is taken as the un-strained
shape. The volume of this shell is gradually reduced in steps of
either of 0.0024Vo or 0.0048Vo. The shape is evolved to an energy
minimum state after each volume step using gradient descent and
the conjugate gradient methods. The simulations are stopped at
the point when the surfaces started to inter penetrate, which
varied from 0.5Vo to 0.15Vo based on the value of relative shell
thickness. In order to establish the accuracy and correctness of
this approach, several simulations were carried out to success-
fully reproduce the buckled shapes presented by Quilliet et al.42
Simulations were carried out for varying values of g keeping the
value of n fixed at 1/3. Fig. 10, 11 and 12 show the evolution of
the buckled shape for relative shell thickness of 0.231, 0.054 and
0.023, respectively. As shown earlier, for the experimental situ-
ation of only silica dispersion, the viscosity of the initial disper-
sion has been much smaller than that in the case after addition of
AHC. It indicates that the Peclet number remains relatively less
in the case of only silica dispersion compared to that of the
situation when AHC is added to the colloid. It is expected that
for only the silica case, a relatively thick shell is formed prior to
the onset of buckling instability during drying. Fig. 10 shows the
evolution of the buckled shape for a shell with h/R ¼ 0.23 and
Poisson ratio of 1/3. It is worthy to mention that the value of
Poisson ratio in case of drying network of silica nanoparticle
suspension has been shown43 to be close to 1/3. Further, similar
values of the Poisson ratio have also been used21,42 in studying
buckling of shells. It is clear from eqn (6) as well simulation
Soft Matter, 2012, 8, 1955–1963 | 1961
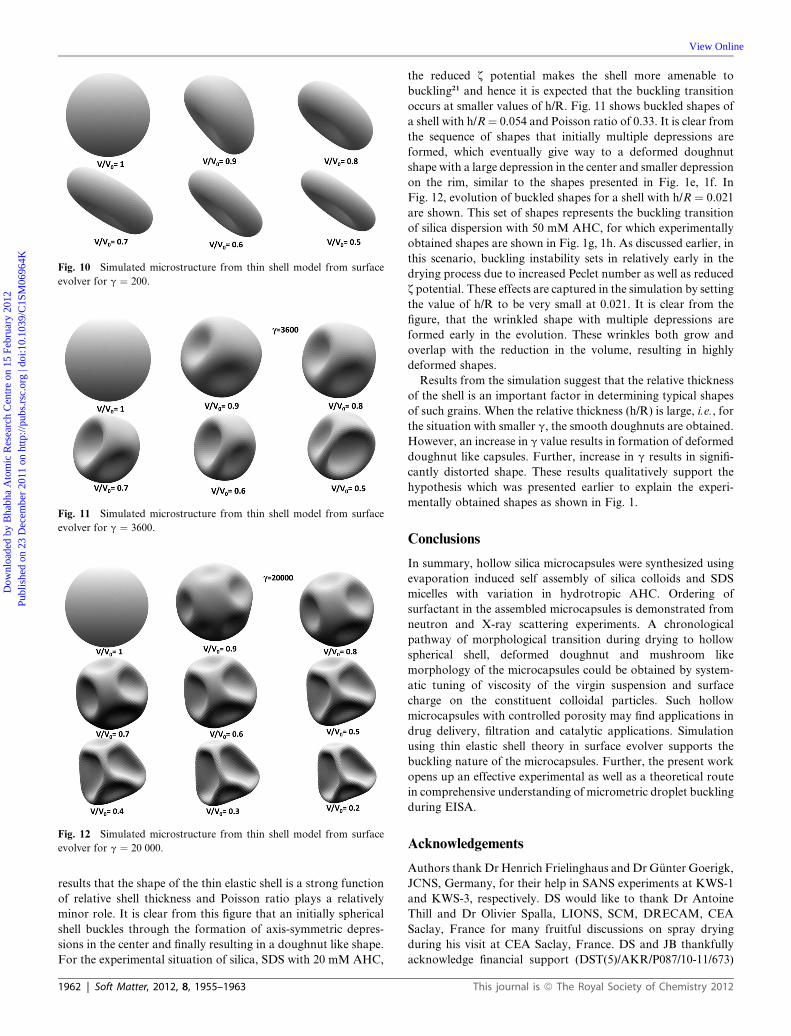
Fig. 10 Simulated microstructure from thin shell model from surface
evolver for g ¼ 200.
Fig. 11 Simulated microstructure from thin shell model from surface
evolver for g ¼ 3600.
Fig. 12 Simulated microstructure from thin shell model from surface
evolver for g ¼ 20 000.
Dow
nloa
ded
by B
habh
a A
tom
ic R
esea
rch
Cen
tre
on 1
5 Fe
brua
ry 2
012
Publ
ishe
d on
23
Dec
embe
r 20
11 o
n ht
tp://
pubs
.rsc
.org
| do
i:10.
1039
/C1S
M06
964K
View Online
results that the shape of the thin elastic shell is a strong function
of relative shell thickness and Poisson ratio plays a relatively
minor role. It is clear from this figure that an initially spherical
shell buckles through the formation of axis-symmetric depres-
sions in the center and finally resulting in a doughnut like shape.
For the experimental situation of silica, SDS with 20 mM AHC,
1962 | Soft Matter, 2012, 8, 1955–1963
the reduced z potential makes the shell more amenable to
buckling21 and hence it is expected that the buckling transition
occurs at smaller values of h/R. Fig. 11 shows buckled shapes of
a shell with h/R¼ 0.054 and Poisson ratio of 0.33. It is clear from
the sequence of shapes that initially multiple depressions are
formed, which eventually give way to a deformed doughnut
shape with a large depression in the center and smaller depression
on the rim, similar to the shapes presented in Fig. 1e, 1f. In
Fig. 12, evolution of buckled shapes for a shell with h/R ¼ 0.021
are shown. This set of shapes represents the buckling transition
of silica dispersion with 50 mM AHC, for which experimentally
obtained shapes are shown in Fig. 1g, 1h. As discussed earlier, in
this scenario, buckling instability sets in relatively early in the
drying process due to increased Peclet number as well as reduced
z potential. These effects are captured in the simulation by setting
the value of h/R to be very small at 0.021. It is clear from the
figure, that the wrinkled shape with multiple depressions are
formed early in the evolution. These wrinkles both grow and
overlap with the reduction in the volume, resulting in highly
deformed shapes.
Results from the simulation suggest that the relative thickness
of the shell is an important factor in determining typical shapes
of such grains. When the relative thickness (h/R) is large, i.e., for
the situation with smaller g, the smooth doughnuts are obtained.
However, an increase in g value results in formation of deformed
doughnut like capsules. Further, increase in g results in signifi-
cantly distorted shape. These results qualitatively support the
hypothesis which was presented earlier to explain the experi-
mentally obtained shapes as shown in Fig. 1.
Conclusions
In summary, hollow silica microcapsules were synthesized using
evaporation induced self assembly of silica colloids and SDS
micelles with variation in hydrotropic AHC. Ordering of
surfactant in the assembled microcapsules is demonstrated from
neutron and X-ray scattering experiments. A chronological
pathway of morphological transition during drying to hollow
spherical shell, deformed doughnut and mushroom like
morphology of the microcapsules could be obtained by system-
atic tuning of viscosity of the virgin suspension and surface
charge on the constituent colloidal particles. Such hollow
microcapsules with controlled porosity may find applications in
drug delivery, filtration and catalytic applications. Simulation
using thin elastic shell theory in surface evolver supports the
buckling nature of the microcapsules. Further, the present work
opens up an effective experimental as well as a theoretical route
in comprehensive understanding of micrometric droplet buckling
during EISA.
Acknowledgements
Authors thank DrHenrich Frielinghaus and DrG€unter Goerigk,
JCNS, Germany, for their help in SANS experiments at KWS-1
and KWS-3, respectively. DS would like to thank Dr Antoine
Thill and Dr Olivier Spalla, LIONS, SCM, DRECAM, CEA
Saclay, France for many fruitful discussions on spray drying
during his visit at CEA Saclay, France. DS and JB thankfully
acknowledge financial support (DST(5)/AKR/P087/10-11/673)
This journal is ª The Royal Society of Chemistry 2012
Dow
nloa
ded
by B
habh
a A
tom
ic R
esea
rch
Cen
tre
on 1
5 Fe
brua
ry 2
012
Publ
ishe
d on
23
Dec
embe
r 20
11 o
n ht
tp://
pubs
.rsc
.org
| do
i:10.
1039
/C1S
M06
964K
View Online
received from Department of Science and Technology, India
through S. N. Bose National Centre for Basic Science, Kolkata,
India for neutron scattering work at JCNS, Germany. Authors
thank Dr Guruswamy Kumaraswamy, NCL, Pune, India for the
SAXS measurements. PD and KV would like to thank Prof. K.
Brakes for providing the software Surface Evolver and Prof. C.
Quilliet for helping in setting the simulations.
References
1 F. Caruso, R. A. Caruso and H. Mohwald, Science, 1998, 28, 1111–1114.
2 P. Jiang, J. F. Bertone and V. L. Colvin, Science, 2001, 291, 453–457.3 W. Gu, L. Zhang, H. Chen and J. Shi, J. Am. Chem. Soc., 2005, 127,8916–8917.
4 Y. Wang, L. Cai and Y. Xia, Adv. Mater., 2005, 17, 473–477.5 Y. Wang and Y. Xia, Nano Lett., 2004, 4, 2047–2050.6 X. Xu and S. A. Asher, J. Am. Chem. Soc., 2004, 126, 7940–7945.7 K. Yong Joo, L. Mi Hyeon, K. Hark Jin, L. Gooil, C. Young Sik,P. Nam-Gyu, K. Kyungkon and L. Wan In, Adv. Mater., 2009, 21,3668–3673.
8 Wenguang Leng, Min Chen, Shuxue Zhou and Limin Wu, Langmuir,2010, 26(17), 14271–14275.
9 E. Donath, G. B. Sukhorukov, F. Caruso, S. A. Davis andH. M€ohwald, Angew. Chem., Int. Ed., 1998, 37, 2201–2205.
10 M. Sch€onhoff, Curr. Opin. Colloid Interface Sci., 2003, 8, 86–95.11 Ferry Iskandar, Mikrajuddin and Kikuo Okuyama,Nano Lett., 2002,
2(4), 389–392.12 D. Sen, O. Spalla, O. Tach�e, P. Haltebourg and A. Thill, Langmuir,
2007, 23, 4296–4302.13 D. Sen, O. Spalla, L. Belloni, T. Charpentier and A. Thill, Langmuir,
2006, 22, 3798–3806.14 S. Lyonnard, J. R. Bartlett, E. Sizgek, K. S. Finnie, T. Zemb and
J. L. Woolfrey, Langmuir, 2002, 18, 10386–10397.15 J. Bahadur, D. Sen, S. Mazumder, S. Bhattacharya, H. Frielinghaus
and G. Goerigk, Langmuir, 2011, 27, 8404–8414.16 D. Sen, J. S. Melo, J. Bahadur, S. Mazumder, S. Bhattacharya,
S. F. D’Souza, H. Frielinghaus, G. Goerigk and R. Loidl, SoftMatter, 2011, 7, 5423.
17 D. Sen, S. Mazumder, J. S. Melo, A. Khan, S. Bhattyacharya andS. F. D’Souza, Langmuir, 2009, 25(12), 6690–6695.
18 D. Sen, J. S. Melo, J. Bahadur, S. Mazumder, S. Bhattacharya,G. Ghosh, D. Dutta and S. F. D’Souza, Eur. Phys. J. E, 2010, 31,393–402.
This journal is ª The Royal Society of Chemistry 2012
19 D. Sen, A. Khan, J. Bahadur, S. Mazumder and B. K. Sapra, J.Colloid Interface Sci., 2010, 347, 25–30.
20 J. Bahadur, D. Sen, S. Mazumder, B. Paul, A. Khan and G. Ghosh, J.Colloid Interface Sci., 2010, 351, 357.
21 N. Tsapis, E. R. Dufresne, S. S. Sinha, C. S. Riera, J. W. Hutchinson,L. Mahadevan and D. A. Weitz, Phys. Rev. Lett., 2005, 94, 018302.
22 L. Pauchard and Y. Couder, Europhys. Lett., 2004, 66(5), 667–673.23 O. D. Velev, A. M. Lenhoff and E. W. Kaler, Science, 2000, 287,
2240–2243.24 Gunjan Garg, P. A. Hassan, V. K. Aswal and S. K. Kulshreshtha, J.
Phys. Chem. B, 2005, 109, 1340.25 P. A. Hassan, Srinivasa R. Raghavan and Eric W. Kaler, Langmuir,
2002, 18, 2543–2548.26 P. Lindner, T. Zemb,Neutrons, X-Rays and Light: ScatteringMethods
Applied to Soft Condensed Matter Elsevier: Amsterdam, 2002.27 O. Glatter and O. Kratky, Small Angle X-ray Scattering, Academic
Press, London 1982.28 D. Sen, S. Mazumder and J. Bahadur, Phys. Rev. B, 2009, 79, 134207.29 S. Mazumder, D. Sen, A. K. Patra, S. A. Khadilker, R. M. Cursetji,
R. Loidl, M. Baron and H. Rauch, Phys. Rev. Lett., 2004, 93, 255704.30 S. Mazumder, D. Sen, I. S. Batra, R. Tewari, G. K. Dey, S. Banerjee,
A. Sequeira, H. Amentisch and S. Bernstorff, Phys. Rev. B, 1999, 60,822.
31 H. Frielinghaus, et al., JCNS Experimental Report, 2007/2008, http://www.jcns.info/src/report/sr2008_KWS1_new_PB3.pdf.
32 G. Goerigk and Z. Varga, J. Appl. Crystallogr., 2011, 44, 337.33 S. Mazumder, D. Sen, T. Saravanan and P. R. Vijayaraghavan, J.
Neutron Res., 2001, 9, 39.34 S. Mazumder, D. Sen, T. Saravanan and P. R. Vijayaraghavan,
Current Science, 2001, 81, 257.35 V. K. Aswal and P. S. Goyal, Curr. Sci., 2001, 79, 947.36 F. Iskandar, L. Gradon and Kikuo Okuyama, J. Colloid Interface
Sci., 2003, 265, 296–303.37 A. Thill and O. Spalla, J. Colloid Interface Sci., 2005, 291, 477–488.38 M. C. Holmes, M. S. Leaver in Bicontinuous liquid crystals; M. L.
Lynch, P. T. Spicer, ed.; Surfactant Science Series, Volume 127,CRC Press: Boca Raton, FL, 2005; pp 15–39.
39 V. Luzzati, In Biological Membrane, D. Chapman, ed.; AcademicPress: London and New York, p71, 1968.
40 K. Brakke, Exp. Math., 1992, 1, 141.41 Yan Jie, Liu Quanhui, Liu Jixing and Ou-Yang Zhong-Can, Phys.
Rev. E: Stat. Phys., Plasmas, Fluids, Relat. Interdiscip. Top., 1998,58, 4730–4736.
42 C. Quilliet, C. Zoldesi, C. Riera, A. van Blaaderen and A. Imhof, Eur.Phys. J. E, 2008, 27, 13–20.
43 G. W. Scherer, J. Non-Cryst. Solids, 1997, 215, 155–168.
Soft Matter, 2012, 8, 1955–1963 | 1963