Public Hearing Transcripts - Nairobi - RTJRC28.02 (Nyayo ...
Nairobi households and their energy use
An economic analysis of consumption patterns
Ellen L. Hughes-Cromwick
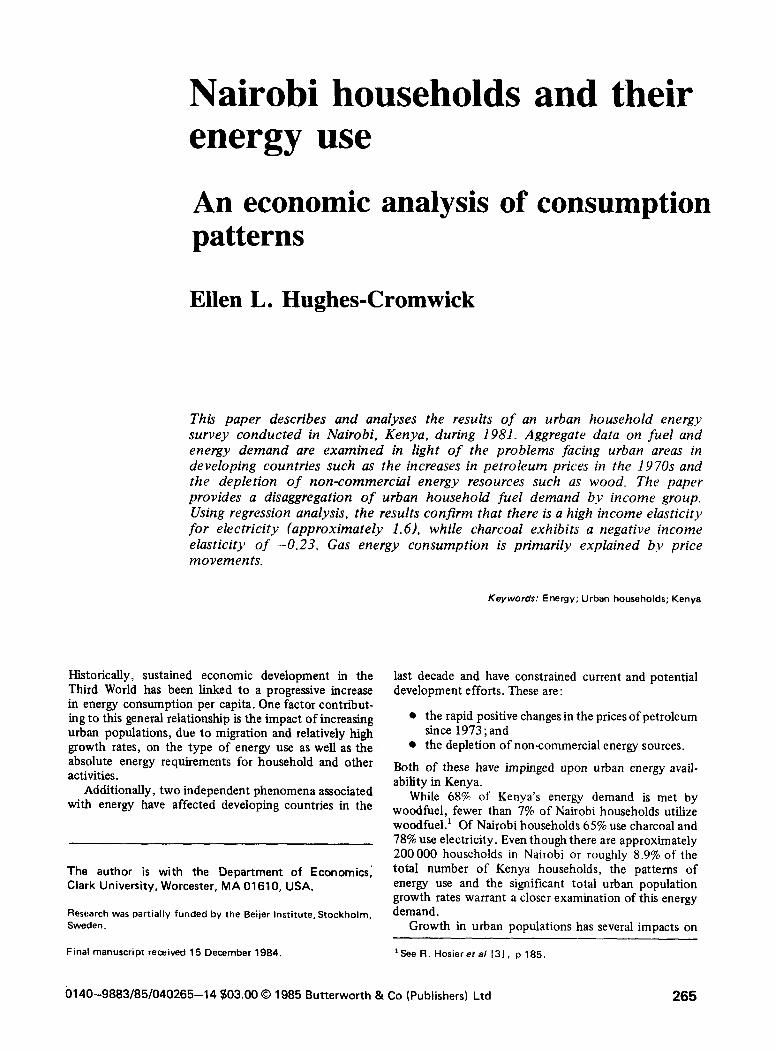
Thtk paper describes and analyses the results of an urban household energy survey conducted in Nairobi, Kenya, during 1981. Aggregate data on fuel and energy demand are examined in light of the problems facing urban areas in developing countries such as the increases in petroleum prices in the 1970s and the depletion of non-commercial energy resources such as wood. The paper provides a disaggregation of urban household fuel demand by income group. Using regression analysis, the results confirm that there is a high income elasticity for electricity (approximately l.(S), while charcoal exhibits a negative income elasticity of -0.23. Gas energy consumption is primarily explained by price movements.
Keywords: Energy; Urban households; Kenya
Historically, sustained economic development in the Third World has been linked to a progressive increase in energy consumption per capita. One factor contribut- ing to this general relationship is the impact of increasing urban populations, due to migration and relatively high growth rates, on the type of energy use as well as the absolute energy requirements for household and other activities.
Additionally, two independent phenomena associated with energy have affected developing countries in the
The author is with the Department of Economics; Clark University, Worcester, MA 01610, USA.
Research was partially funded by the Beijer Institute, Stockholm, Sweden.
While 68% of Kenya’s energy demand is met by woodfuel, fewer than 7% of Nairobi households utilize woodfuel.’ Of Nairobi households 65% use charcoal and 78% use electricity. Even though there are approximately 200000 households in Nairobi or roughly 8.9% of the total number of Kenya households, the patterns of energy use and the significant total urban population growth rates warrant a closer examination of this energy demand.
Growth in urban populations has several impacts on
Final manuscript received 15 December 1984. ‘See R. Hosieref al 131, p 185.
last decade and have constrained current and potential development efforts. These are :
0 the rapid positive changes in the prices of petroleum since 1973 ; and
l the depletion of non-commercial energy sources.
Both of these have impinged upon urban energy avail- ability in Kenya.
b140-9883/85/040265-14 $03.00 0 1985 Butterworth & Co (Publishers) Ltd 265
Nairobi households and their energy use: E. L. Hughes-Cromwick
the course of development as well as energy utilization in any country. Kenya is no exception. A large segment of rural migrants to urban areas previously utilized fuels such as wood and charcoal for the major household activities of cooking and heating. Due to availability and other constraints as well as increases in monetary income, these households, now located in urban areas, utilize greater quantities of gas, paraffin and electricity. Addi- tionally, there is a greater diversification of appliance ownership and usage in the urban areas which serves to increase the energy-related expenditure share of an urban household’s disposable income.
The fuel mix demanded in the Nairobi area affects national energy demand and so places emphasis on identifying the determinants of urban household energy consumption. Such an investigation is useful for energy planning purposes. The structure of energy prices, its availability and efficiency characteristics are all important data to utilize in the formulation of energy and economic policy .
In an effort to obtain a reliable database on Nairobi household energy requirements, the Kenyan Ministry of Energy in collaboration with the Beijer Institute of Sweden designed and implemented a cross-sectional survey in 1981 of 467 households. Survey questions specifically relate to four broad socioeconomic categories :
l social and basic necessities information; l household income; l fuel consumption, prices and end-use data; and l appliance ownership and usage.*
The major purpose of undertaking such an energy study is to fulfill the need for more complete and recent infor- mation on local needs and potential demand for primary and secondary energy sources in the Nairobi area. Very little research to date examines the structure of urban energy use in developing countries and its economic relationship to end-use patterns and changes in house- hold income. The major objectives of the survey, as
*No information on transportation fuel end use was included in the household survey and therefore all analysis undertaken here excludes this component of consumption.
‘See Ministry of Economic Planning and Development, Survey Design and Implementation Report, Ministry of Energy, Govern- ment of Kenya, September 1981, pp l-2. In addition, this report describes the sampling techniques used in identifying Nairobi households to be surveyed.
outlined in the Survey Design and Implementation Report are the following:
l to survey in selected Nairobi areas the present energy use and requirements; and
l to survey the energy resources available and attempt to evaluate the social and economic costs including developments of available and alternative sources of energy in the country.3
This research paper will describe and analyse the data- base obtained from the raw survey results and attempt to explain changes in fuel demand using econometric techniques and analysis.
Another significant element of this study is the effect of income changes on Nairobi fuel demand. While the present survey results preclude time series analysis, a cross-sectional approach illuminates the changes in energy requirements as monetary income increases. While most of the results are intuitive, the research documents the validity and magnitude of such changes.
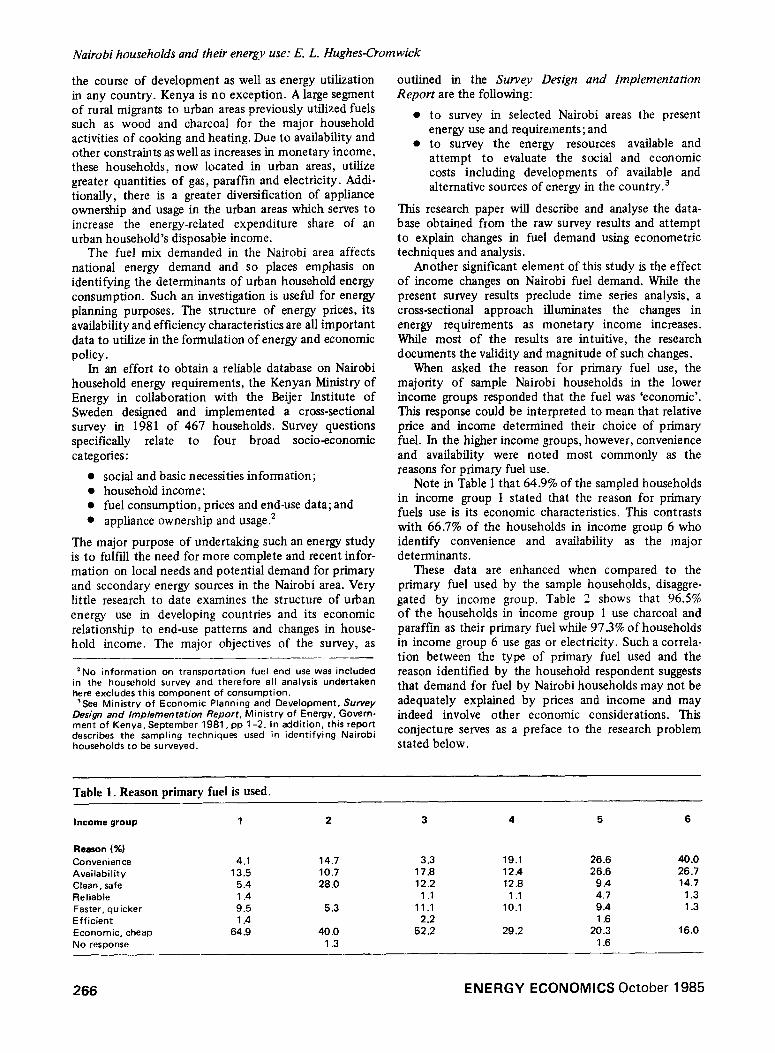
When asked the reason for primary fuel use, the majority of sample Nairobi households in the lower income groups responded that the fuel was ‘economic’. This response could be interpreted to mean that relative price and income determined their choice of primary fuel. In the higher income groups, however, convenience and availability were noted most commonly as the reasons for primary fuel use.
Note in Table 1 that 64.9% of the sampled households in income group 1 stated that the reason for primary fuels use is its economic characteristics. This contrasts with 66.7% of the households in income group 6 who identify convenience and availability as the major determinants.
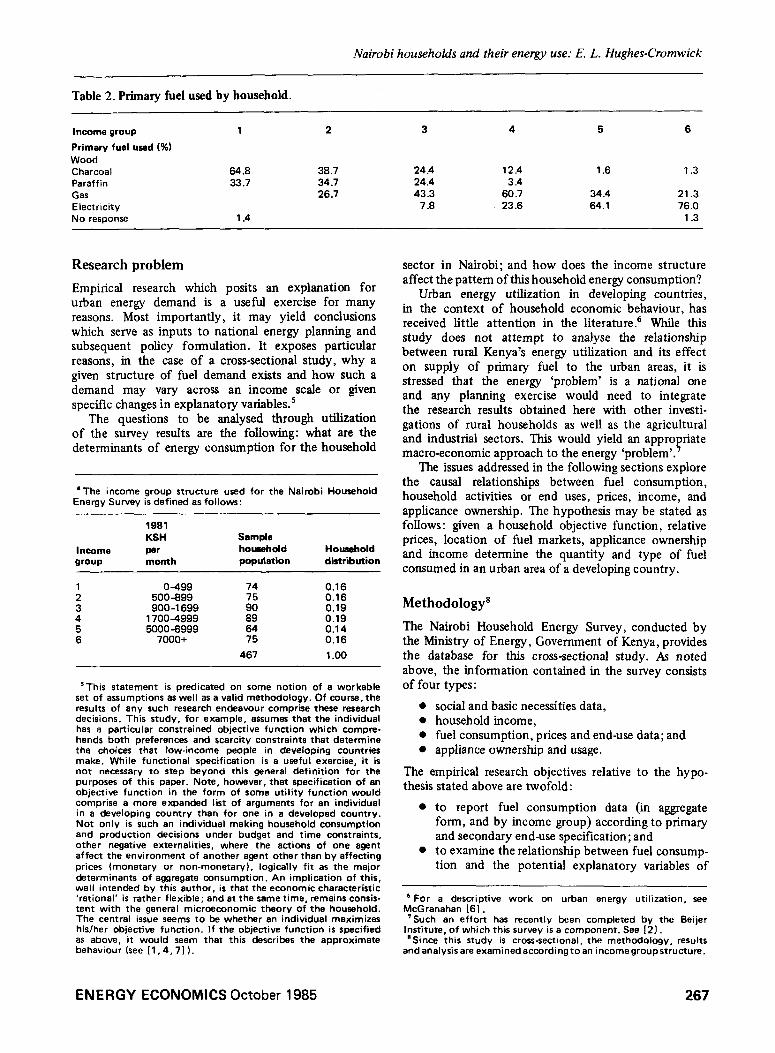
These data are enhanced when compared to the primary fuel used by the sample households, disaggre- gated by income group. Table 2 shows that 96.5% of the households in income group 1 use charcoal and paraffin as their primary fuel while 97.3% of households in income group 6 use gas or electricity. Such a correla- tion between the type of primary fuel used and the reason identified by the household respondent suggests that demand for fuel by Nairobi households may not be adequately explained by prices and income and may indeed involve other economic considerations. This conjecture serves as a preface to the research problem stated below.
Table 1. Reason primary fuel is used.
Income group 1 2 3 4 5 6
Reason (%I Convenience 4.1 14.7 3.3 19.1 26.6 40.0 Availability 13.5 10.7 17.8 12.4 26.6 26.7 Clean, safe 5.4 28.0 12.2 12.8 9.4 14.7 Reliable 1 .4 1 .1 1 .I 4.7 1.3 Faster, quicker 9.5 5.3 11 .I 10.1 9.4 1.3 Efficient 1.4 2.2 1 .6 Economic, cheap 64.9 40 .o 52.2 29.2 20.3 16.0 No response 1 .3 1.6
266 ENERGY ECONOMICS October 1985
Nairobi households and their energy use: E. L. Hughes-Cromwick
Table 2. Primary fuel used by household.
Income group 1
Primary fuel used f%)
Wood Charcoal 64.8 Paraffin 33.7 Gas Electricity No response 1.4
2 3 4 5 6
38.7 24.4 12.4 1.6 1.3 34.7 24.4 3.4 26.7 43.3 60.7 34.4 21.3
7.8 23.6 64.1 76.0 1 .3
Research problem
Empirical research which posits an explanation for urban energy demand is a useful exercise for many reasons. Most importantly, it may yield conclusions which serve as inputs to national energy planning and subsequent policy formulation. It exposes particular reasons, in the case of a cross-sectional study, why a given structure of fuel demand exists and how such a demand may vary across an income scale or given specific changes in explanatory variables.5
The questions to be analysed through utilization of the survey results are the following: what are the determinants of energy consumption for the household
‘The income group structure used for the Nairobi Household Energy Survey is defined as follows:
Income group
1981 KSH
per month
Sample houaahdd population
Household distribution
sector in Nairobi; and how does the income structure affect the pattern of this household energy consumption?
Urban energy utilization in developing countries, in the context of household economic behaviour, has received little attention in the literature.6 While this study does not attempt to analyse the relationship between rural Kenya’s energy utilization and its effect on supply of primary fuel to the urban areas, it is stressed that the energy ‘problem’ is a national one and any planning exercise would need to integrate the research results obtained here with other investi- gations of rural households as well as the agricultural and industrial sectors. This would yield an appropriate macro-economic approach to the energy ‘problem’.’
The issues addressed in the following sections explore the causal relationships between fuel consumption, household activities or end uses, prices, income, and applicance ownership. The hypothesis may be stated as follows: given a household objective function, relative prices, location of fuel markets, applicance ownership and income determine the quantity and type of fuel consumed in an urban area of a developing country.
: o-499
:z 0.16
500-899 0.16 3 900-l 699
:9” 0.19
4 17004999 0.19
: 50006999 64 0.14
7000+ 75 0.16
467 1 .oo
Methodology8
‘This statement is predicated on some notion of a workable set of assumptions as well as a valid methodology. Of course, the results of any such research endeavour comprise these research decisions. This study, for example, assumes that the individual has a particular constrained objective function which compre- hends both preferences and scarcity constraints that determine the choices that low-income people in developing countries make. While functional specification is a useful exercise, it is not necessary to step beyond this general definition for the purposes of this paper. Note, however, that specification of an objective function in the form of some utility function would comprise a more expanded list of arguments for an individual in a developing country than for one in a developed country. Not only is such an individual making household consumption and production decisions under budget and time constraints, other negative externalities, where the actions of one agent affect the environment of another agent other than by affecting prices (monetary or non-monetarv), logically fit as the major determinants of aggregate consumption. An implication of this, well intended by this author, is that the economic characteristic ‘rational’ is rather flexible; and at the same time, remains consis- tent with the general microeconomic theory of the household. The central issue seems to be whether an individual maximizes his/her objective function. If the objective function is specified as above, it would seem that this describes the approximate behaviour (see [l ,4,71).
The Nairobi Household Energy Survey, conducted by the Ministry of Energy, Government of Kenya, provides the database for this cross-sectional study. As noted above, the information contained in the survey consists of four types:
0 social and basic necessities data, l household income, l fuel consumption, prices and end-use data; and 0 appliance ownership and usage.
The empirical research objectives relative to the hypo- thesis stated above are twofold:
l to report fuel consumption data (in aggregate form, and by income group) according to primary and secondary end-use specification; and
l to examine the relationship between fuel consump- tion and the potential explanatory variables of
‘For a descriptive work on urban energy utilization, see McGranahan 161. ‘Such an effort has recently been completed by the Beijer
Institute, of which this survey is a component. See [2]. sSince this study is cross-sectional, the methodology, results
and analysis are examined according to an income groupstructure.
ENERGY ECONOMICS October 1985 267

Nairobi households and their energy use: E. L. Hughes-Cromwick
prices, income, appliance ownership, and fuel market locations.
The direct use of a particular fuel in a household is disaggregated into four end uses (or activities): cooking, space heating, lighting and ‘other’.’ In addition, each household specified primary and secondary end uses. Thus, a household could respond that it uses paraffin for primary/secondary end uses light/cook, and other.
One should note that the survey contains questions pertaining to end-use consumption (ie does household use gas for cooking). However, a fuel quantity is not specified with a particular end use. Hence, the survey discloses the total quantity of gas used per month, for example, as well as for what end uses gas is consumed, but it does not yield information on the quantity of gas (or percentage of total) used for cooking, heating etc.
Additionally, a survey respondent indicates if a fuel is used primarily for cooking, or secondarily for lighting, but again, no specific fuel quantity is associated with either the primary or secondary end uses specified by the respondent. Since fuel consumption disaggregated by primary and secondary end use is important infor- mation in understanding fuel consumption and potential substitution, a methodology was devised to perform this function .I0
A simple and multiple regression methodology was used to test the hypothesis as stated above and to address the third research objective. A multiplicative demand equation of the following form is specified:
Yi = oozei (1)
From this, two regression equations are defined:
In Yi = PO + fir lnXi + ei (2)
In Yi = /30 + pi In Xii + /I2 In X,i + Ei (3)
where
‘i = annual energy consumption of the ith fuel (in GJ)
xi = explanatory variable of the ith fuel
PO = constant term pi, & = regression coefficients of Xi
Ei = error term
The explanatory variable in Equation (2) is the nominal household income, measured in 1981 KSH per annum. The coefficient or, in this case, measures the income elasticity of the ith energy consumption. This income elasticity is generally defined as follows:
Hence it measures the percent response change in the ith energy consumption given a 1% change in nominal income. Such elasticities are valuable in determining changes in fuel demand as income rises and are useful in demand forecasts when 0, is significant.
9The ‘other’ end use may include such activities as entertain- ment (television. radio) and ironing. “‘A description of this methodology isavailable from the author.
268
The coefficients in Equation (3) provide simila! information to the researcher in that they signal the direction of change an explanatory variable such as Xii may have on the dependent variable Yi. The maxi- mum number of explanatory or independent variables used in this study is six; therefore it should be noted that not all regressions are constrained to two indepen- dent variables specified in Equation (3).
In both Equations (2) and (3), the validity of the regression coefficients 0 depends on significant F values. R* is also noted in the results reported later.” If the F value is insignificant at the 5% level for a particular regression, the results are rejected.
Empirical results
Aggregate consumption data
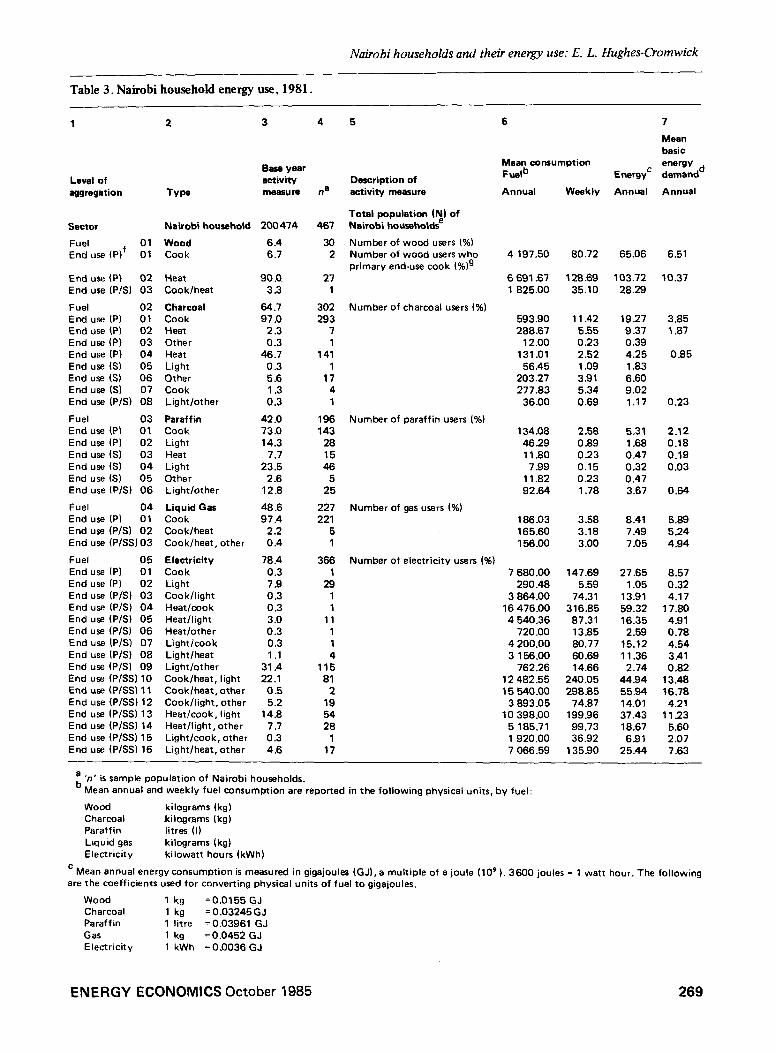
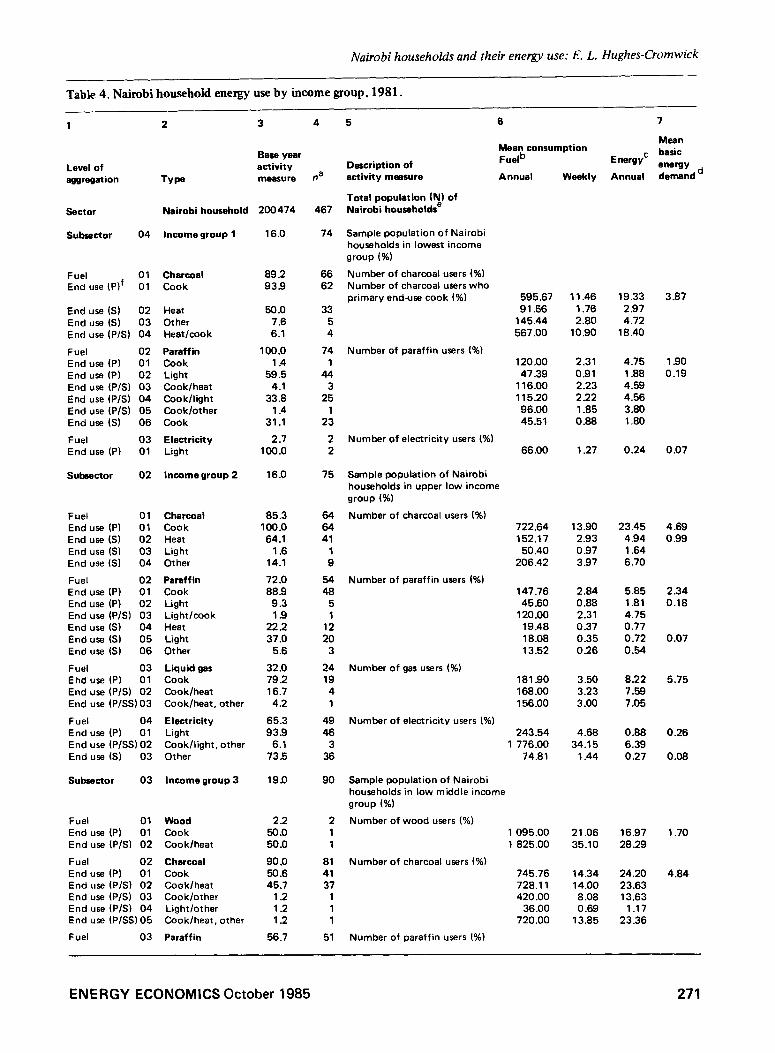
Tables 3 and 4 report the energy consumption results. Table 3 lists the aggregate consumption disaggregated by type of fuel and end use, while Table 4 disaggregates the same data by income group, thus providing a better picture of fuel consumption changes across income groups.
Utilization. We can note first, from column 3 of Table 3, that 78.4% of Nairobi households use electricity while 64.7% use charcoal. This contrasts with only 6.4% of the sampled households who reported using wood. While paraffin is a significant energy source in the rural areas, note here that 42.0% of the sample Nairobi households use paraffin.
Of all wood users 90% primarily heat with wood while 97.0% of the charcoal users primarily cook with charcoal. In addition, 97.4% of the gas users primarily cook with gas. Electricity utilization is quite different from the other fuels in that it is used for multiple purposes. The highest percentage (31.4%) utilize elec- tricity for the primary/secondary end use of lighting/ other; 22% use electricity for primary/secondary end uses of cooking/lighting and heating.
The activity measures do serve to focus attention on the degree of household utilization of these fuels; how- ever, it does not illustrate the differences, among fuels, in average consumption and basic energy demand. The mean consumption data listed in column 6 depend largely on how many sampled households primary end use cook with charcoal (column 4), the average con- sumption figure of 593.9 kg (column 6) is more significant than those cases where only one household is observed to use a fuel/end-use combination.
Fuel consumption. With this in mind, some general- izations may be drawn from the data in column 6 of Table 3. Of the 6.4% of sampled households who use
I’ One would reject (using the F-test) the null hypothesis of no relationship between Y and X at the 5% significance level with 1 and n-2 degrees of freedom. R s is the proportion of the total variation in Y explained by the regression of Y on X. Because this is a cross-sectional studv, however, low values for R* are expected (even though Models I and II specified in Equations (2) and (3) may be satisfactory) due to the large variation across individual units of observation which is inherently present in the data.
ENERGY ECONOMICS October 1985
Nairobi households and their energy use: E. L. Hughes-Cromwick
Table 3. Nairobi household energy use, 1981.
Level of aggregation
Sector Nairobi household
Fuel 01 End use (PIf 01
Wood Cook
200414 461
6.4 30 6.7 2
End use (P) 02 End use (P/S) 03
Heat Cook/heat
90 a 3.3
27
Fuel 02 End usa (P) 01 End use (P) 02 End use (P) 03 End use (P) 04 End use (S) 05 End use (S) 06 End use (S) 07 End use (P/S) 08
Charcoal Cook Heat Other Heat Light Other Cook Light/other
64.7 97.0
2.3 0.3
46.7 0.3 5.6 1 .3 0.3
302 293
7 1
141 1
17 4 1
Fuel 03 Paraffin 42 .O 196 End use (PI 01 Cook 73.0 143 End use (PI 02 Light 14.3 28 End use (S) 03 Heat 7.7 15 End use (S) 04 Light 23.5 46 End use (S) 05 Other 2.6 5 End use (P/S) 06 Light/other 12.8 25
Fuel 04 End use (P) 01 End use (P/S) 02 End use (PBS) 03
Liquid Gas Cook Cook/heat Cook/heat, other
227 221
5
Fuel 05 End use (P) 01 End use (P) 02 End use (P/S) 03 End use (P/S) 04 End use (P/S) 05 End use (P/S) 06 End use [P/S) 07 End use (P/S) 08 End use (P/S) 09 End use (PBS) IO End use (PISS) 11 End use (P/SSl 12 End use (PISS) 13 End use (PBS) 14 End use (PBS) 15 End use (P/SS) 16
Electricity Cook Light Cook/light Heat/cook Heat/light Heat/other Light/cook Light/heat Light/other Cook/heat, light Cook/heat, other Cook/light, other Heat/cook, light Heat/light, other Light/cook, other Light/heat, other
48.6 97.4
2.2 0.4
78.4 0.3 7.9 0.3 0.3 3.0 0.3 0.3 1 .I
31 .4 22.1
0.5 5.2
14.8 7.7 0.3 4.6
366 Number of electricity users (%) 1 7 680 .oo
29 290.48 1 3 864.00 1 16 476.00
11 4 540.36 1 720.00 1 4 200.00 4 3 156.00
115 762.26 81 I 2 482.55
2 15 540 .oo 19 3 893.05 54 lo 398.00 28 5 185.71
1 1 920.00 17 7 066.59
2
Type
3
Base year activity measure
4
na
5
Description of activity measure
Total population (N) of Nairobi househo\dse
Number of wood users (%) Number of wood users who primary end-use cook (%I9
Number of charcoal users (%I
Number of paraffin users (%I
Number of gas users (%)
6
Mean consumption FUelb
Annual
Meen basic energy
EnergyC demandd
Weekly Annual Annual
4 197.50 80.72
6 691.67 128.69 1 825.00 35.10
65.06 6.51
103.72 10.37 28.29
593.90 11.42 19.27 3.85 288.67 5.55 9.37 1.87
12.00 0.23 0.39 131 .Ol 2.52 4.25 0.85
56.45 1.09 1.83 203.27 3.91 6.60 277.83 5.34 9.02
36.00 0.69 1.17 0.23
134.08 2.58 5.31 2.12 46 29 0.89 1.68 0.18 11.80 0.23 0.47 0.19
7.99 0.15 0.32 0.03 11.82 0.23 0.47 92.64 1.78 3.67 0.64
186.03 3.58 a.41 5.89 165.60 3.18 7.49 5.24 156.00 3.00 7.05 4.94
147.69 27.65 a.57 5.59 1.05 0.32
74.31 13.91 4.17 316.85 59.32 17.80
87.31 16.35 4.91 13.85 2.59 0.78 80.77 15.12 4.54 60.69 11.36 3.41 14.66 2.74 0.82
240.05 44.94 13.48 298.85 55.94 16.78
74.87 14.01 4.21 199.96 37.43 11.23
99.73 18.67 5.60 36.92 6.91 2.07
135.90 25.44 7.63
7
’ ‘n’ is sample population of Nairobi households. b Mean annual and weekly fuel consumption are reported in the following physical units, by fuel:
Wood kilograms (kg) Charcoal kilograms (kg) Paraffin litres (I) Liquid gas kilograms (kg) Electricity kilowatt hours (kWh)
’ Mean annual energy consumption is measured in gigajoules (GJ), a multiple of a joule IlO9 ). 3600 joules = 1 watt hour. The following are the coefficients used for converting physical units of fuel to gigajoules.
Wood 1 kg =0.0155 GJ Charcoal 1 kg = 0.03245 G J Paraffin 1 litre = 0.03961 GJ Gas 1 kg =0.0452 GJ Electricity 1 kWh =O.O036GJ
ENERGY ECONOMICS October 1985 269
Nairobi households and their energy use: E. L. Hughes-Cromwick
Source: L. Schipper ef a/, ‘Energy conservation in Kenya’, Beijer Institute, Stockholm, 1981.
cl Basic energy demand is the mean final demand given the technological efficiency of a fuel/technology/end-use combination:
FDij = eij ECij
where
FDij = mean basis energy demand of the ith end use and thejth fuel/technology combination (measured in GJ)
l?ij = technological efficiency of the ith end use and the jth fuel/technology combination. ECii = mean energy consumption of the ith fuel and the jth fuel (measured in GJ).
e The mean basic energy demand was not calculated in cases of multiple end uses where the efficiency coefficients could not be deter- mined. The list of technological efficiencies used in calculating basic energy demand is as follows:
Fuel/technology/end uses eij
Wood/hearth/cook, water heat Charcoal/jikojcook, water heat Paraffin/stove/cook, water heat Paraffin/hurricane lamp/light Gas/stove/cook, water heat Electricity/bulb/light Electricity/stove/cook Electricity/heater/water heat Electricity/refrigerator, washer, radio, television, space conditioner, fans, other
0.1 0.2 0.4 0.1 0.7 0.3 0.31 0.31 0.31
Source: G. McGranahan er a/, ‘Patterns of urban household energy use in developing countries: the case of Nairobi’, in UNEP, Energy andEnvironmentin EastAfrica, Nairobi, March 1980, pp 178-231.
See footnote 3.
f End uses consist of four types: primary (P), secondary (S), primary/secondary (P/S), and primary/secondary uses (P/C&). These abbreviations are used throughout these tables and the readershould be careful to note the type of end use associated with a particular consumption figure.
’ This description applies equivalently to all of the enduse activity measures. It should be stressed here that these are percentages of subpopulations (fuel users) and not percentages of subsactor (income groups) or sector (Nairobi household subpopulations).
wood, 90.0% use it for primary end use heat at a weekly average of 129 kg. This compares with only 23% of charcoal users who primary end-use heat at a weekly average of 6 kg. A significant number of charcoal users (46.7%) use charcoal for secondary end use heat with an average weekly consumption of 2.5 kg.
While the highest percentage of sampled households (97.0%) use charcoal for primary end-use cooking at an average of 11.5 kg per week, note that gas and paraffm are also important fuels for primary end-use cooking. Electricity consumption, on the other hand, is most used for the primary/secondary end use lighting/other for a weekly average of 15 kWh per week. Note the significant increase over this average electricity consumption for the primary/secondary end uses cooking/heating and lighting (0.240 kWh per week). And lastly, when heating is the primary end use with cooking and lighting as the second- ary uses, the average electricity consumption is less than when cooking is the primary end use (200 kWh per week).
Energy consumption. A comparison of average consumption levels across fuels requires conversion to units of energy.12 Some interesting features of the data are highlighted when energy consumption comparisons are made. While it was not immediately clear when examining average fuel consumption data, it now appears that primary end-use cooking is largely met by charcoal
“This study uses joules as the unit of energy to which each fuel “The definition and equation for basic energy demand is is converted. borrowed from McGranahan [61.
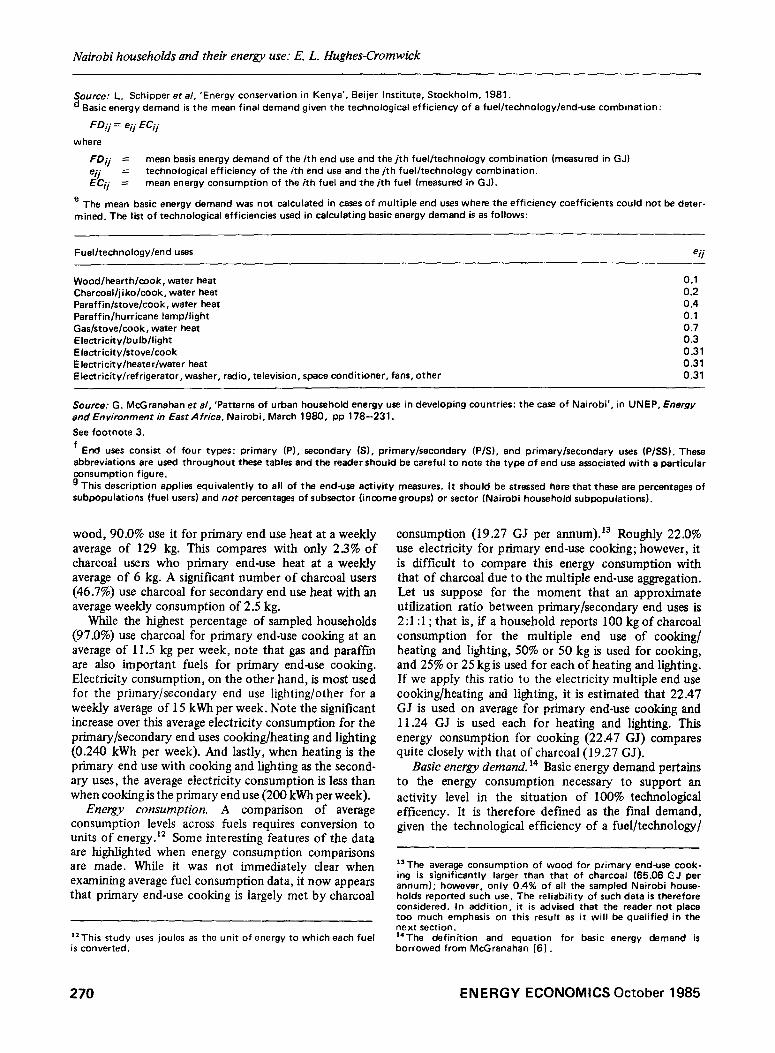
consumption (19.27 GJ per annum).‘3 Roughly 22.0% use electricity for primary end-use cooking; however, it is difficult to compare this energy consumption with that of charcoal due to the multiple end-use aggregation. Let us suppose for the moment that an approximate utilization ratio between primary/secondary end uses is 2 :l : 1 ; that is, if a household reports 100 kg of charcoal consumption for the multiple end use of cooking/ heating and lighting, 50% or 50 kg is used for cooking, and 25% or 25 kg is used for each of heating and lighting. If we apply this ratio to the electricity multiple end use cooking/heating and lighting, it is estimated that 22.47 GJ is used on average for primary end-use cooking and 11.24 GJ is used each for heating and lighting. This energy consumption for cooking (22.47 GJ) compares quite closely with that of charcoal (19.27 GJ).
Basic energy demand. I4 Basic energy demand pertains to the energy consumption necessary to support an activity level in the situation of 100% technological effcency. It is therefore defined as the final demand, given the technological efficiency of a fuel/technology/
“The average consumption of wood for primary enduse cook- ing is significantly larger than that of charcoal (65.06 GJ per annum); however. only 0.4% of all the sampled Nairobi house- holds reported such use. The reliability of such data is therefore considered. In addition, it is advised that the reader not place too much emphasis on this result as it will be qualified in the next section.
270 ENERGY ECONOMICS October 1985
Nairobi households and their energy use: E. L. Hughes-Cromwick
Table 4. Nairobi household energy use by income group, 1981.
1
Level of eggregetion
Subsector 04
Fuel 01 End use (PI’ 01 Cook
End use (S) 02 Heat End use (S) 03 Other End use (P/S) 04 Heat/cook
Fuel 02 End use (P) 01 End use (PI 02 End use (P/S) 03 End use (P/S) 04 End use (P/S) 05 End use (S) 06
Fuel 03 End use (P) 01
Paraffin Cook Light Cook/heat Cook/tight Cook/other Cook
Electricity Light
Subsector 02 Income group 2 16.0 75
Fuel 01 End use (P) 01 End use (S) 02 End use (S) 03 End use (S) 04
Fuel 02 End use (P) 01 End use (P) 02 End use (P/S) 03 End use (S) 04 End use (S) 05 End use Ki) 06
Fuel 03 Ehd-use (P) 01 End use (P/S) 02 End use (PBS) 03
Fuel 04 End use (P) 01 End use (P/ES) 02 End use (S) 03
Subeector 03
Fuel 01 End use (P) 01 End use (P/S) 02
Wood Cook Cook/heat
2.2 50.0 50.0
Fuel 02 Charcoal 90 .o End use (PI 01 Cook 50.6 End use (P/S) 02 Cook/heat 45.7 End use (P/S) 03 Cook/other 1.2 End use (P/S) 04 Light/other 1.2 End use (PBS) 05 Cook/heat, other 1.2
Fuel 03 Paraffin 56.7
2
TVW
Nairobi household 200474 467
Income group 1 16.0 74
Charcoal 85.3 64 Cook 100.0 64 Heat 64.1 41 Light 1.6 1 Other 14.1 9
Paraffin 72.0 64 Cook 88.9 48 Light 9.3 5 Light/cook 1.9 1 Heat 22.2 12 Light 37.0 20 Other 5.6 3
Liquid gas 32.0 24 Cook 79.2 19 Cook/heat 16.7 4 Cook/heat, other 4.2 1
Electricity 65.3 49 Light 93.9 46 Cook/light, other 6.1 3 Other 73.5 36
Income group 3 19.0 90
3 4
Base year activity meesure na
89.2 66 939 62
50.0 33 7.6 5 6.1 4
100.0 74 1 .4 1
59.5 44 4.1 3
33.8 25 1.4 1
31.1 23
2.7 2 100.0 2
2 1 1
ai 41 37
1 1 1
51
5
Description of activity meerure
6
Mean consumption Fuelb
Annual Weekly Annual
Total population (N) of Nairobi householdse
Sample population of Nairobi households in lowest income
group (%I
Number of charcoal users (%I Number of charcoal users who primary enduse cook f%)
Number of paraffin users (%I
Number of electricity users (%I
Sample population of Nairobi households in upper low income
group (%I
Number of charcoal users f%)
Number of paraffin users f%)
Number of gas users f%)
Number of electricity users (%I
595.67 11.46 19.33
91.56 1.76 2.97 145.44 2.80 4.72 567 .OO 10.90 la.40
3.87
120.00 2.31 4.75
47.39 0.91 I .a8 116.00 2.23 4.59 115.20 2.22 4.56
96.00 i .a5 3.80 45.51 0.88 I .a0
1.90 0.19
66.00 1.27 0.24 0.07
722.64 13.90 23.45 152.17 2.93 4.94
50.40 0.97 1.64
206.42 3.97 6.70
4.69 0.99
147.76 2.84 5.85 45.60 0.88 I.81
120.00 2.31 4.75 19.48 0.37 0.77 18.08 0.35 0.72
13.52 0.26 0.54
2.34 0.18
0.07
181.90 3.50 a.22 168 .oo 3.23 7.59 156.00 3.09 7.05
5.75
243.54 4.68 0.88 1 776.00 34.15 6.39
74.81 1.44 0.27
0.26
0.08
Sample population of Nairobi households in low middle income
group (%)
Number of wood users (%) 1 095.00 i 825.00
Number of charcoal users (%I
745.76 728.1 i 420 .OO
36.00 720.00
Number of paraffin users (%)
21.06 16.97 35.10 28.29
14.34 24.20 14.00 23.63
8.08 13.63 0.69 1.17
13.85 23.36
Energ$
7
Mean basic
energy demand d
1.70
4.84
ENERGY ECONOMICS October 1985
Nairobi households and their energy use: E. L. Hughes-Cromwick
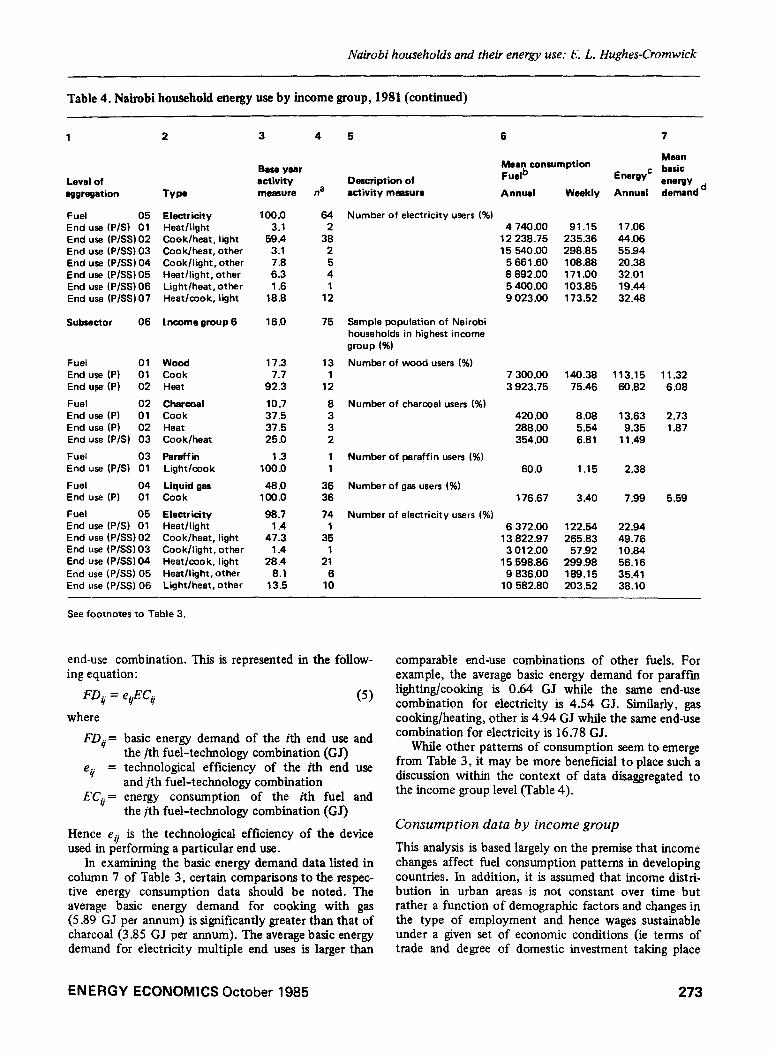
Table 4. Nairobi household energy use by income group, 1981 (continued)
1 2 3 4
Base year activity measure
5
Description of activity measure
6
Mean consumption Fuelb
Annual
141.95 36.00 50.64 25.32
Level of aggregation
End use (P) 01 End use (P) 02 End use (S) 03 End use (S) 04
Fuel 04 End use (P) 01
Fuel 05 End use (PI 01 End use (P/S) 02
End use (P/S) 03 End use (P/S) 04 End use (P/S) 05 End use (PBS) 06 End use (PBS) 07 End use (PBS) 08 End use (P/SSI 09 End use (PBS) 10
Subeector 04 Income group 4 19.0 89
Fuel 01 End use (PI 01
Fuel 02 End use (PI 01 End use (S) 02 End use (S) 03
Fuel 03 End use (PI 01
Fuel 04 End use (P) 01 End use (P/S) 02
wood Heat
Charcoal Cook Heat Other
Paraffin Cook
Liquid gas Cook Cook/heat
Fuel 05 Electricity End use (PI 01 Cook End use (P/S) 02 Heat/cook End use (P/S) 03 Heat/light End use (P/S) 04 Light/cook End use (P/S) 05 Light/heat
End use (P/S) 06 Light/other End use (PBS) 07 Cook/light, other End use (PISS) 08 Cook/heat, light End use (PBS) 09 Heat/cook, light
End use (PBS) 10 Heat/light, other
End use (P/SS) 11 Light/heat, other
Subsector 05
Fuel 01 End use (PI 01
Fuel 02 End use (PI 01 End use (P) 02 End use (P/S) 03
Fuel 03 End use (P) 01
Fuel 04 End use (P) 01
TYW
Cook Light Light Other
Liquid gas Cook
Electricity Light Light/heat
Light/other Cook/light Heat/other Light/cook, other Light/heat, other Cook/heat, light Cook, light, other Heat/light, other
Income group 5
Wood Heat
Charcoal Cook Other Cook/heat
Paraffin Cook
Liquid gas Cook
na
96.1 49 3.9 2 2.0 1 2.0 1
82.2 56 100.0 56
97.8 88 19.3 17
1 .l 1
59.1 52 1.1 1 1.1 1 1.1 1 3.4 3 2.3 2
8.0 7 3.4 3
1 .l 1 100.0 1
70.8 63 100.0 63
41.3 26 1.6 1
14.6 13 100.0 13
74.2 66 98.5 65
1.5 1
100.0 89 1.1 1 1 .l 1 9.0 8 1 .l 1 3.4 3
30.3 27 3.4 3 6.7 6
23.6 21 16.9 15
3.4 3
14.0
21 .9 100.0
31.3 90.0
5.0 5.0
4.7 100.0
70.3 100.0
64
14 14
20 18
1 1
3 3
45 45
Number of gas users (%I 183.00
Number of electricity users (%) 344.47
264.00 905.08
3 864.00 720.00
1 920.00 1 504.00 4 998.00 4 018.29 3 284.00
Sample population of Nairobi households in upper middle income group I%)
Number of wood users 1%) 11 315.00
Number of charcoal users (%) 471.40 105.32 239.40
217.60 175.38 17.54
9.07 15.30 2.03 3.42 4.60 7.77
Number of paraffin users (%I 96 .OO 1.85 3.80 1.52
Number of gas users (%) 186.65 3.59 8.44 156.00 3.00 7.05
Number of electricity users (%) 7 680.00
16 476.00 4 261.50 4 200 .oo 4 120.00 1 079.11 3 064.00 6 622.00 5 982.86 2 717.60 1 464.00
147.69 27.65 316.85 59.31
81.95 15.34 80.77 15.12 79.23 14.83 20.75 3.88 58.92 11.03
127.35 23.84 115.06 21.54
52.26 9.78 28.15 5.27
Sample population of Nairobi households in lower high income group (%)
Number of wood users 1%) 8 733.93 167.98 135.81 13.58
Number of charcoal users (“/.I 367.67
12.00 840 .OO
Number of paraffin users (%) 108.00
Number of gas users (%I 198.13
Weekly
2.73 0.69 0.97 0.49
5.62 1.43 2.01 1 .oo
energy demend ’
2.25 0.14 0.20
3.52 8.27 5.79
6.62 1.24 5.08 0.95
17.41 3.26 74.3 1 13.91 13.85 2.59 38.92 6.91 28.92 5.41 96.12 17.99 77.27 14.47 63.15 11.82
0.37
3.06 0.68
5.91
8.57
7.24 11.93 0.23 0.39
16.15 27.26
2.39
2.08 4.28 1.71
3.81 8.96 6.27
7
Meen
Energy c basic
272 ENERGY ECONOMICS October 1985
Nairobi households and their energy use: E. L. Hughes-Cromwick
Table 4. Nairobi household energy use by income group, 1981 (continued)
1 2 3 4 5 6
Level of aggregation
Base year activity measure na
Fuel 05 Electricity 100.0 64
End use (P/S) 01 Heat/light 3.1 2
End use (PBS) 02 Cook/heat, light 59.4 38
End use (PBS) 03 Cook/heat, other 3.1 2 End use (PBS) 04 Cook/light, other 7.6 5 End use (P/SS) 05 Heat/light, other 6.3 4
End use (P/-W 06 Light/heat, other 1.6 1
End use (P/W 07 Heat/cook, light 18.8 12
Subsactor 06 Lncome group 6 16.0 75
Fuel 01 End use (P) 01 End use (P) 02
Fuel 02 End use (PI 01 End use (P) 02 End use (P/S) 03
Fuel 03 End use (P/S) 01
Fuel 04 End use (PI 01
Fuel 05 End use (P/S) 01 End use (PASS) 02 End use (P/SS) 03 End use (PBS) 04
End use (P/W 05 End use (P/W 06
Wood Cook Heat
17.3 7.7
92.3
13 1
12
Charcoal 10.7 8 Cook 37.5 3 Heat 37.5 3 Cook/heat 25.0 2
Paraffin Light/cook
1.3 100.0
1 1
Liquid gas 48.0 36 Cook 100.0 36
Electricity 98.7 74 Heat/light 1.4 1 Cook/heat, light 47.3 35 Cook/light, other 1.4 1 Heat/cook, light 28.4 21 Heat/light, other 8.1 6 Light/heat, other 13.5 10
Description of activity measure
Number of electricitv users f%)
Mean consumption Fuelb
7
Mean
Energy c basic
Annual Weekly Annual
4 740.00 91.15 17.06 12 238.75 235.36 44.06 15 540.00 296.85 55.94
5 661.60 108.88 2038 8 892 .OO 171 .oo 32.01 5 400 .oo 103.85 19.44 9 023.00 173.52 32.48
Sample population of Nairobi households in highest income
group (%I
Number of wood users (%) 7 300.00 140.38 113.15 11.32 3 923.75 75.46 60.82 6.08
Number of charcoal users (%I
420 .OO 8.08 13.63 288 .OO 5.54 9.35 354.00 6.81 11.49
Number of paraffin users (%)
Number of gas users (%I
Number of electricity users (%)
60.0 1.15 2.38
176.67 3.40 7.99 5.59
6 372.00 122.64 22.94 13.822.97 265.83 49.76 3 012.00 57.92 10.84
15 598.86 299.98 56.16 9 836 .oo 189.15 35.41
IO 582.80 203.52 38.10
enwn demand d
2.73 1 .a7
See footnotes to Table 3.
end-use combination. This is represented in the follow- ing equation:
FD, =
where
FD,=
e& =
EC4. =
basic energy demand of the ith end use and the jth fuel-technology combination (GJ) technological efficiency of the ith end use and jth fuel-technology combination energy consumption of the ith fuel and the jth fuel-technology combination (GJ)
Hence eti is the technological efficiency of the device used in performing a particular end use.
In examining the basic energy demand data listed in column 7 of Table 3, certain comparisons to the respec- tive energy consumption data should be noted. The average basic energy demand for cooking with gas (5.89 GJ per annum) is significantly greater than that of charcoal (3.85 GJ per annum). The average basic energy demand for electricity multiple end uses is larger than
comparable end-use combinations of other fuels. For example, the average basic energy demand for paraffm lighting/cooking is 0.64 GJ while the same end-use combination for electricity is 4.54 GJ. Similarly, gas cooking/heating, other is 4.94 GJ while the same end-use combination for electricity is 16.78 GJ.
While other patterns of consumption seem to emerge from Table 3, it may be more beneficial to place such a discussion within the context of data disaggregated to the income group level (Table 4).
Consumption data by income group
This analysis is based largely on the premise that income changes affect fuel consumption patterns in developing countries. In addition, it is assumed that income distri- bution in urban areas is not constant over time but rather a function of demographic factors and changes in the type of employment and hence wages sustainable under a given set of economic conditions (ie terms of trade and degree of domestic investment taking place
ENERGY ECONOMICS October 1985 273
Nairobi households and their energy use: E. L. Hughes-Cromwick
as well as many other factors). Due to these very broad reasons, an analysis of the consumption data by income group proves to be very useful within a planning or policy context.
Utilization. The first major point brought out in Table 4 is that wood utilization is anomalous. While one would expect wood to be used primarily by the low- income households, the sample households reported wood use among the two highest income groups. Any conclusions drawn from these data would be highly misleading. Since the income groups are based upon location, it seems plausible that this pattern of wood use is due to the spatial distribution of the wood source, whether this source is a market or a woodlot. Wood utilization and consumption data are therefore excluded from further scrutiny.
Charcoal utilization is relatively high among the three lowest income groups. We may note from column 3 of Table 4 that 90% of income group 3 utilize charcoal while 3 13% of income group 5 utilize charcoal. Paraffin utilization is very similar to that of charcoal. The highest utilization level is of the lowest income group, tapering off to negligible paraffin utilization in the higher income groups (2 2% for income groups 5 and 6 combined).
In contrast, liquid gas and electricity utilization increases as the household income level increases. One should note that gas utilization peaks at income group 4 (74.2%) and decreases somewhat thereafter (48.0% for income group 6). It is quite clear that electricity usage depends on the income level, noting a sharp rise in utilization from income group 3.
Utilization levels for primary and secondary fuel end uses reveal somewhat distinct patterns across income groups as well. Examining these end-use level activity measures in column 3, note that charcoal is the primmy cooking fuel for income groups l-3 (93.9, 100.0 and 98.8%, respectively). l5 Paraffin is also a significant source of cooking fuel as approximately 40% of house- holds in income group 1 use paraffin for primary end-use cooking. Paraffin cooking peaks at income group 2; 64.0% of income group 2 households primary end-use cook with paraffin while only 4.7% cook with paraffin in income group 5. Therefore, in terms of utilization, paraffin and charcoal are the primary cooking fuels for the lower income groups.
In addition, paraffin lighting and space heating are prevalent among the lower income groups. There is a distinct conversion to electric lighting between income groups 2 and 3 as 82.2% of the latter group uses electri- city for primary end-use lighting.
The higher income groups use liquid gas and electricity for all end uses. Gas cooking utilization increases from 32.0% for income group 2 to 74.2% in income group 4.
“Due to the inability to disagg g re ate charcoal consumption for income group 3, combination end uses are reported in Table 4 for these charcoal users. When obtaining the percentage of char- coal users that primary end-use cook for this income group, it is necessary to sum over all households that reported such use, whether they are ‘pure’ end-users or not. It may be seen in this case that 80 households or 98.8% primary end-use cook with charcoal.
274
In the two highest groups, it appears that gas and elec- tricity both serve as major cooking fuel sources.
Fuel consumption. Some very significant consump- tion patterns emerge from the mean fuel consumption data across income groups. Charcoal cooking consump- tion, on average, increases up to and including income group 3. A decrease in consumption from 14 kg to 9 kg a week for charcoal cooking is seen from income group 3 to 4, due to substitution towards gas and elec- tricity cooking.
Paraffin cooking, in contrast, does not exhibit the same consumption pattern across income groups as charcoal. An approximate average of 3 1 of paraffin per week is used for cooking in income group 2, and this level declines in subsequent higher income levels. Paraffin lighting is almost non-existent in the higher income groups, but accounts for an average of a litre per week in income group 1. Some households in these lower groups do in fact utilize both charcoal and paraffin for cooking.
Gas consumption is first evident in the second lowest income group. Both utilization and mean consumption levels increase as income increases. Roughly half as many households use gas for cooking as do those who use paraffin in income group 2. It is curious, however, that the average gas cooking consumption is approximately constant as income rises. The reason for this may be the ‘intermediate’ nature of this fuel. Lower income groups consume charcoal and paraffin for cooking purposes. When income rises and the expenditure share of fuel and appliances becomes less binding, households begin substituting toward gas cooking and ultimately toward electricity cooking. In each of these extremes, gas either serves as a luxury’ primary cooking fuel (largely supple- mented by cheaper charcoal or paraffin fuel sources) or as a residual cooking fuel (a supplement to electricity cooking).
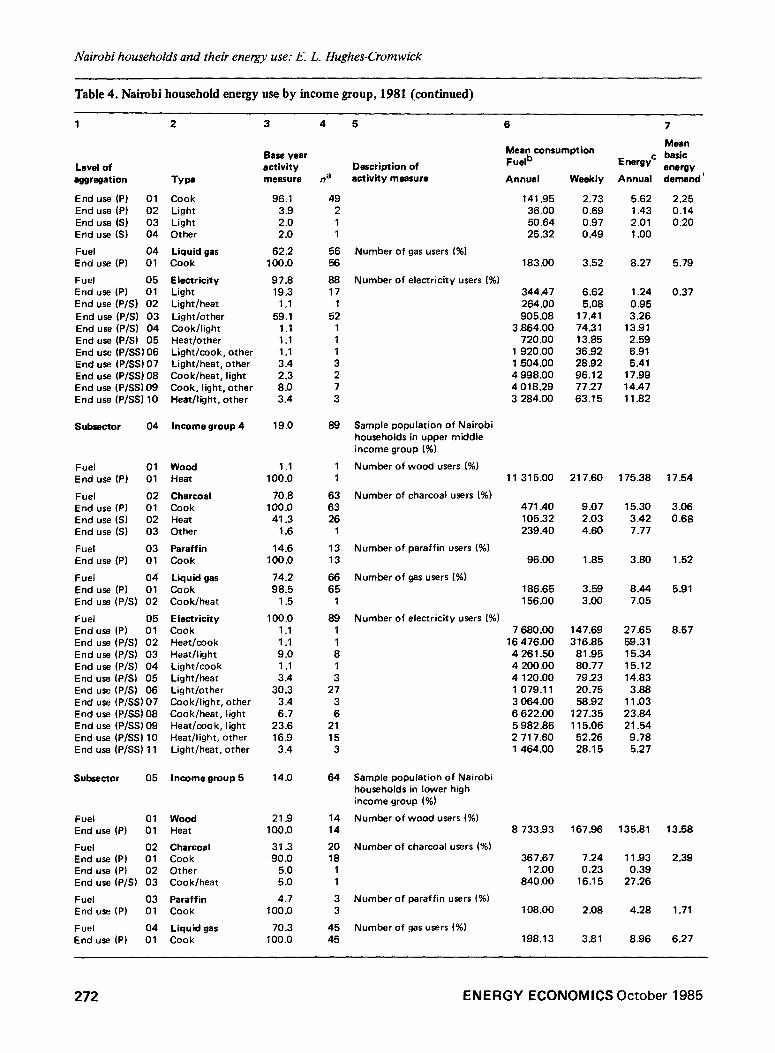
Energy consumption. Several factors emerge when examining the energy consumption levels for various end uses across the type of fuel, both within and between income groups. i6 First, the mean energy consumption associated with charcoal cooking is larger than that of paraffin, gas or electricity within income groups where multiple fuels were utilized for cooking purposes. While many explanations seem plausible, this may in part be due to the amount of energy lost per unit of cooking ‘production’. Note the differential between charcoal and paraffin energy consumption in income group 3 (for primary end-use cooking) of 24.2 GJ and 5.6 GJ, respectively.
Second, we may note higher levels of mean energy consumption not only as income increases but as house- holds use a fuel for multiple activities. For example, in income group 5, average gas cooking consumption is approximately 9 GJ. The electricity end use cook/heat, light consumption is 44 GJ. If we assume that 50% of this aggregate is used for cooking, then an approximate average electricity cooking consumption is 22 GJ or
I6 These data are located in Table 4 under ‘Annual energy’.
ENERGY ECONOMICS October 1985
Nairobi households and their energy use: E. L. Hughes-Cromwick
roughly 127 kWh per week. Hence the gas energy level in this case is about 41% that of electricity.
The energy consumption associated with charcoal cooking is high relative to its utilization up to and including income group 4. While gas and charcoal are utilized by approximately the same percentage of this group’s sample households, the average energy consump- tion for charcoal cooking is almost twice that of gas. By income group 5, we may note a shift toward gas for cooking as 60% more households use gas than charcoal.
Basic energy demand. Due to some intractability associated with the methodology used to disaggregate fuel consumption by end use, much of the consumption data reported in Table 4 for the higher income groups is in the form of multiple end uses. Therefore, it is not feasible to calculate the basic energy demand for multiple end-use energy consumption due to the different effici- encies of each end use/technology combination. A few observations may be made for those singular end uses.
With the introduction of gas as a cooking and heating fuel in income group 2, note that the average basic energy demand is greater for gas cooking than for charcoal cooking. The basic energy demand for gas cooking increases relative to that of charcoal cooking from income groups 4-6. The basic energy demand for paraffin cooking, on the other hand, is approximately one-half that of charcoal cooking. This ratio is roughly constant over all income groups.
Regression analysis
As briefly outlined above, a multiplicative demand function is specified to generate the following simple and multiple regression equations :
In Yi = PO + /3r In Xrj + ej (6)
In Yi = /3e + fir In Xii + fl* In Xzj + Ei (7)
where
Yj = annual energy consumption of the ith fuel
(GJ) explanatory variable of the ith fuel constant term regression coefficients of Xi error term
The methodology proposed above implicitly suggests that a given pattern of energy consumption may be explained by energy price, income and other variables such as distance to the fuel market, family size, and appliance ownership. ” In some cases, these explanatory variables displayed multicollinearity. In this instance one
“A ‘charcoal energy price’, for example, is defined as follows:
Pee = PC - ccc? whert?
Pee = price of energy derived from charocal fuel in 1981 nominal KSH per CJ
PC = price of charcoal in 1981 nominal KSH per kg C ce = conversion factor of charcoal (kg) to energy (GJ)
ENERGY ECONOMICS October 1985
of the collinear variables was excluded from the regression equation. The existence and magnitude of association between any two variables was detected through an examination of correlation coefficients, &i-square test and Cramer’s V. In particular, there existed a high degree of association between charcoal energy price and household income; due to this, these variables were not included in the same multiple regression. The number of electricity appliances and household income also exhibited a strong correlation and a similar procedure was followed.
The issue of estimating price elasticities is an inter- esting one within the context of energy demand fore- casts. If Xi in Equations (6) or (7) equals the nomi- nal energy price, the 4 would equal the price elas- ticity of demand for energy of the ith fuel. This inter- pretation of pi is extremely discouraged due to the nature of the database. A cross-sectional database does not yield price information which varies significantly between households and therefore would be incapable of explaining variance in the dependent variable. Time series data, where different fuel prices are observed, ceteris paribus, would yield more reliable estimates of these price elasticities.
In addition to the need for fuel price observations at different points in time, a discrepancy between two empirical sources of price data for this study has caused concern. As explained in the survey report fuel price data were collected using two methods. First, house- hold respondents to the survey quoted a buying price for the fuels they use. Second, the Ministry of Energy collected data from many of the areas in Nairobi on prices of charcoal, paraffin and gas. In comparing the two price sets for these fuels using correlation co- efficients and T values, it is found that the paraffin price vectors, for example, are highly uncorrelated. The correlation coefficient, in this case, is -0.009 and the T value is significant. The charcoal prices also exhibited a relatively low correlation coefficient as well (0.237). These results serve to limit the applicability of these price data without making some a priori assumption about which price set is, in some sense, more ‘valid’ than the other.
For these reasons, the research objective in the regression analysis, when using price as a determinant of consumption, is to capture the direction (positive or negative) of price effects on the dependent variable rather than exacting the magnitude of such effects. Any other implications from the results given belowmay be considered a misuse of the analytical tools at one’s disposal.
In contrast, however, the estimates of income elas- ticities, given a significant F value, do serve in a more accurate way to approximate the percentage change in energy consumption given a 1% change in household income. This is obviously due to the cross-sectional data- base of which the major feature is significant variation in household income.
A host of regressions were specified and executed. The critical a priori issue is the exact form of the depen- dent variable: should the analysis of consumption
275
Nairobi households and their energy use: E. L. Hughes-Cromwick
patterns for planning purposes examine the fuel quantity in physical terms, the energy content of fuel consumed by households, or the basic energy demand of the household given an end-use /technology combination? Is the household unit, in addition, appropriate if one’s interest is total energy demand over time (ie does family size matter)?
and the household income, run in the following forms:
multiple regressions were
In r=p, t
t
In Y=lie +
+
where
Y =
P, =
HSHSZE = HSHZNC =
PI In p, + 02 In (HSHSIZE)
The three suggested dependent variables are, of course, interrelated and the reader may wonder why the form of the dependent variable is critical to the kind of conclusions which may be drawn from these results. While it may be true that a scalar may functionally relate the values of these three dependent variables for a given fuel, comparisons across fuels and the determinants of these dependent variables are not homogeneous. While a scalar converts a charcoal quantity to energy content, the relationship between the latter value and an explanatory variable such as income does not vary by the same scalar.
& In (HSHINC) + E
AbI ln P, + p2 In (HSHSZE)
& ln(EAPP) + c
(9)
(IO)
electricity energy demand (1981 GJ per annum) electricity energy price (1981 KSH per
GJ) number of household members household income (1981 nominal KSH per annum)
EAPP = number of electric appliances
To determine as best possible why households use a given fuel,it seems that basic energy demand most closely exacts what a household is deriving from a fuel use; that is, how much ‘basic energy’ is required to yield a unit of household activity. But as noted in the previous section, the limitations of the survey prevented the calculation of complete disaggregation by end use. Furthermore, the application of some weighted average efficiency for a multiple end use would be erroneous.
The ‘second best’ dependent variable is energy content of a given fuel because a given physical quantity of fuel is consumed for one of many characteristics it provides, namely energy.
The results from a sample of 360 households for these multiple regression equations are given below.
ln Y = -17.03 -0.338 In P, + 0.187 ln(HSHSIZE) (0.105) (0.085)
+ 1.599 In (HSHZNC) (11) (0.059)
F = 25737
(3,356)
R2 = 68.4%
In light of these issues, the regression analysis proceeds using household energy consumption; in the case of paraffin, for example, this dependent variable is valued as GJ per annum (1981).
In Y = -4.94 - 0349 In P, + 0.065 In (HSHSIZ@ (0.096) (0.077)
+ 1.73 ln(EAPP) (12) (0.056)
The most successful result is a regression of electricity energy consumption on household income.‘* In this simple regression specification, the result for a sample of 360 households is as follows:
F = 336.71 (3,356)
R2 = 73.9%
In Y = -14.47 + 1.582 In (XI) (8) (0.059)
F = 731.71 (1,358)
RZ = 67.1%
The standard error of the estimator /Jr is in parentheses below the value of or. The F value is significant at the 1% level. Thus electricity energy demand is considered income elastic; in this case, a 1% increase in income wilI result in 1.58% increase in electricity energy demand. In addition, the R* is very high for a simple regression specification.
These multiple regression results are significant at the 1% level and serve to explain a high percentage of variation in the dependent variable, as evidenced by the high R2 values. In both regression cases, price movements exhibit a negative effect on electricity energy consumption, as expected. However, household size exhibits a relatively different effect on demand depending upon whether household income or number of electric appliances is one of the independent variables. A correlation coefficent of -0.21 between income and household size suggests some evidence of multi-collinearity. Given the apparent influence of household income on electricity energy demand, it seems very plausible that household size, as a determinant of this demand, is not a major factor, and is more accurately described by Equation (12).
Due to the existence of multicollinearity between the number of electric appliances a household OWNS
I* In all regressions which are specified in this study, the energy consumption (of the ith fuel) is measured in GJ per annum. Household income is measured in 1981 nominal KSH per annum.
In contrast, electric appliance ownership, with a coefficient of 1.73 in this last equation, appears to explain a significant portion of variation in electricity energy demand. Since appliance ownership is in essence a proxy variable for income, this result reinforces the significance of income in determining electricity energy demand.
276 ENERGY ECONOMICS October 1985
Nairobi households and their energy use: E. L. Hughes-Cromwick
The regression results which depict charcoal energy consumption suggest different effects of explanatory variables than in the case of electricity. As denoted above, charcoal energy appears to be an inferior good; that is, as income increases, the amount of charcoal energy demanded declines. A regression of charcoal energy consumption on household income from a sample of 285 households yielded the following:
In Y = 5.02 -0.231 ln(Xr) (13) (0.048)
F = 23.08
(1,283)
R2 = 7.5%
This result is significant at the 1% level. The negative income elasticity indicates that as income increases, households choose to derive their energy needs from other fuel sources, notably gas and electricity.
Charcoal energy consumption was also regressed on household income (X1), household size (X2) and number of charcoal applicances (Xs) to yield the follow- ing results from a sample of 285 households:
In Y = 4.86 - 0.279 ln(Xr ) + 0.359 ln(X,) (0.049) (0.088)
+ 0.409 ln(X,) (14) (0.235)
F = 15.55
(3,281)
R2 = 14.2%
This result is signiicant at the 1% level and yields a relatively high R2 value for a cross-sectional database. In contrast to the electricity results, household size seems to be a more important determinant of charcoal energy demand. Charcoal appliance ownership, with a coefficient of 0.409, also exhibits some explanatory power.
Both simple and multiple regression results of paraffin energy consumption on various explanatory variables were uninteresting. The number of household members (X,) and paraffin appliances (X2) serve as the most important determinants as the following results illustrate :
In Y = 0.75 + 0.250 in(Xr) + 0.132 ln(X,) (15) (0.088) (0.118)
F = 4.42
(2,193)
R2 = 4.4%
From a sample of 196 households, the coefficient of X1 means that a 1% increase in family size leads to a 0.25% increase in paraffin energy demand. This result is significant at the 5% level.
Lastly, regressions specifying gas energy consumption on explanatory variables are examined. The importance of certain of these independent variables varies from that of the regression results analysed above. From a sample of 227 households,gas energy consumption was regressed
ENERGY ECONOMICS October 1985
on gas energy price (X1), number of household members (X2) and household income (Xs).”
In Y = -2.62 - 3.090 ln(X,) + 0.083 ln(X,) (1.223) (0.033)
+ 0.035 ln(Xs) (16) (0.023)
F = 4.24
(3,223)
R2 = 5.4%
These results are significant at the 1% level. Even taking into consideration the high standard error of the regres-
sion coefficient of X1, unit gas energy price movements cause rather large movements of the dependent variable in the opposite direction.20 The coefficients for house- hold size and income are both very small in magnitude, and therefore no significant explanatory power may be attributed to these independent variables.
Conclusion
This study attempts to illucidate an explanation for energy consumption patterns in the Nairobi household sector using a 1981 cross-sectional database of 467 sampled households in addition to the use of regression analysis. Specifically, such independent variables as household nominal income, appliance ownership, prices, household size and geographical distance to fuel markets were postulated as major determinants of fuel-specific energy demand.
One useful output from the Nairobi household energy survey is a report of fuel and energy consumption dis- aggregated according to the type of household activity (Table 3) and additionally by household income group (Table 4). These data provide a clear picture of fuel utilization levels and a comparison of end-use energy levels among the fuels available in the Nairobi area. The tables also serve to illustrate the kind of fuel substitution taking place as income rises.
The focus of this paper is the specification of regres- sion equations to estimate the various effects of these explanatory variables on energy demand. From this analysis, it is apparent that the determinants of energy demand vary between the type of fuel from which a given quantity of energy is derived. Specifically, house- hold income explains a large portion of the variation in electricity energy consumption. It was also found that
“When other explanatory variables, such as number of gas appliances, were included in a multiple regression run, the F values deteriorated. so Despite the qualifications made earlier in this paper regarding the price data and use of price as an independent variable in regression analysis, the gas price data are distinct. The two sets of gas prices (household and Ministry of Energy observations), when compared, have a mean difference of 0.0175 KSH/kg and a correlation coefficient of 0.999 at an acceptable level of significance. Therefore, the conclusions drawn from these regression results are derived from a relatively solid set of price data and may be more reliable than the values of other regres- sion coefficients for price variables.
277
Nairobi households and their energy use: E. L. Hughes-Cromwick
electricity energy consumption is income elastic which is a very useful piece of forecasting information.
Charcoal energy consumption, on the other hand, is affected by the number of household members and charcoal appliance ownership. It appears from this analysis that charcoal is an inferior good; as income rises, energy is derived from fuels other than charcoal for household activities. It was also determined that char- coal energy consumption is negatively related to the charcoal energy price.
A solid explanation of paraffin energy consumption remains somewhat of a mystery. While it is clear that paraffin energy consumption is prevalent among the lower income groups and is therefore negatively related to household income, it is not apparent that one could accurately forecast changes in this energy demand based on income. Household size and the number of paraffin appliances are determining factors as well, but the magnitude of these variables is small.
Finally, gas energy consumption is primarily explained by its price movements. Household income is a very small determining factor in this consumption. From this analysis, one could term gas energy demand as income inelastic.
These findings are useful in an energy planning context because they illustrate the variable effects of explanatory variables on fuel-specific energy consump- tion in the urban household sector. It is evident that such results must be integrated with other social and
economic factors for effective policy making. Indeed, a cross-sectional study highlights very specific aspects of energy demand. In addition, these results are placed within the qualified context of rather straightforward regression models.
The analysis does provide a current picture of the Nairobi household sector’s energy use and directs interested parties to important considerations in subse- quent research and policy endeavours.
References
1 G. Becker, The Economic Approach to Human Behaviour, University of Chicago Press, Chicago, 1976.
2 Beijer Institute, Energy Development in Kenya: Problems and Opportunities, Sweden, 1981.
3 R. Hosier, et al. ‘Energy planning in developing
4 countries’, Ambio, Vol Xl, No 4, 1982. R. Hosier, Something to buy paraffin with: an investigation into domestic energy consumption in rural Kenya, PhD dissertation, Clark University, Worcester, MA, 1981.
5 T. Killick, ed, Papers on the Kenyan Economy, Heinemann Educational Books Ltd, Nairobi, 198 1.
6 G. McGranahan et al, ‘Patterns of urban household energy use in developing countries: the case of Nairobi’, in UNEP, Energy and Environment in East Africa, Nairobi, March 1980.
7 T. Schultz, Investing in People, University of California Press, Berkeley, 1981.
278 ENERGY ECONOMICS October 1985
Copyright © 2022 FDOKUMEN