NAIMA: target amplification strategy allowing quantitative on-chip detection of GMOs
11
Published online 18 August 2008 Nucleic Acids Research, 2008, Vol. 36, No. 18 e118 doi:10.1093/nar/gkn524 NAIMA: target amplification strategy allowing quantitative on-chip detection of GMOs Dany Morisset 1, *, David Dobnik 1 , Sandrine Hamels 2 , Jana Z ˇ el 1 and Kristina Gruden 1 1 Department of Biotechnology and Systems Biology, National Institute of Biology, Vecna pot 111, Ljubljana 1000, Slovenia and 2 Eppendorf Array Technologies SA, Rue du se ´ minaire 20, B-5000 Namur, Belgium Received June 3, 2008; Revised July 30, 2008; Accepted July 31, 2008 ABSTRACT We have developed a novel multiplex quantitative DNA-based target amplification method suitable for sensitive, specific and quantitative detection on microarray. This new method named NASBA Implemented Microarray Analysis (NAIMA) was applied to GMO detection in food and feed, but its application can be extended to all fields of biology requiring simultaneous detection of low copy number DNA targets. In a first step, the use of tailed primers allows the multiplex synthesis of template DNAs in a primer extension reaction. A second step of the procedure consists of transcrip- tion-based amplification using universal primers. The cRNA product is further on directly ligated to fluorescent dyes labelled 3DNA dendrimers allowing signal amplification and hybridized without fur- ther purification on an oligonucleotide probe-based microarray for multiplex detection. Two triplex systems have been applied to test maize samples containing several transgenic lines, and NAIMA has shown to be sensitive down to two target copies and to provide quantitative data on the transgenic con- tents in a range of 0.1–25%. Performances of NAIMA are comparable to singleplex quantitative real-time PCR. In addition, NAIMA amplification is faster since 20 min are sufficient to achieve full amplification. INTRODUCTION In 2007, after 12 years of commercialization of genetically modified (GM) crops, the total accumulated land areas sown with GM plants have exceeded 690 millions hect- ares (1). Consequently, regulations concerning biotech products have been adopted by many countries, and these require traceability of GM products on the market. Additionally, in some countries, compulsory labelling of products containing genetically modified organisms (GMOs) above a certain threshold has been introduced (2). Currently, methods based on PCR technology are implemented in GMO detection laboratories, which allow for specific identification and quantification of single GM organisms (3,4). Not only the increasing pres- ence of GMOs on the market but also their growing taxo- nomic (diverse taxon host plants) and biotechnological (diverse genetic constructs) diversity will render the cur- rent GMO testing strategies unmanageable both in terms of time and associated testing costs. Consequently, it is necessary to introduce new analytical technologies for high throughput GMO diagnostics. At the moment, the use of microarrays is the method of choice for multiplex- ing approaches in many fields of research and has already been applied to GMO diagnostics (5–12). However, for the purpose of GMO detection and quantification, direct hybridization of the samples onto microarrays is not pos- sible due to the high sensitivity of GMO target DNA copies needed. Therefore, an amplification step of the DNA targets is applied prior to hybridization on micro- arrays. PCR technology has thus far, generally, been used for this purpose (5–10,12). However, high-throughput analysis using microarray hybridization may suffer from lack of a true multiplexing solutions for PCR technology due to the number of competitive amplification reactions with different efficiencies (3,13,14). To proceed to the microarray-based analysis, one still needs to use a set-up of multiple PCR reactions; one for each of the PCR assays targeting only a few particular genetic elements (6,8,9,12). As a consequence to such a set-up, the cost and time associated with GMO analyses increase. Furthermore, the accuracy of end-point PCR technology has its limits due to the exponential nature of amplification. This expo- nential nature limits the quantitative aspects of micro- array-based GMO detection systems and therefore, most of these systems are being applied for qualitative analysis. Only one study has reported semiquantitative microarray- based detection (6). Within the European Integrated Project Co-Extra, several multiplexing amplification methods in combina- tion with microarray hybridization are under investiga- tion (http://www.coextra.eu/library/deliverables.html). We have investigated the potential of NASBA to be used for *To whom correspondence should be addressed. Tel: +386 1 42 333 88; Fax: +386 1 25 738 47; Email: [email protected] ß 2008 The Author(s) This is an Open Access article distributed under the terms of the Creative Commons Attribution Non-Commercial License (http://creativecommons.org/licenses/ by-nc/2.0/uk/) which permits unrestricted non-commercial use, distribution, and reproduction in any medium, provided the original work is properly cited. by guest on June 9, 2014 http://nar.oxfordjournals.org/ Downloaded from
Transcript of NAIMA: target amplification strategy allowing quantitative on-chip detection of GMOs

Published online 18 August 2008 Nucleic Acids Research, 2008, Vol. 36, No. 18 e118doi:10.1093/nar/gkn524
NAIMA: target amplification strategy allowingquantitative on-chip detection of GMOsDany Morisset1,*, David Dobnik1, Sandrine Hamels2, Jana Zel1 and Kristina Gruden1
1Department of Biotechnology and Systems Biology, National Institute of Biology, Vecna pot 111, Ljubljana 1000,Slovenia and 2Eppendorf Array Technologies SA, Rue du seminaire 20, B-5000 Namur, Belgium
Received June 3, 2008; Revised July 30, 2008; Accepted July 31, 2008
ABSTRACT
We have developed a novel multiplex quantitativeDNA-based target amplification method suitablefor sensitive, specific and quantitative detectionon microarray. This new method named NASBAImplemented Microarray Analysis (NAIMA) wasapplied to GMO detection in food and feed, butits application can be extended to all fields ofbiology requiring simultaneous detection of lowcopy number DNA targets. In a first step, the useof tailed primers allows the multiplex synthesisof template DNAs in a primer extension reaction.A second step of the procedure consists of transcrip-tion-based amplification using universal primers.The cRNA product is further on directly ligated tofluorescent dyes labelled 3DNA dendrimers allowingsignal amplification and hybridized without fur-ther purification on an oligonucleotide probe-basedmicroarray for multiplex detection. Two triplexsystems have been applied to test maize samplescontaining several transgenic lines, and NAIMA hasshown to be sensitive down to two target copies andto provide quantitative data on the transgenic con-tents in a range of 0.1–25%. Performances of NAIMAare comparable to singleplex quantitative real-timePCR. In addition, NAIMA amplification is faster since20 min are sufficient to achieve full amplification.
INTRODUCTION
In 2007, after 12 years of commercialization of geneticallymodified (GM) crops, the total accumulated land areassown with GM plants have exceeded 690 millions hect-ares (1). Consequently, regulations concerning biotechproducts have been adopted by many countries, andthese require traceability of GM products on the market.Additionally, in some countries, compulsory labellingof products containing genetically modified organisms(GMOs) above a certain threshold has been introduced (2).
Currently, methods based on PCR technology areimplemented in GMO detection laboratories, whichallow for specific identification and quantification ofsingle GM organisms (3,4). Not only the increasing pres-ence of GMOs on the market but also their growing taxo-nomic (diverse taxon host plants) and biotechnological(diverse genetic constructs) diversity will render the cur-rent GMO testing strategies unmanageable both in termsof time and associated testing costs. Consequently, it isnecessary to introduce new analytical technologies forhigh throughput GMO diagnostics. At the moment, theuse of microarrays is the method of choice for multiplex-ing approaches in many fields of research and has alreadybeen applied to GMO diagnostics (5–12). However, forthe purpose of GMO detection and quantification, directhybridization of the samples onto microarrays is not pos-sible due to the high sensitivity of GMO target DNAcopies needed. Therefore, an amplification step of theDNA targets is applied prior to hybridization on micro-arrays. PCR technology has thus far, generally, been usedfor this purpose (5–10,12). However, high-throughputanalysis using microarray hybridization may suffer fromlack of a true multiplexing solutions for PCR technologydue to the number of competitive amplification reactionswith different efficiencies (3,13,14). To proceed to themicroarray-based analysis, one still needs to use a set-upof multiple PCR reactions; one for each of the PCR assaystargeting only a few particular genetic elements (6,8,9,12).As a consequence to such a set-up, the cost and timeassociated with GMO analyses increase. Furthermore,the accuracy of end-point PCR technology has its limitsdue to the exponential nature of amplification. This expo-nential nature limits the quantitative aspects of micro-array-based GMO detection systems and therefore, mostof these systems are being applied for qualitative analysis.Only one study has reported semiquantitative microarray-based detection (6).Within the European Integrated Project Co-Extra,
several multiplexing amplification methods in combina-tion with microarray hybridization are under investiga-tion (http://www.coextra.eu/library/deliverables.html). Wehave investigated the potential of NASBA to be used for
*To whom correspondence should be addressed. Tel: +386 1 42 333 88; Fax: +386 1 25 738 47; Email: [email protected]
� 2008 The Author(s)This is an Open Access article distributed under the terms of the Creative Commons Attribution Non-Commercial License (http://creativecommons.org/licenses/by-nc/2.0/uk/) which permits unrestricted non-commercial use, distribution, and reproduction in any medium, provided the original work is properly cited.
by guest on June 9, 2014http://nar.oxfordjournals.org/
Dow
nloaded from
multiplex target amplification prior to microarray detec-tion in GMO diagnostics to alleviate the lack of multi-plexing and quantitative performance associated withend-point PCR technology (15). NASBA is a methodthat mimics retroviral replication and uses a combinationof three enzymes: the avian myeloblastosis virus’s reversetranscriptase/DNA polymerase, T7 RNA polymerase andRNase H, along with a T7 promoter-labelled target-specific primer (16). NASBA has been most widely usedfor clinical diagnosis of human bacterial and viral path-ogens, as well as for the detection and quantificationof microbes in food and environmental samples (15),using commercial NASBA kits for RNA amplification(bioMerieux SA is the patent holder for NASBA technol-ogy). Additionally, it has recently been shown that NASBAis appropriate for human DNA-target amplification (17).We have developed a novel multiplex quantitative
DNA-based target amplification method suitable foruse in combination with microarray detection. Thisnew method named NASBA Implemented MicroarrayAnalysis (NAIMA) was applied to the field of GMOdetection. This fast and simple integrated method allowssensitive, specific and fully quantitative on-chip GMOdetection in a multiplex format. The NAIMA methodcombined with microarray detection provides a suitableanalytical tool for high throughput GMO diagnosticsthat will be required in the near future.
MATERIALS AND METHODS
Test materials
Mon863 maize flour (9.9% w/w) certified reference mate-rial (CRM) was prepared and purchased from the EUJoint Research Centre, IRMM (Institute for ReferenceMaterials and Measurements, Geel, Belgium). Mon810(100% w/w) maize leaves were obtained from plantsgrown from seeds (Campero cultivar) kindly provided byCSIC, Barcelona, Spain.For the specificity assays, CRM RoundupReady�
Soya (5% w/w) and CRM EH592-527-1 Potato (100%w/w) were purchased from the EU Joint ResearchCentre, IRMM (Institute for Reference Materials andMeasurements, Geel, Belgium). Feed samples containingRoundupReady� Soya and wild-type maize, feed samplescontaining wild-type oilseed rape and wild-type maizeseeds previously assayed by qPCR for routine diagnosticsin our laboratory were also used in these specificity assess-ment experiments.For quantitative analyses, samples containing Mon863
and Mon810 transgenic lines were prepared by mixing theMon810 and Mon863 DNA reference material with DNAfrom feed samples identified as non-GM in our labora-tory, to obtain the appropriate transgenic contents.
DNA purification
Samples were purified using the DNeasy plant mini kit(Qiagen, Valencia, CA) as described by the manufacturerwith the incubation time of the sample in the lysis bufferextended to 10min.
Primer and microarray probes design
Primer design. Oligonucleotide primers used in theNAIMA procedure were designed based on publishedDNA sequences using the Beacon Designer software(Premier Biosoft International Inc., Palo Alto, CA) andtheir secondary structure was analysed using theDINAMelt Server (http://frontend.bioinfo.rpi.edu/appli-cations/hybrid/) (18). We have focused the design on theregion targeted by singleplex qPCR methods used in rou-tine GMO detection (19–22). Primers designed for theNAIMA procedure are listed in Table 1.
For the multiplex template synthesis reaction, one tailedprimer was constructed of a 30 region specific to the targetsequence and of a 50 region harbouring the sequencepromoter for the SP6 RNA polymerase. The secondtailed primer was constructed of a 30 region specific tothe target sequence, a 50 region harbouring the sequencepromoter for the T7 RNA polymerase and a centralregion harbouring an abiotic sequence. The T7 promotersequence was designed as recommended in literature (23)using an extra purine residue sequence. The abioticsequence does not show similarities with known bioticsequences. Tailed primers were designed for specific ampli-fication of the maize plant species (invertase, IVR), theCaMV 35S promoter (P35S), the nopaline synthetase ter-minator (tNOS) and the 50 maize plant DNA-Mon810insert junction (MON810).
Criteria for the selection of primers to be used in thefirst step of the procedure (multiplex template synthesis)were the following: (1) avoiding folding, homodimeriza-tion and heterodimerization with other primers in thereaction mix at 558C; (2) the melting temperature (Tm)of the target-specific regions must be compatible withthe annealing temperature at 558C; (3) possessing thelowest possible difference in Tm between each of theprimer pairs; (4) primers were selected so that they couldbe used for the analysis of degraded genomic DNA aspresent in highly processed products (each ampliconspans 100–200 bases).
In the second step of NAIMA (universal NASBA),a single pair of universal-primers is used to amplify alltemplates created during the first step of the procedure.The T7-universal primer is identical to the 50 sequence ofthe tailed primer, harbouring the T7 promoter sequence inthe first step of NAIMA: it is composed of the T7 RNApolymerase promoter sequence fused with the ‘cap’ abioticsequence. The SP6-universal primer sequence differs fromthis SP6 RNA polymerase sequence in such a way thatit lacks the first four nucleotides contained in the lattersequence.
Primers were synthesized and HPLC-purified by MWGBiotech AG (Eurofins MWG GmbH, Ebersberg,Germany).
Microarray probe design. The microarrays used in thedescribed experiments were based on the technology devel-oped by Eppendorf Array technologies, S.A. (EAT,Namur, Belgium) (24). The probes are covalently boundby their 50 ends to glass slides (25). The capture probes weresuitably designed for sensitive and specific hybridization
e118 Nucleic Acids Research, 2008, Vol. 36, No. 18 PAGE 2 OF 11
by guest on June 9, 2014http://nar.oxfordjournals.org/
Dow
nloaded from
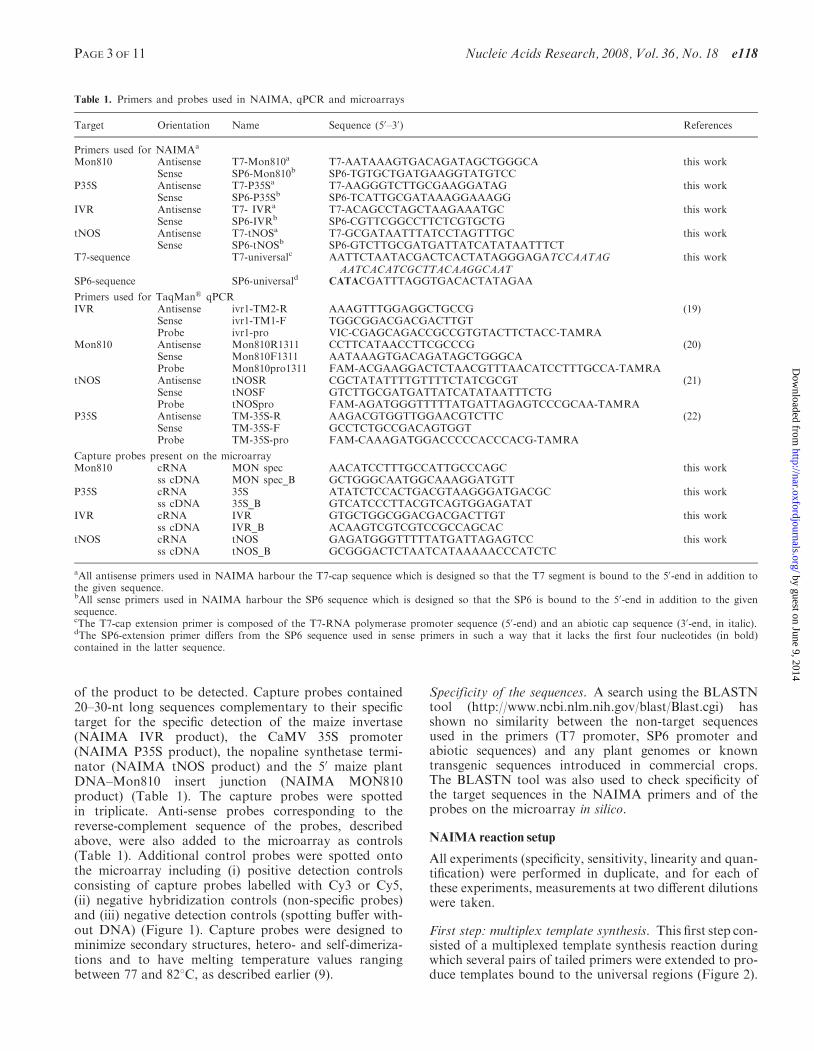
of the product to be detected. Capture probes contained20–30-nt long sequences complementary to their specifictarget for the specific detection of the maize invertase(NAIMA IVR product), the CaMV 35S promoter(NAIMA P35S product), the nopaline synthetase termi-nator (NAIMA tNOS product) and the 50 maize plantDNA–Mon810 insert junction (NAIMA MON810product) (Table 1). The capture probes were spottedin triplicate. Anti-sense probes corresponding to thereverse-complement sequence of the probes, describedabove, were also added to the microarray as controls(Table 1). Additional control probes were spotted ontothe microarray including (i) positive detection controlsconsisting of capture probes labelled with Cy3 or Cy5,(ii) negative hybridization controls (non-specific probes)and (iii) negative detection controls (spotting buffer with-out DNA) (Figure 1). Capture probes were designed tominimize secondary structures, hetero- and self-dimeriza-tions and to have melting temperature values rangingbetween 77 and 828C, as described earlier (9).
Specificity of the sequences. A search using the BLASTNtool (http://www.ncbi.nlm.nih.gov/blast/Blast.cgi) hasshown no similarity between the non-target sequencesused in the primers (T7 promoter, SP6 promoter andabiotic sequences) and any plant genomes or knowntransgenic sequences introduced in commercial crops.The BLASTN tool was also used to check specificity ofthe target sequences in the NAIMA primers and of theprobes on the microarray in silico.
NAIMA reaction setup
All experiments (specificity, sensitivity, linearity and quan-tification) were performed in duplicate, and for each ofthese experiments, measurements at two different dilutionswere taken.
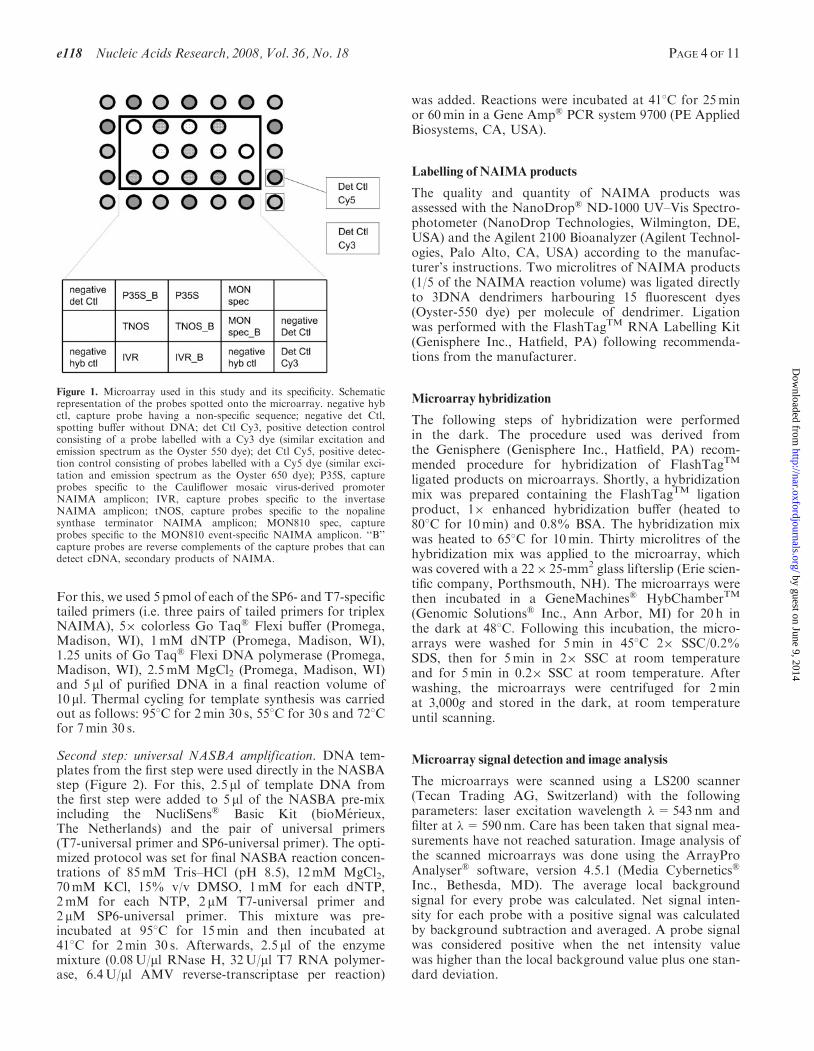
First step: multiplex template synthesis. This first step con-sisted of a multiplexed template synthesis reaction duringwhich several pairs of tailed primers were extended to pro-duce templates bound to the universal regions (Figure 2).
Table 1. Primers and probes used in NAIMA, qPCR and microarrays
Target Orientation Name Sequence (50–30) References
Primers used for NAIMAa
Mon810 Antisense T7-Mon810a T7-AATAAAGTGACAGATAGCTGGGCA this workSense SP6-Mon810b SP6-TGTGCTGATGAAGGTATGTCC
P35S Antisense T7-P35Sa T7-AAGGGTCTTGCGAAGGATAG this workSense SP6-P35Sb SP6-TCATTGCGATAAAGGAAAGG
IVR Antisense T7- IVRa T7-ACAGCCTAGCTAAGAAATGC this workSense SP6-IVRb SP6-CGTTCGGCCTTCTCGTGCTG
tNOS Antisense T7-tNOSa T7-GCGATAATTTATCCTAGTTTGC this workSense SP6-tNOSb SP6-GTCTTGCGATGATTATCATATAATTTCT
T7-sequence T7-universalc AATTCTAATACGACTCACTATAGGGAGATCCAATAGAATCACATCGCTTACAAGGCAAT
this work
SP6-sequence SP6-universald CATACGATTTAGGTGACACTATAGAA
Primers used for TaqMan� qPCRIVR Antisense ivr1-TM2-R AAAGTTTGGAGGCTGCCG (19)
Sense ivr1-TM1-F TGGCGGACGACGACTTGTProbe ivr1-pro VIC-CGAGCAGACCGCCGTGTACTTCTACC-TAMRA
Mon810 Antisense Mon810R1311 CCTTCATAACCTTCGCCCG (20)Sense Mon810F1311 AATAAAGTGACAGATAGCTGGGCAProbe Mon810pro1311 FAM-ACGAAGGACTCTAACGTTTAACATCCTTTGCCA-TAMRA
tNOS Antisense tNOSR CGCTATATTTTGTTTTCTATCGCGT (21)Sense tNOSF GTCTTGCGATGATTATCATATAATTTCTGProbe tNOSpro FAM-AGATGGGTTTTTATGATTAGAGTCCCGCAA-TAMRA
P35S Antisense TM-35S-R AAGACGTGGTTGGAACGTCTTC (22)Sense TM-35S-F GCCTCTGCCGACAGTGGTProbe TM-35S-pro FAM-CAAAGATGGACCCCCACCCACG-TAMRA
Capture probes present on the microarrayMon810 cRNA MON spec AACATCCTTTGCCATTGCCCAGC this work
ss cDNA MON spec_B GCTGGGCAATGGCAAAGGATGTTP35S cRNA 35S ATATCTCCACTGACGTAAGGGATGACGC this work
ss cDNA 35S_B GTCATCCCTTACGTCAGTGGAGATATIVR cRNA IVR GTGCTGGCGGACGACGACTTGT this work
ss cDNA IVR_B ACAAGTCGTCGTCCGCCAGCACtNOS cRNA tNOS GAGATGGGTTTTTATGATTAGAGTCC this work
ss cDNA tNOS_B GCGGGACTCTAATCATAAAAACCCATCTC
aAll antisense primers used in NAIMA harbour the T7-cap sequence which is designed so that the T7 segment is bound to the 50-end in addition tothe given sequence.bAll sense primers used in NAIMA harbour the SP6 sequence which is designed so that the SP6 is bound to the 50-end in addition to the givensequence.cThe T7-cap extension primer is composed of the T7-RNA polymerase promoter sequence (50-end) and an abiotic cap sequence (30-end, in italic).dThe SP6-extension primer differs from the SP6 sequence used in sense primers in such a way that it lacks the first four nucleotides (in bold)contained in the latter sequence.
PAGE 3 OF 11 Nucleic Acids Research, 2008, Vol. 36, No. 18 e118
by guest on June 9, 2014http://nar.oxfordjournals.org/
Dow
nloaded from
For this, we used 5 pmol of each of the SP6- and T7-specifictailed primers (i.e. three pairs of tailed primers for triplexNAIMA), 5� colorless Go Taq� Flexi buffer (Promega,Madison, WI), 1mM dNTP (Promega, Madison, WI),1.25 units of Go Taq� Flexi DNA polymerase (Promega,Madison, WI), 2.5mM MgCl2 (Promega, Madison, WI)and 5 ml of purified DNA in a final reaction volume of10 ml. Thermal cycling for template synthesis was carriedout as follows: 958C for 2min 30 s, 558C for 30 s and 728Cfor 7min 30 s.
Second step: universal NASBA amplification. DNA tem-plates from the first step were used directly in the NASBAstep (Figure 2). For this, 2.5 ml of template DNA fromthe first step were added to 5 ml of the NASBA pre-mixincluding the NucliSens� Basic Kit (bioMerieux,The Netherlands) and the pair of universal primers(T7-universal primer and SP6-universal primer). The opti-mized protocol was set for final NASBA reaction concen-trations of 85mM Tris–HCl (pH 8.5), 12mM MgCl2,70mM KCl, 15% v/v DMSO, 1mM for each dNTP,2mM for each NTP, 2 mM T7-universal primer and2 mM SP6-universal primer. This mixture was pre-incubated at 958C for 15min and then incubated at418C for 2min 30 s. Afterwards, 2.5ml of the enzymemixture (0.08U/ml RNase H, 32U/ml T7 RNA polymer-ase, 6.4U/ml AMV reverse-transcriptase per reaction)
was added. Reactions were incubated at 418C for 25minor 60min in a Gene Amp� PCR system 9700 (PE AppliedBiosystems, CA, USA).
Labelling of NAIMA products
The quality and quantity of NAIMA products wasassessed with the NanoDrop� ND-1000 UV–Vis Spectro-photometer (NanoDrop Technologies, Wilmington, DE,USA) and the Agilent 2100 Bioanalyzer (Agilent Technol-ogies, Palo Alto, CA, USA) according to the manufac-turer’s instructions. Two microlitres of NAIMA products(1/5 of the NAIMA reaction volume) was ligated directlyto 3DNA dendrimers harbouring 15 fluorescent dyes(Oyster-550 dye) per molecule of dendrimer. Ligationwas performed with the FlashTagTM RNA Labelling Kit(Genisphere Inc., Hatfield, PA) following recommenda-tions from the manufacturer.
Microarray hybridization
The following steps of hybridization were performedin the dark. The procedure used was derived fromthe Genisphere (Genisphere Inc., Hatfield, PA) recom-mended procedure for hybridization of FlashTagTM
ligated products on microarrays. Shortly, a hybridizationmix was prepared containing the FlashTagTM ligationproduct, 1� enhanced hybridization buffer (heated to808C for 10min) and 0.8% BSA. The hybridization mixwas heated to 658C for 10min. Thirty microlitres of thehybridization mix was applied to the microarray, whichwas covered with a 22� 25-mm2 glass lifterslip (Erie scien-tific company, Porthsmouth, NH). The microarrays werethen incubated in a GeneMachines� HybChamberTM
(Genomic Solutions� Inc., Ann Arbor, MI) for 20 h inthe dark at 488C. Following this incubation, the micro-arrays were washed for 5min in 458C 2� SSC/0.2%SDS, then for 5min in 2� SSC at room temperatureand for 5min in 0.2� SSC at room temperature. Afterwashing, the microarrays were centrifuged for 2minat 3,000g and stored in the dark, at room temperatureuntil scanning.
Microarray signal detection and image analysis
The microarrays were scanned using a LS200 scanner(Tecan Trading AG, Switzerland) with the followingparameters: laser excitation wavelength �=543 nm andfilter at �=590 nm. Care has been taken that signal mea-surements have not reached saturation. Image analysis ofthe scanned microarrays was done using the ArrayProAnalyser� software, version 4.5.1 (Media Cybernetics�
Inc., Bethesda, MD). The average local backgroundsignal for every probe was calculated. Net signal inten-sity for each probe with a positive signal was calculatedby background subtraction and averaged. A probe signalwas considered positive when the net intensity valuewas higher than the local background value plus one stan-dard deviation.
Figure 1. Microarray used in this study and its specificity. Schematicrepresentation of the probes spotted onto the microarray. negative hybctl, capture probe having a non-specific sequence; negative det Ctl,spotting buffer without DNA; det Ctl Cy3, positive detection controlconsisting of a probe labelled with a Cy3 dye (similar excitation andemission spectrum as the Oyster 550 dye); det Ctl Cy5, positive detec-tion control consisting of probes labelled with a Cy5 dye (similar exci-tation and emission spectrum as the Oyster 650 dye); P35S, captureprobes specific to the Cauliflower mosaic virus-derived promoterNAIMA amplicon; IVR, capture probes specific to the invertaseNAIMA amplicon; tNOS, capture probes specific to the nopalinesynthase terminator NAIMA amplicon; MON810 spec, captureprobes specific to the MON810 event-specific NAIMA amplicon. ‘‘B’’capture probes are reverse complements of the capture probes that candetect cDNA, secondary products of NAIMA.
e118 Nucleic Acids Research, 2008, Vol. 36, No. 18 PAGE 4 OF 11
by guest on June 9, 2014http://nar.oxfordjournals.org/
Dow
nloaded from

Quantitative real-time PCR
Quantitative PCR was used to calibrate DNA copynumber analysed in samples, to assess NAIMA amplifica-tion and to analyse transgenic contents of DNA samples.
qPCR set-up. The primers and probe for detection of theinvertase gene (IVR) were used as described (19). Primersand probes specific for the p35S promoter (P35S) (22) andtNOS terminator (tNOS) (21) were used to target commonpromoter and terminator sequences as previouslydescribed. The event-specific primers and probe for thegenetically modified maize MON810 (MON810) wereused as previously described (20). Sequences of primersand probes used are listed in Table 1 and their positionon the target DNA is indicated on Figure 3. qPCR reac-tions were performed as previously described (26) using2 ml of DNA samples or reverse-transcribed NAIMA prod-ucts. For each sample quantified, dilution controls wereincluded to monitor the possible influence of effectors onqPCR reaction efficiency for each amplicon assayed, as
previously recommended (26). Each dilution was assayedin duplicate. Results were analysed using SDS 2.1 software(Applied Biosystems, Foster City, CA) after an automaticadjustment of the baseline and manual adjustment of thefluorescence threshold. After being exported, further dataanalysis was performed in a basic Excel spreadsheet.
Determination of target copy number in the samples. Thegenome copy number of DNA samples was determined bythe qPCR TaqMan� invertase assay, using a known copynumber of 5% Mon810 certified reference material for theconstruction of the standard curve. The 5% Mon810 stan-dard reference material was diluted to contain approxi-mately 100, 33, 11, 3.7, 1.2, 0.4 and 0.1 ng of DNA,which corresponds to approximately 18 000, 6100, 2000,680, 230, 70 and 23 maize genome copies per reaction,respectively, on the basis of maize genome size (1C) (27)and the measured DNA concentration. Genome copynumber in the sample prior to amplification was calcu-lated by the interpolation of Ct values generated onto astandard regression curve.
Figure 2. Schematic representation of the NAIMA method. Template synthesis step of NAIMA: after denaturation of the target DNA, tailedprimers with a sequence complementary to the target DNA and 50-end sequences necessary for the multiplex amplification bind to the target DNAand are extended by Taq polymerase (1) to produce the DNA template used in the amplification step. The pair of 50-end sequences is identical to allthe different targets. Multiplex amplification step: the DNA template synthesized in the first step is flanked by a recognition site for DNA dependentT7 RNA polymerase (2). This dsDNA is further transcribed by the T7 RNA polymerase into numerous copies of antisense RNA molecules (3),which are later reverse-transcribed into single-stranded sense DNA (ssDNA) (4 and 5) to form an RNA–DNA duplex. This RNA–DNA duplex isdegraded by RNAse H activity (6). The ssDNA is then used as a template by the reverse transcriptase after T7-cap-extension primer annealing (7) tosynthesize a second DNA strand (8). This dsDNA can be used as a template for several cycles of amplification. The final product of NAIMA is anti-sense cRNA. Only one pair of primers is needed in this amplification step for all the targets to be amplified.
PAGE 5 OF 11 Nucleic Acids Research, 2008, Vol. 36, No. 18 e118
by guest on June 9, 2014http://nar.oxfordjournals.org/
Dow
nloaded from
Determination of NAIMA performance. The main finalproduct of NAIMA is cRNA. To estimate the amplifica-tion rate of multiplex NASBA with quantitative real-timePCR (qPCR), a reverse transcription was performed onthe multiplex NASBA products to get double-strandedcDNA. For this, 50 pmol of SP6-universal primer and25 mmol of dNTP (Promega, Madison, WI) were addedto the 10 ml volume of the NASBA reaction products.The mixture was incubated at 658C for 5min and thenput immediately on ice for 5min. Subsequently, 50 pmolof T7-universal primer were added and the mixture wasincubated for 2min at 428C. Finally, 0.045U of RNAseH(50 pmol SP6-universal primer) and 60U of superscriptTM
II reverse transcriptase were added for a final volume of13.6 ml and the reaction solution was incubated for 2 h at428C followed by 5min of denaturation at 658C.After qPCR, Ct values of the NAIMA products were
compared to the Ct values of control samples. The controlsample in our experiments was DNA used for NAIMA,which had been diluted in the same proportion as wasthe amplified DNA in the NAIMA reaction and reversetranscription. The difference in Ct values between theNAIMA products and control indicated the amplificationrate of the NAIMA reaction. From this, Ct values ofNAIMA products were converted into copy numbers asdescribed above.To determine the quantitative performance of the
NAIMA amplification, the 100% Mon810 and the 9.9%
Mon863 standard reference materials were used for pre-paring the standard curve. Reference materials werediluted as described above (determination of target copynumber in the samples), NAIMA-amplified and run onqPCR in duplicate. Target copy number in the sampleprior to NAIMA amplification was calculated by theinterpolation of Ct values generated onto the standardregression curve.
To determine the transgenic contents of the maize DNAsamples, the ratio between the invertase and transgene(P35S, tNOS, Mon8101) copy numbers was calculatedand expressed as a percentage. Standard deviations andcoefficients of variation were evaluated for replicate mea-surements. For each series of measurements, the coeffi-cient of variation that would be attributed to the finalGMO percent calculation was estimated from the follow-ing formula: CV=ˇ(CVinvertase
2+CVtransgene2). Data
were analysed by basic spreadsheet software.Measurements with CV values above 50% were excludedfrom further calculations. For comparison betweenNAIMA and qPCR performances, the coefficient of var-iation was estimated using the standard deviation of theGMO content assessed by NAIMA (SDNAIMA) and theGMO content assessed by qPCR considered as the truevalue (GMOqPCR) as follows: CV=SDNAIMA/GMOqPCR.
RESULTS AND DISCUSSION
We present a new target amplification approach calledNAIMA developed to detect and quantify the presenceof DNA targets in a multiplex fashion. Moreover, wehave shown the possibility of using this new procedurefor the quantification of DNA targets on a microarrayformat. The amplification method is based on a two-stepprocedure. In the first step, the use of multiple tailed prim-ers allows the synthesis of a template DNA in a singleextension reaction. The second step of the procedure con-sists of a NASBA amplification reaction using a single pairof universal primers to anneal to the universal sequencescreated by the tailed primers. After amplification, thecRNA are ligated directly with 3DNA dendrimers labelledwith fluorescent dyes. The cRNA–dendrimer complexesare then hybridized without further purification onto anoligonucleotide microarray harbouring specific probescomplementary to internal segments of the NAIMA prod-ucts. The procedure was tested for two separate triplexsystems.
NAIMA design
Several obstacles needed to be circumvented in the courseof NAIMA development. These included the strong pre-ference of NASBA amplification for RNA templates (23),and the low multiplexing capabilities. Also, multiplexamplification, in general, faces the complexity of primerpair combinations and the problem of unspecific back-ground amplification (13). In the context of multiplexPCR, the use of bipartite primers harbouring a universalregion on the 50 end and target-specific sequences on the30 end has been shown to improve multiplexing capacitiesof amplification (6). Also, the addition of primers identical
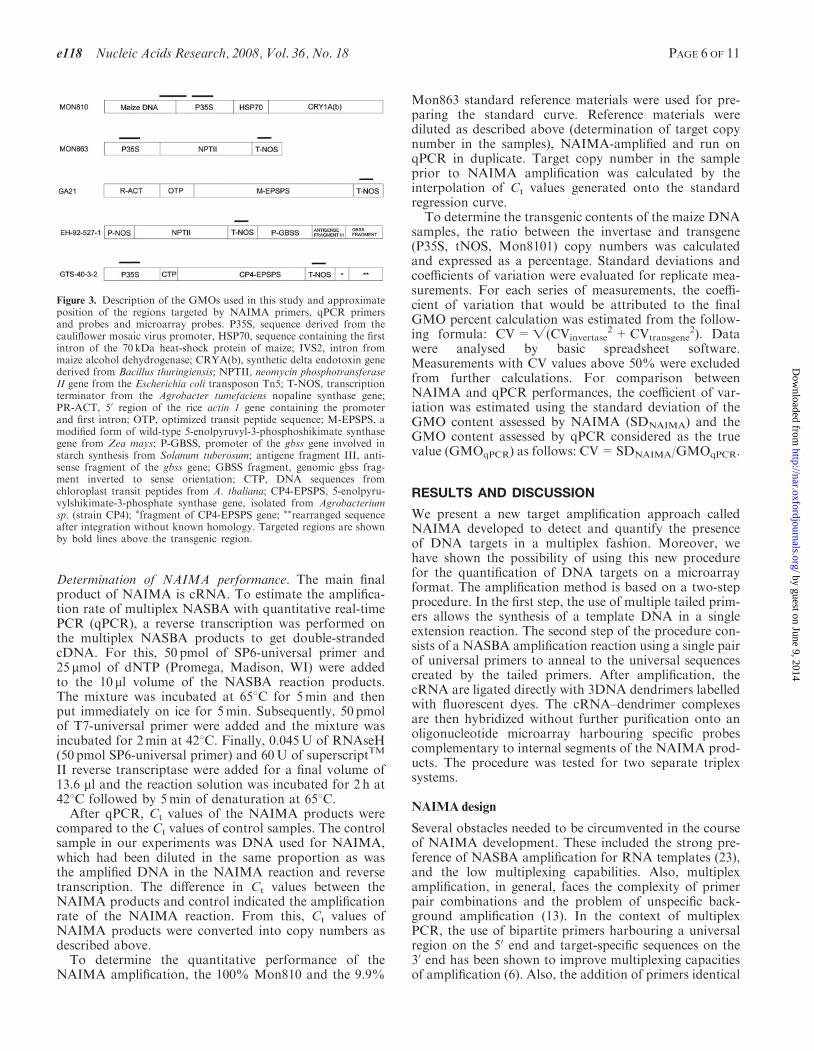
Figure 3. Description of the GMOs used in this study and approximateposition of the regions targeted by NAIMA primers, qPCR primersand probes and microarray probes. P35S, sequence derived from thecauliflower mosaic virus promoter, HSP70, sequence containing the firstintron of the 70 kDa heat-shock protein of maize; IVS2, intron frommaize alcohol dehydrogenase; CRYA(b), synthetic delta endotoxin genederived from Bacillus thuringiensis; NPTII, neomycin phosphotransferaseII gene from the Escherichia coli transposon Tn5; T-NOS, transcriptionterminator from the Agrobacter tumefaciens nopaline synthase gene;PR-ACT, 50 region of the rice actin 1 gene containing the promoterand first intron; OTP, optimized transit peptide sequence; M-EPSPS, amodified form of wild-type 5-enolpyruvyl-3-phosphoshikimate synthasegene from Zea mays; P-GBSS, promoter of the gbss gene involved instarch synthesis from Solanum tuberosum; antigene fragment III, anti-sense fragment of the gbss gene; GBSS fragment, genomic gbss frag-ment inverted to sense orientation; CTP, DNA sequences fromchloroplast transit peptides from A. thaliana; CP4-EPSPS, 5-enolpyru-vylshikimate-3-phosphate synthase gene, isolated from Agrobacteriumsp. (strain CP4); �fragment of CP4-EPSPS gene; ��rearranged sequenceafter integration without known homology. Targeted regions are shownby bold lines above the transgenic region.
e118 Nucleic Acids Research, 2008, Vol. 36, No. 18 PAGE 6 OF 11
by guest on June 9, 2014http://nar.oxfordjournals.org/
Dow
nloaded from
to the universal region of the bipartite primers gave moreuniform amplification results of the different targets (6).
With this in mind, we chose to develop a two-step pro-cedure: template synthesis and NASBA amplification.Prior to the amplification procedure, the DNA samplewas treated with RNAse A to alleviate the bias causedby RNA amplification in the NASBA step. The first stepof NAIMA consists of the synthesis of a DNA templatesuitable for NASBA amplification, which takes place inthe second step. We have designed two types of tailedprimers for this first step: bipartite primers and tripartiteprimers. The bipartite primer is composed of a 50 regioncorresponding to the promoter sequence of the SP6 RNApolymerase, and a 30 region harbouring a target-specificsequence. The SP6 promoter sequence is a non-specificsequence that can be used as universal target in thesecond step. The tripartite primer is composed of a 50
region corresponding to the promoter sequence of theT7 RNA polymerase on which NASBA amplificationrelies, and a 30 region harbouring a target-specificsequence. The central region of the tripartite primer iscomposed of an abiotic sequence used to create a non-specific sequence that is used as the universal target inthe second step thus enabling reconstruction of functionalT7 promoter (step 8 in Figure 2). This sequence wasdesigned to differ from any plant genome or knownsequences inserted in GMOs. The resulting product is ashort double-stranded DNA product harbouring thetarget sequence to be amplified, adjoined to the T7 pro-moter and abiotic sequences on one side, and the SP6-promotor sequence on the other. Such a template hasthe added advantages of being able to be used as a tem-plate by the T7 RNA polymerase, and allowing the use ofonly one pair of universal primers for all analysed targetsduring the NASBA amplification. Sequences of all primersdesigned in this study are available on Table 1.
NAIMA performances
The performance of NAIMA as a DNA target amplifica-tion method was tested using two triplex platforms onGMO testing-related targets. One triplex (screening tri-plex) was designed for the screening of transgenic maizelines authorized in the EU: it targets the endogene maizegene invertase (IVR) and the two main screening elementsfound in transgenic maize lines authorized in the EU, thecauliflower mosaic virus 35S promoter (P35S) and theterminator of the nopalin synthase (tNOS). The secondtriplex platform (MON810 triplex) was designed for thedetection of the Mon810 transgenic maize lines and targetsthe IVR endogene and the P35S element, as well as theevent-specific 50-end junction between the plant DNA andthe Mon810 transgene (MON810). To comply with GMOtesting regulations, the amplification method needs to bespecific to the target DNA, sensitive enough to detectlow numbers of target copies, allow linear amplificationof target sequences over a broad range of target copynumbers (linear range of amplification) and should allowthe identification of samples containing GMOs exceedinga set labelling threshold. In this study, we have set the
threshold of GMO contents at 0.9%, which is the lowestlegal labelling threshold currently in use worldwide (2).The performance characteristics of NAIMA amplifica-
tion described in this section were evaluated using qPCRto quantify target copies after amplification.
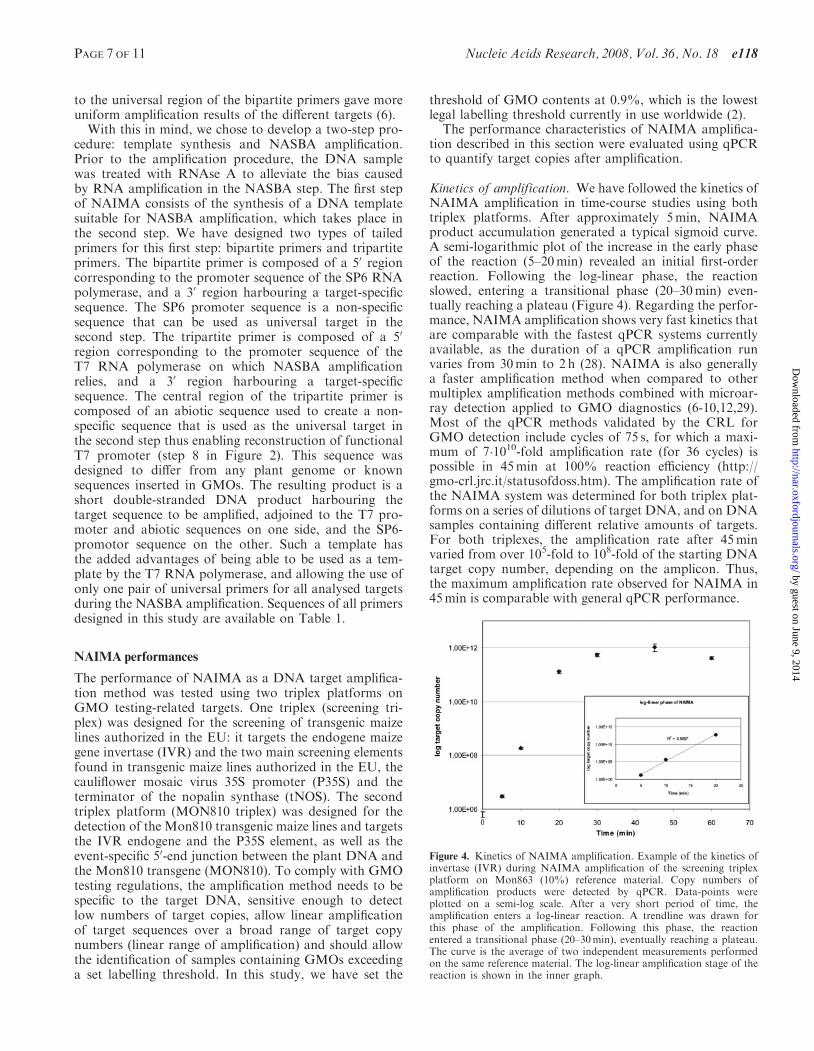
Kinetics of amplification. We have followed the kinetics ofNAIMA amplification in time-course studies using bothtriplex platforms. After approximately 5min, NAIMAproduct accumulation generated a typical sigmoid curve.A semi-logarithmic plot of the increase in the early phaseof the reaction (5–20min) revealed an initial first-orderreaction. Following the log-linear phase, the reactionslowed, entering a transitional phase (20–30min) even-tually reaching a plateau (Figure 4). Regarding the perfor-mance, NAIMA amplification shows very fast kinetics thatare comparable with the fastest qPCR systems currentlyavailable, as the duration of a qPCR amplification runvaries from 30min to 2 h (28). NAIMA is also generallya faster amplification method when compared to othermultiplex amplification methods combined with microar-ray detection applied to GMO diagnostics (6-10,12,29).Most of the qPCR methods validated by the CRL forGMO detection include cycles of 75 s, for which a maxi-mum of 7�1010-fold amplification rate (for 36 cycles) ispossible in 45min at 100% reaction efficiency (http://gmo-crl.jrc.it/statusofdoss.htm). The amplification rate ofthe NAIMA system was determined for both triplex plat-forms on a series of dilutions of target DNA, and on DNAsamples containing different relative amounts of targets.For both triplexes, the amplification rate after 45minvaried from over 105-fold to 108-fold of the starting DNAtarget copy number, depending on the amplicon. Thus,the maximum amplification rate observed for NAIMA in45min is comparable with general qPCR performance.
Figure 4. Kinetics of NAIMA amplification. Example of the kinetics ofinvertase (IVR) during NAIMA amplification of the screening triplexplatform on Mon863 (10%) reference material. Copy numbers ofamplification products were detected by qPCR. Data-points wereplotted on a semi-log scale. After a very short period of time, theamplification enters a log-linear reaction. A trendline was drawn forthis phase of the amplification. Following this phase, the reactionentered a transitional phase (20–30min), eventually reaching a plateau.The curve is the average of two independent measurements performedon the same reference material. The log-linear amplification stage of thereaction is shown in the inner graph.
PAGE 7 OF 11 Nucleic Acids Research, 2008, Vol. 36, No. 18 e118
by guest on June 9, 2014http://nar.oxfordjournals.org/
Dow
nloaded from

We have analysed the influence of the tailed primer’spresence during the first step of NAIMA on the totalamplification rate. For this purpose, the universal primerswere substituted with water during the second step ofNAIMA. In the absence of universal primers, all ampli-cons were amplified but weak amplification was obtained,ranging from 0.4 to 4.8% of the normal amplification rate.Therefore, the tailed primers only have a minor contribu-tion to the overall NAIMA amplification and hence donot need to be removed by purification or enzymatic diges-tion prior to the NASBA step. On the other hand, inclassical two-step multiplex PCR, the second step multi-plex amplification failed if the tailed primers from the firststep were not removed (6).
Specificity of amplification. To evaluate the specificity ofthe system, we performed both NAIMA triplexes usingseveral DNA samples in which at least one of the threetargets was absent: RoundupReady� Soya CRM, EH592-527-1 potato CRM, Mon810 maize CRM, a feed samplecontaining RoundupReady� Soya and wild-type maize,and a feed sample containing wild-type oilseed rape,wild-type maize seed, GA21 maize flour with traces ofP35S contamination (Figure 3). In all samples, only theexpected targets were amplified by NAIMA and qualita-tive results were identical to direct qPCR analysis of thesame samples. Using this approach, one can consider thatour triplexes do not non-specifically amplify transgenicelements inserted in analysed GM lines. Additionally, wehave shown that the system does not amplify neither soy-bean, oilseed rape nor potato genome DNA, the othercrops available on the GMO market for food and feed.
Sensitivity of amplification. The sensitivity of the triplexplatforms to the template concentration was assayed usinga dilution series of Mon863 (9.9%, w/w) and Mon810(100% w/w) DNA. For the screening triplex, IVR wasdetectable in the range between 5400 and 6 copies, whilethe P35S amplicon was detectable from 530 to 4 copies.For tNOS, a signal was obtained from 265 to 2 copies.With the MON810 triplex platform, IVR was detectable inthe range of 5500 to 7 copies of the endogene. The P35Samplicon was detectable from 2750 to 3 copies, while asignal for the Mon810 event-specific amplicon was detect-able from 2750 to 7 copies. These results show that thesensitivity of the newly developed method is comparableto qPCR method, where best assays allow detection of oneto ten molecules (4,30).
Linearity of amplification. We investigated the influenceof target copy number on the linearity of the NAIMAamplification to assess the linear range of amplification.For this, both triplex platforms were assayed using aseries of Mon863 (9.9%, w/w) and Mon810 (100% w/w)DNA samples. Using Mon863 (9.9% w/w) DNA samples,a linear response to copy number was obtained with theIVR amplicon from 5380 copies to 11 copies (with asquared regression coefficient of 0.9145). For the P35Samplicon, amplification was quantitative from 530 to 4copies (with a squared regression coefficient of 0.8980).With the tNOS amplicon, linear amplification was
obtained from 265 to 4 copies (with a squared regressioncoefficient of 0.9336) (Figure 5). Using Mon810 (100%w/w) DNA samples, linear amplification of the IVR ampli-con was obtained from 5500 to 11 copies (the squaredregression coefficient being 0.8621). For the P35S ampli-con, amplification was linear between 2750 and 21 copies(with a squared regression coefficient of 0.9077), while forthe Mon810 amplicon this ranged from 2750 to 21 copies(the squared regression coefficient of which was 0.9798).The linearity of amplification was sufficient to allowbroad range of quantitative analysis on the samples.
Figure 5. Linearity of NAIMA amplification. Example of the amplifi-cation using the screening triplex. A dilution series of template DNAwas amplified with NAIMA. Copy number of template DNA wasestimated by qPCR before NAIMA amplification (control DNA,plotted with circles) and compared to the copy number of the samesample amplified by NAIMA (NAIMA products, plotted with trian-gles) estimated by qPCR. As for the plots from the non-amplifiedcontrol DNA, plots obtained from NAIMA-amplified DNA arelinear showing the linearity of the NAIMA amplification method.Linearity of amplification was assessed for all three amplicon IVR(A), P35S (B) and tNOS (C).
e118 Nucleic Acids Research, 2008, Vol. 36, No. 18 PAGE 8 OF 11
by guest on June 9, 2014http://nar.oxfordjournals.org/
Dow
nloaded from
Quantification trueness. Both triplex platforms were eval-uated for trueness of quantification based on a series ofmaize samples containing different ratios of P35S,Mon810 and tNOS targets copies in maize DNA fromMon810 and Mon863 GM maize background. Quanti-fication results were compared on the same samples withthose of singleplex qPCR analysis that is a goldenstandard in GMO detection (Table 2). The amount ofGMO present was calculated as a ratio of transgene andendogene DNA copy numbers.
For samples with GM contents between 0.1 and 25%,analyses results were in agreement with qPCR quantifica-tion with a correlation of variation (CV) between resultsof both methods ranging from 2.3 to 33.0% for the screen-ing triplex, and from 0.2 to 45.7% for the Mon810 triplex(Table 2). Also, comparable standard deviation values ofcalculated results were observed for qPCR and NAIMAquantification (Table 2). Thus, one can consider thatNAIMA behaves similarly to singleplex qPCR for thesesamples in quantitative analyses.
NAIMA as a target amplification method for on-chipGMO detection
NAIMA product is a single-stranded RNA allowing directhybridization to probes on microarrays without a priordenaturation step. To additionally increase sensitivity ofthe system, we have included signal amplification, as fluo-rescent tagged dendrimers were used for labelling. Thecapture probes present on the microarray allowed specificrecognition of the maize plant species (IVR gene), theCaMV 35S promoter (35S), the nos terminator (tNOS)and the event-specific Mon810 sequence (50 junctionbetween the maize host plant DNA and the transgenicMon810 construct).
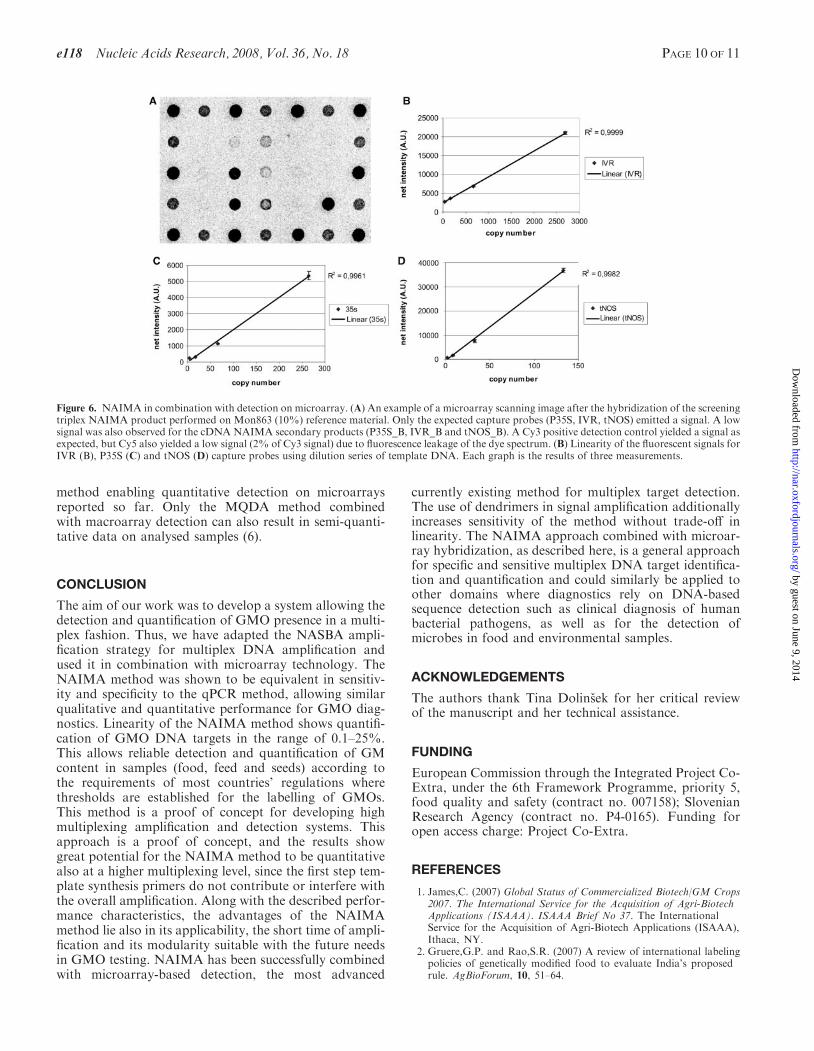
Detection on microarray was tested with products ofboth NAIMA triplexes. The screening triplex was testedon Mon863 CRM material (9.9% w/w) and the Mon810triplex was tested on Mon810 material (100% w/w). Foreach of the expected capture probes, a statistically signifi-cant positive signal was generated, while no signal wasobserved for other capture probes showing high specificityof the system (Figure 6).Linearity and sensitivity of the detection method were
tested using a dilution series of CRMMon863 (9.9% w/w)DNA. The detection on microarrays was proportional tothe starting copy number of the target (before NAIMA)with coefficients of linear correlation ranging from 0.9961to 0.9999 (Figure 6). The detection system appeared to bevery sensitive, since as few as 2 copies of tNOS could beamplified and detected (4 copies for P35S and 42 copies forIVR, this being the lowest concentration tested for inver-tase). This corresponds to 60 pg of starting maize genomicDNA (27). Considering the maize genome size, this meansthat the NAIMA-microarray platform should reliablyidentify the presence of transgenic events at 0.1% level.In comparison to other array-based GMO detection
methods, the method presented in this study shows com-parable performances in terms of specificity and relativesensitivity; most other methods being able to detect as lowas 0.1% GM contents (6,9,29,31), and some being slightlyless sensitive (8,10). The absolute sensitivity of theNAIMA amplification method combined with microarraydetection (�60 pg) is also favourable when compared tothe above-cited methods, since several methods requirestarting amounts of DNA from 10 to 500 ng (8,10,31),two methods requiring 60 pg (29) and 300 pg (6). Themicroarray detection of NAIMA-amplified GM targetsoverpowers other mentioned methods by being the only
Table 2. Trueness of GMO quantification: comparison between NAIMA and qPCR
Triplex platform 35S/IVRNAIMA
35S/IVRqPCR
Cv% betweenNAIMA and qPCR
Mon810/IVRNAIMA
Mon810/IVRqPCR
Cv% betweenNAIMA and qPCR
MON810(IVR� 35S�Mon810)
20.0� 8.1 25.7� 8.0 15.5 11.5� 5.0 8.7� 1.0 23.1
8.4� 6.0 11.5� 3.2 19.2 5.0� 2.1 5.0� 0.4 0.27.4� 2.9 5.1� 0.6 32.6 2.6� 0.8 4.1� 0.4 25.21.5� 0.7 3.9� 1.1 44.1 1.4� 0.6 1.2� 0.5 16.00.9� 0.6 2.6� 0.8 45.7 0.3� 0.2 0.7� 0.3 37.40.3� 0.2 0.6� 0.2 35.6 0.14� 0.11 0.13� 0.04 1.5
Triplex platform 35S/IVRNAIMA
35S/IVRqPCR
Cv% betweenNAIMA and qPCR
tNOS/IVRNAIMA
tNOS/IVRqPCR
Cv% betweenNAIMA and qPCR
screening(IVR � 35S � tNOS)s
17.1� 5.9 13.4� 4.3 20.0 10.9� 5.9 9.2� 3.4 12.9
12.6� 4.7 10.1� 1.7 17.7 9.6� 2.9 9.9� 1.0 2.34.0� 1.8 6.2� 1.9 24.4 3.5� 0.6 3.4� 0.8 3.70.9� 0.5 1.0� 0.4 6.1 0.6� 0.2 0.6� 0.2 2.40.5� 0.2 0.4� 0.1 21.0 0.13� 0.13 0.3� 0.1 33.0ND 0.04� ND 0.00� 0.02� ND
Both triplex platforms were evaluated for trueness of quantification on a series of maize samples containing different ratio of P35S, Mon810 andtNOS target copies in maize DNA from Mon810 and Mon863 GM maize background. Results of quantification were compared with those ofsingleplex qPCR analysis on the same samples.Results are expressed as percentage of the transgenic element copy number (35S, tNOS or Mon810) in haploid genome (estimated by the IVRcopy number).�one of the amplifications has failed.ND, not determined.
PAGE 9 OF 11 Nucleic Acids Research, 2008, Vol. 36, No. 18 e118
by guest on June 9, 2014http://nar.oxfordjournals.org/
Dow
nloaded from
method enabling quantitative detection on microarraysreported so far. Only the MQDA method combinedwith macroarray detection can also result in semi-quanti-tative data on analysed samples (6).
CONCLUSION
The aim of our work was to develop a system allowing thedetection and quantification of GMO presence in a multi-plex fashion. Thus, we have adapted the NASBA ampli-fication strategy for multiplex DNA amplification andused it in combination with microarray technology. TheNAIMA method was shown to be equivalent in sensitiv-ity and specificity to the qPCR method, allowing similarqualitative and quantitative performance for GMO diag-nostics. Linearity of the NAIMA method shows quantifi-cation of GMO DNA targets in the range of 0.1–25%.This allows reliable detection and quantification of GMcontent in samples (food, feed and seeds) according tothe requirements of most countries’ regulations wherethresholds are established for the labelling of GMOs.This method is a proof of concept for developing highmultiplexing amplification and detection systems. Thisapproach is a proof of concept, and the results showgreat potential for the NAIMA method to be quantitativealso at a higher multiplexing level, since the first step tem-plate synthesis primers do not contribute or interfere withthe overall amplification. Along with the described perfor-mance characteristics, the advantages of the NAIMAmethod lie also in its applicability, the short time of ampli-fication and its modularity suitable with the future needsin GMO testing. NAIMA has been successfully combinedwith microarray-based detection, the most advanced
currently existing method for multiplex target detection.The use of dendrimers in signal amplification additionallyincreases sensitivity of the method without trade-off inlinearity. The NAIMA approach combined with microar-ray hybridization, as described here, is a general approachfor specific and sensitive multiplex DNA target identifica-tion and quantification and could similarly be applied toother domains where diagnostics rely on DNA-basedsequence detection such as clinical diagnosis of humanbacterial pathogens, as well as for the detection ofmicrobes in food and environmental samples.
ACKNOWLEDGEMENTS
The authors thank Tina Dolinsek for her critical reviewof the manuscript and her technical assistance.
FUNDING
European Commission through the Integrated Project Co-Extra, under the 6th Framework Programme, priority 5,food quality and safety (contract no. 007158); SlovenianResearch Agency (contract no. P4-0165). Funding foropen access charge: Project Co-Extra.
REFERENCES
1. James,C. (2007) Global Status of Commercialized Biotech/GM Crops2007. The International Service for the Acquisition of Agri-BiotechApplications (ISAAA). ISAAA Brief No 37. The InternationalService for the Acquisition of Agri-Biotech Applications (ISAAA),Ithaca, NY.
2. Gruere,G.P. and Rao,S.R. (2007) A review of international labelingpolicies of genetically modified food to evaluate India’s proposedrule. AgBioForum, 10, 51–64.
Figure 6. NAIMA in combination with detection on microarray. (A) An example of a microarray scanning image after the hybridization of the screeningtriplex NAIMA product performed on Mon863 (10%) reference material. Only the expected capture probes (P35S, IVR, tNOS) emitted a signal. A lowsignal was also observed for the cDNA NAIMA secondary products (P35S_B, IVR_B and tNOS_B). A Cy3 positive detection control yielded a signal asexpected, but Cy5 also yielded a low signal (2% of Cy3 signal) due to fluorescence leakage of the dye spectrum. (B) Linearity of the fluorescent signals forIVR (B), P35S (C) and tNOS (D) capture probes using dilution series of template DNA. Each graph is the results of three measurements.
e118 Nucleic Acids Research, 2008, Vol. 36, No. 18 PAGE 10 OF 11
by guest on June 9, 2014http://nar.oxfordjournals.org/
Dow
nloaded from
3. Hernandez,M., Rodriguez-Lazaro,D. and Ferrando,A. (2005)Current methodology for detection, identification and quanti-fication of genetically modified organisms. Curr. Anal. Chem.,1, 203–221.
4. Holst-Jensen,A., Ronning,S.B., Lovseth,A. and Berdal,K.G. (2003)PCR technology for screening and quantification of geneticallymodified organisms (GMOs). Anal. Bioanal. Chem., 375, 985–993.
5. Birch,L., Archard,C.L., Parkes,H.C. and McDowell,D.G. (2001)Evaluation of LabChipTM technology for GMO analysis in food.Food Control, 12, 535–540.
6. Rudi,K., Rud,I. and Holck,A. (2003) A novel multiplex quantitativeDNA array based PCR (MQDA-PCR) for quantification of trans-genic maize in food and feed. Nucl. Acids Res., 31, e62.
7. Bordoni,R., Germini,A., Mezzelani,A., Marchelli,R. and DeBellis,G. (2005) A microarray platform for parallel detection of fivetransgenic events in foods: a combined polymerase chain reaction-ligation detection reaction-universal array method. J. Agric. FoodChem., 53, 912–918.
8. Germini,A., Rossi,S., Zanetti,A., Corradini,R., Fogher,C. andMarchelli,R. (2005) Development of a peptide nucleic acid arrayplatform for the detection of genetically modified organisms infood. J. Agric. Food Chem., 53, 3958–3962.
9. Leimanis,S., Hernandez,M., Fernandez,S., Boyer,F., Burns,M.,Bruderer,S., Glouden,T., Harris,N., Kaeppeli,O., Philipp,P. et al.(2006) A microarray-based detection system for genetically modified(GM) food ingredients. Plant Mol. Biol., 61, 123–139.
10. Xu,J., Miao,H., Wu,H., Huang,W., Tang,R., Qiu,M., Wen,J.,Zhu,S. and Li,Y. (2006) Screening genetically modified organismsusing multiplex-PCR coupled with oligonucleotide microarray.Biosens. Bioelectron., 22, 71–77.
11. Tengs,T., Kristoffersen,A.B., Berdal,K.G., Thorstensen,T.,Butenko,M.A., Nesvold,H. and Holst-Jensen,A. (2007) Microarray-based method for detection of unknown genetic modifications.BMC Biotechnol., 7, 91.
12. Xu,J., Zhu,S., Miao,H., Huang,W., Qiu,M., Huang,Y., Fu,X. andLi,Y. (2007) Event-specific detection of seven genetically modifiedsoybean and maizes using multiplex-PCR coupled with oligonu-cleotide microarray. J. Agric. Food Chem., 55, 5575–5579.
13. Markoulatos,P., Siafakas,N. and Moncany,M. (2002) Multiplexpolymerase chain reaction: a practical approach. J. Clin. Lab. Anal.,16, 47–51.
14. Lipp,M., Shillito,R., Giroux,R., Spiegelhalter,F., Charlton,S.,Pinero,D. and Song,P. (2005) Polymerase chain reaction technologyas analytical tool in agricultural biotechnology. J. AOAC Int., 88,136–155.
15. Morisset,D., Stebih,D., Cankar,K., Zel,J. and Gruden,K. (2008)Alternative DNA amplification methods to PCR and their appli-cation in GMO detection: a review. Eur. Food Res. Technol.,doi:10.1007/s00217-008-0850-x.
16. Compton,J. (1991) Nucleic acid sequence-based amplification.Nature, 350, 91–92.
17. Timmermans,E.C., Tebas,P., Ruiter,J.P., Wanders,R.J.,de Ronde,A. and de Baar,M.P. (2006) Real-time nucleic acidsequence-based amplification assay to quantify changes in mito-chondrial DNA concentrations in cell cultures and blood cells
from HIV-infected patients receiving antiviral therapy. Clin. Chem.,52, 979–987.
18. Markham,N.R. and Zuker,M. (2005) DINAMelt web server fornucleic acid melting prediction. Nucl. Acids Res., 33, W577–W581.
19. Brodmann,P.D., Ilg,E.C., Berthoud,H. and Herrmann,A. (2002)Real-time quantitative polymerase chain reaction methods for fourgenetically modified maize varieties and maize DNA content infood. J. AOAC Int., 85, 646–653.
20. Holck,A., Vaitilingom,M., Didierjean,L. and Rudi,K. (2002)50-Nuclease PCR for quantitative event-specific detection of thegenetically modified Mon810 MaisGard maize. Eur. Food Res.Technol., 214, 449–454.
21. Kuribara,H., Shindo,Y., Matsuoka,T., Takubo,K., Futo,S.,Aoki,N., Hirao,T., Akiyama,H., Goda,Y., Toyoda,M. et al. (2002)Novel reference molecules for quantitation of genetically modifiedmaize and soybean. J. AOAC Int., 85, 1077–1089.
22. Pauli,U., Schouwey,B., Hubner,P., Brodmann,P. and Eugster,A.(2001) Quantitative detection of genetically modified soybean andmaize: method evaluation in a Swiss ring trial. Mitt. Geb.Lebensmittelunters Hyg., 92, 145–158.
23. Deiman,B., van Aarle,P. and Sillekens,P. (2002) Characteristics andapplications of nucleic acid sequence-based amplification (NASBA).Mol. Biotechnol., 20, 163–179.
24. Hamels,S., Gala,J.L., Dufour,S., Vannuffel,P., Zammatteo,N. andRemacle,J. (2001) Consensus PCR and microarray for diagnosisof the genus Staphylococcus, species, and methicillin resistance.Biotechniques, 31, 1364–1372.
25. Zammatteo,N., Jeanmart,L., Hamels,S., Courtois,S., Louette,P.,Hevesi,L. and Remacle,J. (2000) Comparison between differentstrategies of covalent attachment of DNA to glass surfaces to buildDNA microarrays. Anal. Biochem., 280, 143–150.
26. Cankar,K., Stebih,D., Dreo,T., Zel,J. and Gruden,K. (2006) Criticalpoints of DNA quantification by real-time PCR—effects of DNAextraction method and sample matrix on quantification of geneti-cally modified organisms. BMC Biotechnol., 6, 37.
27. Bennett,M.D. and Smith,J.B. (1991) Nuclear DNA amounts inangiosperms. Philos. Trans. R. Soc. Lond. Ser. B Biol. Sci., 334,309–345.
28. Csako,G. (2006) Present and future of rapid and/or high-through-put methods for nucleic acid testing. Clin. Chim. Acta, 363, 6–31.
29. Bordoni,R., Mezzelani,A., Consolandi,C., Frosini,A., Rizzi,E.,Castiglioni,B., Salati,C., Marmiroli,N., Marchelli,R., Bernardi,L.R.et al. (2004) Detection and quantitation of genetically modifiedmaize (Bt-176 transgenic maize) by applying ligation detectionreaction and universal array technology. J. Agric. Food Chem., 52,1049–1054.
30. Gruden,K. (2006) Gene expression analysis by DNA microarraysand other methods—advantages and disadvantages. In Freitag,J.(ed), Plant Genomics and Bioinformatics Expression Micro Arraysand Beyond—A Course Book. National Institute of Biology,Ljubljana, Slovenia, pp. 36–45.
31. Peano,C., Bordoni,R., Gulli,M., Mezzelani,A., Samson,M.C.,Bellis,G.D. and Marmiroli,N. (2005) Multiplex polymerase chainreaction and ligation detection reaction/universal array technologyfor the traceability of genetically modified organisms in foods.Anal. Biochem., 346, 90–100.
PAGE 11 OF 11 Nucleic Acids Research, 2008, Vol. 36, No. 18 e118
by guest on June 9, 2014http://nar.oxfordjournals.org/
Dow
nloaded from