Reversible addition fragmentation chain transfer polymerization - RAFT
Upload
independentCategory
view
3download
0
n-3 polyunsaturated fatty acids suppress the localization andactivation of signaling proteins at the immunological synapse inmurine CD4+ T cells by affecting lipid raft formation1
Wooki Kim*, Yang-Yi Fan*, Rola Barhoumi†,‡, Roger Smith§, David N. McMurray*,†,‡,¶, andRobert S. Chapkin*,†,‡,2
*Faculty of Nutrition, Texas A&M University, College Station, TX 77843
†Center for Environmental and Rural Health, Texas A&M University, College Station, TX 77843
‡Department of Veterinary Integrative Biosciences, Texas A&M University, College Station, TX 77843
§Department of Veterinary Pathology, Texas A&M University, College Station, TX 77843
¶Department of Microbial & Molecular Pathogenesis, Texas A&M University System Health Science Center,College Station, TX 77843
AbstractThe molecular properties of immunosuppressive n-3 polyunsaturated fatty acids (PUFA) have notbeen fully elucidated. Using CD4+ T cells from wild type control and fat-1 transgenic mice (enrichedin n-3 PUFA), we show that membrane raft accumulation assessed by Laurdan (6-dodecanoyl-2-dimethyl aminonaphthalene) labeling was enhanced in fat-1 cells following immunological synapse(IS) formation by CD3-specific Ab expressing hybridoma cells. However, the localization ofPKCθ, PLCγ-1 and F-actin into the IS was suppressed. In addition, both the phosphorylation statusof PLCγ-1 at the IS and cell proliferation as assessed by CFSE labeling and [3H]-thymidineincorporation were suppressed in fat-1 cells. These data imply that lipid rafts may be targets for thedevelopment of dietary agents for the treatment of autoimmune and chronic inflammatory diseases.
KeywordsT cells; Signal Transduction; Cell Activation; fat-1; immunological synapse; lipid rafts; nutrition
IntroductionThe Singer and Nicholson lipid bilayer model of the plasma membrane (1) has evolvedsignificantly to include specialized microdomains, i.e., lipid rafts. Lipid rafts can be classifiedas morphologically featureless, detergent-resistant membranes (DRM)3 due to their
1This work was supported by National Institutes of Health Grants DK071707, CA59034 and P30ES09106. Confocal and multi-photonmicroscopy was performed in the College of Veterinary Medicine & Biochemical Sciences Image Analysis Laboratory, supported withfunding from NIH-NCRR Shared Instrumentation Grant (1 S10 RR22532-01)2Address correspondence and reprint request to Dr. Robert S. Chapkin, 321 Kleberg Biotechnology Center, MS 2253, Texas A&MUniversity, College Station, TX 77843-2253, USA. Phone: 979-845-0448, Fax: 979-862-2378, E-mail: [email protected] used in this paper: DRM, detergent-resistant membranes; PUFA, polyunsaturated fatty acids; DHA, docosahexaenoicacid; PKC, protein kinase C; CARMA1, caspase recruitment domain-containing protein 11; EPA, eicosapentaenoic acid; MβCD, methyl-β-cyclodextrin; GP, generalized polarization; LAT, linker for activation of T cells; PLC, phospholipase C; CTx-FITC, cholera toxin Bsubunit-fluorescein isothiocyanate; RRI, relative relocation index; PI, propidium iodide; DPM, disintegrations per minute
NIH Public AccessAuthor ManuscriptJ Immunol. Author manuscript; available in PMC 2009 November 1.
Published in final edited form as:J Immunol. 2008 November 1; 181(9): 6236–6243.
NIH
-PA Author Manuscript
NIH
-PA Author Manuscript
NIH
-PA Author Manuscript
insolubility in cold nonionic detergents (2). Their highly enriched cholesterol and sphingolipidcontent suggests that they are in a liquid ordered (lo) state, whereas the bulk membrane is in aliquid disordered (ld) state (3). The biochemical characterization of lipid rafts has providednew insight into the regulation and function of plasma membrane proteins. For example, it isnow known that T cell intracellular signaling cascades, endocytosis, protein trafficking andcell-cell communication are modulated in part by altering the lipid-protein composition of thebulk membrane and specialized lipid microdomains (3-6).
Dietary fish oil, rich in n-3 polyunsaturated fatty acids (PUFA), can alter immune cell functionand aid in the resolution of chronic inflammation, e.g., arthritis, Crohn's disease, dermatitis,psoriasis and ulcerative colitis (7-10). To further investigate the anti-inflammatory propertiesof fish oil, we have demonstrated that n-3 PUFA modulate CD4+ T cell immune responses inpart via reduction in Th1 clonal expansion (11), IL-2 secretion and IL-2 receptor α-chainmRNA transcription (12). However, the molecular mechanisms by which n-3 PUFA suppressCD4+ T cell function are not fully understood.
It has been reported that the fatty acid composition of lipid rafts and the bulk membrane inJurkat T cells was altered by addition of n-3 PUFA to the culture media (13). Our lab alsodemonstrated the modulation of T cell lipid rafts by dietary n-3 PUFA in a mouse model(14). In the latter study, it was demonstrated that dietary fish oil as well as purifieddocosahexaenoic acid (DHA, 22:6n-3), a major bioactive n-3 PUFA, altered CD4+ T cellplasma membrane fatty acid composition, specifically in phosphatidylserine andphosphatidylethanolamine, which are abundant in the cytofacial leaflet of the cell membrane(15). In contrast, fatty acid profiles in sphingomyelin, phosphatidylinositol, andphosphatidylcholine, which are major lipids in the exofacial leaflet (15) in which TCR is linked,were not altered. These observations may partially explain why n-3 PUFA alter signalingpathways without affecting expression and/or affinity of the TCR/CD3 complex (16,17).Furthermore, in complementary studies, changes in lipid raft fatty acid composition wereassociated with a decrease in the translocation of protein kinase C (PKC)θ, a key moleculeregulating CD4+ T cell activation, into lipid rafts in mitogen stimulated T cells (12). In contrast,n-3 PUFA incubation displaced F-actin, talin, LFA-1α, but not PKCθ from the IS, where Tcells and APC form a conjunction (18). In terms of cell signaling triggered by TCR, it wasreported that a scaffold protein, caspase recruitment domain-containing protein 11 (CARD11,CARMA1) is recruited into the IS and plays an essential role in linking Ag recognition,PKCθ activation via translocation into lipid rafts and NF-kB nuclear translocation (19). Fromthese studies, it is apparent that n-3 PUFA may modulate T cell function via alteration of lipidraft structure and the translocation of signaling molecules.
We have recently reported that long chain PUFA alter the size and distribution of lipid rafts inHeLa cells, as determined by immuno-gold electron microscopy (20). These data suggest thatplasma membrane organization of inner leaflets is fundamentally altered by n-3 PUFAenrichment. However, to date, the direct visualization of T cell lipid rafts at the IS followingn-3 PUFA membrane enrichment has not been reported. Recently, it was demonstrated thatthe fluorescent probe Laurdan can align itself parallel with the hydrophobic tails ofphospholipids in membranes (21-23). Owing to its ability to emit two different wavelengthsaccording to the fluidity of the microenvironment, Laurdan can be used to measure membranefluidity and visualize lipid rafts in living cells by two-photon microscopy (22).
Since mammals cannot produce n-3 PUFA from the major n-6 PUFA found in the diet due tothe lack of Δ15-desaturase activity, it is necessary to enrich the diet with eicosapentaenoic acid(EPA, 20:5n-3) and/or DHA in order to assess their biological properties in vivo. Recently, thefat-1 gene encoding an n-3 fatty acid desaturase was cloned from Caenorhabditis elegans andexpressed in mammalian cells (24). This enzyme can catalyze the conversion of n-6 PUFA to
Kim et al. Page 2
J Immunol. Author manuscript; available in PMC 2009 November 1.
NIH
-PA Author Manuscript
NIH
-PA Author Manuscript
NIH
-PA Author Manuscript
n-3 PUFA by introducing a double bond into fatty acyl chains. Hence, transgenic miceexpressing fat-1 allow us to investigate the biological properties of n-3 PUFA without havingto incorporate these fatty acids in the diet. Using the fat-1 mouse model, we report for the firsttime the effect of n-3 PUFA on (a) the formation of lipid rafts in living CD4+ T cells at theimmunological synapse, (b) membrane translocation of signaling molecules, (c)phosphorylation (activation status) of key signaling proteins and (d) the proliferation ofCD4+ T cells.
Materials and MethodsAnimals, diets, and CD4+ T cell purification
Fat-1 transgenic mice were generated and backcrossed onto a C57BL/6 background bybreeding heterozygous mice (24,25). Littermates were used in all experiments as previouslydescribed (25). All procedures followed guidelines approved by Public Health Service and theInstitutional Animal Care and Use Committee at Texas A&M University. Mice were genotypedusing tail DNA. To confirm the phenotype, total lipids were isolated from splenic CD4+ T cellsand the fatty acid profile was characterized by gas chromatography as previously described(14). Animals were fed a 10% safflower oil diet (n-6 PUFA rich, Research Diets) ad libitumwith a 12 h light/ dark cycle. The diet contained 40 (g/100 g diet) sucrose, 20 casein, 15 cornstarch, 0.3 DL-methionine, 3.5 AIN 76A salt mix, 1.0 AIN 76A mineral mix, 0.2 cholinechloride, 5 fiber (cellulose), 10 safflower oil. CD4+ T cells from fat-1 or WT mice were isolatedfrom spleens by a magnetic microbead positive selection method (Miltenyi Biotec) accordingto the manufacturer's recommendation.
Laurdan labelingPurified (91.0 ± 1.0% determined by flow cytometry, n=3) CD4+ T cells were stained withLaurdan (Invitrogen) for lipid raft visualization. Briefly, 5 μmol/L Laurdan was prepared inserum-free RPMI medium and incubated with 2×10⁶ cells/mL for 30 min at 37°C (21). Cellswere subsequently washed and resuspended in serum-free Leibovitz's medium. To evaluatethe effect of cholesterol depletion on lipid raft formation, cells were pretreated with 10 mmol/L methyl-β-cyclodextrin (MβCD, Sigma) in fatty acid-free RPMI media containing 0.1% BSAfor 3 min prior to Laurdan labeling (26).
CD4+ T cell activation and two-photon microscopyFor mitogenic activation, CD4+ T cells were cocultured with CD3-specifc Ab expressinghybridoma cells (clone 145-2C11, ATCC, anti-CD3 hybridoma) in complete medium [RPMI1640 medium with 25 mmol/L HEPES (Irvine Scientific), supplemented with 5% heat-inactivated FBS (Invitrogen), 105 U/L penicillin and 100 mg/L streptomycin (Gibco), 2 mmol/L L-glutamine (Glutamax®, Gibco), and 10 μmol/L 2-ME (Sigma)]. To validate immunesynapse formation, T cells were also incubated with an irrelevant DNP-specific Ab expressinghybridoma cells (clone UC8-1B9, anti-DNP hybridoma) (27). In select experiments,hybridoma cells were prelabeled with Cell Tracker orange-fluorescent tetramethylrhodamine(CMTMR, Invitrogen). Laurdan labeled CD4+ T cells were coincubated with hybridoma cellsat a ratio of 5:1. Cell mixtures were seeded onto poly-L-lysine (Sigma) precoated chamberedcoverglass slides (2×10⁶ CD4+ T cells/chamber). After a 30 min incubation period at 37°C,Laurdan was measured by two-photon microscopy (Zeiss LSM 510 META NLO, 40x objective1.3 NA oil) at 400-460 nm and 470-530 nm (Fig. 1A-D) to calculate generalized polarization(GP)-values, which indicate lo and ld states of the membrane, respectively (22). The CoherentChameleon femtosecond pulsed Ti:Sapphire laser was set at an excitation of 770 nm.
Kim et al. Page 3
J Immunol. Author manuscript; available in PMC 2009 November 1.
NIH
-PA Author Manuscript
NIH
-PA Author Manuscript
NIH
-PA Author Manuscript
GP-value calculationAll images were converted to 8-bit/channel TIFF format and were processed using AdobePhotoshop CS3®. The mean intensities of each color channel were measured in either wholecells or contact regions of the synapse by drawing a polygon around each cell boundary (wholecell) (Fig. 1F) or by drawing an oval at the T cell membrane proximal to the hybridoma cell(Fig. 1E). GP-values were obtained by the formula, GP=(I400-460−I470-530)÷(I400-460+I470-530), where I stands for intensities of each region of interest for the blue andgreen channels, respectively (21,22).
Quantification of protein localization, activation and GM1 relocationTo assess the relocalization of signaling proteins or cytoskeletal F-actin, isolated CD4+ T cellswere mixed with hybridoma cells (5:1) and seeded onto poly-L-lysine precoated coverglassslides. After a 30 min incubation period, cells were fixed in 4% formaldehyde for 20 min,rinsed with PBS, and incubated with 10 mmol/L glycine in PBS for 10 min at room temperatureto quench aldehyde groups. Cell membranes were permeabilized by exposure to 0.2% TritonX-100 in PBS for 5 min at room temperature, followed by PBS washing. Cells weresubsequently covered with blocking solution (1% BSA/0.1% NaN3 in PBS) and incubated at4°C overnight with primary Abs, rabbit Abs specific to either PKCθ (Santa CruzBiotechnology), linker for activation of T cells (LAT), phospho-LAT (Upstate Biotechnology),CARMA1, phospholipase C (PLC)γ-1, phospho-PLCγ-1 (Cell Signaling Technology) aspreviously reported (12). After PBS washing, cells were incubated with secondary AlexaFluor® 568 goat Ab to rabbit IgG (Molecular Probes). In order to visualize F-actin andganglioside GM1 localization, cells were incubated with F-actin-specific phallotoxin-AlexaFluor 568® (Molecular Probes) or GM1-specific cholera toxin B subunit-fluoresceinisothiocyanate (CTx-FITC, Sigma), respectively. Following serial ethanol dehydration steps,samples were mounted onto glass slides with ProLong Antifade reagent (Molecular Probes)(12). Fluorescence images were acquired by confocal microscopy to determine both thetranslocation and phosphorylation status (activation) of signaling proteins in CD4+ T cells.Either a BioRad Radiance 2000MP (argon laser excitation at 568 nm and emission at 590 nm,63x objective 1.4 NA water) or Zeiss LSM 510 META NLO (argon laser excitation at 543 nmand emission with a LP 560 nm, 63x objective 1.4 NA oil) system was used for imageacquisition. Cell images were captured in 8-bit TIFF format and the percentage of cells withprotein patching at the IS was counted to assess the relocalization of signaling proteins or F-actin. GM1 recruitment into the IS was quantified by relative relocation index (RRI) (28).Briefly, polygons were drawn to designate the IS, the contact whole cell and background area.RRI was calculated by the formula, RRI=[mean fluorescence intensity (MFI) at the IS-background]÷(MFI at the contact whole cell-background). Quantitative analysis of MFI wasperformed using Adobe Photoshop® CS3 for Windows.
CD4+ T cell proliferation assayThe effect of n-3 PUFA on T cell proliferation was evaluated by the [3H]-thymidineincorporation and CFSE labeling as previously described (11,29). Briefly, 2×10⁵ purifiedCD4+ T cells were stimulated using either control RPMI complete medium, 5×10⁵ anti-CD3hybridoma cells which were pretreated with 10 μmol/L mitomycin C (Sigma) for 30 min toblock cell division, plate bound CD3-specific mAb (1 ng/L) and soluble CD28-specific mAb(5 ng/L, BD Pharmingen) (anti-CD3/28 mAbs) or PMA (1 pg/L) and Ionomycin (500 nmol/L) (PMA/Ionomycin). Cells were cultured for 72 h in round-bottom 96-well multiplates. ForCFSE profile analysis, CD4+ T cells were pretreated with 5 μmol/L CFSE in PBS supplementedwith 5% FBS for 10 min (29). After 72 h in culture as described above, CFSE was analyzedby flow cytometry (FACSCalibur, BD) as previously reported (11). Briefly, cells wereharvested by centrifugation and resuspended in PBS. To determine viability, propidium iodide
Kim et al. Page 4
J Immunol. Author manuscript; available in PMC 2009 November 1.
NIH
-PA Author Manuscript
NIH
-PA Author Manuscript
NIH
-PA Author Manuscript
(PI, Sigma) was added to each sample prior to analysis. CFSE fluorescence was detected usinga 530/30 band pass filter and PI fluorescence through a 650LP filter. CFSE fluorescence wassufficiently intense to be detected through a 650LP filter. Viable cells were determined usinga plot of CFSE vs PI fluorescence, based on the fluorescence patterns of a sample with CFSEbut no PI. This gate also excluded most of the hybridoma cells because of their higher level ofautofluorescence. An additional lymphocyte gate was set based on forward and side lightscattering properties. CFSE profiles were analyzed by ModFit LT 3.0 (Verity Software House).Data were expressed as difference of percentage (Δpercentage, fat-1 - WT) at each daughtercell generation. For the [3H]-thymidine incorporation, 4 μCi [3H]-thymidine/well (NewEngland Nuclear) was added to the cultures for the final 6 h. Cells were harvested using a 96-well cell harvester (Packard Instrument) and thymidine uptake was measured using liquidscintillation counting (Beckman Coulter). Results are expressed as proliferation index, whichis derived by dividing disintegrations per minute (DPM) of stimulated wells by DPM of basalcontrol.
StatisticsData were analyzed using Student's t-test to compare fat-1 and WT cells. Kolmogorov-Smirnovmethod was applied to test the normality of the data distribution. Statistical interaction of thevariables (genotype and ROI) was tested by two-way ANOVA. To compare multiple treatmentmeans, one-way ANOVA and LSD multiple post-hoc tests were used (SPSS 15.0 forWindows). Data are expressed as mean ± SEM and differences of P<0.05 were consideredstatistically significant.
Resultsn-3 PUFA enhances the formation of lipid rafts at the immune synapse
Both fat-1 transgenic and wild type (WT) control offspring were fed a 10% safflower oil dietenriched in n-6 PUFA throughout the duration of study. Splenic CD4+ T cell total lipid fattyacid compositional analyses revealed an increase in n-3 PUFA [EPA (P=0.010),docosapentaenoic acid (DPA 22:5n-3, P=0.007) and DHA (P=0.015)] and a decrease in n-6PUFA, specifically arachidonic acid (20:4n-6, P=0.053), adrenic acid (22:4n-6, P=0.041) andDPA (22:5n-6, P=0.008) in fat-1 transgenic mice (Fig.2). In addition, the ratio of n-6 to n-3PUFA was significantly (P=0.003) suppressed in fat-1 (5.13 ± 1.18), compared to WT T cells(35.71 ± 6.38). These data indicate that an appropriate activity of n-3 fatty acid desaturase waspresent and that T cells from fat-1 mice were enriched in n-3 PUFA.
To investigate the effect of endogenous n-3 PUFA on lipid raft formation at the IS, Laurdanlabeled CD4+ T cells were cocultured with anti-CD3 hybridoma cells at 37°C in 5% CO2 for30 min. Images of conjugate CD4+ T cells and hybridomas were captured, while non-contactCD4+ T cells served as a negative control. Two-way ANOVA of generalized polarization (GP)-values revealed that there was no statistical interaction between genotype and regions of interest(ROI) (P=0.430). GP-values were significantly (P<0.001, LSD post-hoc test) increased at theIS (0.412 ± 0.017 WT vs 0.452 ± 0.014 fat-1) compared to non-contact T cells (0.329 ± 0.008WT vs 0.372 ± 0.008 fat-1) or contact whole cells (0.363 ± 0.010 WT vs 0.377 ± 0.008fat-1) (Fig. 3A). Overall, raft formation was enhanced in fat-1 vs WT cells in both resting(P=0.016) and stimulated (P=0.022) CD4+ T cells. The DNP-specific Ab expressing hybridomawas used as a negative control, and failed to exhibit an increase in the GP index at the IS (Fig.3B and C). These data demonstrate that the n-3 PUFA-dependent increase in the GP index isIS dependent.
In independent experiments, CD4+ T cells were pretreated with 10 mmol/L MβCD for 3 minto specifically deplete cholesterol from lipid rafts as described previously (26). Laurdan
Kim et al. Page 5
J Immunol. Author manuscript; available in PMC 2009 November 1.
NIH
-PA Author Manuscript
NIH
-PA Author Manuscript
NIH
-PA Author Manuscript
analysis revealed that the elevated GP values associated with IS formation (ΔGP=0.195 ±0.030, fat-1 and 0.139 ± 0.015, WT, n=6-14 cells per mouse from 1-2 mice per genotype) wasdiminished following MβCD treatment (ΔGP=0.053 ± 0.022, fat-1 and ΔGP=0.059 ± 0.033,WT), indicating that changes in the GP index at the IS are cholesterol dependent.
In complementary experiments, GM1-specific microcluster recruitment was assessed usingCTx-FITC. CTx has been used to mark membrane microdomains in the exofacial leaflet,although a significant fraction of GM1 is found outside lo regions (30). Interestingly, in contrastto the enhanced lo domain formation at the IS (Fig. 3B), GM1 recruitment was not altered infat-1 CD4+ T cells (Fig. 3D and E).
n-3 PUFA suppress the localization of signaling proteins into the ISFollowing Ag recognition by the TCR, signaling cascades proximal to the IS are initiated byrelocalization of a complex of molecules, i.e., protein kinases (Fyn, Lck, ZAP-70, PLCγ-1),scaffolding proteins (LAT, Grb-2, SLP-76, CARMA1) and cytoskeletal proteins (F-actin) intothe IS (5,19,31). In this study, the effect of n-3 PUFA on the localization of select signalingmolecules in the plasma membrane at the IS was quantified. Fig. 4A shows representative cellimages obtained following incubation with rabbit mAb specific to mouse LAT and thesecondary Alexa Fluor® 568 Ab specific to rabbit IgG. Relocalization of PKCθ, PLCγ-1 andF-actin into the IS, expressed as the percentage conjugate with patching, were suppressed infat-1 transgenic cells by 30% (P=0.050), 32% (P=0.081) and 36% (P=0.020), respectively (Fig.4B). In contrast, the intracellular localization of LAT and CARMA1 at the IS was not alteredby n-3 PUFA.
n-3 PUFA down-regulate PLCγ-1 phosphorylation at the ISSince phosphorylation of LAT and PLCγ-1 occurs at the very early stages of T cell activation,either phospho-LAT or phospho-PLCγ-1 specific Ab was used to visualize the effect of n-3PUFA on T cell activation. Specifically, the percentage conjugate patching of phospho-Y195(LAT) (32) and phospho-Y783 (PLCγ-1) (33) was examined and showed that PLCγ-1phosphorylation was suppressed by 29% (P=0.034) in n-3 PUFA enriched cells at the IS,whereas LAT phosphorylation was not altered (P=0.464) (Fig. 5A and B).
n-3 PUFA suppress CD4+ T cell proliferationCD4+ T cells were labeled with CFSE and cultured for 72 h for the purpose of determiningwhether the effect of n-3 PUFA on lipid rafts and signaling protein recruitment/activation wasassociated with an alteration in T cell proliferation. Using flow cytometry analysis, non-viablecells were gated out based on their uptake of PI (Fig. 6A, D and G) and lymphocytes wereidentified by forward and side scatter plot analysis (Fig. 6B, E and H). The parental peak wasobtained by examining unstimulated control cells, which did not divide (Fig. 6C), whereas celldivision was visualized by the shift of CFSE peak to the left (11, 29). To identify each daughtergeneration, computer-aided modeling was performed (Fig. 6F and I). Examination of thepercentage of each daughter cell generation revealed that fat-1 CD4+ T cell proliferation wassuppressed in response to anti-CD3 hybridoma stimulation. Specifically, a higher percentageof non-divided parental cells (Δpercentage=5.87, P=0.028) and lower percentage of daughtercells at generation 4 (Δpercentage=−0.98, P=0.037), 5 (Δpercentage=−1.73, P=0.042) and 6(Δpercentage=−1.38, P=0.065) were obtained (Fig. 7A). In addition, CD4+ T cells stimulatedby either anti-CD3/28 mAbs or PMA/Ionomycin exhibited a similar trend; larger fraction atgeneration 1 (Δpercentage=4.30, P=0.085 anti-CD3/28 mAbs, Δpercentage=3.58, P=0.001PMA/Ionomycin) and a reduced number of cells at generation 4 (Δpercentage=−3.34, P=0.081anti-CD3/28 mAbs), suggesting a suppression of cell division in the fat-1 group (Fig. 7B andC).
Kim et al. Page 6
J Immunol. Author manuscript; available in PMC 2009 November 1.
NIH
-PA Author Manuscript
NIH
-PA Author Manuscript
NIH
-PA Author Manuscript
In a complementary experiment, CD4+ T cell proliferation was assessed by the incorporationof [3H]-thymidine. In accordance with CFSE profile data, thymidine uptake expressed as theproliferation index revealed that fat-1 CD4+ T cell division was significantly suppressed by52% (P<0.001), 45% (P=0.002) and 56% (P=0.001) in anti-CD3 hybridoma, anti-CD3/28mAbs and PMA/Ionomycin stimulated cells, respectively (Fig. 8).
DiscussionIt has been postulated that n-3 PUFA, because of their perceived broad acting effects onmammalian physiology, act at a fundamental level common to all cells, i.e., by altering thephysical properties of biological membranes (9,10,18,34-38). More specifically, wehypothesized that the anti-inflammatory effects of n-3 PUFA on CD4+ T cells would beexplained, in part, by suppressing/disrupting lipid raft formation at the IS.
To elucidate the membrane bioactive properties of n-3 PUFA in T-cells, the fat-1 transgenicmouse model was utilized because it is uniquely capable of converting n-6 PUFA to n-3 PUFAendogenously by introducing a cis double bond into fatty acyl chains (24,39). Data from initialexperiments showed that the fat-1 gene was functionally expressed in splenic CD4+ T cellsand that the plasma membrane was enriched in n-3 PUFA (Fig. 2).
We have demonstrated previously that n-3 PUFA suppress murine CD4+ T cell proliferationby remodeling lipid raft fatty acid composition and by altering PKCθ colocalization (12). Inthat study, CD4+ T cells were stimulated by culture plate-bound mAb to CD3 (anti-CD3 mAb)to induce the colocalization of PKCθ with GM1, a marker of lipid rafts. However, the directvisualization of lipid rafts at the IS is necessary in order to investigate microdomain assemblyand localization at the plasma membrane. Hence, in the present study, we incubated CD4+ Tcells with Laurdan to directly measure membrane fluidity and visualize lipid rafts by two-photon microscopy. For this purpose, anti-CD3 hybridoma cells were used as Ag presentingcells to form an IS, since they express cell surface costimulatory B7 and intercellular adhesionmolecule (ICAM-1) (27). In a major step toward developing a unifying mechanistic hypothesisaddressing how dietary PUFA modulate cell membrane microdomains, we demonstrate for thefirst time that n-3 PUFA actually promote lipid raft formation at the IS (Fig. 3A-C). Theseresults can be explained in part by the fact that n-3 PUFA, specifically DHA, has a low affinityfor cholesterol, providing a lipid-driven mechanism for lateral phase separation of cholesterol/sphingolipid-rich lipid microdomains from the surrounding ld phase (34-38). Hence, theinsertion of DHA into the bulk membrane should enhance the coalescence of cholesterol-richlipid raft-like domains in living cells. These findings are consistent with previous observationsusing immuno-gold electron microscopy of plasma membrane sheets coupled with spatial pointanalysis of validated microdomain markers (20). In that study, we demonstrated that DHAincreased lipid raft clustering in HeLa cells, indicating that plasma membrane organization ofinner leaflets is fundamentally altered by n-3 PUFA-enrichment.
With regard to the role of lipid rafts in T cell activation, T cells from patients suffering fromautoimmune disease synthesized more GM1 following TCR activation (5), suggesting thatGM1 enriched domains play a critical role in the activation of immune responses. However,cholesterol overloading in healthy T cells reduced the lateral mobility of receptors and signalingmolecules providing a link between plasma membrane cholesterol content andimmunosenescence (5). These observations are controversial because GM1 and cholesterol,which are both thought to be lipid raft building blocks (3), play different roles in T cellactivation and regulation. Therefore, we measured the recruitment of GM1 into the IS bylabeling with CTx-FITC in order to evaluate the effect of n-3 PUFA on GM1-specific lipidrafts. Of interest, GM1 relocation as assessed by RRI was not altered by n-3 PUFA (Fig. 3E).This observation is consistent with a previous report, where GM1 localization as assessed by
Kim et al. Page 7
J Immunol. Author manuscript; available in PMC 2009 November 1.
NIH
-PA Author Manuscript
NIH
-PA Author Manuscript
NIH
-PA Author Manuscript
biochemical isolation of DRM was not affected by PUFA treatment (40). Interestingly, thefatty acid composition of phospholipids in the exofacial leaflet of T cells, where GM1 isenriched, was not altered by n-3 PUFA (14). In addition, long chain PUFA are predominantlyenriched in phospholipids localized to the cytofacial leaflet (14,41). Based on these findings,the data suggest that the incorporation of n-3 PUFA into cytofacial leaflet phospholipids altersthe lateral composition of lipid rafts in the plasma membrane, thereby altering the ISmicroenvironment to impact thresholds for the activation TCR mediated cell signaling.
The proximal events of cell signaling following Ag recognition by the TCR are initiated bythe localization of signaling molecules into the IS (5). To evaluate the effect of n-3 PUFA onthe localization of select signaling proteins, the percentage of cells with multi-protein signalingcomplexes relocalized to the IS was enumerated by immunofluorescence microscopy.Consistent with a perturbation in lipid raft structure, n-3 PUFA enriched CD4+ T cells exhibiteda suppressed localization of PKCθ, PLCγ-1 and F-actin into the IS (Fig. 4). We also reportedthat PKCθ colocalization with GM1 in anti-CD3 mAb stimulated T cells was suppressed bydietary fish oil and purified DHA ethyl ester administration (12). Although a significant fractionof GM1 can be found outside lo regions (30,42), the dislocation of PKCθ from GM1 enricheddomains may explain in part why PKCθ accumulation at the IS was suppressed by n-3 PUFA,while lipid raft formation was enhanced. In addition, we also show that the localization ofPLCγ-1 and F-actin was selectively suppressed by n-3 PUFA, whereas LAT and CARMA1localization was not altered. In contrast, in a previous study, F-actin, LAT and PKCθlocalization into the IS was not altered by n-3 PUFA (EPA) treatment compared to n-6 PUFA(arachidonic acid) (18). Indeed, both n-3 and n-6 PUFA treatment equally suppressed thelocalization of F-actin, talin, leukocyte function-associated molecule-1α, LAT and CD3ε intothe IS, compared to the saturated stearic acid (18:0) treated control group. The apparentdifferences between these studies may be attributed to the fact that Jurkat human T cells weredirectly incubated with 50 μmol/L fatty acid followed by antigenic stimulation (18).
Since not only the spatial migration but also the phosphorylation status of LAT and PLCγ-1 iscritical for T cell activation (32,33) and dietary FO has been shown to modulate PLCγ-1phosphorylation in rat lymphocytes (43), we counted cells with phospho-specificimmunofluorescent patching in order to assess the activation status of those proteins. Inaccordance with the localization results, LAT phosphorylation was not affected by n-3 PUFA,however PLCγ-1 phosphorylation was suppressed in fat-1 transgenic T cells (Fig. 5). Thesedata indicate that n-3 PUFA selectively modulate the localization and/or activation status ofsignaling proteins in TCR-mediated T cell activation.
The function of the IS is still evolving. For example, membrane condensation and signalingprotein translocation to the IS has been shown to be critical for TCR triggered T cell activation(21). In contrast, compelling data suggest central supramolecular activation cluster (cSMAC)of mature IS may promote TCR/CD3 internalization and recycling (44). In addition, TCRmicroclusters initiate T cell signaling in seconds (45) following binding to peptide-MHCcomplex but the signal becomes weaker when cSMAC is formed in minutes (46,47). Theseobservations suggest that the dynamic nature of the IS and perhaps rapid formation/dissolutionof rafts promote TCR signaling. It is possible, therefore, that n-3 PUFA by stabilizing lipidrafts at the IS disrupt lipid-protein interactions and perturb membrane structure/function.
Alteration of CD4+ T cell lipid raft microdomains and proximal T cell signaling by n-3 PUFAin fat-1 cells resulted in the suppression of proliferation (Fig. 7A and 8), indicating the criticalimportance of lipid raft localization of proteins such as PKCθ, PLCγ-1 and F-actin to TCRsignaling. To test if the mechanism of suppression by n-3 PUFA was limited to the IS orproximal signaling cascades, T cells were stimulated with either anti-CD3/28 mAbs or PMA/Ionomycin to bypass IS formation and TCR mediated signaling, respectively. T cell
Kim et al. Page 8
J Immunol. Author manuscript; available in PMC 2009 November 1.
NIH
-PA Author Manuscript
NIH
-PA Author Manuscript
NIH
-PA Author Manuscript
proliferation by anti-CD3/28 mAbs and PMA/Ionomycin was suppressed as assessed by CFSEprofiles and thymidine uptake, indicating that the down-regulation of T cell proliferation byn-3 PUFA is not limited to TCR-mediated activation. Indeed, CFSE profile analysis revealedthat the largest Δpercentage was associated with the non-dividing parental generation when Tcells were stimulated with the IS forming anti-CD3 hybridoma cell model (Fig. 7), consistentwith a very strong suppression of T cell proliferation. These data are consistent with previousreports that n-3 PUFA are anti-inflammatory and immunomodulatory in vivo (12,48).
In general, hyperactivation of CD4+ T cells is associated with enhanced susceptibility toautoimmune disorders and chronic inflammatory diseases induced diseases (9,10). Recently,our lab reported that fat-1 mice exhibited an enhanced ability to resolve dextran sodiumsulphate-induced intestinal inflammation and injury (25). Since subsets of CD4+ T cells areknown to be critical mediators of chronic inflammation, results from our study may partiallyexplain why n-3 PUFA favorably modulate the inflammation-dysplasia-carcinoma axis.
In conclusion, we have shown that n-3 PUFA promote the formation of lipid rafts and perturbthe reorganization of signaling machinery which is critical to T cell activation. These resultsprovide a critical new paradigm in understanding the molecular mechanisms through whichdietary n-3 PUFA modulate T-cell activation. Additional studies are needed to further elucidatethe effect of dietary n-3 PUFA on T cell signaling networks.
AcknowledgementWe thank J. X. Kang, Department of Medicine, Harvard University, for providing fat-1 breeder mice and L. Zhou forstatistical assistance.
References1. Singer SJ, Nicolson GL. The fluid mosaic model of the structure of cell membranes. Science
1972;175:720–731. [PubMed: 4333397]2. Lingwood D, Simons K. Detergent resistance as a tool in membrane research. Nat Protoc 2007;2:2159–
2165. [PubMed: 17853872]3. Pike LJ. Lipid rafts: heterogeneity on the high seas. Biochem J 2004;378:281–292. [PubMed:
14662007]4. Hanzal-Bayer MF, Hancock JF. Lipid rafts and membrane traffic. FEBS Lett 2007;581:2098–2104.
[PubMed: 17382322]5. Jury EC, Flores-Borja F, Kabouridis PS. Lipid rafts in T cell signalling and disease. Semin Cell Dev
Biol 2007;18:608–615. [PubMed: 17890113]6. Brassard P, Larbi A, Grenier A, Frisch F, Fortin C, Carpentier AC, Fulop T. Modulation of T-cell
signalling by non-esterified fatty acids. Prostaglandins Leukot Essent Fatty Acids 2007;77:337–343.[PubMed: 18042367]
7. Sijben JW, Calder PC. Differential immunomodulation with long-chain n-3 PUFA in health and chronicdisease. Proc Nutr Soc 2007;66:237–259. [PubMed: 17466105]
8. Siddiqui RA, Harvey KA, Zaloga GP, Stillwell W. Modulation of lipid rafts by Omega-3 fatty acidsin inflammation and cancer: implications for use of lipids during nutrition support. Nutr Clin Pract2007;22:74–88. [PubMed: 17242459]
9. Chapkin RS, Davidson LA, Ly L, Weeks BR, Lupton JR, McMurray DN. Immunomodulatory effectsof (n-3) fatty acids: putative link to inflammation and colon cancer. J Nutr 2007;137:200S–204S.[PubMed: 17182826]
10. Chapkin RS, McMurray DN, Lupton JR. Colon cancer, fatty acids and anti-inflammatory compounds.Curr Opin Gastroenterol 2007;23:48–54. [PubMed: 17133085]
11. Zhang P, Kim W, Zhou L, Wang N, Ly LH, McMurray DN, Chapkin RS. Dietary fish oil inhibitsantigen-specific murine Th1 cell development by suppression of clonal expansion. J Nutr2006;136:2391–2398. [PubMed: 16920860]
Kim et al. Page 9
J Immunol. Author manuscript; available in PMC 2009 November 1.
NIH
-PA Author Manuscript
NIH
-PA Author Manuscript
NIH
-PA Author Manuscript
12. Fan YY, Ly LH, Barhoumi R, McMurray DN, Chapkin RS. Dietary docosahexaenoic acid suppressesT cell protein kinase C theta lipid raft recruitment and IL-2 production. J Immunol 2004;173:6151–6160. [PubMed: 15528352]
13. Li Q, Tan L, Wang C, Li N, Li Y, Xu G, Li J. Polyunsaturated eicosapentaenoic acid changes lipidcomposition in lipid rafts. Eur J Nutr 2006;45:144–151. [PubMed: 16133744]
14. Fan YY, McMurray DN, Ly LH, Chapkin RS. Dietary (n-3) polyunsaturated fatty acids remodelmouse T-cell lipid rafts. J Nutr 2003;133:1913–1920. [PubMed: 12771339]
15. Zachowski A. Phospholipids in animal eukaryotic membranes: transverse asymmetry and movement.Biochem J 1993;294(Pt 1):1–14. [PubMed: 8363559]
16. Chow SC, Sisfontes L, Jondal M, Bjorkhem I. Modification of membrane phospholipid fatty acylcomposition in a leukemic T cell line: effects on receptor mediated intracellular Ca2+ increase.Biochim Biophys Acta 1991;1092:358–366. [PubMed: 1646642]
17. Sasaki T, Kanke Y, Kudoh K, Misawa Y, Shimizu J, Takita T. Effects of dietary docosahexaenoicacid on surface molecules involved in T cell proliferation. Biochim Biophys Acta 1999;1436:519–530. [PubMed: 9989281]
18. Geyeregger R, Zeyda M, Zlabinger GJ, Waldhausl W, Stulnig TM. Polyunsaturated fatty acidsinterfere with formation of the immunological synapse. J Leukoc Biol 2005;77:680–688. [PubMed:15703198]
19. Tanner MJ, Hanel W, Gaffen SL, Lin X. CARMA1 coiled-coil domain is involved in theoligomerization and subcellular localization of CARMA1 and is required for T cell receptor-inducedNF-kappaB activation. J Biol Chem 2007;282:17141–17147. [PubMed: 17428801]
20. Chapkin RS, Wang N, Fan YY, Lupton JR, Prior IA. Docosahexaenoic acid alters the size anddistribution of cell surface microdomains. Biochim Biophys Acta 2008;1778:466–471. [PubMed:18068112]
21. Gaus K, Chklovskaia E, Jessup W, Harder T. Condensation of the plasma membrane at the site of Tlymphocyte activation. J Cell Biol 2005;171:121–131. [PubMed: 16203859]
22. Gaus K, Zech T, Harder T. Visualizing membrane microdomains by Laurdan 2-photon microscopy.Molecular membrane biology 2006;23:41–48. [PubMed: 16611579]
23. Rentero C, Zech T, Quinn CM, Engelhardt K, Williamson D, Grewal T, Jessup W, Harder T, GausK. Functional implications of plasma membrane condensation for T cell activation. PLoS ONE2008;3:e2262. [PubMed: 18509459]
24. Kang JX, Wang J, Wu L, Kang ZB. Transgenic mice: fat-1 mice convert n-6 to n-3 fatty acids. Nature2004;427:504. [PubMed: 14765186]
25. Jia Q, Lupton JR, Smith R, Weeks BR, Callaway E, Davidson LA, Kim W, Fan YY, Yang P, NewmanRA, Kang JX, McMurray DN, Chapkin RS. Reduced Colitis-Associated Colon Cancer in Fat-1 (n-3Fatty Acid Desaturase) Transgenic Mice. Cancer Res 2008;68:3985–3991. [PubMed: 18483285]
26. Zidovetzki R, Levitan I. Use of cyclodextrins to manipulate plasma membrane cholesterol content:evidence, misconceptions and control strategies. Biochim Biophys Acta 2007;1768:1311–1324.[PubMed: 17493580]
27. Tamir A, Eisenbraun MD, Garcia GG, Miller RA. Age-dependent alterations in the assembly of signaltransduction complexes at the site of T cell/APC interaction. J Immunol 2000;165:1243–1251.[PubMed: 10903722]
28. Tavano R, Contento RL, Baranda SJ, Soligo M, Tuosto L, Manes S, Viola A. CD28 interaction withfilamin-A controls lipid raft accumulation at the T-cell immunological synapse. Nat Cell Biol2006;8:1270–1276. [PubMed: 17060905]
29. Quah BJ, Warren HS, Parish CR. Monitoring lymphocyte proliferation in vitro and in vivo with theintracellular fluorescent dye carboxyfluorescein diacetate succinimidyl ester. Nat Protoc2007;2:2049–2056. [PubMed: 17853860]
30. Owen DM, Neil MA, French PM, Magee AI. Optical techniques for imaging membrane lipidmicrodomains in living cells. Semin Cell Dev Biol 2007;18:591–598. [PubMed: 17728161]
31. Gaide O, Favier B, Legler DF, Bonnet D, Brissoni B, Valitutti S, Bron C, Tschopp J, Thome M.CARMA1 is a critical lipid raft-associated regulator of TCR-induced NF-kappa B activation. NatImmunol 2002;3:836–843. [PubMed: 12154360]
Kim et al. Page 10
J Immunol. Author manuscript; available in PMC 2009 November 1.
NIH
-PA Author Manuscript
NIH
-PA Author Manuscript
NIH
-PA Author Manuscript
32. Reynolds LF, de Bettignies C, Norton T, Beeser A, Chernoff J, Tybulewicz VL. Vav1 transduces Tcell receptor signals to the activation of the Ras/ERK pathway via LAT, Sos, and RasGRP1. J BiolChem 2004;279:18239–18246. [PubMed: 14764585]
33. Moore AL, Roe MW, Melnick RF, Lidofsky SD. Calcium mobilization evoked by hepatocellularswelling is linked to activation of phospholipase Cgamma. J Biol Chem 2002;277:34030–34035.[PubMed: 12167665]
34. Shaikh SR, Edidin M. Polyunsaturated fatty acids, membrane organization, T cells, and antigenpresentation. Am J Clin Nutr 2006;84:1277–1289. [PubMed: 17158407]
35. Shaikh SR, Edidin MA. Membranes are not just rafts. Chem Phys Lipids 2006;144:1–3. [PubMed:16945359]
36. Shaikh SR, Cherezov V, Caffrey M, Stillwell W, Wassall SR. Interaction of cholesterol with adocosahexaenoic acid-containing phosphatidylethanolamine: trigger for microdomain/raftformation? Biochemistry 2003;42:12028–12037. [PubMed: 14556634]
37. Wassall SR, Stillwell W. Docosahexaenoic acid domains: the ultimate non-raft membrane domain.Chem Phys Lipids 2008;153:57–63. [PubMed: 18343224]
38. Soni SP, LoCascio DS, Liu Y, Williams JA, Bittman R, Stillwell W, Wassall SR. Docosahexaenoicacid enhances segregation of lipids between : 2H-NMR study. Biophys J 2008;95:203–214. [PubMed:18339742]
39. Ma DW, Ngo V, Huot PS, Kang JX. N-3 polyunsaturated fatty acids endogenously synthesized infat-1 mice are enriched in the mammary gland. Lipids 2006;41:35–39. [PubMed: 16555469]
40. Stulnig TM, Berger M, Sigmund T, Raederstorff D, Stockinger H, Waldhausl W. Polyunsaturatedfatty acids inhibit T cell signal transduction by modification of detergent-insoluble membranedomains. J Cell Biol 1998;143:637–644. [PubMed: 9813086]
41. Pike LJ, Han X, Gross RW. Epidermal growth factor receptors are localized to lipid rafts that containa balance of inner and outer leaflet lipids: a shotgun lipidomics study. J Biol Chem 2005;280:26796–26804. [PubMed: 15917253]
42. Blank N, Schiller M, Krienke S, Wabnitz G, Ho AD, Lorenz HM. Cholera toxin binds to lipid raftsbut has a limited specificity for ganglioside GM1. Immunol Cell Biol 2007;85:378–382. [PubMed:17325693]
43. Sanderson P, Calder PC. Dietary fish oil appears to prevent the activation of phospholipase C-gammain lymphocytes. Biochim Biophys Acta 1998;1392:300–308. [PubMed: 9630688]
44. Lee KH, Dinner AR, Tu C, Campi G, Raychaudhuri S, Varma R, Sims TN, Burack WR, Wu H, WangJ, Kanagawa O, Markiewicz M, Allen PM, Dustin ML, Chakraborty AK, Shaw AS. Theimmunological synapse balances T cell receptor signaling and degradation. Science 2003;302:1218–1222. [PubMed: 14512504]
45. Huse M, Klein LO, Girvin AT, Faraj JM, Li QJ, Kuhns MS, Davis MM. Spatial and temporal dynamicsof T cell receptor signaling with a photoactivatable agonist. Immunity 2007;27:76–88. [PubMed:17629516]
46. Mossman KD, Campi G, Groves JT, Dustin ML. Altered TCR signaling from geometricallyrepatterned immunological synapses. Science 2005;310:1191–1193. [PubMed: 16293763]
47. Varma R, Campi G, Yokosuka T, Saito T, Dustin ML. T cell receptor-proximal signals are sustainedin peripheral microclusters and terminated in the central supramolecular activation cluster. Immunity2006;25:117–127. [PubMed: 16860761]
48. Ly LH, Smith R 3rd, Chapkin RS, McMurray DN. Dietary n-3 polyunsaturated fatty acids suppresssplenic CD4(+) T cell function in interleukin (IL)-10(−/−) mice. Clin Exp Immunol 2005;139:202–209. [PubMed: 15654818]
Kim et al. Page 11
J Immunol. Author manuscript; available in PMC 2009 November 1.
NIH
-PA Author Manuscript
NIH
-PA Author Manuscript
NIH
-PA Author Manuscript
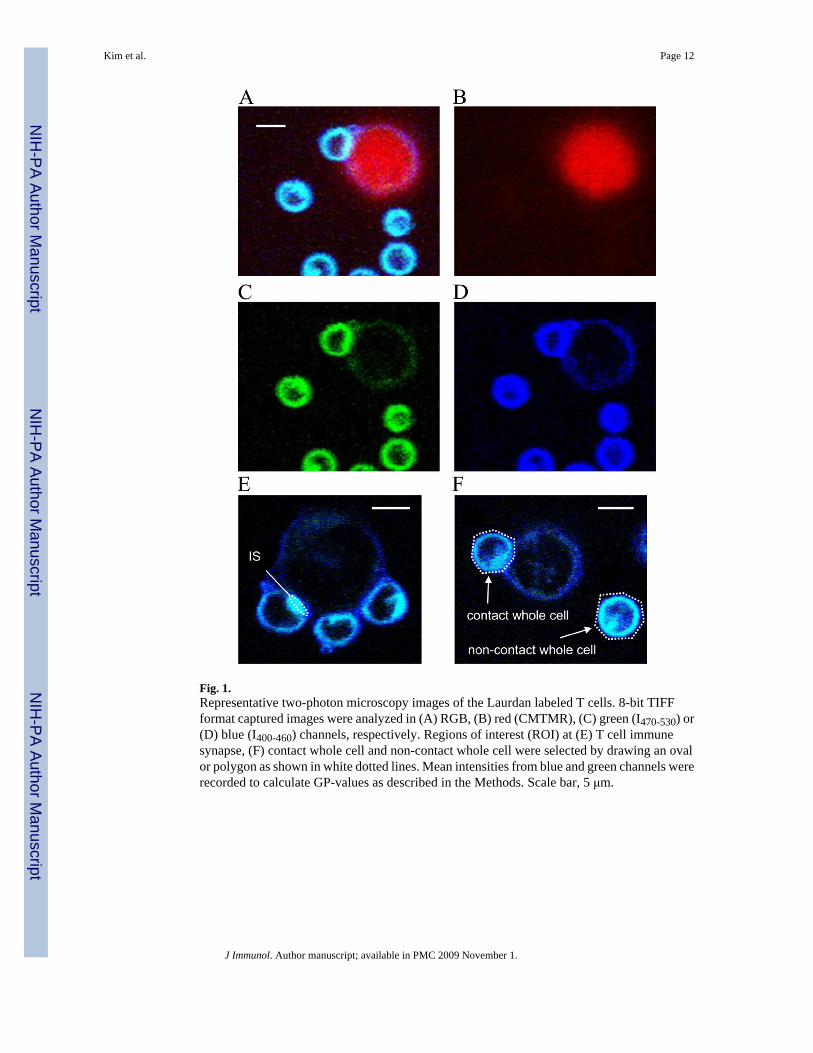
Fig. 1.Representative two-photon microscopy images of the Laurdan labeled T cells. 8-bit TIFFformat captured images were analyzed in (A) RGB, (B) red (CMTMR), (C) green (I470-530) or(D) blue (I400-460) channels, respectively. Regions of interest (ROI) at (E) T cell immunesynapse, (F) contact whole cell and non-contact whole cell were selected by drawing an ovalor polygon as shown in white dotted lines. Mean intensities from blue and green channels wererecorded to calculate GP-values as described in the Methods. Scale bar, 5 μm.
Kim et al. Page 12
J Immunol. Author manuscript; available in PMC 2009 November 1.
NIH
-PA Author Manuscript
NIH
-PA Author Manuscript
NIH
-PA Author Manuscript
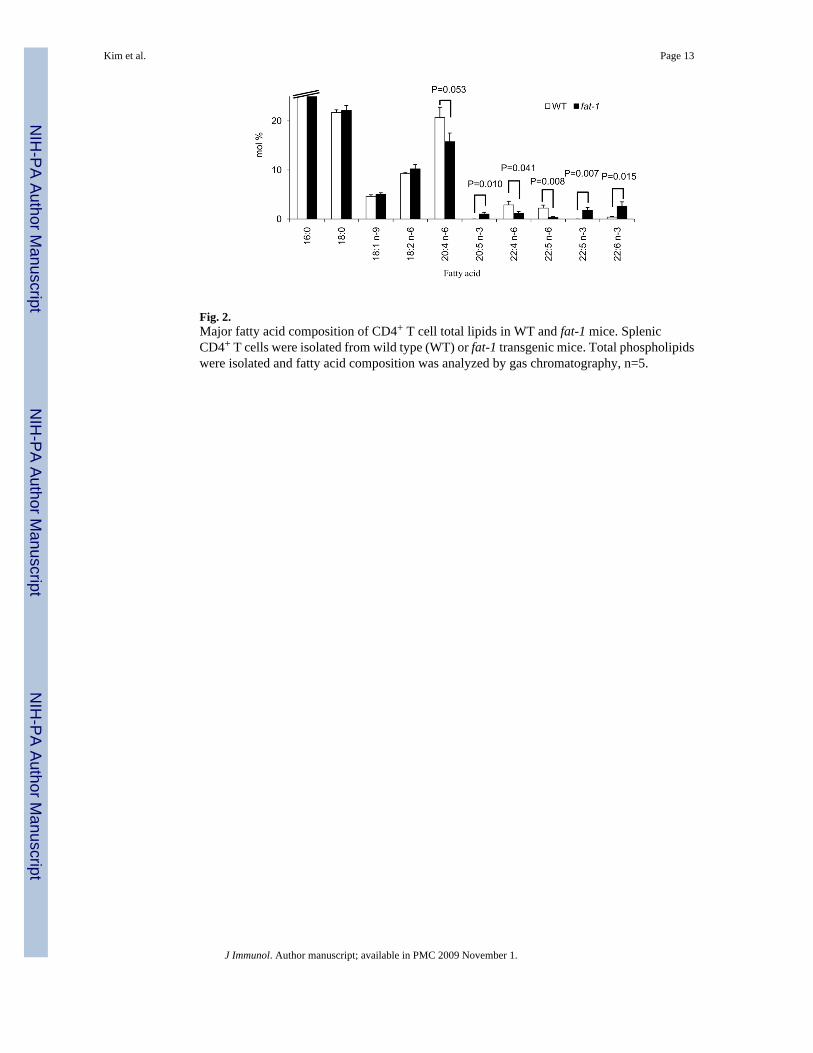
Fig. 2.Major fatty acid composition of CD4+ T cell total lipids in WT and fat-1 mice. SplenicCD4+ T cells were isolated from wild type (WT) or fat-1 transgenic mice. Total phospholipidswere isolated and fatty acid composition was analyzed by gas chromatography, n=5.
Kim et al. Page 13
J Immunol. Author manuscript; available in PMC 2009 November 1.
NIH
-PA Author Manuscript
NIH
-PA Author Manuscript
NIH
-PA Author Manuscript
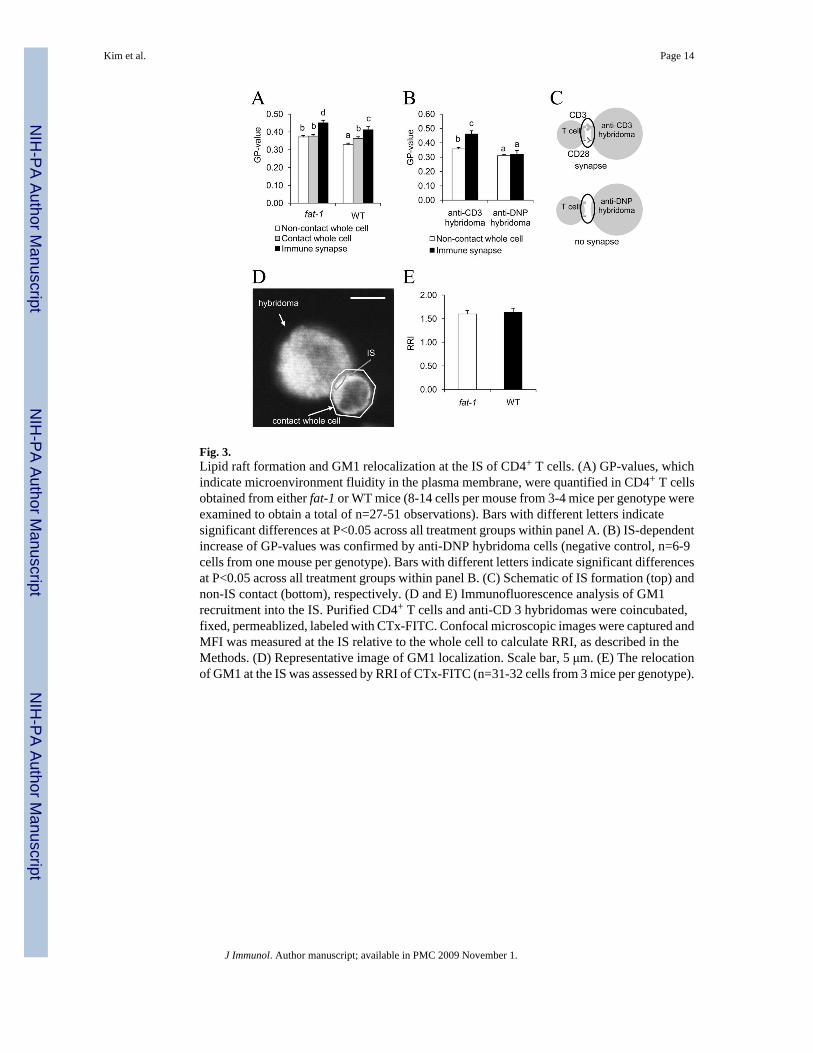
Fig. 3.Lipid raft formation and GM1 relocalization at the IS of CD4+ T cells. (A) GP-values, whichindicate microenvironment fluidity in the plasma membrane, were quantified in CD4+ T cellsobtained from either fat-1 or WT mice (8-14 cells per mouse from 3-4 mice per genotype wereexamined to obtain a total of n=27-51 observations). Bars with different letters indicatesignificant differences at P<0.05 across all treatment groups within panel A. (B) IS-dependentincrease of GP-values was confirmed by anti-DNP hybridoma cells (negative control, n=6-9cells from one mouse per genotype). Bars with different letters indicate significant differencesat P<0.05 across all treatment groups within panel B. (C) Schematic of IS formation (top) andnon-IS contact (bottom), respectively. (D and E) Immunofluorescence analysis of GM1recruitment into the IS. Purified CD4+ T cells and anti-CD 3 hybridomas were coincubated,fixed, permeablized, labeled with CTx-FITC. Confocal microscopic images were captured andMFI was measured at the IS relative to the whole cell to calculate RRI, as described in theMethods. (D) Representative image of GM1 localization. Scale bar, 5 μm. (E) The relocationof GM1 at the IS was assessed by RRI of CTx-FITC (n=31-32 cells from 3 mice per genotype).
Kim et al. Page 14
J Immunol. Author manuscript; available in PMC 2009 November 1.
NIH
-PA Author Manuscript
NIH
-PA Author Manuscript
NIH
-PA Author Manuscript
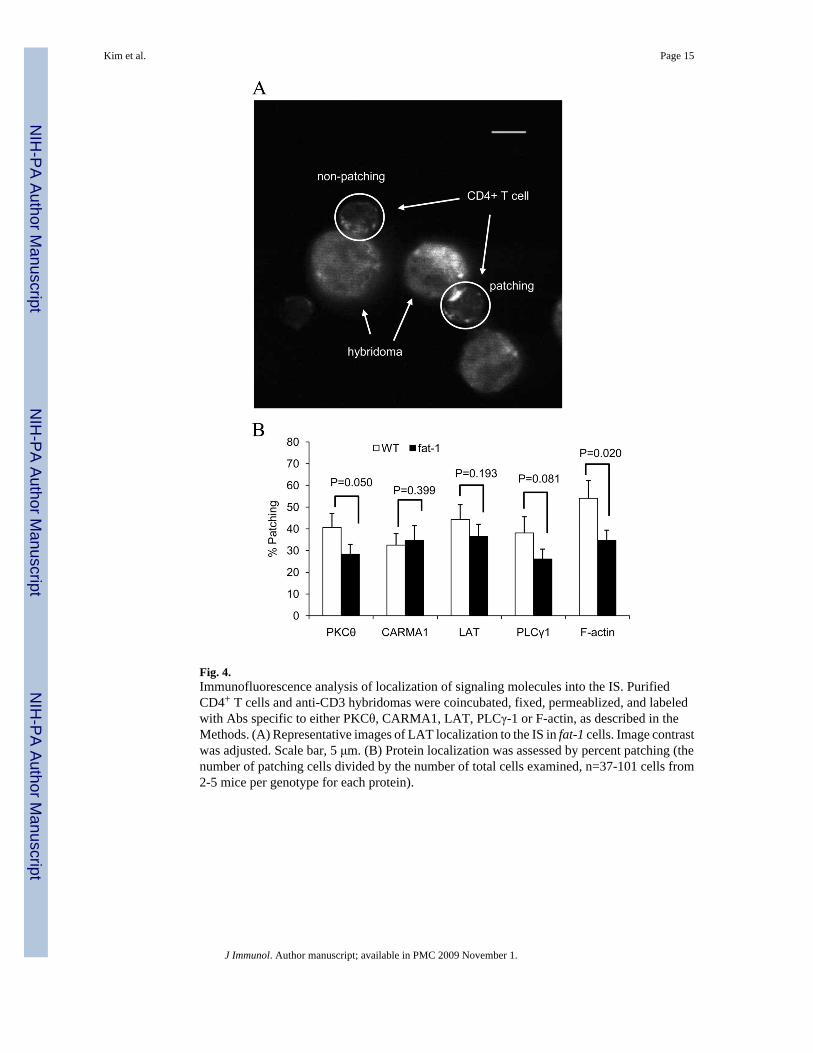
Fig. 4.Immunofluorescence analysis of localization of signaling molecules into the IS. PurifiedCD4+ T cells and anti-CD3 hybridomas were coincubated, fixed, permeablized, and labeledwith Abs specific to either PKCθ, CARMA1, LAT, PLCγ-1 or F-actin, as described in theMethods. (A) Representative images of LAT localization to the IS in fat-1 cells. Image contrastwas adjusted. Scale bar, 5 μm. (B) Protein localization was assessed by percent patching (thenumber of patching cells divided by the number of total cells examined, n=37-101 cells from2-5 mice per genotype for each protein).
Kim et al. Page 15
J Immunol. Author manuscript; available in PMC 2009 November 1.
NIH
-PA Author Manuscript
NIH
-PA Author Manuscript
NIH
-PA Author Manuscript
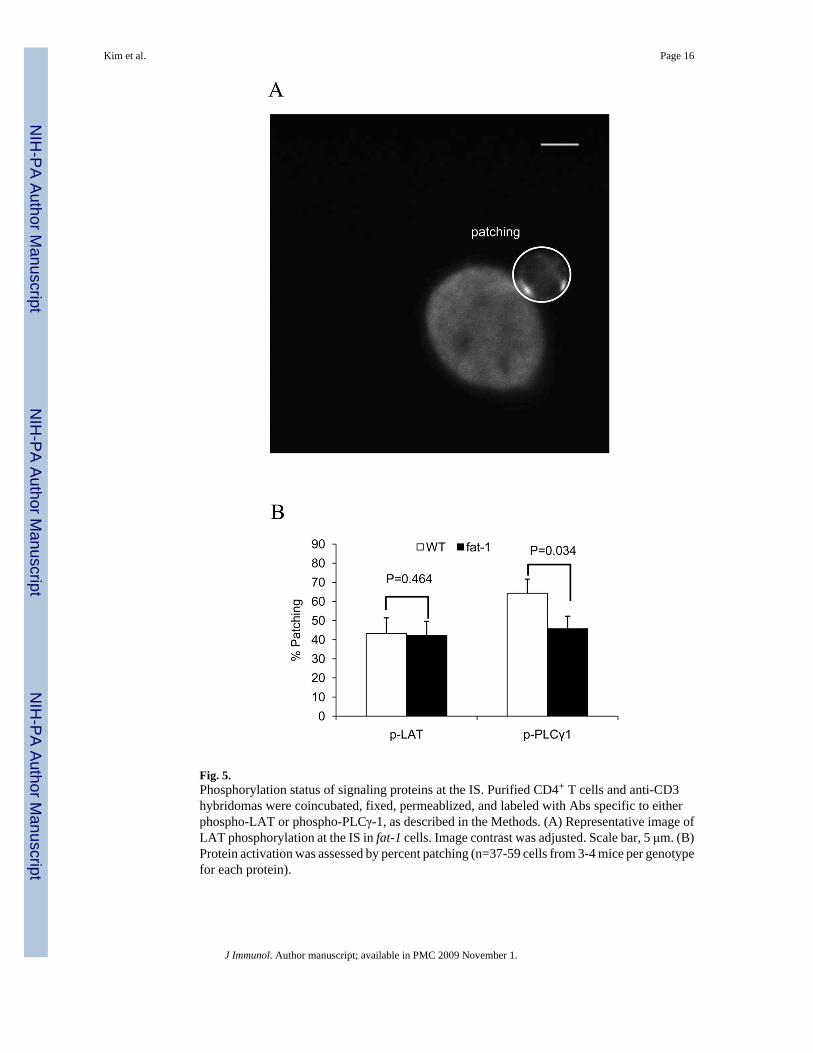
Fig. 5.Phosphorylation status of signaling proteins at the IS. Purified CD4+ T cells and anti-CD3hybridomas were coincubated, fixed, permeablized, and labeled with Abs specific to eitherphospho-LAT or phospho-PLCγ-1, as described in the Methods. (A) Representative image ofLAT phosphorylation at the IS in fat-1 cells. Image contrast was adjusted. Scale bar, 5 μm. (B)Protein activation was assessed by percent patching (n=37-59 cells from 3-4 mice per genotypefor each protein).
Kim et al. Page 16
J Immunol. Author manuscript; available in PMC 2009 November 1.
NIH
-PA Author Manuscript
NIH
-PA Author Manuscript
NIH
-PA Author Manuscript
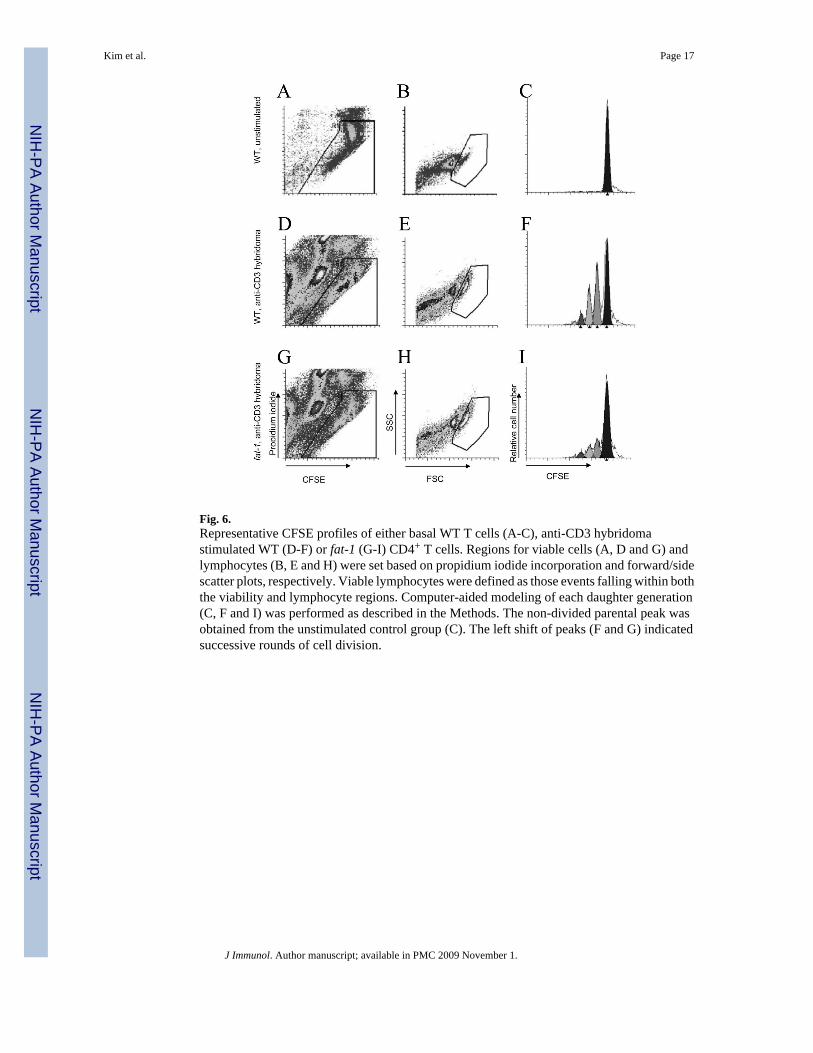
Fig. 6.Representative CFSE profiles of either basal WT T cells (A-C), anti-CD3 hybridomastimulated WT (D-F) or fat-1 (G-I) CD4+ T cells. Regions for viable cells (A, D and G) andlymphocytes (B, E and H) were set based on propidium iodide incorporation and forward/sidescatter plots, respectively. Viable lymphocytes were defined as those events falling within boththe viability and lymphocyte regions. Computer-aided modeling of each daughter generation(C, F and I) was performed as described in the Methods. The non-divided parental peak wasobtained from the unstimulated control group (C). The left shift of peaks (F and G) indicatedsuccessive rounds of cell division.
Kim et al. Page 17
J Immunol. Author manuscript; available in PMC 2009 November 1.
NIH
-PA Author Manuscript
NIH
-PA Author Manuscript
NIH
-PA Author Manuscript
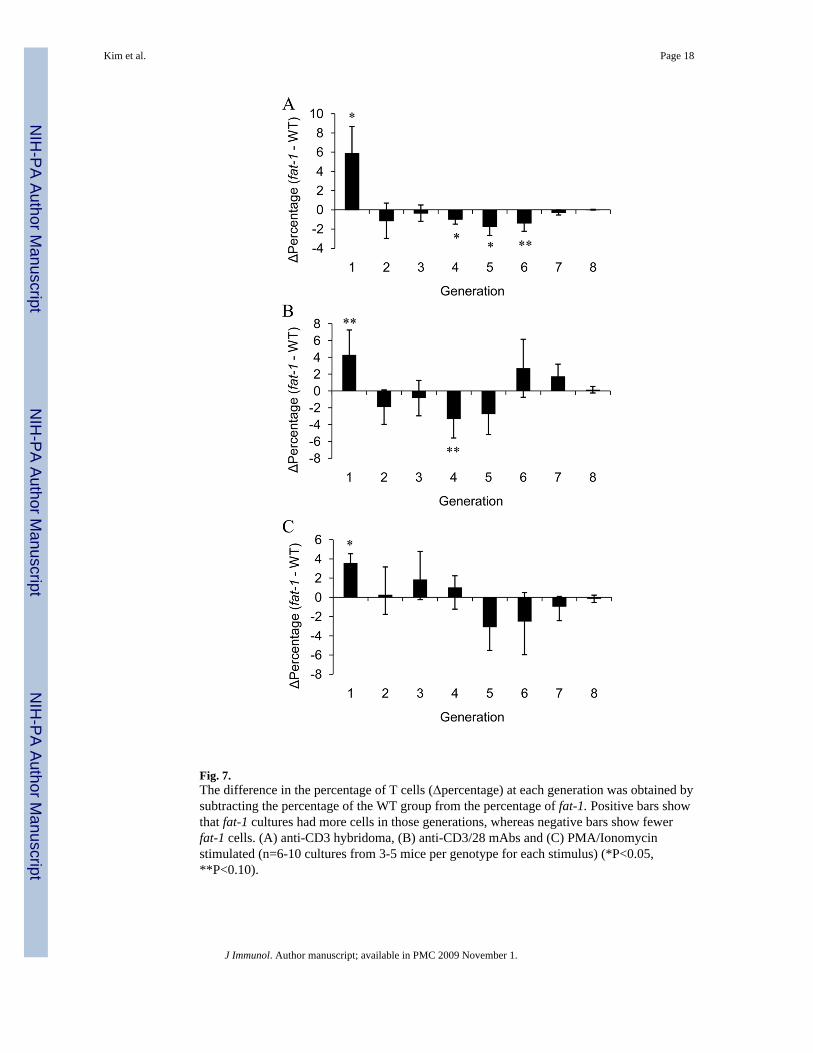
Fig. 7.The difference in the percentage of T cells (Δpercentage) at each generation was obtained bysubtracting the percentage of the WT group from the percentage of fat-1. Positive bars showthat fat-1 cultures had more cells in those generations, whereas negative bars show fewerfat-1 cells. (A) anti-CD3 hybridoma, (B) anti-CD3/28 mAbs and (C) PMA/Ionomycinstimulated (n=6-10 cultures from 3-5 mice per genotype for each stimulus) (*P<0.05,**P<0.10).
Kim et al. Page 18
J Immunol. Author manuscript; available in PMC 2009 November 1.
NIH
-PA Author Manuscript
NIH
-PA Author Manuscript
NIH
-PA Author Manuscript
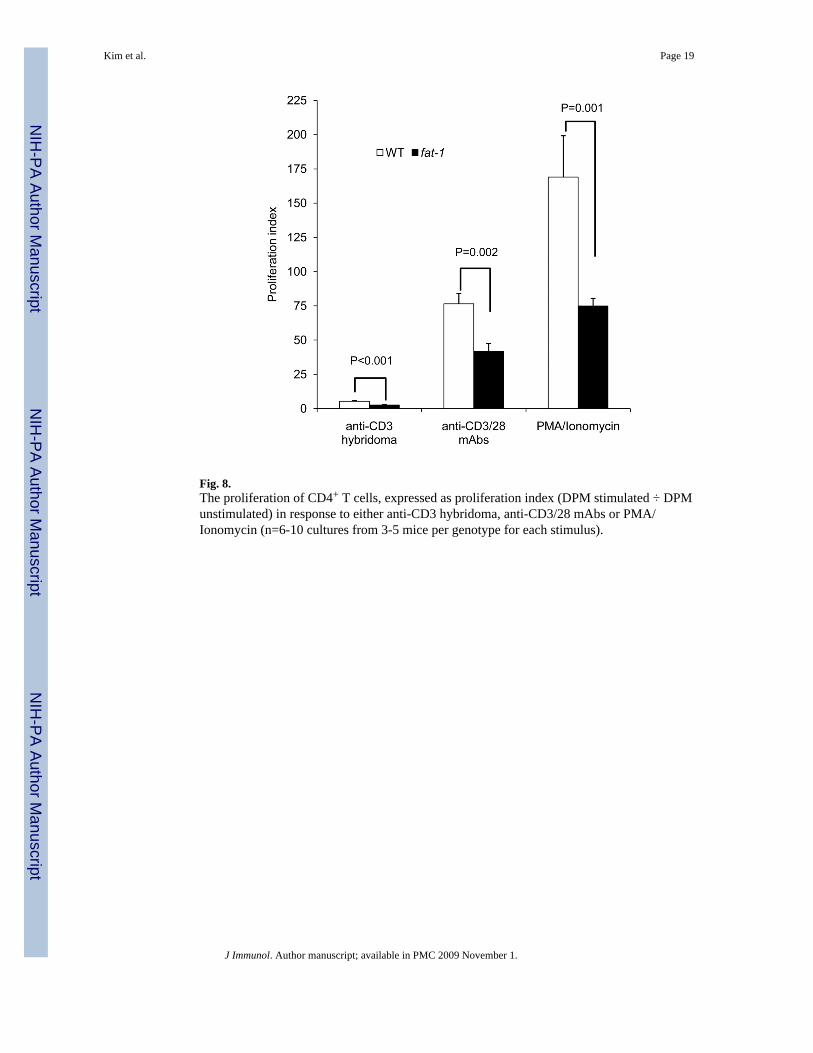
Fig. 8.The proliferation of CD4+ T cells, expressed as proliferation index (DPM stimulated ÷ DPMunstimulated) in response to either anti-CD3 hybridoma, anti-CD3/28 mAbs or PMA/Ionomycin (n=6-10 cultures from 3-5 mice per genotype for each stimulus).
Kim et al. Page 19
J Immunol. Author manuscript; available in PMC 2009 November 1.
NIH
-PA Author Manuscript
NIH
-PA Author Manuscript
NIH
-PA Author Manuscript
Copyright © 2022 FDOKUMEN