MY PROJECT WORK
105
UNIVERSITY OF PROFESSIONAL STUDIES EVALUATING THE RELATIONSHIP BETWEEN INTERNAL CONTROL MEASURES AND PERFORMANCE IN THE TRANSPORTATION SECTOR IN GHANA: A CASE STUDY OF METRO MASS TRANSIT LIMITED BY GROUP 67 NAMES ID DONKOR GODWIN 10BAW203 ISSAH YAHAYA 10BAW210 OWUSU GORDON MENSAH 10BAW201 A DISSERTATION PRESENTED TO THE DEPARTMENT OF ACCOUNTING OF FACULTY OF ACCOUNTING AND FINANCE, UNIVERSITY OF PROFESSIONAL
-
Upload
koforiduapolytechnic -
Category
Documents
-
view
0 -
download
0
Transcript of MY PROJECT WORK

UNIVERSITY OF PROFESSIONAL STUDIES
EVALUATING THE RELATIONSHIP BETWEENINTERNAL CONTROL MEASURES AND PERFORMANCEIN THE TRANSPORTATION SECTOR IN GHANA: ACASE STUDY OF METRO MASS TRANSIT LIMITED
BY
GROUP 67
NAMES ID
DONKOR GODWIN 10BAW203
ISSAH YAHAYA 10BAW210
OWUSU GORDON MENSAH 10BAW201
A DISSERTATION PRESENTED TO THE DEPARTMENT OF ACCOUNTING OF
FACULTY OF ACCOUNTING AND FINANCE, UNIVERSITY OF PROFESSIONAL

STUDIES, ACCRA, IN PARTIAL FULFILLMENT OF THE REQUIREMENTS FOR
THE AWARD OF BACHELOR OF SCIENCE (BSC) DEGREE IN ACCOUNTING
JUNE 2013
CANDIDATE’S DECLARATION
We, the undersigned do hereby declare that this Dissertation is
the result of our own original research and that no part of it
has been presented for another degree in any university. However,
all sources of borrowed materials have been duly acknowledged.
NAMES SIGN
DATE
DONKOR GODWIN ………………….
……………
ISSAH YAHAYA ………………….
……………

OWUSU GORDON MENSAH ………………….
……………
I
SUPERVISOR’S DECLARATION
I declare that the preparation and the presentation of this
Dissertation were in accordance with the guidelines on
supervision of Dissertation laid by the University of
Professional Studies.

Sign……………………………………………….
Name……………………………………………..
Date……………………………………………….
II

DEDICATION
To our families and friends for their love, support and
encouragement throughout our academic studies in the university.
We humbly dedicate this work to all of them.
III
ACKNOWLEDGEMENT
The research team wishes to express their sincerest gratitude
first to God Almighty for His grace and mercies and good health
that He has shown to us throughout our stay in the University of
Professional Studies.
We would like to express thanks for the many useful comments and
suggestions provided by our supervisor, Mr. Timothy King Avordey,
and colleagues who reviewed all or portions of this project work
during its development.
Our appreciation also goes to the management of Metro Mass
Transit Limited who assisted the research team in their data
collection efforts especially Mr. Kwame Obeng the assistant
managing director.
IV
ABSTRACT
The study analysed internal control measures and its performance
in the transportation industry; a case of Metro Mass Transit
Limited (MMT), Accra. The study specifically, found out the
internal control system put in place by the MMT, ascertained the
level of effectiveness of the internal control system in place,
assessed the challenges facing the MMT in its attempt to
implement existing controls, and to determine the level of
performance given its controls. Although examples of successful

BRT systems abound, the same cannot be said in Ghana’s case. The
research design was a case study. The target population of 5000
from which a sample frame of 200 was drawn comprising employees
and passengers of MMT at the Kaneshie terminal, Accra. Sampling
method used was simple random sampling whilst the research
instrument used was a closed-ended questionnaire. Data collected
was analysed with SPSS. Even though the MMT had lots of controls
in place; it had serious challenges implementing them.
Nonetheless, passengers rated their performance high in exception
of a few areas begging for improvement. The MMT might improve
further, if it is to widen its portfolio of controls, work on
motivation and commitment and finally benchmark or adopt proven
innovative ways of loading.

V
LIST OF TABLES
Table 1:4.1: Gender of Respondents ………………………………………………………….37
Table 2:4.2: Age of Respondents ……………………………………………………………..38
Table 3:4.3. Marital Status of Respondents
…………………………………………………..38
Table 4:4.4: Educational Level of Respondents ………………………………………………
39
Table 5:4.5: Period of Service of
Respondents………………………………………………..40
Table 6:4.6: Transportation Qualification of
Respondents…………………………………….40
Table 7:4.7: Are Internal Ccontrols in place in Metro Mass
Transit Limited? ..........................41
Table 8:4.8: Challenges Facing MMT in implementing its internal
controls………………….43
Table 9:4.9: The Level of Effectiveness of the Internal Control
System………………………45
Table 10:4.10 Determination of the Level of
Performance……………………………………48

VI
LIST OF ACRONYM
COSO : Committee of Sponsoring Organisation
COBIT: Control Objectives for Information and Related
Technology
CO2: Carbon Dioxide
BRT: Bus Rapid Transit

INTOSAI: International Organisation of Supreme Auditing
Institutions
IT: Information Technology
JCI: Johannesburg Consolidated
Investment
MMT: Metro Mass Transit
MDG: Millennium Development goals
MFI; Monetary Financial Institution
MIS: Management Information System
OSA: Omnibus Service Authority
SOX: Sarbanes-Oxley
STC: State Transport Corporation
VII
TABLE OF CONTENTS
CONTENT PAGE
CANDIDATES’ DECLARATION……………………………………………………. I
SUPERVISOR’S DECLARATION…………………………………………………....II
DEDICATION…………………………………………………………………………...III
ACKNOWLEDGEMENT………………………………………………………………IV
ABSTRACT………………………………………………………………………………V
LIST OF TABLES……………………………………………………………………….VI
LIST OF ACRONYMS…………………………………………………………………VII
CHAPTER ONE: INTRODUCTION……………………………………………………. 1
1.1 Background of the Study……………………………………………………………….. 1
1.2 Statement of the Problem……………………………………………………………….. 7
1.3 Objectives of the Research……………………………………………………………… 8
1.4 Research Questions……………………………………………………………………... 8
1.5 Significance of the Research……………………………………………………………. 9
1.6 Scope and Organisation of the Study…………………………………………………… 9
CHAPTER TWO: INTRODUCTION………………………………………………….11

2.0 Literature review………………………………………………………………………11
2.1 Theoretical Literature…………………………………………………………………..11
2.1.1 Concept of Internal Control…………………………………………………………... 12
2.1.2 Components of Internal Control Systems……………………………………………..
13
2.1.3 Objectives of Internal Control………………………………………………………… 17
2.1.4 The Need for Internal Control………………………………………………………… 17
2.1.5 Limitations on Internal Control
Effectiveness……………………………………….. 18
2.1.6 Processes and Models in Mass Transportation…………………………………………
20
2.1.7 Organisation Performance………………………………………………………….......24
2.2.0 Empirical Literature………………………………………………………………….. 26
2.2.1 Successful Bus Rapid Transit Systems around the
World……………………………..27
2.2.2 Relationship between internal control and organizational
performance……………….29
2.3 Operational Definition of Terms and
Constructs………………………………………...31
CHAPTER THREE: INTRODUCTION…………………………………………………32
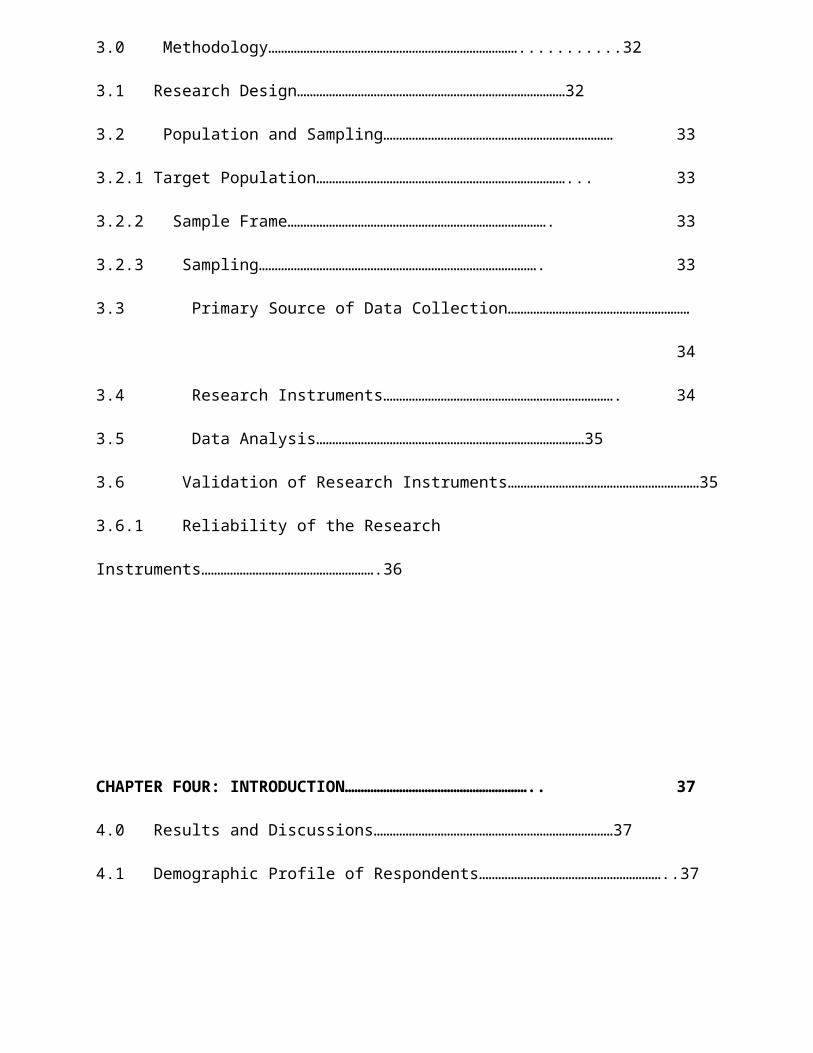
3.0 Methodology……………………………………………………………………...........32
3.1 Research Design…………………………………………………………………………32
3.2 Population and Sampling……………………………………………………………… 33
3.2.1 Target Population……………………………………………………………………... 33
3.2.2 Sample Frame………………………………………………………………………. 33
3.2.3 Sampling……………………………………………………………………………. 33
3.3 Primary Source of Data Collection…………………………………………………
34
3.4 Research Instruments………………………………………………………………. 34
3.5 Data Analysis…………………………………………………………………………35
3.6 Validation of Research Instruments……………………………………………………35
3.6.1 Reliability of the Research
Instruments……………………………………………….36
CHAPTER FOUR: INTRODUCTION………………………………………………….. 37
4.0 Results and Discussions…………………………………………………………………37
4.1 Demographic Profile of Respondents…………………………………………………..37

4.2 Are Internal Ccontrols in place in Metro Mass Transit
Limited? ...................................41
4.3 Assessment of the Challenges facing Metro Mass Transit in
implementing its Internal
Controls………………………………………………………………………………………43
4.4 The Level of Effectiveness of the Internal Control
System at Metro Mass Transit
Limited..........................................................
.............................................................45
4.4.1 Internal Audit……………………………………………………………………….46
4.4.2 Human Resource Controls…………………………………………………………..46
4.4.3 Controls Against Asset Loss………………………………………………………..46
4.4.4 Controls Against Ticketing Fraud…………………………………………………..47
4.4.5 Commitment from Top Management to implement Laws and
Regulations………..47
4.4.6 Willingness to Apply Sanctions for Failure to Ensure
Compliance…………………47
4.5 Determination of the Level of Performance in Metro Mass
Transit Limited……….48
4.5.1 Performance in Customer Service…………………………………………………...49

4.5.1 Ticketing…………………………………………………………………………….49
4.5.3 Fleet Maintenance……………………………………………………………………50
4.5.4 General Performance…………………………………………………………………50
4.5.5 Effectiveness in Solving Ghana’s Road Transport
Problems…………………………50
4.5.6 Departure and Arrival Times…………………………………………………………..51
4.5.7 Overloading……………………………………………………………………………51
CHAPTER FIVE INTRODUCTION
…................................................................
...........53
5.0 Conclusions and recommendations…………………………………………………….53
5.1 Summary of Results…………………………………………………………………… 54
5.2 Recommendations…………………………………………………………………… 54
5.3 Limitations of the Study……………………………………………………………….. 55
5.4 Further Studies………………………………………………………………………… 56
REFERENCES
APPENDIX A: QUESTIONNAIRE

CHAPTER ONE
1.0 INTRODUCTION
1.1 Background of the Study
In the past, people used to walk or use animals for
mobility. Transportation development came after European
colonization to Africa. They came to Africa in the 1400s for
the first time (George, 1958). There were well aligned and
extensively networked roads during the 1600s. These roads
were also used to transport slaves in the trans-Atlantic
slave era (Fage, 1969). Horse-drawn carts or ox-drawn carts
were used to transport slaves (Muhammad, 2003). In the
colonial era of Africa, there was a decline in interest in
road construction due to the Europeans interest to develop
rail transport for their raw material mobility. They focused
on rail transport due to the huge cost of investment needed
in creating road facilities (Thomas, 1973). They invested in
railways because it would return them highest profits of
their investments. So the road transport was neglected

When transport systems are deficient in terms of capacity or
reliability, they can have an economic cost such as reduced or
missed opportunities. Efficient transportation reduces costs,
while inefficient transportation increases costs. The impacts of
transportation are not always intended, and can have unforeseen
or unintended consequences such as congestion. Transport also
carries an important social and environmental load, which cannot
be neglected. (Rodrigue & Notteboom, 1998). Man, nations, regions
and the world would be severely limited in development without
transportation, which is a key factor for physical and economic
growth (Oyesiku, 2002). According to Bailey et al (2008),
transportation route is part of distinct development pattern or
road network and mostly described by regular street patterns as
an indispensable factor of human existence, development and
civilization. The route network coupled with increased transport
investment result in changed levels of accessibility reflected
through Cost Benefit Analysis, savings in travel time, and other
benefits. These benefits are noticeable in increased catchment
areas for services and facilities like shops, schools, offices,
banks, and leisure activities.

According to Oyesiku (2002), urbanization in Nigeria has a long
history in its growth and development. Extensive development
being a feature of the 19th and 20th centuries, with concentration
of economic and administrative decision-making in Lagos, Ibadan,
Kaduna, Jos, and Enugu, and high degree of specialization and
larger population associated with greater specialization of goods
and services. Wyatt (1997) states that urban areas have tendency
to develop at nodal points in transport network and places with
good road network will possess relative advantage over locations
having poor network. Urban locations with such relative advantage
are found where different transport routes converge with high
degree of compactness,
connectivity, density, length and accessibility exhibited within
the intra- and inter- urban road networks.
According to the United Nations Economic and Social Council,
Economic Commission for Africa (2009) sustainable economic growth
and poverty reduction address a complex set of issues that call
for the development of all sectors of the economy to meet the
needs of the current generation without compromising the long-

term needs of future generations. Transport is one of the key
sectors that play crucial roles in achieving the goals of poverty
eradication and sustainable development. The transport sector is
very much linked and influences developments in other sectors of
the economy. Indeed, it affects attainment of all eight
Millennium Development Goals (MDGs).
Most African countries face huge costs associated with
transportation. In accessing foreign markets, on average,
Africa’s transport and insurance costs represent 30 per cent of
the total value of exports, which compares unfavourably with 8.6
per cent for all developing countries. Although most share the
problem of high transport costs, landlocked countries face the
most excessive transport costs recorded on the continent, United
Nations Economic and Social Council, Economic Commission for
Africa (2009).
The first Bus Rapid Transit (BRT) system was the Rede Integrada
de Transporte in Curitiba, Brazil (translated as 'Integrated
Transportation Network') which entered service in 1974, which
inspired the respected TransMilenio in Bogota, Colombia (opened
2000) and subsequently many other systems around the world.

In 1927, the Accra Town Council operated bus services in Accra,
Kumasi, Sekondi–Takoradi and Obuasi. Governments over the years
have established bus service companies such as the Omnibus
Services Authority (OSA), State Transport company (STC), City
Express Services (CES), and lately Metro Mass Transit (MMT)
Limited for various reasons including government
social obligations, environmental factors, energy considerations
and the promotion of efficient public transportation to increase
productivity and economic growth. Notable among the transport
operators in the informal sector in the 1980s was King of Kings
Limited. Its bus operation, which was heavily patronized, was
concentrated mainly on the Odorkor–Accra corridor.
The introduction of Metro Mass Transit Limited buses to the
existing ones has somehow eased passenger congestion during rush
hours along the roads across both the urban cities and rural
areas. Metro Mass Transit Limited has its headquarters at
Kaneshie, a suburb of Accra, and the various other terminals
across the regions. Metro Mass Transit (MMT) Limited was
introduced between 2001 and 2004 by the then government in place
who thought of strengthening the inadequate bus transportation

system already in place in the country. The Metro Mass Transit
Limited was officially incorporated in March 2003, as a limited
liability company under the Companies Act 1963, Act 179 to
provide safe, affordable, efficient and reliable movement of
commuters within the metropolitan and municipal areas. The
shareholders include State Insurance Company (SIC), National
Investment Bank (NIB), Ghana Oil Company Limited (GOIL),
Agriculture Development Bank (ADB), Prudential Bank (PB) and
Social Security and National Insurance Trust (SSNIT). These
together have 55% shareholding. The Government of Ghana holds the
remaining 45% shares.
In general, Metro Mass Transit Limited wants to set up a public
transport system, an integrated network of scheduled buses. A
public transport system interlinking residential areas, business
districts, Central bus terminals, suburbs and villages in a
reliable, efficient, safe and affordable way. The focus of Metro
Mass Transit Limited is presently on the short and medium
distances, i.e. intra-city transport (Metro Mass Transit Limited,
2012). Metro Mass Transit Limited aims to co-operate with the
Government to ensure that the pilot Bus Rapid Transit System
(BRTS)

succeeds. A Bus Rapid Transit System is the solution for heavily
congested areas in the regional capitals of Ghana and that is why
the proposed system will be copied to other relevant areas.
However, Metro Mass Transit Limited has not been without
problems. Some of which as reported by Gariba, C. A (2011) are;
(i) They have relatively reliable departure times but there are
instances where one can get delayed for an hour or two.
(ii) Some management practices being adopted by the officials of
the Metro Mass Transit buses are defeating the purpose of the
buses thus making life very uncomfortable for travelers.
(iii) Passengers travelling on the Metro Mass buses have always
been frustrated regarding the period of time they have to spend
joining long queues in anticipation of getting a ticket to buy.
Internal controls are put in place to keep organizations on
course towards profitability goals and achievement of its mission
and to minimize surprise along the way. They enable management to
deal with rapidly changing economic and competitive environment,
shifting customer demands and priorities and restructuring for
future growth. Internal controls promote efficiency, reduce risks
of asset loss and help to ensure the reliability of financial
statements and compliance with laws and regulations (COSO, 1992).
At the end of the research, the researcher intend to identify
additional internal controls to enable Metro Mass Transit Limited
curtail some of the problems enumerated.
As a result of injecting a reasonable level of efficiency into
the subject matter, Ghana can become one of the forerunners in
Africa combining fantastic bus infrastructure with a frequent bus
service.
Metro Mass Transit Limited has grown to be one of the major
employers in Ghana considering that it has operations in almost
all the ten regions of Ghana. In addition, it outsources indirect
jobs to third parties in the areas of security, bus washing and
cleaning services (Metro Mass Transit Limited, 2012). Moreover,
the operations of Metro Mass Transit Limited has empowered the
Ghanaian community by making jobs, markets, schools and
healthcare centers better accessible.
Organizational performance is measured in terms of customer
satisfaction, through reduced customer complaints (Kloot, 1999).
In order to be able to perform, organizations should critically

look at customers and all stakeholders in business and know how
best they are satisfying their needs. Kloot adds that
organizations should continuously improve their services through
assets accumulation, value creation, improved quality services
and flexibility of internal control system is intertwined with
organizations’ operating activities; it is most effective when
controls are built into the organizations infrastructure becoming
part of the very essence of the organization’s success, in terms
of continued improvement on performance standards as part of the
competitive advantage of the organization.
1.2 Statement of the Problem
The first Bus Rapid Transit (BRT) system was the Rede Integrada
de Transporte in Curitiba, Brazil (translated as 'Integrated
Transportation Network') which entered service in 1974, which
inspired the respected TransMilenio in Bogota, Colombia (opened
2000) and subsequently many other systems around the world. In
all of the above cases cited, the respective systems have been
successful due to particular regard for prioritization (dedicated
bus lanes), quality stations, high-frequency all day services
(for all income ranges), high capacity buses ( bi-articulated

buses, double-decker buses, or guided buses) and prominent brands
or identities.
However, in Ghana, the national transport system has
characterized by deficient customer services, poor maintenance
culture, poor ticketing administration and inadequate use of
spare tyres (Gariba, 2011).
The problem is to analyse and evaluate the internal control
structures that has brought about Metro Mass Transit Limited’s
uninspiring internal control structures that has brought about
adverse effects on the Ghanaian citizenry and ultimately the
economy, the complain of low productivity by both the private and
the government sectors of which are due to delayed departure
times, low profits leading to low tax revenues to the government,
free movement of people hampered and many other knock-on effects.
The benefit of administering good internal control measures in
the country’s transport industry will help to improve all the
above effects.

1.3 General Objective
The study sought to analyse the effects of internal control
measures and its performance in Metro Mass Transit Limited in
Ghana.
Specific Objectives
Specific objectives for the research are:
To find out the control systems in Metro Mass Transit Limited.
To ascertain the level of effectiveness of the internal
control system at Metro Mass Transit Limited.
To assess the challenges facing the Metro Mass Transit limited
in its attempt to implement these controls.
To determine the level of performance in Metro Mass Transit
Limited.
1.4 Research Questions
The research questions are:
1. What kinds of control systems are put in place by the Metro
Mass Transit Limited?

2. What are the challenges confronting Metro Mass Transit
Limited in the implementation of its internal control measures.
3. What is the most critical internal control measure that would
fundamentally help to improve Metro Mass Transit Limited’s
performance?
4. What is the level of performance in Metro Mass Transit
Limited?
1.5 Significance of the Study
The results of the study will help identify new control measures
and ways of strengthening the already existing ones in Metro Mass
Transit limited. It is also the researcher’s belief that the
study will bring invaluable benefits to management and those
charged with governance, thus ultimately helping to solve a
country’s age-old problem. The study will also add to the
existing knowledge bank regarding internal control measures and
performance in general. Also the study will assist in creating
awareness within the staff with regard to the importance of
putting in place internal controls in Metro Mass Transit Limited
as well as strict adherence to such internal control mechanisms.
1.6 Scope and Organisation of the Study

This study is limited to Metro Mass Transit Limited only. It is
also limited to the kinds of internal controls put in place by
Metro Mass Transit Limited, the extent of implementation of the
controls, their effectiveness, and the challenges hampering their
smooth implementation. The study is organised into five chapters
as outlined below:
Chapter one constitutes the introduction which includes an
overview of the background of the study, statement of the
problem, purpose of the study, objectives of study, research
questions and the scope and organisation of the study and how the
results of this work could be used.
Chapter two discusses the literature review which highlights both
the theoretical and the empirical literature of the study. It
ended with the operational definition of certain technical terms
and phrases used in the study.
Chapter three considers the methodology used in the study. This
chapter includes the research design, population and sampling
method used and the research instrument. How the data was
analysed as well as the statistical instrument used in analysing

the data is all included in this chapter. The fourth chapter
dealt with the presentation and discussions of the findings. This
Chapter discussed and presented the findings of the study by
using descriptive statistics, frequency tables and percentages.
Chapter five summarized the major findings of the research, the
conclusions reached and ended by making relevant recommendations,
limitations of the study not forgetting the recommendations for
further studies.

CHAPTER TWO
2.0 LITERATURE REVIEW
Introduction
This second chapter reviewed both theoretical and empirical
literature on the topic. The chapter reviewed available theories
relating to the concept, components, objectives of performance.
The review of literature, in addition, aims at providing detailed
account of earlier studies in internal control measures,
processes and models in the transport industry and related them
in order to identify the gap that exists in the literature, which
the study attempted to fill. The empirical literature however,
cited similar works by other researchers in discussing the topic
to help enrich the discussion further. It also discussed the link
between the variables of this study.
2.1 Theoretical Literature
When companies suddenly collapse, the often-resounding question
is, “what went wrong?” A breakdown in the internal control system
is the usual cause. Internal control is a process that guides an
organization towards achieving its objectives. These objectives

include operational efficiency and effectiveness, reliability of
financial reporting, and compliance with relevant laws and
regulations (COSO 1992). The COSO framework has, as of 14 May,
2013, been updated to comply with Sarbanes-Oxley Act of 2002
(SOX) and to review, refresh and modernize the original framework
ensuring it remains relevant. Absence of these variables often
results in organizational failure. The findings of the Treadway
Commission Report of 1987 in the United States (USA) confirmed
absence of, or weak, internal controls as the primary cause of
many cases of fraudulent company financial reporting. The
widespread global corporate accounting scandals that assumes near
epidemic proportions in recent years inform this study. Notable
cases include Enron and WorldCom in the USA, Parmalat in Europe,
and ChuoAoyama in Asia. In
South Africa, cases of accounting scandals have been recorded in
JCI and Randgold and Exploration companies. In Nigeria, the
Managing Director and Chief Financial Officer of Cadbury Nigeria
plc were dismissed in 2006 for inflating the profits of the
company for some years before the company’s foreign partner
acquired controlling interest. These scandals emphasize the need
to evaluate, scrutinize, and formulate systems of checks and
balances to guide corporate executives in decision-making. These
executives are legally and morally obliged to produce honest,
reliable, accurate and informative corporate financial reports
periodically.
2.1.1 Concepts of Internal Control
According to COSO (2011) Internal Control is a process effected
by an entity’s board of directors, management and other
personnel, designed to provide reasonable assurance regarding the
achievement of objectives in the following categories:
• Effectiveness and efficiency of operations.
• Reliability of reporting
• Compliance with applicable laws and regulations.
This definition emphasizes that internal control is:
• A process consisting of ongoing tasks and activities. It is a
means to an end, not an end in itself.
• Effected by people. It is not merely about policy manuals,
systems and forms, but about people at every level of an
organisation that impact internal control.

• Able to provide reasonable assurance, not absolute assurance,
to an entity’s senior management and board.
• Geared to the achievement of one or more separate but
overlapping categories.
• Adaptable to the entity structure.
An organisation establishes a mission, sets strategies,
establishes the objectives it wants to achieve, and formulates
plans for achieving them. Objectives may be set for an entity as
a whole, or be targeted to specific activities within the entity.
Though many objectives are specific to a particular entity, some
are widely shared. For example, objectives common to most
entities are sustaining organizational success, providing
reliable reporting to stakeholders, recruiting and retaining
motivated and competent employees, achieving and maintaining a
positive reputation within the business and consumer communities,
and complying with laws and regulations.
2.1.2 Components of Internal Control Systems

Supporting the organisation to achieve its objectives are five
components of internal control, COSO (2011):
Control Environment- is the foundation for all other components
of internal control. The board and senior management establish
the tone from the top regarding the importance of internal
control and expected standards of conduct. It provides
discipline, process and structure.
Risk Assessment-involves a dynamic and iterative process for
identifying and analyzing risks to achieving the entity’s
objectives, forming a basis for determining how risks should be
managed. Management considers possible changes in the external
environment and within its own business model that may impede its
ability to achieve its objectives.
Control Activities-are the actions established by policies and
procedures to help ensure that management’s directives to
mitigate risks to the achievement of objectives are carried out.
Information and Communication-provides the organisation with the
information needed to carry out internal control
responsibilities. It also enables personnel to understand their
internal control responsibilities and their importance.

Monitoring Activities-ongoing evaluations, separate evaluations,
or some combination of the two are used to ascertain whether each
of the five components of internal control are present and
functioning.
The framework above relates to the aggregate control system of
the organisation, which is composed of many individual control
procedures. According to Amudo & Inanga (2009), the COSO
framework may be relevant to larger organisations, but
inappropriate for smaller ones due to costs and operational
complexity. Management of small entities may not need formal
internal controls for the reliability of the records and other
information, because of their personal involvement in the
operations of the organisation. This raises a question of whether
the controls of small companies should be as complex as those of
large companies for them to be effective.
Amudo & Inanga (2009) also note that COSO framework did not
recognize and capture the delicate balance between formal and
informal controls in smaller organisations. More so, can small
companies’ internal controls be effective when only few of the

components recommended by COSO are present and yet the controls
could still be effective? COSO did not address this question.
The final weakness of the COSO mechanism is failure to recognize
Information Technology (IT) as one of the major control
components. IT is crucial to an internal control framework. In
contemporary times, organisations use IT for initiation,
authorization, recording and processing of transactions. IT
ensures effectiveness of internal controls. However, COSO’s
failure to recognize IT as a control component motivated other
bodies to design and develop frameworks to remedy the omission.
One such framework is the Control Objectives for Information and
Related Technology (COBIT 1996, 1998, 2000, 2005, 2007).
In 2001, the International Organisation of Supreme Auditing
Institution (INTOSAI) decided to update the 1992 guidelines on
internal control standards to take into account all relevant and
recent evolutions in internal control and to incorporate the
concept of the COSO report titled Internal Control – Integrated
Framework in the INTOSAI document.
According to INTOSAI (2001), Internal Control is an integral
process that is effected by an entity’s management and personnel

and is designed to address risks and to provide reasonable
assurance that in pursuit of the entity’s mission, the following
general objectives are being achieved:
• executing orderly, ethical, economical, efficient and effective
operations;
• fulfilling accountability obligations;
• complying with applicable laws and regulations;
• safeguarding resources against loss, misuse and damage.
Internal control is a dynamic integral process that is
continuously adapting to the changes an organisation is facing.
Internal control should be built in rather than built on. People
are what make internal control work. It is accomplished by
individuals within an
organisation by what they do and say. Achievement of an
organisation’s mission is basically the reason for internal
controls measures. After identifying the risks that faces an
organization, internal controls are put in place to reduce such
risks.
Provides reasonable assurance
No matter how well designed and operated, internal controls
cannot provide management absolute assurance regarding the
achievement of the general objectives. Instead, the guidelines
acknowledge that only a “reasonable” level of assurance is
attainable. Reasonable assurance equates to a satisfactory level
of confidence under given considerations of costs, benefits, and
risks. Determining how much assurance is reasonable requires
judgment. In exercising that judgment, managers should identify
the risks inherent in their operations and the acceptable levels
of risk under varying circumstances, and assess risk both
quantitatively and qualitatively.
Reasonable assurance reflects the notion that uncertainty and
risk relate to the future, which no one can predict with
certainty. Also factors outside the control or influence of the
organisation can affect the ability to achieve its objectives.
Achievement of objectives
Internal control is geared to the achievement of a separate but
interrelated series of general objectives. These general
objectives are implemented through numerous specific sub-
objectives, functions, processes, and activities.
2.1.3 Objectives of Internal Control

According to INTOSAI (2001), the objectives of internal controls
are:
Executing orderly, ethical, economical, efficient and
effective operations:
The entity’s operations should be orderly, ethical, economical,
efficient and effective. They have to be consistent with the
organisation’s mission. “Orderly” means in a well-organized way
or methodical. Ethical relates to moral principles. General
expectations are that public servants should serve the public
interest with fairness and manage public resources properly.
Citizens should receive impartial treatments in the basis of
legality and justice. Economical means not wasteful or extravagant.
It means getting the right amount of resources, of the right
quality, delivered at the right time and place and at lowest
cost. Efficient refers to the relationship between the resources
used and the outputs produced to achieve the objectives. It means
the minimum resources input to achieve the given quantity and
quality of output, or a maximum output with a given quantity and
quality of resource inputs. Effective refers to the accomplishment
of objectives or to the extent to which the outcomes of an

activity match the objective or the intended effects of that
activity.
2.1.4 The need for Internal Control
Internal Control is designed to ensure that an organisation
carries out its required functions effectively and efficiently so
that its financial reporting is reliable, and that it complies
with the relevant laws and regulations. For most organisations,
such internal controls are focused on controlling allocation of
spending, accounting procedures and financial statements to avoid
theft or fraud. Employee fraud or organizational fraud is defined
as a form of employee dishonesty that causes losses to the
organisation. All forms of occupational fraud are clandestine,
violate the employee’s fiduciary duties to the organisation, and
are committed for the purpose of direct or indirect financial
benefit to the perpetrator, and costs the employing organisation
assets, revenues or reserves (Holtfreter, 2004). Holtfreter
further argues that employee fraud causes extensive costs related
to societal outcomes such as diminished trust in governmental and
corporate institutions and reduces public confidence.

Therefore, internal control is a tool used by management and
directly related to the entity’s objectives. As such, management
is an important element of internal control. However, all
personnel in the organisation play important roles in making it
happen (Aucoin et al., 2004).
2.1.5 Limitations on Internal Control Effectiveness
The limitations on internal control effectiveness need to be
stressed to avoid exaggerated expectations due to a
misunderstanding of its effective scope. Internal control cannot
by itself ensure the achievement of the general objectives
defined earlier. An effective internal control system, no matter
how well conceived and operated can provide only reasonable – not
absolute – assurance to management about the achievement of an
entity’s objectives or its survival. It can give management
information about the entity’s progress, or lack of it, toward
achievement of the objectives. But internal control cannot change
an inherently poor manager into a good one.
Moreover, shifts in government policy or programs, demographic or
economic conditions are typically beyond management’s control and
may require managers to redesign controls or adjust the level of
acceptable risk.
An effective system of internal control reduces the probability
of not achieving the objectives. However, there will always be
the risk that internal control will be poorly designed or fail to
operate as intended. Because internal control depends on the
human factor, it is subject to flaws in design, errors or
judgment or interpretation, misunderstanding, carelessness,
fatigue, distraction, collusion, abuse or override.
Another limiting factor is that the design of an internal control
system faces resource constraints. The benefits of controls must
consequently be considered in relation to their costs.
Maintaining an internal control system that eliminates the risk
of loss is not realistic and would probably cost more than is
warranted by the benefit derived. In determining whether a
particular control should be established, the likelihood of the
risk occurring and the potential effect on the entity are
considered along with the related costs of establishing a new
control.
Organizational changes and management attitude can have a
profound impact on the effectiveness of internal control and the
personnel operating the system. Thus, management needs to
continually review and update controls, communicate changes to
personnel, and set an example by adhering to those controls.
The large number of accounting scandals during the early part of
the 21 century resulted in the Sarbanes-Oxley Act of 2002.
Sections 302 and 404 of this Act require companies to maintain,
assess, and disclose internal control over financial reporting.
The disclosures of internal controls were intended to provide
financial statement users with an early warning about potential
future problems that could result from deficiencies in internal
controls (Nicolaisen, 2004). The broader objectives of internal
controls are not limited to the reliability of financial
reporting as required
by SOX alone. A number of key internal control frameworks, such
as COSO’s (1992) and Turnbull’s Guidance on Internal Control
(1999) have been developed prior to the high profile accounting
scandals at the turn of the century.
Thus, management needs to continually review and update controls,
communicate changes to personnel and set example by adhering to
those controls.

2.1.6 Processes and Models in Mass Transportation
The Bus Rapid Transit Model
The “bus rapid transit” system (BRT) is a mobility concept for
rapidly growing cities. Urban buses travel in dedicated bus
lanes with a high service frequency and separate traffic lights.
Buses are given priority, enabling them to travel at high speeds.
This means fast and comfortable travel, even at peak traffic
times. Daimler is committed to BRT solutions as only a reliable
and safe public transport system can incentivise people to make
the switch from private transport. This is particularly important
in larger cities to take the strain off the transport system and
therefore to ensure permanent mobility for all sections of the
population into the future. Deploying state-of-the-art engine
technology and ensuring that bus traffic flows smoothly without
stop-and-go also contributes to reducing CO2 emissions. A further
advantage for municipal operators is that BRT is cheaper in terms
of procurement and maintenance than rail-based concepts and can
be integrated into existing infrastructures more easily. This
makes BRT a sustainable, future-proof concept that Daimler has
already successfully implemented from planning through to

introduction and provision with buses in cities including
Istanbul, Nantes, Mexico City and Bogota. About 17,000 buses by
Mercedes-Benz are operating for more than 20 BRT systems around
the world - from minibuses to articulated uses. BRT systems are
characterised by separate bus lanes and priority over other road
users, barrier-free entrance via
bus-stop platforms, optimised vehicles in terms of size and
design, ticket purchase and access control outside the vehicle,
integration of all modes of transport, control via ITS
(Intelligent Transport System) and organisation of the system
into main and feeder routes, The mobility concepts of Daimler.
(n.d.).
The DHV route optimization model
The DHV route optimization model (or in short DHV-model) was
developed by the Dutch consulting engineering firm DHV
Consultants BV. Initially the model was developed for the urban
bus company “De Lijn” operating in Brussels, the capital of
Belgium. The aim of the bus company was to improve the quality of
their services with the current resources in terms of budget,
vehicles and drivers. The model was subsequently applied for the
public transport route optimization of the cities of Rotterdam
and Denhaag in the Netherlands on mainframe computers. The
application of the DHV model was boosted following the further
development of the model on a personal computer platform.
Following this development, the model was successfully applied in
various cities in the formal Soviet Union, as well as central
Europe and Asia. The model was used to identify new profitable
routes which will meet the demand of the public transport
passengers. The model was applied through close co-operation
between the transport authority and the operators. The following
input information is required to apply the route optimization
model:
A reliable origin-destination (O-D) matrix for public
transport trips (train, taxi and bus);
The road and rail networks available for the use of public
transport vehicles;
The available resources for public transport operations
(budget, vehicles, drivers).
Apart from the information on the resources, all other
information is normally available from conventional transport
modelling studies.

To determine an optimised network it is not necessary to have
knowledge of the current route structure, but this is useful in
order to simulate the existing situation to determine the
improvement achieved by the optimised network. The DHV model
makes use of operational research techniques to identify the
optimal set of routes and frequencies to meet the demand for
public transport, subject to resource constraints such as the
operating budget and vehicle fleet. In the DHV model the
optimization is primary approach from the interest of the public
user. The main aim of model is to satisfy the needs of the
passenger in terms of the reduction in the travelling time (more
direct routes, higher frequency and less meeting time, etc.) and
the reduction in the number of transfers. The DHV model consists
of two main components: a simulation sub-model and an
optimization sub-model. The simulation model is traditional step
transport model which can be used for matrix estimation,
assignment and evaluation similar to the EMME/2 model which is
normally used for transport planning in South Africa. The
optimization sub-model generates the optimal route network in

view of the specified demand. After the assignment of the
existing trip matrix to the existing route network (the reference
situation) the first step in the process is the calculation of
the concentrated network. The concentrated network represents the
shortest paths for all public transport users, ensuring a
specified minimum number of passengers per road link. The
concentrated network represents the demand for bus and taxi
routes. In the line generation a large number of lines are
generated between each pair of existing and potential public
transport terminals in the study area subjects to user supplied
restrictions. In the generation process, routes are identified
following the concentrated paths. In this process the potential
supply of routes is calculated. The final step in the route
optimization process is line selection. In this step the most
attractive lines are selected from the list of generated and
existing routes. The concentrated network is used in the
selection of attractive lines. The final result of the
optimization process is a complete set of public
transport routes (bus or taxi), the required frequency of each
individual routes and the identification of the locations where

transfer terminals are needed. It is important to state that the
optimised set of routes, as proposed by the computer model, is
not the final answer. The result of the optimization process
needs to be verified by the modeller and the public transport
operators. The verification by the modeller is needed to both
check and improve the result of the model. After the assignment
of the optimised route the modeller may have to:
change some 2-way routes into 1-way route (the model suggests
defaults 2-way routes)
change some of the frequencies if the occupancies shown in
the assignment are too high
Combine two short routes into one longer route
Exchange some taxi and bus routes based on the loading and
frequency of the vehicle.
The impact of these changes of the individual routes as well as
the total network performance can be determined with the help of
assignment statistics (Zyl, V. et al 1999, August).
2.1.7 Organisation Performance
Brown (1996) argues that performance measures in organizations
must focus attention on what makes, identifies and communicates

the drivers of success, support organizations learning and
provide a basis for assessment and reward. Dixion (1990) adds
that appropriate performance measures are those which enable
organizations to direct their actions towards achieving their
strategic objectives. This is because according to him, a firm’s
performance is central to the future well-being and prosperity of
any enterprise.
Study by Whyte (1991), shows that performance can be measured at
both organizational and individual levels. This measurement is
sometimes referred to as performance appraisal. Whyte argues that
organizations have desired potentials in terms of capacity,
attraction, manual share and financial strength and performance
is the difference between those potentials and those that
have been achieved. Whyte argues that human capital asset
accumulation has significant impact on the organization’s ability
to introduce new products, compete within markets thus
influencing the level of performance. It increases knowledge base
within the organization’s success and performance.
Rumelt (1994), assert that availability and level of resources
can also be used to analyse the performance of an organization.

Rumelt contend that resources which may include assets, finances,
employee skills and organizational processes are key indicators
of the organization’s performance at one time. In agreement with
this, Barney (1991) suggested that resources could be grouped
into physical, human and capital resources and that a firm can
increase its performance only when other firms are unable to
imitate its resources. Rhyne (1994) argues that although a strong
financial performance indicates a strong institution, qualitative
indicators like the nature of management and educational level of
labour force must supplement the quantitative indicators in order
to enable the enterprise’s ability to meet its focus and
objectives.
Palmer (1993) emphasizes that performance in organizations is
looked at in terms of economy, efficiency and effectiveness.
Economy and efficiency are usually measured in financial terms
and data such as costs, volume of sales and productivity are
used. Economy is defined as acquiring resources in appropriate
quantities and at the least cost.
Drucker (1999) defines efficiency as maximizing inputs for a
required output. On the other hand Drucker defines effectiveness
as the extent to which the defined task has been accomplished and
is consistent with notions of non-financial accountability.
Effectiveness may partly be measured in terms of quality service,
customer satisfaction and achievement of goals.
Morton (1992) is also in agreement with Drucker’s (1999)
contention that performance should be measured in terms of
customer satisfaction. Morton argues that in order to be able to
perform, organizations should critically look at their customers
and know how best they are satisfying
their needs. He adds that organizations should continuously
improve on their services through innovations and great value.
Kloot (1999) adds that in order to assess performance,
organizations should be examined in terms of quality of services,
flexibility, utilization and innovations.
2.2 Empirical Literature
The introduction of the Metro Mass Transit buses in Ghana is
probably one of the best policy interventions in the transport
sector in the last decade. Everyday these buses transport
thousands of Ghanaians and their goods to various destinations in
the country.
However, the apparent neglect and subsequent decay of some of the
Metro Mass Transit buses in recent times leaves much to be
desired. The focus of this study is to analyse the effects of
internal control measures and its performance in the
transportation industry and try to link it with the case of Metro
Mass Transit Limited. In doing this, references were made
throughout the work to previous research works.
Previous research have focused on studying certain control
elements such as communication which was handled by Hooks et al
(1994), risk management Mills (1997) and human resource practices
done by Carey and Stringer, (1995). The study on village banks in
Uganda, Kenya and Tanzania by German Technical Cooperation
assistance (GTZ) and Africa Rural Agriculture and Credit
Association (AFRICA) (2002) revealed that most of the MFIs were
operating without documented policies and procedures and lacked
operational manuals. It identified the necessity to provide
support to the MFIs so that they can come up with operational
manuals and to improve on the existing systems. Information
system is a set of interrelated components all of which should be
present and work together for a common purpose. Internal control
mechanisms must have well documented processes that are

understood by everyone involved. There is immense need for MFIs
to set aside resources such as time, money and personnel to
develop or
improve a MIS that can match its information requirement (The
Center for Micro Enterprise Development Project, 1999). An
organization which lacks information will be unable to attain its
potential performance even if it may have capable and motivated
staff (CGAP, 1998).
2.2.1 Successful Bus Rapid Transit Systems around the World
The China Bus Rapid Transit System
Among the facilities provided by the Bus Rapid Transit (BRT), E-
card charge stations scored the highest, followed by BRT ticket
machines. In relation to the rush hour congestion, measures such
as the capacity to add departure frequency and vehicle are highly
praised. In the meantime, the city of Guangzhou, China, won the
2011 Sustainable Transport Award for its new world-class Bus
Rapid Transit system that integrates with bike lanes, bike share
and metro stations into a collective transport system. This
award, presented by the Institute for Transportation Development

Policy (ITDP) on 24 January 2011, goes to a city that made the
most progress over the year to increase mobility, while reducing
transportation greenhouse and CO2 emissions, and improving road
safety. Today the Guangzhou BRT services over 800,000 riders
daily and was built for about one-tenth the cost of the metro,
with an average of one bus passing every 10 seconds in peak
hours, it carries more passengers in a single direction than just
about every metro lines in all of China, and more than triple any
other BRT system in Asia. The system has resulted in 30 percent
higher bus speeds, and reduced congestion along the corridor at
the same time as vehicle volumes have increased, primarily due to
the solving of severe problems of congestion at bus stops, and
intersection signal improvements. explained ITDP director of
marketing and communications, Dani Simons The Guangzhou BRT was
able to eliminate 50,000 tons of carbon dioxide in its first
year, mostly due in part to residents choosing BRT over private
vehicles, in addition to help cut congestion and improve traffic
flow, Bus & Coach (n.d.).
The Argentina Bus Rapid Transit System
Argentina’s first Bus Rapid Transit system was inaugurated by
Mauricio Macri, the mayor of Buenos Aires, on 2nd June, marking
its first day of operation. Government officials and the public
speak of the tremendous impact this transit system will have in
improving people’s lives. The new BRT system, called “Metrobus”
has 21 stations and physically separated lanes that run in the
middle of the street. As an extra safety measure, the Metrobus
has elevated station platforms and features countdown clocks that
notify riders of the next arriving bus on each platform to keep
riders informed. The BRT will connect to two commuter rail
stations on opposite sides of the city, forming a trip that takes
40% less time than before, ITDP reports. With the addition of the
BRT to the city’s transport network, city officials expect the
line to grow to an anticipated 100,000 daily riders, a 15 percent
increase in ridership. City officials also expect the system to
reduce fuel use by buses in the city by 30 percent, and therefore
cut carbon emissions and improve air quality. The implementation
of Metrobus in Buenos Aires, the first BRT corridor in Argentina,
represents significant progress in the development of urban
transportation, allowing for an increased quality of life of more
than 100,000 people, said Macri. Our main goal, as those

responsible for urban planning, is to restore the quality of
public transportation, for which the support of the W.J. Clinton
Foundation and ITDP has been crucial in the process of
development and implementation of a world-class BRT system. In
the coming years, based on the success of this first phase, we
plan to continue the expansion of the BRT network in the City of
Buenos Aires. Road transportation accounts for 90% of all
transportation emissions in Latin America, half of which are
produced by passenger traffic, said Stephen Crolius, director of
the Transportation Program at the Clinton Climate Initiative.
“Bus rapid transit systems play an important role in addressing
those emissions as they create dedicated bus lanes across cities,
providing millions of people with a more cost and time efficient
solution to using cars—resulting
in fewer emissions and improved air quality. The system was built
in just seven months, showing the huge savings that BRT provides
in construction time, cost and logistics when compared to a fixed
rail system, ITDP explains. The BRT comes as only one component
of Buenos Aires’s efforts in creating a comprehensive transit
network to its residents and visitors. In a remarkably short

amount of time the City has helped improve conditions for walking
downtown, dramatically increased the availability of high quality
bike lanes, and provided a public bicycle system, said Andres
Fingeret, director of ITDP’s Argentina office. And now Metrobus
will add another high quality transportation option that will get
residents where they need to go, quickly, with less pollution and
without getting stuck in traffic. Bus & Coach (n.d.).
2.2. Relationship between internal control and organizational
performance
COSO (1992) provided criteria against which effectiveness of
internal controls can be assessed. Internal control can be judged
effective, if the entity’s operational objectives are being
achieved; published financial statements are being prepared,
reliable and applicable laws and regulations are being complied
with. While internal control is a process, its effectiveness is a
state at a point in time. Accordingly, the effective functioning
of components of internal control provides a reasonable assurance
regarding achievement of one or more of the stated categories of
objectives to ensure high levels of organizational performance.

Efficiency and effectiveness of operations have been taken to
mean efficiencies and effective use of its resources including
personnel, accurate information for decision making and
safeguarding of assets and records (Aren and Lwebbecke, 1994).
One of the five interrelated components of an internal control
system is the control environment. It refers to the integrity,
ethical values and competence of personnel (COSO, 1994). Internal
control should be viewed in a broader context, for example, it
should as well be reorganized as a
function of people’s ethical values as it is of standards and
compliant mechanisms (COCO, 1995). Wells (2001), illustrate
practical fraud occurrences discovered by competent accountants
within organizations and what the accountants say about how they
detect fraudulent transactions. Internal control system helps an
organization to achieve its objectives such as its efficiency and
effectiveness, reliable financial reporting and compliance with
regulations COSO (1994). Controls serve the system goals, they
interact with the system and its environment thus directing the
energy of the system toward fulfillment, in the same way changes
in the environment are easily noticed and adapted to (COCO,
1995). ACMAD (1994) recognizes that internal controls can enhance
the productivity and competitiveness of organizations.
In conclusion, internal control serves as a major mechanism that
every organisation must have to enhance its performance and
achievement of objectives.
2.3 Operational Definitions of Term and Constructs
For the purpose of this dissertation, the following terms were
defined:
Effectiveness
The degree to which objectives are achieved and the extent to
which targeted problems are solved. In contrast to efficiency,
effectiveness is determined without reference to costs and,
whereas efficiency means "doing the thing right," effectiveness
means "doing the right thing."
Efficient refers to the relationship between the resources used
and the outputs produced to achieve the objectives. It means
the minimum resources input to achieve the given quantity and
quality of output, or a maximum output with a given quantity
and quality of resource inputs.
CHAPTER THREE
3.0 METHODOLOGY
Introduction
This chapter provides an account on how this study was conducted.
3.1 Research Design
The study sought to analyse the effects of internal control
measures and its performance in Metro Mass Transit Limited in
Ghana. In order to achieve the purpose, the researcher sought to
find out control measures put in place, challenges confronting
their implementation, the most critical of the measures to attain
performance targets and most importantly determine the level of
performance given controls in place at Metro Mass Transit
Limited.
The study is a case study. A case study offers an opportunity to
study a particular subject in depth, for instance an organization
and usually involves gathering and analyzing information that may
be both qualitative and quantitative. Consequently the researcher
used explanatory research to look out for explanations of the
nature of the internal control measures and its effects on
performance of the transportation industry. The main advantage of
explanatory research is that, it helps the researcher to
understand the relationship that exists between variables as a
result of hypothesis testing. It however has some downsides. The
main disadvantage is that, it is less useful for observational
research since several other factors come into play.
The target population comprised employees and passengers of Metro
Mass Transit buses at the Kaneshie terminal, Accra. Sampling
method used was simple random sampling whilst the research
instrument used was a closed-ended self-administered
questionnaire.
3.2 Population and Sample
3.2.1 The Target population:
A research population is a well-defined collection of individuals
or objects known to have similar characteristics. All individuals
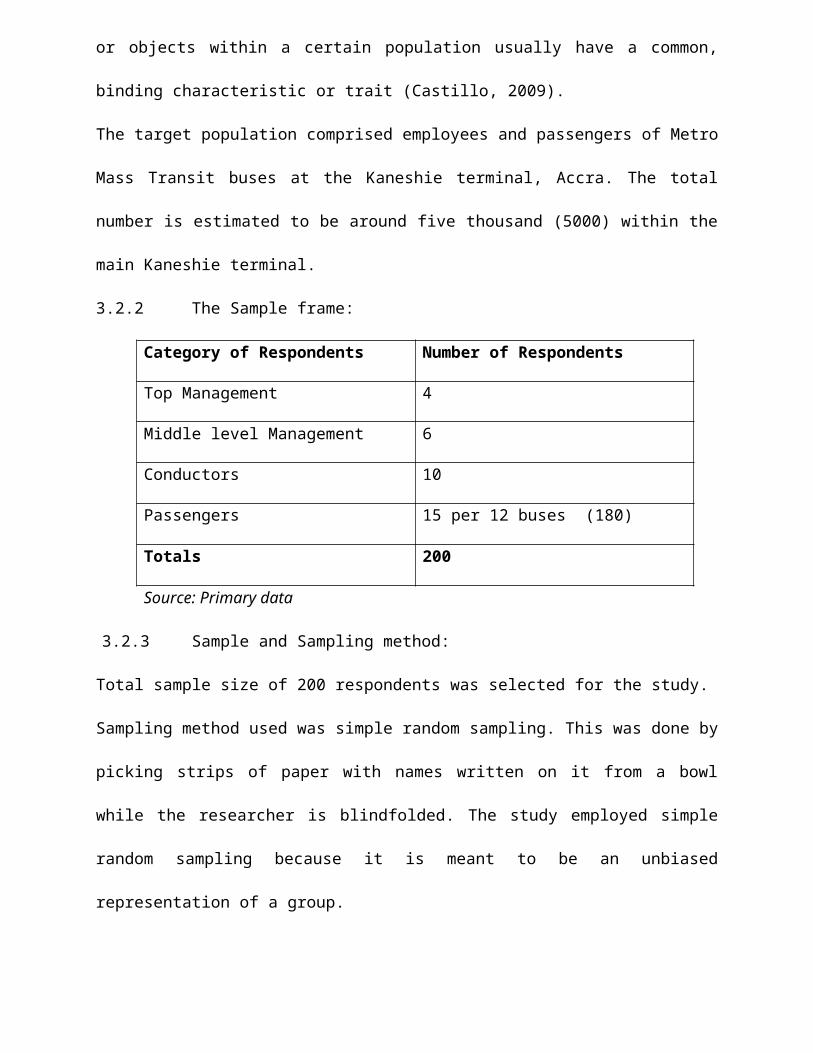
or objects within a certain population usually have a common,
binding characteristic or trait (Castillo, 2009).
The target population comprised employees and passengers of Metro
Mass Transit buses at the Kaneshie terminal, Accra. The total
number is estimated to be around five thousand (5000) within the
main Kaneshie terminal.
3.2.2 The Sample frame:
Category of Respondents Number of Respondents
Top Management 4
Middle level Management 6
Conductors 10
Passengers 15 per 12 buses (180)
Totals 200
Source: Primary data
3.2.3 Sample and Sampling method:
Total sample size of 200 respondents was selected for the study.
Sampling method used was simple random sampling. This was done by
picking strips of paper with names written on it from a bowl
while the researcher is blindfolded. The study employed simple
random sampling because it is meant to be an unbiased
representation of a group.

3.3 Data Collection Method
The main instrument that was used during data collection was a
self-administered questionnaire. It is closed-ended and made use
of a four-point and a two-point likert-scales respectively
(A=Excellent, B=Satisfactory, C=Above Average, D=Poor), (A=Yes,
B=No). There were four sets (for top management, middle
management, conductors and passengers) of questionnaires each of
which had two sections made up of background information and the
main questions. The questionnaires were delivered personally by
the researcher.
Both management and conductors were able to answer their
questionnaire without any assistance. However, questionnaires
issued to passengers were done by self- administration. This was
largely because the researcher was called upon to repeatedly
explain questions in our local Ghanaian dialect.
3.4 Research Instruments
In this study, a structured questionnaire was used as the primary
research instrument and can be found at appendix A.

The questionnaires were closed-ended questions of simple “Yes and
No” and “Excellent, Satisfactory, Above Average and Poor” where
respondents were asked to choose from a list of answer choices.
This plan is designed to give a researcher a sense of direction
and focus in undertaking the study within a specific time frame.
Primary data is data observed or collected directly from first-
hand experience. Published data and data collected in the past
are called secondary data.
3.5 Data Analysis
The researcher attempted to analyse the relationship between
internal control measures and its performance.
Data collected was analysed by way of Statistical Package for
Social Sciences (SPSS Version 16.0). SPSS Statistics is a
software package used for statistical analysis. It is now
officially named "IBM SPSS Statistics". It allows for in-depth
data access and preparation, analytical reporting, graphics and
modeling.

3.6 Validation of Research Instrument
The research instrument was validated both internally and
externally. The following
internal validations were used.
For face validity, the researcher thought that it was logical to
measure internal control effectiveness using a questionnaire-base
survey.
To achieve content validity, the questionnaire for this study
was given to the research fellow (supervisor) for review.
For criterion validity, the questionnaire developed was
matched up with other similar validated instruments that have
been developed and used in several studies.
Construct validity were ensured by deriving the component and
objectives of internal control system from COSO (1992),
INTOSAI (2001) frameworks and others.
To ensure external validity, the findings and results were
generalized to Metro Mass Transit Limited only.

3.6.1 Reliability of the Research Instrument
To test the reliability of the instrument, the researcher
administered the same questionnaire twice at both the Kaneshie
and Accra terminals of Metro Mass Transit Limited.

CHAPTER FOUR
4.0 RESULTS AND DISCUSSIONS
Introduction
This chapter presents empirical findings in reference to research
objectives in chapter one. These findings were obtained from only
primary sources. They were presented and analysed using
descriptive statistics, frequency tables and percentages. The
first section summarizes the averages of the demographic profiles
of top management, middle-level management operational level and
passengers. The second section finds out the control systems in
Metro Mass Transit Limited. The third section ascertains the
level of effectiveness of the internal control system in Metro
Mass Transit Limited. The fourth section assesses the challenges
facing Metro Mass Transit Limited in its attempt to implement
these controls. The fifth section tries to determine the level of
performance in Metro Mass Transit Limited.

4.1 Findings of Demographic Profile of Respondents
Source: Primary Data, 2013
Of the 200 sampled, 140 representing 70% of the respondents were
males, while 60 representing 30% were females.
Table 2.Age of Respondents
Frequency Percentage (%)
Less than 20 years 0 0
20-34 years 180 90
35-49 years 20 10
50 years and above 0 0
Total 200 100
Source: Primary Data (2013)
Table 1. Gender of Respondents
Frequency
Percentage
(%)
Male 140 70
Female 60 30
Total 200 100

With regard to table 2 above, there were no respondents less than
21 years and 50 years and above whilst there were 180 (90%) and
20 (10%) of respondents between the ages of 20-34 years and 35-49
years respectively. Findings indicate that majority were in the
age group of 20-34 years. Since majority of the respondents were
in the maturity group, it can be said that they can answered the
questionnaires in a matured way.
Table 3. Marital Status
Frequency Percentage (%)
Never Married 160 80
Married 40 20
Divorced 0 0
Widow/Widower 0 0
Total 200 100
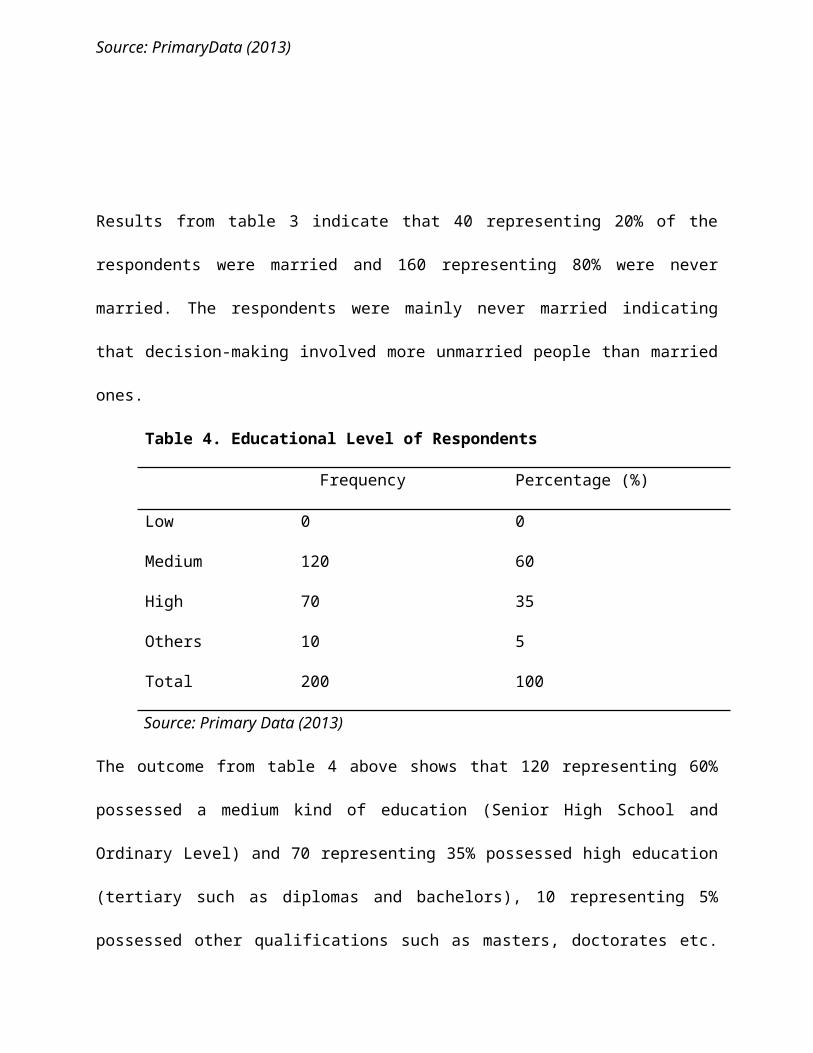
Source: PrimaryData (2013)
Results from table 3 indicate that 40 representing 20% of the
respondents were married and 160 representing 80% were never
married. The respondents were mainly never married indicating
that decision-making involved more unmarried people than married
ones.
Table 4. Educational Level of Respondents
Frequency Percentage (%)
Low 0 0
Medium 120 60
High 70 35
Others 10 5
Total 200 100
Source: Primary Data (2013)
The outcome from table 4 above shows that 120 representing 60%
possessed a medium kind of education (Senior High School and
Ordinary Level) and 70 representing 35% possessed high education
(tertiary such as diplomas and bachelors), 10 representing 5%
possessed other qualifications such as masters, doctorates etc.

the educational levels of the respondents were on the higher side
and helped to enhance the reliability of the data.

Source: Primary Data (2013)
Findings in table 5 above show that 140 (70%) of the respondents
served between 1-5 years and 60 (30%) served between 6-10 years.
It appeared there was fair balances as far as the ages were
concerned making the respondents fairly aware of the day-to-day
operations of the organisation.
Table 6. Transportation Qualification of Respondents
Frequency Percentage (%)
Degree 80 40
Diploma 20 10
Certificate 80 40
Table 5. Period of Service of Respondents
Frequency
Percentage
(%)
1-5 years 140 70
6-10 years 60 30
11-15 years 0 0
16 years and above 0 0
Total 200 100
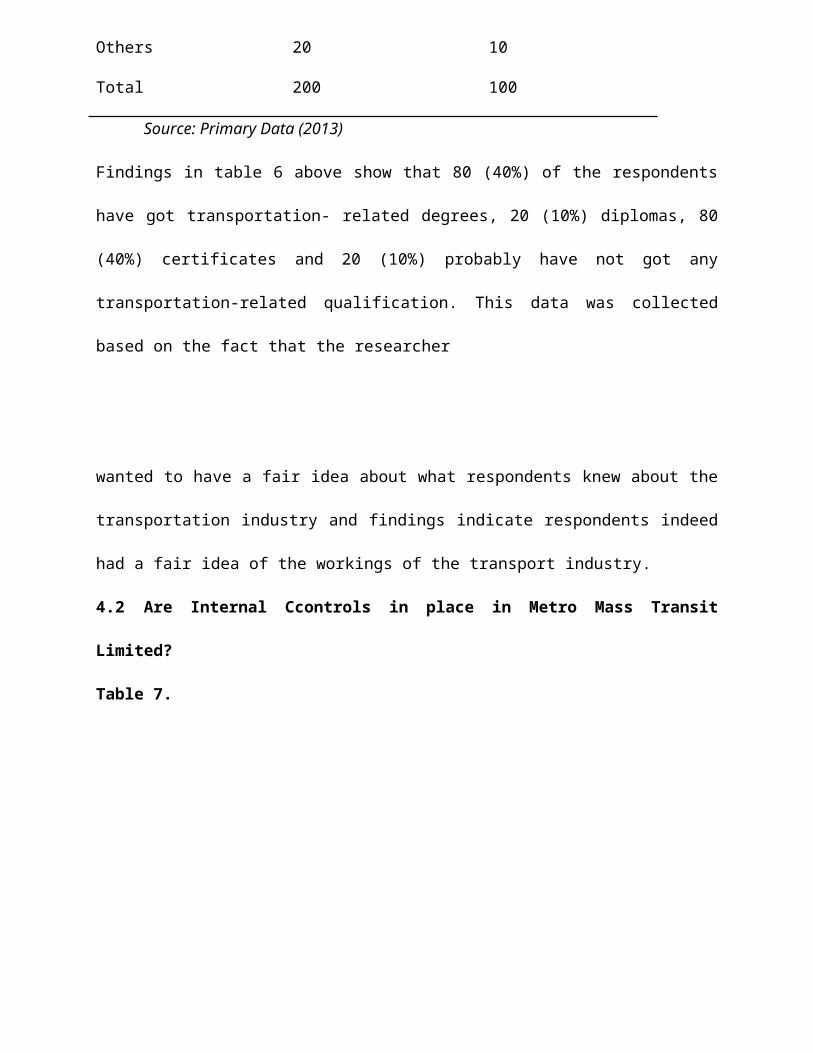
Others 20 10
Total 200 100
Source: Primary Data (2013)
Findings in table 6 above show that 80 (40%) of the respondents
have got transportation- related degrees, 20 (10%) diplomas, 80
(40%) certificates and 20 (10%) probably have not got any
transportation-related qualification. This data was collected
based on the fact that the researcher
wanted to have a fair idea about what respondents knew about the
transportation industry and findings indicate respondents indeed
had a fair idea of the workings of the transport industry.
4.2 Are Internal Ccontrols in place in Metro Mass Transit
Limited?
Table 7.

Source: Primary Data (2013)
Are Internal Controls put in
place in MMT
Yes No
Has MMT established internal
control system? √
Do you have controls to ensure
good financial statements? √
Are controls in place to ensure
employment of competent
personnel? √
Are controls in place to secure
against asset loss? √
Are controls put in place to
prevent and detect fraud and
error? √
Are controls put in place to
ensure general compliance with
laws and regulations? √
√=Yes X=No

Clearly, all respondents were of the view that internal controls
are in place. Upon further interrogation the researcher
discovered that the finance staff record all sales, promptly bank
all monies for the day, not one individual handles all accounting
processes and then payment vouchers are properly approved before
monies are paid out.
More so, information obtained during the data gathering process
indicates that, to be employed, one has to formally apply, go
through an interview process, gets hired and trained, put through
a probation process and then finally maintained or rejected
depending on performance exhibited. There are also structures in
place for already employed personnel to continually develop
themselves. In addition, all buses were parked within the
terminals everyday after work under tight security to secure
against asset loss. The researcher realised that unless a genuine
need for spare parts arises, requisitions are not approved. To
check against fraud and error within the organisation,
transactions must be approved by the appropriate staff at all
departmental levels. For instance, some contracts to purchase
buses cannot be approved by the managing director alone without
consulting the board. All units within the organisation have

operating manuals and policies which must be followed religiously
in performing their day-to-day duties.

4.3 Challenges Facing MMT in implementing its internal controls
Table 8.
Yes No
Is internal audit function
effective? √
Are workers generally satisfied
with conditions of service? X
Are workers motivated to work? X
Is the HR unit effective in its
employment decisions? √
Is there any likelihood of
collusion to steal company
assets? √
Is the maintenance culture
effective? √
Is the asset replacement policy
of MMT effective? √
Are controls against ticketing
fraud effective? √
Is top management committed to √

implementing policies, laws and
regulations?
Is top management willing to
apply sanctions for failure to
ensure compliance? √
√=Yes X=No
Source: Primary Data, (2013)
It is clear from the findings that the organisation faced few
challenges in implementing its set controls despite chalking
successes in most other areas such as effectiveness of internal
audit,
effectiveness of the HR unit in its employment decisions,
likelihood of collusion to misappropriate company assets,
effectiveness of the maintenance culture, effectiveness of the
asset replacement policy among others. To understand the reasons
behind the findings, the researcher sought for some reasons for
the authorities concerned.
The internal audit function was sufficiently independent from the
management. As a result it had the free hand to scrutinize
transactions and audit operations as they deemed fit.

The offices were mostly small, crowded and workers welfare was
not paramount to management not to talk of delayed in payment of
salaries.
It was a policy that family relations could not work in the same
unit and the control was instituted so that workers could not
easily collude to misappropriate the organisation’s assets.
Moreover, there was regular rotation of personnel from role to
role. Buses and other valuable assets were regularly checked in
the morning before the start of the day’s operations as well as
the maintenance of servicing history records to inform future
decision- making. The organisation had an ongoing programme of
asset replacements which were strictly adhered to. There were
times the government even stepped in upon request help beef up
the company’s fleet.
Both drivers and conductors accounted for the exact tickets given
to them at the terminal office and an invoice with the serial
numbers of the tickets issued is then given to the driver to
establish their indebtedness. Another control was that tickets
issued to passengers were slightly torn to ensure that they are
not reused. Furthermore, management set the tone at the top by

abiding by the rules and regulations and ensured that offenders
were sanctioned appropriately.
4.4 The Level of Effectiveness of the Internal Control
System at Metro Mass Transit Limited.
Table 9. Descriptive
Statistics
N
Minimu
m Maximum
Mea
n
Std.
Dev
Is the internal audit the
most critical? 10 1 1
1.0
0
0.00
0
Are HR controls the most
critical? 10 1 2
1.2
0
0.42
2
Are controls against asset
loss the most critical? 10 1 2
1.1
0
0.31
6
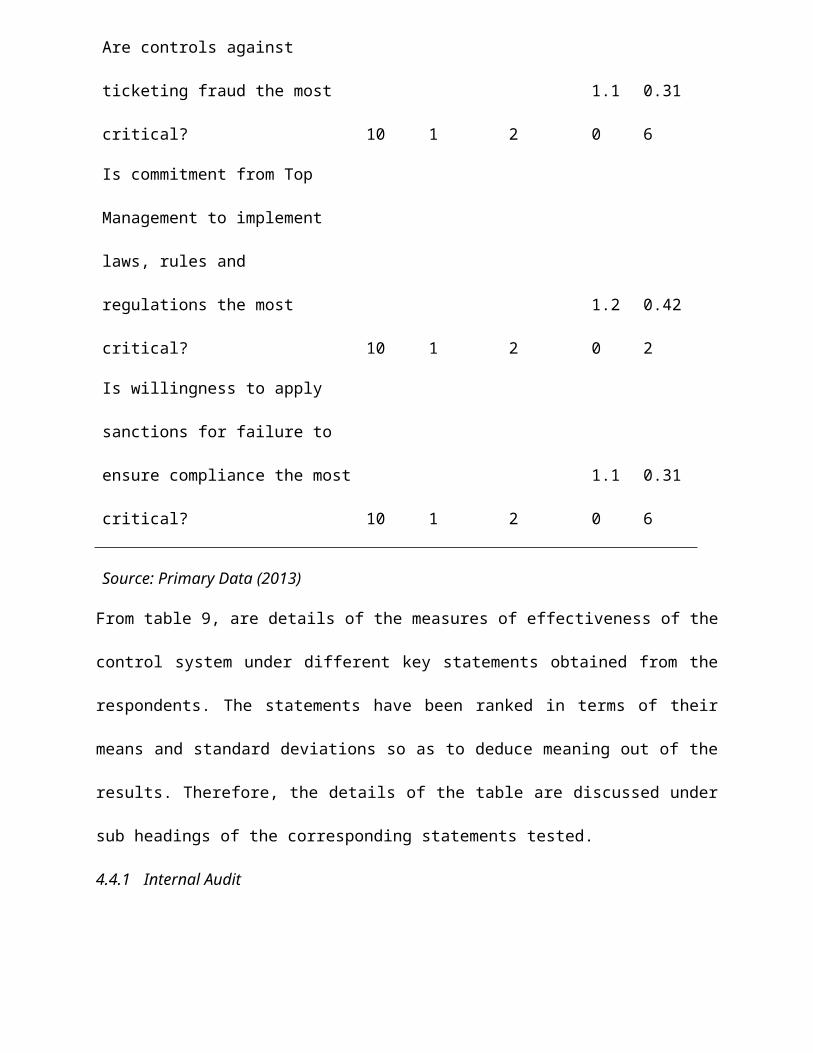
Are controls against
ticketing fraud the most
critical? 10 1 2
1.1
0
0.31
6
Is commitment from Top
Management to implement
laws, rules and
regulations the most
critical? 10 1 2
1.2
0
0.42
2
Is willingness to apply
sanctions for failure to
ensure compliance the most
critical? 10 1 2
1.1
0
0.31
6
Source: Primary Data (2013)
From table 9, are details of the measures of effectiveness of the
control system under different key statements obtained from the
respondents. The statements have been ranked in terms of their
means and standard deviations so as to deduce meaning out of the
results. Therefore, the details of the table are discussed under
sub headings of the corresponding statements tested.
4.4.1 Internal Audit

The study (as reflected in table 9) found that the respondents
without doubt agree that the internal audit function in the MMT
is most critical with a mean value of 1.0 which is the same as
the maximum rank of 1. This shows that they clearly agree about
the criticality of the internal audit function. However, the
corresponding standard deviation also revealed a significant
value of 0. This also shows that there is no variation in the
responses provided by the respondents about how critical the
internal audit function is.
4.4.2 Human Resource Controls
From table 9 above, the respondents seem not to agree that the HR
controls in the MMT are very critical to it with a mean value of
1.2 which appears to be farther away from the maximum rank of 2.
This shows that on the average they do not agree about the
criticality of the human resource controls. However, the
corresponding standard deviation also revealed a somehow
significant value of 0.422. This also shows that there is some
variation in the responses provided by the respondents about the
criticality of the HR controls.
4.4.3 Controls Against Asset Loss

From table 9 above, the respondents seem not to agree that
controls against asset loss in the MMT are very critical to it
with a mean value of 1.10 which appears to be farther away from
the maximum rank of 2. This shows that on the average they do not
agree about the criticality of controls against asset loss.
However, the corresponding standard deviation also revealed a
somehow significant value of 0.316. This also shows that there is
some variation in the responses provided by the respondents about
the criticality of the HR controls.
4.4.4 Controls Against Ticketing Fraud
The analysis and effects as given on controls against asset loss
also applies here because the values obtained for the means and
standard deviations are same.
4.4.5 Commitment from Top Management to implement Laws and Regulations
The analysis and effects as given on HR controls also applies
here because the values obtained for the means and standard
deviations are same.
4.4.6 Willingness to Apply Sanctions for Failure to Ensure Compliance

Again, the analysis and effects as given on controls against
asset loss also applies here because the values obtained for the
means and standard deviations are the same.
From all the analysis above, it is quite clear that the level of
effectiveness of the internal control system at the MMT is on the
low side. Even though all the respondents seem to agree on the
criticality of the internal audit function and as such likely
that controls within the function would be made to work, the same
cannot be said for the other controls. The reason being that,
since the other controls are not one of the most critical, the
organisation will not go to great lengths to make sure they
succeed. However, the internal audit function must succeed for
the organisation to succeed since is the most critical of all the
controls.

4.5 Determination of the Level of Performance in Metro Mass
Transit Limited.
Table 10. Descriptive
Statistics
N
Minimu
m Maximum Mean
Std.
Dev.
Is MMT's performance in
customer service
anything to write home
about? 180 1 4 2.32
0.96
0
Do you think MMT should
not improve on its
ticketing? 180 1 4 2.91
1.26
5
Does MMT ensure regular
fleet maintenance? 180 1 4 2.45
1.01
0

Do you think MMT is
doing a good job? 180 1 4 2.03
1.06
2
Would you say MMT has
come to solve our road
transport problems? 180 1 4 2.47
1.27
0
Has MMT been consistent
with their departure and
arrival times? 180 1 4 2.63
1.06
7
Is overloading a big
issue in most MMT buses? 180
1 4 1.96
1.31
3
Source: Primary Data (2013)
Here in table 10, are details of the measures of effectiveness of
the control system under different key statements obtained from
the respondents. The statements have been ranked in terms of
their means and standard deviations so as to deduce meaning out
of the results. Therefore, the details of the table are discussed
under sub headings of the corresponding statements tested.
4.5.1 Performance in Customer Service

According to table 10 above, the respondents in their view seem
surprisingly to suggest that customer service in MMT buses is
encouraging with a mean value of 2.32 which is a little above the
average of the maximum rank of 4. This shows they generally are
of the view that customer service in MMT buses is something to
write home about. However, the corresponding standard deviation
also revealed a significant value of 0.960. This also shows that
there is mostly variation in the responses provided by the
respondents about the performance of MMT in customer service.
4.5.2. Ticketing
According to table 10 above, the respondents in their view seem
surprisingly again to suggest that ticketing in MMT buses is
encouraging with a mean value of 2.91 which is a little above the
average of the maximum rank of 4. This shows, on the average,
they are of the view that ticketing in MMT buses needn’t
improvement. However, the corresponding standard deviation also
revealed a significant value of 1.265. This also shows that there
is a clear variation in the responses provided by the respondents
about the performance of MMT in ticketing and therefore probably
does not need improvement.
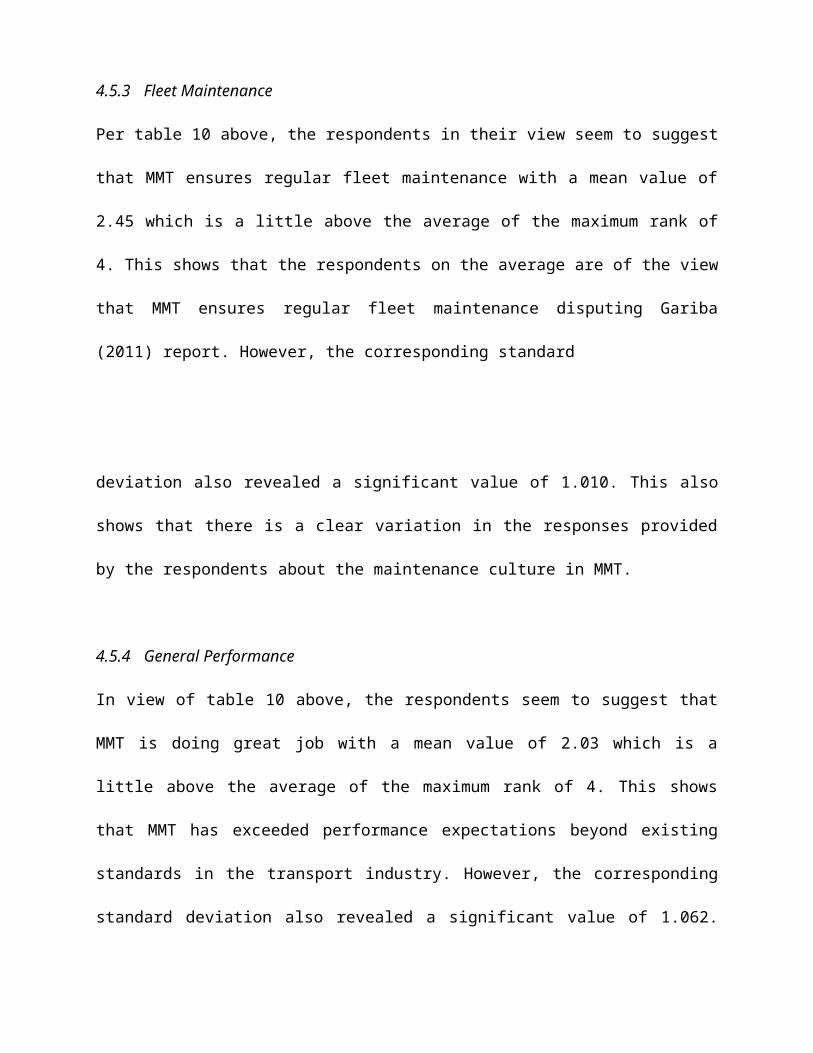
4.5.3 Fleet Maintenance
Per table 10 above, the respondents in their view seem to suggest
that MMT ensures regular fleet maintenance with a mean value of
2.45 which is a little above the average of the maximum rank of
4. This shows that the respondents on the average are of the view
that MMT ensures regular fleet maintenance disputing Gariba
(2011) report. However, the corresponding standard
deviation also revealed a significant value of 1.010. This also
shows that there is a clear variation in the responses provided
by the respondents about the maintenance culture in MMT.
4.5.4 General Performance
In view of table 10 above, the respondents seem to suggest that
MMT is doing great job with a mean value of 2.03 which is a
little above the average of the maximum rank of 4. This shows
that MMT has exceeded performance expectations beyond existing
standards in the transport industry. However, the corresponding
standard deviation also revealed a significant value of 1.062.

This also shows that there is a clear variation in the responses
provided by the respondents about the general performance of MMT.
4.5.5 Effectiveness in Solving Ghana’s Road Transport Problems
According to table 10 above, the respondents in their view seem
to suggest that MMT has come to solve our road transport problems
with a mean value of 2.47 which is a little above the average of
the maximum rank of 4. This shows, on the average, they are of
the view that our road transport problems are over. However, the
corresponding standard deviation also revealed a significant
value of 1.270. This also shows that there is a clear variation
in the responses provided by the respondents about MMT’s
effectiveness in solving Ghana’s road transport problems.
4.5.6 Departure and Arrival Times
According to table 10 above, the respondents in their view seem
to suggest that MMT has relatively reliable departure and arrival
times with a mean value of 2.63 which is a little above the
average of the maximum rank of 4. This shows, on the average,
they are of the view that,
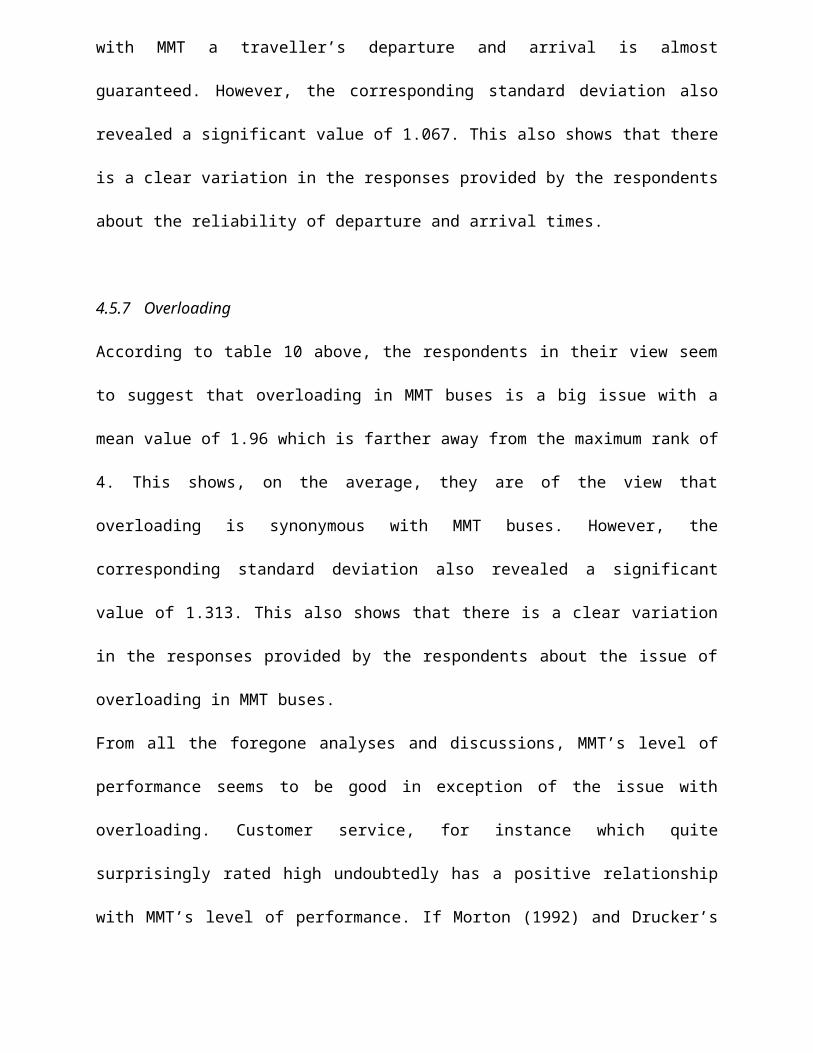
with MMT a traveller’s departure and arrival is almost
guaranteed. However, the corresponding standard deviation also
revealed a significant value of 1.067. This also shows that there
is a clear variation in the responses provided by the respondents
about the reliability of departure and arrival times.
4.5.7 Overloading
According to table 10 above, the respondents in their view seem
to suggest that overloading in MMT buses is a big issue with a
mean value of 1.96 which is farther away from the maximum rank of
4. This shows, on the average, they are of the view that
overloading is synonymous with MMT buses. However, the
corresponding standard deviation also revealed a significant
value of 1.313. This also shows that there is a clear variation
in the responses provided by the respondents about the issue of
overloading in MMT buses.
From all the foregone analyses and discussions, MMT’s level of
performance seems to be good in exception of the issue with
overloading. Customer service, for instance which quite
surprisingly rated high undoubtedly has a positive relationship
with MMT’s level of performance. If Morton (1992) and Drucker’s

(1999) assertion that organizational performance should be
measured in terms of customer satisfaction holds, then MMT’s
level of performance is encouraging. All the reasons cited under”
Assessment of challenges” are also relevant here.
CHAPTER FIVE
5.0 CONCLUSIONS AND RECOMMENDATIONS
Introduction
This chapter presents summaries of the study findings as per the
study objectives, conclusions based on those findings and
recommendations which are based on the study findings.
5.1 Summary
MMT has controls in place and probably as a result is less risky
and therefore more likely to achieve its set goals thereby
enhancing organizational performance. In exception of a few

areas, MMT has challenges implementing its set controls across-
board. It was evident that conditions of service was poor, low
motivation to excel, high likelihood of collusion, poor
maintenance culture as well as a bad asset replacement practice
all militating against effective implementation of the internal
control measures.
In view of the many challenges militating against the effective
implementation of MMT’s internal control measures, the level of
effectiveness per the empirical evidence was quite on the low
side. The study revealed that the level of performance in the MMT
is quite good as viewed from the lenses of passengers. However,
overloading was a huge concern.
In conclusion, MMT appears to be doing well but for its
overloading problem, undesirable maintenance culture, incoherent
asset replacement practice not forgetting the seemingly lack of
commitment to the vision of the organisation on the part of its
staff.
5.2 Recommendations
In view of the findings, the researcher makes the following
recommendations:

MMT should consider widening its portfolio of controls to include
other effective IT controls or adopt proven successful high-tech
systems as used by some of the most successful mass transit
systems in the world (Argentina BRT System for instance).
Drucker (1999) defines efficiency as maximizing inputs for a
required output. This suggests that the success of organisations
first depends on the people it employs. That said, the researcher
believes MMT would do greater if it pays a little attention to
its internal customers (staff).
There is a need to form or assign an authority that regulates the
rising number of cars in the city so that mechanisms be
introduced that induce modal shift from car commuting to the use
of public transport.
Accessibility to the public transport has an important role to
play in determining its ridership. This is determined by the
routes and the location of the stops and their coverage.
The MMT provides a good service from its side. But on the other
hand, the private vehicle ownership has a crucial influencing
factor in travel patterns. Referring to Accra, the use of private
automobile is expected to rise as they are becoming increasingly

cheaper in the market. As a result, more and more people,
including middle and low income group commuters are shifting
towards that area. The continuation of this trend could have a
negative impact on the share of the public transport. So, taking
this issue into consideration, some policies can be formulated
that makes public transport more attractive as compared to
private modes. For instance, vehicle pricing can be reformulated,
in terms of vehicle ownership cost, registration charge, vehicle
tax. Other measures could be, enforcing different regulatory
instruments, congestion pricing etc. These strategies could help
to minimize unnecessary use of the private vehicles and promote
towards the public transport usage. No matter, which strategy is
used, there is always a need of proper planning and appropriate
public-relation tactics for it to be successful.
Finally innovative ways of loading luggage as well as people is
another area the researcher points the attention of MMT. This MMT
can do by benchmarking the best in that class.
5.3 Limitations

Despite completing the dissertation successfully, some factors
however limited the researcher in his attempt to complete the
study. Some of which are the fact that the research was an
expensive venture and yet the researcher was constrained
financially.
Time constraint was yet another challenge for the researcher to
accomplish the study.
Respondents were very reluctant to attend to the researcher as
well as answering the
questionnaire. Finally, ongoing academic work at the researcher’s
university also
militated against the depth of work undertaken.
5.4 Further Studies
The study did not exhaust all the dependent variables that
influence organizational performance thus the need for other
researchers to conduct an exhaustive study on variables under
listed.
Leadership style and organizational performance
Organizational learning and organizational performance
Consumer behavior and organizational performance

REFERENCES
Amudo, A. & Inanga, E.L. (2009). Evaluation of internal control
systems: A case study from Uganda. International Research
Journal of Finance and Economics, ISSN 1450-2887 Issue 27,
pp.124-144.
Aucoin, P. & Jarvis, M.D, (2004), Accountability in Democratic
Governance and Public Management: A Framework for
Understanding the Canadian System. Ottawa, Canada School
of Public Service.

Beneish, M., Billings, M. and Hodder, L. (2008), “Internal
control weaknesses and information uncertainty”, The
Accounting Review, Vol. 83 No. 3, pp. 665-703.
Brown, T. J. (1996). Performance: Strategic Manager, Chicago:
St. Louis Press.
COBIT Internal Control Framework (2007), Available at:
http://www.isaca.org/AMTemplate.cfm?
Section=Downloads&Template=/ContentManagement/
ContentDisplay.cfm&ContentID=34172 (Accessed: 28th
February, 2013).
BARNEY, J (1991), Firm Resources and Sustained Competitive
Advantage, Journal of
Management, (Vol.17, pp. 99-120).
COSO Internal control framework (1992), Available at:
http://www.coso.org/documents/coso_framework_body_v6.pdf
(Accessed: 28th February, 2013).
Curtis C. Verschoor. (1999) Corporate Performance is Closely
Linked to a Strong Ethical
Commitment.

Dixion, J. R. (1990). The New Performance Challenge. Harvard
Business Review 69 – 78.
Doyle, J., Ge, W. and McVay, S. (2007b), “Determinants of
weaknesses in internal control over financial reporting”,
Journal of Accounting and Economics, Vol. 44 Nos 1/2, pp.
193-223.
Drucker, P. E. (1999). The Emerging Theories of Performance,
Harvard Business Review, June p. 94 – 102.
Farrugia, S. (2002), “A dangerous occupation? Violence in public
libraries”, New Library World, Vol. 103 No. 9, pp. 309-20.
Gariba, Chieminah Abudu. (May 13, 2011). How a Metro Mass Transit
Buss Nearly Cremated Its Passengers. In Peace FM Online.
Retrieved December 13, 2012, from
http://news.peacefmonline.com/features/201105/40740.php.
Gaskill, M. (2000), Crime and Mentalities in Early Modern
England, Cambridge University Press, Cambridge.
George, K. (1958). The civilized west looks at primitive Africa:
1400-1800 a study in

ethnocentrism. Isis. 49: 62-72.
Gupta (2001) from Statements of Standard Auditing Practices No. 6
(SAP 6).
Fage, J.D. (1969). Slavery and the slave trade in the context of
West African history. J. Afr.
History, 10: 393-404.
Hailey, W.M. (1938). An African survey. Oxford University Press,
London.
Henle, C.A. (2005), “Predicting workplace deviance from the
interaction between organizational justice and
personality”, Journal of Managerial Issues, Vol. 17 No. 2,
pp. 247-63.
Hotfreter K., (2004). Fraud in US organisations: ”An examination
of control mechanism”, Journal
of Financial Crime, 12(1), 88-94.

INTOSAI (2001). International Organisation of Supreme Auditing
Institution, Frame of internal control system.
Joan Joseph Castillo (Nov 15, 2009). Research Population.
Retrieved Jun 10, 2013 from
Explorable.com: http://explorable.com/research-population
Jones, M.J. (2008), “Dialogus de Scaccario (c.1179): the first
Western book on accounting?”
Kloot L. (1999). Performance Measurement And Accountability in
Victorian Local Government.
International Journal of Public Sector Management (Vol. 12
No 7 pp. 565-583).
Metro Mass Transit Limited. (2012). Tour through Ghana. Retrieved
from
http://www.metromass.com/tour_ghana.htm
Muhammad, P.M. (2003). Trans-Atlantic slave trade: A forgotten
crime against humanity as
defined by international law. Am. U. Intl'L. Rev., 19: 883-
883.

Nicolaisen, D.T. (2004), “Remarks before the 2004”, AICPA
National Conference on Current SEC and PCAOB Developments,
US Securities and Exchange Commission, Washington, DC.
Njoh, A.J. (2008). Implications of Africa’s transportation
systems for development in the era of
globalization. Rev. Black Political Econ., 35: 147-162.
Oyesiku, O. O. (2002). From Womb to Tomb. 24th Inaugural Lecture
at Olabisi Onabanjo
University on 27 August 2002. Ago-Iwoye: Olabisi Onabanjo
University Press.
Preston, B. (1981). Road safety: International comparisons.
Transport Rev.,1 1: 75-100.
Rodrigue J. & Notteboom T. (1998). Transportation and Economic
Development: the economic
importance of transportation. In Rodrigue J. & Notteboom T.
(3rd Ed). Retrieved from:
http://people.hofstra.edu/geotrans/eng/ch7en/conc7en/ch7c1en
.html

Rumelt R.P.(1994). Fundamental Issues in Strategy: A research
Agenda. Boston: Havard Business
School Press.
Shelton, S.W. and Whittington, O.R. (2008), “The influence of the
auditor’s report on investors’
evaluations after the Sarbanes-Oxley Act”, Managerial
Auditing Journal, Vol. 23 No. 2, pp. 142-60.
Thomas, R.G. (1973). Forced labour in British West Africa: The
case of the Northern territories of
the gold coast 1906-1927. J. Afr. History, 14: 79-103.
United Nations Economic and Social Council, Economic Commission
for Africa (2009, September
29). Africa Review Report on Transport. Retrieved on 12 June
2013 from the United Nations Economic and Social Council
website: http://sustainabledevelopment.un.org /content/
documents/AfricanReviewReport-on-TransportSummary.pdf.
Whyte, R. (1991). General Business Strategies and performance,
an Empirical Investigation, Strategic Management journal
7, p. 217 – 31.

Wright, C.J., Johnson, C.B, & Dorr, P.B.(2006).Employee
Recognition and Assessment of Fraud Scheme: an
International perspective, Petroleum Accounting and
Financial Management Journal 25(1), 17-40.