Human small-intestinal epithelium contains functional natural killer lymphocytes
Upload
khangminh22Category
view
2download
0
I hereby certify this document contains my own original work, and all references are cited and acknowledged.
signed
John Middendorf
Left and above: The Bluesat micro satellite showing the tray design.
PREFACE
The purpose of this assignment is to look at the peak vibration response of two different sat-ellite designs using the finite element analysis Patran/Nastran programs. The satellites are based on actual satellite designs but are greatly simplified, and modeled so as to have identi-cal dimensions and mass for comparison purposes.
The first satellite, the Bluesat, is a small unpowered communications satellite designed by stu-dents at the University of New South Wales. The launch date is scheduled in 2004. The main feature of the BLUEsat microsatellite structure is the configuration of the mainframe structure, a series of trays referred to as “module stack frames”. The module trays are stacked on top of one another to form the satellite mainframe structures. This satellite will be modeled as a stack of four frames bolted together with a single point mass payload of 10kg located at the center of the satellite on the middle tray. References: Web, http://www.bluesat.unsw.edu.au/
The second satellite is the Forte launched into orbit for the US Department of Energy in 1997, with the objective is to record atmospheric bursts of electromagnetic radiation. The Forte was one of the first all composite satellite structures and was exten-sively analyzed prior to launch, including its vibrations modes. The dynamic response char-acteristics of the composite satel-lite are affected by its relatively high stiffness and its low damping. Results of the actual satellite are shown here.
Above: the Forte satellite showing the frame structure. Below: the composite satellite being tested and analyzed.
Source: COMPOSITE SATELLITE STRUCTURE FOR FORTÉ Los Alamos National Laboratory (Proceedings from The Tenth International Conference on Composite Materials 1995)

MODELING THE SATELLITESFor the purposes of the assignment, simplified models were created in Patran and analyzed using Nastran finite element software. Dimensions are based on the last digit of my student number (1), specifying L=220mm. The BlueSat was modeled as four simple trays bolted to-gether with a cover plate on the top. All side, floor, and top plates were modeled as 4mm thick, and the corner posts were modeled as 22mm square beams.
Left: Dimensions. Above: BlueSat simplifications.
For the model of Forte design, a simple frame with alternating cross sectional diagonal braces structure replaced the tray design. The frame cross section spec was given as 50mm square, with a thick-ness determined by equalizing the mass of the structure to be identi-cal to the Bluesat model. The model also included a 4mm thick floor panel on the bottom of each of the frame trays. Note that the 50mm square beam is an unlikely size in conjunction with the specified governing dimension(L=220mm), as the trays are only 55mm high(L/4). However, for modeling the idea is to look at how a square tubular reinforced deck improves the frequency response.
MATERIAL: Material for both satellites was modeled as aluminum with a tensile strength of 71 GPa, a Poisson ratio of 0.334, and a density of 2710 kg/m3.
DAMPING COEFFICIENT: Structural damping ratios for the structures was input within the material property section as 0.07 based on Robert Cook’s recommendation for bolted struc-tures (p. 234).
UNITS: Throughout the analysis care was taken to enter a consistent unit system, as the pro-grams uses dimensionless values. Input values are scaled from a normal N*kG*m*s system into a N*Mg*mm*s system.
Dimension Unit Example = Units input in PatranLength mm (10-3 m) 210mm 210Mass Mg (106 grams) 15 kg(modeled weight of satellite w/ 10kg payload) 15 e-3 (0.015)Force Mg mm/s2 (N) 4 g load on 15 e3 Mg (4 x 9810 mm/s2 x15 e3 Mg) 5.89 e8 Pressure Mg /mm s2 (106 Pa) 1 Pascal (N/m2) 1 e-6Density Mg/mm3 (1012 kg/m3) 2710 kg/m3 (density of Aluminum) 2.71 e-9Elastic Modulus Mg /mm s2 (106 Pa) 71 GPa 71 e3 (71000)
Above: two of the four “frame trays” for modeling the Forte satellite.
L
L/4
L/10

MODELING STRATEGYGeneral ProcedureUsing Patran, extensive use of groups was utilized to aid in the modeling of the satellites. A coarse mesh was initially created and an initial analysis run, then the mesh was refined and more extensive analyses were performed. The general procedure was thus:
1. Create the Geometry of a single tray. Groups were created based on the geometry and properties. For the BlueSat, 3 groups were created for the tray design: beams, floor plate, and side plates. For the Forte, 4 groups were created: horizontal beams, vertical beams, diagonal beams, and floor plate. Once the groups for a single tray were created, it was a simple matter to transform each group to create additional trays, though some care was required in the case of the Forte design so as to not duplicate structural members.
2. Next, enter Materials and Properties of the structure. The material throughout was aluminum (proper-ties listed previous page, including damping coefficient of 0.07). Since the properties were all aligned with the geometry, properties were assigned to the geometry which allowed ease of refining the mesh (although, for safe measure, the properties were reapplied to each group after each mesh creation/refinement). Beams were modeled as 1D Beams using sections from the Patran beam library (22mm solid square for the BlueSat, 50mm hollow square for the Forte), with orientation vectors aligned perpendicular to the base. Each group of beams (with different orientations) were assigned a unique property set with the orientation vector aligned ap-propriately. Plates were modeled as 2D Shells, with a thickness of 4mm.
3. Create Elements. Two meshes were created for each design: a coarse mesh and a fine mesh (note: normal mode and frequency response results were nearly identical for both meshes in each design, which indicated that an additional finer mesh was not required). The general procedure was to create mesh seeds on each group, then mesh the elements, prior to mesh seeding and meshing the next group. This ensured consistent and deliberate meshing results. Curves were modeled as bar2 elements, and surfaces as quad4 isomeshes. More advanced elements were not considered necessary for this modal and frequency response analysis. Initial coarse meshes had an element length of 20, while the fine meshes had an element length of 10. Finally, all groups were posted and Equivalence task was performed, eliminating many duplicate nodes.
4. Add the Lumped payload mass. The first task was to check the mass of the entire structure and to check for realistic accuracy. This was done using the Tools>Mass Properties command in Patran. (results=5.6e-3) Then, using Elements, a point element was created at the center of the middle tray. Then, in Properties, a 0D lumped payload mass of 10KG was created and assigned to the point element in the center of the struc-ture. Again total mass was checked (results= 1.56e-2) This completed the structural modeling of each satel-lite.
5.Next, in Loads/BC, fix the bottom four corners in the x and y directions using a translation vector input of <0,0, >. Actually, tests were run without this boundary condition, but as we were mainly interested in the ver-tical frequency response of the structure, fixing the bottom four corners of the satellite in the x and y directions allowed for a more relevant result set.
6. In Analysis, run a Normal Modes analysis which gives the natural frequencies of vibration (harmonic fre-quencies) of the structure. Check normal modes and frequencies using a quickplot of translational eigenvec-tors in Results.
7. Add the 4g vertical force. In Elements, create a point element at the center of the bottom tray. In Proper-ties, add a 0D lumped point mass that is 106 times the mass of the structure (1.5e4). In Loads/BC, add the vertical force that corresponds to 4g (<0 0 5.886 e8>). This force is automatically multiplied by a timewise sine function in the frequency response analysis.
8. Finally, in Analysis, run a Frequency Response analysis, create XY plots in Results of displacement verses frequency, and refine results further with specific subcase parameter frequency ranges depending on the range of interest.

MODELS
Above: BlueSat beam and plate structure--single tray (with coarse mesh). Note the center point in the floor plate which was considered necessary for the point ele-ments for the loads.
Above: Forte beam structure . Points were created, then linked with curves. Groups were used to produce successive layers.
Above: BlueSat 4 tray structure. (fine mesh). Beams shown in 3d view. Note the use of Groups on right. After some consideration, the side panels were mod-eled as bonded (nodes were equivalenced), Initial tests indicated that the frequency response of floor plates were relatively independent of side plate bonding. The model has a bonded panel on top which is based on the actual design.
Above: Forte completed model. Shown in 1D view of beams. Note the use of groups on the right which were chosen based on the property values required for each individual orientation of beam direction. Floors are 4mm plate structures. The top lacks a plate structure as this more accurately represented the actual design.
Above: Initial test of single tray normal modes, and modal shape for first harmonic frequency (196 Hz).
Above: 3D full span view of Forte beam structure. Note that the 50mm specified beam dimension nearly completely fills in the 220mm x 220mm x 220 mm structure. Joint connec-tions are default. This prompted some thought as to how Nastran actually analyzes beam connections. Since the area of frequency response interest in the frequency response of the floor plates, the line modeling of beams was considered adequate.

RESULTSTests were fun for both the fine and coarse mesh versions of the satellite structures. The re-sults were nearly identical, as shown below for the BlueSat coarse and fine mesh. Forte coarse and fine mesh runs were also nearly identical. Furthermore, the Nastran recommends 5 to 10 grid points per half cycle of response amplitude, both meshes are within these limits. The fine mesh results are presented hereafter.
ABOVE: Coarse mesh Normal Mode results and Frequency Response XY displacement vs. frequency plot. First har-monic frequency at 37.7 Hz,second harmonic at 120.0Hz (note: slightly different boundary condition applied)
ABOVE: Coarse mesh Normal Mode results and Frequency Response XY plot (displacement vs. frequency). First har-monic frequency at 37.8Hz, second at 120.6Hz. Note almost identical results of frequency response from coarse mesh at left.BlueSat Normal Modes
Above: BlueSat Normal Modes results. Fringe plot of first harmonic frequency. The sideplate and beam groups have been unposted for clarity. The BlueSat has a low first harmonic frequency of 37.8 Hz, and a second harmonic frequency at 120Hz. At the first harmonic frequency, we see a modal shape that includes displacement of all the floor plates, with larger displace-ments of the two floorplates at the point at which the point masses were added. Note the opposing displacements of the two point masses. This image represents the moment when the force on the larger mass is at a minimum (-4g), while the payload massʼs inertia is responding accordingly.

BlueSat Frequency Response
Left: The Frequency Response XY plot of displacements vs. frequency for the BlueSat satellite. We see a large peak at around 37 Hz of around 12mm displace-ment. The unsupported 4mm thick floor plate in resonance will displace 11 mm in both directions under the sinusoidal load condition. This is a large displacement and would be unsatisfactory if delicate instruments were installed in the satel-lite. However, in reality, the BlueSat is an unpowered communications satellite and is unlikely to receive a force input that would approach its natural harmonic frequency.
Left: a close up of the region of inter-est with 100 divisions of frequency between the ranges of 25Hz and 50Hz. Here we can find a more exact value of the displacement. From the chart, we find the maximum displacement of 11.2 mm at 37 Hz.
Above: XY plot in the region of the second harmonic frequency and modal shape at the second harmonic frequency. The plot gives results of 0.11mm at 120Hz. Note that in the second harmonic frequency the lower mass and middle mass are in phase with eachother (at the first harmonic, they were 180 degrees out of phase with eachother).
Summary of BlueSat Displacement Results
First Frequency = 37.8 HzMax. displacement = 11.2 mm
Second Frequency = 120 HzMax displacement = 0.11mm

BlueSat Large Mass Force Response
Forte AnalysisBefore launching into the Forte analysis proper, and with the Bluesat results still in mind, it is interesting to look at the Forte design without the diagonal cross braces. Results are similar to the Bluesat design, indicating that the differences of the Forte design are largely due to the diagonal cross braces below the floor plate.Below is the result from a run of the Forte Satellite design without the diagonal cross braces underneath the floor plate. Normal modes are similar to the BlueSat design (first harmonic frequency at 33Hz, and second harmonic frequency at 105Hz). Displacements are likewise similar to the BlueSat design. What this indicates is that the weight savings from using a tubular structure over a plate design can be applied to adding floor reinforcements to improve the frequency response of a design.
Above: XY plots of the Large Mass displacement response from the 4g force. The first chart (left) shows a gradual decline in displacement, as would be expected: as the frequency of the applied load increases, the force approaches a steady value and the inertia of the mass is not accelerated. Right: close up of displacement in the region of the first harmonic frequency. Displacement at 37 Hz=0.75mm. This allows us to check the input values, below.
Check of the force inputTheoretically, with no damping, once motion on a mass begins as a result of a force, the mass vibrates with simple harmonic motion, with the instantaneous displacement=amplitude * sin(wt), where w (omega) is given in radians. Differentiating, we get: acceleration = w2 *amplitude* sin(wt), which is at a maximum when sin(wt) =1. Since we know the acceleration (4g), we solve: 4*9810=0.75*(37*2*pi)2, which solves: 39240=40534, an error of 3.3%.
Left: Forte frame design results with the diagonal cross braces under the floor plates removed.

Forte Results: Normal Modes
Above: Forte Normal Modes results. Fringe plot of first harmonic frequency. The Forte has a higher first harmon-ic frequency of 156.9 Hz, and a second harmonic frequency at 534.1Hz. At the first harmonic frequency, we see a modal shape that includes displacement of all the floor plates, with larger displacements of the two floorplates at the point at which the point masses were added. Again we see 180 degree out-of-phase opposing displacements of the two point masses. This image represents the moment when the force on the larger mass is at a maximum (4g), while the payload massʼs inertia is responding accordingly.
Normal Mode Result DiscussionBoth satellites have similar modal deformations, but the BlueSat first and second harmonic frequencies (37.8Hz and 120Hz) are much lower than for the Forte design (157Hz and 534Hz). This is expected as the tubular beam structure is much more rigid than the plate structure. The floor plates are modeled identically, but the Forte has the addition of two 50mm square tubular beams supporting the floor. This clearly stiffens the structure and increases the frequencies of the normal modes.
Tubular BeamsIn order to equalize the masses of the two satellites (5.6KG), the square tubular beam thick-ness was set at 0.66mm, very thin for such a large tubular beam. Further analysis would indi-cate investigating buckling modes of this structure, but this analysis did not encompass stress analysis.
Forte Frequency Response
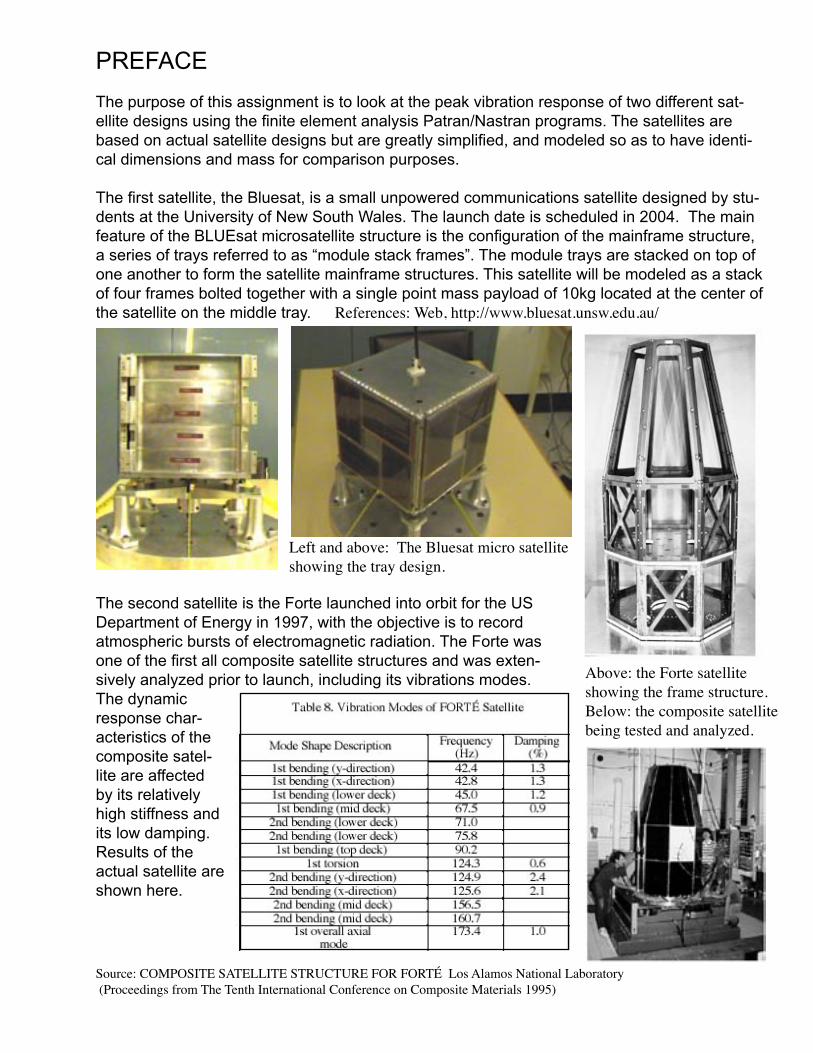
Left: Frequency response of the Forte Satellite. As predicted by the normal mode analysis, we see a peak at around 150 Hz, with a smaller bump somewhere around 550 Hz. Displacements are much lower than the BlueSat design, at around 0.7mm. The curve does not have a static value at zero frequency, as it should. This is probably because the satellite is not constrained by fixed boundary conditions and the software plots the calculated zero frequency displace-ments (rigid body modes), which physically relate to the unbounded travel of the satellite structures under a given force.
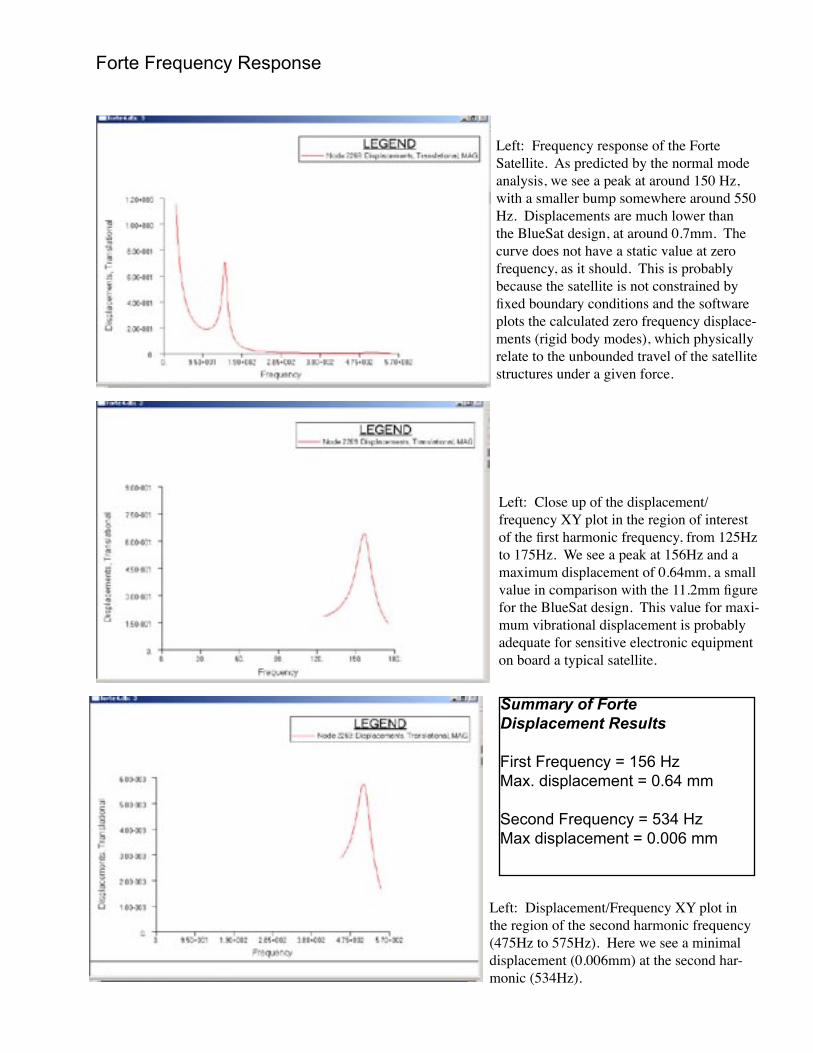
Left: Close up of the displacement/frequency XY plot in the region of interest of the first harmonic frequency, from 125Hz to 175Hz. We see a peak at 156Hz and a maximum displacement of 0.64mm, a small value in comparison with the 11.2mm figure for the BlueSat design. This value for maxi-mum vibrational displacement is probably adequate for sensitive electronic equipment on board a typical satellite.
Left: Displacement/Frequency XY plot in the region of the second harmonic frequency (475Hz to 575Hz). Here we see a minimal displacement (0.006mm) at the second har-monic (534Hz).
Summary of ForteDisplacement Results
First Frequency = 156 HzMax. displacement = 0.64 mm
Second Frequency = 534 HzMax displacement = 0.006 mm

Forte large mass force response
Above: XY plots of the Large Mass displacement response from the 4g force in the Forte satellite. The first chart (left) shows a gradual decline in displacement, as would be expected: as the frequency of the applied load increases, the force approaches a steady value and the inertia of the mass is not accelerated. Right: close up of displacement in the region of the first harmonic frequency. Displacement at 156Hz=0.041mm. This allows us to check the input values, below.
Check of the force inputTheoretically, with no damping, once motion on a mass begins as a result of a force, the mass vibrates with simple harmonic motion, with the instantaneous displacement=amplitude * sin(wt), where w (omega) is given in radians. Differentiating, we get: acceleration = w2 *amplitude* sin(wt), which is at a maximum when sin(wt) =1. Since we know the acceleration (4g), we solve: 4*9810=0.041*(156*2*pi)2, which solves: 39240=39391, an error of 0.4%.
SummaryFinal results show a difference by a factor of 17.5 between the maximum vibrational displace-ment of the Bluesat design (11.2mm at 37Hz) and the Forte frame design (0.64mm at 157Hz). Much of the discussion of the results is included in the captions of the images already pre-sented above. To summarize, although many assumptions were made in modeling the two satellite designs, a frame structure of the same given mass of a plate structure offers more rigidity, has higher natural frequencies, and will displace less at the maximum resonance. As-sumptions included the way the structure was modeled (rigid corners), damping coefficient, mass considerations, and boundary conditions. The models used a damping coefficient of 0.07, which is recommended by Cook for bolted structures. The damping coefficient is the ratio of the amount of damping as a percentage of critical damping (no oscillation) and influ-ences the maximum displacement for a given vibrational frequency (if damping =0, displace-ment of a forced response goes to infinity). Clearly, the damping value chosen affects the values presented here. The payload mass was modeled as a point mass, which also could affect the vibrational modes. A distributed load could offer more accurate results. In regard to boundary conditions, the model was underconstrained as is allowed in vibration analyses though the bottom corners were fixed in the x and y directions. Unfixing the corners gave slightly different results in regards to the harmonic frequencies (but not in the critical regime in the first and second natural frequencies). In summary, the models presented here give a good indication of two approaches to satellite design and the Nastran/Patran finite element analysis gives viable results for determining modal shapes, harmonic frequencies, and forced vibration responses of a structure.
References: Cook, Robert D. Finite Element Modeling for Stress Analysis. John Wiley and Sons, 1995.Nastran/Patran Manuals.
Copyright © 2022 FDOKUMEN