Multisensor Fusion for Atrial and Ventricular Activity Detection in Coronary Care Monitoring
20
Multisensor Fusion for Atrial and Ventricular Activity Detection in Coronary Care Monitoring Alfredo I. Hernández, Guy Carrault , Fernando Mora , Laurent Thoraval, Gianfranco Passariello and Jean M. Schleich Abstract— Information management for critical care monitoring is still a very difficult task. Medical staff is often overwhelmed by the amount of data provided by the increased number of specific monitoring devices and instrumentation, and the lack of an effective automated system. Specifically, a basic task such as arrhythmia detection still produce an important amount of undesirable alarms, due in part to the mechanistic approach of current monitoring systems. In this work, multi-sensor and multi-source data fusion schemes to improve atrial and ventricular activity detection in critical care environments are presented. Applications of these schemes are quantitatively evaluated and compared with current methods, showing the potential advantages of data fusion techniques for event detection in noise corrupted signals. Index Terms—CCU monitoring, P-wave detection, Ventricular activity detection, Systemic arterial pressure, Optimal decentralized data fusion. I. INTRODUCTION Critical care monitoring has been the subject of many studies in order to increase its effectiveness, from the information management point of view. In this sense, it does not escape from the explosion of information sources and handling methodologies seen in other non-medical monitoring applications such as: strategic defense, satellite tracking, automatic supervision of industrial processes, petroleum pipeline transport surveillance, space flights, and so on. Proper integration of these sources and methodologies is a need in modern critical care monitoring. Coronary Care Units (CCUs), have been dedicated to the follow up of cardiac patients under recovery, either during ischaemic episodes or after myocardial infarction. Mainly, they are devoted to the prevention and control of fatal and of non-fatal arrhythmias, and to specific therapeutic follow-up. In order to pursue this task, many physiological observations are routinely acquired in a typical CCU, among them: several channels of ECG, blood pressure, blood chemestry, clinical observations, and even echo doppler data. These sensors and data are not easily combined by machines, mainly due to the mechanistic approach in which they are implemented, and the differences in data sources. The information "fusion", to produce a meaningful interpretation for the decision making process, is left to the experience of the attending cardiologist and nurses whose responsibility goes as far to collect, classify, organize and This material is presented to ensure timely dissemination of scholarly and technical work. Copyright and all rights therein are retained by authors or by other copyright holders All persons copying this information are expected to adhere to the terms and constraints invoked by each author's copyright. In most cases, these works may not be reposted without the explicit permission of the copyright holder. HAL author manuscript inserm-00134401, version 1 HAL author manuscript IEEE Trans Biomed Eng 1999;46(10):1186-90
-
Upload
independent -
Category
Documents
-
view
4 -
download
0
Transcript of Multisensor Fusion for Atrial and Ventricular Activity Detection in Coronary Care Monitoring
Multisensor Fusion for Atrial and Ventricular
Activity Detection in Coronary Care Monitoring
Alfredo I. Hernández, Guy Carrault , Fernando Mora , Laurent Thoraval, Gianfranco Passariello and Jean M. Schleich
Abstract— Information management for critical care monitoring is still a very difficult task. Medical staff is
often overwhelmed by the amount of data provided by the increased number of specific monitoring devices and
instrumentation, and the lack of an effective automated system. Specifically, a basic task such as arrhythmia
detection still produce an important amount of undesirable alarms, due in part to the mechanistic approach of
current monitoring systems. In this work, multi-sensor and multi-source data fusion schemes to improve atrial
and ventricular activity detection in critical care environments are presented. Applications of these schemes are
quantitatively evaluated and compared with current methods, showing the potential advantages of data fusion
techniques for event detection in noise corrupted signals.
Index Terms—CCU monitoring, P-wave detection, Ventricular activity detection, Systemic arterial pressure,
Optimal decentralized data fusion.
I. INTRODUCTION
Critical care monitoring has been the subject of many studies in order to increase its effectiveness, from the
information management point of view. In this sense, it does not escape from the explosion of information sources and
handling methodologies seen in other non-medical monitoring applications such as: strategic defense, satellite tracking,
automatic supervision of industrial processes, petroleum pipeline transport surveillance, space flights, and so on. Proper
integration of these sources and methodologies is a need in modern critical care monitoring.
Coronary Care Units (CCUs), have been dedicated to the follow up of cardiac patients under recovery, either during
ischaemic episodes or after myocardial infarction. Mainly, they are devoted to the prevention and control of fatal and of
non-fatal arrhythmias, and to specific therapeutic follow-up. In order to pursue this task, many physiological
observations are routinely acquired in a typical CCU, among them: several channels of ECG, blood pressure, blood
chemestry, clinical observations, and even echo doppler data. These sensors and data are not easily combined by
machines, mainly due to the mechanistic approach in which they are implemented, and the differences in data sources.
The information "fusion", to produce a meaningful interpretation for the decision making process, is left to the
experience of the attending cardiologist and nurses whose responsibility goes as far to collect, classify, organize and
This material is presented to ensure timely dissemination of scholarly and technical work.Copyright and all rights therein are retained by authors or by other copyright holders All persons copying this information are expected to adhere to the terms and constraints invoked by each author's copyright.In most cases, these works may not be reposted without the explicit permission of the copyright holder.
HA
L author manuscript inserm
-00134401, version 1
HAL author manuscriptIEEE Trans Biomed Eng 1999;46(10):1186-90

interpret massive data, both redundant and complementary, in order to construct an appropriate mental image of the
pathophysiological state of the patient [1].
Attempts to reduce this information handling stress in time-critical environments have been undertaken by many
researchers and groups. Automatic arrhythmia detection has been the subject of extensive work, due to the need of a fast
response when life-threatening events occur. Nevertheless, most systems still produce undesirable alarms and are prone
to confuse artifacts with rhythms, becoming quite ineffective in every day practice, and making human observation and
monitoring mandatory. Currently, mostly ventricular arrhythmias are detected. Ischaemic episode trending requires
special methodologies which are still under development [2] and atrial arrhythmias have proven to be a rather elusive
problem due to the difficulties inherent to P-wave detection.
This paper presents some ideas to enhance current methods of cardiac rhythm monitoring. The approach undertaken
seeks to integrate, with the usual ECG signals, complementary data from haemodynamic processes or from other
electrical signals such as the esophageal ECG (EECG). A data fusion paradigm [3] is proposed to handle the
information integration approach. As such, the following aspects have been developed: i) Data fusion examples,
combining multi-sensor and multi-source information ii) Presentation of explicit technical solutions and, iii)
Quantitative performance measurements for the particular tasks chosen, by means of Receiver Operational
Characteristics (ROC) curve analysis [4].
In this work, data fusion techniques have been applied to the detection of fundamental cardiac events, namely the
ventricular activity (VA) and the atrial activity (AA) –represented respectively by the QRS complex and the P-wave in
the ECG. Evaluation of AA and VA detection schemes has been performed for an initial set of real and simulated
signals, in order to present the advantages of the data fusion approach. With a proper detection of these two activities, a
more accurate characterization of the cardiac rhythm can be achieved, particularly for differential diagnoses between
ventricular and supra-ventricular tachycardia [5].
II. CLINICAL EXAMPLES OF DATA FUSION
A. Association of ECG and haemodynamic signals
Haemodynamic signals are analyzed usually in a punctual basis either during diagnostic procedures in the cath lab, or
during continuous bedside monitoring. Although being of heterogeneous nature, both the ECG and haemodynamic
signals, such as the Impedance Cardiograph or Blood Pressure, have information mutually correlated due to the
physiological interrelation of the mechanical and electrical functions of the heart. In medical practice, this existing
interconnection has been very rarely exploited for rhythm analysis purposes.
HA
L author manuscript inserm
-00134401, version 1

A simple example of this effect is shown in figure 1. The ECG signal by itself, even using three leads, would be
interpreted by an automatic recognition system as showing ventricular couplets. Further analysis of the haemodynamic
signal invalidates this hypothesis, suggesting that the second event can be interpreted as an artifact by simply observing
the absence of a systolic peak in concordance with the second candidate QRS, since noise sources in the ECG and the
haemodynamic signal are decorrelated.
In critical situations where the ECG is missing (leads off), or degraded (patient movement or electrosurgery) classic
detection systems behave like an erratic alarm generator. Joint analysis by means of additional sensors, such as the
ventricular pressure signal, may allow the preservation of a window to monitor the cardiac rhythm, assuring patient
monitoring. Nowadays, data fusion with electromechanic information still comprises several obstacles to its application
in automatic supervision, mainly because they are obtained by invasive techniques. Nevertheless, these procedures are
still widely used in current CCU units, awaiting newer non invasive ways to collect information from haemodynamic
processes, such as automatic oscillometric blood pressure measurement.
INSERT FIGURE 1 HERE
Fig.1. Multi-source fusion (electrical and mechanical): 3 ECG leads (upper panel) and intra-ventricular pressure (lower panel).
Analysis of ECG traces suggest the presence of two ventricular couplets. Analysis of pressure curves allows us to invalidate this
hypothesis and to re-establish the more probable diagnosis of a unique ventricular extrasystole followed by an artifact. The presence
of a premature ventricular contraction (PVC) in the ECG lead induced a ventricular pressure fall linked to the short coupling time
(point 1) and an increase of pressure superior than the average (Point 2) due to the compensation rest following a PVC (the ventricle
presents a lengthened filling time).
B. ECG-EECG association
The interest in this case is the differential diagnosis between supra-ventricular and ventricular arrhythmias, observing
the heart's electrical function alone. In addition to the surface ECG, the EECG is used to obtain an enhanced atrial
activity representation (A-wave) which directly correlates to the P-wave in the surface ECG. Some proposed methods of
automatic arrhythmia recognition perform essentially the location and identification of the A-wave, allowing the
analysis of the atrio-ventricular conduction and its dysfunction [6,7]. Enhancement of the atrial electrical activity in the
EECG allows to distinguish supra-ventricular arrhythmias with aberrant conduction from arrhythmias of ventricular
origin, such as those depicted figure 2. This task is still rather difficult to perform in current CCU applications, due to
the possibility of wave superposition (i.e. P-wave immersed in the QRS or T-waves). Besides its application on supra-
ventricular arrhythmias, fusion of the surface ECG and the EECG allows the distinction between sinus tachycardia,
HA
L author manuscript inserm
-00134401, version 1

atrial flutter, tachysystole, atrial fibrillation, and also between tachycardia with intra-nodal reentries and those using a
secondary path (beam of Kent)[8,9].
INSERT FIGURE 2 HERE
Fig. 2. Example of electrical sources printouts (a) ECG (upper panel); (b) Acquired esophageal ECG (EECG) (middle panel); and (c)
filtered EECG (lower panel). Although the P-wave is not visible on the whole surface ECG printout, the atrial activation wave in the
EECG (A-wave) is particularly predominant, notably after signal processing of the EECG. Analysis of the EECG allows us to refute
the hypothesis of ventricular tachycardia that could have been diagnosed by the analysis of the ECG alone (a) and keep the more
probable diagnosis of supraventricular tachycardia with bundle branch block.
III. MULTISENSOR FUSION APPROACHES
A general structure applicable to both VA and AA detection is presented in figure 3. It is based in a distributed
detection scheme of n!2 pre-processors fed by a set of k!1different sensors (Sk,n). Each pre-processor is composed of: i)
a nonlinear transformation to enhance the activity of interest, ii) a sensor association stage (SA) in order to minimize
false alarms, and iii) a global fusion node of local decisions. Every pre-processor produces a local detection of the
activity of interest (u1,…,un) which is merged by a general data fusion stage, to produce a final decision u by means of a
fusion rule f(u1,…,un).
Two realizations of this general structure have been implemented and evaluated: the first one is focused on VA
detection based on ECG and pressure signals, and the second on AA detection from the ECG and the EECG. In each
case, particular pre-processors have to be developed. They are described in the following sections.
INSERT FIGURE 3 HERE
Fig. 3. General detector structure based on a distributed detection scheme.
A. Ventricular activity detection
In this section, mono-source and multi-source VA detection methods are presented. In the case of mono-source
detection, two pre-processors are used, each one fed by a different ECG lead (n=2, S1,1=ECG lead I, S1,2=ECG lead II).
For the multi-source implementation, three pre-processors are used: two pre-processors are fed by different ECG leads,
as previously, and the third by a SAP signal (n=3, S1,1=ECG lead I, S1,2=ECG lead II, S1,3=SAP).
HA
L author manuscript inserm
-00134401, version 1

The first level in each pre-processor acts as a pre-detector of ventricular activity. It is based on the use of the
following methods:
! QRS detector reported by Gritzali [10],
! A matched filter, adapted to the systolic ejection slope of the haemodynamic signal, for the detection of the
increase of ventricular pressure [11].
In low-noise situations, the same number (Nv) of ventricular events are estimated from the QRS and systolic ejection
detectors, with a time delay between them. For a given patient showing a regular sinus rhythm, this physiological delay
(!) between the electrical and mechanical myocardial activation can be considered as a random variable following a
Normal law P"(!) with mean µEMD and variance #EMD, as suggested by Thoraval in [12]. Also, the association stage
appears quite simple and consists to artificially re-synchronize the electrical and mechanical activities by introducing a
delay of !=µEMD on the ECG channels, in order to assure the coherence of decisions taken on each pre-processor, before
the fusion node.
B. Atrial activity detection
Two pre-processors are used in this implementation (n=2). Each one has two input signals: one providing mainly a
good representation of VA, (S1,i=SV,i) and the second (S2,i=SA+V,i) being a good index of AA. Obviously, this second
signal will also present ventricular information, which will be considered as impulsive noise for that channel. Pre-
processor 1 will acknowledge a decision when a P-wave is detected in the ECG (SA+V,1=SV,1=ECG), and Pre-processor 2
will acknowledge a decision when an A-wave is detected in the EECG (SA+V,2=EECG; SV,2=ECG).
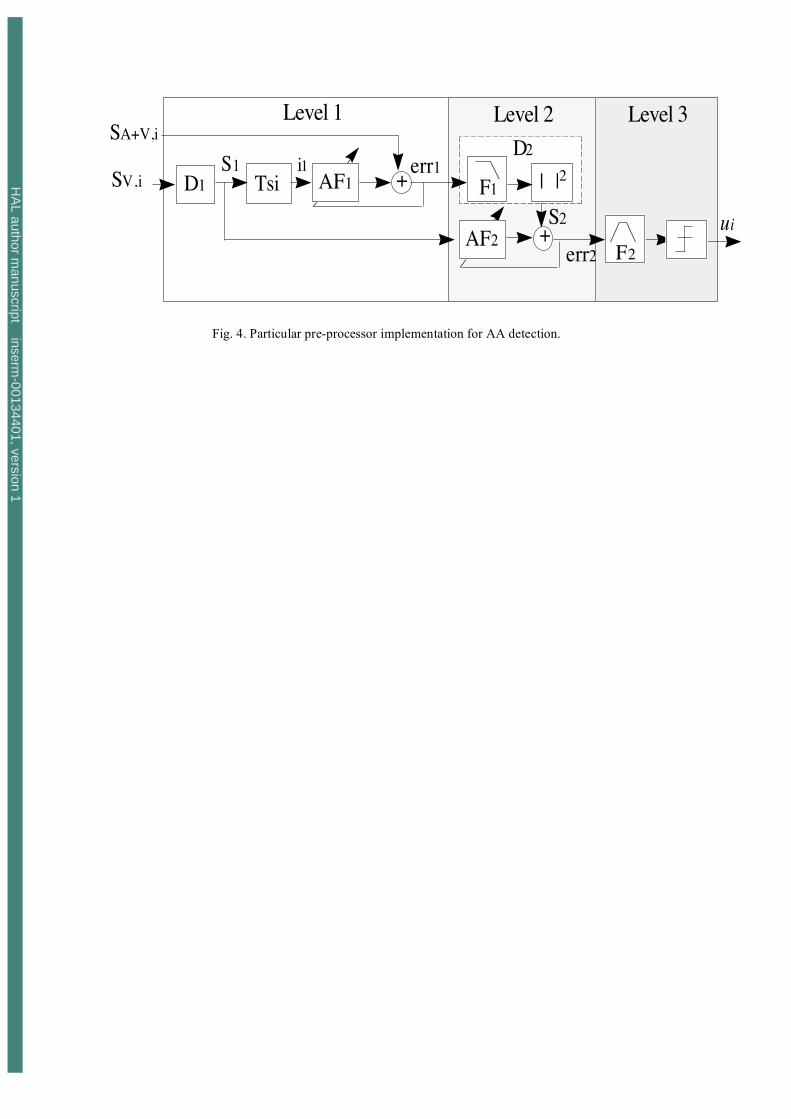
INSERT FIGURE 4 HERE
Fig. 4. Particular pre-processor implementation for AA detection.
Actual preprocessor implementation for AA detection is done as follows [13]: The first level is based on the method
proposed by Thakor and Yi-Sheng [14] which cancels the ventricular activity by means of the QRS-T adaptive filter
AF1. This adaptive filter is fed by VA detection impulses (i1), previously generated by mmodules D1 and Tsi. More
precisely, AF1 is an impulse-response filter having as weights an inverted template of the QRS-T, adaptively calculated.
Gritzali's QRS detection algorithm [10] was used for D1.
The second level performs the sensor association and involves a second adaptive filter AF2 (i.e. optimal Wiener
filtering). Module D2 consists of a low-pass filter (F1) tuned to the spectral band of the P-wave, and a square-law
envelope transformation. The resulting signal (S2) is introduced in AF2, in which an index of the undesired ventricular
HA
L author manuscript inserm
-00134401, version 1
activity (S1) is used as reference. This level aims to eliminate remaining ventricular activity in S2, mainly due to the
detection jitter, sharp morphological changes (such those produced by a PVC) or missed QRS detections, by taking into
account the correlated information between S1 and S2.
The third level proceeds to the detection of P-waves by means of a classical filter (F2) and thresholding, to obtain a
local atrial activity detection (ui), used as input to the final data fusion stage. Design of filters F1 and F2 is based on the
spectral analysis of several P-waves and QRS complex residuals, in order to separate at best the two spectral bands.
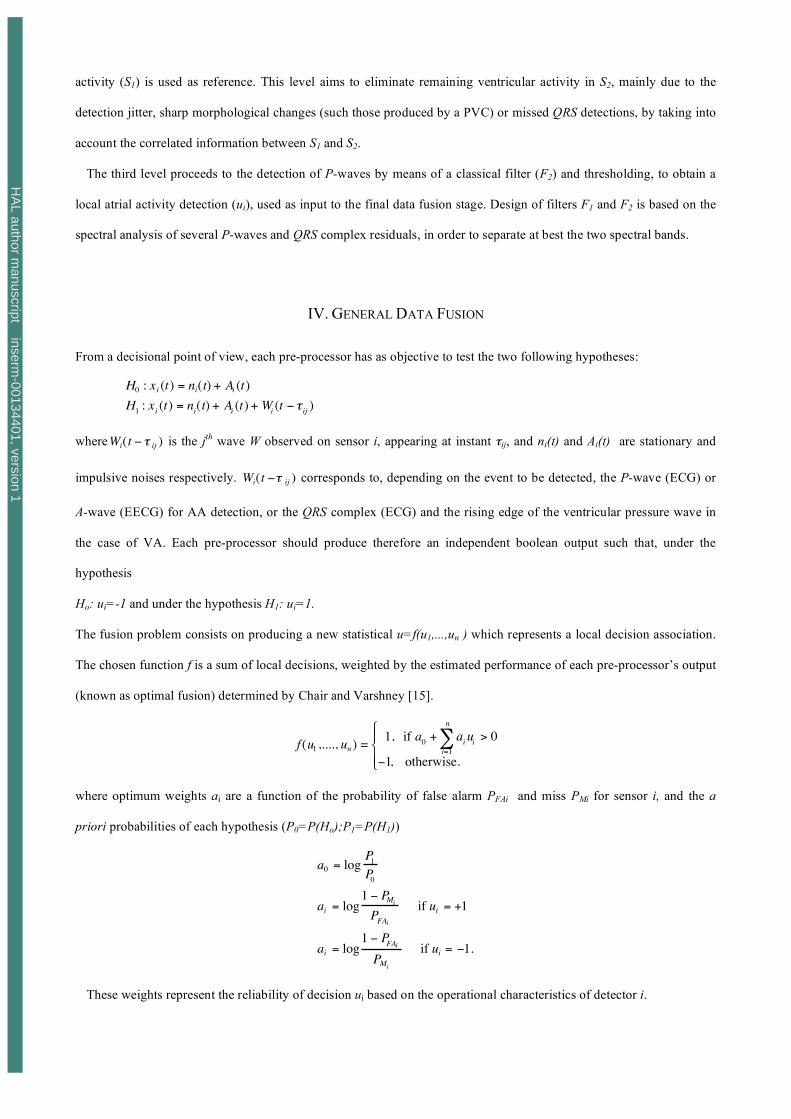
IV. GENERAL DATA FUSION
From a decisional point of view, each pre-processor has as objective to test the two following hypotheses:
H0 : xi (t) = ni(t) + Ai (t)
H1: x
i(t) = n
i(t) + A
i(t) + W
i(t ! "
ij)
whereWi(t ! " ij ) is the jth wave W observed on sensor i, appearing at instant $ij, and ni(t) and Ai(t) are stationary and
impulsive noises respectively. Wi(t !" ij ) corresponds to, depending on the event to be detected, the P-wave (ECG) or
A-wave (EECG) for AA detection, or the QRS complex (ECG) and the rising edge of the ventricular pressure wave in
the case of VA. Each pre-processor should produce therefore an independent boolean output such that, under the
hypothesis
Ho: ui=-1 and under the hypothesis H1: ui=1.
The fusion problem consists on producing a new statistical u=f(u1,...,un ) which represents a local decision association.
The chosen function f is a sum of local decisions, weighted by the estimated performance of each pre-processor’s output
(known as optimal fusion) determined by Chair and Varshney [15].
f (u1 ,...., un ) = 1, if a
0+ a
iui
> 0i=1
n
!"1, otherwise.
#
$ %
& %
where optimum weights ai are a function of the probability of false alarm PFAi and miss PMi for sensor i, and the a
priori probabilities of each hypothesis (P0=P(Ho);P1=P(H1))
a0 = logP
1
P0
ai = log1 ! PM
i
PFAi
if ui = +1
ai = log1 ! P
FAi
PMi
if ui = !1.
These weights represent the reliability of decision ui based on the operational characteristics of detector i.
HA
L author manuscript inserm
-00134401, version 1

For all performance measurements, sensor fusion was calculated for equivalent PFA on each local detector involved.
Probabilities P0 and P1 are estimated from the annotations of the event of interest.
V. RESULTS
A. Detection of ventricular activity
Before proceeding further, some important aspects deserve to be clarified. In spite of the fact that multi-sensor
detection of the QRS complex is supposed to be a relatively well known problem nowadays, nevertheless, very few
works have attempted to describe the mathematical laws which govern the optimal or the most suitable association
scheme for accurate event detection. Regarding this point, several questions can be posed. Do the association have to be
global as suggested by Gritzali? Or can it make use of local detections with a fusion of decisions, in a decentralized
detection scheme?
Results of multi-source fusion were obtained using the IMPROVE European database, corresponding to recordings
collected during 24-hour ICU monitoring [12]. This database is constituted of multiple signals from different sources,
including two ECG channels, systemic arterial pressure (SAP), pulmonary arterial pressure (PAP), central venous
pressure (CVP), carbon dioxide concentration (C02), oxygen concentration (02), air flow (AWF) and the airway
pressure (AWP). Patient record KUOOOO7 was used for testing. This particular recording was chosen because it
presents many periods of high and low frequency noise and sensor failure, as well as different pathological rhythms.
Several segments were selected from the record and concatenated together in order to artificially reconstruct a recording
with 5738 cardiac cycles, containing intermixed noisy and clean periods. Also, annotations were made for each
ventricular activity representation in the ECG and SAP channels.
Figure 5 presents ROC curves obtained from each individual sensor (ECG1, ECG2 and SAP), from a centralized
detection scheme based on the multidimensional length transformation proposed by Gritzali (GRIT2D), and from
distributed detection with optimal data fusion of the three available sensors (OPT). Optimal data fusion was also
calculated for ECG sensors alone showing the same curve of ECG lead 1 -due to the reduced performance of the local
detector applied to ECG lead 2-, and providing higher performances than the centralized detection (GRIT2D).
INSERT FIGURE 5 HERE
Fig. 5. ROC curve of ventricular activity detection measured from record KUO007 of the IMPROVE European database.
HA
L author manuscript inserm
-00134401, version 1

Also, a previous study on 10 files of the MIT-BIH arrhythmia database [16], containing two ECG channels, has been
undertaken in our laboratory. Applying Gritzali's algorithm for each individual sensor (ECG1 and ECG2), it emerged
from this study that the decentralized approach with an optimal local fusion (OPT) presents superior performances than
those shown by the centralized approach (GRIT2D). These results are consistent with those shown in figure 5.
Finally, regarding the multi-source data fusion, results show that the gain in detection accuracy obtained by jointly
considering both electrical and mechanical sources produced by the cardiovascular system is quite important when
compared to the mono-sensor analysis of the ECG signal.
B. Detection of atrial activity
Validation of these methods was undertaken using real signals recorded in an ambulatory setting at the “Fundación
Venezolana de Cardiología”. The selected record is composed of a single ECG lead and an esophageal ECG channel.
The proposed structure was compared with three methods previously presented in the literature for AA detection:
those by Gritzali [17], Thakor [14] (to which a supplementary detection stage was added), and Jenkins[6]. For the
EECG, Jenkins proposed a simple scheme for A-wave detection based on filtering and thresholding. In this work,
Gritzali's algorithm, included into the preceding detection scheme, was adapted to the case of the A-wave in the EECG
signal.
1) Sensor Association: Performance evaluation at the second level of each pre-processor (which consists to reduce the
impulsive noise related to QRS suppression) was done in order to quantify the gain obtained in this stage. An estimation
of the signal-to-noise ratio (SNR) at the output of each level is presented in this section for the case of pre-processor 2
(combination of EECG and ECG signals). The SNR for beat b and sensor s, is defined as:
SNRb
s= 10 log10
ˆ E b(P2 )
ˆ E b (QRS2)
!
" #
$
% &
where Ê(P2) and Ê(QRS2) represent an estimate of the energy of the P-wave and QRS complex respectively. A boxplot
is presented in figure 6 showing the increase in the SNR accomplished by the association stage, and clearly justifying its
utilization.
INSERT FIGURE 6 HERE
Fig. 6. Boxplot of the SNR between the energies of the atrial and ventricular activities from a surface ECG, an EECG and the output
of level 1 (Prep2, L1) and level 2 (Prep2, L2) for pre-processor 2.
HA
L author manuscript inserm
-00134401, version 1
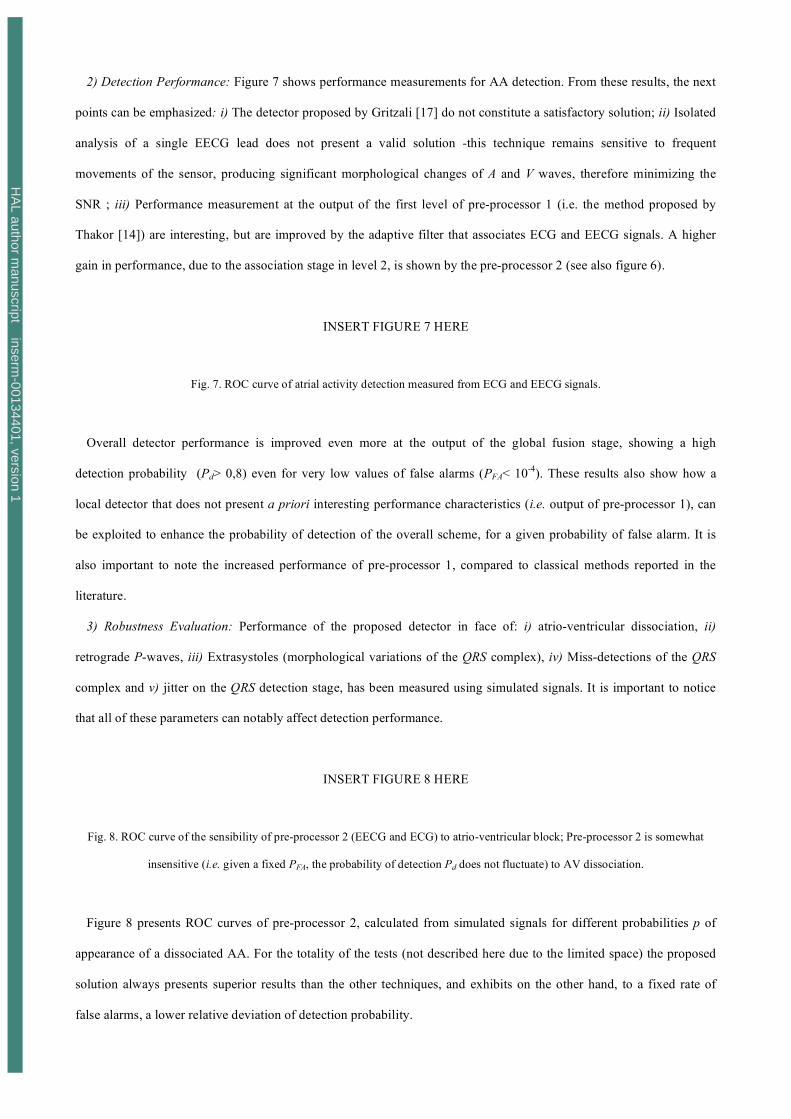
2) Detection Performance: Figure 7 shows performance measurements for AA detection. From these results, the next
points can be emphasized: i) The detector proposed by Gritzali [17] do not constitute a satisfactory solution; ii) Isolated
analysis of a single EECG lead does not present a valid solution -this technique remains sensitive to frequent
movements of the sensor, producing significant morphological changes of A and V waves, therefore minimizing the
SNR ; iii) Performance measurement at the output of the first level of pre-processor 1 (i.e. the method proposed by
Thakor [14]) are interesting, but are improved by the adaptive filter that associates ECG and EECG signals. A higher
gain in performance, due to the association stage in level 2, is shown by the pre-processor 2 (see also figure 6).
INSERT FIGURE 7 HERE
Fig. 7. ROC curve of atrial activity detection measured from ECG and EECG signals.
Overall detector performance is improved even more at the output of the global fusion stage, showing a high
detection probability (Pd> 0,8) even for very low values of false alarms (PFA< 10-4
). These results also show how a
local detector that does not present a priori interesting performance characteristics (i.e. output of pre-processor 1), can
be exploited to enhance the probability of detection of the overall scheme, for a given probability of false alarm. It is
also important to note the increased performance of pre-processor 1, compared to classical methods reported in the
literature.
3) Robustness Evaluation: Performance of the proposed detector in face of: i) atrio-ventricular dissociation, ii)
retrograde P-waves, iii) Extrasystoles (morphological variations of the QRS complex), iv) Miss-detections of the QRS
complex and v) jitter on the QRS detection stage, has been measured using simulated signals. It is important to notice
that all of these parameters can notably affect detection performance.
INSERT FIGURE 8 HERE
Fig. 8. ROC curve of the sensibility of pre-processor 2 (EECG and ECG) to atrio-ventricular block; Pre-processor 2 is somewhat
insensitive (i.e. given a fixed PFA, the probability of detection Pd does not fluctuate) to AV dissociation.
Figure 8 presents ROC curves of pre-processor 2, calculated from simulated signals for different probabilities p of
appearance of a dissociated AA. For the totality of the tests (not described here due to the limited space) the proposed
solution always presents superior results than the other techniques, and exhibits on the other hand, to a fixed rate of
false alarms, a lower relative deviation of detection probability.
HA
L author manuscript inserm
-00134401, version 1

VI. CONCLUSION
Two schemes, based on a proposed general structure for multi-sensor event detection, were implemented and tested in
this work: one for AA detection and another for VA detection. Three different preprocessor implementations have been
used in the evaluated schemes, for sensor association and local detection, depending on the types of signals used as
inputs, and the activity to be detected. The interest of this work was not to substitute the clinical use of the surface ECG,
which still remains as far the more robust technique to characterize cardiac arrhythmias, but to simply show that
automatic monitoring of the cardiovascular system can be vastly improved by combining the ECG with other signals.
Results show clearly the improvement in performance and robustness obtained from both the sensor association stage
and the final atrial and ventricular activity detection, when different types of cardiovascular signals are combined into a
data fusion model, suggesting that the presented detection schemes can lead to a better automatic classification of
cardiac arrhythmias.
Regarding VA detection, the multi-source scheme showed a greater Pd for a given PFA than any other evaluated
method. A fixed delay was used to associate asynchronous events detected from different sources. Also other
association methods, such as adaptive estimation of time delays, are currently being evaluated. In the multi-sensor
detection of AA, based on surface and esophageal ECG leads, the proposed detection structure provided an increased
detection performance and robustness.
Obviously, the amount of redundant and complementary information obtained from each local detector is crucial to
the fusion process. In most cases, sensors observing different sources of the same activity of interest are more likely to
offer complementary information and to produce increased detection performances. However, important gains in
performance are also obtained from multi-sensor/mono-source detection schemes, by means of the decentralized
optimal rule.
It is important to notice that the implementation of the fusion rule used in this work depends on an on-line or batch
estimation of the performance characteristics of each local detector (PFAi, PMi), and a-priori probabilities of the
confronted hypothesis (P0, P1). Development in this sense is being carried out as part of our project in intelligent
monitoring, concerning the adaptation of the proposed algorithms for real-time applications and real-time algorithm
switching, based on the estimation of the acquisition environment state (clean, noisy, very noisy) [18].
Although the proposed data fusion model has been only applied in this work to the UCC/ICU environment, its
extension to other biomedical applications such as pacemaker control and intra-cardiac defibrillation is also possible. In
the case of pacemaker control, an esophageal signal could acknowledge the correct use and placement of pacing
electrodes, and the stability of the P-wave detected by the pacemaker [19]. In the case of intra-cardiac defibrillation, the
HA
L author manuscript inserm
-00134401, version 1

jointed evaluation of electrical stimuli and its mechanical response could lead to optimize the quality and energy of the
stimuli.
ACKNOWLEDGEMENTS
The authors would like to thank Dr. María I. Hernández, and the Fundación Venezolana de Cardiología, for the
acquisition and annotation of ECG and EECG signals.
This work has been supported in part by Project BID-CONICIT E-08, and the PCP-GBM Cooperation Program.
REFERENCES
[1] F. Mora, G. Passarielllo, G. Carrault, J. P. Le Pichon, "Intelligent patient monitoring and Management Systems : A
review," IEEE Eng Med, Biol. Mag., vol. 12, pp. 23-33, 1993.
[2] A. Bosjnak, G. Bevilacqua, F. Mora F, G. Passariello, B. Sanso, G. Carrault, "An approach to intelligent Ischaemia
monitoring," Med. Biol. Eng. Comp., vol. 33, pp. 749-756, 1995.
[3] D. Hall, Mathematical techniques in multisensor data fusion. Artech House, MA, 1992.
[4] J. Michaelis, J. Willems, "Performance Evaluation of Diagnostic ECG Programs" In : Computers in Cardiology
1988. Los Alamitos: IEEE Computer Society Press, pp. 25-30, 1988.
[5] R. LeBlanc, "Quantitative Analysis of Cardiac Arrhythmias," CRC Crit. Rev. in Biom.. Eng., vol. 14, no.1, pp. 1-43,
1986.
[6] J. Jenkins, "Automated Electrocardiography and Arrhythmia Monitoring," Prog. Card. Dis. vol. 25. no. 5, pp. 367-
408, 1983.
[7] J. Jenkins, R. C. Arzbaecher, "Computer diagnosis of Supraventricular and Ventricular Arrhythmias. A new
esophageal technique," Circulation, vol. 60, pp. 977-987, 1979.
[8] W. H. Brown, "A study of the esophageal lead in clinical electrocardiography, Part I," Am. Heart J., vol. 12, pp. 1-
45, 1936.
[9] W. H. Brown, "A study of the esophageal lead in clinical electrocardiography, Part II," Am. Heart J., vol. 12, pp.
307-381, 1936.
[10] F. Gritzali, "Towards a genralized scheme for QRS detection in ECG waveforms," Signal Processing, vol. 15, pp
183-192, 1988.
[11] I. Pino, Aplicación de la Fusión de Datos para la detección robusta de eventos cardíacos. Masters Thesis. Caracas,
Venezuela, Universidad Simón Bolívar, 1998.
[12] "The IMPROVE Project," IEEE Eng Med, Biol. Mag., vol. 16, no. 6, 1997.
HA
L author manuscript inserm
-00134401, version 1

[13] A.I. Hernández, G. Carrault, F. Mora, G. Passariello, M.I. Hernández, J Schleich. "Quantitative Comparison of
Atrial Activity Detection Approaches". In: Computers in Cardiology 1997. Los Alamitos: IEEE Computer Society
Press, pp. 481-484, 1997
[14] N. Thakor, Z. Yi-Sheng. "Applications of Adaptive Filtering to ECG Analysis: Noise Cancellation and Arrhythmia
Detection," IEEE Trans. Biom. Eng, vol. 38, no. 8, pp. 785-794, 1991.
[15] Z. Chair, P. Varshney. "Optimal data fusion in multiple sensor detection systems," IEEE Trans. Aer. Electr. Syst,
vol. AES-22, no. 1, pp. 98-101, 1986.
[16] G. B. Moody, R. G. Mark, "The MIT-BIH Arrhythmia Database on CD-ROM and Software for use with it," In :
Computers in Cardiology 1990. Los Alamitos: IEEE Computer Society Press, pp. 185-188, 1990.
[17] F. Gritzali, G. Frangakis, G. Papakonstantinou, "Detection of the P and T waves in an ECG," Comp. Biom. Res.,
vol. 22, pp. 83-91, 1989.
[18] G. Le Certen, T. Soulas, G. Carrault, J. P. Le Pichon,"SIMBAD: Intelligent ECG Monitoring System (A real-time
software implementation)," Proc. 8th Int. IMEKO Conf. on Meas. in Clin. Med., pp. 3.11-3.14, 1998.
[19] M. G. Bongiorni, E. Soldati, L. Paperini, "Evaluation of rate-responsive pacemakers by transesophageal Holter
monitoring of spontaneous atrial rate," PACE, vol. 13, pp. 1755-1760, 1990.
HA
L author manuscript inserm
-00134401, version 1

Fig.1. Multi-source fusion (electrical and mechanical): 3 ECG leads (upper panel) and intra-ventricular pressure (lower
panel). Analysis of ECG traces suggest the presence of two ventricular couplets. Analysis of pressure curves allows us
to invalidate this hypothesis and to re-establish the more probable diagnosis of a unique ventricular extrasystole
followed by an artifact. The presence of a premature ventricular contraction (PVC) in the ECG lead induced a
ventricular pressure fall linked to the short coupling time (point 1) and an increase of pressure superior than the
average (Point 2) due to the compensation rest following a PVC (the ventricle presents a lengthened filling time).
H
AL author m
anuscript inserm-00134401, version 1

Fig. 2. Example of electrical sources printouts (a) ECG (upper panel); (b) Acquired esophageal ECG
(EECG) (middle panel); and (c) filtered EECG (lower panel). Although the P-wave is not visible on the
whole surface ECG printout, the atrial activation wave in the EECG (A-wave) is particularly predominant,
notably after signal processing of the EECG. Analysis of the EECG allows us to refute the hypothesis of
ventricular tachycardia that could have been diagnosed by the analysis of the ECG alone (a) and keep the
more probable diagnosis of supraventricular tachycardia with bundle branch block.
HA
L author manuscript inserm
-00134401, version 1

General Data
Fusion
u=ƒ(u1,..., u n)
u1
un
Preprocessor 1
Enhancement of the activity
of interest
Sensor association
S1,1
Sk,1
.
.
.
.
Local event
detection
Enhancement of the activity
of interest
Sensor association
S1,n
Sk,n
.
.
Local event
detection
Level 1 Level 2 Level 3
Preprocessor n
Level 1 Level 2 Level 3
Fig. 3. General detector structure based on a distributed detection scheme.
HA
L author manuscript inserm
-00134401, version 1
AF1
S1 i1+SV,i
AF2 +S2
err2
ui
SA+V,i
D1 Tsi | |2
D2
F1
F2
Level 1 Level 2 Level 3
err1
Fig. 4. Particular pre-processor implementation for AA detection.
HA
L author manuscript inserm
-00134401, version 1
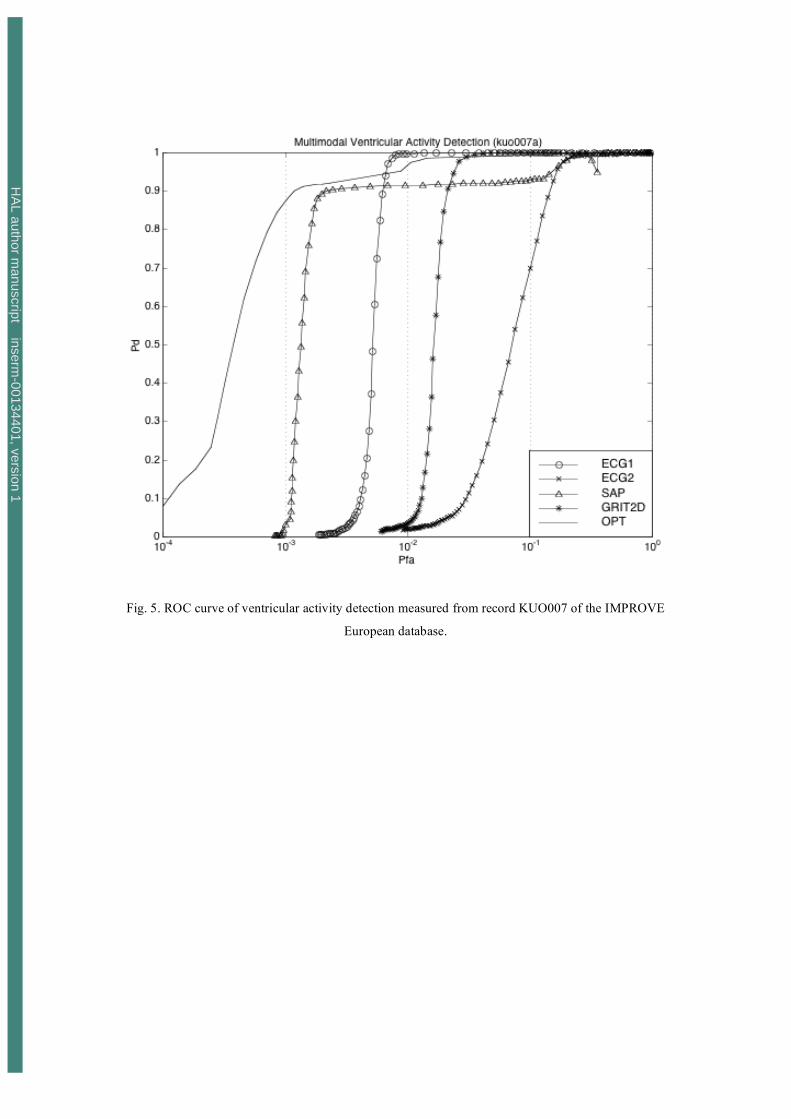
Fig. 5. ROC curve of ventricular activity detection measured from record KUO007 of the IMPROVE
European database.
HA
L author manuscript inserm
-00134401, version 1

Fig. 6. Boxplot of the SNR between the energies of the atrial and ventricular activities from a surface
ECG, an EECG and the output of level 1 (Prep2, L1) and level 2 (Prep2, L2) for pre-processor 2.
HA
L author manuscript inserm
-00134401, version 1

Fig. 7. ROC curve of atrial activity detection measured from ECG and EECG signals.
HA
L author manuscript inserm
-00134401, version 1

Fig. 8. ROC curve of the sensibility of pre-processor 2 (EECG and ECG) to atrio-ventricular block;
Pre-processor 2 is somewhat insensitive (i.e. given a fixed PFA, the probability of detection Pd does not
fluctuate) to AV dissociation.
HA
L author manuscript inserm
-00134401, version 1