
Multiple sclerosis-related proteins identified in cerebrospinal fluid by advanced mass spectrometry
10
RESEARCH ARTICLE Multiple sclerosis-related proteins identified in cerebrospinal fluid by advanced mass spectrometry Marcel P. Stoop, Lennard J. Dekker, Mark K. Titulaer, Peter C. Burgers, Peter A. E. Sillevis Smitt, Theo M. Luider and Rogier Q. Hintzen Laboratories of Neuro-Oncology / Clinical and Cancer Proteomics, Department of Neurology, Erasmus University Medical Centre, Rotterdam, The Netherlands A total of 164 cerebrospinal fluid (CSF) samples taken from neurological patients were classed into four groups according to the clinical diagnosis: multiple sclerosis (MScl, n = 44), clinically isolated syndrome of demyelination (CIS, n = 40), other inflammatory neurological disease (OIND, n = 26) and other neurological disease (OND, n = 54). After tryptic digestion, the samples were measured by MALDI-TOF MS. Spectra were analyzed using the R-project software package, in which a peak detection algorithm was developed. Subsequently, the peak lists were compared based on ranked data (non-parametric). Significant differences were observed in the comparisons of MScl vs. OND and CIS vs. OND. The comparisons of MScl vs. OIND, and CIS vs. OIND showed fewer significant differences. No significant differences were found in comparisons MScl vs. CIS and OIND vs. OND. MScl and CIS had strikingly similar profiles, probably a reflection of common pathological mechanisms. Three differentially expressed proteins in the comparison of MScl vs. OND were identified: chromogranin A, a potential marker for neurodegeneration; and two important factors in complement-mediated inflammatory reaction, clusterin and complement C3. CSF chromo- granin A levels were confirmed to be significantly elevated in the MScl group using an ELISA. Received: May 8, 2007 Revised: December 10, 2007 Accepted: December 21, 2007 Keywords: Cerebrospinal fluid / Differentially expressed peptides / Multiple sclerosis 1576 Proteomics 2008, 8, 1576–1585 1 Introduction Multiple sclerosis (MScl) is a complex disease of the CNS with presumed autoimmune origin [1]. Its pathology is characterized by a combination of inflammation, demyeli- nation and axonal damage [2]. These processes are not uni- formly represented across patient populations but can pre- dominate selectively in individual patients, contributing to the heterogeneity of phenotypic expression of the disease [3]. Due to the complex nature of the disease, there is prob- ably no single protein or peptide that can serve as a bio- marker for MScl in a clinically relevant way. However, indi- viduals with MScl might be differentiated from healthy individuals by a proteomic pattern consisting of a set of dis- tinct individual proteins or peptides that are not independ- ently reliable indicators of disease state. Because the disease process in MScl is located in the CNS, cerebrospinal fluid (CSF) is a promising body fluid in which to search for bio- markers and disease-associated proteins and peptides [4, 5]. The absence of an active clotting system in CSF compared to serum makes it an attractive bio-fluid to perform proteomic studies. Biomarkers for MScl could potentially identify rele- vant biological pathways for MScl, which could help clarify currently unsolved issues in the pathology and etiology of the Correspondence: Dr. Theo M. Luider, Laboratories of Neuro- Oncology/Clinical and Cancer Proteomics, Department of Neurol- ogy, Erasmus University Medical Centre, P.O. Box 1738, 3000 DR Rotterdam, The Netherlands E-mail: [email protected] Fax: 131-10-408-8365 Abbreviations: CIS, clinically isolated syndrome (of demyelina- tion); CSF , cerebrospinal fluid; FTMS, Fourier transform mass spectrometer; MScl, multiple sclerosis; OIND, other inflamma- tory neurological diseases; OND, other (non-inflammatory) neu- rological diseases; PP , primary progressive (multiple sclerosis); RR, relapsing remitting (multiple sclerosis); XC, Xcorrelation score DOI 10.1002/pmic.200700446 © 2008 WILEY-VCH Verlag GmbH & Co. KGaA, Weinheim www.proteomics-journal.com
Transcript of Multiple sclerosis-related proteins identified in cerebrospinal fluid by advanced mass spectrometry

RESEARCH ARTICLE
Multiple sclerosis-related proteins identified in
cerebrospinal fluid by advanced mass spectrometry
Marcel P. Stoop, Lennard J. Dekker, Mark K. Titulaer, Peter C. Burgers,Peter A. E. Sillevis Smitt, Theo M. Luider and Rogier Q. Hintzen
Laboratories of Neuro-Oncology / Clinical and Cancer Proteomics, Department of Neurology,Erasmus University Medical Centre, Rotterdam, The Netherlands
Atotal of 164 cerebrospinal fluid (CSF) samples taken from neurological patients were classed intofour groups according to the clinical diagnosis: multiple sclerosis (MScl, n = 44), clinically isolatedsyndrome of demyelination (CIS, n = 40), other inflammatory neurological disease (OIND, n = 26)and other neurological disease (OND, n = 54). After tryptic digestion, the samples were measuredby MALDI-TOF MS. Spectra were analyzed using the R-project software package, in which a peakdetection algorithm was developed. Subsequently, the peak lists were compared based on rankeddata (non-parametric). Significant differences were observed in the comparisons of MScl vs. ONDand CIS vs. OND. The comparisons of MScl vs. OIND, and CIS vs. OIND showed fewer significantdifferences. No significant differences were found in comparisons MScl vs. CIS and OIND vs.OND. MScl and CIS had strikingly similar profiles, probably a reflection of common pathologicalmechanisms. Three differentially expressed proteins in the comparison of MScl vs. OND wereidentified: chromogranin A, a potential marker for neurodegeneration; and two important factorsin complement-mediated inflammatory reaction, clusterin and complement C3. CSF chromo-granin A levels were confirmed to be significantly elevated in the MScl group using an ELISA.
Received: May 8, 2007Revised: December 10, 2007
Accepted: December 21, 2007
Keywords:
Cerebrospinal fluid / Differentially expressed peptides / Multiple sclerosis
1576 Proteomics 2008, 8, 1576–1585
1 Introduction
Multiple sclerosis (MScl) is a complex disease of the CNSwith presumed autoimmune origin [1]. Its pathology ischaracterized by a combination of inflammation, demyeli-
nation and axonal damage [2]. These processes are not uni-formly represented across patient populations but can pre-dominate selectively in individual patients, contributing tothe heterogeneity of phenotypic expression of the disease [3].
Due to the complex nature of the disease, there is prob-ably no single protein or peptide that can serve as a bio-marker for MScl in a clinically relevant way. However, indi-viduals with MScl might be differentiated from healthyindividuals by a proteomic pattern consisting of a set of dis-tinct individual proteins or peptides that are not independ-ently reliable indicators of disease state. Because the diseaseprocess in MScl is located in the CNS, cerebrospinal fluid(CSF) is a promising body fluid in which to search for bio-markers and disease-associated proteins and peptides [4, 5].The absence of an active clotting system in CSF compared toserum makes it an attractive bio-fluid to perform proteomicstudies. Biomarkers for MScl could potentially identify rele-vant biological pathways for MScl, which could help clarifycurrently unsolved issues in the pathology and etiology of the
Correspondence: Dr. Theo M. Luider, Laboratories of Neuro-Oncology/Clinical and Cancer Proteomics, Department of Neurol-ogy, Erasmus University Medical Centre, P.O. Box 1738, 3000 DRRotterdam, The NetherlandsE-mail: [email protected]: 131-10-408-8365
Abbreviations: CIS, clinically isolated syndrome (of demyelina-tion); CSF, cerebrospinal fluid; FTMS, Fourier transform massspectrometer; MScl, multiple sclerosis; OIND, other inflamma-tory neurological diseases; OND, other (non-inflammatory) neu-rological diseases; PP, primary progressive (multiple sclerosis);RR, relapsing remitting (multiple sclerosis); XC, Xcorrelationscore
DOI 10.1002/pmic.200700446
© 2008 WILEY-VCH Verlag GmbH & Co. KGaA, Weinheim www.proteomics-journal.com

Proteomics 2008, 8, 1576–1585 Systems Biology 1577
disease [6]. Additionally, biomarkers could also be useful as anew method for diagnosis of MScl, which might enable ear-lier detection of the disease, or as a tool to identify clinicallyrelevant subgroups. Earlier detection, and subsequently earlytreatment, will retard the long-term evolution of the disease[7].
Recently, a study was published in which a cleavageproduct of the protein Cystatin C was identified as a potentialbiomarker for a subgroup of MScl [8]. However, a later reportsuggests that this cleavage product is merely a freezing arti-fact caused by freeze-thaw cycles [9]. Further research isrequired to clarify this. Other studies used pooled CSF sam-ples of MScl patients after ultrafiltration [10] or 2-DE [11] assample preparation steps in their efforts to identify proteinsin human CSF.
The objective of this study was to examine CSF peptideprofiles of MScl patients in order to identify the peptides andproteins that differ between the patient groups. UsingMALDI-TOF MS, we analyzed 164 CSF samples. After tryp-tic digestion of the CSF proteins, the peptide mixtures weremeasured by MALDI-TOF MS and subsequently analyzedusing a bioinformatics tool [5]. MALDI MS was used in thisstudy because it is well suited for high-throughput peptideprofiling, as it is a relatively fast and accurate way of analyz-ing complex protein and peptide mixtures. Although it isalso a useful tool for the identification of peptides and pro-teins, we also confirmed the identifications by moreadvanced MS techniques (MALDI-FTMS and ESI-Orbitrap).The ESI-orbitrap also identified an additional eight peptidesthat were not identified by the MALDI-TOF/TOF experi-ments.
2 Materials and methods
2.1 Patient selection
All samples analyzed in this study were taken from patientsthat were followed prospectively by the Rotterdam MultipleSclerosis Center and the department of Neurology at Eras-mus University Medical Center (Rotterdam, The Nether-lands). The samples were all specifically selected fromuntreated patients. These samples were selected and classi-fied into four groups by an experienced neurologist (RQH).The first designated group consisted of CSF samples frompatients suffering from multiple sclerosis (MScl, n = 44). Thesecond group consisted of samples from patients who werediagnosed with a clinically isolated syndrome of demyelina-tion (CIS, n = 40), which is considered a pre-stage of MScl.The third group of samples was taken from patients withanother inflammatory neurological disease (OIND, n = 26),to be used as controls. The fourth group, which was also acontrol group, consisted of samples from patients with someother neurological disease (OND, n = 54). All these diagnoseswere based on data derived from the examination at the timethe CSF sample was taken.
Immediately after sampling, the CSF samples werecentrifuged for 10 min at 3000 rpm to discard cells andcellular elements. The samples were subsequently used forroutine CSF diagnostics. This included quantification oftotal protein and high abundant protein (albumin and IgG)concentration, assessment of the number of oligoclonalbands, which are present in most, but not all MScl patients,as well as quantification of the intrathecal cell count. Theremaining volume of the samples was aliquoted and storedat 2807C, where they remained until sample preparationfor this study.
2.2 Sample preparation
Prior to all sample preparation procedures, all samples wereblinded. They were subsequently measured and analyzed ina random order. Twenty microliters of each CSF sample wasput into a 96-microtiter well plate (Nunc, Low binding, VWR,The Netherlands), and an equal amount of 0.2% Rapigest(Waters, USA) in 50 mM ammonium bicarbonate buffer wasadded to each well. Following a 2-min incubation period at377C, 4 mL 0.1 mg/mL gold grade trypsin (Promega, USA)/3 mM Tris-HCl (pH 8.0) was added to each well. The sampleswere incubated at 377C for 2 h. To obtain a final concentra-tion of 30–-50 mM HCl (pH ,2), 2 mL of 500 mM HCl wasadded. The samples were then incubated for 45 min at 377C,which stopped the digestion reaction.
Following the digestion procedure, the samples weredesalted using 96-well zip C18 microtiter plates (Millipore,USA), which had been pre-wetted and washed twice with100 mL ACN per well. The microtiter plates were centrifuged(Multifuge 3 S-R, Goffin Meyvis, The Netherlands) at 2000rpm for 5 min. After the washing step, 3 mL ACN was put onthe C18 resin to prevent drying. Each trypsin-digested CSFsample was mixed with 200 mL HPLC grade water/0.1%TFA. The samples were subsequently put onto the washedand pre-wetted 96-well zip C18 plate, and 30 min of cen-trifugation at 1500 rpm was used to load the peptides ontothe C18 material. The wells were washed twice with 100 mL0.1% TFA (5 min, 1750 rpm). An elution volume of 15 mL50% ACN/ 0.1% TFA was used to elute the samples in a new96-well plate. The centrifugation period for the elution stepwas 30 min at 1600 rpm. After this elution step, the sampleswere stored in 96-well plates, which were covered with alu-minum seals, at 47C.
2.3 Measurement
A matrix solution was made by dissolving 2 mg CHCA in1 mL ACN, using an ultrasonic bath for 30 min. Twomicroliters of elute of each sample was mixed with 8 mL ofthe matrix solution, 0.5 mL of which was spotted onto aMALDI target (600/384 AnchorChip™ with transponderplate, Bruker Daltonics, Germany). All samples were spot-ted in duplicate. The digestion step and the subsequentmeasurement in duplicate were performed three times for
© 2008 WILEY-VCH Verlag GmbH & Co. KGaA, Weinheim www.proteomics-journal.com

1578 M. P. Stoop et al. Proteomics 2008, 8, 1576–1585
each sample, resulting in six spectra per sample. Thesamples were all measured using the automated measure-ment feature of the MALDI-TOF MS (Ultraflex, BrukerDaltonics, Germany). The standard method for peptidemeasurements (Proteomics_HPC) was used on theMALDI-TOF MS, with the measurement range set to 500–3400 Da.
The following settings were used for the automatedmeasurements: the initial laser power was 25%, and themaximum was 45%. The peak with the highest intensityabove the 750 Da had to have an S/N of at least 5 and aminimum resolution of 5000. Every 50 laser shots the sumspectrum was checked for these criteria. It was rejected if itdid not meet these criteria. If 20 sum spectra of 50 laser shotsmet these criteria, they were combined and saved. If 25 con-secutive sum spectra of 50 shots had been rejected, themeasurement of the spot was ended and the measurement ofthe next spot commenced.
2.4 Analysis
The raw binary data files of the MALDI-TOF MS experi-ments were first converted to American Standard Code forInformation Interchange (ASCII) files containing themeasured intensities for all channel indices of the spectra.All spectrum files were designated a group number (1 –MScl, 2 – CIS, 3 – OIND, 4 – OND) and serial numbered.To calibrate the channel numbers to masses we used aquadratic fit with a number of internal calibrants, whichwere five omnipresent tryptic albumin peptides (927.4934,1226.6051, 1467.8430, 1875.0156 and 2045.0953). The algo-rithm described by Dekker and co-workers [12, 13] was usedfor peak detection, performed in the statistical language R(http://www.r-project.org). A percentile threshold of 96%was chosen, meaning that the intensity of the peak positionmust belong to the 4% highest intensity values of the spec-trum. The mass window (minimum distance between twoadjacent peak positions) was set at 0.5 Da. After the gen-eration of a peak list for each spectrum using the peakdetection algorithm, an analyses matrix was created in R.During this process, all peak lists of every sample werechecked for the presence of all peaks. Only absence orpresence of the peaks was scored. Thus, a peak position thatwas present in all peak lists of one sample was designatedwith a 6 and a peak position present in half of the peak listswas designated with a 3. In this matrix, all samples weretagged with their group number and with a number rang-ing from 0 to 6 for all separate peak positions. The matrixwas subsequently used for statistical analysis of the data.Using a univariate analysis in R, a p-value was determinedfor every peak position. The Wilcoxon-Mann-Whitney testwas used for comparison between the groups [14, 15]. Fordata that do not follow a known theoretical distribution, onecan use non-parametric tests. One such test is the Wilcoxon-Mann-Whitney test. Data from multiple groups is combinedand the data are tagged so that the group to which they
belong is recorded. The combined dataset is then sortedaccording to the value of the data. This type of statistical testis very well suited for the comparison of pre-defined groups,as was the case in these experiments. A cross validation wasperformed on the same data by randomly assigning a groupnumber to each CSF sample and then repeating the Wil-coxon-Mann-Whitney test. This scrambling procedure wassubsequently repeated 10 000 times, which gives animpression of the probability to find a significant differen-tially expressed peptide by chance.
2.5 Identification
The next step in the process was identification of the differ-entially expressed peptides. Due to the limitations of theMALDI-TOF strategy, the differentially expressed peptidescould not be identified immediately from the complete CSFsample, due to the high amount of peaks per spectrum.Thus, for identification of the peptides alternative methodswere needed. We used two different strategies. First, wedetermined the accurate masses of the peptides with a 9.4Tesla (MALDI) Fourier transform mass spectrometer(FTMS, Bruker Daltonics). Due to the excellent mass accu-racy and precision of this technique, it is suited to determinethe masses of the peptides up to an accuracy of better than1 ppm (parts-per-million). Because the CHCA matrix is notcompatible with orthogonal MALDI (Apex I, Bruker Dal-tonics), we used another matrix molecule, 2,5-dihydroxybenzoic acid (DHB).
Secondly, we used a nano-LC system (Ultimate system,Dionex, USA) to separate the digested CSF peptides on aC18 RP column, followed by off-line MALDI-TOF/TOFMS. The digested CSF sample was injected and separatedon this column during a 130-min LC run, using a 90-mingradient of increasing concentrations of ACN (Solvent A:95% TFA (0.1%) in water, 5% ACN v/v; Solvent B: 20%TFA (0.1%) in water, 80% ACN), and subsequently spottedon a MALDI target plate. The MALDI target plate used inthis nano-LC experiment was a pre-spotted target plate(PAC 384 plate, Bruker Daltonics). On this plate the matrixwas already previously applied and only the sample has tobe added. By dividing a single sample into 384 separatespots and corresponding spectra, it proved to be possible toacquire the required mass windows for several of the dif-ferentially expressed peptides. Measurement of the pre-spotted plate was done in an automated way, using theWarp-LC software package, version 1.0 (Bruker Daltonics)on the MALDI-TOF/TOF, which first generated a massspectrum for all spots and then proceeded to generate MS/MS spectra, in a data-dependent manner, for peaks whichwere suitable for MS/MS by a series of pre-set conditions,such as, for example, a sufficiently high S/N. Identifica-tions were obtained by database searches of the MS/MSspectra using MASCOT search program, version 2.1 andthe Swiss-Prot database (version 51.2), using the standardsettings of the Warp-LC software package. The score
© 2008 WILEY-VCH Verlag GmbH & Co. KGaA, Weinheim www.proteomics-journal.com

Proteomics 2008, 8, 1576–1585 Systems Biology 1579
threshold for peptide identification was a MASCOT scoreof over 54, which correlates with a p-value ,0.05. Identifi-cations were confirmed by determination of accurate massby MALDI-FTMS.
In a separate effort to identify the differentially expressedpeptides we also used an Orbitrap mass spectrometer withESI (Thermo Electron, Germany), using a C18 column nano-LC system online connected to the device. Five microliters ofthe digested CSF was injected into the nano-LC and subse-quently the digested peptides were separated on the C18column. After ionization, the peptides were measured in theOrbitrap, using a data-dependent acquisition mode for theMS/MS identification step, which occurred in the IT. TheMS/MS identifications were obtained using the Bioworks 3.2software package (Thermo Fisher Scientific, Germany) andits SEQUEST feature, using the standard settings, withXcorrelation (XC) scores of 1.5, 2.0 and 2.5 for single, doubleand triple charged ions, respectively. With this method, wealso used the Swiss-Prot database for database searching asmentioned above.
2.6 Immunoassay
As specified by the manufacturer (DakoCytomation, Den-mark), we used a commercially available ELISA kit forchromogranin A to determine the chromogranin A con-centrations in the CSF samples. The sample volumesavailable were not sufficient to do this ELISA for all sam-ples. Hundred twenty-three samples of the original test setwere evaluated (32 MScl, 32 CIS, 25 OIND and 34 ONDsamples). For external validation, we had available a secondset of CSF samples of MScl patients (n = 19) and ONDcontrols (n = 18), including non-neurological cancer, intra-cranial hypertension, Sneddon syndrome and headache.
3 Results
3.1 Clinical information
Of the 44 patients in the MScl group, 30 patients had relapsingremitting (RR) MScl and 14 had primary progressive (PP)MScl (Table 1). The mean age of the patients in this group was42.1 6 11.3 years, and the mean protein concentration of theCSF was 0.41 6 0.13 g/L. The group contained 12 males and32 females. The median of the time that these patients hadbeen afflicted with MScl was nearly 2 years.
The CIS group (n = 40) consisted of 12 males and 28females, nearly 70% of whom had been diagnosed with opticneuritis (Table 1). The other patients were diagnosed withone, or a combination, of the other possible localizations of aCIS, like for example brainstem syndromes or myelitis [16].The mean age of this second group was 33.7 6 9.4 years, andthe mean protein concentration of the CSF was0.36 6 0.11 g/L. The median time between the sampling ofthe CSF and the occurrence of the first symptoms in thesepatients was 3 months.
The OIND group (n = 26) contained 7 males and 19females, with a mean age of 49.6 6 16.3 years. The meanCSF protein concentration was 0.43 6 0.16 g/L (Table 1).Diagnoses of the patients in this group were bacterial andsterile infections (n = 17), vasculitis (n = 7), and GuillainBarré Syndrome (n = 2).
The 54 patients in the OND group had a mean age of48.1 6 16.7 years. This group contained 23 males and 31females, and the CSF samples had a mean protein con-centration of 0.42 6 0.22 g/L (Table 1). The diagnoses set forthese patients were headaches (n = 19), neurological degen-eration (n = 11), non-neurological disease (n = 10), infarct(n = 8), brain tumor (n = 4), and other (n = 2).
Table 1. Clinical information, including routine protein quantifications, of all patients included in this study
MScl (n = 44) CIS (n = 40) OIND (n = 26) OND (n = 54)
Males/Females 12/32 12/28 7/19 23/31% of samples oligoclonal positive 72.7% 60.0% 7.7% 3.7%Median time between first MScl or CIS related
complaint and sampling in months (range)22 (0-232) 3 (0-72)a)
Protein concentration (g/L), SD in bracketsb) 0.406 (0.135) 0.358 (0.106) 0.435 (0.161) 0.422 (0.217)Albumin concentration (g/L), SD in brackets 0.239 (0.097) 0.210 (0.080) 0.250 (0.160) 0.280 (0.190)Immunoglobulin G concentration (g/L),
SD in bracketsb)0.060 (0.033) 0.048 (0.029) 0.055 (0.045) 0.043 (0.032)
Diagnoses - 30 RR MScl- 14 PP MScl
- 25 optic neuritis CIS- 7 myelitis CIS- 5 brainstem CIS- 3 other CIS
- 17 infections (bacterial and sterile)- 7 vasculitis- 2 Guillain Barré Syndrome
- 19 isolated headaches- 11 neurological degeneration- 10 non neurological disease- 8 infarct- 4 brain tumor- 2 other
a) Except for two patients (72 and 27 months), all CIS samples were taken within 20 months after the first symptoms were observed.b) Concentrations: p .0.05 for all comparisons (two-tailed t-test), except total protein concentration for CIS-OIND (p = 0.026) and IgG con-centration for MScl-OND (p = 0.035).
© 2008 WILEY-VCH Verlag GmbH & Co. KGaA, Weinheim www.proteomics-journal.com

1580 M. P. Stoop et al. Proteomics 2008, 8, 1576–1585
The total protein concentrations of the CSF samples didnot differ significantly between the groups when subjected toa two-tailed t-test. In addition, the albumin and IgG con-centrations of the CSF samples did not differ significantlybetween the groups.
3.2 Peak detection and data analysis
An average of 515 peaks was detected per MALDI-TOFspectrum. After spectrum conversion, the matrix was cre-ated, which consisted of 1755 peaks. The significance of dif-ference in distribution over the four groups was tested foreach peak.
The significant difference between the MScl group andthe OND group (p,0.05: 132 peaks; p,0.01: 44 peaks) indi-cates obvious differences in the CSF of MScl patients com-pared to that of the non-inflammatory control patients. Theobvious skew towards the low p-values is clearly visible in thep-value histogram (Fig. 1A). The largest statistical difference(Fig. 1B) was observed in the comparison of the CIS groupand the OND group (p,0.05: 161 peaks; p,0.01: 60 peaks).
The comparison of the MScl group with the OIND group(Fig. 1C), and also that of the CIS group with the OINDgroup (Fig. 1D), shows a number of peak positions with astatistically significant p-value (p,0.05: 127 peaks; p,0.01:12peaks, and p,0.05: 134 peaks; p,0.01: 27 peaks, respec-tively). Both these p-value histograms are also skewed to-
© 2008 WILEY-VCH Verlag GmbH & Co. KGaA, Weinheim www.proteomics-journal.com
Proteomics 2008, 8, 1576–1585 Systems Biology 1581
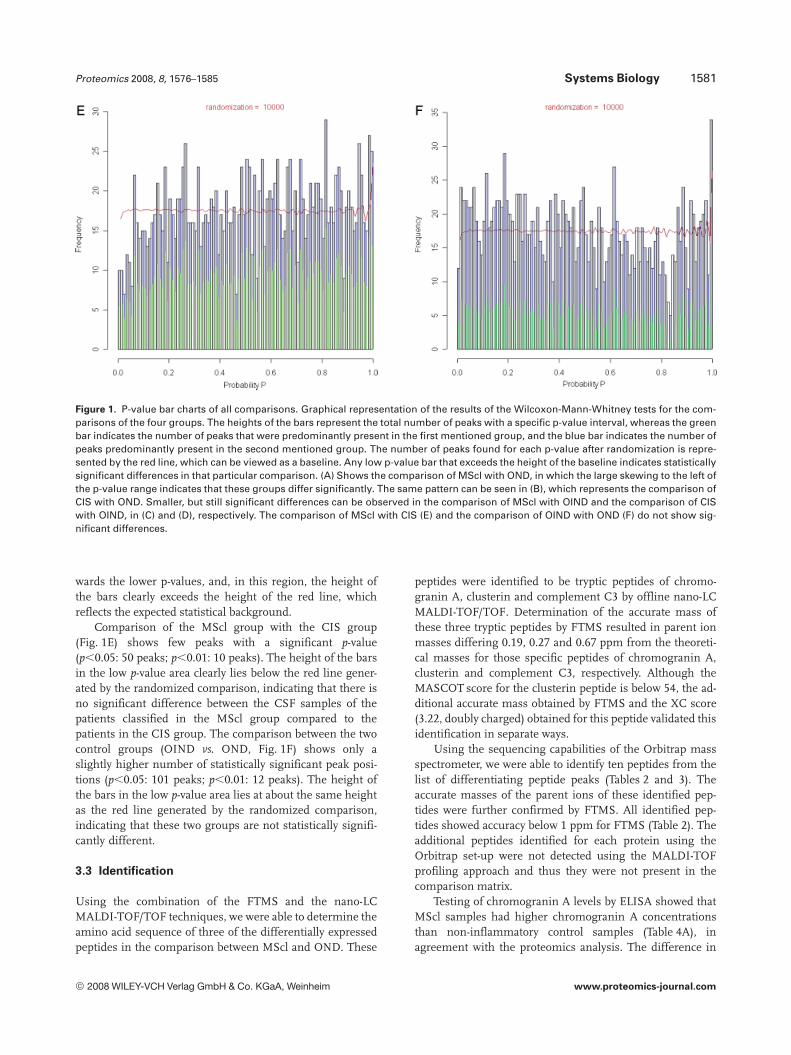
Figure 1. P-value bar charts of all comparisons. Graphical representation of the results of the Wilcoxon-Mann-Whitney tests for the com-parisons of the four groups. The heights of the bars represent the total number of peaks with a specific p-value interval, whereas the greenbar indicates the number of peaks that were predominantly present in the first mentioned group, and the blue bar indicates the number ofpeaks predominantly present in the second mentioned group. The number of peaks found for each p-value after randomization is repre-sented by the red line, which can be viewed as a baseline. Any low p-value bar that exceeds the height of the baseline indicates statisticallysignificant differences in that particular comparison. (A) Shows the comparison of MScl with OND, in which the large skewing to the left ofthe p-value range indicates that these groups differ significantly. The same pattern can be seen in (B), which represents the comparison ofCIS with OND. Smaller, but still significant differences can be observed in the comparison of MScl with OIND and the comparison of CISwith OIND, in (C) and (D), respectively. The comparison of MScl with CIS (E) and the comparison of OIND with OND (F) do not show sig-nificant differences.
wards the lower p-values, and, in this region, the height ofthe bars clearly exceeds the height of the red line, whichreflects the expected statistical background.
Comparison of the MScl group with the CIS group(Fig. 1E) shows few peaks with a significant p-value(p,0.05: 50 peaks; p,0.01: 10 peaks). The height of the barsin the low p-value area clearly lies below the red line gener-ated by the randomized comparison, indicating that there isno significant difference between the CSF samples of thepatients classified in the MScl group compared to thepatients in the CIS group. The comparison between the twocontrol groups (OIND vs. OND, Fig. 1F) shows only aslightly higher number of statistically significant peak posi-tions (p,0.05: 101 peaks; p,0.01: 12 peaks). The height ofthe bars in the low p-value area lies at about the same heightas the red line generated by the randomized comparison,indicating that these two groups are not statistically signifi-cantly different.
3.3 Identification
Using the combination of the FTMS and the nano-LCMALDI-TOF/TOF techniques, we were able to determine theamino acid sequence of three of the differentially expressedpeptides in the comparison between MScl and OND. These
peptides were identified to be tryptic peptides of chromo-granin A, clusterin and complement C3 by offline nano-LCMALDI-TOF/TOF. Determination of the accurate mass ofthese three tryptic peptides by FTMS resulted in parent ionmasses differing 0.19, 0.27 and 0.67 ppm from the theoreti-cal masses for those specific peptides of chromogranin A,clusterin and complement C3, respectively. Although theMASCOT score for the clusterin peptide is below 54, the ad-ditional accurate mass obtained by FTMS and the XC score(3.22, doubly charged) obtained for this peptide validated thisidentification in separate ways.
Using the sequencing capabilities of the Orbitrap massspectrometer, we were able to identify ten peptides from thelist of differentiating peptide peaks (Tables 2 and 3). Theaccurate masses of the parent ions of these identified pep-tides were further confirmed by FTMS. All identified pep-tides showed accuracy below 1 ppm for FTMS (Table 2). Theadditional peptides identified for each protein using theOrbitrap set-up were not detected using the MALDI-TOFprofiling approach and thus they were not present in thecomparison matrix.
Testing of chromogranin A levels by ELISA showed thatMScl samples had higher chromogranin A concentrationsthan non-inflammatory control samples (Table 4A), inagreement with the proteomics analysis. The difference in
© 2008 WILEY-VCH Verlag GmbH & Co. KGaA, Weinheim www.proteomics-journal.com

1582 M. P. Stoop et al. Proteomics 2008, 8, 1576–1585
Table 2. Identified differentially expressed peptides and corresponding proteins (p ,0.01) amongst the patient groups
MALDI-FTMSa) ESI-Orbitrap
Comparisonb) Protein Accessionnumber
Peptidesequencec)
Theoreticalmass
Measuredmass
D(ppm)
Measuredmass
D(ppm)
No. ofpept.
MScl-OND Chromogranin A P10645 YPGPQAEGDSEGLSQGLVDR
2074.9675 2074.9679 0.193 2074.970 1.205 5
MScl-OND Clusterin P10909 TLLSNLEEAK 1117.6099 1117.6102 0.268 1117.610 0.089 9MScl-OND Complement C3 P01024 AGDFLEANYMN
LQR1641.7689 1641.7678 0.670 - - -
MScl-OIND Complement C4B P0C0L5 ASAGLLGAHAAAITAYALTLTK
2085.1703 2085.1684 0.911 2085.173 1.295 1
CIS-OND Beta V spectrin Q9NRC6 WINNVFQCGQAGIKIR
1903.9959 1903.9944 0.193 1904.000 2.153 1
CIS-OND Hypothetical protein XP_011125 ISHELDSASSEVN 1387.6335 1387.6348 0.937 1387.635 1.081 2CIS-OIND Apolipoprotein D P05090 VLNQELR 871.4996 871.4991 0.574 871.4994 0.229 1CIS-OIND Complement C4A P0C0L4 GLQDEDGYR 1052.4643 1052.4641 0.190 1052.464 0.285 10CIS-OIND Contactin 1 Q12860 VQVTSQEYSAR 1267.6277 1267.6288 0.868 1267.628 0.237 4CIS-OIND Neuronal pentraxin
receptorO95502 QTALQQEAR 1044.5432 1044.5435 0.287 1044.543 0.191 2
CIS-OIND RNA binding motif protein 7 Q9Y580 VTEELLFELFHQAGPVIKVK
2297.2903 2297.2881 0.958 2297.286 1.871 1
a) One peptide was identified in the MALDI comparison.b) Bold in column 1 denotes group with elevated expression for that specific protein.c) One missed cleavage allowed.
concentration was statistically significant (p = 0.00034). Nostatistically significant differences were observed in thecomparisons of the chromogranin A concentrations of theother groups. The external validation in a new set of samplesshowed that also these MScl samples contained significantlyhigher chromogranin A concentrations compared with thenon-inflammatory controls (Table 4B).
4 Discussion
A main observation of this study is that, based on proteomicCSF analysis, the group of MScl patients could be clearlydistinguished from the non-inflammatory neurological con-trols. However, as MScl is considered an inflammatory dis-ease, it was imperative to include a group of controls cover-ing other CNS inflammatory neurological diseases. We werealso able to clearly differentiate between CSF peptide profilesof the MScl patients and inflammatory neurological controls.As MScl has both an inflammatory and a neurodegenerativecomponent [17], comparison with both control groups isessential to ensure that the control groups covered both theinflammatory and the non-inflammatory phase of the dis-ease.
We were also able to make similar distinctions in theproteomic CSF analyses of the CIS patients when com-pared to the non-inflammatory controls, as well as in thecomparison of the CIS patients with the inflammatory
neurological controls. The fact that the MScl and CISgroups behaved similarly fits with the clinical observationsthat, in the majority of the cases, CIS is a pre-stage of MScl[18, 19]. It can be assumed that similar immunopathologi-cal and neurodegenerative processes take place in bothconditions [20]. Another indication of the similarities be-tween the proteomic profiles of the CSF samples of thepatients in the MScl group and those of the CIS group isthe overlap of the peptides found in the comparisons ofMScl with the non-inflammatory controls (OND) and thecomparison of CIS with OND. Eleven of the forty-fourpeptide peaks (25%) found to be significantly (p,0.01) dif-ferent in the comparison of MScl and OND was found tobe significantly different in the comparison of CIS andOND. If the significance cut-off is set to p,0.05, this over-lap increases to nearly 38%.
We also compared two major distinct disease courses ofMScl, PP MScl and RR MScl. Specifically for this sub-com-parison we had included a relatively high number of PP MSclpatients in this study (32% of the MScl samples; normal 10–15% of the total MScl population)). However, we did notobserve any significant differences between PP MScl and RRMScl (data not shown).
Because pathology changes over time in MScl [21–24],one could imagine differences in CSF proteomic profiles asthe disease duration progresses. The MScl samples weredivided into a short and a long disease duration group,according to their position in relation to the median time
© 2008 WILEY-VCH Verlag GmbH & Co. KGaA, Weinheim www.proteomics-journal.com

Proteomics 2008, 8, 1576–1585 Systems Biology 1583
Table 3. Sequence coverage and scores of significantly differentially expressed peptides found by MALDI-MS
MALDI-TOF/TOF ESI-Orbitrap
Protein Peptide Sequencecoveragea) (%)
Protein Mol.Weight (Da)
MASCOT Score SEQUESTXC value
Charge
Chromogranin A YPGPQAEGDSEGLSQGLVDR 20.3 50730 133 3.51c) 2Clusterin TLLSNLEEAK 22.3 52495 50 3.22c) 2Complement C3 AGDFLEANYMNLQR 0.8 187148 75 - d) -Complement C4B ASAGLLGAHAAAITAYALTLTK 1.3 192739 -b) 3.84c) 2Beta V spectrin WINNVFQCGQAGIKIR 0.4 416835 -b) 2.07 2Hypothetical protein XP_011125 ISHELDSASSEVN -b) - -b) 3.42c) 2Apolipoprotein D VLNQELR 3.7 21276 -b) 2.20 2Complement C4A GLQDEDGYR 7.4 192771 -b) 2.64c) 2Contactin 1 VQVTSQEYSAR 3.8 113320 -b) 3.01c) 2Neuronal pentraxin receptor QTALQQEAR 3.6 52718 -b) 2.24c) 2RNA binding motif protein 7 VTEELLFELFHQAGPVIKVK 7.5 30504 -b) 2.25 2
a) Using Swiss-Prot database (October 2006).b) Not found.c) XC value in agreement with the HUPO criteria (XC = 1.8, 2.5 and 3.1 for single, double and triple charged ions respectively).d) Other peptide(s) of this protein were identified with XC values in agreement with the HUPO criteria.
Table 4. Determination of chromogranin A concentrations4A:
Original test set MScl OND CIS OIND
Concentration (U/L) 251.85 166.26 213.86 204.23SD (6) 91.18 92.28 89.07 80.54p-value (MScl vs. OND) 0.00034
Chromogranin A concentrations were determined in the originaltest set by means of a commercially available ELISA. A total of123 CSF samples (32 MScl, 34 OND, 32 CIS and 25 OIND) weretested. The Chromogranin A concentration was significantlyhigher (p = 0.00034) in MScl than in OND, using a t-test. The con-centrations of Chromogranin A in the other comparisons did notyield statistically significant p-values.
4B:
External validation test set MScl OND
Concentration (U/L) 240.44 139.86SD (6) 167.53 68.80p-value (MScl vs. OND) 0.02
Chromogranin A concentrations were also determined in anexternal validation set of CSF MScl and OND samples. A total of37 samples were tested (19 MScl and 18 OND). A t-test showed astatistically significant p-value (p = 0.02) for this comparison.
between first symptoms and CSF sampling. No significantdifferences were observed in this comparison, compared tothe statistical background (data not shown).
It has been suggested that the course of the disease ismore benign in MScl patients without oligoclonal immu-noglobulin G bands in CSF [25]. One might therefore expectto find other differences in CSF composition when compar-ing MScl patients with oligoclonal immunoglobulin G bands
in the CSF versus MScl patients without these bands. How-ever, we did not observe this. Finally, also no differences wereobserved between males and females, compared to the sta-tistical background (data not shown). These sub-analyseslend support to the interpretation that common peptide pat-terns are shared within the whole group of MScl patients.
It has been shown that factors such as sample stabilityand a low number of measurements per sample can causedifficulties regarding the reproducibility of proteomic profil-ing studies [26]. Other studies have shown the low repro-ducibility of peak height in MALDI-TOF MS [13]. The meth-od described here is less affected by these variations. Theheights of the peaks were not included in this analysis be-cause quantitative measurements of peak heights withMALDI-TOF MS are poorly reproducible, with standarddeviations up to 30% [13]. In this study only the absence orpresence of the peaks was scored.
Considering the fact that these data are a summation ofthree separate MALDI-TOF experiments, in which CSFsamples were measured in duplicate, we also performedthree separate analyses for these three experiments. A simi-lar p-value diagram for each experiment was obtained, com-pared to the combined experiments. Similarly, the differen-tially expressed peptides that were found in the total analysisalso had low p-values in the separate analyses, showing thatthese results were reproducible inter assay wise.
A beneficial factor is the lower protein load, especially ofhigh-abundant proteins such as albumin in CSF [27, 28],which allows CSF peptide profiling without complicatedsample pretreatment steps (e.g. high-abundant proteindepletion) that are essential to serum peptide profiling.Other studies have already delved into the CSF proteomicprofile. Although these studies identified a number of inter-esting proteins that were present in CSF of MScl patients,
© 2008 WILEY-VCH Verlag GmbH & Co. KGaA, Weinheim www.proteomics-journal.com

1584 M. P. Stoop et al. Proteomics 2008, 8, 1576–1585
these analyses were performed in a setting with limitednumbers of patients [29, 30]. It is hard to compare thesestudies, as the set-up and objectives have been very different.The studies mentioned aimed to identify as many proteins aspossible in CSF of MScl patients, whereas we aimed to pin-point peptide distinctions between MScl patients and con-trols. The method used in our study also differed from thesestudies in the fact that our sample pretreatment was muchless complex, as we did not perform a 2-DE procedure priorto the trypsin digestion. Another difference is that the num-ber of samples we analyzed is considerably higher, whichallowed for more advanced statistics during the analysis.
In summary, we identified 11 proteins in associationwith MScl (Table 2). Five of them, neuronal pentraxin recep-tor, contactin 1, beta V spectrin, RNA binding motif protein 7and hypothetical protein XP_011125, have not been reportedin association with MScl previously. These proteins may helpto reveal new pathways associated with MScl. Neuronal pen-traxin receptor is a molecule implied in synapse formationand neuronal remodeling [31]. It is also suggested to beinvolved in a pathway responsible for the transport of tai-poxin into synapses and that this may represent a novelneuronal uptake pathway involved in the clearance of synap-tic debris. Contactins mediate cell surface interactions dur-ing nervous system development. They are involved in theformation of paranodal axo-glial junctions in myelinated pe-ripheral nerves and in the signaling between axons andmyelinating glial cells. Beta V spectrin is expressed at verylow levels in many tissues, with strongest expression in,among others, cerebellum and spinal cord. It is now wellrecognized that spectrins may contribute to the establish-ment and maintenance of membrane order [32].
The other six proteins, apolipoprotein D, chromograninA, clusterin, complement C3, complement C4A and comple-ment C4B have been previously reported in association withMScl. Apolipoprotein D, which is involved in the removal oflipids during nerve cell degeneration, has been reported pre-viously to be present in elevated levels in MScl [33].
The relevance for the role of complement in MSclpathogenesis is a matter of a long debate, with several paperssuggesting elevated levels in affected tissue and in CSF [34,35]. This detection of several complement components in theCSF of MScl patients lends further support to the role ofcomplement in this disease.
The association of CSF clusterin, also known as apolipo-protein J, with MScl is of particular interest in this respect,because this molecule serves as a regulator (inhibitor) ofcomplement activity. In addition, it is considered as animportant factor in neuronal cell survival [36]. There is anearlier report that suggested elevated CSF clusterin levels inpatients with CNS inflammation [37].
Finally, the detection of chromogranin A in associationwith MScl is interesting. Although the neurodegenerativecomponent of MScl pathology has remained an enigma [38],an important role of innate immune cells and signals isobvious. It is of interest that chromogranin A can induce
neurotoxicity in microglial cells [39]. Chromogranin A is notdifferentially expressed in the comparison between MScl andOIND, so this protein could also be a marker for nonspecificinflammation. Other reports have shown that this protein iselevated in other neurodegenerative diseases such as Alz-heimer’s disease [39, 40], which may indicate that chromo-granin A is involved in the neurodegenerative component ofMScl. While proteins and peptides identified by this shotgunapproach may certainly be specific for MScl, the possibility ofnon-MScl pathology specific differentially expressed proteinscannot be ruled out. While nonspecific differentially expres-sed proteins can also add valuable information about diseaseprocesses, more research on chromogranin A could providea better understanding about the role of this protein in MScldisease processes. Therefore, for example, it will be of inter-est to determine whether high CSF chromogranin A levelsare associated with more aggressive clinical disease types.
In conclusion, the MALDI-TOF analysis of trypticdigested CSF proteins showed significant differences be-tween MScl patients and control patients (MScl vs. OND: 44peptides with p,0.01), as well as significant differences be-tween CIS patients and control patients (CIS vs. OND: 60peptides with p,0.01). Among these proteins were impor-tant factors in complement mediated inflammatory reaction,such as complement C3, complement C4A, complementC4B and clusterin, as well as several proteins that were notpreviously reported to be differentially expressed in MScl andits pre-stage (CIS). These new potential markers includefunctionally interesting proteins such as chromogranin A,neuronal pentraxin receptor and contactin 1.
This work was supported by a program grant provided by theNetherlands Multiple Sclerosis Research Foundation to the Rot-terdam Multiple Sclerosis research Center, ErasMS, the Nether-lands Proteomics Centre and the Top Institute Pharma grant D4-102-1. The authors would like to thank Thermo Electron, and inparticular Wilfried Voorhorst and Wolfgang Metelmann-Strupatfor assistance with the Orbitrap experiments.
The authors have declared no conflict of interest.
5 References
[1] Keegan, B. M., Noseworthy, J. H., Multiple sclerosis. Annu.Rev. Med. 2002, 53, 285–302.
[2] Compston, A., Coles, A., Multiple sclerosis. The Lancet 2002,359, 1221–1231.
[3] Bielekova, B., Martin, R., Development of biomarkers in mul-tiple sclerosis. Brain 2004, 127, 1463–1478.
[4] Yuan, X., Desiderio, D. M., Proteomics analysis of pre-fractionated lumbar cerebrospinal fluid. Proteomics 2005, 5,541–550.
[5] Romeo, M. J., Espina, V., Lowenthal, M., Espina, B. H. et al.,CSF proteome: a protein repository for potential biomarkeridentification. Expert Rev. Proteomics 2005, 2, 57–70.
© 2008 WILEY-VCH Verlag GmbH & Co. KGaA, Weinheim www.proteomics-journal.com

Proteomics 2008, 8, 1576–1585 Systems Biology 1585
[6] Greenstein, J. I., Current concepts of the cellular and molec-ular pathophysiology of multiple sclerosis. Dev. Neurobiol.2007, 67, 1248–1265.
[7] Tintore, M., Early MS treatment. Int. MS J. 2007, 14, 5–10.[8] Irani, D. N., Andersen, C., Gundry, R., Cotter, R. et al., Cleav-
age of cystatin C in the cerebrospinal fluid of patients withmultiple sclerosis. Ann. Neurol. 2006, 26, 237–247.
[9] Del Boccio, P., Pieragostino, D., Lugaresi, A., Di Ioia, M. et al.,Cleavage of cystatin C is not associated with multiplesclerosis. Ann. Neurol. 2007, 62, 201–204.
[10] Noben, J. P., Dumont, D., Kwasnikowska, N., Verhaert, P. etal., Lumbar cerebrospinal fluid proteome in multiple sclero-sis: characterization by ultrafiltration, liquid chromatogra-phy, and mass spectrometry. J. Proteome Res. 2005, 5,1647–57.
[11] Hammack, B. N., Owens, G. P., Burgoon, M. P., Gilden, D. H.,Improved resolution of human cerebrospinal fluid proteinson two-dimensional gels. Mult. Scler. 2003, 9, 472–475.
[12] Dekker, L. J., Boogerd, W., Stockhammer, G., Dalebout, J. etal., MALDI-TOF mass spectrometry analysis of cere-brospinal fluid tryptic peptide profiles to diagnose leptome-ningeal metastases in patients with breast cancer. Mol. Cell.Proteomics 2005, 4, 1341–1349.
[13] Dekker, L. J., Dalebout, J. C., Siccama, I., Jenster, G. et al., Anew method to analyze matrix-assisted laser desorption/ionization time-of-flight peptide profiling mass spectra.Rapid Commun. Mass Spectrom. 2005, 19, 865–870.
[14] Gaddis, G. M., Gaddis, M. L., Introduction to biostatistics:Part 5, Statistical inference techniques for hypothesis testingwith nonparametric data. Ann. Emerg. Med. 1990, 19, 1054–1059.
[15] Titulaer, M. K., Siccama, I., Dekker, L. J., van Rijswijk, A. L. etal., A database application for pre-processing, storage andcomparison of mass spectra derived from patients and con-trols. BMC Bioinformatics 2006, 7, 403.
[16] Tintoré, M., Rovira, A., Rio, J., Nos, C. et al., Is optic neuritismore benign than other first attacks in multiple sclerosis?Ann. Neurol. 2005, 57, 210–215.
[17] Brück, W., Stadelmann, C., Inflammation and neurodegen-eration in multiple sclerosis. Neurol. Sci. 2003, 24, 265–267.
[18] McDonald, W. I., Compston, A., Edan, G., Goodkin, D. et al.,Recommended diagnostic criteria for multiple sclerosis:guidelines from the International Panel on the diagnosis ofmultiple sclerosis. Ann. Neurol. 2001, 50, 121–127.
[19] Miller, D., Barkhof, F., Montalban, X., Thompson, A. et al.,Clinically isolated syndromes suggestive of multiple sclero-sis, part 1: natural history, pathogenesis, diagnosis, andprognosis. Lancet Neurol. 2005, 4, 281–288.
[20] Fernando, K. T. M., Tozer, D. J., Miszkiel, K. A., Gordon, R. M.et al., Magnetization transfer histograms in clinically iso-lated syndromes suggestive of multiple sclerosis. Brain2005, 128, 2911–2925.
[21] Prat, A., Antel, J., Pathogenesis of multiple sclerosis. Curr.Opin. Neurol. 2005, 18, 225–230.
[22] Bjartmar, C., Trapp, B. D., Axonal and neuronal degenerationin multiple sclerosis: mechanisms and functional con-sequences. Curr. Opin. Neurol. 2001, 14, 271–278.
[23] Zamvil, S. S., Steinman, L., Diverse targets for interventionduring inflammatory and neurodegenerative phases ofmultiple sclerosis. Neuron 2003, 38, 685–688.
[24] Coles, A. J., Wing, M. G., Molyneux, P., Paolillo, A. et al.,Monoclonal antibody treatment exposes three mechanisms
underlying the clinical course of multiple sclerosis. Ann.Neurol. 1999, 46, 296–304.
[25] Zeman, A. Z., Kidd, D., McLean, B. N., Kelly, M. A. et al., Astudy of oligoclonal band negative multiple sclerosis. J.Neurol. Neurosurg. Psychiatry 1996, 60, 27–30.
[26] Aivado, M., Spentzos, D., Alterovitz, G., Otu, H. H. et al.,Optimization and evaluation of surface-enhanced laser de-sorption/ionization time-of-flight mass spectrometry(SELDI-TOF MS) with reversed-phase protein arrays forprotein profiling. Clin. Chem. Lab. Med. 2005, 43, 133–140.
[27] You, J. S., Gelfnova, V., Knierman, M. D., Witzmann, F. A. etal., The impact of blood contamination of cerebrospinalfluid. Proteomics 2005, 5, 290–296.
[28] Ramström, M., Hagman, C., Mitchell, J. K., Derrick, P. J. et al.,Depletion of high-abundant proteins in body fluids prior toliquid chromatography fourier transform ion cyclotronresonance mass spectrometry. J. Proteome Res. 2005, 4,410–416.
[29] Dumont, D., Noben, J. P., Raus, J., Stinissen, P. et al., Prote-omic analysis of cerebrospinal fluid from multiple sclerosispatients. Proteomics 2004, 4, 2117–2124.
[30] Hammack, B. N., Kung, K. Y., Hunsucker, S. W., Duncan, M.W. et al., Proteomic analysis of multiple sclerosis cere-brospinal fluid. Mult. Scler. 2004, 10, 245–260.
[31] Kirkpatrick, L. L., Matzuk, M. M., Dodds, D. D., Perin, M. S.,Biochemical interactions of the neuronal pentraxins. Neu-ronal pentraxin (NP) receptor binds to taipoxin and taipoxin-associated calcium-binding protein 49 via NP1 and NP2. J.Biol. Chem. 2000, 275, 11786–11792.
[32] Stabach, P. R., Morrow, J. S., Identification and characteri-zation of beta V spectrin, a mammalian ortholog of Droso-phila beta H spectrin. J. Biol. Chem. 2000, 275, 21385–21395.
[33] Reindl, M., Knipping, G., Wicher, I., Dilitz, E. et al., Increasedintrathecal production of apolipoprotein D in multiplesclerosis. J. Neuroimmunol. 2001, 119, 327–332.
[34] Mar, P., Gradl, T., Dorner, C., Contag, I., A longitudinal srudyof immunological parameters in multiple sclerosis: Cell-mediated immunity and complement profiles. Clin. Exp.Immonol. 1979, 36, 442–448.
[35] Williams, K. C., Ulvestad, E., Hickey, W. F., Immunology ofmultiple sclerosis. Clin. Neurosci. 1994, 2, 229–245.
[36] Li, W., Trovero, F., Cordier, J., Wang, Y. et al., Prenatal expo-sure of rats to Ginkgo biloba extract (EGgb 761) increasesneuronal survival/growth and alters gene expression in thedeveloping fetal hippocampus. Brain Res. Dev. Brain Res.2003, 144, 169–180.
[37] Polihronis, M., Paizis, K., Carter, G., Sedal, L. et al., Elevationof human cerebrospinal fluid clusterin concentration isassociated with acute neuropathology. J. Neurol. Sci. 1993,115, 230–233.
[38] Zipp, F., Aktas, O., The brain as a target of inflammation:common pathways link inflammatory and neurodegenera-tive diseases. Trends Neurosci. 2006, 29, 518–527.
[39] Taylor, D. L., Diemel, L. T., Cuzner, M. L., Pocock, J. M., Acti-vation of group II metabotropic glutamate receptors under-lies microglial reactivity and neurotoxicity following stimu-lation with chromogranin A, a peptide up-regulated in Alz-heimer’s disease. J. Neurochem. 2002, 85, 1179–1191.
[40] Lechner, T., Adlassnig, C., Humpel, C., Kaufmann, W. A. etal., Chromogranin peptides in Alzheimer’s disease. Exp.Gerontol. 2004, 39, 101–113.
© 2008 WILEY-VCH Verlag GmbH & Co. KGaA, Weinheim www.proteomics-journal.com