Multiple-Pulse COSY NMR Spectroscopy of Oriented Molecules in Thermotropic Cholesteric
7
J. Phys. Chem. 1994, 98, 12849-12855 12849 Multiple-Pulse COSY NMR Spectroscopy of Oriented Molecules in Thermotropic Cholesterics P. Lesot, F. Nielsen, J. M. Ouvrard, and J. Courtieu* Laboratorie de Chimie Structurale Organique, ICMO, URA CNRS no. 1384, Universitg de Paris-Sud, 91405 Orsay, France Received: June 4, 1994; In Final Form: September 22, 1994@ The coherent reduction of anisotropic NMR interactions in molecules oriented in a thermotropic cholesteric phase, using a multiple-pulse COSY experiment, is described. The technique, which directly modifies the spin part of the nuclear spin Hamiltonian, allows the transformation of second-order spectra into first-order spectra. An experimental study of the evolution of the chemical shift and dipolar reduction factors is presented. The effects of the finite pulse duration in the multiple-pulse sequence are discussed, and explicit equations for the anisotropic interactions which take into account the pulse widths are obtained. The technique in cholesteric solvents is illustrated by using two specific examples for AB and ABC type of spectra: 2,6- dichloro-3-nitropyridine and 2-cyanofuran. Introduction Cholesteric solvents are optically active liquid crystals which allow for the NMR visualization of enantiomer^.'-^ The observation of each enantiomer is obtained through a doubling of the spectra, from which detailed structural information can be extracted. Unfortunately, the observed 'H-NMR spectra are generally second-order spectra and very complicated to decipher even at high magnetic Therefore, it is interesting to find an effective method for simplifying the proton spectra of molecules dissolved in such media, in order to fully exploit their analytical potential. The fist approach to simplify the analysis of the anisotropic 'H-NMR spectra was achieved by averaging the anisotropic interactions, by rotation of the sample around an axis perpen- dicular to Later this approach evolved to the variable angle sample spinning (VASS) technique, introduced by Hom- reich,s in which the sample is rotated quickly around an axis tilted at an angle 0 to the magnetic field. This technique showed great potential with uniaxial fluid liquid crystal such as nematics?-" Nevertheless, this technique fails in cholesteric or chiral smectic liquid crystal solvents due to the particular behavior of the director field in the magnetic field BO.l2J3 Indeed, cholesterics are known to be twisted nematics, which under the influence of chiral centers give rise to a director field of helical ~tructure.'~J~ When the samples are spun about an axis tilted from Bo, the helicity axis h tends to align either parallel (Axm < 0) or perpendicular (Axm > 0) to the rotation axis. Consequently, the directors n are distributed in planes which are perpendicular or parallel to the spinning axis and are not homogeneously oriented relatively to BO, as shown in Figure 1. In both cases, the spectra for the dissolved molecules have the appearance of a powder pattem.16-18 Only few experiments, where the anisotropic interactions were averaged to zero by using a fast magic angle spinning (MAS) technique, have been reported.lg Another way to reduce the anisotropic spin interactions consists of using a multiple-pulse sequence which results in a coherent reduction of the spin Hamiltonian through spin reorientation.20,21Recently, this laboratory has reported the coherent reduction of dipolar splittings through a 16-pulse @ Abstract published in Advance ACS Abstracts, November 1, 1994. 0022-365419412098- 12849$04.50/0 a b h A h Bo R z+ ,y X X J Figure 1. Orientational behavior of director n of a Ax,,, 0 cholesteric phase in the magnetic field upon rotation around an axis R parallel to Bo (a) and tilted by an angle B from Bo (b). h is the cholesteric helical axis. sequence, named flip-flop-16 (FF-16).22 Furthermore, it was demonstrated that the technical difficulties generally encountered in multiple-pulse experiments synchronized with the sampling of the magnetization can be avoided if the pulse train is applied during the tl period of a simple COSY experiment, as diagrammed in Figure 2. Under these conditions a normal one- dimensional spectrum is expected in YZ and a reduced spectrum along VI, following a tl evolution under the theoretical zero- order FF-16 average Hamiltonian expressed in eq 1: . %& represents the chemical shift Hamiltonian, the scalar coupling Hamiltonian, and 6 the dipolar coupling Hamiltonian. KCS and KD are the chemical shift and dipolar reduction factors, respectively. In the ideal case of 6 pulses, these reduction factors can be expressed as 0 1994 American Chemical Society
-
Upload
independent -
Category
Documents
-
view
1 -
download
0
Transcript of Multiple-Pulse COSY NMR Spectroscopy of Oriented Molecules in Thermotropic Cholesteric

J. Phys. Chem. 1994, 98, 12849-12855 12849
Multiple-Pulse COSY NMR Spectroscopy of Oriented Molecules in Thermotropic Cholesterics
P. Lesot, F. Nielsen, J. M. Ouvrard, and J. Courtieu* Laboratorie de Chimie Structurale Organique, ICMO, URA CNRS no. 1384, Universitg de Paris-Sud, 91405 Orsay, France
Received: June 4, 1994; In Final Form: September 22, 1994@
The coherent reduction of anisotropic NMR interactions in molecules oriented in a thermotropic cholesteric phase, using a multiple-pulse COSY experiment, is described. The technique, which directly modifies the spin part of the nuclear spin Hamiltonian, allows the transformation of second-order spectra into first-order spectra. An experimental study of the evolution of the chemical shift and dipolar reduction factors is presented. The effects of the finite pulse duration in the multiple-pulse sequence are discussed, and explicit equations for the anisotropic interactions which take into account the pulse widths are obtained. The technique in cholesteric solvents is illustrated by using two specific examples for AB and ABC type of spectra: 2,6- dichloro-3-nitropyridine and 2-cyanofuran.
Introduction
Cholesteric solvents are optically active liquid crystals which allow for the NMR visualization of enantiomer^.'-^ The observation of each enantiomer is obtained through a doubling of the spectra, from which detailed structural information can be extracted. Unfortunately, the observed 'H-NMR spectra are generally second-order spectra and very complicated to decipher even at high magnetic Therefore, it is interesting to find an effective method for simplifying the proton spectra of molecules dissolved in such media, in order to fully exploit their analytical potential.
The f i s t approach to simplify the analysis of the anisotropic 'H-NMR spectra was achieved by averaging the anisotropic interactions, by rotation of the sample around an axis perpen- dicular to Later this approach evolved to the variable angle sample spinning (VASS) technique, introduced by Hom- reich,s in which the sample is rotated quickly around an axis tilted at an angle 0 to the magnetic field. This technique showed great potential with uniaxial fluid liquid crystal such as nematics?-" Nevertheless, this technique fails in cholesteric or chiral smectic liquid crystal solvents due to the particular behavior of the director field in the magnetic field BO.l2J3 Indeed, cholesterics are known to be twisted nematics, which under the influence of chiral centers give rise to a director field of helical ~tructure. '~J~ When the samples are spun about an axis tilted from Bo, the helicity axis h tends to align either parallel (Axm < 0) or perpendicular (Axm > 0) to the rotation axis. Consequently, the directors n are distributed in planes which are perpendicular or parallel to the spinning axis and are not homogeneously oriented relatively to BO, as shown in Figure 1. In both cases, the spectra for the dissolved molecules have the appearance of a powder pattem.16-18 Only few experiments, where the anisotropic interactions were averaged to zero by using a fast magic angle spinning (MAS) technique, have been reported.lg
Another way to reduce the anisotropic spin interactions consists of using a multiple-pulse sequence which results in a coherent reduction of the spin Hamiltonian through spin reorientation.20,21 Recently, this laboratory has reported the coherent reduction of dipolar splittings through a 16-pulse
@ Abstract published in Advance ACS Abstracts, November 1, 1994.
0022-365419412098- 12849$04.50/0
a
b
h A
h
Bo R z +
,y
X
X J
Figure 1. Orientational behavior of director n of a Ax,,, 0 cholesteric phase in the magnetic field upon rotation around an axis R parallel to Bo (a) and tilted by an angle B from Bo (b). h is the cholesteric helical axis.
sequence, named flip-flop-16 (FF-16).22 Furthermore, it was demonstrated that the technical difficulties generally encountered in multiple-pulse experiments synchronized with the sampling of the magnetization can be avoided if the pulse train is applied during the tl period of a simple COSY experiment, as diagrammed in Figure 2. Under these conditions a normal one- dimensional spectrum is expected in Y Z and a reduced spectrum along V I , following a t l evolution under the theoretical zero- order FF-16 average Hamiltonian expressed in eq 1:
.%& represents the chemical shift Hamiltonian, the scalar coupling Hamiltonian, and 6 the dipolar coupling Hamiltonian. KCS and KD are the chemical shift and dipolar reduction factors, respectively. In the ideal case of 6 pulses, these reduction factors can be expressed as
0 1994 American Chemical Society

12850 J. Phys. Chem., Vol. 98, No. 49, I994 Lesot et al.
a
FF- 16 SEQUENCE Y 4 ............................... 4 ........... *
t l '2
l/SWl= n . t P l 6 w i t h n = 1.2.3 ... NE
............... ...... ........... .................................... 4 i K >..~ b
C
4 .................................... r ,=25' h +t;+ 2t,
Figure 2. (a) Representation of the flip-flop-16 COSY sequence. No phase cycling is done on the multiple-pulse sequence. (b) Schematic diagram of the FF-8 sequence as 6 pulses. tx is the total duration of a symmetric two-pulse subcycle. P: indicates the a pulse angle rotation about the v = x or y axis of the rotating frame. The second half of the FF-16 sequence is symmetric to the first according to the definition given by Wang and Ramshaw. (c) Zoom on a two-pulse subcycle of the FF-16 sequence in which the finite pulse width tW is apparent. The times 6~ and 6, are the real spacing between pulses. (d) Schematic description of the interaction Hamiltonian tensors associated with the different periods in the subcycle shown in part c.
22, + z,, cos(a)
2, Kcs =
and
where 'tK = 22, + ztl is the total duration of a basic two-pulse cycle.
To illustrate these principles, simple spin systems dissolved in nematic solvents have been studied, and the potential of the method was demonstrated.22 Taking into account the usefulness of the applications in cholesteric media, where the VASS method is not useful, the logical step is to check the feasibility of the multiple-pulse technique for molecules dissolved in these chiral phases.
This paper presents an experimental study of the reduction of the anisotropic interactions of molecules oriented in choles- teric media. To illustrate these principles, it will be shown how the technique allows the transformation of an AB spectrum into an AX spectrum and an ABC spectrum into Ah4X spectrum. The influence of finite pulse width in the multiple-pulse sequence will be presented.
Experimental Part The experimental study of the evolution of the chemical shift
and the dipolar reduction factors is performed, using an A
(CHC13) and an A2 (CH2C12) proton spin system, respectively, dissolved in a mixture containing cholesteryl esters and bicy- clohexyl nematic. Such a cholesteric mixture is oriented homogeneously with the helical axis parallel to Bo and consequently allows for obtaining high-resolution ~ p e c t r a . ~ , ~ ~ All spectra presented in the following parts have been obtained with a Ax negative mixture of 45/55 by weight ratio of cholesteryl butyrate and Merck ZLI 2806 nematic liquid crystal. The molecules under study were dissolved in the mixture at about 10% by weight. NMR experiments were performed on a Bruker AM250 high-resolution spectrometer operating at a frequency of 250.16 MHz for protons. Samples were introduced in 4 mm 0.d. tubes which were inserted in a 5 mm tube with D20 in order to provide a deuterium lock signal. The samples were spun at 50 Hz along Bo, and the temperature was regulated under air flow. Rf pulses were achieved through the decoupling channel in the reverse mode (tw9O0 FY 13.5 ps). The 2D spectra were obtained in magnitude mode with 128(tl)*1024(tz) digi- tization and unshifted sinebell digital filtering in the v1 and v2 dimensions.22
Results and Discussion
The action of the FF-16 sequence on the anisotropic interac- tions is studied as a function of pulse angles (a) and of the timing ratio Z!&i!Z!, + dv). The experimental and expected values of the chemical shift and dipolar reduction factors are plotted in Figure 3.
The analysis of the experimental results shows a divergence between experimental values of the reduction factors and theoretical values calculated according to eqs 2 and 3. This effect, caused by the finite pulse length, tw, of radio frequency pulses, has already been reported in studies performed on an A2 spin system oriented in a nematic phase.21q22 By using the average Hamiltonian theory, reviewed by Meh~ing?~ it is possible to calculate the zeroth-order spin Hamiltonian of the FF-16 sequence taking into account the finite pulse widths (see the Appendix). The new expressions of the corrected chemical shifts and dipolar couplings reduction factors, labeled K& and KD", are given respectively by
and
where z, = tJ8 = 2 z ' ~ + z',, + 2t, is the total duration of a symmetric two-pulse cycle, including the pulse duration. The times r', and z',, are the real spacing between pulses, as diagrammed in Figure 2, and tw is the a pulse duration. Introducing tw = 0 in the expressions for Kcsf- and KD'W gives, as expected, the reduction coefficients in the 6 pulse case, KCS and KD, eqs 2 and 3.
The experimental values, KcseXP and K D ~ ~ P , as a function of a, correlate with the expected values according to eqs 4 and 5. As already stated in the previous paper, the minimum attainable scale factor can be strongly decreased by increasing r', and r',,22 which will change the spectral width in v1. Thus, decreasing the v1 spectral width and keeping a equal to 90°, it is possible to average to zero the dipolar splitting or to change the dipolar
Oriented Molecules in Thermotropic Cholesterics J. Phys. Chem., Vol. 98, No. 49, 1994 12851
a
Oo 20" 4V 6V 8 4 1W lu)' 140. 160. 180' a
0' 1v 20" 3 4 4 4 sv 6V 7v 8 4 90" a
0 0.2 0.4 0.6 0.8 1
7' /(27Ir + 7;)
0
-0,3 --
--
0 0.2 0.4 0.6 0.8 I 7'4(27'A + TI,,)
Figure 3. Comparison between the experimental chemical shift and dipolar coupling reduction factors, KcsCXP and and calculated reduction factors, KCS, KD, KCS'W, and KD'w, calculated according to eqs 2, 3,4, and 5 , respectively. (a) KC^, KCS, and K& as a function of a (tww" = 12.5 ps, fJ(2f1 4- fJ = 3/4, SW2 = 2000 Hz, and SWI is about 2000 Hz). (b) KcseXP, KCS, and KCS'~ as a function of the timing ratio f , J ( 2 f ~ + f,,) (a = 180", tw'80' = 25.5 ps, and SW2 = 2000 Hz). The values of the timing ratio are 1/23, 1/17, 1/11, 115, 113, 1/2,2/3, 3/4, 5/6, 9/10, and 23/25. (c) KD~~P, KD, and KD" as a function of a (tww' = 12.5 ps, SWZ = 2500 Hz, and SW1 is about 2500 Hz). (d) K p , KD, and K+ as a function of the timing ratio fV/(2z'n + z',,) (a = go", tww" = 14.7 ps, and SW2 = 2000 Hz). The values of the timing ratio are 1/17, 1/11, 1/5, 113, 112, 2/3, 314, 9/11, 5/6, 9/10, and 15/16. In all experiments, the times and z',, are taken to fit the desired values of timing ratios and the spectral width in the VI dimension is equal to 1/8(2fn i- z',, + 2tw). In the experiments corresponding to Figure 3a.b and 3c,d the chemical shifts in the vz dimension are 900 and 0 Hz, respectively. The dipolar splitting constant for the AZ spin system in the vz dimension is 1900 Hz.
coupling sign. When the spectral width is decreased, the duty cycle, i.e. the ratio 2tw/z,, tends to zero, and the experimental reduction factors approach the theoretical value when tw = 0.
The evolution of the experimental values, KcseXP and KD~~P, as a function of the timing ratio z',/(2z'1 + t',), is also in agreement with the pulse width dependent coefficients in eqs 4 and 5 . Notice further in Figures 3b,d that the values of KcseXP and K D ~ ~ P are smaller for dV/(2t'1 + f,) -= 1/2 and larger for z'J(2t'~ + z'q)' > 1/2 than those stated by theory using 6 pulses. This shows a remarkable property of the pulse width, since for t',/(2z'~ + T',) < 1/2 it causes further reduction relative to the ideal case of the 6 pulse.
Illustrative Applications
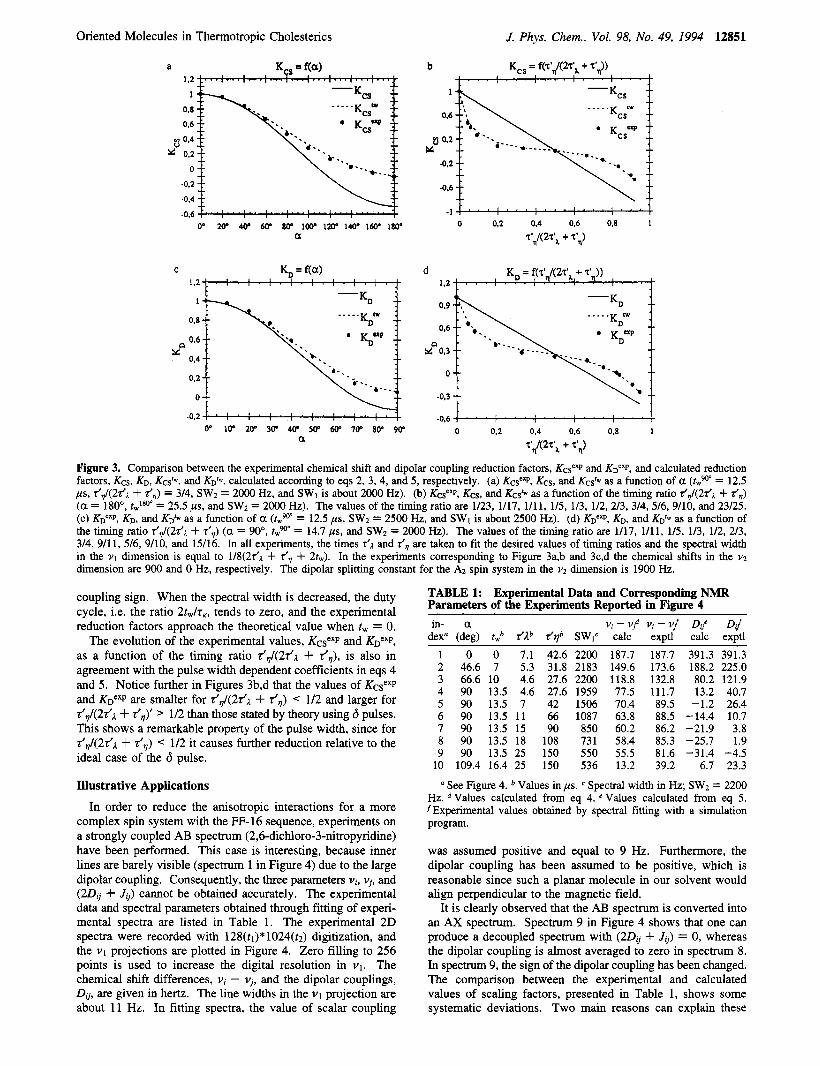
In order to reduce the anisotropic interactions for a more complex spin system with the FF-16 sequence, experiments on a strongly coupled AB spectrum (2,6-dichloro-3-nitropyridine) have been performed. This case is interesting, because inner lines are barely visible (spectrum 1 in Figure 4) due to the large dipolar coupling. Consequently, the three parameters vi. v,, and ( 2 0 , + J,$ cannot be obtained accurately. The experimental data and spectral parameters obtained through fitting of experi- mental spectra are listed in Table 1. The experimental 2D spectra were recorded with 128(tl)* 1024(t2) digitization, and the v1 projections are plotted in Figure 4. Zero filling to 256 points is used to increase the digital resolution in v1. The chemical shift differences, vi - v,, and the dipolar couplings, D,, are given in hertz. The line widths in the v1 projection are about 11 Hz. In fitting spectra, the value of scalar coupling
TABLE 1: Experimental Data and Corresponding NMR Parameters of the Exwriments Reported in Figure 4 in- a vi- V? vi- V/ Dij' Dd
dex" (deg) twb </Ib f ib SWlc calc exptl calc exptl
1 0 0 7.1 42.6 2200 187.7 187.7 391.3 391.3 2 46.6 7 5.3 31.8 2183 149.6 173.6 188.2 225.0 3 66.6 10 4.6 27.6 2200 118.8 132.8 80.2 121.9 4 90 13.5 4.6 27.6 1959 77.5 111.7 13.2 40.7 5 90 13.5 7 42 1506 70.4 89.5 -1.2 26.4 6 90 13.5 11 66 1087 63.8 88.5 -14.4 10.7 7 90 13.5 15 90 850 60.2 86.2 -21.9 3.8 8 90 13.5 18 108 731 58.4 85.3 -25.7 1.9 9 90 13.5 25 150 550 55.5 81.6 -31.4 -4.5
10 109.4 16.4 25 150 536 13.2 39.2 6.7 23.3
See Figure 4. Values in ps. Spectral width in Hz; SWI = 2200 Hz. Values calculated from eq 4. e Values calculated from eq 5 . fExperimenta1 values obtained by spectral fitting with a simulation program.
was assumed positive and equal to 9 Hz. Furthermore, the dipolar coupling has been assumed to be positive, which is reasonable since such a planar molecule in our solvent would align perpendicular to the magnetic field.
It is clearly observed that the AB spectrum is converted into an AX spectrum. Spectrum 9 in Figure 4 shows that one can produce a decoupled spectrum with (20, + J,) = 0, whereas the dipolar coupling is almost averaged to zero in spectrum 8. In spectrum 9, the sign of the dipolar coupling has been changed. The comparison between the experimental and calculated values of scaling factors, presented in Table 1, shows some systematic deviations. Two main reasons can explain these

12852 J. Phys. Chem., Vol. 98, No. 49, 1994 Lesot et al.
10
9
8
7
6
5
4
3
2
1
400 OHz -400 Figure 4. Experimental v1 projections of a FF-16 COSY sequence acting on a strongly coupled AB spin system for different values of a, z'~, and z',,. The timing ratio r'd(2r'~ + z',,) of the sequence is 3/4. The temperature of the sample is 347 K. Note how the sequence converts a second-order spectrum into a fmt-order spectrum. See Table 1 for more experimental details.
differences. Firstly, the error on a pulse values, created by the uncertainty on the pulse width calibration, can account for the difference between experimental and calculated values. This effect is more pronounced for large values of a. For example, with the data in entry 4 of Table 1, an error of 5% on the a value introduces an error on KCS'W and KD'W equal to 11% and 33%, respectively. Secondly, the dipolar reduction factor is sensitive to the offset effects. This problem was not encountered in the study of the A2 spin system, where the carrier frequency was set equal to Larmor frequency of the spin system. In more complex spin systems, this ideal situation can never be implemented. Pulsing off-resonance, the simultaneous contribu- tions of the offset, and radio-frequency Hamiltonians in the rotating frame force the spins to rotate about an effective field tilted at an angle /3 from the z axis, as described by Waugh et al.25,26 Consequently, the first-order terms are not entirely eliminated in the average Hamiltonian expansion and may change the scaling factors. Studies of the offset effects on the dipolar coupling scaling factor are presently underway.
It should be noticed that the relative intensity of the inner lines of the AB system observed on the v2 projection increases, compared to the high-resolution 1D spectrum, when the pulse angle increases from 0" to the value for which KD~W is minimum (see Figure 5). Computer simulations?0*21 using 6 pulses, have confirmed this result. The modification of the inner transition intensities arises from the correlations between reduced and normal spectra on the 2D surface and the result issued from magnetization transfers during t l . This effect, also observed in nematic solvents, provides an interesting way to separate, without ambiguity, the frequency of these lines from experi- mental artifacts or signals due to impurities dissolved in the
v Dimension 1
ad" u- 300 Hz
a=%"
v Dimension 2
500 Hz u- Figure 5. Evolution with a of the inner line intensities of the AB spin system on the V I and v2 projections when a FF-16 COSY experiment is used.
1 P
- - l . , , . , . , . ,
600 400 200 OH2 -200 -400 -HI0
Q- v 2 - D
Figure 6. 2D stack plot of a FF-16 COSY experiment of the ABC spin system for a = 70" and I , , / (~IA + z',J = 3/4 (associated with experimental conditions reported in entry 4 of Table 2). Note the original spectrum along the v2 projection and reduced spectrum along the V I projection.
liquid crystal. It is well-known that the observation of these small lines in the spectrum is sometimes crucial for the success of a simulation. A more illustrative example will be discussed in the forthcoming section.
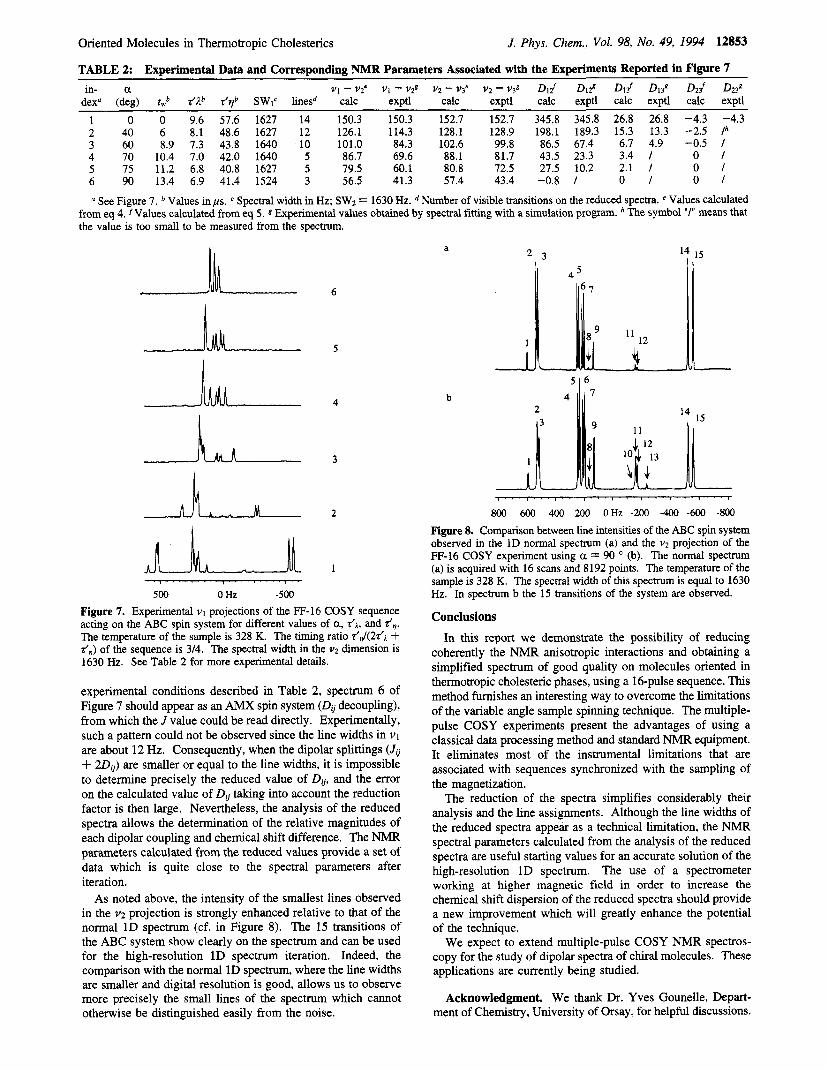
Study of an ABC Spin System
Utilizing this method simplifies work with three spin systems. An ABC spin system such as 2-cyanofuran has been chosen to be converted into a fmt-order system. The isotropic spectrum shows a typical AMX spin system with J12 = 3.5 Hz, J13 = 1.6
These values have been obtained by fitting the spectrum of 2cyanofuran, dissolved in the cholesteric solvent at a tempera- ture above the clearing point. The experimental 2D spectra are obtained with 256(21)*1024(t2) digitization at 328 K (see spectrum in Figure 6). Zero filling to 512 points is used to increase the digital resolution in V I (about 1.6 Hz per point). The experimental data and the NMR parameters for all experi- ments are listed in Table 2, and the V I projections are plotted in Figure 7. The chemical shift differences, Vi - Vj, and the dipolar couplings, Do, are expressed in hertz. It is known that any ABC spectrum cannot be iterated by using all of the nine spectral parameters, so the scalar couplings have been assumed to have their isotropic values.
Hz, J23 = 0.7 Hz, V I - 1r2 = 135 Hz, and ~2 - ~3 = 130 Hz.
The analysis of the results shows that, within experimental error, the evolution of spectral parameters is in quite good agreement with the calculated reduction factors. The analysis of the reduced spectra is limited mostly by the low spectral resolution in the V I projection due to the experimental line widths arising from B1 inhomogeneities?1*22 According to the
Oriented Molecules in Thermotropic Cholesterics
TABLE 2: Experimental Data and Corresponding NMR Parameters Associated with the Experiments Reported in Figure 7
dex' (deg) tWb <Ab <vb SWf lines" calc exptl calc exptl calc exptl calc exptl calc exptl 1 0 0 9.6 57.6 1627 14 150.3 150.3 152.7 152.7 345.8 345.8 26.8 26.8 -4.3 -4.3 2 40 6 8.1 48.6 1627 12 126.1 114.3 128.1 128.9 198.1 189.3 15.3 13.3 -2.5 lh 3 60 8.9 7.3 43.8 1640 10 101.0 84.3 102.6 99.8 86.5 67.4 6.7 4.9 -0.5 I 4 70 10.4 7.0 42.0 1640 5 86.7 69.6 88.1 81.7 43.5 23.3 3.4 I 0 1 5 75 11.2 6.8 40.8 1627 5 79.5 60.1 80.8 72.5 27.5 10.2 2.1 I 0 1 6 90 13.4 6.9 41.4 1524 3 56.5 41.3 57.4 43.4 -0.8 I 0 1 0 1
J. Phys. Chem., Vol. 98, No. 49, I994 12853
in- a V I - ~2~ V I - ~ 2 8 ~ 2 - ~ 3 ' ~ 2 - ~ 3 8 012' 0 1 2 8 014 D138 0 2 4 023'
See Figure 7. Values in ps. Spectral width in Hz; SW2 = 1630 Hz. Number of visible transitions on the reduced spectra. e Values calculated from eq 4. f Values calculated from eq 5. Experimental values obtained by spectral fitting with a simulation program. The symbol "I" means that the value is too small to be measured from the spectrum.
>
500 0 Hz -500 Figure 7. Experimental v1 projections of the FF-16 COSY sequence acting on the ABC spin system for different values of a, <A, and dq. The temperature of the sample is 328 K. The timing ratio <,4(2<.1 i- <,J of the sequence is 314. The spectral width in the v 2 dimension is 1630 Hz. See Table 2 for more experimental details.
experimental conditions described in Table 2, spectrum 6 of Figure 7 should appear as an AMX spin system (Dv decoupling), from which the J value could be read directly. Experimentally, such a pattern could not be observed since the line widths in v1 are about 12 Hz. Consequently, when the dipolar splittings (Ju + 2Du) are smaller or equal to the line widths, it is impossible to determine precisely the reduced value of Du, and the error on the calculated value of Dv taking into account the reduction factor is then large. Nevertheless, the analysis of the reduced spectra allows the determination of the relative magnitudes of each dipolar coupling and chemical shift difference. The NMR parameters calculated from the reduced values provide a set of data which is quite close to the spectral parameters after iteration.
As noted above, the intensity of the smallest lines observed in the v2 projection is strongly enhanced relative to that of the normal 1D spectrum (cf. in Figure 8). The 15 transitions of the ABC system show clearly on the spectrum and can be used for the high-resolution 1D spectrum iteration. Indeed, the comparison with the normal 1D spectrum, where the line widths are smaller and digital resolution is good, allows us to observe more precisely the small lines of the spectrum which cannot otherwise be distinguished easily from the noise.
'4 15
1 ' . , . . ' , ' . ' I , ' , , 1 . 1 I . I ' . I
800 600 400 200 OHZ -200 -400 -600 -800
Figure 8. Comparison between line intensities of the ABC spin system observed in the 1D normal spectrum (a) and the vz projection of the FF-16 COSY experiment using a = 90 ' (b). The normal spectrum (a) is acquired with 16 scans and 8192 points. The temperature of the sample is 328 K. The spectral width of this spectrum is equal to 1630 Hz. In spectrum b the 15 transitions of the system are observed.
Conclusions In this report we demonstrate the possibility of reducing
coherently the NMR anisotropic interactions and obtaining a simplified spectrum of good quality on molecules oriented in thermotropic cholesteric phases, using a 16-pulse sequence. This method furnishes an interesting way to overcome the limitations of the variable angle sample spinning technique. The multiple- pulse COSY experiments present the advantages of using a classical data processing method and standard NMR equipment. It eliminates most of the instrumental limitations that are associated with sequences synchronized with the sampling of the magnetization.
The reduction of the spectra simplifies considerably their analysis and the line assignments. Although the line widths of the reduced spectra appear as a technical limitation, the NMR spectral parameters calculated from the analysis of the reduced spectra are useful starting values for an accurate solution of the high-resolution 1D spectrum. The use of a spectrometer working at higher magnetic field in order to increase the chemical shift dispersion of the reduced spectra should provide a new improvement which will greatly enhance the potential of the technique.
We expect to extend multiple-pulse COSY NMR spectros- copy for the study of dipolar spectra of chiral molecules. These applications are currently being studied.
Acknowledgment. We thank Dr. Yves Gounelle, Depart- ment of Chemistry, University of Orsay, for helpful discussions.

12854 J. Phys. Chem., Vol. 98, No. 49, 1994
Appendix
In agreement with the theory described by M e h r i ~ ~ g , ~ ~ the intemal Hamiltonian can be expressed as a sum of irreducible tensor operators Ak and Tk:
k
Lesot et al.
Then, for the chemical shift,
i q=-1
and for the dipolar coupling
2
The extemal radio frequency perturbation pulses of the spin system in the multiple-pulse sequence are given by
Zd = -ol(t).uT*I 04-4)
where u is a unit vector in the direction of the applied field and 01 is the perturbation frequency.
The rotation corresponding to these pulses is described by the unitary operators
~ , ( t ) = exp[-a(t).u'*11 (44-5)
with
a(?) = hfwl(t') dr'
In the rotating frame, the "switched" Hamiltonian, which describes the spin system, is given by
fiint(t) = 64-6)
In spin space, the spatial part of the intemal Hamiltonian is invariant under rf pulses. Furthermore, considering secular contributions, only ?,(t) need to be calculated. For a single spin F,(t) is given by
G
P,(d = Ll-'(t)T,Ll(t) = c T&,,(w(t),-- q) (A-7) q=-k
Dk are the Wigner rotation matrices where p is the rf pulse phase and a is the rf pulse angle.
The average Hamiltonian during rf irradiation is then defined as
(A-8) ?',(a) = --haP,(a') 1 da'
with
a = hfwwl( t ) di
where tw is the duration of the rf pulse. Let us now consider the case of the chemical shift and the
dipolar interaction. The time independant evolution tensor between rf pulses and the time dependent evolution tensor during rf pulses of the chemical shift can be written respectively as
- Tlo(a) = cos(a)Tlo + 2-'" sin(a)[eip,T1-, - e "pTll] (A-9)
and
In a similar manner, the dipolar coupling tensors are given by
and
3 sin(2a) = '(' 2 2 + 4a )7,20 +
FF-8 is constructed of four symmetric two-pulse subcycles. In the irreducible tensor representation, the zero-order average Hamiltonian is expressed as a weighted sum over the tensors associated with each subcycle. In Figure 2d, the tensor associated with each period of a subcycle is diagrammed.
$o)m-8 = 4 8 y P ,(o) + 6 , ~ C d a ) + %'(a> + %(a> + 4%
M)
%'(a)) + 2tw(Sx,(a) + c ( a > + %(a) + %(a)>>
(A-1 1)
The FF-16 sequence is obtained by a reflection symmetriza- tion of FF-8 (Figure 2b) according to the definition given by Wang and rams ha^.^' This symmetrization cancels the odd- order average Hamiltonian but leaves the zero-order average Hamiltonian unchanged, so
= CY (A-12)
Inserting eq A-9 into eq A-11, the chemical shift can be expressed as
with
2t', + r', cos(a) + 2tw Kc,'" = (22!2 + 6, + 2tw) (4)
Inserting eq A-10 into eq A-11, the dipolar interaction can be expressed as
= K,'"% = K , " W 20 ?ti 20 (A-14) i5j
with

Oriented Molecules in Thermotropic Cholesterics
References and Notes
90, 2183.
111, 8294.
Cryst. 1989, 2 , 189.
(1) Sackmann, E.; Meiboom, S.; Snyder, L. C. J. Am. Chem. SOC. 1968,
(2) Lafontaine, E.; Bayle, J. P.; Courtieu, J. J. Am. Chem. SOC. 1989,
(3) Lafontaine, E.; Pechiney, J. M.; Mayne, C. L.; Courtieu, J. Liq.
(4) Saupe, A.; Englert, G. Phys. Rev. Lett. 1963, 11, 462. (5) Emsley, J. W.; Lindon, J. C. In NMR Spectroscopy Using Liquid
Crystal Solvents; Ed.; Pergamon Press: New York, 1975; Chapters 1, 2. (6) Tsvetkov, V. Zh. Eksp. Theor. Fiz. 1935, 9, 603. (7) Lippmann, H. Ann. Phys. 1958, I , 157. (8) Hornreich, R. M. Phys. Rev. A 1977, 15, 1967. (9) Courtieu, J.; Alderman, D. W.; Grant, D. M. J. Am. Chem. SOC.
(10) Courtieu, J.; Alderman, D. W.; Grant, D. M.; Bayle, J. P. J. Chem.
(11) Courtieu, J.; Bayle, J. P.; Fung, B. Prog. NMR Spectrosc. 1994,
(12) Bayle, J. P.; Khandar-Shahabad, A,; Courtieu, J. Liq. Cryst. 1986,
1981, 103, 6783.
Phys. 1982, 77, 723.
26 (2), 141.
I, 189.
J. Phys. Chem., VoE. 98, No. 49, 1994 12855
(13) Bayle, J. P.; Khandar-Shahabad, A.; Gonord, P.; Courtieu, J. J.
(14) Friedel, G. Ann. Phys. (Paris) 1922, 8, 273. (15) Buckingham, A. D.; Ceasars, G. P.; Dum, M. B. Chim. Phys. Let?.
(16) Luz, 2.; Poupko, R.; Samulski, E. T. J. Chem. Phys. 1981, 74,
(17) Sackmann, E.; Meiboom, S.; Snyder, L. C. J. Am. Chem. SOC. 1967,
(1 8) Sackmann, E.; Meiboom, S.; Snyder, L. C.; Meixner, A. E.; Dietz,
(19) Bayle, J. P.; Lafontaine, E.; Courtieu, J. J. Chem. Phys. 1988,85,
(20) Ouvrard, J. M. Ph.D. Thesis, University of Paris-Sud, CNRS No.
(21) Ouvrard, J. M.; Ouvrard, B. M.; Courtieu, J.; Maine, C. L.; Grant,
(22) Lesot, P.; Ouvrard, J. M.; Ouvrard, B. N.; Courtieu, J. J. Mugn.
(23) Canet, I.; Wvshall, J.; Courtieu, J. Liq. Cryst. 1994, 16, 405. (24) Mehring, M. In Principles of High Resolution NMR in Solids; 2nd
(25) Haeberlen, U.; Waugh, J. S. Phys. Rev. 1968, 175, 453. (26) Meluing, M.; Waugh, J. S. Phys. Rev. B 1972, 5, 3459. (27) Wang, C. H.; Ramshaw, D. Phys. Rev. B 1972, 6, 3253.
Chem. Phys. 1986,83, 177.
1969, 3, 540.
5825.
89, 5981.
R. E. J. Am. Chem. SOC. 1967, 90, 3567.
985.
1167, 1990.
D. M. J. Magn. Reson. 1991, 93, 225.
Reson. 1994, I07A, 141.
ed.; Springler-Verlag: New York, 1983; Chapter 3.