
Perfluorinated contaminants in fur seal pups and penguin eggs from South Shetland, Antarctica
Molecular Ecology (2009) 18, 2390–2400 doi: 10.1111/j.1365-294X.2009.04203.x
© 2009 Blackwell Publishing Ltd
Blackwell Publishing LtdMultilocus assignment analyses reveal multiple units and rare migration events in the recently expanded yellow-eyed penguin (Megadyptes antipodes)
SANNE BOESSENKOOL,* BASTIAAN STAR,† JONATHAN M. WATERS* and PHILIP J . SEDDON**Department of Zoology, University of Otago, 340 Great King Street, Dunedin 9016, New Zealand, †Centre for Ecological and Evolutionary Synthesis, Department of Biology, University of Oslo, PO Box 1066, Blindern, 0316 Oslo, Norway
Abstract
The identification of demographically independent populations and the recognition ofmanagement units have been greatly facilitated by the continuing advances in genetictools. Managements units now play a key role in short-term conservation managementprogrammes of declining species, but their importance in expanding populations receivescomparatively little attention. The endangered yellow-eyed penguin (Megadyptes antipodes)expanded its range from the subantarctic to New Zealand’s South Island a few hundredyears ago and this new population now represents almost half of the species’ total censussize. This dramatic expansion attests to M. antipodes’ high dispersal abilities and suggeststhe species is likely to constitute a single demographic population. Here we test thishypothesis of panmixia by investigating genetic differentiation and levels of gene flowamong penguin breeding areas using 12 autosomal microsatellite loci along with mitochon-drial control region sequence analyses for 350 individuals. Contrary to our hypothesis,however, the analyses reveal two genetically and geographically distinct assemblages:South Island vs. subantarctic populations. Using assignment tests, we recognize just two first-generation migrants between these populations (corresponding to a migration rate of < 2%),indicating that ongoing levels of long-distance migration are low. Furthermore, the SouthIsland population has low genetic variability compared to the subantarctic population. Theseresults suggest that the South Island population was founded by only a small numberof individuals, and that subsequent levels of gene flow have remained low. The demographicindependence of the two populations warrants their designation as distinct managementunits and conservation efforts should be adjusted accordingly to protect both populations.
Keywords: assignment test, dispersal, genetic structure, microsatellites, New Zealand, wildlifemanagement
Received 5 February 2009; revision received s March 2009; accepted 25 March 2009
Introduction
Genetic tools have revolutionized our ability to identifypopulations and assess gene flow in species where collectionof robust ecological and demographic data is challengingdue, for example, to the inaccessibility of breeding sites,or the secretive behaviour or rarity of the species. Theaccurate identification of populations plays a key role inconservation, where populations represent focal points fordetermining appropriate scales for management (Cegelski
et al. 2003; Waples & Gaggiotti 2006). Populations may berecognized within either an ecological or an evolutionaryparadigm (Waples & Gaggiotti 2006). The latter paradigmdefines populations as groups of individuals that areconnected through demographic cohesion (Waples &Gaggiotti 2006) and provides a suitable framework for theidentification of management units (MU) for conservation.The recognition of MUs, defined as demographicallyindependent populations in which population dynamicsare primarily dependent on local birth and death ratesrather than immigration, is particularly important forshort-term (e.g. < 20 years) wildlife management pro-grammes (Palsbøll et al. 2007). While the importance of
Correspondence: Sanne Boessenkool, Fax: +47 22 85 4001; E-mail: [email protected]
R A R E M I G R AT I O N E V E N T S I N Y E L L O W- E Y E D P E N G U I N S 2391
© 2009 Blackwell Publishing Ltd
defining MUs is widely accepted for species that havesuffered recent declines, less attention has been paid to thepotential importance of MUs for expanding taxa.
The iconic yellow-eyed penguin (Megadyptes antipodes) —an endangered New Zealand endemic — was, until recently,considered a declining remnant of a once widespread andabundant population. Genetic and morphological research,however, suggests that M. antipodes underwent a dramaticrange expansion during the last few hundred years (Boes-senkool et al. 2009). Indeed, up to ~1500 ad, yellow-eyedpenguins were apparently restricted to the subantarcticAuckland and Campbell Islands (Fig. 1), and only after theanthropogenic demise of the endemic mainland Megadyptes
waitaha is M. antipodes inferred to have expanded north tomainland New Zealand (Boessenkool et al. 2009). The latterspecies is now an important and well-promoted elementof the country’s wildlife tourism industry. This penguincurrently breeds along the southeast coast of the SouthIsland (i.e. mainland New Zealand), around Stewart Island,and on the subantarctic Auckland and Campbell Islands(Fig. 1). Coastal breeding sites are patchily distributed,however, and consist of loose aggregations of nests ratherthan true colonies (Seddon & Davis 1989). The species hasbeen classified as endangered based on its confined breedingrange, destruction of local habitat and extreme fluctuationsin numbers during recent decades (Birdlife International2008). This classification, in combination with the species’high profile, has led to intense conservation efforts bygovernmental and local community agencies. Such con-servation measures typically involve predator trapping,revegetation of coastal habitat, regular monitoring of neststhroughout the breeding areas on the South Island, and —more recently — regulations restricting access to beacheshave been implemented in an attempt to reduce the impactof tourism (McKinlay 2001; Ellenberg et al. 2007).
Although M. antipodes’ inferred recent expansion clearlyindicates strong potential for long-distance dispersal, it isunclear whether this was a ‘one-off’ colonization eventin response to anthropogenic extinction, or whether suchoceanic dispersal is an ongoing ecological phenomenonin this species. Considering the penguin’s putative recentarrival in South Island (Boessenkool et al. 2009), low fecundity,and slow rate of reproduction (Darby & Seddon 1990),it is noteworthy that South Island M. antipodes nowadaysconstitutes a sizeable proportion (40%; ~800 nests) of thetotal yellow-eyed penguin population (McKinlay 2001).This substantial increase of M. antipodes on the South Islandmight result from ongoing immigration from the sub-antarctic, but three lines of evidence suggest otherwise. First,of the ~10 000 yellow-eyed penguins that have been bandedon the South Island, along with ~550 on the Campbell andAuckland Islands, only one individual is known to havecrossed the ~500 km stretch of ocean separating theseregions. This migrating bird was recovered dead on theSouth Island (Department of Conservation, unpublisheddata). Second, allozyme data show significant geneticdifferentiation between Auckland Islands and the SouthIsland, and between Campbell Island and the South Islandpenguins (FST = 0.33 and 0.14, respectively) (Triggs & Darby1989). Finally, yellow-eyed penguins, like most penguinspecies, show strong reproductive philopatry with up to 98%of breeders returning to their previous breeding location(Richdale 1957; Ratz et al. 2004). Therefore, any dispersalbetween breeding areas most likely results from the move-ment of young adults before they reach maturity. Althoughjuveniles have been recorded travelling 600 km along theSouth Island (Marchant & Higgins 1990), almost 90% of the
Otago Peninsula
North Otago
Catlins
Codfish Island
South Island
Stewart Island
Auckland Islands
Campbell Island0 200 km
N
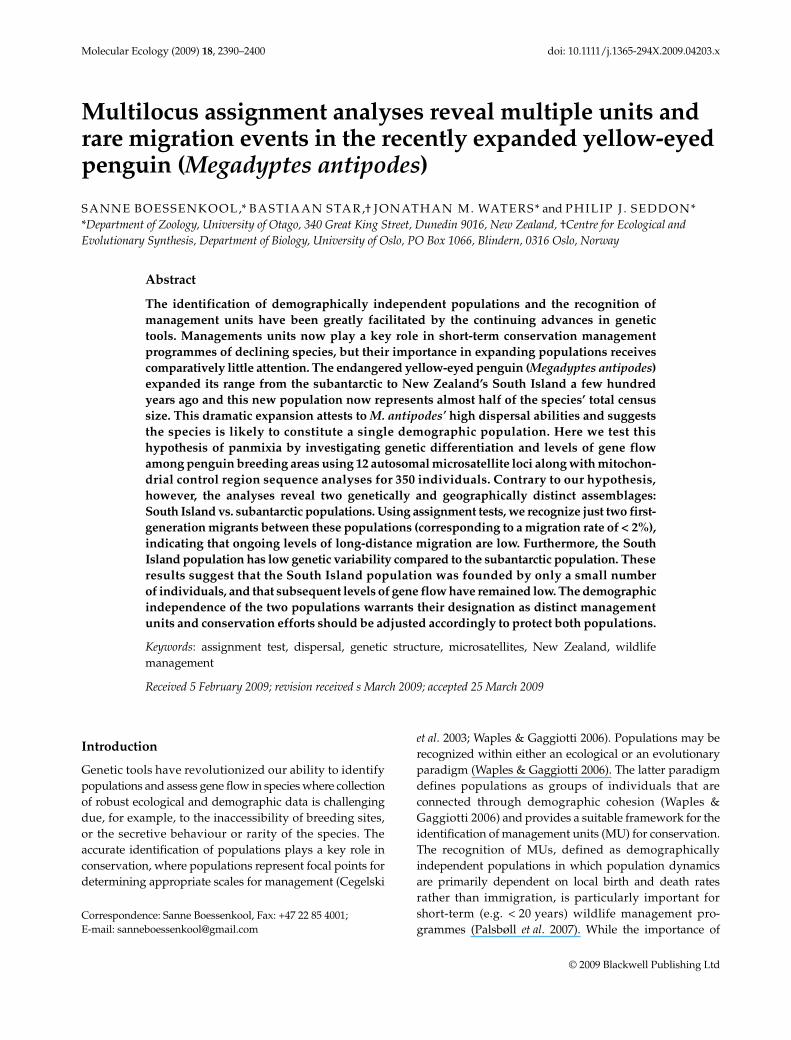
Fig. 1 Map of the south and subantarctic islands of New Zealand.Arrows point to the geographical locations where samples werecollected. The dark grey line represents the current breeding rangeof Megadyptes antipodes. Samples were not collected from the mostnorthern part of the range (Banks Peninsula on the east coast of theSouth Island). In this area, only ~30 birds are found and most areknown migrants from Otago Peninsula.
2392 S . B O E S S E N K O O L E T A L .
© 2009 Blackwell Publishing Ltd
surviving juveniles eventually breed near the area wherethey hatched (Richdale 1957). Therefore, despite the inferredrecent range expansion of M. antipodes, existing ecologicaland allozyme data imply that dispersal between the suban-tarctic and the South Island may be rare. In light of theseapparent contradictions, an improved understanding of M.antipodes population structure and dispersal, including theidentification of MUs, is urgently needed to aid managementof this endangered species.
The identification of demographically independentpopulations, and the subsequent designation of MUs, is atwo-step process. The first step requires identificationof population boundaries. Such boundaries are not self-evident in species with considerable dispersal ability, andthe separation of mobile individuals into groups based ongeographical proximity is problematic. The physical barriersthat restrict dispersal are particularly poorly understoodfor marine biota (Cassens et al. 2005). In such cases, geneticclustering analyses provide a promising means of inferringthe number of populations, and these methods have alreadyproven to be a valuable and reliable tool in conservationbiology (Pearse & Crandall 2004; Manel et al. 2005; Waples& Gaggiotti 2006). Once populations have been identified,the second step requires quantitative estimates of dispersalrates among the different populations (Palsbøll et al. 2007).While the exact rate of migration required to preventdemographic independence is unknown (Waples & Gaggiotti2006), it has been suggested that such independence occurswhen dispersal rates drop below 10% (Hastings 1993).Determining dispersal rates from traditional genetic modelsis difficult, but recent advances in assignment methods nowenable us to obtain critical information regarding geneticstructure and gene flow (Berry et al. 2004; Pearse & Crandall2004; Manel et al. 2005).
In this study, we use microsatellite markers and mitochon-drial DNA to test the hypothesis that M. antipodes comprisesa single demographic population across its New Zealand —subantarctic range. We discuss our results in light of therecent expansion and current conservation management ofthis species, and evaluate the designation of multiple MUs.
Materials and methods
Study area and sampling
Yellow-eyed penguin blood samples (N = 350) werecollected at all major breeding areas in New Zealand andits subantarctic islands, covering the entire, known breedingrange of the species (Fig. 1). In the subantarctic, sampleswere obtained from Campbell Island (52°32′S, 169°05′E,N = 49) and the Auckland Islands (50°29′S, 166°17′S,N = 52). On the South Island of New Zealand samplingwas conducted in North Otago (45°23′S, 170°52′E, N = 35),Otago Peninsula (45°53′S, 170°37′E, N = 86), and the Catlins
(46°34′S, 169°35′E, N = 38). Finally, samples were collectedon Stewart Island (46°57′S, 168°80′E, N = 40) and CodfishIsland (46°46′S, 167°38′E, N = 50), which lie just south ofthe South Island.
Samples were collected from 2005 to 2008, with theexception of 24 birds that were sampled on Otago Penin-sula in 2001. These 24 birds were, however, all still breedingin this location in 2006 and can therefore be treated as partof the 2005–2008 sample. To avoid sampling dispersingbirds, and to minimize sampling closely related individuals,samples were collected from either adults or chicks in eachbreeding area. Sampling of juveniles was avoided becausejuvenile birds are known to travel in their first year follow-ing fledging (Marchant & Higgins 1990). Juveniles can berecognized by the lack of a distinctive yellow eye andyellow crown across the head, features that develop duringthe first moult around 18 months after hatching. Resamplingof individuals was avoided either by permanently taggingbirds with flipper bands or transponders, or by visitingbreeding sites during a single season only.
Penguins were captured on the nest (South Island and sub-antarctic islands) or on the beach (subantarctic islands only).Blood samples (~0.05 mL) were collected from the brachialvein using sterilized syringes and needles, and subsequentlystored in 1 mL Queens lysis buffer (Seutin et al. 1991).
DNA extraction, microsatellite genotyping and mtDNA sequencing
DNA was extracted and purified using 40 μg proteinase Kin 5% Chelex (Bio-Rad; Walsh et al. 1991). All samples weregenotyped at 12 microsatellite loci previously developedfor yellow-eyed penguins (Man03, Man08, Man13, Man21,Man22, Man27, Man39, Man47, Man50, Man51, Man54,Man55; Boessenkool et al. 2008). Microsatellite primersequences and polymerase chain reaction (PCR) conditionsare described in Boessenkool et al. (2008).
Mitochondrial DNA sequence analyses targeted thefirst hypervariable region of the control region which wasamplified using primers L-Man-CR4 and H-Man-CR7 asdescribed in Boessenkool et al. (2009). The 813-bp fragmentwas sequenced for a subset of samples (N = 100), including20 birds from each of the subantarctic breeding areas, and15 from North Otago, Otago Peninsula, Catlins, and CodfishIsland, respectively. PCR products were sequenced one way,using primer H-Man-CR7, resulting in a total of 731 bp usedfor further analyses. All haplotypes have been deposited inGenBank under accession nos FJ822137–FJ822143.
Hardy–Weinberg and linkage equilibrium of microsatellites
Deviations from Hardy–Weinberg proportions and linkageequilibrium were tested in each breeding area separately
R A R E M I G R AT I O N E V E N T S I N Y E L L O W- E Y E D P E N G U I N S 2393
© 2009 Blackwell Publishing Ltd
using GenePop 4.0 (Rousset 2008). Markov chain parametersemployed 10 000 dememorizations, 1000 batches and 10 000iterations. Significance levels were adjusted for multiplecomparisons using Bonferroni corrections (Rice 1989).
Population genetic structure
To identify genetically cohesive populations of yellow-eyedpenguins, we used the Bayesian clustering analysis imple-mented in Structure 2.2 (Pritchard et al. 2000). This model-based method uses a Markov chain Monte Carlo (MCMC)simulation to assign individuals to genetic clusters (K) onthe basis of their genotypes, regardless of geographicalsampling information. The analysis detects clusters underthe assumptions of Hardy–Weinberg and linkage equilibriumwithin each cluster. Estimated membership coefficientsper individual per cluster (Q) are calculated, allowingprobabilistic assignment of individuals to clusters.
We performed five replicate runs for values K = 1 toK = 7 (seven being the number of sampled breeding areas),using the admixture model and assuming correlated allelefrequencies (Pritchard et al. 2000; Falush et al. 2003).Exploratory runs showed that a burn-in of 500 000 followedby 1 000 000 iterations was sufficient to achieve convergencein our data set. We used a uniform prior for alpha, with amaximum of 10.0 and set Alphapropsd to 0.05. Lambdawas set at 1.0 and the prior for FST was left at default valueswith a mean of 0.01 and a standard deviation of 0.05. Weestimated the optimal number of clusters for our data bycomparing the log-likelihood of the data given the numberof clusters [ln P(X|K)] (Pritchard et al. 2000), by examiningthe standardized second order rate of change of lnP(X|K) (ΔK) (Evanno et al. 2005), and by evaluatingindividual membership coefficients for different valuesof K (Pritchard et al. 2000). The assumption of correlatedallele frequencies can sometimes lead to overestimates ofK (Pritchard et al. 2007), and we therefore repeated ouranalyses using the independent allele frequency modelwith lambda set to 1.0. The outcomes of the analyses were,however, not affected by model choice and we report onlyresults from runs in which correlated allele frequencieswere assumed.
To evaluate levels of genetic variation within breedingareas and the populations identified from the clusteringanalyses in Structure, we calculated the total number ofalleles, number of unique alleles, and expected and observedheterozygosities in Genetix 4.05.2 (Belkhir et al. 1996–2004).When calculating levels of genetic variation within theidentified populations, we placed samples into one of theidentified populations according to their geographicalsampling location rather than the population they weredefined in genetically. In other words, individuals that hadbeen placed genetically in a population different from theirgeographical sampling area were returned to their original
location. This ‘correction’ prevents biasing populationallele frequencies due to the exclusion of possible migrants(Cegelski et al. 2003). For the mtDNA data, we calculatedhaplotype and nucleotide diversity indices within each ofthe different breeding areas and the identified populationsusing DnaSP (Rozas et al. 2003).
To quantify levels of genetic differentiation, we calculatedFST values between both geographical breeding areasand the populations identified by the clustering analysis.Calculations of Weir & Cockerham’s (1984) FST wereperformed in Genetix 4.05.2 (Belkhir et al. 1996–2004) forthe microsatellite data, and FST values for mtDNA datawere calculated with Arlequin 3.11 (Excoffier et al. 2005).Significance levels were tested using 10 000 permutationsand adjustments for multiple comparisons were appliedusing Bonferroni corrections (Rice 1989). Genealogicalrelationships among samples were reconstructed using aparsimony-based haplotype network with a 95% parsi-mony criterion using tcs (Clement et al. 2000).
Detection of migrants
We employed two different methods to evaluate dispersalbetween the yellow-eyed penguin populations identifiedusing Structure. We did not attempt to identify migrantsbetween breeding areas, because assignment tests (seebelow) can be unreliable in identifying migrants whenpopulation units are only weakly differentiated (e.g.FST < 0.05; Berry et al. 2004).
First-generation migrants were identified using themethod specifically designed to detect F0 immigrants,implemented in GeneClass2 (Paetkau et al. 2004; Piry et al.2004). We used the test statistic Lh/Lmax, where Lh is the like-lihood of drawing a genotype in the population fromwhich it was sampled and Lmax is the greatest likelihood ofdrawing this genotype in any of the sampled populations.This test statistic is appropriate when all source populationshave been sampled (Paetkau et al. 2004), as is the case in thecurrent study. We employed Rannala & Mountain’s (1997)Bayesian criterion for likelihood estimation and Paetkau’set al. (2004) resampling method to generate critical valuesfor rejecting the null hypothesis that an individual wasborn in the population where it was sampled. We simulated10 000 individuals and set alpha at 0.001. This alpha valuecorresponds to an expected type I error rate of 0.35 migrantsin our data set comprising 350 individuals (see Paetkauet al. 2004). Since migration rates between the penguinpopulations appear to be low, we consider this an appro-priate type I error rate for the current study.
The assignment test implemented in Structure 2.2(Pritchard et al. 2000) was used to detect putative migrantsalong with any individuals with recent immigrant ancestry.The latter category was particularly important for our ana-lysis, which includes 125 individuals that were sampled as
2394 S . B O E S S E N K O O L E T A L .
© 2009 Blackwell Publishing Ltd
chicks from the South Island. Although these individualsare obviously not migrants themselves, their genotypes maycontain valuable information regarding the geographicalorigin of their parents. The assignment test implemented inStructure is a fully Bayesian method that uses geographicalsampling location as prior population information, andassumes with a user-specified prior probability (v) that anindividual is an immigrant (Pritchard et al. 2000). Thisspecified probability that an individual is an immigrant(i.e. did not originate in its sampling location) can affect theoutcome of the test (Pritchard et al. 2000). To account foruncertainty in v, we ran replicate analyses using distinctprior settings: v = 0.05 and v = 0.1. These settings corre-spond to individuals having a 5% or 10% probability,respectively, of being an immigrant or having migrantancestry. Posterior probabilities (PP) of immigrant ancestrywere calculated to two generations back, and models wererun under the assumption that allele frequencies werecorrelated among populations with lambda set to 1.0. TheMCMC simulation was performed with a burn-in of500 000 followed by 1 000 000 iterations.
Results
All 350 samples amplified at all 12 microsatellite lociwith the exception of six samples, which have missing geno-types for one (three samples), three (two samples) or five loci(one sample), respectively. There was no evidence for linkagedisequilibrium between any pair of loci in any of thebreeding areas. Only one locus (Man08) showed significantdeparture from Hardy–Weinberg proportions, and thiswas observed in just a single breeding area (Catlins).
Estimating the number of populations
Low variance in ln P(X|K) across replicate runs, and visualinspection of the time series plots of the likelihood andthe estimated parameters, confirmed convergence of theclustering analyses in Structure. Evaluation of ln P(X|K),
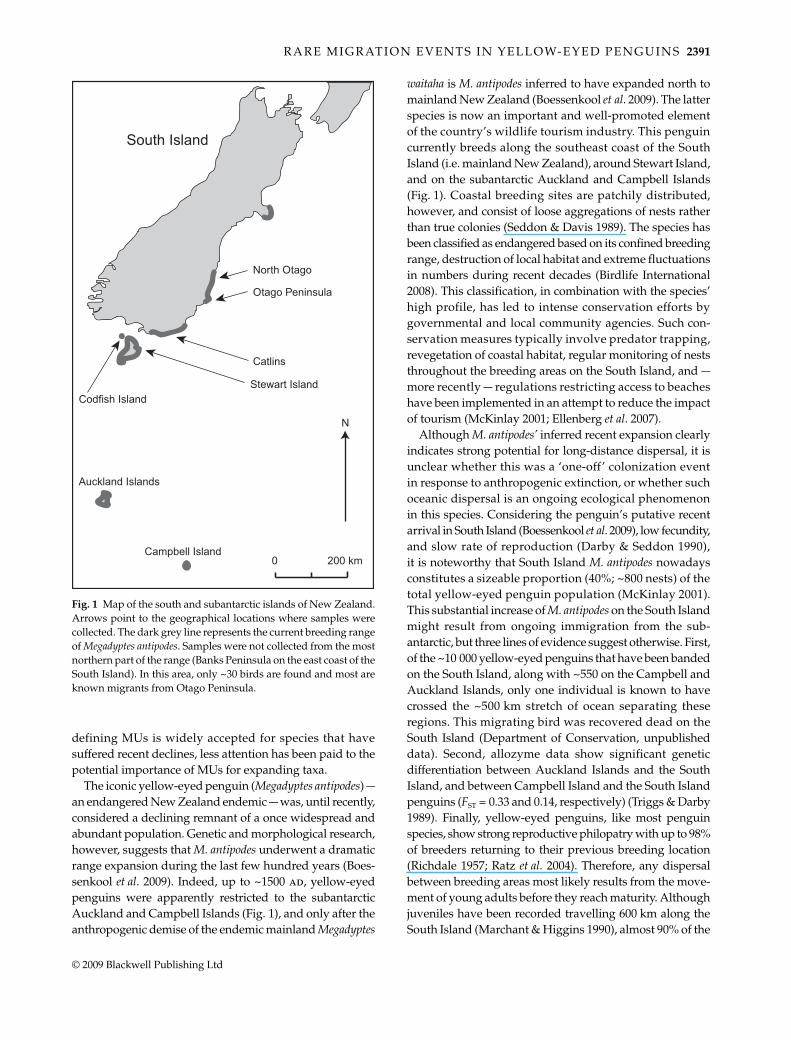
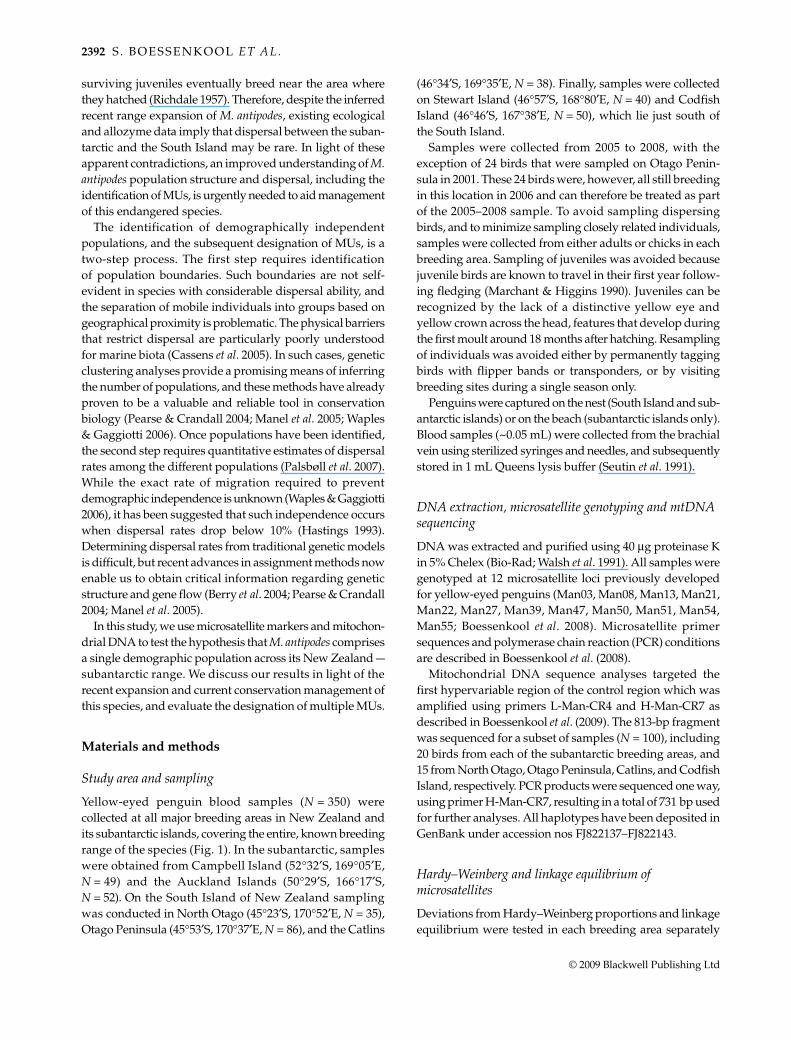
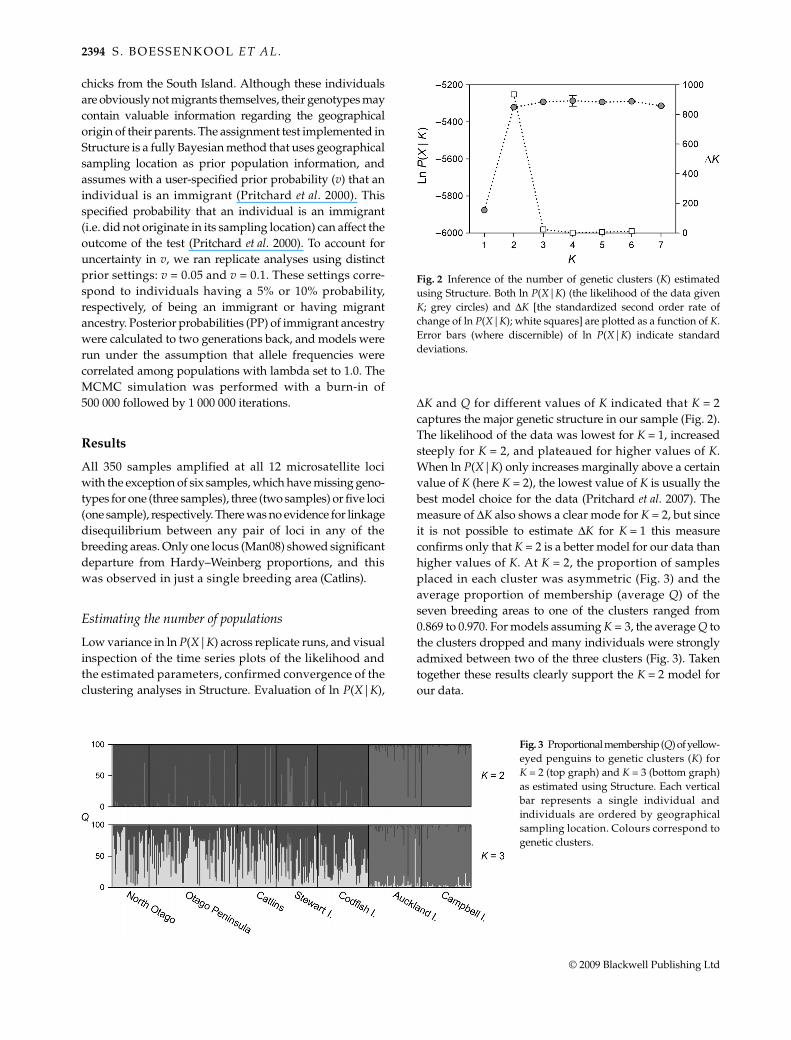
ΔK and Q for different values of K indicated that K = 2captures the major genetic structure in our sample (Fig. 2).The likelihood of the data was lowest for K = 1, increasedsteeply for K = 2, and plateaued for higher values of K.When ln P(X|K) only increases marginally above a certainvalue of K (here K = 2), the lowest value of K is usually thebest model choice for the data (Pritchard et al. 2007). Themeasure of ΔK also shows a clear mode for K = 2, but sinceit is not possible to estimate ΔK for K = 1 this measureconfirms only that K = 2 is a better model for our data thanhigher values of K. At K = 2, the proportion of samplesplaced in each cluster was asymmetric (Fig. 3) and theaverage proportion of membership (average Q) of theseven breeding areas to one of the clusters ranged from0.869 to 0.970. For models assuming K = 3, the average Q tothe clusters dropped and many individuals were stronglyadmixed between two of the three clusters (Fig. 3). Takentogether these results clearly support the K = 2 model forour data.
Fig. 3 Proportional membership (Q) of yellow-eyed penguins to genetic clusters (K) forK = 2 (top graph) and K = 3 (bottom graph)as estimated using Structure. Each verticalbar represents a single individual andindividuals are ordered by geographicalsampling location. Colours correspond togenetic clusters.
Fig. 2 Inference of the number of genetic clusters (K) estimatedusing Structure. Both ln P(X|K) (the likelihood of the data givenK; grey circles) and ΔK [the standardized second order rate ofchange of ln P(X|K); white squares] are plotted as a function of K.Error bars (where discernible) of ln P(X|K) indicate standarddeviations.
R A R E M I G R AT I O N E V E N T S I N Y E L L O W- E Y E D P E N G U I N S 2395
© 2009 Blackwell Publishing Ltd
The two genetic clusters identified using Structurecorresponded remarkably well with the geographicallocations. The first cluster was made up of the subantarcticbreeding areas Auckland and Campbell Islands. The averageQ of these breeding areas to this cluster was 0.908 and0.970, respectively. All the breeding areas on and near theSouth Island were placed in the second cluster. Average Qto this cluster was 0.976, 0.950, 0.925, 0.869 and 0.958 forNorth Otago, Otago Peninsula, Catlins, Stewart and CodfishIsland, respectively. In all subsequent analyses, andthroughout the discussion, we refer to the two clusters assubantarctic and the South Island populations. Since we areultimately interested in geographical populations, and toprevent biasing allele frequencies by exclusion of migrants,we placed samples into one of the two populations (sub-antarctic or South Island) according to their geographicalsampling location (see Materials and Methods).
Genetic variation within breeding areas and populations
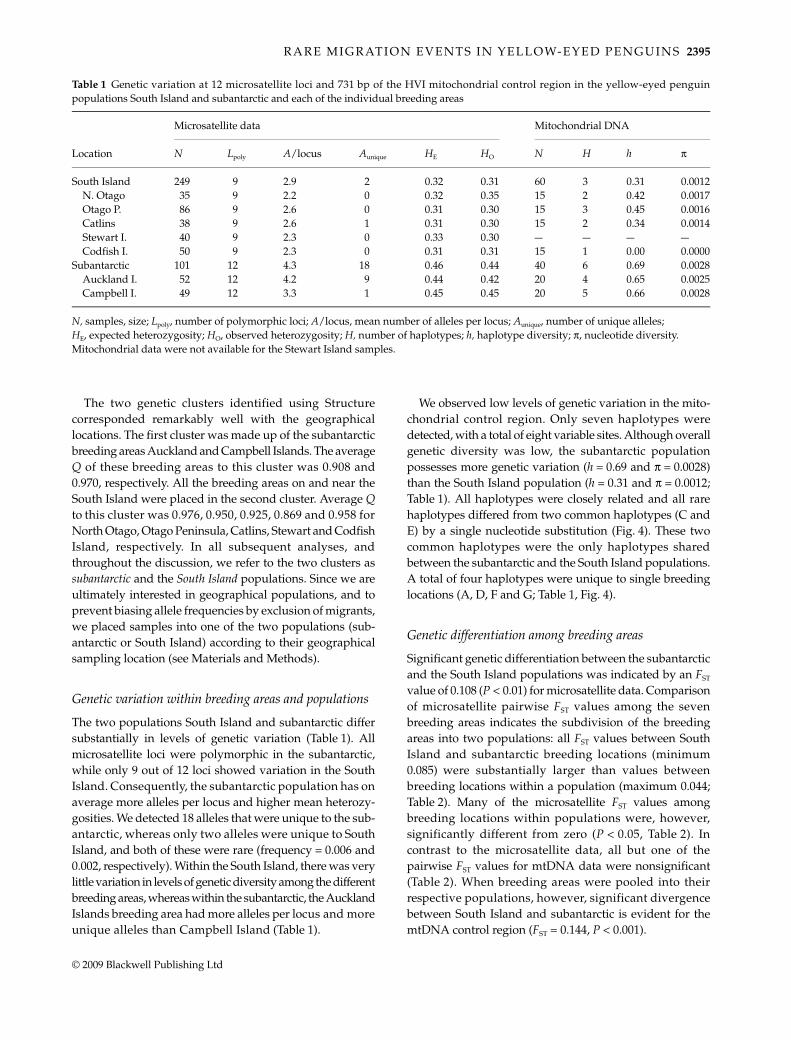
The two populations South Island and subantarctic differsubstantially in levels of genetic variation (Table 1). Allmicrosatellite loci were polymorphic in the subantarctic,while only 9 out of 12 loci showed variation in the SouthIsland. Consequently, the subantarctic population has onaverage more alleles per locus and higher mean heterozy-gosities. We detected 18 alleles that were unique to the sub-antarctic, whereas only two alleles were unique to SouthIsland, and both of these were rare (frequency = 0.006 and0.002, respectively). Within the South Island, there was verylittle variation in levels of genetic diversity among the differentbreeding areas, whereas within the subantarctic, the AucklandIslands breeding area had more alleles per locus and moreunique alleles than Campbell Island (Table 1).
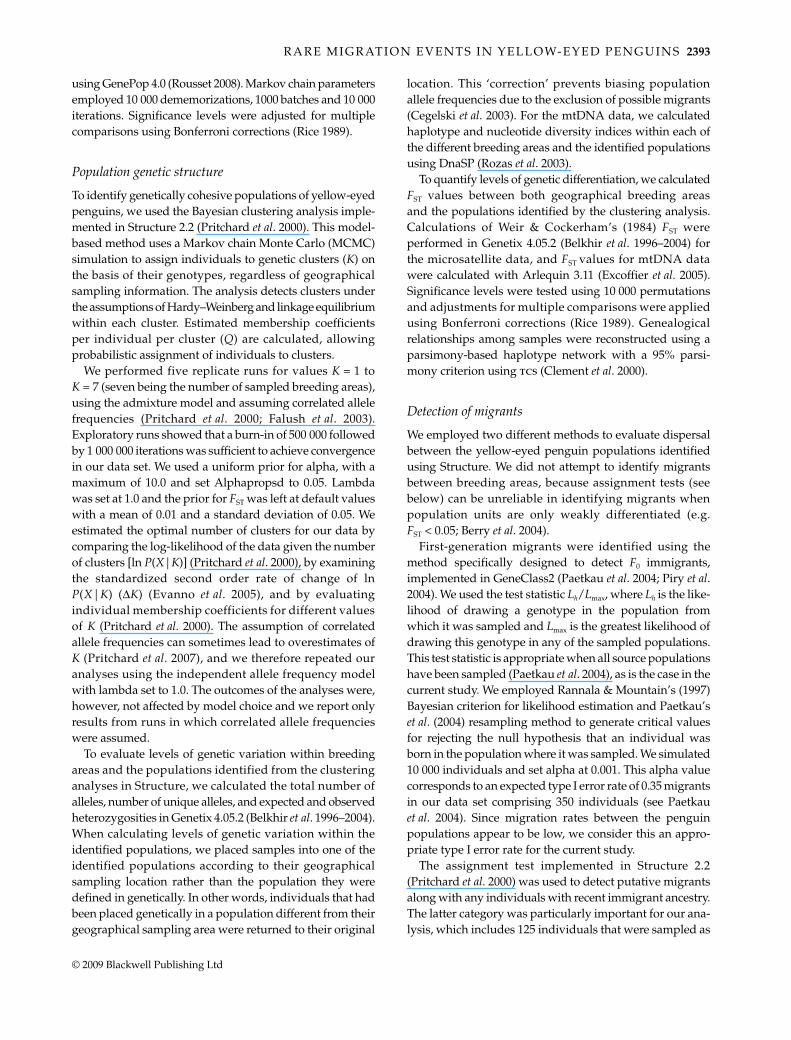
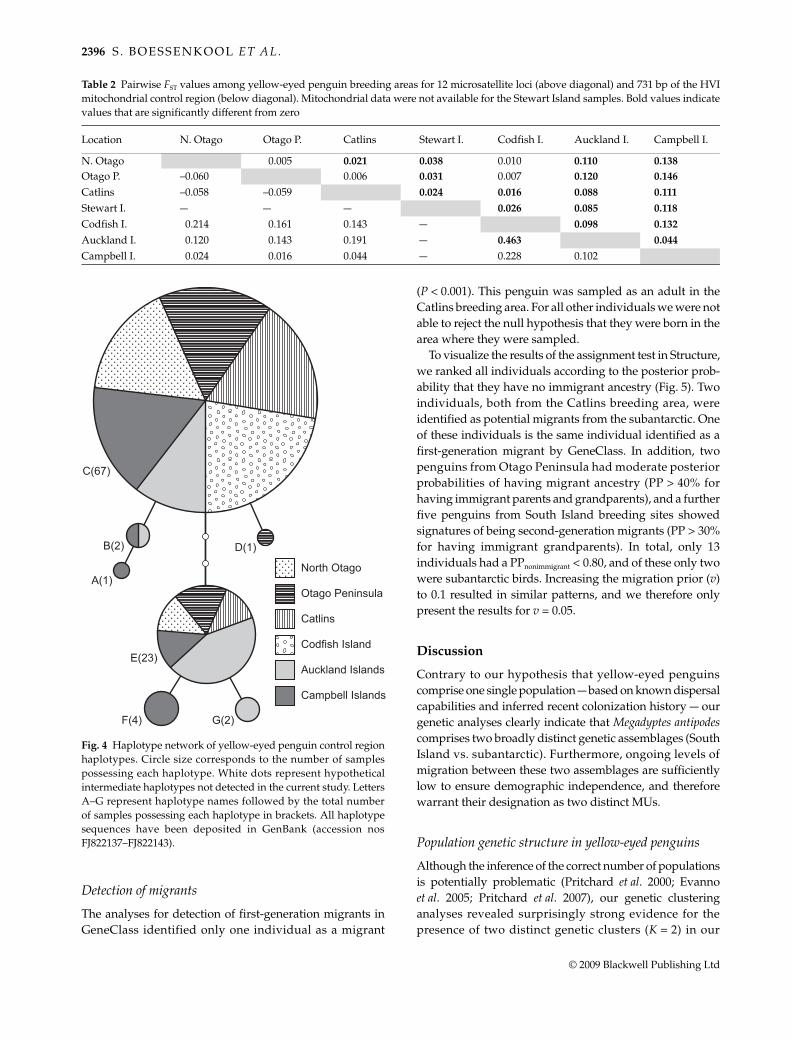
We observed low levels of genetic variation in the mito-chondrial control region. Only seven haplotypes weredetected, with a total of eight variable sites. Although overallgenetic diversity was low, the subantarctic populationpossesses more genetic variation (h = 0.69 and π = 0.0028)than the South Island population (h = 0.31 and π = 0.0012;Table 1). All haplotypes were closely related and all rarehaplotypes differed from two common haplotypes (C andE) by a single nucleotide substitution (Fig. 4). These twocommon haplotypes were the only haplotypes sharedbetween the subantarctic and the South Island populations.A total of four haplotypes were unique to single breedinglocations (A, D, F and G; Table 1, Fig. 4).
Genetic differentiation among breeding areas
Significant genetic differentiation between the subantarcticand the South Island populations was indicated by an FST
value of 0.108 (P < 0.01) for microsatellite data. Comparisonof microsatellite pairwise FST values among the sevenbreeding areas indicates the subdivision of the breedingareas into two populations: all FST values between SouthIsland and subantarctic breeding locations (minimum0.085) were substantially larger than values betweenbreeding locations within a population (maximum 0.044;Table 2). Many of the microsatellite FST values amongbreeding locations within populations were, however,significantly different from zero (P < 0.05, Table 2). Incontrast to the microsatellite data, all but one of thepairwise FST values for mtDNA data were nonsignificant(Table 2). When breeding areas were pooled into theirrespective populations, however, significant divergencebetween South Island and subantarctic is evident for themtDNA control region (FST = 0.144, P < 0.001).
Table 1 Genetic variation at 12 microsatellite loci and 731 bp of the HVI mitochondrial control region in the yellow-eyed penguinpopulations South Island and subantarctic and each of the individual breeding areas
Location
Microsatellite data Mitochondrial DNA
N Lpoly A/locus Aunique HE HO N H h π
South Island 249 9 2.9 2 0.32 0.31 60 3 0.31 0.0012N. Otago 35 9 2.2 0 0.32 0.35 15 2 0.42 0.0017Otago P. 86 9 2.6 0 0.31 0.30 15 3 0.45 0.0016Catlins 38 9 2.6 1 0.31 0.30 15 2 0.34 0.0014Stewart I. 40 9 2.3 0 0.33 0.30 — — — —Codfish I. 50 9 2.3 0 0.31 0.31 15 1 0.00 0.0000
Subantarctic 101 12 4.3 18 0.46 0.44 40 6 0.69 0.0028Auckland I. 52 12 4.2 9 0.44 0.42 20 4 0.65 0.0025Campbell I. 49 12 3.3 1 0.45 0.45 20 5 0.66 0.0028
N, samples, size; Lpoly, number of polymorphic loci; A/locus, mean number of alleles per locus; Aunique, number of unique alleles; HE, expected heterozygosity; HO, observed heterozygosity; H, number of haplotypes; h, haplotype diversity; π, nucleotide diversity. Mitochondrial data were not available for the Stewart Island samples.
2396 S . B O E S S E N K O O L E T A L .
© 2009 Blackwell Publishing Ltd
Detection of migrants
The analyses for detection of first-generation migrants inGeneClass identified only one individual as a migrant
(P < 0.001). This penguin was sampled as an adult in theCatlins breeding area. For all other individuals we were notable to reject the null hypothesis that they were born in thearea where they were sampled.
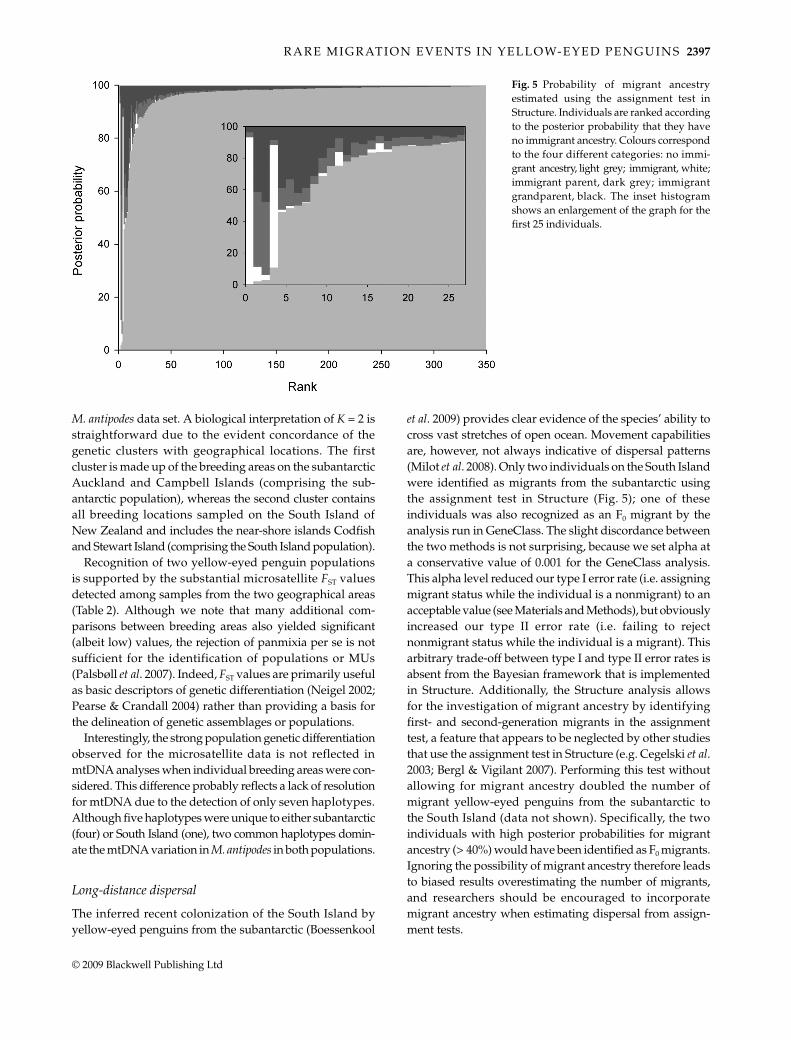
To visualize the results of the assignment test in Structure,we ranked all individuals according to the posterior prob-ability that they have no immigrant ancestry (Fig. 5). Twoindividuals, both from the Catlins breeding area, wereidentified as potential migrants from the subantarctic. Oneof these individuals is the same individual identified as afirst-generation migrant by GeneClass. In addition, twopenguins from Otago Peninsula had moderate posteriorprobabilities of having migrant ancestry (PP > 40% forhaving immigrant parents and grandparents), and a furtherfive penguins from South Island breeding sites showedsignatures of being second-generation migrants (PP > 30%for having immigrant grandparents). In total, only 13individuals had a PPnonimmigrant < 0.80, and of these only twowere subantarctic birds. Increasing the migration prior (v)to 0.1 resulted in similar patterns, and we therefore onlypresent the results for v = 0.05.
Discussion
Contrary to our hypothesis that yellow-eyed penguinscomprise one single population — based on known dispersalcapabilities and inferred recent colonization history — ourgenetic analyses clearly indicate that Megadyptes antipodescomprises two broadly distinct genetic assemblages (SouthIsland vs. subantarctic). Furthermore, ongoing levels ofmigration between these two assemblages are sufficientlylow to ensure demographic independence, and thereforewarrant their designation as two distinct MUs.
Population genetic structure in yellow-eyed penguins
Although the inference of the correct number of populationsis potentially problematic (Pritchard et al. 2000; Evannoet al. 2005; Pritchard et al. 2007), our genetic clusteringanalyses revealed surprisingly strong evidence for thepresence of two distinct genetic clusters (K = 2) in our
Table 2 Pairwise FST values among yellow-eyed penguin breeding areas for 12 microsatellite loci (above diagonal) and 731 bp of the HVImitochondrial control region (below diagonal). Mitochondrial data were not available for the Stewart Island samples. Bold values indicatevalues that are significantly different from zero
Location N. Otago Otago P. Catlins Stewart I. Codfish I. Auckland I. Campbell I.
N. Otago 0.005 0.021 0.038 0.010 0.110 0.138Otago P. –0.060 0.006 0.031 0.007 0.120 0.146
Catlins –0.058 –0.059 0.024 0.016 0.088 0.111
Stewart I. — — — 0.026 0.085 0.118
Codfish I. 0.214 0.161 0.143 — 0.098 0.132
Auckland I. 0.120 0.143 0.191 — 0.463 0.044
Campbell I. 0.024 0.016 0.044 — 0.228 0.102
North Otago
Catlins
Codfish Island
Auckland Islands
Campbell Islands
Otago PeninsulaA(1)
G(2)F(4)
E(23)
D(1)
C(67)
B(2)
Fig. 4 Haplotype network of yellow-eyed penguin control regionhaplotypes. Circle size corresponds to the number of samplespossessing each haplotype. White dots represent hypotheticalintermediate haplotypes not detected in the current study. LettersA–G represent haplotype names followed by the total numberof samples possessing each haplotype in brackets. All haplotypesequences have been deposited in GenBank (accession nosFJ822137–FJ822143).
R A R E M I G R AT I O N E V E N T S I N Y E L L O W- E Y E D P E N G U I N S 2397
© 2009 Blackwell Publishing Ltd
M. antipodes data set. A biological interpretation of K = 2 isstraightforward due to the evident concordance of thegenetic clusters with geographical locations. The firstcluster is made up of the breeding areas on the subantarcticAuckland and Campbell Islands (comprising the sub-antarctic population), whereas the second cluster containsall breeding locations sampled on the South Island ofNew Zealand and includes the near-shore islands Codfishand Stewart Island (comprising the South Island population).
Recognition of two yellow-eyed penguin populationsis supported by the substantial microsatellite FST valuesdetected among samples from the two geographical areas(Table 2). Although we note that many additional com-parisons between breeding areas also yielded significant(albeit low) values, the rejection of panmixia per se is notsufficient for the identification of populations or MUs(Palsbøll et al. 2007). Indeed, FST values are primarily usefulas basic descriptors of genetic differentiation (Neigel 2002;Pearse & Crandall 2004) rather than providing a basis forthe delineation of genetic assemblages or populations.
Interestingly, the strong population genetic differentiationobserved for the microsatellite data is not reflected inmtDNA analyses when individual breeding areas were con-sidered. This difference probably reflects a lack of resolutionfor mtDNA due to the detection of only seven haplotypes.Although five haplotypes were unique to either subantarctic(four) or South Island (one), two common haplotypes domin-ate the mtDNA variation in M. antipodes in both populations.
Long-distance dispersal
The inferred recent colonization of the South Island byyellow-eyed penguins from the subantarctic (Boessenkool
et al. 2009) provides clear evidence of the species’ ability tocross vast stretches of open ocean. Movement capabilitiesare, however, not always indicative of dispersal patterns(Milot et al. 2008). Only two individuals on the South Islandwere identified as migrants from the subantarctic usingthe assignment test in Structure (Fig. 5); one of theseindividuals was also recognized as an F0 migrant by theanalysis run in GeneClass. The slight discordance betweenthe two methods is not surprising, because we set alpha ata conservative value of 0.001 for the GeneClass analysis.This alpha level reduced our type I error rate (i.e. assigningmigrant status while the individual is a nonmigrant) to anacceptable value (see Materials and Methods), but obviouslyincreased our type II error rate (i.e. failing to rejectnonmigrant status while the individual is a migrant). Thisarbitrary trade-off between type I and type II error rates isabsent from the Bayesian framework that is implementedin Structure. Additionally, the Structure analysis allowsfor the investigation of migrant ancestry by identifyingfirst- and second-generation migrants in the assignmenttest, a feature that appears to be neglected by other studiesthat use the assignment test in Structure (e.g. Cegelski et al.2003; Bergl & Vigilant 2007). Performing this test withoutallowing for migrant ancestry doubled the number ofmigrant yellow-eyed penguins from the subantarctic tothe South Island (data not shown). Specifically, the twoindividuals with high posterior probabilities for migrantancestry (> 40%) would have been identified as F0 migrants.Ignoring the possibility of migrant ancestry therefore leadsto biased results overestimating the number of migrants,and researchers should be encouraged to incorporatemigrant ancestry when estimating dispersal from assign-ment tests.
Fig. 5 Probability of migrant ancestryestimated using the assignment test inStructure. Individuals are ranked accordingto the posterior probability that they haveno immigrant ancestry. Colours correspondto the four different categories: no immi-grant ancestry, light grey; immigrant, white;immigrant parent, dark grey; immigrantgrandparent, black. The inset histogramshows an enlargement of the graph for thefirst 25 individuals.
2398 S . B O E S S E N K O O L E T A L .
© 2009 Blackwell Publishing Ltd
The strong genetic differentiation and low levels of geneflow observed in yellow-eyed penguins contrast with thosefound using microsatellite data in other penguin species.Adelie (Pygoscelis adeliae), Humboldt (Spheniscus humboldti)and blue penguins (Eudyptula minor) all show weak geneticheterogeneity and relatively high gene flow over largegeographical areas (Roeder et al. 2001; Overeem et al. 2008;Schlosser et al. 2009). The surveyed populations of thesespecies are, however, not separated by hundreds of kilome-tres of open ocean, and instead include populations alonglong stretches of coast lines.
Our data reveal that the large stretch of ocean separatingthe South Island from the subantarctic islands is a naturalbarrier that limits gene flow for yellow-eyed penguins. Thewater masses between the South Island and the subantarcticislands are separated by the subtropical convergence,one of three major oceanic fronts in the Southwest Pacific(Heath 1985). This convergence separates subtropical andsubantarctic waters and is a well-known biogeographicaland ecological boundary for marine taxa (Mackintosh1960; Jouventin et al. 2006; de Dinechin et al. 2009). Thecurrent study shows that this boundary also apparentlyaffects dispersal in yellow-eyed penguins, impedingsubantarctic-South Island gene flow.
The higher number of individuals with migrant ancestryon the South Island (11 individuals) compared to thesubantarctic (two individuals) suggest that directionalmigration from south to north is more prevalent than viceversa. This result, however, might be confounded by thedifference in level of genetic variation between the twopopulations. The subantarctic population has 18 uniquealleles compared to only two in the South Island, andmigrants carrying these unique alleles should be easier toidentify genetically compared to migrants possessingshared alleles. Whether directional migration from south tonorth is more common than from north to south thereforeremains uncertain.
Range expansion
Range expansion has been suggested as one of the factorsreducing genetic structure in seabird populations (Friesenet al. 2007). The genetic effects of range expansion are,however, not straightforward and depend strongly on themode of expansion. Specifically, if range expansion isachieved by a relatively small number of individuals,founder effects can lead to a major reduction in geneticdiversity in the newly founded population and stronggenetic differentiation between source and foundingpopulation (Nei et al. 1975; Chakraborty & Nei 1977; Tarret al. 1998; Pruett & Winker 2005; Fabbri et al. 2007).Random genetic drift will further enhance these processesif the newly founded population has a slow growth rate.The low genetic variation in the South Island yellow-eyed
penguin population compared to the subantarctic popu-lation, together with the strong genetic differentiationbetween these two populations, suggests that the SouthIsland yellow-eyed penguin population has been subject tosuch founder effects, and that this population was foundedby only a small number of individuals. The low level ofgene flow between the subantarctic and the South Islandhas subsequently been insufficient to homogenize thegenetic structure generated by the founder event.
M. antipodes’ inferred recent range expansion acrossthe major ecological and biogeographical boundary of thesubtropical convergence is remarkable. By contrast, inrockhopper penguins, Eudyptes chrysocome sensu lato, rangeexpansion to Amsterdam and Saint Paul Islands in theIndian Ocean appears to have occurred from southernAtlantic populations that lie in the same watermass (i.e. northof the subtropical convergence), rather than from nearbyCrozet and Kerguelen, which lie across the subtropicalconvergence (de Dinechin et al. 2009). Ocean convergencescould therefore be considered driving forces for vicariantspeciation in southern ocean taxa, including penguins(Mackintosh 1960; de Dinechin et al. 2009). The recognitionof two Megadyptes species — with one species now extinct— (Boessenkool et al. 2009) on either side of the subtropicalconvergence supports this speciation hypothesis. Whetherthe current levels of gene flow between the two populationsof M. antipodes are sufficiently high to prevent speciation inthe long term remains a question in the realm of speculation.
Identification of management units and conservation implications
The recognition of two management units in yellow-eyedpenguins is warranted based on the two distinct geneticclusters and the identification of low numbers of migrants.Although we did not test the actual migration rate per se,we identified only two migrants out of 124 adult penguinssampled on the South Island, which approximates aconservative immigration rate in to the South Islandpopulation of 1.6%. If we apply the guideline that demo-graphic independence occurs when migration rates dropbelow 10% (Hastings 1993; Palsbøll et al. 2007), it is evidentthat the migration rate between the subantarctic andSouth Island populations is sufficiently low to achievedemographic independence of each of these populations.Consequently, yellow-eyed penguins can no longer beregarded as one large, panmictic population. This findinghas important implications for the conservation of thisendangered species. Monitoring efforts have been intenseon the South Island and full nest counts are made yearly inmost areas (McKinlay 2001). As a result, a reliable populationestimate exists and changes in population size are detectedrapidly. The demographic independence of the SouthIsland population means, however, that the dynamics that
R A R E M I G R AT I O N E V E N T S I N Y E L L O W- E Y E D P E N G U I N S 2399
© 2009 Blackwell Publishing Ltd
are observed in the South Island may not reflect thedynamics in the subantarctic, and thus separate monitoringof this area is required. At the very least, a count of breedingyellow-eyed penguins on the subantarctic will have to beconducted, because data from this area are either incompleteor out of date (particularly on the Auckland Islands; Moore1992; Moore et al. 2001).
Yellow-eyed penguins on the South Island have sufferedseveral severe population crashes during the last decadesthat were attributed to food shortages or disease (Marchant& Higgins 1990; Gill & Darby 1993). Predation by re-colonizing sea lions (Phocarctos hookeri) on the South Islandand disturbance due to tourism are further, more recentlyidentified threats that are likely to worsen in the comingyears (Ellenberg et al. 2007; Lalas et al. 2007). Demographicindependence and the low immigration from the subant-arctic, mean that the South Island population has lowerresilience to these threats than previously assumed.Although the species has expanded its range from thesubantarctic to the South Island before, significant changesoccurred to the habitat on the South Island since Europeansettlement over the last 200 years (e.g. introduction of adiversity of predatory mammals) and it cannot be assumedthat such a range expansion would happen again. On amore positive note, the low gene flow from the SouthIsland to the subantarctic makes it unlikely that diseasesprevalent in the South Island population are transferred tothe south. In fact, having two demographically independentpopulations prevents having ‘all (penguin) eggs in onebasket’ and may protect the yellow-eyed penguin fromextinction due to local, stochastic catastrophic events.
Acknowledgements
We are grateful to Jon Potter, Matt Charteris, Annabel Gosset, LouiseChilvers, Kath Walker and Graeme Elliott for sample collection onthe subantarctic islands. We are also indebted to Sheryl Pullar,Sandy King, Rosalie Goldsworthy, Thomas Mattern, UrsulaEllenberg, Tiffany Brown, Andrew Hill and numerous field assist-ants for help with collecting samples around the South Island.Samples collected on Otago Peninsula during 2001 were kindlyprovided by Lloyd Davis. We would like to thank Tania King forher guidance and advice in the laboratory. Thanks also to ThomasMattern and John Darby for providing information and ideas onyellow-eyed penguin dispersal. This research was supported bythe Department of Zoology, University of Otago, including PBRFResearch Enhancement grants to J.M.W. and P.J.S. Sample collectionwas supported by the Yellow-Eyed Penguin Trust and the Depart-ment of Conservation. Samples were collected under Departmentof Conservation permits SO-17933-FAU and OT-19097-RES andUniversity of Otago Animal Ethics Approval 69/06.
References
Belkhir K, Borsa P, Chikhi L, Raufaste N, Bonhomme F (1996–2004)Genetix 4.05, logiciel sous Windows TM pour la génétique des
populations. Laboratoire Génome, Populations, Interactions,Université de Montpellier II, Montpellier, France.
Bergl RA, Vigilant L (2007) Genetic analysis reveals populationstructure and recent migration within the highly fragmentedrange of the Cross River gorilla (Gorilla gorilla diehli). MolecularEcology, 16, 501–516.
Berry O, Tocher MD, Sarre SD (2004) Can assignment tests measuredispersal? Molecular Ecology, 13, 551–561.
Birdlife International (2008) Species factsheet: Megadyptesantipodes. In: 2007 IUCN Red List of Threatened Species (ed. IUCN2007). Available from URL: http://www.iucnredlist.org
Boessenkool S, King TM, Seddon PJ, Waters JM (2008) Isolationand characterization of microsatellite loci from the yellow-eyedpenguin (Megadyptes antipodes). Molecular Ecology Resources, 8,1043–1045.
Boessenkool S, Austin JJ, Worthy TH et al. (2009) Relict or colonizer?Extinction and range expansion of penguins in southern NewZealand. Proceedings of the Royal Society B: Biological Sciences,276, 815–821.
Cassens I, Van Waerebeek K, Best PB et al. (2005) Evidence for maledispersal along the coasts but no migration in pelagic waters indusky dolphins (Lagenorhynchus obscurus). Molecular Ecology, 14,107–121.
Cegelski CC, Waits LP, Anderson NJ (2003) Assessing populationstructure and gene flow in Montana wolverines (Gulo gulo) usingassignment-based approaches. Molecular Ecology, 12, 2907–2918.
Chakraborty R, Nei M (1977) Bottleneck effects on average heter-ozygosity and genetic distance with the stepwise mutationmodel. Evolution, 31, 347–356.
Clement M, Posada D, Crandall KA (2000) tcs: a computer programto estimate gene genealogies. Molecular Ecology, 9, 1657–1659.
Darby JT, Seddon PJ (1990) Breeding biology of the yellow-eyedpenguin (Megadyptes antipodes). In: Penguin Biology (eds DavisLS, Darby JT), pp. 45–62. Academic Press Inc, San Diego, California.
de Dinechin M, Ottvall R, Quillfeldt P, Jouventin P (2009) Speciationchronology of rockhopper penguins inferred from molecular,geological and palaeoceanographic data. Journal of Biogeography,36, 693–702.
Ellenberg U, Setiawan AN, Cree A, Houston DM, Seddon PJ (2007)Elevated hormonal stress response and reduced reproductiveoutput in yellow-eyed penguins exposed to unregulated tourism.General and Comparative Endocrinology, 152, 54–63.
Evanno G, Regnaut S, Goudet J (2005) Detecting the number ofclusters of individuals using the software Structure: a simulationstudy. Molecular Ecology, 14, 2611–2620.
Excoffier L, Laval G, Schneider S (2005) Arlequin version 3.0: anintegrated software package for population genetics dataanalysis. Evolutionary Bioinformatics Online, 1, 47–50.
Fabbri E, Miquel C, Lucchini V et al. (2007) From the Apennines tothe Alps: colonization genetics of the naturally expanding Italianwolf (Canis lupus) population. Molecular Ecology, 16, 1661–1671.
Falush D, Stephens M, Pritchard JK (2003) Inference of populationstructure using multilocus genotype data: Linked loci andcorrelated allele frequencies. Genetics, 164, 1567–1587.
Friesen VL, Burg TM, McCoy KD (2007) Mechanisms of populationdifferentiation in seabirds. Molecular Ecology, 16, 1765–1785.
Gill JM, Darby JT (1993) Deaths in yellow-eyed penguins(Megadyptes antipodes) on the Otago Peninsula during thesummer of 1990. New Zealand Veterinary Journal, 41, 39–42.
Hastings A (1993) Complex interactions between dispersal anddynamics — lessons from coupled logistic equations. Ecology, 74,1362–1372.
2400 S . B O E S S E N K O O L E T A L .
© 2009 Blackwell Publishing Ltd
Heath RA (1985) A review of the physical oceanography of theseas around New Zealand–1982. New Zealand Journal of Marineand Freshwater Research, 19, 79–124.
Jouventin P, Cuthbert RJ, Ottvall R (2006) Genetic isolation anddivergence in sexual traits: evidence for the northern rockhopperpenguin Eudyptes moseleyi being a sibling species. MolecularEcology, 15, 3413–3423.
Lalas C, Ratz H, McEwan K, McConkey SD (2007) Predation byNew Zealand sea lions (Phocarctos hookeri) as a threat to theviability of yellow-eyed penguins (Megadyptes antipodes) at OtagoPeninsula, New Zealand. Biological Conservation, 135, 235–246.
Mackintosh NA (1960) The pattern of distribution of the antarcticfauna. Proceedings of the Royal Society B: Biological Sciences, 152,624–631.
Manel S, Gaggiotti OE, Waples RS (2005) Assignment methods:matching biological questions with appropriate techniques.Trends in Ecology & Evolution, 20, 136–142.
Marchant S, Higgins PJ (1990) Handbook of Australian, New Zealandand Antarctic Birds. Oxford University Press, Melbourne, Australia.
McKinlay B (2001) Hoiho (Megadyptes Antipodes) Recovery Plan 2000–2025. Department of Conservation, Wellington, New Zealand.
Milot E, Weimerskirch H, Bernatchez L (2008) The seabird paradox:dispersal, genetic structure and population dynamics in ahighly mobile, but philopatric albatross species. MolecularEcology, 17, 1658–1673.
Moore PJ (1992) Population estimates of yellow-eyed penguin(Megadyptes antipodes) on Campbell and Auckland Islands 1987–90. Notornis, 39, 1–15.
Moore PJ, Fletcher D, Amey J (2001) Population estimates ofyellow-eyed penguins, Megadyptes antipodes, on CampbellIsland, 1987–98. Emu, 101, 225–236.
Nei M, Maruyama T, Chakraborty R (1975) The bottleneck effectand genetic variability in populations. Evolution, 29, 1–10.
Neigel JE (2002) Is FST obsolete? Conservation Genetics, 3, 167–173.Overeem RL, Peucker AJ, Austin CM, Dann P, Burridge CP (2008)
Contrasting genetic structuring between colonies of theWorld’s smallest penguin, Eudyptula minor (Aves: Spheniscidae).Conservation Genetics, 9, 893–905.
Paetkau D, Slade R, Burden M, Estoup A (2004) Genetic assignmentmethods for the direct, real-time estimation of migration rate: asimulation-based exploration of accuracy and power. MolecularEcology, 13, 55–65.
Palsbøll PJ, Berube M, Allendorf FW (2007) Identification ofmanagement units using population genetic data. Trends inEcology & Evolution, 22, 11–16.
Pearse DE, Crandall KA (2004) Beyond FST: analysis of populationgenetic data for conservation. Conservation Genetics, 5, 585–602.
Piry S, Alapetite A, Cornuet JM et al. (2004) GeneClass2: a softwarefor genetic assignment and first-generation migrant detection.Journal of Heredity, 95, 536–539.
Pritchard JK, Stephens M, Donnelly P (2000) Inference of populationstructure using multilocus genotype data. Genetics, 155, 945–959.
Pritchard JK, Wen X, Falush D (2007) Documentation for StructureSoftware. Version 2.2. Department of Human Genetics, Universityof Chicago, Chicago, Illinois.
Pruett CL, Winker K (2005) Northwestern song sparrow popula-tions show genetic effects of sequential colonization. MolecularEcology, 14, 1421–1434.
Rannala B, Mountain JL (1997) Detecting immigration by usingmultilocus genotypes. Proceedings of the National Academy ofSciences, USA, 94, 9197–9201.
Ratz H, Darby JT, Edge KA, Thompson C (2004) Survival and
breeding of yellow-eyed penguins (Megadyptes antipodes), at twolocations on Otago Peninsula, South Island, New Zealand,1991–96. New Zealand Journal of Zoology, 31, 133–147.
Rice WR (1989) Analyzing tables of statistical tests. Evolution, 43,223–225.
Richdale LE (1957) A Population Study of Penguins. ClarendonPress, Oxford, UK.
Roeder AD, Marshall RK, Mitchelson AJ et al. (2001) Gene flow onthe ice: genetic differentiation among Adelie penguin coloniesaround Antarctica. Molecular Ecology, 10, 1645–1656.
Rousset F (2008) GenePop ‘007: a complete re-implementationof the GenePop software for Windows and Linux. MolecularEcology Resources, 8, 103–106.
Rozas J, Sanchez-De I, Barrio JC, Messeguer X, Rozas R (2003)DnaSP, DNA polymorphism analyses by the coalescent andother methods. Bioinformatics, 19, 2496–2497.
Schlosser JA, Dubach JM, Garner TWJ et al. (2009) Evidence for geneflow differs from observed dispersal patterns in the Humboldtpenguin, Spheniscus humboldti. Conservation Genetics, in press.
Seddon PJ, Davis LS (1989) Nest-site selection by yellow-eyedpenguins. Condor, 91, 653–659.
Seutin G, White BN, Boag PT (1991) Preservation of avian bloodand tissue samples for DNA analyses. Canadian Journal of Zoology,69, 82–90.
Tarr CL, Conant S, Fleischer RC (1998) Founder events and variationat microsatellite loci in an insular passerine bird, the Laysan finch(Telespiza cantans). Molecular Ecology, 7, 719–731.
Triggs S, Darby JT (1989) Genetics and conservation of yellow-eyedpenguin: an interim report. Science and Research Directorate.Department of Conservation, Wellington, New Zealand.
Walsh PS, Metzger DA, Higuchi R (1991) Chelex-100 as a mediumfor simple extraction of DNA for PCR-based typing from forensicmaterial. BioTechniques, 10, 506–513.
Waples RS, Gaggiotti O (2006) What is a population? An empiricalevaluation of some genetic methods for identifying the numberof gene pools and their degree of connectivity. Molecular Ecology,15, 1419–1439.
Weir BS, Cockerham CC (1984) Estimating F-statistics for theanalysis of population structure. Evolution, 38, 1358–1370.
This research is part of Sanne Boessenkooi’s PhD dissertation, inwhich she investigates spatial and temporal genetic structuring ofMegodyptes antipodes. She is interested in applying genetic tools tostudy the causes that lead to population decline and the processesthat affect the dynamics of populations through time. BastiaanStar is a postdoctoral fellow at the Centre for Ecological andEvolutionary Synthesis, University of Oslo. He is working with avariety of tools, including population modeling, population genetictheory and population genetics/genomics to problems in marineecology. Jonathan Waters is an Associate Professor of Zoology atthe University of Otago. His research focuses on the phylogeographyand evolution of Southern Hemisphere marine and freshwaterbiota. Current projects are centered on the use of freshwatervicariant events to calibrate molecular clocks, and the importanceof macroalgae as facilitators for oceanic rafting. Philip Seddon isan Associate Professor of Zoology at the University of Otago andDirector of the Postgraduate Wildlife Management Programme.His research interests relate to the conservation management andrestoration of threatened native species and the spatial ecology ofintroduced pest species.
Copyright © 2022 FDOKUMEN