DNA Barcodes Combined with Multilocus Data of ...
14
Syst. Biol. 71(2):382–395, 2022 © The Author(s)2021. Published by Oxford University Press on behalf of the Society of Systematic Biologists. This is an Open Access article distributed under the terms of the Creative Commons Attribution License (http://creativecommons.org/licenses/by/4.0/), which permits unrestricted reuse, distribution, and reproduction in any medium, provided the original work is properly cited. DOI:10.1093/sysbio/syab038 Advance Access publication May 22, 2021 DNA Barcodes Combined with Multilocus Data of Representative Taxa Can Generate Reliable Higher-Level Phylogenies GERARD TALAVERA 1,2,∗ ,VLADIMIR LUKHTANOV 3 ,NAOMI E. PIERCE 2 , AND ROGER VILA 4 1 Institut Botànic de Barcelona (IBB, CSIC-Ajuntament de Barcelona), Passeig del Migdia s/n, 08038 Barcelona, Catalonia, Spain; 2 Department of Organismic and Evolutionary Biology and Museum of Comparative Zoology, Harvard University, 26 Oxford Street, Cambridge, MA 02138, USA; 3 Department of Karyosystematics, Zoological Institute of Russian Academy of Sciences, Universitetskaya nab. 1, 199034 St. Petersburg, Russia; 4 Institut de Biologia Evolutiva (CSIC-UPF), Passeig Marítim de la Barceloneta, 08003 Barcelona, Catalonia, Spain; ∗ Correspondence to be sent to: Institut Botànic de Barcelona (IBB, CSIC-Ajuntament de Barcelona), Passeig del Migdia s/n, 08038 Barcelona, Catalonia, Spain; E-mail: [email protected]. Received 30 July 2019; reviews returned 13 May 2021; accepted 25 May 2021 Associate Editor: Jason Bond Abstract.—Taxa are frequently labeled incertae sedis when their placement is debated at ranks above the species level, such as their subgeneric, generic, or subtribal placement. This is a pervasive problem in groups with complex systematics due to difficulties in identifying suitable synapomorphies. In this study, we propose combining DNA barcodes with a multilocus backbone phylogeny in order to assign taxa to genus or other higher-level categories. This sampling strategy generates molecular matrices containing large amounts of missing data that are not distributed randomly: barcodes are sampled for all representatives, and additional markers are sampled only for a small percentage. We investigate the effects of the degree and randomness of missing data on phylogenetic accuracy using simulations for up to 100 markers in 1000-tips trees, as well as a real case: the subtribe Polyommatina (Lepidoptera: Lycaenidae), a large group including numerous species with unresolved taxonomy. Our simulation tests show that when a strategic and representative selection of species for higher-level categories has been made for multigene sequencing (approximately one per simulated genus), the addition of this multigene backbone DNA data for as few as 5–10% of the specimens in the total data set can produce high-quality phylogenies, comparable to those resulting from 100% multigene sampling. In contrast, trees based exclusively on barcodes performed poorly. This approach was applied to a 1365-specimen data set of Polyommatina (including ca. 80% of described species), with nearly 8% of representative species included in the multigene backbone and the remaining 92% included only by mitochondrial COI barcodes, a phylogeny was generated that highlighted potential misplacements, unrecognized major clades, and placement for incertae sedis taxa. We use this information to make systematic rearrangements within Polyommatina, and to describe two new genera. Finally, we propose a systematic workflow to assess higher-level taxonomy in hyperdiverse groups. This research identifies an additional, enhanced value of DNA barcodes for improvements in higher-level systematics using large data sets. [Birabiro; DNA barcoding; incertae sedis; Kipepeo; Lycaenidae; missing data; phylogenomic; phylogeny; Polyommatina; supermatrix; systematics; taxonomy] The impact of missing data in modern phylogenetics is highly debated. It is well accepted that phylogenetic accuracy improves with a greater sampling of taxa and more informative characters. In practice, possible detrimental effects of imbalanced sampling for phylogenetic inference are often circumvented by excluding taxa and/or genes when the former have problematic placements or the latter have been poorly sampled. However, increasing evidence suggests that inclusion of incomplete taxa (that have not been sequenced for all markers) or incomplete markers (that have not been sequenced for all taxa) may increase phylogenetic accuracy, or at worst be inconsequential provided that a sufficient number of informative characters are sampled overall (Wiens 2003; Philippe et al. 2004; Wiens 2006; de Queiroz and Gatesy 2007; Wiens and Morrill 2011; Wiens and Tiu 2012; Roure et al. 2013; Grievink et al. 2013; Jiang et al. 2014). According to this view, complete matrices are not essential for optimal phylogenetic performance, and incomplete taxa can still be placed correctly. Nevertheless, this approach is not without controversy (Lemmon et al. 2009; but see Wiens and Morrill 2011; Simmons 2012a, 2012b). Given that comprehensive data sets in terms of both taxa and characters are hard to obtain, especially for hyperdiverse taxon groups, two strategies are commonly used to explore biodiversity: 1) sampling multiple loci (in the hundreds in the case of phylogenomics) for representatives of higher-level taxonomic categories (the “phylogenetic/-omic approach”), which explores deeper relationships but potentially misses recent diversification; or 2) sampling only one or two loci, such as the mitochondrial COI DNA barcode, for as many taxa as possible, and trying to cover the entire group’s biodiversity at the possible expense of accurate inference of deep relationships (the “barcoding approach”). These approaches are analogous to the “bottom up” (many characters, few taxa) and “top down” (many taxa, few characters) analyses described by Wiens (2005). Option 1) should facilitate resolving higher-level relationships. However, while phylogenetic accuracy is improved by the addition of informative characters, this approach can sometimes create model violations if it fails to detect multiple substitutions due to long branches (Poe 2003; Wiens 2005). In addition, other potential issues such as gene tree discordance and “the anomaly zone” may also challenge phylogenetic accuracy (Jeffroy et al. 2006; Degnan and Rosenberg 2006; Galtier and Daubin 2008; Mendes and Hahn 2018). Option 2) has the benefit of breaking long branches and thus improves the detection 382 Downloaded from https://academic.oup.com/sysbio/article/71/2/382/6281234 by guest on 13 July 2022
-
Upload
khangminh22 -
Category
Documents
-
view
1 -
download
0
Transcript of DNA Barcodes Combined with Multilocus Data of ...

Copyedited by: YS MANUSCRIPT CATEGORY: Systematic Biology
[10:34 22/1/2022 Sysbio-OP-SYSB210038.tex] Page: 382 382–395
Syst. Biol. 71(2):382–395, 2022© The Author(s) 2021. Published by Oxford University Press on behalf of the Society of Systematic Biologists.This is an Open Access article distributed under the terms of the Creative Commons Attribution License (http://creativecommons.org/licenses/by/4.0/),which permits unrestricted reuse, distribution, and reproduction in any medium, provided the original work is properly cited.DOI:10.1093/sysbio/syab038Advance Access publication May 22, 2021
DNA Barcodes Combined with Multilocus Data of Representative Taxa Can GenerateReliable Higher-Level Phylogenies
GERARD TALAVERA1,2,∗, VLADIMIR LUKHTANOV3, NAOMI E. PIERCE2, AND ROGER VILA4
1Institut Botànic de Barcelona (IBB, CSIC-Ajuntament de Barcelona), Passeig del Migdia s/n, 08038 Barcelona, Catalonia, Spain; 2Department ofOrganismic and Evolutionary Biology and Museum of Comparative Zoology, Harvard University, 26 Oxford Street, Cambridge, MA 02138, USA;
3Department of Karyosystematics, Zoological Institute of Russian Academy of Sciences, Universitetskaya nab. 1, 199034 St. Petersburg, Russia; 4Institut deBiologia Evolutiva (CSIC-UPF), Passeig Marítim de la Barceloneta, 08003 Barcelona, Catalonia, Spain;
∗Correspondence to be sent to: Institut Botànic de Barcelona (IBB, CSIC-Ajuntament de Barcelona), Passeig del Migdia s/n,08038 Barcelona, Catalonia, Spain;
E-mail: [email protected].
Received 30 July 2019; reviews returned 13 May 2021; accepted 25 May 2021Associate Editor: Jason Bond
Abstract.—Taxa are frequently labeled incertae sedis when their placement is debated at ranks above the species level, suchas their subgeneric, generic, or subtribal placement. This is a pervasive problem in groups with complex systematics due todifficulties in identifying suitable synapomorphies. In this study, we propose combining DNA barcodes with a multilocusbackbone phylogeny in order to assign taxa to genus or other higher-level categories. This sampling strategy generatesmolecular matrices containing large amounts of missing data that are not distributed randomly: barcodes are sampledfor all representatives, and additional markers are sampled only for a small percentage. We investigate the effects of thedegree and randomness of missing data on phylogenetic accuracy using simulations for up to 100 markers in 1000-tips trees,as well as a real case: the subtribe Polyommatina (Lepidoptera: Lycaenidae), a large group including numerous specieswith unresolved taxonomy. Our simulation tests show that when a strategic and representative selection of species forhigher-level categories has been made for multigene sequencing (approximately one per simulated genus), the additionof this multigene backbone DNA data for as few as 5–10% of the specimens in the total data set can produce high-qualityphylogenies, comparable to those resulting from 100% multigene sampling. In contrast, trees based exclusively on barcodesperformed poorly. This approach was applied to a 1365-specimen data set of Polyommatina (including ca. 80% of describedspecies), with nearly 8% of representative species included in the multigene backbone and the remaining 92% includedonly by mitochondrial COI barcodes, a phylogeny was generated that highlighted potential misplacements, unrecognizedmajor clades, and placement for incertae sedis taxa. We use this information to make systematic rearrangements withinPolyommatina, and to describe two new genera. Finally, we propose a systematic workflow to assess higher-level taxonomyin hyperdiverse groups. This research identifies an additional, enhanced value of DNA barcodes for improvements inhigher-level systematics using large data sets. [Birabiro; DNA barcoding; incertae sedis; Kipepeo; Lycaenidae; missing data;phylogenomic; phylogeny; Polyommatina; supermatrix; systematics; taxonomy]
The impact of missing data in modern phylogeneticsis highly debated. It is well accepted that phylogeneticaccuracy improves with a greater sampling of taxa andmore informative characters. In practice, possibledetrimental effects of imbalanced sampling forphylogenetic inference are often circumvented byexcluding taxa and/or genes when the former haveproblematic placements or the latter have been poorlysampled. However, increasing evidence suggests thatinclusion of incomplete taxa (that have not beensequenced for all markers) or incomplete markers (thathave not been sequenced for all taxa) may increasephylogenetic accuracy, or at worst be inconsequentialprovided that a sufficient number of informativecharacters are sampled overall (Wiens 2003; Philippeet al. 2004; Wiens 2006; de Queiroz and Gatesy 2007;Wiens and Morrill 2011; Wiens and Tiu 2012; Roure et al.2013; Grievink et al. 2013; Jiang et al. 2014). Accordingto this view, complete matrices are not essential foroptimal phylogenetic performance, and incomplete taxacan still be placed correctly. Nevertheless, this approachis not without controversy (Lemmon et al. 2009; but seeWiens and Morrill 2011; Simmons 2012a, 2012b).
Given that comprehensive data sets in terms of bothtaxa and characters are hard to obtain, especially for
hyperdiverse taxon groups, two strategies are commonlyused to explore biodiversity: 1) sampling multiple loci(in the hundreds in the case of phylogenomics) forrepresentatives of higher-level taxonomic categories(the “phylogenetic/-omic approach”), which exploresdeeper relationships but potentially misses recentdiversification; or 2) sampling only one or two loci, suchas the mitochondrial COI DNA barcode, for as manytaxa as possible, and trying to cover the entire group’sbiodiversity at the possible expense of accurate inferenceof deep relationships (the “barcoding approach”). Theseapproaches are analogous to the “bottom up” (manycharacters, few taxa) and “top down” (many taxa, fewcharacters) analyses described by Wiens (2005). Option1) should facilitate resolving higher-level relationships.However, while phylogenetic accuracy is improved bythe addition of informative characters, this approach cansometimes create model violations if it fails to detectmultiple substitutions due to long branches (Poe 2003;Wiens 2005). In addition, other potential issues suchas gene tree discordance and “the anomaly zone” mayalso challenge phylogenetic accuracy (Jeffroy et al. 2006;Degnan and Rosenberg 2006; Galtier and Daubin 2008;Mendes and Hahn 2018). Option 2) has the benefit ofbreaking long branches and thus improves the detection
382
Dow
nloaded from https://academ
ic.oup.com/sysbio/article/71/2/382/6281234 by guest on 13 July 2022

Copyedited by: YS MANUSCRIPT CATEGORY: Systematic Biology
[10:34 22/1/2022 Sysbio-OP-SYSB210038.tex] Page: 383 382–395
2022 TALAVERA ET AL.—DNA BARCODES ON HIGHER-LEVEL PHYLOGENIES 383
FIGURE 1. Distribution of missing data in molecular matrices. a) A complete matrix, where no missing data are involved (referred as thebackbone data set). b) A single-gene matrix, including only one molecular marker and therefore providing information about only one genehistory (referred as the barcode data set). c) The combined matrix, the product of merging a backbone and a barcode data set, where one marker(DNA-barcode) is present for all specimens, but other markers are entirely sampled only for a reduced percentage of specimens that have beenselected by prioritizing representatives of higher-level taxonomic categories. d) A combined matrix, where the selection of fully sequencedspecimens, and therefore the distribution of missing data, is randomly sampled (usually as a result of merging data sets from various sources).
of multiple substitutions, but the smaller number ofinformative characters, as well as the linkage of thosecharacters in a single mitochondrial gene region, mayresult in weakly supported phylogenetic hypotheses(DeSalle et al. 2005). Moreover, the resulting single-genephylogenetic histories are likely to not reflect the speciestrees (Pamilo and Nei 1988; Maddison 1997; Nichols 2001;Degnan and Rosenberg 2006). The debate regarding thecosts and benefits of sampling more taxa on the one handor more characters on the other has a long history andis still unresolved (GrayBeal 1998; Rannala et al. 1998;Zwickl and Hillis 2002; Poe 2003; Rosenberg and Kumar2001; Wiens and Morrill 2011; Philippe et al. 2011; Wiensand Tiu 2012; Zheng and Wiens 2016).
In theory, sampling many loci for many taxa wouldbe the best solution, but this remains a costly optionfor many, often due to the difficulty of obtainingsamples with well-preserved DNA. In practice, mostphylogeneticists have to cope with the problem ofmissing data or imbalanced sets of sequences in theattempt to build large phylogenies by merging multipledata sets. The availability of public molecular dataincreases exponentially, but these data are remarkablyheterogeneous. Heterogeneity comes from the variedsampling strategies followed in different studies, fromuneven sequencing of various genetic markers and/orfrom sampling biases involving particular clades orgenes.
A number of studies have attempted to evaluate theperformance of patchy supermatrices in phylogenetics(Wiens et al. 2005; de Queiroz and Gatesy 2007; Choet al. 2011; Kawahara et al. 2011; Roure et al. 2013;Hovmöller et al. 2013; Streicher et al. 2015; Philippeet al. 2017). Patchy supermatrices may differ not onlyin their completeness but also in their randomness,a rarely assessed but possibly important parameter.Randomness in matrix patchiness can vary in bothdimensions: taxon or marker. Previous studies testedscenarios with maximum randomness: probabilities ofrepresentation are equal for all taxa and characters(i.e., all taxa may equally have 1,2,3… to the maximumnumber of markers). It is still unclear whether partialmatrices with guided missing data (those where onlya set of selected samples are fully represented by allgenes; see Fig. 1) can benefit phylogenetic accuracy.We here test the effects of missing data on partialmatrices where some taxa have a maximum numberof markers and some have only one and alwaysthe same one, the standard COI mitochondrial DNAbarcode. We also test the relevance of the selected taxahaving the maximum number of markers by using arandom strategy versus a taxonomically guided strategythat prioritizes having at least one representative perhigher-level clade (genus in this case). The motivatingquestion is to evaluate whether partial matrices can bestrategically designed by combining multiple genes for
Dow
nloaded from https://academ
ic.oup.com/sysbio/article/71/2/382/6281234 by guest on 13 July 2022

Copyedited by: YS MANUSCRIPT CATEGORY: Systematic Biology
[10:34 22/1/2022 Sysbio-OP-SYSB210038.tex] Page: 384 382–395
384 SYSTEMATIC BIOLOGY VOL. 71
relatively few representative taxa (the phylogenetic/-omic approach) to resolve higher-level relationships,with barcode data from many taxa mostly informingspecies-level or shallow relationships (the barcodingapproach).
We analyze different scenarios through simulationexperiments and use this approach to assess achallenging empirical data set, the Polyommatinabutterflies. The subtribe Polyommatina (Lycaenidae,Polyommatinae) is a species-rich group (ca. 480 species)that is the product of one or more radiations (Kandulet al. 2004; Wiemers et al. 2010; Vila et al. 2011;Talavera et al. 2013a; Talavera et al. 2015, Stradomsky2016). Butterflies in this group are morphologicallyhighly similar and their taxonomy has been unstable.Species diversity in the Polyommatina has beenclassified with 82 formally described generic namesin a wide array of taxonomic combinations. Priorto this work, we addressed a higher-level taxonomicrevision after reconstructing the first comprehensivemolecular phylogeny of the group, based on threemitochondrial genes plus six nuclear markers (Talaveraet al. 2013a). This data set included 109 specimensrepresenting nearly all genera and subgenera describedwithin the subtribe. The resulting phylogeny uncoveredseveral polyphyletic genera. We develop objectivecriteria for a systematic arrangement that could bestaccommodate pre-existing generic nomenclature to thenew phylogenetic framework, and, after applying aflexible temporal scheme, we delimited 32 genera.
The controversial taxonomy of this group mirrorsthe high evolutionary lability of most morphologicalcharacters. It’s possible that the group contains crypticdiversity, and that taxa not characterized geneticallyso far might be assigned to the wrong genus. Infact, a remarkable number of species in this grouphave been assigned to multiple genera by differentauthors. For example, the North American taxon acmonWestwood, [1851] (originally described as Lycaena acmon)has been placed in the genera Plebejus (Pelham 2008),Aricia (Bálint and Johnson 1997), and Icaricia (Layberryet al. 1998, Talavera et al. 2013a). The enigmatic andmorphologically distinct taxon avinovi Stshetkin 1980has been placed in the genera Polyommatus (Bálint andJohnson 1997), Rimisia (Zhdanki 2004; Eckweiler andBozano 2016) and Afarsia (Shapoval and Lukhtanov2016). This situation is not unique to the Polyommatinabut extends to many other insect groups where rareor morphologically similar taxa provide challengingtaxonomic assignments due to difficulties in findingdiagnostic synapomorphies.
In this study, we increase taxon sampling for thePolyommatina to 1360 specimens, comprising about 80%of putative species. We combine DNA barcodes withthe genus-level phylogenetic backbone in a supermatrixwhere specimens having only COI barcodes (658 bp)represent ca. 92% of the total matrix, and specimens withmultiple markers (6666 bp) represent ca. 8%. With thisapproach, we aim to screen the phylogenetic diversity ofthe group, assign species or subspecific taxa to genera,
identify unrecognized major clades and re-evaluate thephylogenetic history of the group with a nearly completetaxon sampling.
We also design a battery of simulations to evaluatephylogenetic accuracy for partial matrices, withparticular emphasis on testing whether strategicselections of fully sequenced representatives improveaccuracy over random selections. Our simulations testtwo scenarios: 1) a phylogenetic data set resemblingour empirical data and 2) a phylogenomic data set(sampling 100 genes per taxon) to test the possible effectof backbone-barcode imbalances in large-scale studies.We propose a systematic workflow to assess higher-leveltaxonomy in hyperdiverse groups. In so doing, we alsoreinforce the value of the COI DNA barcode in highersystematics when combined with a minimal, but awell-designed, multilocus framework.
MATERIALS AND METHODS
Empirical Molecular Data SetsWe gathered molecular data for as many taxa as
possible within the Polyommatina butterflies (genera,subgenera, species, and subspecies), sampling as manypopulations as possible within the distribution range ofeach taxon (Supplementary Table S1 available on Dryadat http://dx.doi.org/10.5061/dryad.m0cfxpp0d). Ourphylogenetic approach involved building two differentmolecular data sets. First, we took advantage ofa multilocus matrix assembled for an earlier study(Talavera et al. 2013a), that included a mitochondrialDNA fragment containing three gene regions, plus sixnuclear markers (6666 bp, hereafter referred to as thebackbone data set, Fig. 1a). This data set included 109specimens with at least one representative of each ofthe 82 formally described genera in Polyommatina (withthe exception of Xinjiangia Huang and Murayama 1988and Grumiana Zhdanki 2004). The markers included inthe backbone data set were mitochondrial cytochromeoxidase I (COI), leucine transfer RNA (leu-tRNA) andcytochrome oxidase II (COII), and nuclear elongationfactor-1 alpha (EF-1a), 28S ribosome unit (28S), histoneH3 (H3), wingless (wg)—carbamoyl-phosphate synthetase2/aspartate transcarbamylase/dihydroorotase (CAD) andinternal transcribed spacer 2 (ITS2).
A second data set (hereafter referred to as the barcodedata set, Fig. 1b) was generated by assembling asingle-gene matrix (658 bp) for the universal barcodefragment of mitochondrial COI. This data set exemplifiesa molecular matrix with a one-gene phylogenetichistory, often involving a limited number of informativecharacters. A total of 1365 barcodes were retrievedfrom multiple sources: 109 from the backbone dataset, 1100 from the public repositories GenBank andBOLD, and 156 from specimens collected in the fieldor obtained from collections and sequenced specificallyfor this research. New collection efforts specificallytargeted taxa and populations that are difficult to
Dow
nloaded from https://academ
ic.oup.com/sysbio/article/71/2/382/6281234 by guest on 13 July 2022

Copyedited by: YS MANUSCRIPT CATEGORY: Systematic Biology
[10:34 22/1/2022 Sysbio-OP-SYSB210038.tex] Page: 385 382–395
2022 TALAVERA ET AL.—DNA BARCODES ON HIGHER-LEVEL PHYLOGENIES 385
obtain and/or are not sampled in previous studies(collection data in Supplementary Table S1 available onDryad). The barcode data set included representativesof approximately 80% of the roughly 480 species ofPolyommatina currently recognized (Bálint and Johnson1997; Talavera et al. 2013a). Both backbone and barcodedata sets included as outgroup taxa four representativesfor the sister subtribe Everina and one for Leptotinabased on Talavera et al. (2013a). All specimens used inthis study are listed in Supplementary Table S1 availableon Dryad.
Based on unexpected taxonomic placements ordivergences observed from preliminary phylogeneticinspections of the barcode data set, we increasedsequencing coverage by sequencing multiple markersfor four additional taxa (Chilades kedonga, Chiladeselicola, Kretania psyorita, and Neolysandra corona)(Supplementary Table S1 available on Dryad), thusincreasing the backbone data set to 113 specimens.
A matrix merging barcode and backbone data sets(hereafter referred to as the “combined” data set) wasalso built for downstream analyses. This consisted ofa matrix of 1365 specimens, where approximately 8%(113 specimens) were completely sequenced for allmarkers, and 92% (1252 specimens) were representedby COI barcodes uniquely. In this asymmetric matrixof characters only one leading marker is complete,and the presence/missing data of other markers isintentionally guided towards particular taxa (Fig. 1c).This model contrasts with that of a partial matrix wherethe presence/missing data of other markers is randomlydistributed across taxa (Fig. 1d).
DNA extraction, amplification, and sequencing forboth barcode and backbone data sets followed standardprotocols used for Lycaenidae (Vila et al. 2011; Talaveraet al. 2013a). Newly sequenced specimens are storedin the DNA and Tissues Collection of the Institutde Biologia Evolutiva (CSIC-UPF) in Barcelona andthe sequences obtained were submitted to GenBank(Supplementary Table S1 available on Dryad).
Phylogenetics and Divergence Times (Empirical Data Set)Both barcode and backbone data sets were realigned
based on available matrices from Talavera et al. (2013a),using Geneious 10.0.3. The barcode matrix consisted of1365 sequences of 658 bp. The final backbone matrixconsisted of 113 tips and 6672 bp: 2172 bp of COI + leu-tRNA + COII, 1171 bp of EF-1a, 745 bp of CAD, 811 bp of28S, 370 bp of Wg, 1075 bp of ITS2, and 328 bp of H3. Threedata sets, backbone alone, barcode alone, and backboneand barcode combined, were used for phylogenetics.
Bayesian inference was used to simultaneously inferevolutionary relationships and divergence times withthe software BEAST 1.8.0 (Drummond et al. 2012). Datain the backbone and combined data sets were partitionedby six markers, considering COI + leu-tRNA + COII asingle evolutionary unit in the mitochondrial genome.Models for DNA substitution for each marker werechosen according to the Akaike information criterion in
JModeltest (Guindon and Gascuel 2003; Darriba et al.2012). As a result, the HKY model was used for H3,the TN model for CAD, and a GTR model for the restof the markers, in all cases with a gamma distribution(+G) and a proportion of invariants (+I) to account forheterogeneity in evolutionary rates among sites. Thegamma distribution was estimated automatically fromthe data using six rate categories. Normally distributedtmrca priors including maximum and minimum ageswithin the 95% HPD distribution were established onfour well-supported nodes according to Talavera et al.(2013a). The uncorrelated relaxed clock (Drummondet al. 2006) and a constant population size under acoalescent model were established as priors. The restof the settings and priors were set by default. Twoindependent chains were run for 50 million generationseach, sampling values every 1000 steps. All parameterswere analyzed using the program Tracer ver. 1.7 to checkfor stationarity and convergence between runs. Burn-invalues were applied accordingly. Independent runs werecombined in LogCombiner ver. 1.6.0 and tree topologieswere assessed in TreeAnnotator ver. 1.6.0 to generate amaximum clade credibility tree of all sampled trees withmedian node heights.
Maximum likelihood (ML) tree inference wasperformed using two methods, RAxML v.8.2.12(Stamatakis 2014) and IQtree v.2 (Minh et al. 2020).For RAxML, a general GTRCAT substitution modelfor all genes was chosen and 100 rapid bootstrapinferences were executed. For IQtree inference, a generalbest-fit model for all genes was automatically selectedby ModelFinder (Kalyaanamoorthy et al. 2017) andclade support was assessed using ultrafast likelihoodbootstrap with 1000 replicates (Hoang et al. 2018). To testfor possible effects of different modeling approachesand partitioning schemes, we also inferred ML trees forthe combined data set partitioning characters by codonposition, where best substitution models were selectedby ModelFinder in IQtree and by PartitionFinder 2.1.1(Lanfear et al. 2017) for RAxML.
For the resulting BEAST trees, nodes for genera(as reviewed in Talavera et al. 2013a) were collapsedinto a single branch, producing a genus level treefor subsequent topological comparisons of intergenericcladogenetic events between the three different datasets. Genus-level trees were produced to discriminatebetween topological differences belonging to inter- orintrageneric relationships, which are not possible toevaluate from the whole trees. The resulting backbonephylogeny, improved in four relevant taxa, was takenas a reference to re-evaluate generic classifications inPolyommatina by applying the flexible temporal scheme(4–5 Myr) proposed in Talavera et al. (2013a).
SimulationsWe designed simulations to test the performance
of combined data sets in both resolving higher-level
Dow
nloaded from https://academ
ic.oup.com/sysbio/article/71/2/382/6281234 by guest on 13 July 2022
Copyedited by: YS MANUSCRIPT CATEGORY: Systematic Biology
[10:34 22/1/2022 Sysbio-OP-SYSB210038.tex] Page: 386 382–395
386 SYSTEMATIC BIOLOGY VOL. 71
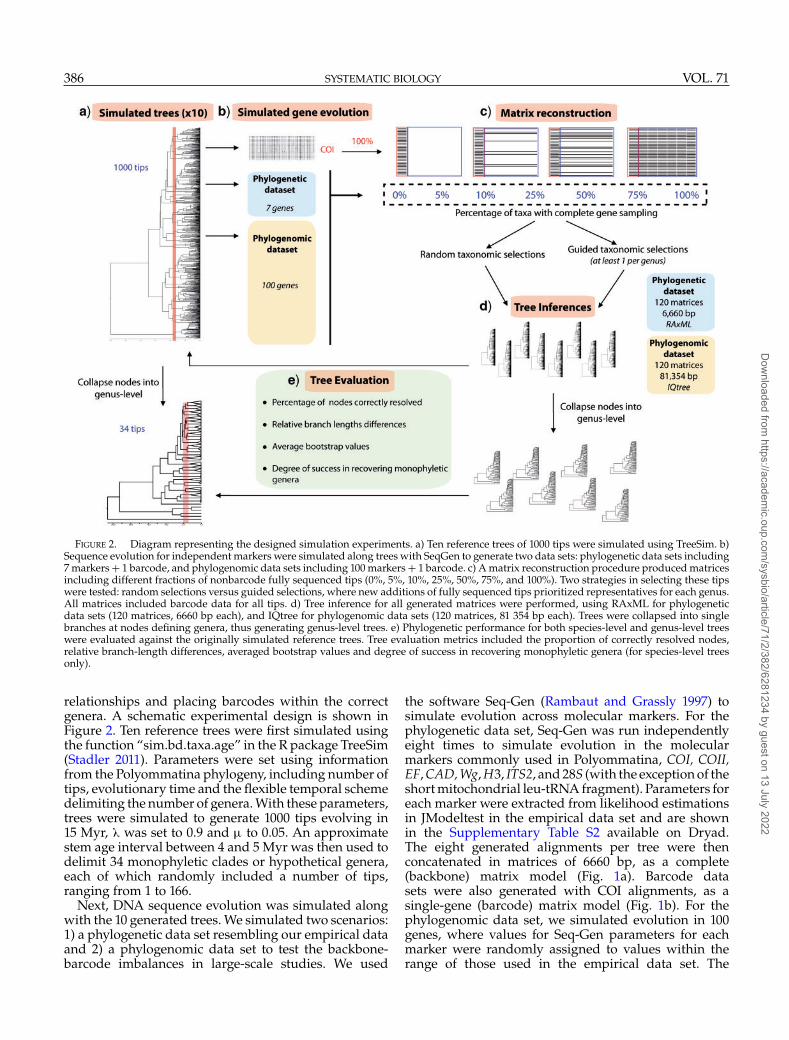
FIGURE 2. Diagram representing the designed simulation experiments. a) Ten reference trees of 1000 tips were simulated using TreeSim. b)Sequence evolution for independent markers were simulated along trees with SeqGen to generate two data sets: phylogenetic data sets including7 markers + 1 barcode, and phylogenomic data sets including 100 markers + 1 barcode. c) A matrix reconstruction procedure produced matricesincluding different fractions of nonbarcode fully sequenced tips (0%, 5%, 10%, 25%, 50%, 75%, and 100%). Two strategies in selecting these tipswere tested: random selections versus guided selections, where new additions of fully sequenced tips prioritized representatives for each genus.All matrices included barcode data for all tips. d) Tree inference for all generated matrices were performed, using RAxML for phylogeneticdata sets (120 matrices, 6660 bp each), and IQtree for phylogenomic data sets (120 matrices, 81 354 bp each). Trees were collapsed into singlebranches at nodes defining genera, thus generating genus-level trees. e) Phylogenetic performance for both species-level and genus-level treeswere evaluated against the originally simulated reference trees. Tree evaluation metrics included the proportion of correctly resolved nodes,relative branch-length differences, averaged bootstrap values and degree of success in recovering monophyletic genera (for species-level treesonly).
relationships and placing barcodes within the correctgenera. A schematic experimental design is shown inFigure 2. Ten reference trees were first simulated usingthe function “sim.bd.taxa.age” in the R package TreeSim(Stadler 2011). Parameters were set using informationfrom the Polyommatina phylogeny, including number oftips, evolutionary time and the flexible temporal schemedelimiting the number of genera. With these parameters,trees were simulated to generate 1000 tips evolving in15 Myr, � was set to 0.9 and � to 0.05. An approximatestem age interval between 4 and 5 Myr was then used todelimit 34 monophyletic clades or hypothetical genera,each of which randomly included a number of tips,ranging from 1 to 166.
Next, DNA sequence evolution was simulated alongwith the 10 generated trees. We simulated two scenarios:1) a phylogenetic data set resembling our empirical dataand 2) a phylogenomic data set to test the backbone-barcode imbalances in large-scale studies. We used
the software Seq-Gen (Rambaut and Grassly 1997) tosimulate evolution across molecular markers. For thephylogenetic data set, Seq-Gen was run independentlyeight times to simulate evolution in the molecularmarkers commonly used in Polyommatina, COI, COII,EF, CAD, Wg, H3, ITS2, and 28S (with the exception of theshort mitochondrial leu-tRNA fragment). Parameters foreach marker were extracted from likelihood estimationsin JModeltest in the empirical data set and are shownin the Supplementary Table S2 available on Dryad.The eight generated alignments per tree were thenconcatenated in matrices of 6660 bp, as a complete(backbone) matrix model (Fig. 1a). Barcode datasets were also generated with COI alignments, as asingle-gene (barcode) matrix model (Fig. 1b). For thephylogenomic data set, we simulated evolution in 100genes, where values for Seq-Gen parameters for eachmarker were randomly assigned to values within therange of those used in the empirical data set. The
Dow
nloaded from https://academ
ic.oup.com/sysbio/article/71/2/382/6281234 by guest on 13 July 2022
Copyedited by: YS MANUSCRIPT CATEGORY: Systematic Biology
[10:34 22/1/2022 Sysbio-OP-SYSB210038.tex] Page: 387 382–395
2022 TALAVERA ET AL.—DNA BARCODES ON HIGHER-LEVEL PHYLOGENIES 387
concatenation of the 100 generated alignments resultedin backbone matrices of 81,354 bp.
In order to test for effects of nonbarcodepresence/missing data on phylogenetic (-omic)performance, we also built five data sets where weprogressively increased the percentage of representationby additional (nonbarcode) markers by 5%, 10%, 25%,50%, and 75% (Fig. 2). The selection of tips representedby these markers followed two strategies: 1) a randomselection per each percentage and 2) a guided selectionper each percentage prioritizing one addition per genus,thus discarding already represented genera (until allgenera were represented). Thus, for each of the 10simulated trees, we produced 12 matrices rangingfrom 0% to 100% of nonbarcode data. Specifically, wegenerated one barcode matrix, one complete matrix, fivematrices with a random selection of tips with multigenedata and five matrices with guided selection of tipswith multigene data. Overall, this procedure generateda total of 120 simulated molecular matrices for thephylogenetic data set, and 120 for the phylogenomicdata set.
Phylogenetic inference for all matrices in the simulatedphylogenetic data set was conducted using ML inRAxML v.8 (Stamatakis 2014). We used the GTRCATmodel of nucleotide evolution and conducted a rapidbootstrap analysis with 100 iterations and a searchfor the best-scoring tree in a single run (-f a). Forthe phylogenomic data set, ML phylogenetic inferencewas conducted using IQtree v.2 (Minh et al. 2020), asdescribed for the empirical data set. All resulting treeswere also posteriorly collapsed into genus-level trees(where intrageneric tips were collapsed into a singlebranch) according to each of the reference simulatedtrees.
Tree Evaluation (Empirical and Simulated)The resulting phylogenetic trees, both from empirical
and simulated data sets, were evaluated along fourdifferent axes: 1) percentage of nodes correctly resolved,2) relative branch lengths differences using the K treescore (K) (Soria-Carrasco et al. 2007), 3) bootstrap valuesas an average of all nodes (for simulations only) and 4)degree of success in recovering monophyletic genera.
For the empirical data sets, we scored the percentageof matching nodes and K score between the combinedand barcode trees. We also scored these metricsfor the genus-level barcode tree and for the genus-level combined tree, always taking the genus-levelbackbone tree as a reference. Values for both genus-level and species-level trees allowed us to discernhigher-level (between genera or deeper) and lower-level (intrageneric) topological differences. The degreeof success in recovering monophyletic genera wasalso compared between the combined and barcodetrees, using the function “AssessMonophyly” in the Rpackage MonoPhy (Schwery and O’Meara 2016). For thebattery of simulations, the percentage of nodes correctly
resolved and K were also retrieved for both genus-level and species-level trees, taking each correspondingsimulated tree as a reference (Fig. 2).
RESULTS
Empirical PhylogeneticsAt the genus-level, the percentage of nodes matching
the backbone tree was higher for the combined trees(81.25% in BEAST, 71.87% in IQtree, and 43.75% inRAxML) than for the barcode trees (12.5% in BEAST,25% in IQtree, and 21.87% in RAxML) (SupplementaryTable S3 available on Dryad). Assuming that thebackbone tree provides the best phylogenetic hypothesis,these results indicate a substantial improvement inphylogenetic resolution for each of the three methodswhen comparing the combined tree with the barcodetree, even though only 8% of the specimens, representingall genera, incorporated additional, non-barcode data.A similar trend of improvement was observed forrelative branch length comparisons, where lower Kscores and scale-factors closer to one indicate branchlengths that are more similar to each other betweentwo trees (Supplementary Table S3 available on Dryad).According to this metric, the combined tree was alsomore similar to the backbone tree (K = 1.57/0.006/0.10;scale-factor = 1.05/0.92/0.70) than was the barcode tree(K = 15.85/0.08/0.14; scale-factor = 0.91/0.54/0.30).
At the species level, the percentage of nodes recoveredin both the combined tree and the barcode treewas 42.33% in BEAST, 65.81% in IQtree and 57.52%in RAxML, indicating that there were meaningfuldifferences between the two data sets in the phylogeneticrelationships recovered within each genus. Differencesbetween the three tree inference methods used to resolvetopologies and relative branch lengths were appreciable,which may be related to the number of unresolved nodes.No supported changes in topology at the genus levelcould be detected in ML trees of the combined dataset when we compared nonpartitioned analyses withanalyses partitioned by codon position (SupplementaryFigs. S2 and S3 available on Dryad). The only observeddifferences were associated with nodes that repeatedlyshowed low support across all methods used.
When testing for inconsistencies in resolvingmonophyletic genera using data from only the barcodetree, we determined that the barcode tree failed tocluster 5 of the 34 genera in the BEAST tree, 4 genera inthe IQtree tree, and 3 genera in the RAxML tree, whilethe combined tree failed to cluster only one genus inthe RAxML tree (Supplementary Table S4 available onDryad).
In an initial exploratory step, the combined treerecovered four taxa that each had an unexpectedplacement or divergence that violated the criteriaapplied to delimit genera in Polyommatina suggestedby Talavera et al. (2013) (i.e., divergencies of <4–5 Myr).These four taxa were represented only by barcodes
Dow
nloaded from https://academ
ic.oup.com/sysbio/article/71/2/382/6281234 by guest on 13 July 2022

Copyedited by: YS MANUSCRIPT CATEGORY: Systematic Biology
[10:34 22/1/2022 Sysbio-OP-SYSB210038.tex] Page: 388 382–395
388 SYSTEMATIC BIOLOGY VOL. 71
FIGURE 3. BEAST tree for the species-level data set of Polyommatina butterflies (1365 specimens—ca. 80% of all taxa (left), and genus-level treewhere nodes are collapsed into a single branch per genus (right), both showing the temporal banding used as a threshold for genus delimitation.
in the analysis. Since taxonomic changes might berequired for these four taxa, we increased their molecularrepresentation by sequencing the same additional genesfor them that were included in the backbone database.Taxonomic decisions were then applied based on atree incorporating these additional sequences (Fig. 3,Supplementary Fig. S1 available on Dryad).
Neolysandra corona was confirmed to be nested withinPolyommatus, and thus, we transferred the taxon coronato Polyommatus.
Kretania psylorita’s divergence (4.02 Myr) fell withinthe flexible temporal scheme of 4–5 Myr, and thus,we retained psylorita together with the rest of the taxawithin Kretania, as defined here. However, the genus wasnot well supported and relationships shifted dependingupon the method of phylogenetic reconstruction. Sincepsylorita is the type-species of the genus Kretania, thiscould have taxonomic consequences, but for now wehave opted for the topology most frequently recovered,which is also in keeping with the morphology-basedclassification.
Divergences for C. elicola (6.68 [4.58–9.01] Myr) andC. kedonga (8.21 [5.65–10.77] Myr) were considerablyolder than 5 Myr, ages that in both cases indicatedthe need for a description of new, monotypic, genus.We describe these two new genera as Birabiro gen. nov.(type species elicola) and Kipepeo gen. nov. (type specieskedonga) (see Appendix).
Finally, we use these results to propose a full divisioninto subgenera of the large genus Polyommatus, including
the description of three new subgenera: Escherilycaenasubgen. nov., Amandolycaena subgen. nov., andIranolysandra subgen. nov. This new phylogeneticclassification helps to resolve other debated cases suchas that of Chilades parrhasius, which is transferredto Luthrodes (see Supplementary material availableon Dryad for the full taxonomic description anddiscussion).
SimulationsThe phylogenetic consequences of combining
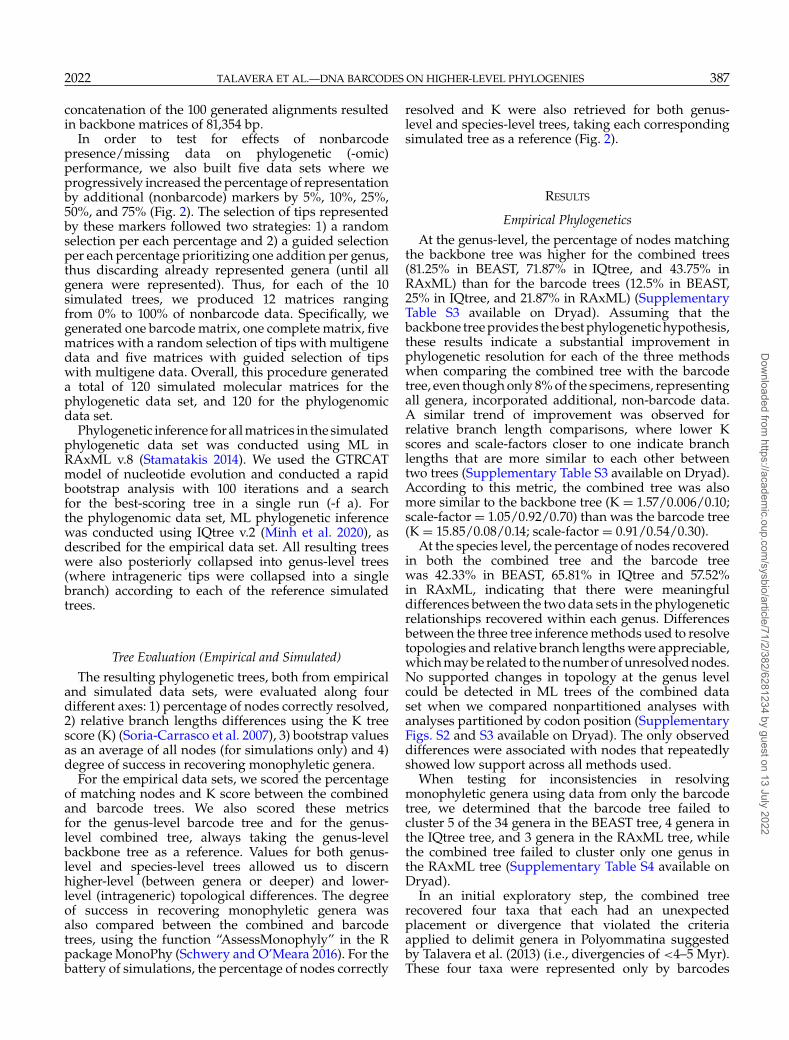
different sequencing strategies to infer higher-levelsystematics were further evaluated using simulatedexperiments. The proportion of nodes that werecorrectly resolved in genus-level trees increased withthe percentage of fully sequenced tips in the matrices(Fig. 4a). For the phylogenetic data set, the proportionof nodes that were correctly resolved was 68.75% onaverage for the barcode data sets and reached a peakvalue of 94.06% for the combined data sets, whereasfor the phylogenomic data set, these values rangedfrom 73.44% for the barcode data sets to 99.38% for thecombined data sets.
The improvement curve was optimized when theselection of tips was guided to include one tip per genus(Fig. 4a). In these cases, combined trees having only 5%of fully sequenced tips (90.94% and 99.38% of correctnodes in the phylogenetic and phylogenomic data sets,
Dow
nloaded from https://academ
ic.oup.com/sysbio/article/71/2/382/6281234 by guest on 13 July 2022

Copyedited by: YS MANUSCRIPT CATEGORY: Systematic Biology
[10:34 22/1/2022 Sysbio-OP-SYSB210038.tex] Page: 389 382–395
2022 TALAVERA ET AL.—DNA BARCODES ON HIGHER-LEVEL PHYLOGENIES 389
FIGURE 4. Phylogenetic performance evaluation from simulation experiments along a progressive percentage of fully sequenced representativesin combination with barcode data sets: a) Percentage of correctly resolved nodes, b) relative branch-length/divergence times (K score), c) averagebootstrap values, and d) monophyly assessment for genera (number of nonmonophyletic genera and number of affected tips). Evaluation metricsare shown for both the species-level trees (1000 tips) and the genus-level trees (34 tips, after collapsing nodes defining genera into a single branch).Values from randomly selected representatives with all markers (in blue) and guided selection strategy using one representative per genus (inred) are compared. Results for a phylogenetic data set (7 markers + 1 barcode), and a phylogenomic data set (100 markers + 1 barcode) areshown. Trees were inferred using RAXML for the phylogenetic data set and IQtree for the phylogenomic data set.
respectively), or 10% of fully sequenced tips (93.12% and98.75% of correct nodes) already produced comparabletopologies to the ones resulting from complete matriceswith 100% of fully sequenced tips (93.44% and 99.38%of correct nodes) (Fig. 4a). This was not the case using arandom selection strategy, where equivalent topologies
were achieved only when 50% of fully sequenced tipswere included (93.12% and 98.44% of correct nodes),percentages that were likely to have included at least onerepresentative per genus by chance (Fig. 4a). In species-level trees, a progressive improvement of phylogeneticaccuracy was also observed, but only reached the
Dow
nloaded from https://academ
ic.oup.com/sysbio/article/71/2/382/6281234 by guest on 13 July 2022
Copyedited by: YS MANUSCRIPT CATEGORY: Systematic Biology
[10:34 22/1/2022 Sysbio-OP-SYSB210038.tex] Page: 390 382–395
390 SYSTEMATIC BIOLOGY VOL. 71
optimal when trees were reconstructed using 100% ofthe data (Fig. 4a). The percentage of correctly resolvednodes ranged from 86.1% in the barcode trees to 96.8%in the complete trees for the phylogenetic data set, andfrom 86% to 99.45% in the phylogenomic data set.
Tree shape as indicated by relative branch lengthassessments performed similarly to topologicalassessments (Fig. 4b). In these comparisons, higherK scores indicate more disparate branch lengths thanlower K scores. For genus-level trees, an improvement(decrease) of K was generally observed when guidedfully sequenced tips were progressively added: whennone of these were present, K =7.07 and K =6.58 forphylogenetic and phylogenomic data sets respectively,whereas when only 5% of fully sequenced tipsrepresenting each genus were added, these valuesdropped to K =2.97 and K =1.25, respectively. Thelatter values were already quite close to those obtainedwhen 100% of taxa were fully sequenced, with K =2.44and K =0.85, respectively (Fig. 4b).
This rapid convergence in branch length differencesdid not occur for randomly selected, fully sequenced tips,where K only approached optimal values when 100%of fully sequenced tips were included (K =2.43 and K=0.85) (Fig. 4b).
When assessing lower-level phylogeneticrelationships with species-level trees, K scores showeda similar pattern with a progressive improvement from0% of fully sequenced tips where K =13.74 and K=13.35 for phylogenetic and phylogenomic data setsrespectively, to 100% of fully sequenced tips whereK =5.77 and K =2.12 (Fig. 4b). Random and guidedselections did not show substantial differences inthis case, suggesting that a guided selection of fullysequenced tips is mainly of benefit in resolving deeperlevel phylogenetic relationships.
Bootstrap values rapidly increased on average fromthe barcode data sets (57.88%) to the combined datasets, with 5% of fully sequenced tips (87.16% for guidedselection and 77.16% for random selection) in thegenus-level trees of the phylogenetic data set (Fig. 4c).Bootstrap values of the phylogenomic data sets increasedfrom 92.51% to 98.12% (guided selection) and 94.83%(random selection) (Fig. 4c). Bootstrap values of thespecies-level trees showed a progressive improvementas fully sequenced tips were incorporated, independentof the sampling strategy (Fig. 4c). Although the averagebootstrap does not provide information about which setof nodes contribute the most to the topological changesobserved, the patterns are consistent between all of theseindices, and give no indication that a few nodes mightbe strongly biasing the results.
The number of monophyletic genera in thephylogenetic data sets increased with the numberof fully sequenced tips, starting with an average of9.7% of nonmonophyletic genera out of 34 (involvingon average 13.4% of affected tips) in barcode treesto 0.6% nonmonophyletic genera (involving 0.9% ofaffected tips) in complete (100% gene sampling) trees(Fig. 4d). Values in the phylogenomic data sets ranged
from an average of 9.1% of nonmonophyletic genera(involving 11.1% of affected tips) to none (Fig. 4d).No substantial differences were detected betweenrandomly and guided selection strategies. Fewer generawere recovered as nonmonophyletic in the simulationsthan in the empirical data set, highlighting the simplicityof simulated evolution against the complexity of realevolutionary processes in nature. Nevertheless, thesimulations show cases of tips that are hard to placeinto the right genera, possibly due to effects of shortinternode branching patterns or of “singletons,” generarepresented by a single terminal species, either becauseof poor sampling or because monotypic lineages canbe grouped together erroneously due to long-branchattraction.
DISCUSSION
Robustness of the Combined ApproachAll tree evaluation methods assessed, both for
empirical and simulated data, show importantimprovements in phylogenetic accuracy whenprogressively increasing fully sequenced tips (Fig. 4,Supplementary Table S3 available on Dryad). Topology,bootstrap support, and concordance in relative branchlengths are particularly strengthened when fullysequenced tips are not added randomly but areselected with the goal of representing at least onetip per genus (Fig. 4). Taxonomically balanced,multigene phylogenetic information seems efficientat counteracting the leading signal of the single-geneCOI history in the combined phylogenies. Trees with5–10% fully sequenced tips are comparable to those with100% fully sequenced tips, but not to trees inferred fromonly barcodes. Interestingly, this effect mostly applies todeeper level phylogenetic relationships (i.e., genus-leveltrees) (Fig. 4).
The K score can be interpreted as a proxy fordivergence time estimates. Missing data have previouslybeen estimated to have little influence in the accuracy ofdivergence dating in BEAST (Zheng and Wiens 2015).Our empirical results also show little difference indivergence times when comparing the backbone andthe taxonomy-guided combined data sets. This is alsoreflected in the simulations, which achieve near optimalvalues at 10% sampling provided fully sequenced tipsare selected to be representative of each genus. However,data sets where fully sequenced tips are added randomlydo not achieve optimal values until sampling is 100%complete (Fig. 4).
The placement of species into genera with which theyare traditionally associated is reflected by the numberof monophyletic genera recovered by an analysis. Ourempirical data show that taxa are likely to be misplacedinto genera with which they are not normally associatedin phylogenies based exclusively on data from COI-based barcodes, with up to five genera recovered asnonmonophyletic (affecting 768 of the tips of the tree)
Dow
nloaded from https://academ
ic.oup.com/sysbio/article/71/2/382/6281234 by guest on 13 July 2022
Copyedited by: YS MANUSCRIPT CATEGORY: Systematic Biology
[10:34 22/1/2022 Sysbio-OP-SYSB210038.tex] Page: 391 382–395
2022 TALAVERA ET AL.—DNA BARCODES ON HIGHER-LEVEL PHYLOGENIES 391
(Supplementary Table S4 available on Dryad). However,inaccurate placements are reduced in phylogenies basedon the combined data sets. The same result is obtainedwith simulations, where the number of monophyleticgenera improves progressively with the addition of fullysequenced tips (Fig. 4d).
Studies carried out by Cho et al. (2011) and Kawaharaet al. (2011) show at the order and family levelrespectively that increased gene sampling improvesestimates of deep relationships as indicated by highersupport values. Our simulated findings are generallycompatible with these results (Fig. 4), which have alsobeen observed in multiple other phylogenies whenincreasing the number of characters (Rokas et al. 2003;Bapteste et al. 2002; Dunn et al. 2008; Zwick et al. 2011;Wilson 2011; Wilson et al. 2011; Kuntner et al. 2019).
The simulated phylogenomic analyses (Fig. 4) showthat data sets with large barcode representation canbe successfully combined with modern genomic datasets where taxa have been sampled for a large numberof genes. The overall performance of the simulatedcombined phylogenomic data set (100 genes + barcode)is better than that of the phylogenetic combined data set(7 genes + barcode), as expected by the much greaternumber of characters. Again, in order to produce thebest possible trees, it is key that taxa with genomicdata represent a diversity of higher-level taxonomiccategories. Thus, phylogeneticists are encouraged—andmany do so instinctively—to strategically design theirsampling to include 1) taxonomically distributed andrepresentative species characterized with genomic dataas well as 2) well-sampled barcode data from individualsrepresenting as many species as possible in order torecover large-scale phylogenetic relationships.
DNA Barcodes as a Tool for Higher-LevelSystematics: A New Value
A great many DNA barcodes representing a widearray of organisms have been generated and depositedin public repositories in recent years. Several markersfunction as DNA barcodes, with mitochondrial COItypically representing animals, and others such as ITS2representing fungi, rcbl or matK representing plants,and 16S rRNA representing bacteria. To date, nearly 9.2million barcoded specimens are available on the BOLDdatabase, and nearly 4 million can be extracted fromGenBank for COI.
Potential applications of DNA barcodes are varied.First, they have been used as references for species-level identification since their conception (Hebert et al.2003), and their impact on taxonomy is undeniable(Miller 2007; Hubert and Hanner 2015; Dinca et al.2015; Miller et al. 2016). Conceptual variations of theinitial DNA barcode idea such as metabarcoding haveexpanded into many other fields of molecular ecologyand community ecology (Creer et al. 2016). DNAbarcodes are also widely applied in phylogeography andsurveys of intraspecific variability. After much initial
debate, it is now well established that DNA barcoding(and any other single-marker approach) can be a usefultool to identify potential cryptic species, although anintegrative approach is necessary for confirmation (e.g.,nuclear markers, morphology, and ecology) (Will et al.2005; DeSalle et al. 2005; Talavera et al. 2013b; Dincaet al. 2015; Hernández-Roldán et al. 2016; Lukhtanov et al.2016; Gaunet et al. 2019).
Few studies have assessed whether DNA barcodescan be helpful at placing unidentified species intohigher-level taxonomic categories (Wilson et al. 2011;Coddington et al. 2016). Here, we show that DNAbarcoding can potentially be applied to assign taxato genera (or higher categories) provided a solid andrepresentative higher-level backbone phylogeny exists.Our results indicate that large data sets of barcodes canbe used to identify cases where taxa have been wronglyassigned to higher-level taxonomic categories, a frequentproblem in diverse groups with complex taxonomy,where synapomorphies helping to delineate genera havebeen difficult to find.
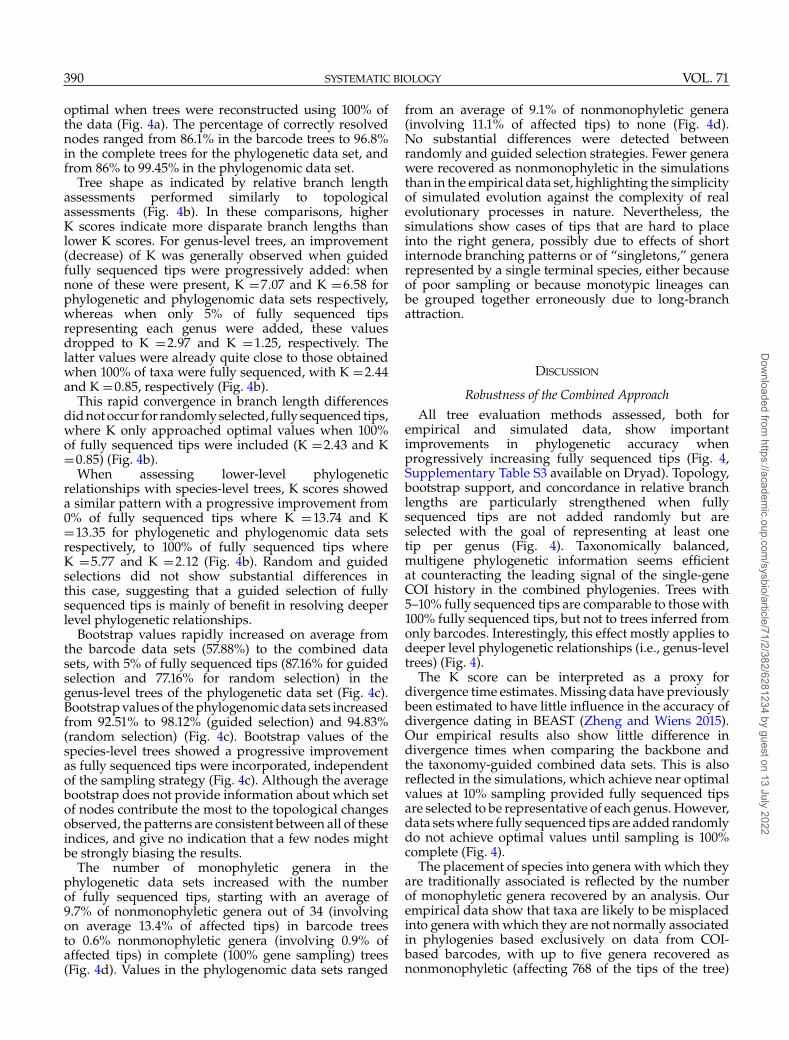
In the case where potential higher-level cryptic taxaare indicated by the results, these can be the focusof further taxonomic assessments following standardprinciples of phylogenetic systematics, such as theaddition of molecular characters that aid in phylogeneticplacement. Our proposed workflow for phylogeneticsystematic assessments (Fig. 5, Supplementary materialavailable on Dryad) takes advantage of the huge numberof sequenced specimens available in public databaseswith the aim of accelerating taxonomic resolution athigher-taxonomic levels. It may facilitate molecular-based taxonomy in research labs where phylogenomictechniques are not yet easily available and, ultimately,benefit the common goal of taxonomic stability.
CONCLUSIONS
Phylogenetic inference based exclusively on DNAbarcodes has been shown, both here and elsewhere, toperform poorly. However, we show how in combinationwith a backbone of carefully sampled, representativetaxa for which a large number of additional markershave been sequenced, these short barcode sequencescan nevertheless be used effectively to produce reliablephylogenies and improve higher-level systematics inlarge data sets. Our simulation tests show that amultigene sampling for as few as 5–10% of thespecimens in the total data set can produce high-qualityphylogenies, comparable to those resulting from 100%multigene sampling, provided a strategic selection hasbeen made of higher-level representatives for multigenesequencing (approximately one per genus). These resultsare found at both a phylogenetic and phylogenomicscale, thus accounting for a wide range of imbalancein the number of characters between the combinedbarcode and backbone matrices. Thus, as long asbackbone matrices are taxonomically representative,data coming from probe capture, transcriptomic or
Dow
nloaded from https://academ
ic.oup.com/sysbio/article/71/2/382/6281234 by guest on 13 July 2022

Copyedited by: YS MANUSCRIPT CATEGORY: Systematic Biology
[10:34 22/1/2022 Sysbio-OP-SYSB210038.tex] Page: 392 382–395
392 SYSTEMATIC BIOLOGY VOL. 71
FIGURE 5. Diagram of the proposed workflow for higher-level systematic assessments.
genomic techniques can be effectively combined withbarcodes to generate phylogenetically accurate, large-scale molecular characterizations of biodiversity.
SUPPLEMENTARY MATERIAL
Data available from the Dryad Digital Repository:http://dx.doi.org/10.5061/dryad.m0cfxpp0d.
ACKNOWLEDGMENTS
We thank many colleagues who collected materialused in this study, including: D. Benyamini, F. Bolland,C. Castelain, S. Cuvelier, L. Dapporto, V. Dinca, V.Doroshkin, V. Doroshkin, K. Dovgailo, Ph. George, J.Hernández-Roldán, E. Ivanova, M. Khaldi, R. Khellaf,T. Larsen, M. Markhasiov, D.J. Martins, I.N. Osipov,O. Pak, V. Patrikeev, N. Rubin, P. Stamer, M.R. Tarrier,V. Tikhonov, S. Toropov, A. Ugarte, J. Verhulst, and R.Voda. Our special thanks are to Blanca Huertas fortaking pictures of type specimens in the Natural HistoryMuseum in London.
FUNDING
This work was funded by projects PID2019-107078GB-I00/AEI/10.13039/501100011033 and 2017-SGR-991(Generalitat de Catalunya) to R.V. and G.T., by theCommittee for Research and Exploration of theNational Geographic Society [grant WW1300R18 toG.T.], by the Putnam Expeditionary Fund of the
Museum of Comparative Zoology (to all authors), bythe U.S. National Science Foundation [DEB-0447244,and DEB-1541560 to N.E.P], and by the Ramón y Cajalprogramme of the Spanish Ministry of Science andInnovation [RYC2018-025335-I to G.T.]. Taxonomicstudies and descriptions of new genera and subgenerawere supported by the Russian Science Foundation[19-14-00202] to the Zoological Institute of the RussianAcademy of Sciences to V.L.
APPENDIX 1
Taxonomic DescriptionsKipepeo Lukhtanov, Talavera, Pierce & Vila gen. novurn:lsid:zoobank.org:act:03C66BDD-56AF-47D1-94F5-FABD45094262Type species: Everes kedonga Grose-Smith, 1898The name is masculine in gender.
Diagnosis. The genus Kipepeo differs in male genitalia(Supplementary Fig. S3a and b available on Dryad)from the representatives of the closest genera Luthrodes,Chilades and Birabiro by relatively short and broadvalves with angular, tooth-similar lower process; inwing pattern it differs by wing underside withdistinct enlarged roundish ocelli and by hind wingunderside with a row of large orange submarginal spots(Supplementary Figs. S1 and S2a available on Dryad). Itcan also be distinguished from other genera by uniquemolecular characters from COI, COII, Wg, ITS2, CAD,and H3 (see Supplementary material available on Dryadfor the full taxonomic description and discussion).
Dow
nloaded from https://academ
ic.oup.com/sysbio/article/71/2/382/6281234 by guest on 13 July 2022

Copyedited by: YS MANUSCRIPT CATEGORY: Systematic Biology
[10:34 22/1/2022 Sysbio-OP-SYSB210038.tex] Page: 393 382–395
2022 TALAVERA ET AL.—DNA BARCODES ON HIGHER-LEVEL PHYLOGENIES 393
Etymology. The name refers to the word “butterfly” in theSwahili language, specific to East Africa.
Birabiro Lukhtanov, Talavera, Pierce & Vila gen. nov.urn:lsid:zoobank.org:act:015918DC-EE7A-477D-9902-2D0D0175EFBBType species: Cupido elicola Strand, 1911The name is masculine in gender.
Diagnosis. The genus Birabiro differs from the closestgenera Luthrodes and Chilades by the trapezoidal(not fusiform) shape of the valve in male genitalia(Supplementary Fig. S4 available on Dryad). The onlyrepresentative of this genus (Birabiro elicola) has aplesiomorphic pattern on the wing underside, with thepresence of all the basic elements typical of the non-Neotropical Polyommatina (Supplementary Fig. S2bavailable on Dryad). Thus, this pattern has no diagnosticvalue to distinguish the genus Birabiro. However,Birabiro represents a distinct monophyletic entity on thebasis of molecular characters. It can be distinguishedfrom other genera by unique molecular charactersfrom COI, COII, ITS2, and H3 (see Supplementarymaterial available on Dryad). The genus Birabiro differsfrom the genus Kipepeo by the wing pattern and thestructure of the male genitalia, as well as by abovementioned molecular characters (see Supplementarymaterial available on Dryad for the full taxonomicdescription and discussion).
Etymology. The name refers to the word “butterfly” in theAmharic language, specific to Ethiopia.
Polyommatus (Iranolysandra) Lukhtanov, Talavera,Pierce & Vila subgen. nov.urn:lsid:zoobank.org:act:BAF45FDC-0398-4103-BF2F-B569BB014336Type species: Lysandra corona Verity, 1936Diagnosis. The wing pattern of Iranolysandra(Supplementary Fig. S5a available on Dryad) ismost similar to those found in two other genera:Neolysandra (the sister genus to Polyommatus) andGlaucopsyche (very distant genus with completelydifferent structure of genitalia). All these taxa sharea similar wing pattern that seems to have evolvedindependently three times. However, Iranolysandrarepresents a distinct monophyletic entity on the basisof molecular characters. It can be distinguished fromother subgenera of the genus Polyommatus by usingmolecular markers from COI, COII, ITS2, and CAD (seeSupplementary material available on Dryad for the fulltaxonomic description and discussion).
The subgenus Polyommatus (Iranolysandra) includes thespecies: P. (I.) corona, P. (I.) fatima, P. (I.) stempfferi andP. (I.) fereiduna.
Etymology. The name Iranolysandra reflects thedistribution area of the subgenus (distributed mostly inIran) and its phenotypic similarity to the species of thegenus Neolysandra.
Polyommatus (Amandolycaena) Lukhtanov, Talavera,Pierce & Vila subgen. nov.
urn:lsid:zoobank.org:act:7363C141-F71A-4844-9728-0676F4FD43E0Type species: Papilio amandus Schneider, 1792
Diagnosis. The wing pattern of Amandolycaena(Supplementary Fig. S5b available on Dryad) seemsto represent a plesiomorphic character found in thegenus Polyommatus. It is most similar to those foundin other subgenera of Polyommatus: Polyommatussensu stricto, Plebicula, Thersitesia, Sublysandra, andEscherilycaena. However, Amandolycaena represents adistinct monophyletic entity on the basis of molecularcharacters. It can be distinguished from other subgeneraof the genus Polyommatus by using molecular markersfrom COI, COII, and Wg (see Supplementary materialavailable on Dryad for the full taxonomic descriptionand discussion).
The subgenus includes a single species Polyommatus(Amandolycaena) amandus (Schneider, 1792).
Etymology. The name Amandolycaena reflects the name ofthe type-species (Papilio amandus) and includes the wordLycaena that has been used in the past as a genus namefor blue butterflies.
Polyommatus (Escherilycaena) Lukhtanov, Talavera,Pierce & Vila subgen. nov.urn:lsid:zoobank.org:act:2FBDDBBB-1073-43CE-845C-1D3491544390Type species: Papilio escheri Hübner, [1823]
Diagnosis. The wing pattern of Escherilycaena(Supplementary Fig. S8 available on Dryad) seemsto represent a plesiomorphic character found in thegenus Polyommatus. It is most similar to those foundin other subgenera of Polyommatus: Polyommatussensu stricto, Plebicula, Thersitesia, Sublysandra, andAmandolycaena. However, Escherilycaena represents adistinct monophyletic entity on the basis of molecularcharacters. It can be distinguished from other subgeneraof the genus Polyommatus by using molecular markersfrom COI, COII, EF-1a, Wg, CAD, H3, and 28S (seeSupplementary material available on Dryad for the fulltaxonomic description and discussion).
The subgenus includes a single species Polyommatus(Escherilycaena) escheri Hübner, [1823].
Etymology. The name Escherilycaena reflects the name ofthe type-species (Papilio escheri) and includes the wordLycaena that has been used in past as a genus name forblue butterflies.
REFERENCES
Bálint Z., Johnson K. 1997. Reformation of the Polyommatus sectionwith a taxonomic and biogeographic overview (Lepidoptera,Lycaenidae, Polyommatini). Neue Ent. Nachr. 40:1–68.
Bapteste E., Brinkmann H., Lee J.A., Moore D.V., Sensen C.W., GordonP., Duruflé L., Gaasterland T., Lopez P., Müller M., Philippe H. 2002.The analysis of 100 genes supports the grouping of three highlydivergent amoebae: Dictyostelium, Entamoeba, and Mastigamoeba.Proc. Natl. Acad. Sci. USA 99:1414–1419.
Dow
nloaded from https://academ
ic.oup.com/sysbio/article/71/2/382/6281234 by guest on 13 July 2022

Copyedited by: YS MANUSCRIPT CATEGORY: Systematic Biology
[10:34 22/1/2022 Sysbio-OP-SYSB210038.tex] Page: 394 382–395
394 SYSTEMATIC BIOLOGY VOL. 71
Cho S., Zwick A., Regier J.C., Mitter C., Cummings M.P., Yao J., DuZ., Zhao H., Kawahara A.Y., Weller S., Davis D.R., Baixeras J.,Brown J.W., Parr C. 2011. Can deliberately incomplete gene sampleaugmentation improve a phylogeny estimate for the advancedmoths and butterflies (Hexapoda: Lepidoptera)? Syst. Biol. 60:782–796.
Creer S., Deiner K., Frey S., Porazinska D., Taberlet P., Thomas K.,Potter C., Bik H. 2016. The ecologist’s field guide to sequence-basedidentification of biodiversity. Methods Ecol. Evol. 7:1008–1018.
Coddington J.A., Agnarsson I., Cheng R.-C., Candek K., DriskellA., Frick H., Gregoric M., Kostanjsek R., Kropf C., Kweskin M.,Lokovsek R., Pipan M., Vidergar N., Kuntner M. 2016. DNA barcodedata accurately assign higher spider taxa. PeerJ 4:e2201.
Darriba D., Taboada G.L., Doallo R., Posada D. 2012. jModelTest 2: moremodels, new heuristics and parallel computing. Nat. Methods 9:772.
Degnan J., Rosenberg N.A. 2006. Discordance of species trees with theirmost likely gene trees. PLoS Genet. 2:e68.
de Queiroz A., Gatesy J. 2007. The supermatrix approach to systematics.Trends Ecol. Evol. 22:34–41.
DeSalle R., Egan M.G., Siddall M. 2005. The unholy trinity: taxonomy,species delimitation and DNA barcoding. Philos. Trans. R. Soc. B.360:1905–1916.
Dinca V., Montagud S., Talavera G., Hernández-Roldán J., MunguiraM.L., García-Barros E., Hebert P.D.N., Vila R. 2015. DNA barcodereference library for Iberian butterflies enables a continental-scalepreview of potential cryptic diversity. Sci. Rep. 5:12395.
Drummond A.J., Ho S.Y.W., Phillips M.J., Rambaut A. 2006. Relaxedphylogenetics and dating with confidence. PLoS Biol. 4, e88.
Drummond A.J., Suchard M.A., Xie D., Rambaut A. 2012. Bayesianphylogenetics with BEAUti and the BEAST 1.7. Mol. Biol. Evol.29:1969–1973.
Dunn C.W., Hejnol A., Matus D.Q., Pang K., Browne W.E., SmithS.A., Seaver E., Rouse G.W., Obst M., Edgecombe G.D., SørensenM.V., Haddock S.H.D., Schmidt-Rhaesa A., Okusu A., MøbjergKristensen R., Wheeler W.C., Martindale M.Q., Giribet G. 2008.Broad phylogenomic sampling improves resolution of the animaltree of life. Nature 452:745–749.
Eckweiler W., Bozano G.C. 2016. Guide to the butterflies of thePalearctic region: Lycaenidae. Part IV. Milano, pp. 132.
Galtier N., Daubin V. 2008. Dealing with incongruence inphylogenomic analyses. Philos. Trans. R. Soc. B 363:4023–4029.
Gaunet A., Dinca V., Dapporto L., Montagud S., Voda R., Schär S.,Badiane A., Font, E., Vila R. 2019. Two consecutive Wolbachia-mediated mitochondrial introgressions obscure taxonomy inPalearctic swallowtail butterflies (Lepidoptera, Papilionidae). Zool.Scr. 48:507–519.
GrayBeal A. 1998. Is it better to add taxa or characters to a difficultphylogenetic problem? Syst. Biol. 47:9–17.
Grievink L., Penny D., Holland B.R. 2013. Missing data andinfluential sites: choice of sites for phylogenetic analysis can be asimportant as taxon sampling and model choice. Genome Biol. Evol.5:681–687.
Guindon S., Gascuel O. 2003. A simple, fast and accurate algorithmto estimate large phylogenies by maximum likelihood. Syst. Biol.52:696–704.
Hebert P.D.N., Cywinska A., Ball S.L., deWaard J.F. 2003. Biologicalidentifications through DNA barcodes. Proc. R. Soc. Lond. B270:313–321.
Hernández-Roldán J.L., Dapporto L., Dinca V., Vicente J.C., HornettE.A., Šichová J., Lukhtanov V., Talavera G., Vila R. 2016. Integrativeanalyses unveil speciation linked to host plant shift in Spialiabutterflies. Mol. Ecol. 25:4267–4284.
Hey J., Waples R.S., Arnold M.L., Butlin R.K., Harrison R.G. 2003.Understanding and confronting species uncertainty in biology andconservation. Trends Ecol. Evol. 18:597–603.
Hoang D.T., Chernomor O., von Haeseler A., Minh B.Q., Vinh, L.S.2018. UFBoot2: improving the ultrafast bootstrap approximation.Mol. Biol. Evol. 35:518–522.
Hovmöller R., Knowles L.L., Kubatko L.S. 2013. Effects of missing dataon species tree estimation under the coalescent. Mol. Phylogenet.Evol. 69:1057–1062.
Hubert N., Hanner R. 2015. DNA Barcoding, species delineation andtaxonomy: a historical perspective. DNA Barcodes 3:44–58.
Jeffroy O., Brinkmann H., Delsuc F., Philippe H. 2006. Phylogenomics:the beginning of incongruence? Trends Genet. 22:225–231.
Jiang W., Chen S.Y., Wang H., Li D.Z., Wiens J.J. 2014. Should geneswith missing data be excluded from phylogenetic analyses? Mol.Phylogenet. Evol. 80:308–318.
Kalyaanamoorthy S., Minh B.Q., Wong T.K.F., von Haeseler A., L.S.Jermiin L.S. 2017. ModelFinder: fast model selection for accuratephylogenetic estimates. Nat. Methods 14:587–589.
Kandul N.P., Lukhtanov V.A., Dantchenko A.V., Coleman J.W.S.,Sekercioglu C.H., Haig D., Pierce N.E. 2004. Phylogeny ofAgrodiaetus Hübner 1822 (Lepidoptera: Lycaenidae) inferred frommtDNA sequences of COI and COII and nuclear sequences ofEF1-�: karyotype diversification and species radiation. Syst. Biol.53:278–298.
Kawahara A.Y., Ohshima I., Kawakita A., Regier J.C., Mitter C.,Cummings M.P., Davis D.R., Wagner D.L., De Prins J., Lopez-Vaamonde C. 2011. Increased gene sampling strengthens supportfor higher-level groups within leaf-mining moths and relatives(Lepidoptera: Gracillariidae). BMC Evol. Biol. 11:182.
Kuntner M., Hamilton C.A., Ren-Chung C., Gregoric M., LupseN., Lokovsek T., Lemmon E.M., Lemmon A.R., Agnarsson I.,Coddington J.A., Bond, J. 2019. Golden Orbweavers ignore biologicalrules: phylogenomic and comparative analyses unravel a complexevolution of sexual size dimorphism. Syst. Biol. 68:555–572.
Lanfear R., Frandsen P.B., Wright A.M., Senfeld T., Calcott,B. 2017.PartitionFinder 2: new methods for selecting partitioned models ofevolution formolecular and morphological phylogenetic analyses.Mol. Biol. Evol. 34:772–773.
Layberry R.A., Hall P.W., Lafontaine J.D. 1998. The butterflies ofCanada. Toronto, Buffalo, London: University of Toronto Press. 280pp.
Lemmon A.R., Brown J.M., Stanger-Hall K., Lemmon E.M. 2009. Theeffect of ambiguous data on phylogenetic estimates obtained bymaximum likelihood and Bayesian inference. Syst. Biol. 58:130–145.
Lukhtanov V.A., Sourakov A., Zakharov E.V. 2016. DNA barcodes asa tool in biodiversity research: testing pre-existing taxonomichypotheses in Delphic Apollo butterflies (Lepidoptera,Papilionidae). Syst. Biodivers. 14:599–613.
Maddison W.P. 1997. Gene trees in species trees. Syst. Biol. 46:523–536.Mendes F.K., Hahn M.W. 2018. Why concatenation fails near the
anomaly zone. Syst. Biol. 67:158–169.Minh B.Q., Schmidt H.A, Chernomor O., Schrempf D., Woodhams
M.D., von Haeseler A., Lanfear R. 2020. IQ-TREE 2: new modelsand efficient methods for phylogenetic inference in the genomic era.Mol. Biol. Evol. 37:1530–1534.
Miller S.E. 2007. DNA barcoding and the renaissance of taxonomy. Proc.Natl. Acad. Sci. USA 104:4775–4776.
Miller S.E., Hausmann A, Hallwachs W, Janzen D.H. 2016. Advancingtaxonomy and bioinventories with DNA barcodes. Philos. Trans. R.Soc. B. 371:20150339.
Pamilo P., Nei M. 1988. Relationships between gene trees and speciestrees. Mol. Biol. Evol. 5:568–583.
Nichols R. 2001. Gene trees and species trees are not the same. TrendsEcol. Evol. 16:358–364.
Pelham J.P. 2008. A catalogue of the butterflies of the United States andCanada. J. Res. Lepid. 40: I-XIII, 1–658.
Philippe H., Snell E.A., Bapteste E., Lopez P., Holland P.W.H., CasaneD. 2004. Phylogenomics of Eukaryotes: impact of missing data onlarge alignments. Mol. Biol. Evol. 21:1740–1752.
Philippe H., de Vienne D.M., Ranwez V., Roure B., Baurain D., Delsuc F.2017. Pitfalls in supermatrix phylogenomics. Eur. J. Taxon. 283:1–25.
Philippe H., Brinkmann H., Lavrov D.V., Littlewood D.T.J., ManuelM., Wörheide G., Baurain D. 2011. Resolving difficult phylogeneticquestions: why more sequences are not enough. PLoS Biol.9:e1000602.
Poe S. 2003. Evaluation of the strategy of long branch subdivision toimprove accuracy of phylogenetic methods. Syst. Biol. 52:423–428.
Rambaut A., Grassly N.C. 1997. Seq-Gen: an application for the MonteCarlo simulation of DNA sequence evolution along phylogenetictrees. Comput. Appl. Biosci. 13:235–238.
Rambaut A., Drummond A.J., Xie D., Baele G., Suchard M.A. (2018)Posterior summarisation in Bayesian phylogenetics using Tracer 1.7.Syst. Biol. 67:901–904.
Dow
nloaded from https://academ
ic.oup.com/sysbio/article/71/2/382/6281234 by guest on 13 July 2022

Copyedited by: YS MANUSCRIPT CATEGORY: Systematic Biology
[10:34 22/1/2022 Sysbio-OP-SYSB210038.tex] Page: 395 382–395
2022 TALAVERA ET AL.—DNA BARCODES ON HIGHER-LEVEL PHYLOGENIES 395
Rannala B., Huelsenbeck J.P., Yang Z., Nielsen R. 1998. Taxon samplingand the accuracy of large phylogenies. Syst. Biol. 47:702–710.
Robinson D.F., Foulds L.R. 1981. Comparison of phylogenetic trees.Math. Biosci. 53:131–147.
Rokas A., Williams B.L., King N., Carroll S.B. 2003. Genome-scaleapproaches to resolving incongruence in molecular phylogenies.Nature 425:798–804.
Rosenberg M.S., Kumar S. 2001. Incomplete taxon sampling is nota problem for phylogenetic inference. Proc. Natl. Acad. Sci. USA98:10751–10756.
Roure B., Baurain D., Philippe H. 2013. Impact of missing data onphylogenies inferred from empirical phylogenomic data sets. Mol.Biol. Evol. 30:197–214.
Rubinoff D., Holland B.S. 2005. Between two extremes: mitochondrialDNA is neither the panacea nor the nemesis of phylogenetic andtaxonomic inference. Syst. Biol. 54:952–961.
Schwery O., O’Meara B.C. 2016. MonoPhy: a simple R package to findand visualize monophyly issues. PeerJ Comput. Sci. 2:e56.
Shapoval N., Lukhtanov V. 2016. On the generic position of Polyommatusavinovi (Lepidoptera: Lycaenidae). Folia Biol. (Krakow) 64:267–273.
Simmons M.P. 2012. Radical instability and spurious branch support bylikelihood when applied to matrices with non-random distributionsof missing data. Mol. Phylogenet. Evol. 62:472–484.
Simmons M.P. 2012. Misleading results of likelihood-basedphylogenetic analyses in the presence of missing data. Cladistics28:208–222.
Stadler T. 2011. Simulating trees on a fixed number of extant species.Syst. Biol. 60:676–684.
Stamatakis A. 2014. RAxML version 8: a tool for phylogenetic analysisand post-analysis of large phylogenies. Bioinformatics 30:1312–1313.
Streicher J.W., Schulte J.A.II., Wiens J.J. 2015. How should genes andtaxa be sampled for phylogenomic analyses with missing data? Anempirical study in iguanian lizards. Syst. Biol. 65:128–145.
Soria-Carrasco V., Talavera G., Igea J., Castresana J. 2007. The K treescore: quantification of differences in the relative branch length andtopology of phylogenetic trees. Bioinformatics 23:2954–2956.
Stamatakis A. 2014. RAxML version 8: a tool for phylogenetic analysisand post-analysis of large phylogenies. Bioinformatics 30:1312–1313.
Stradomsky B.V. 2016. A molecular phylogeny of the subfamilyPolyommatinae (Lepidoptera: Lycaenidae). Caucas. Entomol. Bull.12:145–156.
Talavera G., Lukhtanov V.A., Pierce N.E., Vila R. 2013a. Establishingcriteria for higher-level classification using molecular data:the systematics of Polyommatus blue butterflies (Lepidoptera,Lycaenidae). Cladistics 29:166–192.
Talavera G., Dinca V., Vila R. 2013b. Factors affecting speciesdelimitations with the GMYC model: insights from a butterflysurvey. Methods Ecol. Evol. 4:1101–1110.
Talavera G., Kaminski L.A., Freitas A.V.L., Vila R. 2015. One-notesamba: the biogeographical history of the relict Brazilian butterflyElkalyce cogina. J. Biogeogr. 43:727–737.
Vila R., Bell C.D., Macniven R., Goldman-Huertas B., Ree R.H.,Marshall C.R., Balint Z., Johnson K., Benyamini D., Pierce N.E. 2011.Phylogeny and palaeoecology of Polyommatus blue butterflies showBeringia was a climate-regulated gateway to the New World. Proc.R. Soc. Lond., B, Biol. Sci. 278:2737–2744.
Wiemers M., Stradomsky B.V., Vodolazhsky D.I. 2010. A molecularphylogeny of Polyommatus s. str. and Plebicula based onmitochondrial COI and nuclear ITS2 sequences (Lepidoptera:Lycaenidae). Eur. J. Entomol. 107:325–336.
Wiens J.J. 2003. Missing data, incomplete taxa, and phylogeneticaccuracy. Syst. Biol. 52:528–538.
Wiens J.J. 2005. Can incomplete taxa rescue phylogenetic analyses fromlong-branch attraction? Syst. Biol. 54:731–742.
Wiens J.J., Fetzner J.W., Parkinson C.L., Reeder T.W. 2005. Hylid frogphylogeny and sampling strategies for speciose clades. Syst. Biol.54, 719–748.
Wiens J.J. 2006. Missing data and the design of phylogenetic analyses.J. Biomed. Inform. 39:34–42.
Wiens J.J., Morrill M.C. 2011. Missing data in phylogenetic analysis:reconciling results from simulations and empirical data. Syst. Biol.60:719–731.
Wiens J.J., Tiu J. 2012. Highly incomplete taxa can rescue phylogeneticanalyses from the negative impacts of limited taxon sampling. PLoSOne 7:e42925.
Will K.W., Mishler B.D., Wheeler Q.D. 2005. The perils of DNABarcoding and the need for integrative taxonomy. Syst. Biol. 54:844–851.
Wilson J., Rougerie R., Schonfeld J., Janzen D.H., Hallwachs W.,Hajibabaei M., Kitching I.J., Haxaire J., Hebert P.D. 2011. Whenspecies matches are unavailable are DNA barcodes correctlyassigned to higher taxa? An assessment using sphingid moths. BMCEcol. 11:18.
Wilson J.J. 2011. Assessing the value of DNA barcodes for molecularphylogenetics: effect of increased taxon sampling in Lepidoptera.PLoS One 6:e24769.
Zhdanki A.B. 2004. A revision of the supraspecific taxa of thelycaenid tribe Polyommatini (Lepidoptera, Lycaenidae). Entomol.Rev. 84:782–796.
Zheng Y., Wiens J.J. 2016. Combining phylogenomic and supermatrixapproaches, and a time-calibrated phylogeny for squamate reptiles(lizards and snakes) based on 52 genes and 4162 species. Mol.Phylogenet. Evol. 94:537–547.
Zheng Y., Wiens J.J. 2015. Do missing data influence the accuracy ofdivergence-time estimation with BEAST? Mol. Phylogenet. Evol.85:41–49.
Zwick A., Regier J.C., Mitter C., Cummings M.P. 2011. Increasedgene sampling yields robust support for higher-level clades withinBombycoidea (Lepidoptera). Syst. Entomol. 36:31–43.
Zwickl D.J., Hillis D.M. 2002. Increased taxon sampling greatly reducesphylogenetic error. Syst. Biol. 51:588–598.
Dow
nloaded from https://academ
ic.oup.com/sysbio/article/71/2/382/6281234 by guest on 13 July 2022