Multi-target warning through millimeter wave Radar and RGB ...
24
1 / 24 Assisting the visually impaired: Multi-target warning through millimeter wave Radar and RGB-Depth sensors Ningbo Long, Kaiwei Wang*, Ruiqi Cheng, Kailun Yang, Weijian Hu, Jian Bai State Key Laboratory of Modern Optical Instrumentation, Zhejiang University, Hangzhou, China Corresponding author: [email protected] Abstract: It is very difficult for visually impaired people to perceive and avoid obstacles at a distance. To address this problem, we propose a sensor fusion system, which combines the RGB-Depth sensor and millimeter wave radar sensor, to perceive the surrounding obstacles. The position and velocity information of the multiple target are detected by the millimeter wave radar based on the principle of frequency modulated continuous wave. The depth and position information of the obstacles are verified by the RGB-Depth sensor based on the MeanShift algorithm. The data fusion based on the Joint Probabilistic Data Association algorithm and Kalman filter enable the navigation assistance system to obtain more accurate state estimates compared with using only one sensor. The non-semantic stereophonic interface is utilized to transfer the obstacle detection results to the visually impaired people. The experiment results show that multiple object with different ranges and angles are detected by the radar and the RGB-Depth sensor. The effective detection range is expanded up to 80 meters compared to using only the RGB-Depth sensor. Moreover, the measurement results are stable under diverse illumination conditions. As a wearable system, the sensor fusion system has the characteristics of versatility, portability and cost-effectiveness. Keywords RGB-D sensor, millimeter wave radar, sensor fusion, visually impaired people 1. Introduction According to the data from the World Health Organization (WHO), 253 million people are estimated to be visually impaired worldwide, and 36 million are blind [1]. It is very difficult for visually impaired people (VIP) to perceive and avoid obstacles at a distance. To address this problem, we propose a sensor fusion system, which combines the RGB-Depth (RGB-D) sensor and millimeter wave (MMW) radar sensor, to perceive the surrounding obstacles and their positions. In the literature, navigation assistance systems based on RGB-D sensors have been investigated to help VIP to avoid obstacles [2-7]. The RGB-D sensors revolutionize the field of VIP aiding because of its outstanding performance. They provide much more information compared with the traditional assistive tools.
-
Upload
khangminh22 -
Category
Documents
-
view
1 -
download
0
Transcript of Multi-target warning through millimeter wave Radar and RGB ...

1 / 24
Assisting the visually impaired: Multi-target warning through millimeter wave
Radar and RGB-Depth sensors
Ningbo Long, Kaiwei Wang*, Ruiqi Cheng, Kailun Yang, Weijian Hu, Jian Bai State Key Laboratory of Modern Optical Instrumentation, Zhejiang University, Hangzhou, China
Corresponding author: [email protected]
Abstract:
It is very difficult for visually impaired people to perceive and avoid obstacles at a distance. To address this problem, we propose a sensor fusion system, which combines the RGB-Depth sensor and millimeter wave radar sensor, to perceive the surrounding obstacles. The position and velocity information of the multiple target are detected by the millimeter wave radar based on the principle of frequency modulated continuous wave. The depth and position information of the obstacles are verified by the RGB-Depth sensor based on the MeanShift algorithm. The data fusion based on the Joint Probabilistic Data Association algorithm and Kalman filter enable the navigation assistance system to obtain more accurate state estimates compared with using only one sensor. The non-semantic stereophonic interface is utilized to transfer the obstacle detection results to the visually impaired people. The experiment results show that multiple object with different ranges and angles are detected by the radar and the RGB-Depth sensor. The effective detection range is expanded up to 80 meters compared to using only the RGB-Depth sensor. Moreover, the measurement results are stable under diverse illumination conditions. As a wearable system, the sensor fusion system has the characteristics of versatility, portability and cost-effectiveness.
Keywords
RGB-D sensor, millimeter wave radar, sensor fusion, visually impaired people
1. Introduction
According to the data from the World Health Organization (WHO), 253 million people are estimated to be visually impaired worldwide, and 36 million are blind [1]. It is very difficult for visually impaired people (VIP) to perceive and avoid obstacles at a distance. To address this problem, we propose a sensor fusion system, which combines the RGB-Depth (RGB-D) sensor and millimeter wave (MMW) radar sensor, to perceive the surrounding obstacles and their positions.
In the literature, navigation assistance systems based on RGB-D sensors have been investigated to help VIP to avoid obstacles [2-7]. The RGB-D sensors revolutionize the field of VIP aiding because of its outstanding performance. They provide much more information compared with the traditional assistive tools.

2 / 24
They are able to acquire color information and perceive three-dimensional environment in real time [8-11]. However, the RGB-D sensors, including light-coding sensors, time-of-flight (TOF) sensors and stereo cameras, could not detect obstacles at a distance and measure the velocity of objects.
Notably, a VIP assistance system needs to deal with complex environments, such as time-varying environments and weather conditions. However, the detection range of low power light-coding sensors is too small in outdoor environment, especially in sunny environment [2,12]. The measurement results of TOF camera are sensitive to ambient light and show poor performance in outdoor environments [13,14]. The ranging results of remote objects derived from stereo cameras are not accurate, and the objects without abundant textures are not robustly detected [15,16]. Furthermore, it is difficult to measure the velocity of object using all these kinds of RGB-D sensors.
In contrast, the range and velocity of the obstacles are obtained simultaneously using the MMW radar, and the accuracy of the range is satisfactory. The radar detection results are rarely influenced by the varying illumination and severe weather [17]. Meanwhile, the detection range could be very far compared with the RGB-D sensor. Thanks to the technological development, the MMW radar sensors have become small, low-cost and accurate, which makes them especially suitable for portable low-power applications. Moreover, the single chip radar sensor has already appeared. However, the MMW radar has its own drawbacks, such as, the azimuth beam with of most MMW radars only cover more than several degrees due to the limited antenna distributions, which results in a low directional resolution compared with the camera.
There are various advantages of fusing RGB-D sensor and radar sensor [18]. This fusion complements the drawbacks of each sensor and maximizes the capability of object detection and location in varying environments. The MMW radar provides with relatively high distance resolution and low directional resolution. However, the RGB-D sensor provides high spatial resolution but low accuracy in depth ranging. The high spatial resolution of the RGB-D camera enhances the directional resolution of the radar, and the high distance resolution of the radar improves the ranging accuracy of the RGB-D sensor. Meanwhile, the fusion system is able to fully utilize the complementary information coming from the different sensors, such as the shape and color information of the objects coming from the RGB-D sensor and the velocity information coming from the MMW radar sensor. Meanwhile, the sensor fusion system increases the overall system robustness to varying lighting conditions.
Depending on the approach, fusion roughly takes place at three levels [19,20], which are prior to objects detection (bottom level) [21,22], during objects detection [23,24] and at the state level [25,26]. In our system, the fusion is performed at the objects detection level, which provides with the unique list of stationary and moving objects around VIP at every discrete time step. However, in multiple sensor systems, each sensor obtains the object detection results in separate coordinate systems. In order to transform these object detection results into a unified coordinate system, the calibration of pose between the two sensors is essential.
In this paper, we propose a sensor fusion system based on the MMW radar and the RGB-D sensor to help VIP perceive and avoid the obstacles. The range, velocity and angle information of objects are measured by the MMW radar based on the principle of frequency-modulated continuous wave (FMCW), during which the linearity of the radar chirps is considered. The MeanShift algorithm is applied to the depth images to fulfill feature extraction, then the depth and position information of the obstacles are obtained. The calibration between the radar and RGB-D sensor coordinate is accomplished. The multiple target tracking task is accomplished with the method of Joint Probabilistic Data Association (JPDA) algorithm. The data fusion

3 / 24
based on the Kalman filtering is proposed to obtain more accurate state estimates. The non-semantic stereophonic interface is carried out to transfer the detection information to VIP. Furthermore, special attention is taken to assure the clock synchronization of data fusion.
In addition to technical aspects, some other factors should be considered in VIP assistance domain, such as the price, dimension, weight and energy consumption of the assistive system. The main purpose of our research in this paper is to design a robust and cost-effective multiple object detection system to help VIP perceive and avoid obstacles. The rest of this paper is organized as follow. In the section 2, the related work is reviewed. In the section 3, we describe the design and implementation of the proposed data fusion system, which is composed of the RGB-D and radar sensor. The field tests and the user study are described in detail in section 4. Finally, in section 5, we draw the conclusions and give an outlook to future work.
2. Related Work
Several distinct research fields are related to our work presented in this paper, which include stereo vision, digital image processing, radar signal processing, multiple sensor fusion, multitarget detection and tracking. In this part, we focus on reviewing state-of-the-art multiple sensor fusion.
In the literature, most research work focused on the fusion system composed of the radar and monocular vision. For example, Sugimoto et al. [27] proposed a calibration method between MMW radar and camera, which does not require estimation of rotation and translation between them, nor intrinsic parameters of the camera. They also proposed an obstacle detection method consisting of an occupancy-grid representation, and a segmentation technique which divides data acquired by radar into clusters. However, the segmentation method which only depends on the radar data is easily affected by the ground clutter. Wang et al. [21] presented a systematic scheme by fusing millimeter wave radar and a monocular vision sensor for on-road obstacle detection. They also presented a radar-vision coordinate calibration method and the potential obstacle detection algorithm. However, the method, which utilizes the shadows underneath the vehicle to estimate the left-right boundary, is not suitable for VIP assistance field which needs to consider versatile and complex environments. Kim and Jeon [28] presented a multiple object tracking system which combined a cheap radar module and a CCD camera. The data fusion method based on multiple Kalman filters had been proposed to process measurements from two different kinds of physical sensors. However, the radar was not able to give the angle of different objects. The data fusion would be inappropriate when two objects appeared at the same distance but in different directions.
Only a few works have been dedicated to fusing the radar and the stereo vision system. Fang et al. [29] proposed a sensor fusion method that makes use of coarse target depth information provided by radar or the stereo vision system to segment target locations in video images. The segmentation algorithm is clear, but the target depth information provided by the radar might be erroneous measurement because of the ground clutter. Wu et al. [22] proposed a fusion approach to accurately estimate the location, size, pose and motion information of a threat vehicle by using both stereo cameras and radar. However, the method of contour point extraction and contour fitting was complex and not necessary because the measurement results of the stereo cameras were not accurate when the objects were too remote. Kim et al. [30] developed a firefighting robot system based on the stereo infrared vision and radar sensor to solve the obstacles detection in fire smoke-filled environments which feature low visibility and high temperature. They also described the basic principle of

4 / 24
FMCW radar and the image processing algorithm. However, the ability of the radar was limited, and the direction of different objects was not confirmed. The matching strategy of obstacles close to each other, which are detected by the stereo vision and radar, is not considered. Molchanov et al. [31] proposed a multiple sensor system for accurate and power efficient recognition of dynamic hand gesture for car drivers, by using a short-range radar, a color camera, and a depth camera. They employed convolutional deep neural networks to fuse data from multiple sensors and to classify the gestures. However, the detectable range of this system was less than one meter and was not fit for within VIP assistance domain. Ćesić et al. [19] addressed the detection and tracking of moving objects by using a radar and a stereo camera. They proposed a data fusion method based on the extended Kalman filter on Lie Groups and the joint integrated probabilistic data association filter. They built the accurate uncertainty modeling at the same time. However, this system was designed for the advanced driver assistance systems (ADAS), while its size was big, and its energy consumption was great. Obrvan et al. [20] proposed a method for vehicle detection by employing stereo vision system and radar units. The contour extraction algorithm was executed based on only stereo image then generating the information about the vehicles’ position. But the radar readings were only used to verify the detections basing on the stereo vision, and the fusion results were not stated.
There is almost none specialized radar and stereo vision fusing system for VIP assistance. Although plenty of related work have been done to achieve objects detection by fusing the radar and the stereo vision system, most of them are part of automobile ADAS. Compared with these works, the main advantages of our system can be summarized as follows:
The fusion system based on the low power MMW radar and the RGB-D sensor is specially optimized to help VIP perceive and avoid the obstacles. This system has the characteristics of small size, low energy consumption and cost-effectiveness.
The RGB-D sensor uses a combination of active projecting and passive stereo matching, which has a good environment adaptability. The image processing, such as contour extraction, is executed at the depth image. The MMW radar has the ability of angle distinguish, and the angle resolution is about 15°. The matching problem of two same range obstacles in different directions to be detected by the RGB-D sensor and radar is solved.
The sensor fusion is performed at the objects detection level. The coordinate calibration between the RGB-D sensor and the MMW radar is accomplished.
This assisting system uses a non-semantic stereophonic interface to transfer the detection results to VIP.
3. Methodology
In this section, the system hardware configuration is detailed described firstly. Then the FMCW basic principle and the feature extraction on the depth image are introduced. The calibration between the RGB-D sensor coordinate and the MMW radar coordinate is achieved. At last, the data fusion and the non-semantic stereophonic interface are presented.

5 / 24
3.1 System configuration
In our application, we have utilized Intel RealSense R200 stereo vision system [32] and a TI short range radar evaluation board [33], as illustrated in Figure 1(a). They are mounted on a framework fabricated by 3D printing and their position is fixed. The sensors are closely spaced at about a same plane, while the sensor fusion is performed at the objects detection level. Since the radar measurements is coarse in nature, the current fixed mode is sufficiently precise to achieve the data fusion.
Figure 1. The hardware configuration. (a) Experimental platform equipped with the RealSense R200 and the TI short
range radar evaluation board. The size of the R200 and radar evaluation board is so small that they are portable, and a credit card is placed nearby for comparison. They are closely mounted on a framework fabricated by 3D printing and their position is fixed. (b) The RealSense R200 module is shown without reinforcement frame, it includes two infrared cameras (right and left), an infrared laser projector, a color camera and an image processor.
The RealSense R200 developed by the Intel company uses a combination of active projecting and passive stereo matching [32], as shown in Figure 1(b). It includes two infrared cameras (right and left), an infrared laser projector, a color camera and an image processor. The infrared laser projector projects static non-visible near-infrared patterns on the scene [2], then the scatter is acquired by the right and left infrared cameras. The image processor generates a depth map through the embedded stereo-matching algorithm. With the principle of active projecting and passive stereo matching, the performance of RealSense R200 is excellent under indoor and outdoor circumstances [2]. The R200 is quite suitable for VIP navigation because of its environment adaptability, small size and cost-effectiveness.
However, the effective depth range of the RealSense R200 is short, and the range accuracy is reduced when the depth exceeds the general detectable range of 650-2100 mm [2]. On the contrary, the range accuracy of the MMW radar based on the principle of FMCW is high and the measurements results are stable. We take the TI short range radar system in our system. The TI IWR1642BOOST evaluation board, as shown in Figure 1(a), is a short-range radar system basing on the IWR1642 radar chip[33]. The IWR1642 device is an

6 / 24
integrated single-chip MMW sensor based on FMCW radar technology capable of operation in the 76 to 81 GHz band with up to 4 GHz continuous chirp. The IWR1642 is an ideal solution for low-power, self-monitored, ultra-accurate radar systems in the industrial and consumer electronics applications.
The sensor features and the Field of View (FOV) also need to be considered. The RealSense R200 uses a combination of active projecting and passive stereo matching. The color camera image resolution is 1920×1080 pixels with rolling shutter, the horizontal and the vertical field of view is 70° and 43° respectively. The experiments are carried out at the resolution is 640×480 pixels in order to improve the efficiency. Meanwhile, we want to project depth information into a color map to get the depth information of the corresponding data point. And depth images produced by the infrared camera is 640×480 pixels, the horizontal and the vertical field of view is 59° and 46° respectively. The stereo image synchronization is executed internally, while the results are recorded in the auto-exposure mode of the camera. The antenna FOV of the MMW radar (IWR1642EVM) is ±60° with angular resolution of approximately 15°.
3.2 Frequency modulated continuous wave
FMCW radar is a technique that obtains range and velocity information from a radar by the way of frequency modulating a continuous signal[34]. The frequency modulation takes many forms, and the linear frequency modulation is the most common used. The basic principle of the sawtooth modulation is illuminated in Figure 2.
The transmitted signal is frequency modulated by a periodic saw-wave [35]. The received signal is a copy
one including the frequency shift (Doppler shift, df ) and the time delay τ , as shown in Figure 2(a). The
BWf is the modulation bandwidth, and T is the modulation period or sweep time. The Doppler shift is
caused by the relative motion between the object and the radar. The signal traveling between the object and the radar causes the time delay. The frequency difference between the transmitted and received signal is called “beat frequency”, which carries the range and velocity information, as shown in Figure 2(b). For saw-wave modulation, the range and velocity of the objects are difficult to measure because of the Range-Doppler coupling effect. We obtain the range, velocity and angle information of different objects through three FFT, as shown in Figure 2(c).

7 / 24
Figure 2. The basic principle of the FMCW radar with the sawtooth shape modulation. (a) The transmitted and received
signal. (b) The corresponding beat frequency. (c) The beat signal processing flow. We acquire a number of chirps’ ADC data, organize them in the form of a matrix, where each column of
the matrix stands for the beat signal of a single chirp (Figure 2(c1)). This single chirp beat signal consisting of multiple target should be processed using a Fast Fourier Transform (FFT) in order to separate the different range objects. Fourier transform processing will result in a frequency spectrum that has separate peaks and each peak denotes the presence of an object at a specific distance. This processing is called the range-FFT and the result is shown in Figure 2(c2). The range-FFT corresponding to each chirp will have peaks in the same location, but with a different phase. The measured phase difference corresponds to the moving velocity.
However, the velocity measurement method based on the two close chirps does not work when multiple moving objects with different velocities and same distance to the radar appear at the time of measurement. An FFT on the sequence of phasors corresponding to the range-FFT peaks resolves this problem nicely. This processing is called the Doppler-FFT and the result is shown in Figure 2(c3).
The range-FFT and Doppler-FFT do not work when two objects with equidistant and same velocity relative to the radar appear. Then the angle of arrival needs to be estimated. Angle estimation is based on the phase change in the peak of the range-FFT or Doppler-FFT because of differential distance from the object to each of the antennas, which requires at least 2RX antennas. Similarly, a FFT on the sequence of phasors corresponding to the 2D-FFT (range-FFT and Doppler-FFT) peaks resolves the angle estimation problem. This is called angle-FFT and the result is shown in Figure 2(c4).
After three FFT, the range, velocity and angle information of objects are obtained. Besides these above issues, some other problems need to be considered, such as, the pre-processing of the raw ADC data, the constant false alarm rate (CFAR), and so on. However, these topics are out of scope of this paper and not discussed.

8 / 24
3.3 Linearization
The linearity quality of the chirps has a direct effect on the beat signal, as the Figure 2(a) manifested, then the range measurement precision is affected. Methods for linearizing FMCW radar signal can be classified into two categories, open-loop and closed-loop methods [36]. Closed-loop methods act continually during the radar signal transmission to ensure a continuous frequency lock [36], which offers high linearity performance. The IWR1642 device has an excellent chirp linearity based on the closed-loop PLL which is used to synthesize the precise and linear chirp. The device also includes a built-in radio processor for RF calibration and safety monitoring.
In order to evaluate the linearity of chirps and the reliability of radar, we performed the verification experiment with a stationary trihedral corner (diameter about 12 inches), as shown in Figure 3(a)(b). The trihedral corner is placed in front of the radar, while different distances are measured by the radar. The real distances between the trihedral corner and the radar are measured at the same time using the laser range finder and the ruler. The observed relationship between the radar measurements and the real distances is shown in Figure 3(c). The deviation between the radar measurement and the real distance is very small, which illustrates that the chirp linearity is very good. The strongly linear nature of this relationship is one of the important evidences for the high reliability of the radar system.
Figure 3. The verification experiment on the linearity of chirps and the reliability of radar. (a) The trihedral corner is
placed in front of the radar. (b) The radar trihedral corner used in this paper. (3) The relationship between the radar measured distance and the corresponding real distance.
3.4 Feature extraction
The main goal of the feature extraction on the depth image is to detect stationary and moving objects in the scene. However, this paper focuses on the fusion of two sensors, hence the feature extraction on the depth image is only briefly described.
Compared with the ordinary digital image processing on the color image, this paper achieves the objects detection function on the depth image produced by the RealSense R200. As the Figure 4 shown, the obstacles are detected in indoor and outside environment, the color images are shown in Figure 4(a1-a4), and the depth images are shown in Figure 4(b1-b4). The MeanShift algorithm [37] is applied to detect the objects in the depth images, the detection results are shown in Figure 4(c1-c4). The detected objects are indicated by the red bounding box. The application domains of the MeanShift algorithm include cluster analysis in computer vision and image processing. Herein, we use the MeanShift to detect objects with the help of depth differences in the

9 / 24
depth images and achieve it using the OpenCV. We utilize the depth images directly produced by the RealSense R200. The IR projector of the R200
projects static non-visible near-IR patterns on the scene, which is acquired by the left and right IR cameras. In texture less indoor environments, such as the a1 and a2 scene in the Figure 4, the projected patterns enrich textures, which makes the depth images dense within a certain distance. However, in sunny outdoor environments, the projected patterns are partly submerged by sunlight. And the power of IR laser projector is limited. Simultaneously, for the stereo cameras, since depth error increases with the increase of the depth value, stereo cameras are prone to be unreliable in the distance. These make the depth information of the R200 much less accurate than that in the normal working distance ranging from 650-2100 mm.
In addition, the FOV of the IR projector and the IR camera is limited. Both vertical and horizontal FOV of the R200 IR projector are 60 5° ± ° . The vertical and horizontal FOV of the R200 IR camera is 46 5° ± ° and 59 5° ± ° respectively. These reasons make the metal bar object bottom part lack the effective reflected near-IR patterns, the depth images disappear at the corresponding region, and the depth error occurs, such as the a3 and a4 scene in the Figure 4.
The distance of the detection object is decided by the average depth in the red bounding box. The
detection object coordinates ( ),u v in the pixel coordinate system is the center of the red bounding box, then
the coordinate ( ), y ,c c cx z of the detection object in the camera coordinate system is acquired with the help
of the camera intrinsic and extrinsic parameters.
Figure 4. The object detection and feature extraction on the depth image. (a1-a4) The color images, the objects are
detected in indoor and outside environments. (b1-b4) The depth images. (c1-c4) The detection results based on the MeanShift algorithm, the objects are indicated using the red bounding box.
3.5 Calibration
In multiple sensor system, each sensor performs measurements in its own coordinate system. Thus, one needs to transform these measurements into a global coordinate system.

10 / 24
Figure 5. The RGB-D sensor coordinate and MMW radar coordinate.
In this paper, the standard pinhole model is assumed for the camera. As shown in Figure 5, the ( ), ,c c cx y z
and ( ),u v are the camera coordinate and the image plane coordinate respectively. The relationship between
them is described as equation (1). The xf , yf , xc , and yc are the ,x y direction focus length and
principal point coordinates respectively, and the K is the matrix of intrinsic parameters.
0
01 0 0 1
c x x c
c c y y c
c c
u x f c xz v K y f c y
z z
= =
. (1)
The position of a target is represented as ( ), ,r r rx y z in radar coordinate, as shown in Figure 5. The ry
coordinate has no meaningful value since the radar just gives azimuth information in 2D with no information on pitch angle in the 3D plane. The calibration matrix RTM (including the rotation R and translation T)
between the camera coordinate ( ), ,c c cx y z and the radar coordinate ( ),r rx z is obtained through
11 12 13
21 22 23
31 32 331 1
c r rRT
c r r
c
x x m m m xy M z m m m zz m m m
= =
. (2)
where the calibration matrix RTM is made up of 9 elements. We use the linear least square (LS) method with the help of 46 data points to estimate the calibration matrix RTM . Image and radar targets are extracted and matched manually, then the matched data point is acquired, as the Figure 6 shown. The 5 targets are placed at different height and depths, as the color image shown in the Figure 6(a). They are detected by the RGB-D sensor and MMW radar simultaneously, and the detection results are shown in Figure 6(b) and (c) respectively. The corresponding pixels on the depth image and the radar detection points are matched manually, then the matched data point is acquired. We manually select the region with accurate depth to accomplish this calibration. More different matched data can be obtained by changing the relative position of the sensors and targets.

11 / 24
Figure 6. The processing procedure of the matched data point. (a)The color image including 5 targets which are placed
at different height and depths. (b)The RGB-D sensor detection results. (c) The MMW radar detection results. The corresponding pixels on the depth image and radar points are matched manually, then the matched data point is acquired.
In our paper, the calibration matrix RTM between the RGB-D sensor coordinate and the MMW radar coordinate is:
1.0225 0.0039 0.01290.0315 0.0099 0.13090.0269 1.0190 0.0107
RTM− −
= − − −
(3)
Compared with the ordinary color images, the object which is detected by the MMW radar becomes a
line when it is projected onto the depth image, because the ry coordinate has no meaningful value in the
radar coordinate system. The actual effect is shown in Figure 7. The object is detected by the RGB-D sensor and MMW radar at the same time. The MMW radar detection result is projected on the depth image and represented by the green line.
Figure 7. The object is detected by the RGB-D sensor and MMW radar simultaneously. (a)The color image. (b)The depth
image, the MMW radar detection result is projected on the depth image and represented by the green line. As shown in Figure 7(b), the red bounding box is the detection result of the RGB-D sensor, its depth
value (2.906 m) is different from the radar detection result (2.961 m). It is very necessary to fuse the information from these two different sensors together to improve the stability and accuracy of the whole system. The fusion method based on the Kalman filter is described in the next subsection.

12 / 24
3.6 Data fusion
As mentioned above, the object position in x z− plane is measured by the two sensors. After calibration, we obtain two sets of measurements on the common plane. Considering the sensors resolution, noise and errors, we propose data fusion based on Kalman filtering [28] to obtain more accurate state estimate.
Intuitively, the detection results are more reliable when collecting as many data as possible. However, just collecting data from different sources without efficient fusion rule could seriously degrade the quality of an estimate even with large amount of data [28]. Therefore, we propose data fusion methods based on the Kalman filter. The fundamental formulation of the Kalman filter is a Bayesian filtering framework. The Kalman filter is a set of mathematical equations that provides an efficient computational means to estimate the state of a process, in a way that minimizes the mean of the squared error [38]. The filter is very powerful in several aspects. Here, we apply it in multiple sensor data fusion.
The Kalman filter achieves the data fusion function based on the predict and update algorithm. Here, we introduce the multivariate form equations of the Kalman filter briefly.
Prediction:
T
x Fx Bu
P FPF Q
= +
= +, (4)
where ,Px are the state mean and covariance. F is the state transition function, when multiplied by x it
computes the prior. Q is the process covariance. u is the control input, and B is the control input model or control function.
Update:
( )
( )
1
1
T T
y z H x
K PH H PH R
x x Ky
P KH P
−
= −
= +
= +
= −
(5)
where, H is the measurement function. ,z R are the measurement mean and noise covariance. y and K are the residual and Kalman gain. In this paper, the z matrix is composed of the RGB-D detection result
( ), ,x y z and the MMW radar detection result ( ), ,x z v . The x matrix is the data fusion result, that is
( ), , ,x y z v . The B and u parameters are ignored. The Q and R matrix are optimized based on the
characteristics of the sensor fusion system and the data fusion performances. The specific implementation of the Kalman filter is accomplished using OpenCV.
The main task of the data fusion is to detect the position and velocity information of multiple object with more than one sensor and fusion them. However, the Kalman filter, which is unimodal, is not able to achieve the multiple object information fusion at the same time. The JPDA algorithm [19,28], which is one of most efficient data association algorithms under cluttered environments, approaches the multiple target tracking problem. The JPDA algorithm calculates the association probabilities to the target being tracked for each validated measurement at the current time [39]. This probabilistic or Bayesian information is used in the JPDA
13 / 24
tracking algorithm, which includes the steps of prediction, measurement validation, data association and state estimation. The detailed instructions and calculation steps are explained in the literature [39], here we are no longer to repeat.
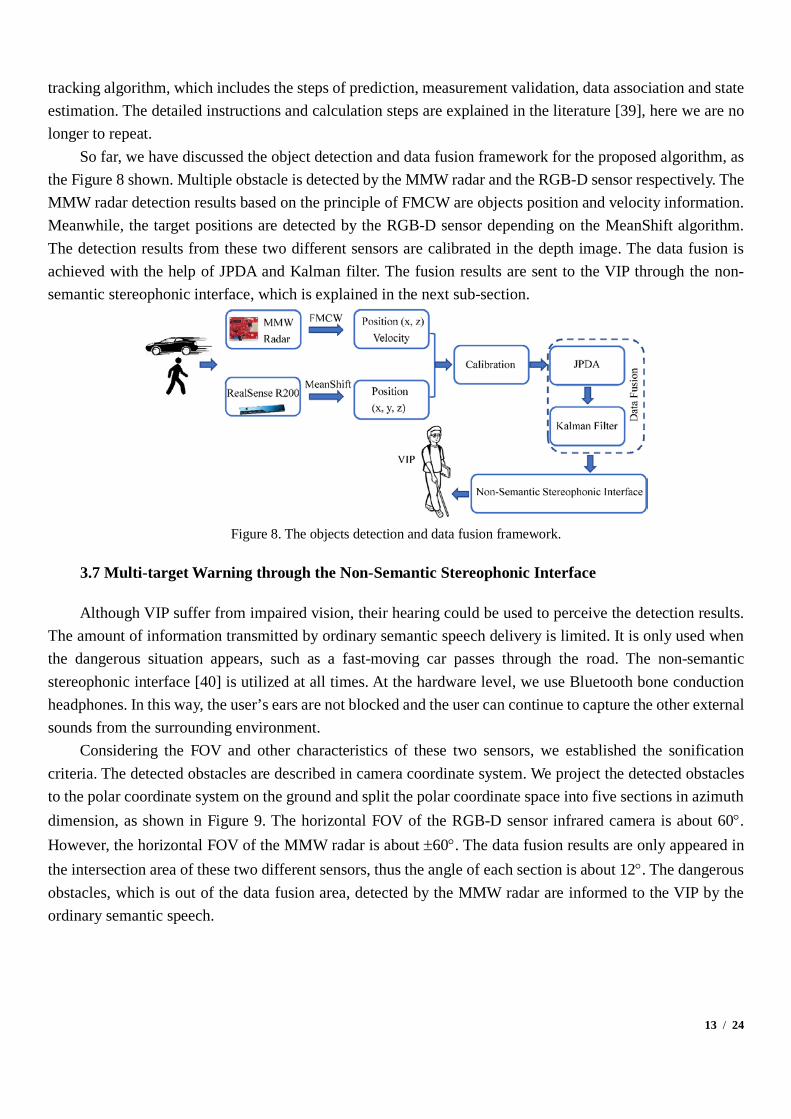
So far, we have discussed the object detection and data fusion framework for the proposed algorithm, as the Figure 8 shown. Multiple obstacle is detected by the MMW radar and the RGB-D sensor respectively. The MMW radar detection results based on the principle of FMCW are objects position and velocity information. Meanwhile, the target positions are detected by the RGB-D sensor depending on the MeanShift algorithm. The detection results from these two different sensors are calibrated in the depth image. The data fusion is achieved with the help of JPDA and Kalman filter. The fusion results are sent to the VIP through the non-semantic stereophonic interface, which is explained in the next sub-section.
Figure 8. The objects detection and data fusion framework.
3.7 Multi-target Warning through the Non-Semantic Stereophonic Interface
Although VIP suffer from impaired vision, their hearing could be used to perceive the detection results. The amount of information transmitted by ordinary semantic speech delivery is limited. It is only used when the dangerous situation appears, such as a fast-moving car passes through the road. The non-semantic stereophonic interface [40] is utilized at all times. At the hardware level, we use Bluetooth bone conduction headphones. In this way, the user’s ears are not blocked and the user can continue to capture the other external sounds from the surrounding environment.
Considering the FOV and other characteristics of these two sensors, we established the sonification criteria. The detected obstacles are described in camera coordinate system. We project the detected obstacles to the polar coordinate system on the ground and split the polar coordinate space into five sections in azimuth dimension, as shown in Figure 9. The horizontal FOV of the RGB-D sensor infrared camera is about 60°. However, the horizontal FOV of the MMW radar is about ±60°. The data fusion results are only appeared in the intersection area of these two different sensors, thus the angle of each section is about 12°. The dangerous obstacles, which is out of the data fusion area, detected by the MMW radar are informed to the VIP by the ordinary semantic speech.
14 / 24
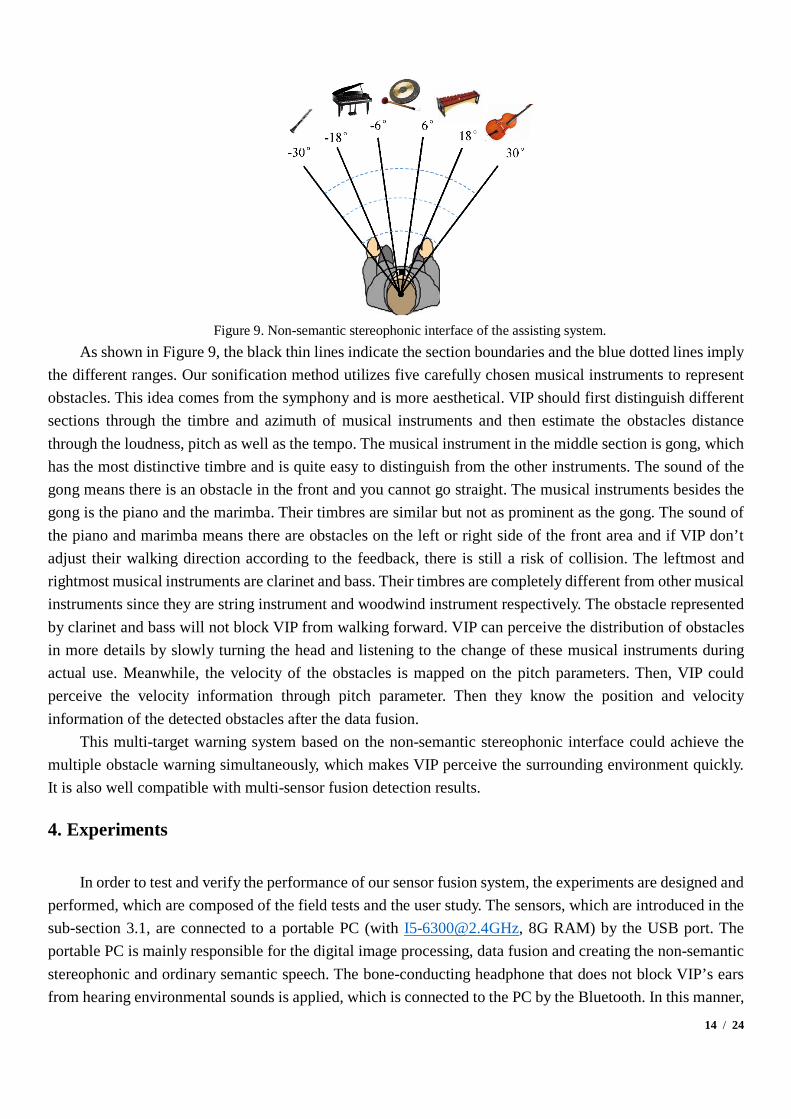
Figure 9. Non-semantic stereophonic interface of the assisting system.
As shown in Figure 9, the black thin lines indicate the section boundaries and the blue dotted lines imply the different ranges. Our sonification method utilizes five carefully chosen musical instruments to represent obstacles. This idea comes from the symphony and is more aesthetical. VIP should first distinguish different sections through the timbre and azimuth of musical instruments and then estimate the obstacles distance through the loudness, pitch as well as the tempo. The musical instrument in the middle section is gong, which has the most distinctive timbre and is quite easy to distinguish from the other instruments. The sound of the gong means there is an obstacle in the front and you cannot go straight. The musical instruments besides the gong is the piano and the marimba. Their timbres are similar but not as prominent as the gong. The sound of the piano and marimba means there are obstacles on the left or right side of the front area and if VIP don’t adjust their walking direction according to the feedback, there is still a risk of collision. The leftmost and rightmost musical instruments are clarinet and bass. Their timbres are completely different from other musical instruments since they are string instrument and woodwind instrument respectively. The obstacle represented by clarinet and bass will not block VIP from walking forward. VIP can perceive the distribution of obstacles in more details by slowly turning the head and listening to the change of these musical instruments during actual use. Meanwhile, the velocity of the obstacles is mapped on the pitch parameters. Then, VIP could perceive the velocity information through pitch parameter. Then they know the position and velocity information of the detected obstacles after the data fusion.
This multi-target warning system based on the non-semantic stereophonic interface could achieve the multiple obstacle warning simultaneously, which makes VIP perceive the surrounding environment quickly. It is also well compatible with multi-sensor fusion detection results.
4. Experiments
In order to test and verify the performance of our sensor fusion system, the experiments are designed and performed, which are composed of the field tests and the user study. The sensors, which are introduced in the sub-section 3.1, are connected to a portable PC (with [email protected], 8G RAM) by the USB port. The portable PC is mainly responsible for the digital image processing, data fusion and creating the non-semantic stereophonic and ordinary semantic speech. The bone-conducting headphone that does not block VIP’s ears from hearing environmental sounds is applied, which is connected to the PC by the Bluetooth. In this manner,

15 / 24
the proposed data fusion system achieves the running speed of around 10 FPS.
4.1 Field tests
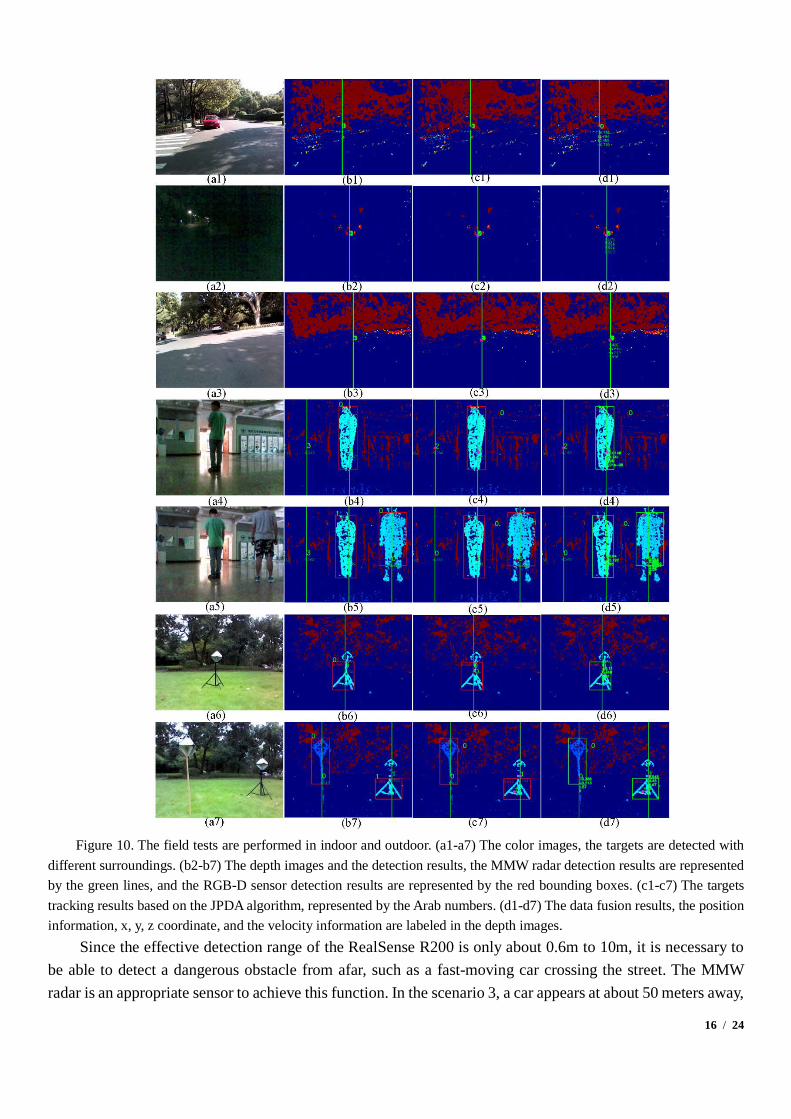
The field tests are designed and performed with different surroundings, as shown in Figure 10. The color images are presented in a1-a7, the targets are detected with different surroundings. The depth images produced by the RGB-D sensor are shown in b1-b7. The depth images detection results based on the MeanShift algorithm are represented by the red bounding boxes. Meanwhile, the detection results of the MMW radar are projected on the corresponding depth images, which are represented by the green lines. The multiple target tracking results based on the JPDA algorithm, which represented by numbers, are shown in c1-c7. The data fusion results based on the Kalman filter, which includes the position information (x, y, z coordinate) and the velocity information, are labeled in the depth images. They are described in d1-d7.
In the scenario 1, a red car is parked on the roadside at noon when the sunlight is very strong, as the Figure 10(a1) illustrated. The depth image coming from the RGB-D sensor is very sparse because of the illumination. The car could not be detected by the RGB-D sensor, as the Figure 10(b1) shown. Nevertheless, the MMW radar detection result is stable, the detection and track results are described at Figure 10(b1) and (c1) respectively. The data fusion result is shown in Figure 10(d1), which only includes the ,x z coordinate and the velocity information because of lacking the information from the RGB-D sensor. Similarly, a car is parked on the roadside at nightfall in the scenario 2, as shown in Figure 10(a2). It is not found in the depth image because the quality of the depth image declines when the lights dim. The MMW radar detection results, by contrast, are stable. The detection and track results of the MMW radar and the RGB-D sensor are described in Figure 10(b2) and (c2), while the last data fusion results are shown in Figure 10(d2), which reveals the effectiveness of our approach even with low illumination. In this sense, our fusion system enhances the robustness of obstacle detection across different illumination conditions.
16 / 24
Figure 10. The field tests are performed in indoor and outdoor. (a1-a7) The color images, the targets are detected with
different surroundings. (b2-b7) The depth images and the detection results, the MMW radar detection results are represented by the green lines, and the RGB-D sensor detection results are represented by the red bounding boxes. (c1-c7) The targets tracking results based on the JPDA algorithm, represented by the Arab numbers. (d1-d7) The data fusion results, the position information, x, y, z coordinate, and the velocity information are labeled in the depth images.
Since the effective detection range of the RealSense R200 is only about 0.6m to 10m, it is necessary to be able to detect a dangerous obstacle from afar, such as a fast-moving car crossing the street. The MMW radar is an appropriate sensor to achieve this function. In the scenario 3, a car appears at about 50 meters away,

17 / 24
shown in Figure 10(a3). It is not found in the depth image because of the limited perception range of the RGB-D sensor, as described in Figure 10(b3). Still, the car is correctly detected with the help of the MMW radar, and the detection and track result are indicated in Figure 10(b3) and (c3), respectively. The data fusion result except the y coordinate information is labelled in Figure 10(d3). In this regard, the effective detection range of the fusion system has been significantly expanded (maximum to 80 meters for a car) compared to the detection with only RGB-D sensor.
Compared with the above situations, RGB-D sensor could detect the obstacles at most cases when the illumination and distance are suitable for its perception. As shown in Figure 10(a4) and (a5), one or multiple person stands in the hallway. The detection results from the RGB-D sensor and the MMW radar are described in Figure 10(b4) and (b5). The track results could be found in Figure 10(c4) and (c5). The obstacles detection information, the , ,x y z coordinate position and the velocity information, is decided by the sensor fusion, which is mapped and labelled in the depth image, as shown in Figure 10(d4) and (d5). The y coordinate is added compared to the detection with radar only. The velocity information is added and the z coordinate is more accurate compared to the detection with only RGB-D sensor. Meanwhile, the field tests are performed at the outside, as shown in Figure 10(a6) and (a7), one or multiple radar trihedral corner is placed in a courtyard. The detection, tracking and data fusion results are similar to the indoor experiments, which are illuminated in Figure 10 (b6)(b7), (c6)(c7) and (d6)(d7) respectively. Compared with the single RGB-D sensor or the single MMW radar, the data fusion enriches the detection results, increases the accuracy and improves the robustness of the prototype.
In order to analyze the detection, tracking and fusion effect in different scenes quantitatively, we save the field test processing results respectively and then give the statistical results, which are shown in Table 1. During the experiments, we record the corresponding video, then analyze each frame of them. The tracking process of the radar detection result and RGB-D sensor detection result is executed respectively. The data fusion is accomplished after the radar tracking being succeeded when only radar works. When the radar and RGB-D sensor works simultaneously, the data fusion is carried out after the last sensor accomplishing the tracking.
Table 1. The detection, tracking and fusion statistical results Scene 1 2 3 4 5 6 7
Total images 142 167 157 118 153 125 134
Radar detection 141 167 157 118 153 125 134
99.3% 100% 100% 100% 100% 100% 100%
RGB-D detection 1 2 0 118 135 120 130
0.7% 1.2% 0.0% 100% 88.2% 96.0% 97.0%
Radar Tracking 127 160 149 110 145 117 128
89.4% 95.8% 94.9% 93.2% 94.8% 93.6% 95.5%
RGB-D Tracking 0 0 0 105 133 110 118
0.0% 0.0% 0.0% 89.0% 86.9% 88.0% 88.1%
Fusion 127 160 149 105 133 110 118
89.4% 95.8% 94.9% 89.0% 86.9% 88.0% 88.1% According to the statistical results from Table 1, the MMW radar detection results are stable when the
scene changes. The obstacles are detected successfully by the radar in all frames except one frame in the scene 1. However, almost no effective targets are detected by the RGB-D sensor in the scene 1, 2 and 3 because of

18 / 24
the improper illumination and detection distance. The percentage of obstacles detected by the RGB-D sensor in scene 4, 5, 6 and 7 is 100%, 88.2%, 96.0%, 97.0% respectively, which shows that most obstacles could be perceived when the environment is proper. It takes several frames to accomplish the tracking function after the detection owing to the JPDA algorithm. For the RGB-D sensor, it takes about 13 to 20 frames to complete the tracking according to the data in the scene 4, 5, 6 and 7. Compared with the RGB-D sensor, the radar requires fewer frames to achieve the tracking because of the fewer feature points. With the help of tracking, accidental detection error in someone frame can be avoided. The data fusion based on the Kalman filter is achieved when the obstacles are tracked successfully. There are about 89.4%, 95.8%, 94.9% images prompting data fusion results in the scene 1, 2 and 3 when only radar works. Contrast, when the radar and RGB-D sensor work simultaneously, there are about 89.0%, 86.9%, 88.0%, 88.1% images prompting data fusion results in the scene 4, 5, 6 and 7 respectively. Compared with only one radar sensor, although the data fusion between the radar and RGB-D sensor takes more time, we could get more accurate state estimation and more robust measurement results.
The field tests show the different ranges and angles of the objects are calculated by the MMW radar based on the principle of FMCW. The feature extraction on the depth image is achieved based on the MeanShift algorithm, and the depth and position information of the obstacles is obtained. The obstacles are tracked successfully based on the JPDA algorithm. The data fusion is achieved by the Kalman filter method. The obstacles effective detection range is expanded compared to the detection with only RGB-D sensor. With the help of the data fusion, we have achieved more accurate state estimation and rich information. Moreover, the measurement results are stable under diverse illumination conditions.
4.2 The performance evaluation at different ranges
In order to verify the performance of our sensor fusion system at different ranges, the experiments are designed and performed. As shown in Figure 11, the car is placed at roadside. We measure the different distances between the car and our system, and the distance of 2m, 4m, 8m, 15m, 20m, 30m and 40m are selected. The 50-meter leather tape box ruler is placed on the ground to get the accurate range. The color images are presented in a1-a7. The depth images are shown in b1-b7, and the detection results are represented by the red bounding boxes. Meanwhile, the detection results of the MMW radar are projected on the corresponding depth images, which are represented by the green lines. The multiple target tracking results based on the JPDA algorithm, which represented by numbers, are shown in c1-c7. The data fusion results based on the Kalman filter, which includes the position information (x, y, z coordinate) and the velocity information, are labeled in the depth images. They are described in d1-d7.
The car is detected by the depth images and the MMW radar simultaneously when the distance is 2m and 4m, as the Figure 11 (b1) and (b2) said. Then, the detection results are successfully tracked, as shown in (c1) and (c2). At last, the data fusion results are labeled on the depth images, as the (d1) and (d2) illustrated. However, the depth images lack effective detection information when the distance exceeds 4m. By contrast, the MMW radar still keeps accurate range perception ability, as shown in b3-b7. We get the distance between the car and our system through the data fusion, as the d3-d7 illustrated. But the y coordinate is meaningless due to the lack of the effective detection information coming from the depth images. At last, the RGB-D sensor detection results, the MMW radar detection results, the data fusion results and the corresponding ground truth

19 / 24
at different ranges are listed in the Table 2. It can be seen that the distance measurement accuracy is high and keeps stable at different ranges with the help of RGB-D sensor and MMW radar.
Figure 11. The performance evaluation at different ranges. (a1-a7) The color images, the targets are detected with
different ranges, which are 2m, 4m, 8m, 15m, 20m, 30m and 40m. The 50-meter leather tape box ruler is placed on the ground to get the accurate range. (b2-b7) The depth images and the detection results, the MMW radar detection results are represented
20 / 24
by the green lines, and the RGB-D sensor detection results are represented by the red bounding boxes. (c1-c7) The targets tracking results based on the JPDA algorithm, represented by the Arab numbers. (d1-d7) The data fusion results, the position information, x, y, z coordinate, and the velocity information are labeled in the depth images.
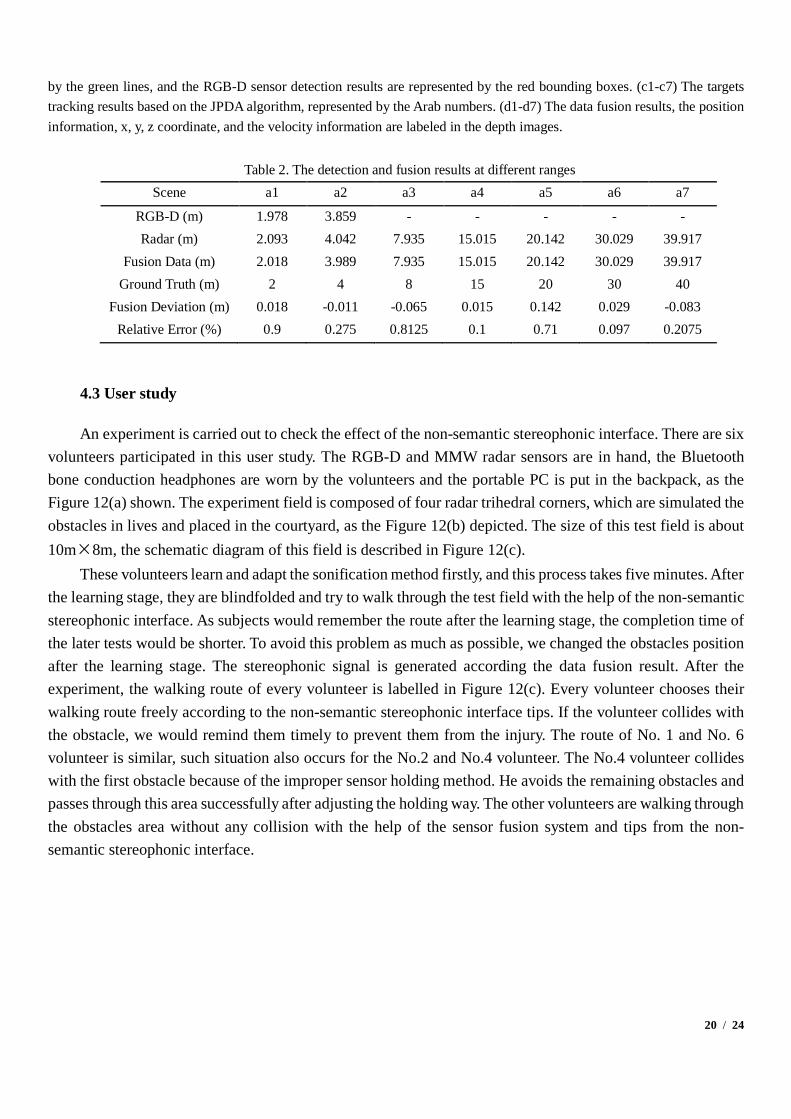
Table 2. The detection and fusion results at different ranges
Scene a1 a2 a3 a4 a5 a6 a7
RGB-D (m) 1.978 3.859 - - - - - Radar (m) 2.093 4.042 7.935 15.015 20.142 30.029 39.917
Fusion Data (m) 2.018 3.989 7.935 15.015 20.142 30.029 39.917 Ground Truth (m) 2 4 8 15 20 30 40
Fusion Deviation (m) 0.018 -0.011 -0.065 0.015 0.142 0.029 -0.083 Relative Error (%) 0.9 0.275 0.8125 0.1 0.71 0.097 0.2075
4.3 User study
An experiment is carried out to check the effect of the non-semantic stereophonic interface. There are six volunteers participated in this user study. The RGB-D and MMW radar sensors are in hand, the Bluetooth bone conduction headphones are worn by the volunteers and the portable PC is put in the backpack, as the Figure 12(a) shown. The experiment field is composed of four radar trihedral corners, which are simulated the obstacles in lives and placed in the courtyard, as the Figure 12(b) depicted. The size of this test field is about 10m×8m, the schematic diagram of this field is described in Figure 12(c).
These volunteers learn and adapt the sonification method firstly, and this process takes five minutes. After the learning stage, they are blindfolded and try to walk through the test field with the help of the non-semantic stereophonic interface. As subjects would remember the route after the learning stage, the completion time of the later tests would be shorter. To avoid this problem as much as possible, we changed the obstacles position after the learning stage. The stereophonic signal is generated according the data fusion result. After the experiment, the walking route of every volunteer is labelled in Figure 12(c). Every volunteer chooses their walking route freely according to the non-semantic stereophonic interface tips. If the volunteer collides with the obstacle, we would remind them timely to prevent them from the injury. The route of No. 1 and No. 6 volunteer is similar, such situation also occurs for the No.2 and No.4 volunteer. The No.4 volunteer collides with the first obstacle because of the improper sensor holding method. He avoids the remaining obstacles and passes through this area successfully after adjusting the holding way. The other volunteers are walking through the obstacles area without any collision with the help of the sensor fusion system and tips from the non-semantic stereophonic interface.

21 / 24
Figure 12. The user study experiment. (a) A volunteer with the sensors in hand, the Bluetooth bone conduction
headphones on the head, the portable PC in the backpack. (b) the experiment scene, four radar trihedral corners are placed in the courtyard. (c) The schematic diagram of this experiment, the size of this field is about 10m×8m, the volunteers walk from the start to the end place with the help of this system.
The main goal of this experiment is to gather information related to the completion time and the number of collisions to analyze the performance of the sonification method. Meanwhile, these volunteers are asked to finish a questionnaire to evaluate some other features of this sensor fusion system after the test, which includes whether the prototype is easy to wear, whether the sensor fusion system provides effective guidance information to help them in an unfamiliar environment. The questionnaire and statistical results are shown in Table 3. Their walking time varies and the time difference is not large. The No.4 volunteer’s time is longer than others because of one collision happening. All volunteers answered that the sensor fusion system is useful and could help them navigate through obstacles in an unfamiliar environment. In addition, they also give some advice about this prototype system, which inspired the research direction of our next work.
Table 3. A questionnaire and statistical result User Walking time (s) Collision number Easy to wear? Useful? Advice
Volunteer 1 23 0 Yes Yes Volunteer 2 27 0 Yes Yes Add image recognition function Volunteer 3 26 0 Yes Yes Volunteer 4 30 1 Yes Yes Volunteer 5 23 0 No Yes Make the prototype size smaller Volunteer 6 25 0 Yes Yes
5. Conclusion and future work
In this paper, we presented a sensor fusion system based on the RGB-D sensor and the low power MMW radar sensor to help visually impaired people to perceive and avoid obstacles at a distance. The experiment results show the multiple target with different ranges and angles could be detected by the MMW radar and the RGB-D sensor. The data fusion based on the Kalman filter and JPDA obtains more accurate state estimations. Meanwhile, the effective detectable range of the fusion system is expanded compared to the detection with only RGB-D sensor. Moreover, the measurement results maintain stable when the illumination is changed. The system users could perceive and avoid obstacles with the help of the non-semantic stereophonic interface.

22 / 24
As a wearable system, the sensor fusion system has the characteristics of versatility, portability and cost-effectiveness, which is very suitable for blind navigation application. Simultaneously, this system could be flexibly applied in the field of self-driving, unmanned aerial vehicle (UAV), robotics, surveillance and defence.
For future work, we plan to add the object recognition module which is based on the color images in our system by using deep learning algorithms. And the detection results which come from the MMW radar, depth images and color images are fused simultaneously. The detection results coming from the color images which have higher image resolution make this data fusion system become more robust. Then the smaller obstacles and the objects at lower positions could be detected effectively. At the same time, once objects have been detected by the proposed multiple sensor fusion approach, the type of each object within regions is determined by a convolutional neural network (CNN) algorithm. Additionally, the data fusion algorithm would be achieved in a Field Programmable Gate Array (FPGA) chip. This greatly reduces the size and weight of the system, which is more portable during navigation.
Reference
1. Bourne, R.R.A.; Flaxman, S.R.; Braithwaite, T.; Cicinelli, M.V.; Das, A.; Jonas, J.B.; Keeffe, J.; Kempen, J.H.; Leasher, J.; Limburg, H., et al. Magnitude, temporal trends, and projections of the global prevalence of blindness and distance and near vision impairment: A systematic review and meta-analysis. The Lancet Global Health 2017, 5, e888-e897.
2. Yang, K.L.; Wang, K.W.; Hu, W.J.; Bai, J. Expanding the detection of traversable area with realsense for the visually impaired. Sensors-Basel 2016, 16.
3. Cheng, R.; Wang, K.; Yang, K.; Zhao, X. A ground and obstacle detection algorithm for the visually impaired. In 2015 IET International Conference on Biomedical Image and Signal Processing (ICBISP 2015), IET: Beijing,China, 2015; pp 1-6.
4. Zhao, X.; Wang, K.; Yang, K.; Hu, W. Unconstrained face detection and recognition based on rgb-d camera for the visually impaired, Eighth International Conference on Graphic and Image Processing, 2017; SPIE: p 6.
5. Cheng, R.; Wang, K.; Yang, K.; Long, N.; Hu, W.; Chen, H.; Bai, J.; Liu, D. Crosswalk navigation for people with visual impairments on a wearable device, 2017; SPIE: p 14.
6. Cheng, R.; Wang, K.; Yang, K.; Long, N.; Bai, J.; Liu, D. Real-time pedestrian crossing lights detection algorithm for the visually impaired. Multimedia Tools and Applications 2017.
7. Yang, K.; Wang, K.; Bergasa, L.; Romera, E.; Hu, W.; Sun, D.; Sun, J.; Cheng, R.; Chen, T.; López, E. Unifying terrain awareness for the visually impaired through real-time semantic segmentation. Sensors-Basel 2018, 18, 1506.
8. Liu, J.; Shahroudy, A.; Wang, G.; Duan, L.; Kot, A.C. Ssnet: Scale selection network for online 3d action prediction, 2018 IEEE/CVF Conference on Computer Vision and Pattern Recognition, 18-23 June 2018, 2018; pp 8349-8358.
9. Liu, J.; Shahroudy, A.; Xu, D.; Kot, A.C.; Wang, G. Skeleton-based action recognition using spatio-temporal lstm network with trust gates. IEEE Transactions on Pattern Analysis and Machine Intelligence 2018, 40, 3007-3021.
10. Liu, Y.; Jing, X.; Nie, J.; Gao, H.; Liu, J.; Jiang, G. Context-aware 3d mean-shift with occlusion handling for robust object tracking in rgb-d videos. IEEE Transactions on Multimedia 2018, 1-1.
11. Liu, J.; Liu, Y.; Zhang, G.; Zhu, P.; Chen, Y.Q. Detecting and tracking people in real time with rgb-d camera. Pattern Recognition Letters 2015, 53, 16-23.
12. Yang, K.; Wang, K.; Cheng, R.; Zhu, X. A new approach of point cloud processing and scene segmentation for guiding the visually impaired. In 2015 IET International Conference on Biomedical

23 / 24
Image and Signal Processing (ICBISP 2015), IET: Beijing, China, 2015; pp 1-6. 13. Tamjidi, A.; Ye, C.; Hong, S. 6-dof pose estimation of a portable navigation aid for the
visually impaired. In 2013 IEEE International Symposium on Robotic and Sensors Environments (ROSE), IEEE: Washington, DC, USA, 2013; pp 178-183.
14. Zeng, L.; Prescher, D.; Weber, G. Exploration and avoidance of surrounding obstacles for the visually impaired. In Proceedings of the 14th international ACM SIGACCESS conference on Computers and accessibility, ACM: Boulder, Colorado, USA, 2012; pp 111-118.
15. Lin, K.W.; Lau, T.K.; Cheuk, C.M.; Liu, Y. A wearable stereo vision system for visually impaired. In 2012 IEEE International Conference on Mechatronics and Automation, IEEE: Chengdu, China, 2012; pp 1423-1428.
16. Saez Martinez, J.M.; Escolano Ruiz, F. Stereo-based aerial obstacle detection for the visually impaired. In Workshop on Computer Vision Applications for the Visually Impaired, Marseille, France, 2008.
17. Charvat, G.L. Small and short-range radar systems. CRC Press: New York, 2014. 18. Cippitelli, E.; Fioranelli, F.; Gambi, E.; Spinsante, S. Radar and rgb-depth sensors for fall
detection: A review. IEEE Sensors Journal 2017, 17, 3585-3604. 19. Ćesić, J.; Marković, I.; Cvišić, I.; Petrović, I. Radar and stereo vision fusion for multitarget
tracking on the special euclidean group. Robotics and Autonomous Systems 2016, 83, 338-348. 20. Obrvan, M.; Ćesić, J.; Petrović, I. Appearance based vehicle detection by radar-stereo vision
integration, Cham, 2016; Springer International Publishing: Cham, pp 437-449. 21. Wang, T.; Zheng, N.; Xin, J.; Ma, Z. Integrating millimeter wave radar with a monocular
vision sensor for on-road obstacle detection applications. Sensors-Basel 2011, 11, 8992. 22. Wu, S.; Decker, S.; Chang, P.; Camus, T.; Eledath, J. Collision sensing by stereo vision and
radar sensor fusion. IEEE Transactions on Intelligent Transportation Systems 2009, 10, 606-614. 23. Chavez-Garcia, R.O.; Burlet, J.; Vu, T.D.; Aycard, O. Frontal object perception using radar
and mono-vision, 2012 IEEE Intelligent Vehicles Symposium, 3-7 June 2012, 2012; pp 159-164. 24. Bertozzi, M.; Bombini, L.; Cerri, P.; Medici, P.; Antonello, P.C.; Miglietta, M. Obstacle
detection and classification fusing radar and vision, 2008 IEEE Intelligent Vehicles Symposium, 4-6 June 2008, 2008; pp 608-613.
25. Feng, L.; Sparbert, J.; Stiller, C. Immpda vehicle tracking system using asynchronous sensor fusion of radar and vision, 2008 IEEE Intelligent Vehicles Symposium, 4-6 June 2008, 2008; pp 168-173.
26. Richter, E.; Schubert, R.; Wanielik, G. Radar and vision based data fusion - advanced filtering techniques for a multi object vehicle tracking system, 2008 IEEE Intelligent Vehicles Symposium, 4-6 June 2008, 2008; pp 120-125.
27. Sugimoto, S.; Tateda, H.; Takahashi, H.; Okutomi, M. Obstacle detection using millimeter-wave radar and its visualization on image sequence, Proceedings of the 17th International Conference on Pattern Recognition, 2004. ICPR 2004., 23-26 Aug. 2004, 2004; pp 342-345 Vol.343.
28. Kim, D.Y.; Jeon, M. Data fusion of radar and image measurements for multi-object tracking via kalman filtering. Information Sciences 2014, 278, 641-652.
29. Fang, Y.; Masaki, I.; Horn, B. Depth-based target segmentation for intelligent vehicles: Fusion of radar and binocular stereo. IEEE Transactions on Intelligent Transportation Systems 2002, 3, 196-202.
30. Kim, J.-H.; Starr, J.W.; Lattimer, B.Y. Firefighting robot stereo infrared vision and radar sensor fusion for imaging through smoke. Fire Technology 2015, 51, 823-845.
31. Molchanov, P.; Gupta, S.; Kim, K.; Pulli, K. Multi-sensor system for driver's hand-gesture recognition, 2015 11th IEEE International Conference and Workshops on Automatic Face and Gesture Recognition (FG), 4-8 May 2015, 2015; pp 1-8.
32. Intel. Realsense r200. https://software.intel.com/en-us/realsense (20 May 2018), 33. TI. Iwr1642 single-chip 76-to-81ghz mmwave sensor integrating dsp and mcu evaluation
module. http://www.ti.com/tool/iwr1642boost (20 May 2018),

24 / 24
34. Stove, A.G. Linear fmcw radar techniques. IEE Proceedings F - Radar and Signal Processing 1992, 139, 343-350.
35. Molchanov, P.; Gupta, S.; Kim, K.; Pulli, K. Short-range fmcw monopulse radar for hand-gesture sensing. In 2015 IEEE Radar Conference (RadarCon), IEEE: Arlington, VA, USA, 2015; pp 1491-1496.
36. Rouveure, R.; Faure, P.; Monod, M.O. Description and experimental results of a panoramic k‐band radar dedicated to perception in mobile robotics applications. Journal of Field Robotics 2017, 0.
37. Comaniciu, D.; Meer, P. Mean shift: A robust approach toward feature space analysis. IEEE Transactions on Pattern Analysis and Machine Intelligence 2002, 24, 603-619.
38. Bishop, G.; Welch, G. An introduction to the kalman filter. Proc of SIGGRAPH, Course 2001, 8, 41.
39. Bar-Shalom, Y.; Daum, F.; Huang, J. The probabilistic data association filter. IEEE Control Systems 2009, 29, 82-100.
40. Hermann, T.; Hunt, A.; Neuhoff, J.G. The sonification handbook. Logos Verlag: Berlin: Germany, 2011.