Multi-agent Route Choice Game for Transportation Engineering
23
Multi-agent Route Choice Game for Transportation Engineering Xuan Di * (Corresponding Author) a Department of Civil and Environmental Engineering, University of Michigan, Ann Arbor; b University of Michigan Transportation Research Institute, Ann Arbor. Tel: 734-615-5898; Fax: 734-764-4292; Email: [email protected] Henry X. Liu a Department of Civil and Environmental Engineering, University of Michigan, Ann Arbor; b University of Michigan Transportation Research Institute, Ann Arbor. Tel: 734-764-4354; Fax: 734-764-4292; Email: [email protected] David M. Levinson Department of Civil, Environmental, and Geo- Engineering, University of Minnesota, Twin Cities, Pillsbury Dr. S.E., Minneapolis, MN 55455 Tel: 612-625-6354; Fax: 612-626-7750; Email: [email protected] Word count: 5,271 words text + 8 tables/figures x 250 words (each) = 7,271 words TRR Paper number: 15-5036 Submission Date: March 15, 2015
Transcript of Multi-agent Route Choice Game for Transportation Engineering

Multi-agent Route Choice Game for Transportation Engineering Xuan Di * (Corresponding Author) aDepartment of Civil and Environmental Engineering, University of Michigan, Ann Arbor; bUniversity of Michigan Transportation Research Institute, Ann Arbor. Tel: 734-615-5898; Fax: 734-764-4292; Email: [email protected] Henry X. Liu aDepartment of Civil and Environmental Engineering, University of Michigan, Ann Arbor; bUniversity of Michigan Transportation Research Institute, Ann Arbor. Tel: 734-764-4354; Fax: 734-764-4292; Email: [email protected] David M. Levinson Department of Civil, Environmental, and Geo- Engineering, University of Minnesota, Twin Cities, Pillsbury Dr. S.E., Minneapolis, MN 55455 Tel: 612-625-6354; Fax: 612-626-7750; Email: [email protected] Word count: 5,271 words text + 8 tables/figures x 250 words (each) = 7,271 words TRR Paper number: 15-5036 Submission Date: March 15, 2015

Di, Liu, Levinson 2
ABSTRACT In undergraduate transportation engineering courses, traffic assignment is a difficult concept for both instructors to teach and for students to learn, because it involves advanced mathematical modeling and computations. A multiplayer game, named “Multi-agent Route Choice Game” (MARC), is designed to engage students in the process of making route choice, so that they can visualize how traffic gradually reaches a user equilibrium (UE). In addition, the Braess’ paradox phenomenon, a concept not generally taught by undergraduate transportation courses, is embedded into the game so that students can explore this phenomenon through game-play. A before and after comparison and a case-control study are performed to evaluate the effectiveness of the game as a curriculum tool. The impact of students’ learning preferences is also investigated.

Di, Liu, Levinson 3
INTRODUCTION Civil engineering in general, and transportation engineering education in particular, has been evolving from traditional “chalk-and-talk” lectures to more problem- and project-based or game- and simulation-based learning (1-3). With the advance in computer technology, educational games and simulations have been introduced since the 1950s (2). Games and interactive simulations have been incorporated into transportation related courses at the Transportation Engineering program at University of Minnesota, Twin Cities for over a decade. The Simulating Transportation for Realistic Engineering Education and Training platform (STREET), developed by University of Minnesota researchers and sponsored by the National Science Foundation, integrates a series of projects composed of nine web-based simulation modules, which can be accessed at the website http://street.umn.edu/ (4). The ROAD (Roadway Online Application for Design) module is widely used for road design in undergraduate introductory courses. SONG (Simulator of Network Growth) and ADAM (Agent-Based Demand and Assignment Model) facilitate in-depth understanding of transportation network development and transportation systems planning (5-6). In addition to the STREET package, researchers from the University of Minnesota also employed transportation themed board games in undergraduate education, such as Air Baron, Metro, Rail Tycoon, Empire Builder, and 1870. Huang and Levinson in (7) explored the effects of incorporating these board games into the curriculum and showed that they could enhance students' learning process in transportation planning. Transportation planning, an important part of transportation engineering education, incorporates how traffic designers predict travel demands and plan urban transportation networks, so that the whole transportation system can be operated efficiently and effectively. Games, offering students hands-on experiences, are able to help them gain an in-depth understanding of concepts and underlying theories in transportation planning. Route choice (sometimes referred to as “traffic assignment”) describes the process by which travelers going from origins to destinations choose routes. Under assumptions such as that users all minimize the disutility of travel (usually taken to be minimizing travel time), route choice problems on networks generally result in a user equilibrium (UE) pattern of traffic, wherein it is to no individual traveler’s advantage to change routes if no one else does. User equilibrium is thus an emergent property of individual route choice behavior. To enhance students’ learning experience of user equilibrium, an interactive innovative tool gaming the equilibrium-finding process is introduced, i.e., Multi-Agent Route Choice game (MARC) (downloadable from the website http://street.umn.edu/MARC.html, accessed Mar. 15, 2015). It engages students in the choice decision process, and therefore allows them to experience the equilibration process in person. Hopefully this piques their interests in learning and improves their understanding of the underlying equilibrium theory and the mathematical formulas involved. The lecture on traffic assignment model should be accompanied by an important phenomenon, the “Braess’ paradox” (8), which states that building new roads does not necessarily improve traffic conditions. This concept is not usually taught in undergraduate-level classes due to its counter-intuitive nature, but mastering it can facilitate economical transportation network

Di, Liu, Levinson 4
planning and sustainable infrastructure investment. Moreover, teaching Braess' paradox can enrich students' understanding of travel behavior theories and help them develop capabilities of applying those theories to real-world situations they might encounter as transportation planners. Many researchers have explored the existence of equilibrium or Braess’ paradox behaviorally by recruiting volunteers to play a multiple-player game (9-13). However, their goals were to study travelers' choice behavior, instead of education. To engage students to discover this scientific phenomenon through the game, Braess' paradox is embedded into MARC. In this paper, MARC will be introduced and the role of the learning styles in adopting an interactive multi-agent computer game as an education tool will be explored. The development of MARC aims to benefit both students and instructors: making course materials easy and fun to learn for students and providing an opportunity to embed hands-on experiments and active learning strategies into curriculum for instructors. The research questions of this study are:
• Does MARC improve students’ understanding of traffic assignment and Braess’ paradox? • Is MARC an effective tool in undergraduate transportation engineering courses? • Which type of learners benefit more by playing MARC?
The rest of the paper is organized as follows: In Section 2, the Multi-Agent Route Choice game (MARC) is introduced and the undergraduate course where the game was implemented is described. In Section 3, the statistical findings of the game are illustrated based on a before and after comparison and a case-control study. These statistics show that the game improves students' understanding and thus is an effective education tool. Which types of learners benefit more from playing it is also revealed. In Section 4, students’ feedback and comments on the game are presented. In Section 5, conclusions and lessons are summarized. GAME-BASED LEARNING Learning preferences Provided the same course curriculum, students with different learning styles benefit differentially from playing games (5-7, 14). Kolb (14) identified “experiential” learning styles and proposed a four-stage learning cycle: Concrete Experience (CE), Reflective Observation (RO), Abstract Conceptualization (AC), and Active Experimentation (AE); with four-type learning styles: Diverging (CE/RO), Assimilating (AC/RO), Converging (AC/AE), Accommodating (CE/AE). For each learning style, different teaching strategies are needed. Divergers need hands-on exploration of a system; Assimilators require accurate, organized delivery of information, prepared tutorial and exercises; Convergers learn effectively from interactive and computer-assisted instruction; Accommodators demand independent discovery and active participation. In this study, the impact of students’ learning styles on learning consequences will be explored. Accordingly, the learning variables will be first elaborated upon (14): 1. Concrete experience (i.e., feeling) - learns from specific experiences and relating to people. 2. Reflective observation (i.e., watching) - observes before making a judgement by viewing the
environment from different perspectives.

Di, Liu, Levinson 5
3. Abstract conceptualization (i.e., thinking) - uses logical analysis of ideas and acts on intellectual understanding of a situation.
4. Active experimentation (i.e., doing) - achieves by influencing people and events through action.
Moreover, the aforementioned four learning styles are extended to be “Sensing” (concrete, practical facts and procedure oriented) and “Intuitive” (conceptual, innovative, theories and meanings oriented), “Visual” (prefer visual representations, i.e. charts) and “Verbal”(prefer written or spoken explanations), “Active” (doing) and “Reflective” (thinking), “Sequential” (linear, orderly, learn in small increments) and “Global” (holistic, system thinkers, learn in large steps). Course Description “Introduction to Transportation Engineering” (CE 3201) is the first and only required transportation engineering course for undergraduate students from the Department of Civil, Environmental, and Geo- Engineering at University of Minnesota. It is taught every semester and averages 60 students (more in the Spring, fewer in the Fall). Registered students include sophomores, juniors and some out-of-sequence seniors (6). This course usually contains two 2-hour lectures and one recitation or computer lab each week. There are two or three lab/recitation sessions each week. Game Description Before the game was implemented, during lectures, the four-step transportation planning model was already introduced to students. The route choice model was discussed in detail and the concept of Wardrop user equilibrium was mentioned. The Braess' paradox was not in the syllabus, so students are expected to discover it through the game. It is also not at this time described in the textbook Principles of Highway Engineering and Traffic Analysis (5th Edition) (15) (which has been used in some semesters) or in the Fundamentals of Transportation wikibook provided to students (http://en.wikibooks.org/wiki/Fundamentals_of_Transportation, accessed Mar. 15, 2015). In order to help students better understand the concepts taught in the lecture, a Multi-Agent Route Choice game (MARC) is developed, and the goals of designing this game are two-fold:
• Demonstrating Wardrop user equilibrium concept by letting students make route choices with other players simultaneously, wherein the equilibrium is gradually achieved. Gaming equilibration can strengthen understanding of the importance of equilibrium and motivate learning;
• Illustrating the “Braess’ Paradox” phenomenon by letting students experience a change in travel time before and after a new link is added. Simulating the paradox can engage students to learn how to make economic design of transportation networks.
MARC is developed in the C# language using Windows Studio 2008. As a multiplayer game, a client-server model is adopted. A terminal computer, serving as the client, provides an interface

Di, Liu, Levinson 6
for each player to take action. These terminal user computers are connected to a server computer and the decisions made at terminal computers are sent to the server. The server collects data from each terminal (i.e., the ID of each player, the action the player takes, and some game related information), stores and analyzes them in a database created in SQL Server 2005, and broadcasts the summary report to every terminal. Based on the feedback from the server, players will continue to play the next round of the game. MARC is implemented in the lab sessions of the course. At the beginning of the session, every player sits in front of a computer and receives playing instructions. Then they are asked to log into MARC and play two games. Each game includes two scenarios: in the first scenario, a small network contains two alternative routes connecting one OD pair; and in the second scenario, a new road is built so that there are three alternative routes. The difference between two games is: in the first game, building a new road reduces everybody’s travel time; while the new road in the second game worsens the system performance. Two scenarios from the first game are illustrated as follows.
• Scenario 1: A small network with four links (see Figure (1a)); • Scenario 2: A new bridge is built between A and B (see Figure (1b)).
Within each scenario, a small imaginary network is presented along with the flow-dependent travel time function of each link (see Figure (1c)). All available routes are indicated in the “Route Choice” panel. Each player is asked to choose one route traveling from O (origin) to D (destination). Each stage is repeated for ten rounds to ensure the user equilibrium is reached. After all players submit their route choices, the summary regarding how many people on each route and the flow-dependent travel time of each route is presented (see Figure (1d)). Then players adjust route choices in the next day's selection as the game continues. The whole game play session lasts for about 40 minutes. At the beginning of the game, every player receives a fixed number of points. After each round, the travel time he or she has experienced is subtracted from the current score to motivate players to minimize travel time. Whoever has the highest remaining score in the end wins the game. Game implementation To ensure the educational goals can be achieved successfully, before they begin playing, students are asked to brainstorm a list of factors which influence their route choices from home to school. This process helps them connect their own travel experiences with the classroom learning. Then students are told that their grades for this session depend on how effectively they play the game, i.e., minimizing the travel time, which motivates them to choose routes like a real traveler. After playing the game, they have to reflect on the two games and share their findings with others. After they summarize key points of what they have learned from the game, a video is shown to illustrate the Braess’ Paradox occurring in Manhattan aired in PBS (http://www.pbs.org/america-revealed/teachers/lesson-plan/3/, accessed Mar. 15, 2015) to reinforce their learning.

Di, Liu, Levinson 7
This game has been implemented in four semesters: Spring 2012, Fall 2012, Fall 2013 and Spring 2014. Descriptive statistics are provided in Table (1). A total of 178 students were involved in playing the game. Column C1 displays the number of players in each semester. To test whether this computer game can actually improve students’ understanding of traffic assignment and Braess’ paradox, a before and after comparison and a case-control study were conducted. In column C2, a cross indicates whether the before and after study was performed in the associated semester. Because players were required to complete the pre-survey before playing the game and the post-survey afterwards, they were all involved in the before and after study. Columns C3-C5 describe the case-control study. In column C3, the semester when a case-control study was implemented is indicated with a cross sign. The case-control study was performed for Spring 2012, Fall 2012 and Fall 2013 and a total of 124 players participated. In these three semesters, students were randomly assigned to either a case group or a control group. This was able to be achieved because there were multiple lab sessions each week. In one or two sessions the game was implemented (i.e., ‘case group’ or ‘play group’) while in the remaining ones it was not (i.e., ‘control group’ or ‘no-play group’). Students in the play group played the game and filled in the post-survey. Meanwhile, those from the no-play group did not play MARC. Instead, they played ADAM (Agent-Based Demand and Assignment Model) game (downloadable from http://street.umn.edu/, accessed Mar. 15, 2015), which was also designed to enhance students’ understanding of traffic assignment. Then they were asked to answer the same set of questions related to traffic assignment and Braess' paradox as what the play group did. (However, the no-play group played MARC in a subsequent lab session in order to ensure fairness in the course outcome and also filled in the post-survey regarding their opinions on game implementation.) Columns C4 and C5 indicate the number of cases and controls for each semester. There were 84 cases and 40 controls respectively. Column C6 indicates the semesters when “Transportation background” survey was conducted. In Spring 2012, however, these questions were not included. The “Transportation background” survey includes students' self-evaluation of their own understanding of transportation knowledge, which appears in both pre- and post-surveys. GAME STATISTICAL FINDINGS Pre- and post- surveys Before and after game play, students are asked to fill in pre- and post-surveys respectively (accesible from the website http://street.umn.edu/MARC/Pre_Post_Survey.pdf, accessed Mar. 15, 2015). The pre-survey consists of four sections: players’ demographic information, transportation background, learning style and transportation understanding. The post-survey is mainly designed to collect students’ opinions about the game and to assess whether their understanding is improved after playing the game. There are three sections in post-survey: game evaluation, transportation background and transportation understanding. See Table (3) for descriptive statistics of pre-survey results.

Di, Liu, Levinson 8
In the following, the three goals proposed in Section 1 will be assessed by using the data collected from both pre- and post- surveys. Correlations between demographic and learning preference statistics To facilitate the following quantitative analysis, qualitative variables need to be first coded as numerical values. Gender is coded as 0 if the player is female and 1 otherwise. Learning style variables (feeling, watching, thinking, doing) are coded binary in regression. Take “feeling” for example. “feeling=0” represents that the subject does not prefer learning by concrete experience, otherwise “feeling=1”. Learning preference variables (Sensing, Visual, Active, Sequential) have five scales. For example, “highly sensing”, “moderately sensing”, “mildly sensing or intuitive”, “moderately intuitive” and “highly intuitive” are coded as 2,1,0,-1,-2 respectively. The higher the value is, the more sensing and less intuitive the subject is. Correlations between age, gender and learning characteristics (illustrated in Table (4)) are calculated. Age does not have strong correlation with any learning characteristics. Males are more active than females and prefer concrete fact-oriented over conceptual learning. Among all learning styles, students who identify their learning styles as “Active” learn by active experimentation instead of abstract conceptualization and are thus more sensing (i.e., preferring concrete facts oriented learning). Play versus no-play: do players benefit? As indicated in Table (1), the case-control study was only performed in Spring 2012, Fall 2012 and Fall 2013. There are 84 cases and 40 controls respectively and thus 124 players in total. The goal is to test whether playing MARC enhances understanding of Braess’ paradox. The hypothesis is: students who played the game have better understanding of Braess’ paradox. Testing this hypothesis is based on students’ answers to Questions (1-2) in both surveys in Section “Transportation understanding”: Generally speaking, given the total traffic demand on the network is fixed, after a new road is added, how will everyone’s travel time change and why? The correct answer is: It depends. The reason is that everybody’s travel time may be improved or remain the same if Braess' paradox does not happen and will be worsened if it happens. The play group participated in the game play and experienced both travel time increase and decrease with addition of a new link. The no-play group was given the same set of networks used in the game but was asked to solve the equilibrium travel time. Then both groups answered the same question above in post-survey. Students’ performance was evaluated by both their choices and reasoning. If a student’s answer to Question (1) in “Transportation understanding” section is correct but the explanation is wrong, the understanding of Braess’ paradox is still treated as incorrect.

Di, Liu, Levinson 9
In the pre-survey, 13.8% students from the no-play group and 24.2% from the play group realized that travel time may increase or decrease or stay the same, after a new link is added. The remaining students either thought only one consequence could happen, or gave wrong explanations of their choices. The post-survey results show that, 12 students (4 fewer compared to that in the pre-survey) from the no-play group and 48 (18 more) from the play group were able to identify the Braess’ paradox and were aware of the existence of this scientific phenomenon. To further quantify the impact of adopting MARC as an educational tool, a regression analysis is used. Let Y be the response variable, representing whether a student’s answer to the Braess’ paradox related question in the post-survey is correct or not: it equals 0 if incorrect, and 1 if correct. Let Play be the explanatory variable, indicating whether he or she played the game before answering the question: it equals 0 if he or she belongs to no-play group, and 1 otherwise. The above hypothesis is equivalent to testing the relationship between Y and Play. Since the response variable only carries a value of either zero or one, the logistic regression is adopted: 𝑙𝑜𝑔 ! !!!
! !!!= 𝛽! + 𝛽! Play (1)
where 𝛽!,𝛽! are regression coefficients which need to be estimated. The logistic regression coefficients and its goodness-of-fit results are as in Table (5): The Chi-square goodness-of-fit test shows that the hypothesis that the above model fits data well cannot be rejected at the significance level 1%. The estimated increase in odds of improvement is 3.1 (=e1.14). In other words, the likelihood that game players understand the impact of adding a new road is 3 times more than that of non-players. In conclusion, after playing MARC, students understood Braess’ paradox better. Innovative teaching: who thinks the computer game is an effective curriculum tool? After playing the game, students were also asked to rate the effectiveness of this computer game as a curriculum tool with five scales: ‘not effective at all’ to ‘very effective’ (coded from 1 to 5, the greater the value, the more effective this computer game is as an curriculum tool). The hypothesis is: among those who played the game, whether the computer game is considered to be an effective learning tool is influenced by students' learning preferences. ‘Effectiveness of computer game’ is represented by an ordinal variable with values of 1,2,3,4,5. Ordinal data is the categorical data where there are logical ordering represented by ordered numeric scales. To test the above hypothesis, ordinal logistic regression needs to be adopted. In ordinal logistic regression, a proportional odds assumption is made that coefficients describing the relationship between each neighboring categories of the response variable are the same. Due to the same relationship between all pairs of groups, only one set of coefficients is needed.
Di, Liu, Levinson 10
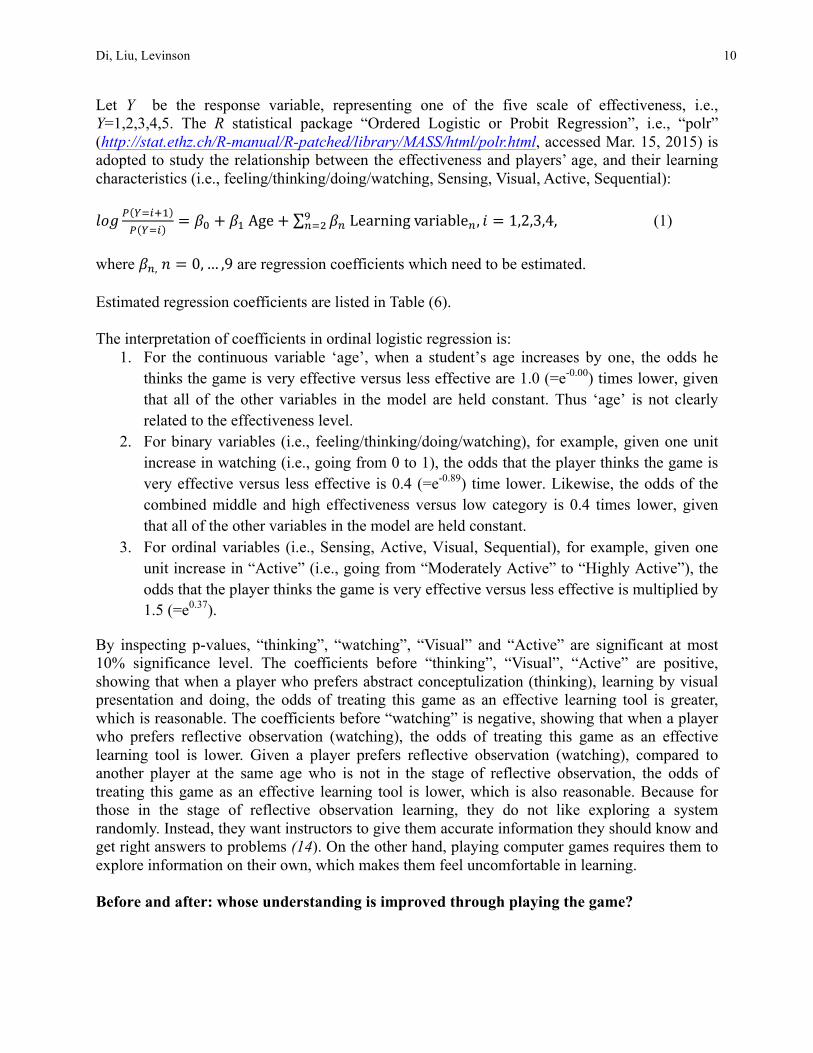
Let Y be the response variable, representing one of the five scale of effectiveness, i.e., Y=1,2,3,4,5. The R statistical package “Ordered Logistic or Probit Regression”, i.e., “polr” (http://stat.ethz.ch/R-manual/R-patched/library/MASS/html/polr.html, accessed Mar. 15, 2015) is adopted to study the relationship between the effectiveness and players’ age, and their learning characteristics (i.e., feeling/thinking/doing/watching, Sensing, Visual, Active, Sequential): 𝑙𝑜𝑔 ! !!!!!
! !!!= 𝛽! + 𝛽! Age+ 𝛽! Learning variable!, 𝑖 = 1,2,3,4,!
!!! (1) where 𝛽!, 𝑛 = 0,… ,9 are regression coefficients which need to be estimated. Estimated regression coefficients are listed in Table (6). The interpretation of coefficients in ordinal logistic regression is:
1. For the continuous variable ‘age’, when a student’s age increases by one, the odds he thinks the game is very effective versus less effective are 1.0 (=e-0.00) times lower, given that all of the other variables in the model are held constant. Thus ‘age’ is not clearly related to the effectiveness level.
2. For binary variables (i.e., feeling/thinking/doing/watching), for example, given one unit increase in watching (i.e., going from 0 to 1), the odds that the player thinks the game is very effective versus less effective is 0.4 (=e-0.89) time lower. Likewise, the odds of the combined middle and high effectiveness versus low category is 0.4 times lower, given that all of the other variables in the model are held constant.
3. For ordinal variables (i.e., Sensing, Active, Visual, Sequential), for example, given one unit increase in “Active” (i.e., going from “Moderately Active” to “Highly Active”), the odds that the player thinks the game is very effective versus less effective is multiplied by 1.5 (=e0.37).
By inspecting p-values, “thinking”, “watching”, “Visual” and “Active” are significant at most 10% significance level. The coefficients before “thinking”, “Visual”, “Active” are positive, showing that when a player who prefers abstract conceptulization (thinking), learning by visual presentation and doing, the odds of treating this game as an effective learning tool is greater, which is reasonable. The coefficients before “watching” is negative, showing that when a player who prefers reflective observation (watching), the odds of treating this game as an effective learning tool is lower. Given a player prefers reflective observation (watching), compared to another player at the same age who is not in the stage of reflective observation, the odds of treating this game as an effective learning tool is lower, which is also reasonable. Because for those in the stage of reflective observation learning, they do not like exploring a system randomly. Instead, they want instructors to give them accurate information they should know and get right answers to problems (14). On the other hand, playing computer games requires them to explore information on their own, which makes them feel uncomfortable in learning. Before and after: whose understanding is improved through playing the game?

Di, Liu, Levinson 11
The before and after study was performed for all four semesters and thus there are 178 players in total (see Table (1)). The hypothesis is: The game-based curriculum improved students’ transportation knowledge. Testing this hypothesis is based on students’ subjective evaluation of their understanding of transportation related knowledge in pre- and post-surveys. The definitions of who actually improved their understanding through playing the game are listed as follows: Definition 3.1.
• An improver is the student whose answer to Question (1) in “Transportation Understanding” section is wrong in pre-survey but correct in post-survey;
• A non-improver is the one whose answer to Question (1) in “Transportation Understanding” section is wrong in pre-survey and also wrong in post-survey.
Among 178 participants, 55 students (i.e., non-improvers) did not improve their answers to Question (1) in post-survey while 42 students (i.e., improvers) did. 20 gave the correct answer in pre-survey but changed to the wrong answer in post-survey and 61 answered it correctly in both surveys. In the subsequent analysis, only non-improvers and improvers will be considered, so there are 97 subjects. The following are summaries inferred from their own evaluations:
1. In general, students’ transportation understanding is improved through playing the game. The mean and the median are higher in post-survey than those in pre-survey for both non-improvers and improvers, and the standard deviations are lower or remain the same.
2. Before playing the game, improvers’ understanding of transportation is better than non-improvers’ in every category except in “opinions on transportation network planning and deployment” and “practical issues”. In these two categories, non-improvers have slightly higher values than improvers.
3. After playing the game, non-improvers’ understanding of transportation in most categories is better than improvers’ or remains the same, except in “traffic assignment”.
4. Combining both pre- and post-survey, in categories “transportation network planning” and “transportation network deployment”, improvers’ understanding is better than non-improvers’ before but not after. Improvers’ ability to form opinions on network planning and deployment is not as good as non-improvers’ before but is better after. Improvers’ understanding of practical issues is not as good as non-improvers’ neither before nor after. On the contrary, improvers’ understanding of traffic assignment is better than non-improvers both before and after.
Based on non-improvers’ and improvers’ evaluation of their ability to form opinions regarding transportation network planning and deployment shown in Table (8), in pre-survey, the mean of the improvers’ evaluation distribution is overall lower than that of non-improvers'. In post-survey, it shifts to the right side of that of non-improvers', meaning that improvers' ability to form opinions regarding transportation network planning and deployment is much more

Di, Liu, Levinson 12
enhanced than non-improvers’ through game play. Thus, after playing the game, improvers' understanding and ability of applying what they have learned from the game to real problems is better. To further test the hypothesis quantitatively that both improvers’ and non-improvers’ knowledge are enhanced after playing the game, a group of paired t-tests are preformed to show whether the means of the subjective evaluation values in pre-survey are less than those in post-survey. The p-values are listed in the last column of Table (8). The category with a p-value well below 0.05 indicate that we can favor the alternative hypothesis that the game has made substantial improvements to both improvers and non-improvers. Test results indicate that both improvers’ and non-improvers’ understandings are enhanced except non-improvers’ opinions on planning and deployment. Enhanced knowledge level: who benefits more? In post-survey, students were asked to self-evaluate whether their learning regarding the user equilibrium and Braess’ paradox was enhanced by playing the game in five scales: from 1 to 5 (the greater the value, the more their learning is enhanced). The hypothesis is: among those who played the game, students’ age and their learning preference influence how much they would benefit from the game. The ordinal logistic regression with predictors of “age” and all learning variables was tried, but only “Age” and “Sequential” are significant. When a student’s age moves from 18 to 19, the odds of moving from low to middle or high categories of enhancement (or from low and middle categories to high) is multiplied by 0.9 (=e-0.07). For one unit increase in ‘Sequential’, i.e., going from “Moderately Sequential” to “Highly Sequential”, the odds of high enhancement versus the combined middle and low categories are 0.8 lower, given that all of the other variables in the model are held constant. In other words, for a student who prefers holistic and systematic learning in large steps, knowledge is more likely enhanced through playing the game. STUDENTS’ FEEDBACK FROM THE GAME Quantitative Assessment After playing the game, all players were asked to assess the game regarding its easiness and effectiveness levels with five scales: from 1 to 5 (the greater the value is, the more difficult or effective the game is). The results are shown in Table (3): the median ease level is 2, so more than half of players think this game is relatively easy, which matches the design goal. The median effectiveness level is 4, meaning half students consider this computer game as a very effective curriculum tool. Qualitative Assessment In the post-survey, students' feedback was collected about their experiences of playing this game and their opinions on the Braess' paradox scenario.

Di, Liu, Levinson 13
As an aid in delivering formal lectures, this game is “...essential to all students to have a good idea of the equations that we are using and how they are derived...”, and this game “helped me understand some of the assumptions that go into deriving those equations...”. Offering hands-on experiences, this game “...was very helpful and would be helpful as a curriculum tool...you can visualize easily what is taking place and how it is working...seeing how it can supplement how we learn is useful. ...working on computer games allows for repetition, doing, and visualizing...”. After witnessing the equilibration process in the course of route choice decision-making, students were able to find out that “the longer you play each game the closer the values get to reaching equilibrium...”. In addition, some students discovered the connection between route choice and game theory: “my choice isn't the only thing that factors into my score, it also has to do with what everyone around me is doing too.” Some also tried to interpret the user equilibrium from the behavioral perspective: “...everyone may switch routes which will increase travel time because we are all selfish.” By playing the Braess’ paradox game, students realized that “adding a new route will not always fix traffic issues.” Some even learned the lesson about decision-making in transportation network planning: “...traffic is very fickle and dynamic, it needs to be studied closely before anything can be done to influence it without running the risk of over compensating.” Moreover, “...if everyone had been more focused on maintaining a minimum average travel time and less focused on decreasing their own travel time...”, Braess’ paradox might not happen. This comment further implied that some players were capable of discovering the real reason behind the occurrence of Braess' paradox and even managed to identify the concept of “social optimality”. CONCLUSION AND FUTURE RESEARCH This paper introduces the Multi-Agent Route Choice game (MARC) developed for undergraduate transportation engineering education. It benefits students' learning about user equilibrium and Braess' paradox. The statistical results show that this game supplements regular lectures, enhances student learning and is an effective education tool. There are still some technical complexities in the game, mainly because it is a multiplayer game instead of a stand-alone one. The aim is to popularize it as a web-based game, so that educators from other institutes can access it and apply it more easily to classroom teaching. More scenarios need to be created based on this platform. For example, real-time traffic information can be displayed to players to test its impact on players’ reactions. This can help students to learn how intelligent transportation systems affect driver behavior and redistribute traffic patterns. Road toll charges can be also imposed to certain links to demonstrate to students the role of tolls in transportation operation and management.

Di, Liu, Levinson 14
REFERENCES 1. Mills, J.E., Treagust, D.F., et al. Engineering education—is problem-based or project-based
learning the answer? Australasian Journal of Engineering Education, 4(1):16, 2003. 2. Gredler, M.E.. Educational games and simulations: A technology in search of a (research)
paradigm.Technology, (39):521–540, 1996. 3. Ebner, M. and Holzinger, A.. Successful implementation of user-centered game based
learning in higher education: An example from civil engineering. Computers & Education, 49(3):873–890, 2007.
4. Liao, C.F., Liu, H., and Levinson, D.M.. Engaging undergraduate students in transportation studies through simulating transportation for realistic engineering education and training (STREET). In 88th Annual Meeting of the Transportation Research Board, Washington, DC. Citeseer, 2009.
5. Chen, W. and Levinson, D.M.. Effectiveness of learning transportation 1 network growth through simulation. Journal of Professional Issues in Engineering Education and Practice, 132:29, 2006.
6. Zhu, S., Xie, F., and Levinson, D.M.. Enhancing transportation education through online simulation using an agent-based demand and assignment model. Journal of Professional Issues in Engineering Education and Practice, 137:38, 2011.
7. Huang, A. and Levinson, D.M.. To game or not to game: teaching transportation planning with board games. Transportation Research Record: Journal of the Transportation Research Board, 2307:141–149, 2012.
8. Braess, D.. ber ein paradoxon aus der verkehrsplanung. Unternehmensforschung, 12:258–268, 1969.
9. Mahmassani, H.S. and Stephan, D.G.. Experimental investigation of route and departure time choice dynamics of urban commuters. Number 1203. 1988.
10. Mahmassani, H.S. and Liu, Y.H.. Dynamics of commuting decision behaviour under advanced traveler information systems. Transportation Research Part C, 7(2-3):91–107, 1999.
11. Rapoport, A., Kugler, T., Dugar, S., and Gisches, E.J.. Choice of routes in congested traffic networks: Experimental tests of the braess paradox. Games and Economic Behavior, 65(2):538–571, 2009.
12. Schneider, K. and Weimann, J.. Against all odds: Nash equilibria in a road pricing experiment. Human Behaviour and Traffic Networks, pages 133–53, 2004.
13. Selten, R., Schreckenberg, M., Chmura, T., Pitz, T., Kube, S., Hafstein, S.F., Chrobok, R., Pottmeier, A., Wahle, J., Schreckenberg, M.. Experimental investigation of day-to-day route-choice behavior and network simulations of autobahn traffic in north rhine-westphalia. Human Behavior and Traffic Networks. Berlin: Springer, pages 1–21, 2004.
14. Kolb, D.A. et al. Experiential learning: Experience as the source of learning and development, volume 1. Prentice-Hall Englewood Cliffs, NJ, 1984.
15. Mannering, F. and Washburn, S.. Principles of highway engineering and traffic analysis. John Wiley & Sons, 2012.

Di, Liu, Levinson 15
LIST OF TABLES TABLE 1 Game implementation statistics TABLE 2 Descriptive statistics of pre-survey results TABLE 3 Descriptive statistics of post-survey results TABLE 4 Correlations between demographic and learning characteristics TABLE 5 Logistic regression coefficients and goodness-of-fit test TABLE 6 Ordinal logit model regression coefficients for innovative teaching TABLE 7 Descriptive statistics of understanding LIST OF FIGURES FIGURE 1 MARC interface

Di, Liu, Levinson 16
LIST OF TABLES TABLE 1 Game implementation statistics
Semester Player Before and after Case-control Case Control Transportation background
C1 C2 C3 C4 C5 C6 Spring 2012 68 X X 48 20
Fall 2012 30 X X 19 11 X Fall 2013 26 X X 17 9 X
Spring 2014 54 X - - X Total 178 178 124 84 40 110

Di, Liu, Levinson 17
TABLE 2 Descriptive statistics of pre-survey results
Variable Mean Std Min Max Age 21.7 3.9 18 50
Variable Level Frequency Percentage Gender Male 134 75.3%
Female 44 24.7%
Learning preference
Concrete experience (feeling) 66 37.1% Reflective observation (watching) 101 56.7%
Abstract conceptualization (thinking) 51 28.7% Active experimentation (doing) 135 75.8%
Sensing
Highly sensing 27 15.2% Moderately sensing 82 46.1%
Mildly sensing or intuitive 36 20.2% Moderately intuitive 22 12.4%
Highly intuitive 11 6.2%
Visual
Highly visual 59 33.1% Moderately visual 76 42.7%
Mildly visual or verbal 25 14.0% Moderately verbal 16 9.0%
Highly verbal 2 1.1%
Active
Highly active 52 29.2% Moderately active 69 38.8%
Mildly active or reflective 35 19.7% Moderately reflective 18 10.1%
Highly reflective 4 2.2%
Sequential
Highly sequential 35 19.7% Moderately sequential 70 39.3%
Mildly sequential or global 42 23.6% Moderately global 24 13.5%
Highly global 7 3.9%

Di, Liu, Levinson 18
TABLE 3 Descriptive statistics of post-survey results
Variable Mean Std Median Level Frequency Percentage
Easiness level 2.0 1.0 2
1 60 33.7% 2 62 34.8% 3 42 23.6% 4 12 6.7% 5 1 0.6%
NA 1 0.6%
Satisfaction level 3.2 1.1 3
1 14 7.8% 2 32 18.0% 3 53 29.8% 4 62 34.8% 5 16 9.0%
NA 1 0.6%
Stimulation level 3.2 1.1 3
1 12 6.7% 2 28 15.7% 3 59 33.1% 4 60 33.7% 5 18 10.2%
NA 1 0.6%
Enhancement level 3.6 1.1 4
1 10 5.6% 2 13 7.3% 3 50 28.1% 4 73 41.0% 5 31 17.4%
NA 1 0.6%
Motivated level 3.7 1.0 4
1 6 3.4% 2 11 6.2% 3 45 25.3% 4 73 41.0% 5 42 23.5%
NA 1 0.6%
Effectiveness level 3.8 1.0 4
1 8 4.5% 2 11 6.2% 3 31 17.4% 4 88 49.4% 5 39 21.9%
NA 1 0.6% NA*: one player’s data is missing.

Di, Liu, Levinson 19
TABLE 4 Correlations between demographic and learning characteristics Age gende
r feelin
g thinkin
g doin
g watchin
g Sensin
g Visua
l Activ
e Sequentia
l Age 1.0 0.1 0.0 -0.1 -0.1 -0.1 0.1 0.1 -0.0 -0.1
gender 0.1 1.0 -0.0 0.1 -0.2 0.1 -0.2 -0.0 -0.1 -0.1 feeling 0.0 -0.0 1.0 0.0 0.1 -0.1 0.1 0.1 0.1 -0.0
thinking -0.1 0.1 0.0 1.0 -0.1 0.2 -0.2 -0.2 -0.3 -0.2 doing -0.1 -0.1 -0.2 0.1 1.0 -0.0 0.1 0.2 0.4 -0.1
watching
-0.1 0.1
-0.1 0.2 -0.0 1.0 0.2 -0.0 -0.0 0.1
Sensing 0.1 -0.2 0.1 -0.2 0.1 0.2 1.0 0.1 0.3 0.2 Visual 0.1 -0.0 0.1 -0.2 0.2 -0.0 0.1 1.0 0.2 0.0 Active -0.0 -0.1 0.1 -0.3 0.4 -0.0 0.3 0.2 1.0 0.1
Sequential
-0.1 -0.1 -0.0 -0.2 -0.1 0.1 0.2 0.0 0.1 1.0

Di, Liu, Levinson 20
TABLE 5 Logistic regression coefficients and goodness-of-fit test
Coefficients Estimate Std. Error Z value p-value (Intercept) -0.85 0.35 -2.46 0.01 *
Play 1.14 0.41 2.77 0.01 ** Goodness-of-fit
test Df Deviance Resid. Df Resid. Dev Pr(>Chi)
NULL 123 171.87 Play 1 6.69 122 165.18 0.01 **
* Statistically significant at 5% level ** Statistically significant at 1% level

Di, Liu, Levinson 21
TABLE 6 Ordinal logit model regression coefficients for innovative teaching Value Std. Error t value p-value Age -0.00 0.04 -0.01 0.99 feeling 0.05 0.30 0.17 0.87 thinking 0.
66 0.37 1.79 0.07 .
doing 0.05 0.38 0.13 0.90 watching -0.89 0.31 -2.86 0.00 ** Sensing 0.06 0.16 0.36 0.72 Visual 0.46 0.16 2.82 0.00 ** Active 0.37 0.17 2.19 0.03 * Sequential -0.15 0.15 -1.01 0.31
. Statistically significant at 10% level * Statistically significant at 5% level ** Statistically significant at 1% level

Di, Liu, Levinson 22
TABLE 7 Descriptive statistics of understanding Category Group Survey Mean Std Median Paired t-test
p-value Transportation planning
Improver
Before 3.3 0.8 3
0.01 **
After 3.6 0.6 4 Non-improver Before 2.9 0.8 3 0.00 ***
After 3.7 0.7 4 Transportation network deployment
Improver
Before 2.8 0.8 3
0.00 ***
After 3.5 0.6 3.5 Non-improver Before 2.5 0.9 3 0.00 ***
After 3.5 0.9 4 Opinions on network planning and deployment
Improver
Before 3.2 0.9 3 0.05 * After 3.7 0.5 4
Non-improver Before 3.3 1.0 3.5 0.00 *** After 3.6 0.7 4 0.00 ***
Practical issues Improver
Before 3.1 0.9 3
0.00 ***
After 3.6 0.6 4 Non-improver Before 3.2 1.0 3
0.00 ***
After 3.8 0.7 4 Traffic assignment
Improver
Before 3.0 0.7 3
0.00 ***
After 4 0.6 4 Non-improver Before 2.8 1.0 3
0.00 ***
After 3.8 0.8 4
* Statistically significant at 5% level ** Statistically significant at 1% level
*** Statistically significant at .1% level

Di, Liu, Levinson 23
LIST OF FIGURES
(a) Network illustration for Scenario 1 (b) Network illustration for Scenario 2
(c) Route choice window
(d) Route choice resutls
FIGURE 1 MARC interface