Mukhopadhyay, S., Basu, J & Rajan, I. (2007) Mental health, gender ideology and women’s status in...
31
chapter three Mental health, gender ideology and women’s status in Kerala Swapna Mukhopadhyay, Jayanti Basu, S. Irudaya Rajan INTRODUCTION S tudies on mental health have generally been the prerogative of mental health experts, outside the ambit of general social science research. However, the search for a class of relatively context free set of gender development indicators prompted the inclusion of the mental health aspect of human well being as an integral part of Gender Network research agenda. 1 An inquiry into the mental health scenario in Kerala was deemed important in view of the high levels of conventional gender development indicators such as high female literacy levels and low levels of maternal mortality, in contrast to disturbing evidence of declining infant sex ratios, rising incidence of dowry and domestic violence. This paper analyses some of the findings of a survey of mental health carried out on a representative sample of over five thousand men and women from one thousand households spread across fourteen districts of Kerala. The focus of the survey is to understand how the gender differentiated status of mental health relates to differences in household and 1 This was initially prompted by the understanding that, cutting across social contexts, violence against women, and the credible threat of such violence resulted in gender-based stress and anxiety. Violence appeared to be the most widespread manifestation of unequal power relations between men and women. See the introductory chapter to this volume for a more detailed exposition. See Mukhopadhyay (2003) and the introductory chapter to this volume for a more detailed exposition.
Transcript of Mukhopadhyay, S., Basu, J & Rajan, I. (2007) Mental health, gender ideology and women’s status in...

chapter three
Mental health, gender ideology andwomen’s status in Kerala
Swapna Mukhopadhyay, Jayanti Basu,S. Irudaya Rajan
INTRODUCTION
Studies on mental health have generally been the prerogativeof mental health experts, outside the ambit of general socialscience research. However, the search for a class of relatively
context free set of gender development indicators prompted theinclusion of the mental health aspect of human well being as anintegral part of Gender Network research agenda.1 An inquiry intothe mental health scenario in Kerala was deemed important in viewof the high levels of conventional gender development indicators suchas high female literacy levels and low levels of maternal mortality, incontrast to disturbing evidence of declining infant sex ratios, risingincidence of dowry and domestic violence. This paper analyses someof the findings of a survey of mental health carried out on arepresentative sample of over five thousand men and women fromone thousand households spread across fourteen districts of Kerala.The focus of the survey is to understand how the gender differentiatedstatus of mental health relates to differences in household and
1This was initially prompted by the understanding that, cutting across socialcontexts, violence against women, and the credible threat of such violenceresulted in gender-based stress and anxiety. Violence appeared to be the mostwidespread manifestation of unequal power relations between men and women.See the introductory chapter to this volume for a more detailed exposition. SeeMukhopadhyay (2003) and the introductory chapter to this volume for a moredetailed exposition.
72 The Enigma of the Kerala Woman
individual characteristics. It also looks at the kind of links it haswith the internalized notions of gender ideology in Kerala society.
While mental health, just as physical health, should be deemedto be an integral dimension of the well being of an individual,independent of gender, on the face of it, there is no a priori reason toexpect that the status of women in a particular community will havea one-to-one correspondence with gender-differentiated status ofmental health within it, unless the contextual specificities are clearlydelineated and looked into. To cite an example, let us take that oneindicator of women’s status that seems to cut across differences inclass and caste divides: i.e., violence against women. Assuming thatviolence against women in its broader sense is a major indicator ofthe low status of women in a society, the existence and severity ofactual perpetrated violence, and credible threat of such violence alongwith the associated stress and anxiety that it entails, will undoubtedlyincrease levels of mental distress among women in that society. Itcan, therefore, be taken as a sure indicator of the low status of women.However, the extent of recorded levels of distress measured by standardindicators of mental health will depend on many other factors andmay well vary from one situation to another, even after correctingfor environmental differences, such as differences in material levelsof living. If such violence is perceived to be unjust or excessive bythe women, levels of distress are likely to be higher, ceteris paribus,than otherwise. In situations where both men and women subscribeto the notion of a certain hierarchy in gender relations, and perceiverelatively mild forms of violence to be the norm rather than theexception, recorded levels of mental distress and psychological wellbeing on account of this factor may not be affected too much. Hencethe importance of understanding gender role ideology as a determinantof the levels of stress and, consequently, of the recorded levels ofmental health indicators.
The study needs to be placed in the perspective of the presentscenario of the mental health status of women and men. Gender balancein the prevalence of mental disorders is notoriously asymmetric allover the world (Busfield 1996; Malik 1993; WHO 2000). Womenpredominate in stress related symptoms, especially, depressive andanxiety disorders, and body image related problems like eatingdisorders (Russo 1990; McIntyre and Hunt 1997). Recent literaturepoints to the fact that the negative mental health status of women isnot so much due to biological reasons as due to personal, social andpolitical factors (Lorber 1997). In this regard, the role of everyday

Mental health, gender ideology and women’s status in Kerala 73
difficulties and negative life events (Bolger et al. 1989; Weissman etal. 1993), violence and abuse (Ratner 1993; Sugarman and Frankel1996), sexist discrimination (Landrine et al. 1995), and finally, roleconflict and multiple roles (Cleary and Mechanic 1983; Gove 1979;Pearlin 1975) have been emphasized. There is, however, an increasingbody of literature that shows that multiple roles among women maycontribute to positive mental health as well (Adelman 1994; Helsonet al. 1990).
Indeed, the emerging literature on mental health increasingly revealsthe need to study separately, the negative aspects of mental healthor distress and its positive aspect, i.e., wellness, for a comprehensiveunderstanding of mental health status. Absence of disease is notsynonymous with wellness. While disease is the presence of distressingsymptoms, wellness is the presence of happiness and the ability toexperience a good quality of life. In fact, the two variables are onlymoderately negatively correlated and wellness is recognized as asignificant factor in the overall mental health status (Diener et al.1997). The available studies also tend to yield contradictory results,in so far as the same person may come up with higher levels of stressas well as wellness indicators. However, gender difference has beenscrutinized with care in cases of distress and disease, and rarely incases of wellness.
This paper analyses the data generated by the Kerala Mental HealthSurvey to understand the variations in the mental health status ofmen and women in Kerala in terms of a range of socio-economicindicators. Simultaneously, the paper investigates the linkages betweena couple of standard mental health indicators and the ideology ofgender relations subscribed to by men and women in the sample. Anindex of gender ideology has been especially constructed for this study.
THE KERALA MENTAL HEALTH SURVEY (KMHS)
Background
The Kerala Mental Health Survey (KMHS) was conducted in 2002, ona sample of 1000 households spread over all fourteen districts ofKerala.2 This was a representatively selected 10 per cent sub-sample
2The Kerala Mental Health Study (KMHS) survey instrument was preparedby the Gender Network research team and the survey was carried out acrossthe state by a team of researchers under the supervision of Dr E. Mohamed,Director of Ansari Hospital, Trissur district, Kerala. We are grateful to Dr

74 The Enigma of the Kerala Woman
of a sample of 10,000 households selected for the Kerala MigrationSurvey conducted by the Centre for Development Studies in 1998.The survey questionnaire in KMHS was given to all members in theselected households in the 12–60 years age groups, as well as to thosemembers of the 60-plus age groups who were willing to answer thequestions. The survey collected information on three sets of variables:
(i) Socio-economic variables(ii) Levels of psychological distress as well as of mental well-being
of the individuals for construction of two mental healthindicators.
(iii) Perceptions and attitudes of the individuals on genderrelations and gender ideology.
The questions on the socio-economic variables elicited informationon variables such as age, education, marital status, occupation andlabour status categories of individuals, as well as economic conditionsand demographic profiles of households to which they belonged.
On mental health, information was collected for the constructionof two standard instruments widely used in Applied Psychologicalresearch. The first is General Health Questionnaire (GHQ). Originallya 60-question instrument (Goldberg and Hiller 1979), the versionused here is the 12-question ‘best items’ set, which has found wideapplication in India and abroad in studies of psychological distress.The GHQ score has been used both as a dimensional measure ofpsychological stress as well as an indicator of potential clinicalpsychiatric cases in case it exceeds a specified threshold level. In the12-item version of GHQ, this threshold level has been identifiedas 2; anybody having a score higher than 2 is a potential clinicalpsychiatric case.
The second mental health indicator on which data have beencollected is the Subjective Well Being Inventory (SUBI), which isdesigned to capture the mental well being of the interviewee. The shortversion of the original 40-item questionnaire (Sell and Nagpal 1992)used in this study is the 9-item version, which can be broken intothree factors: general well-being, expectation achievement congruence,and confidence in coping.
It may be mentioned here that the SUBI and GHQ scores of apopulation need not generate the same rankings. In other words, a
Mohamed and his team of dedicated researchers for conducting the survey andto Professor K.C.Zachariah of the Centre for Development Studies for expertadvice on sample selection.

Mental health, gender ideology and women’s status in Kerala 75
person may be subjected to a relatively higher degree of mental stressmanifested in a high GHQ score, as compared to another, but mayhave a better sense of well-being than the latter, in terms of SUBI.This may well be the result of a better coping ability of the former tohandle stress and anxiety, as compared to the latter. General HealthQuestionnaire and SUBI are two indices that explore two interlinkedbut essentially separate dimensions of mental health. They are neithercollinear with, nor are they orthogonal to each other. In this studywe present results based on both the indices.
The KMHS also collected information on a third set of variables.This consists of perceptions, attitudes and the ideology of theinterviewees on gender relations in society. This set of 15 questions ongender ideology, was pilot tested in the district of Thrissur and thenadministered to the whole sample. A sub-sample of 200 householdswas randomly selected from the original 1000 for standardizing thequestionnaire. The standardized instrument comprising 8 questionswas administered to the remaining 800 households to obtain theGender Ideology scores.3 The analysis involving GI scores reportedin Section 3 of this paper pertains to the sample of these 800households and not the original 1000.
Levels of Perceived Well Being (SUBI)
As mentioned earlier, the Kerala Mental Health Survey (KMHS)data set consists of a sample of 1000 households—consisting of5450 persons, 2740 males and 2710 females—randomly selectedfrom a 10,000-household representative sample used in an earliersurvey, the Kerala Migration Survey (KMS), carried out in thestate by the Centre for Development Studies in Thiruvananthipuram,in 1998.
The results reported in this section reflect the findings of the KeralaMental Health Survey (2002). Tabular analysis of the data suggeststhe following broad patterns.
Broad patterns emerging from tabulations of levels ofperceived well-being (SUBI
In terms of perceived psychological well being, the study suggeststhat men are clearly better off than their female counterparts, withrecorded SUBI scores for men being consistently lower than those
3Cf. Appendix

76 The Enigma of the Kerala Woman
for women: the average difference in the male and female scoresbeing statistically significant at 1 per cent level.5
In general, there is an inverse trend in SUBI scores when mappedagainst increasing age. This suggests that the level of psychologicalwell-being declines as people grow older, for both the male and thefemale sample for most parts of the distribution. However there is adifference. For men, the trend is almost monotonic until the mid-fifties after which, the level of well-being, in fact, shows a marginalimprovement. For women, the ride through the life cycle is anythingbut smooth. First, there is a marked dip in the level of perceived well-being for women in the 25–34 year age group, coinciding with themajor chunk of child bearing, and rearing years, and second, forwomen in the oldest categories, there is, again, a sharp dip in therecorded levels of well-being. This is reinforced by the fact that thetrend rate of age-induced decline in well-being is significantly higherfor women than for men. Older women have amongst the lowestlevels of well-being in the sample.
Table 3.1: Sample Size by District: KMS and KMHS4
District No of Households KMS (1998) KMHS (2002)
Kasaragod 181,667 330 30Kannur 371,221 673 72Wayanad 134,654 244 30Kozhikode 456,673 828 79Malappuram 477,292 866 90Palakkad 444,998 897 80Thrissur 522,159 947 99Ernakulam 555,657 1,008 96Idukki 232,995 423 40Kottayam 361,813 656 64Alappuzha 405,210 735 70Pathanamthitta 259,629 471 50Kollam 489,774 888 90Thriuvananthapuram 619,558 1,124 110KERALA 5,513,300 10,090 1000
KMS: Kerala Migration Survey, 1998.KMHS: Kerala Mental Health Survey, 2002.
4Table 1, page 12 KMHS report.5Table 2, page 15, KMHS Report, op. cit.

Mental health, gender ideology and women’s status in Kerala 77
If one tabulates men and women by their marital status, the‘happiest’ in both sexes are those that are unmarried, happier by farthan those that are married. The worst off by far, are the widows.The interesting thing to note here is that, although the result is notstatistically significant, the only marital status category in whichwomen are relatively happier than men, is the one in which they aredivorced. Divorced women record a better level of well-being thantheir male counterparts.
With regard to work status, farmers and labourers are the worstoff in terms of perceived well-being, and government servants arethe happiest of the lot; a clear reflection of the relative economicwell-being of the households, both in terms of income levels andincome security.
Table 3.2: Index of Subjective Well-being by Age andSex in Kerala, 20026
Age Male Female Mean of the Scores t valueMale Female
15–24 344 343 16.41 16.88 -1.63925–34 269 313 17.21 19.75 -1.50735–44 237 313 17.63 18.13 -2.28545–54 233 277 18.19 18.54 -.88555+ 225 231 17.80 19.64 -4.955*
* Significant at 1 % level.
Table 3.3: Index of Subjective Well-being by Sex and Marital Statusin Kerala, 20027
Marital Status Male Female Mean of the Scores t valueMale Female
Unmarried 99 79 15.52 16.82 -2.272**Married 1086 1117 17.33 17.89 -3.286*Widowed 98 220 18.75 19.81 -1.715***Divorced 10 24 19.40 17.90 1.123
* Significant at 1% level; ** Significant at 5 % level; *** Significant at 10% level
6Table 4, page 16, KMHS Report op., cit.7Table 5, page 16, KMHS Report, op. cit.

78 The Enigma of the Kerala Woman
In the specific context of this paper when one maps genderdisparities with regard to perceived psychological well-being againstthe background of household poverty and household incomeinsecurity, poor women display the highest SUBI levels, or in otherwords, they are the worst off in terms of perceived well-being. Genderdisparities also go up sharply as one moves down the job ladder. Thisis also evident when one tabulates male and female levels of well-being against other categories that are highly correlated with incomes.Scheduled Castes, Scheduled Tribes and Ezavahs, for instance, haveamong the highest SUBI levels. Gender disparities also rise steadilyas one moves down the caste scale, suggesting very low levels of well-being, especially for the women from these caste groups.9
It would be legitimate to generalize from these findings, that whilepoverty adversely affects the psychological well-being of all membersof a household, the relative severity of the impact of poverty onwomen increases steadily, vis-à-vis men, as households get poorer.
In terms of regions in the state, there is a clear indication that theworst average levels of well-being for both men and women are inthe southern districts of Kerala. The average levels of well-being getincreasingly better as one moves to the central and then, to the northerndistricts. It would be interesting to map this finding against thedistribution of caste, religious and ethnic groups across the variousregions of the state.
Table 3.4: Index of Subjective Well-being by Work status and Sexin Kerala, 20028
Work Status Male Female Mean of the Scores t valueMale Female
Government 80 30 14.57 16.80 -2.082***Private 86 32 16.59 17.84 -1.323Self-employed 261 42 17.67 19.40 -2.289***Farmers 121 53 18.51 20.51 -2.792**Labourers 374 77 17.10 20.55 -5.324*Unemployed 186 81 17.80 17.84 -.220Student 171 146 15.61 16.16 -1.494House work 18 1012 17.83 18.17 -.198
* Highly Significant; ** Significant at 1 % level; *** Significant at 5% level
8Table 7, page 18, KMHS Report, op. cit.9Table 8, page 18, KMHS Report, op.cit.

Mental health, gender ideology and women’s status in Kerala 79
An insightful result thrown up by the survey is that, while povertyis a primary cause of subjective ill-being for both men and women,it is not the only cause. The importance of non-economic factors indefining women’s well-being is brought out sharply when one tabulatesgender disparities in mental health indicators by communitymembership. Although gender disparities in perceived well-being area rising function of the poverty of households, the largest disparitiesin SUBI levels turn out not to be within the poorest households, butamong communities such as Syrian Christians and Nairs, communitieswhich have traditionally belonged to the affluent class.10
Broad patterns emerging from tabulations of levels ofmental distress (GHQ)
There are several areas where tabulations of GHQ scores show thesame patterns as those of SUBI scores. With SUBI, women on an averageshowed higher scores, and therefore, lower levels of subjective well-being. In GHQ as well, women on an average fared worse than men.
Table 3.5: Index of Subjective Well-being by Religion andCaste in Kerala, 2002
Religion/Caste Male Female Mean of the Scores t valueMale Female
SC/ST 94 109 18.27 18.76 -.931Nair 133 143 16.68 17.86 -2.43**Ezhava 292 322 17.95 18.07 -.354Syrian X’ans 138 135 16.57 17.71 -2.531**Other X’ans 151 180 17.20 18.48 -2.835*Muslims 258 335 17.35 17.62 -.720Others 173 173 17.35 17.84 -1.200
* Significant at 1% level; ** Significant at 5 % level
Table 3.6: Index of Mental Health in Kerala by Sex, 2002
Gender Total Score Mean t value
Male 1308 1.81 -4.518*Female 1477 2.33
* Highly Significant.
10See Table 9, KMHS Report, op. cit.

80 The Enigma of the Kerala Woman
They displayed higher levels of recorded GHQ than men, suggestingthat women experience higher degrees of mental stress and anxiety.
General Health Questionnaire mapped against some of the socio-economic variables reveal some broad patterns.
Growing old is synonymous with greater mental stress. As withSUBI, here too, the descent with age into a state of greater anxietyand stress is steeper for women, with old women displaying the worstlevels of GHQ.
As with SUBI, the marital status of a person is linked with GHQ.Marriage, on an average, raises GHQ levels. The worst off, once again,are widowed women, who incidentally, are also likely to be the oldest.At the same time, if a woman is divorced, or separated, the level ofstress rises significantly for her too; similar trends are not noticeablein the sample for men.
Higher levels of education generally reduce stress for both menand women. Once again, this may partly be a reflection of the relativeeconomic prosperity of the educated. What is interesting to notehere is that, while the general trend is observable for both men andwomen, for the latter, there is unevenness in the two-way relationshipbetween education and mental distress. This is manifested in a sharppeak in mental distress for women who have primary education,making them almost as stressed out, on an average, as illiterate women.
This phenomenon needs to be investigated further, but it seemsto suggest that literacy, by itself, does not result in a reduction ofthe levels of stress of Kerala women in the same manner, or to thesame degree, as it does for men. This could very well be a reflectionof the fact that what literacy can do as an instrument of control
Table 3.7: Index of Mental Health in Kerala by Marital Status, 200211
Marital Status Male Female Mean of the Scores t valueMale Female
Unmarried 99 79 1.22 1.35 -.354Married 1086 1117 1.78 2.28 -3.966*Widowed 98 220 2.50 3.62 -2.332**Divorced 10 24 1.90 2.70 -.897
* Highly Significant; ** Significant at 5 % level
11Table 16, KMHS op.cit.

Mental health, gender ideology and women’s status in Kerala 81
over the life situation of an individual may be very different forwomen than it is for men.
Another difference in the impact of education and labour marketvariables on levels of stress and anxiety for men and women, is thrownup by the data on unemployment. Unemployed women are far morestressed out than unemployed men, and a large percentage of theformer happen to be educated.
Table 3.9: Index of Mental Health in Kerala by Work Status, 200213
Employment Male Female Mean of the Scores t valueStatus Male Female
Government 80 30 0.700 2.30 -2.227***Private 86 32 1.06 2.78 -2.768**Self-employed 261 42 1.02 3.33 -4.175*Farmers 121 53 2.13 3.51 -1.917****Labourers 374 77 1.05 3.96 -5.629*Unemployed 186 81 1.82 3.13 -2.60**Student 171 146 .88 .91 -.135House work 18 1012 4.50 2.5 1.635
* Highly Significant; ** Significant at 1 % level; *** Significant at 5% level:**** Significant at 10% level
12KMHS, op.cit.13KMHS, op.cit.
Table 3.8: Index of Mental Health in Kerala byEducational Attainment, 200212
Educational Male Female Mean of the Scores t valueAttainment Male Female
Illiterate 42 123 3.88 3.30 0.652Literate 34 33 3.45 3.21 0.291Primary 188 246 2.3 3.48 -2.023**Middle 598 658 1.83 2.32 -2.851*Secondary 330 321 1.14 1.56 -2.253**Degree 116 94 0.84 1.38 -1.613
* Significant at 1% level; ** Significant at 5 % level

82 The Enigma of the Kerala Woman
GENDER IDEOLOGY AND MENTAL HEALTH
A striking feature of the sample is the very high percentages (womenmore than men) that show up with potentially problematic mentalhealth characteristics in the sample population. The percentage ofmen scoring above the cut off point in GHQ is 43.72% while that ofwomen is 49.80%. The situation with the wellness index is worse with50.72% of men and an alarming 56.65% of women scoring abovethe cut off point in the SUBI scale. Compared with national andinternational figures, the incidence of mental stress and mental illnessappear to be significantly worse for the population of Kerala. This, byitself, is a cause for concern. Women, of course, are worse than men interms of both indices, which is more or less, a common scenario.
Direct questioning suggests that the household economic situationis a prime cause for stress and anxiety, in both men and women.This could very well be so, especially where relatively high levels ofeducation pushes up expectations for high incomes. These expectationscannot be realized due to low levels of general economic development;a scenario that could be said to characterize the Kerala situation.Could gender role ideology also have a similar role to play? A numberof earlier studies abroad have indicated that conservative upbringingand socialization can lead to internalization of stereotyped genderrole ideologies. This, in turn, can lead to negative self-evaluation amongwomen causing negative stress tolerance and enhanced vulnerabilityto distress and disorders (Belk and Snell 1989; Kuiper and Dance1994; Ruble et al. 1993). It has also been observed that gender roleideologies operate more intensely to influence mental health statusin women than in men (Cameron and Lalonde 2001).
Most of these studies have been carried out in the context of westernsocieties. Systematic analysis of interlinkages between the status ofmental health of a population and the gender ideology it subscribesto—especially gender differences in such linkages—are rare in thecontext of Indian society. One exception to this is the study by Davar(1999), which highlighted the way Indian women are differentiatedfrom men in prevalence, aetiology, and the availability of mentalhealth services. Davar also demonstrates the inconsistency and lackof normativity of the available psychiatric researches in this context,making comparison across provinces difficult. In Kolkata, two studieshave been conducted to relate gender role with mental health among‘normal’ young adults (Basu 2004), and with psychiatric patients (Basu2003). These two studies have demonstrated how inconsistent gender

Mental health, gender ideology and women’s status in Kerala 83
role messages are integrated in the identity of women, and in turn,are associated with their mental health status. However, consideringthe complicated emotional and social issues involved in the matter,the studies mentioned above are, at best, indicative and serve merelyto posit relevant questions for further research.
As seen in Table 3.10 below, GI scores for men and women in theKerala Mental Health Survey come up with the evidence of womensubscribing to a more patriarchal gender ideology than men on anaverage, and the difference is statistically quite significant.
Table 3.10: Index of Gender Ideology in Kerala by Sex, 200214
Gender Total Score Mean t value Significance
Male 1308 6.68 -3.509* 0.000Female 1477 7.11
* Highly Significant.
Does this have anything to do with the enigma surrounding theissue of women’s status in Kerala?
Clearly the issues involved are complex, and the two-waycorrelations cited in the section above can conceal the complexitiesof the multi-dimensional nature of the problem. The KMHS dataprovides us with the basic ingredients to carry out a preliminaryanalysis of some of these questions. Also, two-way correlations oftenconceal the complexities of multiple dimensionalities of the data.The following sections present the results of some multivariatestatistical analysis carried out with the data to see the relationshipbetween gender ideology and the gender-differentiated status ofmental health indicators.
A Statistical Format for Analysis
A number of regressions were run to unearth the statistical relationshipsbetween various socio-economic variables, gender ideology and thestatus of mental health for the total sample, and for men and womenseparately. The sample consists of 1241 persons, 988 males and 1241females, from 800 households out of the original 1000 after deletingthe 200 randomly chosen households which were used to construct
14Table 24, KMHS, op.cit.

84 The Enigma of the Kerala Woman
the standardized Gender Ideology (GI) Index.15 Apart from the socio-economic variables, standardized gender ideology scores have beenused as an independent variable in explaining variations in the statusof mental health. We have used the total GI scores over the eightquestions selected during the standardization process in the reportedequations, although separate equations were run using the two separateclusters of six and two questions respectively but have not beenreported here. Four different specifications of the dependent variablehave been used. These are:
GHQ scores ranging from 0 to 12,GHQD: A dummy variable which takes the value 1 when GHQ
score is less than or equal to 2, and is 0 otherwise,SUBI scores ranging from 9 to 27,SUBID: A dummy variable which takes the value 1 when SUBI
score is less than or equal to 16, and is 0 otherwise.The socio-economic variables which have been used in addition
to the GI score as explanatory variables are:Age and age-squared, educational status, marital status, labour
force status, economic status of the household, region within thestate, religion/caste and sex of the respondent, in case of equationsfor the total sample.16
With the status of mental health of the individual as the dependentvariable, several equations were run using combinations of theabove variables to explore the explanatory power of various modelspecifications. Since at least two of the specifications for the dependentvariable, i.e., GHQD and SUBID, are binary variables, Probit and Logitmodels appropriate for such cases were used. Most of the reportedequations are for marginal coefficients for Probit equations. A fewresults on odds ratios using the Logit specification have also beengiven for the purpose of comparison. Appendix 3.2 contains a sampleof equations that were run to assess the linkages between the mentalhealth indicators and the gender ideology index, given other socio-economic characteristics of the interviewees as outlined in the variablechart in the appendix.
The nature of association between mental health indicators andother variables as outlined in the descriptions in the earlier section, isbased on two-way tabulations of the data. While useful in themselves,these two-way classifications cannot take into account the effect ofother variables in the system that may be simultaneously impacting
15See Appendix 1 on the construction of the GI index.16Cf. appendix for the variable chart and a sample of the equations.

Mental health, gender ideology and women’s status in Kerala 85
both. This is the primary reason why one goes in for multivariateanalysis in such situations, and if possible, to simultaneous systemsas well. The analysis carried out here is, however, restricted to singleequations regressions. There is, as yet, no well-established ‘theory’in the area connecting variables such as ‘gender ideology’ and ‘statusof mental health’ for instance, to warrant the construction of elaboratesimultaneous systems. As an expository analysis seeking to investigatestatistical associations, if any, between some of these variables, thiswould have been too ambitious a project to start with. Even whileopting for a single equation model, however, we do experiment withsome alternative model and variable specifications within the singleequation format, and come up with some striking results. These arereported in Appendix 3.2 of this paper. The nature of associationthat emerges between the dependent variable, i.e., various measuresof mental stress as well as of perceived mental well-being with themajor explanatory variables in these equations, turns out to be prettyrobust. The following paragraphs summarize the broad nature ofassociations that emerge between the mental health indicators andvarious explanatory variables from the estimated equations Theseare based on the results of the regressions reported in the Appendix3.2 of the paper.
Summary of Results
Gender Ideology
All the equations point to the striking result of the very significantrelationship of the standardized gender ideology indicator with allthe four specifications of mental health as the dependent variable.This is true for the equations run separately for men and women,and also for those that use the whole sample with a sex dummy asan explanatory variable. This holds good for both the Probit and Logitmodels. The significance of the gender variable is highest among allthe explanatory variables in all the specifications tried out with thisdata. The results strongly suggest that given other things, a highergender ideology score (i.e., holding more orthodox views on genderroles and norms) leads to higher levels of GHQ (greater stress andanxiety) and higher SUBI (lower levels of perceived mental well-being). It also raises the probability of a person going beyond thethreshold levels, in terms of both the mental health indicators, as apotential psychiatric case. The results suggest that one percentage pointrise in the GI score could worsen the indicators of mental healthanywhere by a factor of two to three percentage points.

86 The Enigma of the Kerala Woman
Considering that the relationship in the equations between genderideology and mental health is stronger for women than men in termsof significance levels, and also the fact that the marginal coefficientsin Probit models and the odds ratios in the Logit models are fairlyconsistently higher for women than for men, one can say thatsubscribing to an orthodox gender ideology does more harm to womenthan to men. Given that the gender ideology scores in the sampledpopulation are poorer for women than for men, this could be onestrong reason why Kerala women are worse off in terms of mentalhealth than Kerala men in the sample.
Age
Broadly speaking, the results show that the status of mental health ofindividuals declines as they grow older, since all equations have apositive and significant coefficient for the age variable. The age-squaredvariable, however, is fairly consistent with negative, though largelyinsignificant, coefficients in the equations. Even if these were statisticallysignificant, the associated values of the coefficients in the originalequations in most cases are such that the negative effect of the latter isunlikely to show up within the average life span of the sampledpopulation. This suggests that, for all practical purposes, the observedrelationship between mental health status and age is negative withmental health indicators becoming increasingly worse as one gets older.
The effect of other variables on the status of mental health ofmen and women can be read from the equations. While they broadlycorroborate the results obtained from the tabular analysis of the datapresented in Section 2 above, there are some interesting details thatcan be read from the multivariate analysis results. These details couldnot be found through two way tabular analyses where variations inother variables cannot be held constant.
Education
The impact of education on mental health is, by and large, positive,but there are subtle differences between men and women. WhileGHQ and SUBI decrease with higher levels of education, the impactis more pronounced for men than women. In fact for women, itdoes not assume significance before one crosses the level of secondaryeducation. However, when we study the effect of education on thedichotomized GHQ and SUBI, it appears that the possibility ofcrossing the threshold is averted with greater probability for womenthan for men. This tendency is stronger in case of the SUBI dummythan for the GHQ dummy.

Mental health, gender ideology and women’s status in Kerala 87
One could then, hypothesize from these results that being educatedper se, does not benefit women as much as men, in terms of mentalhealth parameters, until one crosses the secondary level. It may benoted that a similar finding had surfaced from preliminary tabularanalysis of the thousand household data reported in Section 2 ofthe paper.
Marital Status
The marital status variable exhibits significance for men, although thesituation is different for women. Compared to those in the unmarriedcategory, GHQ and SUBI scores are significantly higher for divorcedand widowed women. However, they are not significant for either themarried women or men in any of the other categories.
The results are somewhat different when we look at the dichot-omized GHQ and SUBI. These versions of the equations indicate thatbeing divorced, widowed or separated, as opposed to being unmar-ried or currently married, could increase the propensity for crossingthreshold levels, especially in terms of perceived mental well-being,in both men and women. This could mean that given other things,marriage may exacerbate potential psychiatric problems. But thishypothesis would clearly need more evidence to be substantiated.
Work Status
The impact of work status on mental health is not the same for menand women. With regular salaried workers as the base, this variableis insignificant for men for all the other categories. However, forwomen, being a student or being involved in domestic work, more sothe former than the latter raises the level of well-being as compared toholding a secure job (See Table 3.4). This is an interesting result andneeds further probing, especially since it does not turn out to be robustwith respect to model specification (Cf. Table 3.2). It may be notedthat work status turns out to be a more significant variable for menthan women in case of the dichotomized mental health indicators.Men in low status, insecure jobs are more prone to critical levels ofmental stress and lower well-being than women. (Tables 3.4 and 3.9).
Economic Status
The broad relationship between mental health and economic statusof the household is positive. As the economic status of the householdgoes down, levels of mental distress and ill being go up. However thiseffect is most evident when one compares the richest households withthe poorest, and is strengthened when one looks at the dichotomized

88 The Enigma of the Kerala Woman
mental health indicators) Men and women react differently to theeconomic status of the household, in terms of threshold levels ofmental distress and ill being. Women appear to be more prone todistress, while men seem to suffer from a greater sense of ill-being.
Caste/Religion Groups
Taking the SC/ST category as the base group, regressions were run tostudy the differential effects of caste/religion categories on mentalhealth indicators. The results suggest that there are no significant,and consistent marginal variations in the mental health status acrossthese groups, although in terms of significance of the t-values, castedivisions seem to be more significant predictors of mental healthstatus for men than for women. (See Tables A3.1.1–A3.1.5)
Region
The state has been divided into three regions: south, central andnorth. This has been done to broadly reflect the differences in theethnic and cultural characteristics of the population in theselocations. The effect of regional variations is more prominent forwomen than for men. It also emerges in dimensional differences inthe GHQ and SUBI scores rather than in the assessment of potentialcritical levels of mental ill being and distress. For women, the resultsare quite clear. Controlling for other variables, the impact of beinglocated in the southern region is the least beneficial for the mentalhealth status of women. Things get better as one moves from the southto the central region, and to the north. One would perhaps need tolook beyond the crude regional breakdown, into the differentialdistributional profiles of communities and ethnic groups in theseregions, to understand the implications of this result.
Sex Dummy
Some of the equations were run for the whole sample with an interceptdummy to represent the sex of the individual. An example of thisset of results is reproduced in Appendix Table A3.2.5. Without anyexception, the sex dummy shows a positive and significant coefficientin all the equations, suggesting that both mental distress and mentalill being indicators are higher for women.
CONCLUDING OBSERVATIONS
The results of the multivariate regressions suggest a strong statisticalassociation between orthodox Gender Ideology and the status of

Mental health, gender ideology and women’s status in Kerala 89
mental health and perceived well-being of the individual, keepingother factors constant. Women also exhibit a higher degree of anxietyand mental stress, and lower levels of psychological well-being thanmen, but that is a common finding the world over, and not specific tothe Kerala situation. There are two striking features about these resultsthough. One, as noted above, women in our sample are significantlymore orthodox than men in terms of their gender ideology; and two,as the results of the multivariate regressions clearly suggest, high levelsof gender orthodoxy are a strong determinant of low levels of mentalwell-being. This is true for both men and women, but more so forwomen than for men. This suggests that perhaps some portion of thegender differentials in levels of mental well-being can be traced togender orthodoxy.
This is a rather significant finding. Tabular analysis of the data insection 2 above has suggested a number of factors that may havecontributed to the stress levels of women. The stress brought aboutby reproductive responsibilities is manifested in higher GHQ levelsamong married women in the reproductive age group. Old age andpoverty manifest themselves in high levels of gendered patterns ofpsychological ill being. Even literacy may heighten women’s stresslevels relative to men. This is due to the fact that literacy may raiseexpectations without adequate outlets for self-expression andopportunities for exercising control over one’s life. The one factor,however, already mentioned above that has repeatedly come out withthe highest significance levels as a determinant of mental ill beingin both men and women—more so for women than men—is thehigh level of gender orthodoxy.
This also, in a way, solves the contradiction of women’s status inKerala. High levels of conventional gender development indicatorshave not translated into a more liberated gender ideology for theKerala women, or men, for that matter. The straitjacket of astereotypical gender ideology has kept the women in a time warp asit were and may very well has been doing so at the cost of heightenedlevels of mental distress and ill being. These are complex issues andneed much more coordinated research than has been possibleto put into this paper. At the very least, the study has hopefullybeen able to highlight the relevance of some commonly neglectedfacets of women’s status in the state, which need to be explored atgreater depth.
90 The Enigma of the Kerala Woman
APPENDIX 3.1
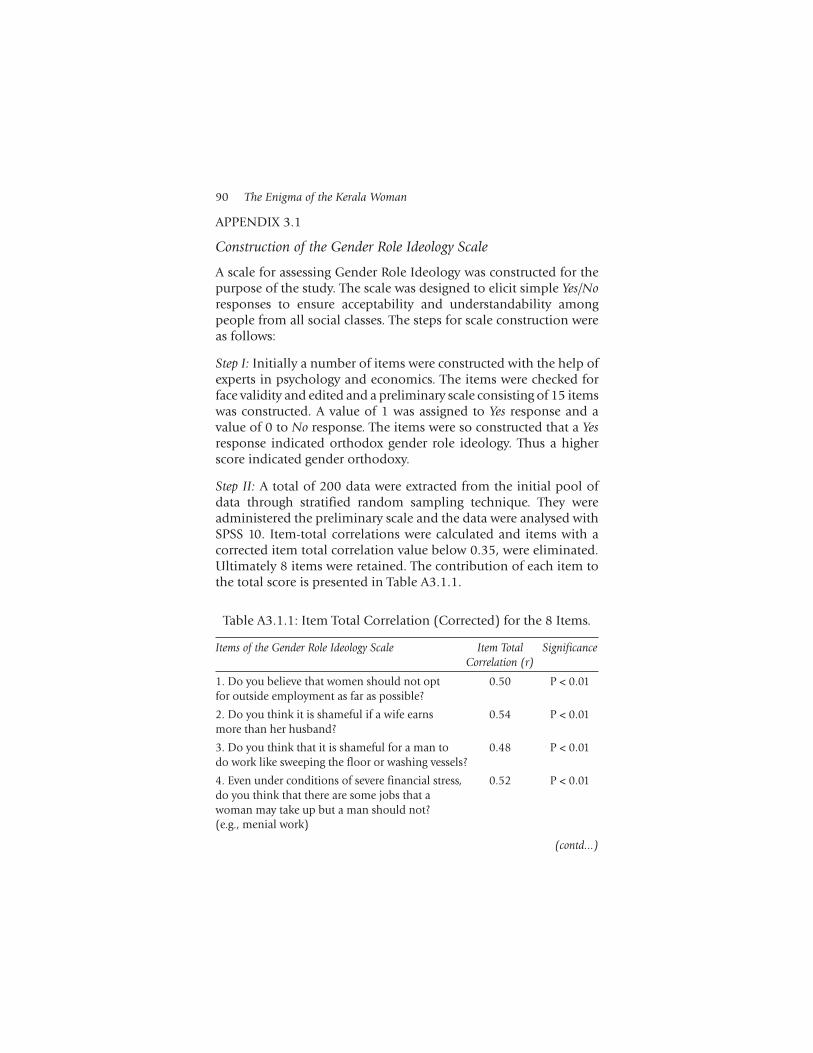
Construction of the Gender Role Ideology Scale
A scale for assessing Gender Role Ideology was constructed for thepurpose of the study. The scale was designed to elicit simple Yes/Noresponses to ensure acceptability and understandability amongpeople from all social classes. The steps for scale construction wereas follows:
Step I: Initially a number of items were constructed with the help ofexperts in psychology and economics. The items were checked forface validity and edited and a preliminary scale consisting of 15 itemswas constructed. A value of 1 was assigned to Yes response and avalue of 0 to No response. The items were so constructed that a Yesresponse indicated orthodox gender role ideology. Thus a higherscore indicated gender orthodoxy.
Step II: A total of 200 data were extracted from the initial pool ofdata through stratified random sampling technique. They wereadministered the preliminary scale and the data were analysed withSPSS 10. Item-total correlations were calculated and items with acorrected item total correlation value below 0.35, were eliminated.Ultimately 8 items were retained. The contribution of each item tothe total score is presented in Table A3.1.1.
Table A3.1.1: Item Total Correlation (Corrected) for the 8 Items.
Items of the Gender Role Ideology Scale Item Total SignificanceCorrelation (r)
1. Do you believe that women should not opt 0.50 P < 0.01for outside employment as far as possible?
2. Do you think it is shameful if a wife earns 0.54 P < 0.01more than her husband?
3. Do you think that it is shameful for a man to 0.48 P < 0.01do work like sweeping the floor or washing vessels?
4. Even under conditions of severe financial stress, 0.52 P < 0.01do you think that there are some jobs that awoman may take up but a man should not?(e.g., menial work)
(contd...)

Mental health, gender ideology and women’s status in Kerala 91
Items of the Gender Role Ideology Scale Item Total SignificanceCorrelation (r)
5. If you were to have only one child would you 0.34 P < 0.01rather have a son?
6. Do you think that a man loses respect in the 0.47 P < 0.01community if his wife or daughter moves aboutfreely outside the home?
7. Do you think that a woman or girl who goes 0.47 P < 0.01out alone after dark is herself to be blamed ifshe gets molested?
8. Do you think that a girl or woman who moves 0.45 P < 0.01about freely outside the house is most likely to bea ‘loose’ woman?
Table A3.1.2: Alpha and Split Half Reliability (with SpearmanBrown correction) for the Gender Role Ideology Scale
The Gender Role IdeologyScale (final format)
Alpha Reliability 0.78Split Half Reliability (with Spearman 0.69Brown correction)
Table A3.1.1(continued)
Step III: The preliminary scale was now converted to the workingscale consisting of 8 items. A total of 356 data were again extractedfrom the initial pool of data through stratified random samplingtechnique. They were administered the working scale and datawere analysed with SPSS 10 for reliability and factorial validity.The results are presented in Tables A3.1.2, A3.1.3 and A3.1.4.The tables indicate an acceptable level of reliability. PrincipalComponents Factor analysis with Varimax rotation elicited twofactors—the first one being of 6 items (named ‘relative socialstatuses’) and the other one of 2 items (named ‘relative jobstatuses’). The total percentage of variance explained by the twofactors was 52.096%.

92 The Enigma of the Kerala Woman
Table A3.1.3: Results of Principal Components Factor Analysiswith Varimax Rotation (using Kaiser normalization)
Eigen Rotation SumsValues of Squared Loadings
Components Total Total % of Variance Cumulative %
1 3.11 2.28 28.493 28.49
2 1.06 1.89 23.603 52.10
3 0.88 NA
4 0.81 NA
5 0.72 NA
6 0.56 NA
7 0.46 NA
8 0.39 NA
Table A3.1.4: Relative Contribution of Each Item to the Factors(Rotated Component Matrix)
Item Numbers (as in Table A3.1.1) Factorswith Cue Content 1 (Relative 2 (Relative
Social Status) Job Status)
7. Woman who goes out alone after dark is 0.79 1.290E-02to be blamed
6. Man loses respect if his wife or daughter 0.67 0.15moves freely
8. Woman who moves about freely is likely 0.66 0.14a ‘loose’ woman
2. Shameful if wife earns more than husband 0.54 0.43
1. Women should not go for outside employment 0.52 0.40
5. Would rather have a son 0.42 0.29
3. Shameful for a man to do work like 9.289E- 0.89sweeping the floor 02
4. Some jobs that a woman may take up but 0.199 0.81a man should not

Mental health, gender ideology and women’s status in Kerala 93
Step IV: A working norm prepared from the same 356 data ispresented in Table A3.1.5.
Table A3.1.5: Normative Data (mean and SD) for theGender Role Ideology Scale
Total sample Male Female(N = 356) (N = 153) (N = 203)
Total score ( 8 items) Mean 3.13 2.92 3.30SD 2.37 2.28 2.42
Factor 1 ( 6 items)(Relative social status) Mean 2.27 2.13 2.37
SD 1.82 1.79 1.85Factor 2 ( 2 items)(Relative job status) Mean 0.87 0.80 0.92
SD 0.88 0.89 0.87
Now the gender role ideology scale was ready for use.

94 The Enigma of the Kerala Woman
APPENDIX 3.2: SOME RESULTS OF THE MULTIVARIATE ANALYSIS
Variable Chart
Age Age age
Age*2 Age square age_sqEducation Illiterate + literate without schooling Base
Primary + Up e11Secondary & above e12
Marital Status 1 Unmarried Base2 Currently Married m113 Others m12
Work status Govt. sector + autonomous + Basecorporate + privateSelf employed + house labour + w11agriculture + agricultural labour +unemployedNo need of job w12Student w13House work w14
Economic Status 1 Very good Base2 Good es113 Poor es12
Caste/Religion SC/ST BaseNair rl_11Ezhava rl_12Syrian Christian + Other Christian rl_13Shia Muslim + Sunni Muslim rl_14Others rl_15
Region 1 South Base2 Central rg113 North rg12
GI total GI Total – 8 questions gi8totalSex Male Base
Female s1

Mental health, gender ideology and women’s status in Kerala 95
Equation A3.2.1: Marginal Coefficients (Probit model)Comparison of Men and Women with GHQ Scores as the
Dependent Variable
Females Males
Number of obs = 1241 Number of obs = 988LR chi2(20) = 139.06 LR chi2(20) = 87.42Prob > chi2 = 0.0000 Prob > chi2 = 0.0000Log likelihood = -776.52349 Log likelihood = -638.19343Pseudo R2 = 0.0822 Pseudo R2 = 0.0641ghq | dF/dx Z ghq dF/dx z———+- ————- ———- ———- ————- ———-age | 0.01315 1.91 age 0.016652 2.31age_sq | -0.00012 -1.42 age_sq -0.00016 -1.92e11*| 0.030938 0.56 e11* -0.15255 -1.93e12*| -0.08005 -1.25 e12* -0.22705 -2.63m11*| 0.000592 0.01 m11* 0.030847 0.43m12*| 0.133904 1.57 m12* 0.014046 0.15w11*| 0.012874 0.14 w11* 0.04192 0.75w12*| -0.025 -0.2 w12* 0.254043 2.8w13*| -0.23162 -2.38 w13* -0.01668 -0.21w14*| -0.14258 -1.84 w14* -0.00839 -0.05es11*| 0.012502 0.31 es11* -0.02685 -0.57es12*| 0.077343 1.65 es12* 0.036226 0.66rl_11*| -0.04343 -0.61 rl_11* 0.108609 1.39rl_12*| 0.017335 0.28 rl_12* 0.129385 1.88rl_13*| 0.047574 0.79 rl_13* 0.053623 0.78rl_14*| -0.01975 -0.31 rl_14* 0.053589 0.73rl_15*| 0.000057 0 rl_15* 0.046274 0.61rg11*| -0.04715 -1.28 rg11* -0.04414 -1.1rg12*| -0.08322 -2.02 rg12* -0.02092 -0.45gi8total | 0.024267 3.63 gi8total 0.021551 2.79———+- ———- ———- ———- ———- ———-obs. P | 0.575343 obs. P 0.538462pred. P | 0.582393 pred. P 0.542227

96 The Enigma of the Kerala Woman
Equation A3.2.2: Odds Ratios (Logit model) Comparison of Menand Women with GHQ Scores as the Dependent Variable
Females Males
Odds Oddsghq Ratio z ghq Ratio z——— ———— ———- ——— ———— ———-age 1.057007 1.91 age 1.071389 2.34age_sq 0.999503 -1.43 age_sq 0.999334 -1.95e11 1.138528 0.56 e11 0.503458 -1.96e12 0.713572 -1.26 e12 0.370815 -2.62m11 1.000382 0 m11 1.142402 0.45m12 1.802513 1.59 m12 1.062611 0.16w11 1.043286 0.11 w11 1.189227 0.77w12 0.909199 -0.17 w12 3.324456 2.8w13 0.375969 -2.4 w13 0.938409 -0.19w14 0.532272 -1.87 w14 0.951762 -0.07es11 1.051465 0.29 es11 0.885034 -0.64es12 1.370209 1.58 es12 1.140552 0.58rl_11 0.814665 -0.68 rl_11 1.579741 1.4rl_12 1.068182 0.25 rl_12 1.730865 1.91rl_13 1.208121 0.73 rl_13 1.238392 0.76rl_14 0.909075 -0.35 rl_14 1.234632 0.7rl_15 1.010084 0.03 rl_15 1.203908 0.6rg11 0.813003 -1.33 rg11 0.837516 -1.08rg12 0.699399 -2.07 rg12 0.916096 -0.46gi8total 1.108755 3.65 gi8total 1.095895 2.87

Mental health, gender ideology and women’s status in Kerala 97
Equation A3.2.3: Marginal Coefficients (Probit)
Comparison of GHQ Dummy for Men and Women level
Females Males
Number of obs = 1241 Number of obs = 988LR chi2(20) = 137.33 LR chi2(20) = 87.38Prob > chi2 = 0.0000 Prob > chi2 = 0.0000Log likelihood = -756.12913 Log likelihood = -556.07076Pseudo R2 = 0.0833 Pseudo R2 = 0.0728ghqd| dF/dx z ———- ————- ———-———+- ————- ———- ghqd dF/dx zage | 0.014797 2.18 ———- ————- ———-age_sq | -0.00012 -1.48 age 0.009493 1.51e11*| 0.006466 0.13 age_sq -8.8E-05 -1.23e12*| -0.13989 -2.39 e11* -0.0902 -1.44m11*| -0.01205 -0.15 e12* -0.12766 -1.89m12*| 0.116872 1.3 m11* -0.01325 -0.19w11*| 0.015742 0.18 m12* 0.019419 0.22w12*| -0.02871 -0.25 w11* 0.117176 2.27w13*| -0.04238 -0.45 w12* 0.274641 2.94w14*| -0.05009 -0.65 w13* 0.040756 0.5es11*| -0.02147 -0.53 w14* 0.339161 1.89es12*| 0.062448 1.33 es11* 0.038274 0.88rl_11*| -0.04485 -0.66 es12* 0.108755 2.09rl_12*| -0.02974 -0.51 rl_11* 0.040612 0.55rl_13*| 0.005931 0.1 rl_12* 0.064472 1.02rl_14*| -0.06947 -1.16 rl_13* 0.008113 0.13rl_15*| -0.02173 -0.33 rl_14* -0.02925 -0.46rg11*| -0.05353 -1.51 rl_15* -0.03993 -0.6rg12*| -0.05504 -1.38 rg11* 0.020319 0.56gi8total | 0.020869 3.19 rg12* 0.026024 0.62———+- ————- ———- gi8total 0.030103 4.42obs. P | 0.381144 ———- ————- ———-pred. P | 0.370097 obs. P 0.295547———- ————- ———- pred. P 0.281121
———- ————- ———-

98 The Enigma of the Kerala Woman
Equation A3.2.4: Marginal Coefficients (Probit)Comparison of SUBI Dummy for Men and Women
Females Males
Number of obs = 1241 Number of obs = 988LR chi2(20) = 124.69 LR chi2(20) = 109.46Prob > chi2 = 0.0000 Prob > chi2 = 0.0000Log likelihood = -742.15321 Log likelihood = -613.60912Pseudo R2 = 0.0775 Pseudo R2 = 0.0819subid | dF/dx z———+- ————- ———- ———- ————- ———-age | -0.00075 -0.11 subid dF/dx zage_sq | 3.84E-05 0.48 ———- ————- ———-e11*| -0.10896 -1.94 age 0.007485 1.07e12*| -0.22079 -3.32 age_sq -7.5E-05 -0.92m11*| 0.000209 0 e11* -0.13108 -1.63m12*| 0.085938 1.08 e12* -0.25021 -2.83w11*| 0.124867 1.61 m11* 0.082456 1.17w12*| -0.18436 -1.51 m12* 0.126005 1.41w13*| -0.047 -0.52 w11* 0.211741 3.84w14*| 0.028771 0.39 w12* 0.228437 2.74es11*| 0.05162 1.36 w13* 0.086522 1.12es12*| 0.177243 4.15 w14* 0.16442 0.98rl_11*| -0.04567 -0.64 es11* 0.132774 2.87rl_12*| -0.03871 -0.63 es12* 0.116543 2.19rl_13*| -0.0222 -0.36 rl_11* -0.04974 -0.63rl_14*| -0.10199 -1.58 rl_12* -0.00678 -0.1rl_15*| -0.045 -0.65 rl_13* -0.06273 -0.91rg11*| -0.02343 -0.67 rl_14* -0.07422 -1.01rg12*| 0.006994 0.18 rl_15* -0.01958 -0.26gi8total | 0.020794 3.25 rg11* 0.01279 0.32———+- ————- ———- rg12* 0.049648 1.09
gi8total 0.018478 2.4attn: Swapna ———- ————- ———-Obs. P ??? obs. P 0.591093Pred. P ??? pred. P 0.597259(Lost !!. Will need to hunt out the ———- ————- ———-numbers from an earlier version.Need time, please.)PRESS: PLEASE KEEP THE YELLOWHIGHLIGHT IN PROOFS

Mental health, gender ideology and women’s status in Kerala 99
Equation A3.2.5Probit and Logit Analysis for the Combined (M+F) Sample for
Dichotomized MH indicators: GHQD and SUBID
Odds Ratios GHQD Odds Ratios with SUBID
Number of obs = 2229 Number of obs = 2229LR chi2(21) = 219.68 LR chi2(21) = 215.32Prob > chi2 = 0.0000 Prob > chi2 = 0.0000Log likelihood = -1323.7149 Log likelihood = -1369.0538Pseudo R2 = 0.0766 Pseudo R2 = 0.0729
Odds Oddsghqd Ratio z subid Ratio z———- ————- ——— ———- ————- ———age 1.060062 2.76 age 1.012269 0.58age_sq 0.999507 -2.02 age_sq 0.999957 -0.17e11 0.865043 -0.84 e11 0.602892 -2.33e12 0.541065 -3 e12 0.384029 -4.06m11 0.921195 -0.33 m11 1.248972 1.05m12 1.403293 1.19 m12 1.725421 2.08w11 1.512829 1.94 w11 2.234597 4.23w12 1.985044 2.19 w12 1.460307 1.21w13 1.125366 0.4 w13 1.206482 0.76w14 1.267927 1.04 w14 1.47576 1.85es11 0.992455 -0.06 es11 1.441988 2.89es12 1.420781 2.26 es12 1.991665 4.58rl_11 0.967342 -0.15 rl_11 0.818602 -0.87rl_12 1.081514 0.41 rl_12 0.92533 -0.38rl_13 1.0562 0.29 rl_13 0.861286 -0.75rl_14 0.793123 -1.14 rl_14 0.690065 -1.77rl_15 0.871958 -0.63 rl_15 0.88232 -0.56rg11 0.903444 -0.87 rg11 0.975725 -0.21rg12 0.906079 -0.75 rg12 1.124653 0.91s1 1.461354 2.63 s1 1.392523 2.35gi8total 1.118986 5.23 gi8total 1.088305 3.91
———- ————- ———
100 The Enigma of the Kerala Woman
REFERENCES
Adelmann, P., 1994, ‘Multiple Roles and Psychological Well being in aNational Sample of Older Adults’, Journal of Gerontology, 49, pp. 277–85.
Basu, J., 2003, ‘Risk factors, Prevention and Culture-compliant Interventionfor Some Psychiatric Disorders prevalent among Women’, reportsubmitted to Kolkata: DST.
Basu, S., 2004, ‘A Study of Gender Role Stereotypes of College Students inRelation to some Mental Health Variables’, unpublished Ph.D. thesis,Calcutta: Calcutta University.
Belk, S.S. and Snell, W.E., 1989, ‘Stereotypic Beliefs about Women asModerators of Stress-Distress Relationships’, Journal of Clinical Psychology,45, pp. 665–72.
Bolger, N., DeLongis, A., Kessler, R.C. and Schilling, E.A., 1989, ‘Effects ofDaily Stress on Negative Mood’, Journal of Personality and Social Psychology,57, pp. 808–18.
Busfield, J., 1996, Men, Women and Madness, Houndsmills, Hampshire:Macmillan Press.
Cameron, J.E. and Lalonde, R.N., 2001, ‘Social Identification and Gender-related Ideology in Women and Men’, British Journal of Social Psychology,40, pp. 59–77.
Cleary, P.D. and Mechanic, D., 1983, ‘Sex Differences in PsychologicalDistress among Married People’, Journal of Health and Social Behavior,24, pp. 111–21.
Davar, B., 1999, Mental Health of Indian Women: A Feminist Agenda, NewDelhi: Sage Publications.
Diener, E., Suh, E.M., Lucas, R.E. and Smith, H., 1997, ‘Subjective Well-being:Three Decades of Progress 1967–1997’, Illinois: University of Illinois.
Goldberg, D.P. and Hiller, V.E., 1979, ‘A Scaled Version of the General HealthQuestionnaire’, Psychological Medicine, 9, pp. 139–46.
Gove, W.R., 1979, ‘Sex Differences in the Epidemiology of Mental Disorders:Evidence and Explanations’, E. S. Gomberg and V. Franks (eds.), Genderand Disordered Behavior: Sex Differences in Psychopathology, New York:Brunner/Mazel, pp. 23–68.
Helson, R., Elliot, T. and Leigh, J., 1990, ‘Number and Quality of Roles’,Psychological of Women Quarterly, 14, pp. 83–101.
KMHS study.Kuiper, N.A. and Dance, K.A., 1994, ‘Dysfunctional Attitudes, Roles, Stress
Evaluations, and Psychological Well being’, Journal of Research inPersonality, 28, pp. 245–62.
Landrine, H., Klonoff, E.A., Gibbs, J., Manning, V. and Lund, M., 1995,‘Physical and Psychiatric Correlates of Gender Discrimination: AnApplication of the Schedule of Sexist Incidents’, Psychology of WomenQuarterly, 19, pp. 473–92.

Mental health, gender ideology and women’s status in Kerala 101
Lorber, J., 1997, Gender and the Social Construction of Illness, New Delhi: SagePublications.
Malik, S., 1993, ‘Women and Mental Health’, Presidential address in the45th Annual Conference of the Indian Psychiatric Society, Lucknow.
McIntyre, S. and Hunt, K., 1997, ‘Socio-economic Position, Gender andHealth’, Journal of Health Psychology, 2, pp. 315–34.
Mohamed, E., Rajan, S.I., Kumar, Anil K. and Mohammed, P.M. Saidu, 2002,‘Gender and Mental Health in Kerala’, Report of the Kerala Mental HealthSurvey (KMHS), submitted to the Gender Network, New Delhi: Instituteof Social Studies Trust.
Mukhopadhyay, Swapna, 2003, ‘What is new about “Gender Bias”?’, SwapnaMukhopadhyay and Ratna Sudarshan (eds.), Tracking Gender Development:Continuity and Change in South Asia, New Delhi: Kali for Women.
Pearlin, L.I., 1975, ‘Sex roles and Depression’, N. Datan and L.H. Ginsberg(eds.), Life-span Developmental Psychology: Normative Life Crises, New York:Academic Press, pp. 191–207.
Ratner, P. A., 1993, ‘The Incidence of Wife Abuse and Mental Health Statusin Abused Wives in Edmonton, Alberta’, Canada Journal of Public Health,83, pp. 246–9.
Ruble, D.N., Greulich, F., Pomerantz, E.M. and Gochberg, B., 1993, ‘The Roleof Gender-related Processes in the Development of Sex Differences in Self-evaluation and Depression’, Special Issue: Toward a New Psychobiology ofDepression in Women, Journal of Affective Disorders, 29, pp. 97–128.
Russo, N.F., 1990, ‘Overview: Forging Research Priorities for Women’s MentalHealth’, American Psychologist, 45, pp. 368–73.
Sell, H. and Nagpal, R., 1992, ‘Assessment of Subjective Well being’, WorldHealth Organization, Regional office for South East Asia, New Delhi.
Sugarman, D. and Frankel, S.L., 1996, ‘Patriarchal Ideology and Wife-assault:A Meta-analytic Review’, Journal of Family Violence, 11, pp. 13–40.
Weissman, M.M., Bland, R., Joyce, P.R., Newman, S., Wells, J.E. and Wittchen,H., 1993, ‘Sex Differences in Rates of Depression: Cross-nationalPerspectives’, Journal of Affective Disorders, 29, pp. 77–84.
World Health Organization Report 2000, ‘Women’s Mental Health: AnEvidence based Review’, Mental Health Determinants and Populations,Department of Mental Health and Substance Dependence, Geneva.


![[Sharmila Basu] Dead Reckoning - Righteous Release, N](https://static.fdokumen.com/doc/165x107/6315acb9c32ab5e46f0d6a4f/sharmila-basu-dead-reckoning-righteous-release-n.jpg)