
Mu Transposon Insertion Sites and Meiotic Recombination Events Co-Localize with Epigenetic Marks for...
13
Mu Transposon Insertion Sites and Meiotic Recombination Events Co-Localize with Epigenetic Marks for Open Chromatin across the Maize Genome Sanzhen Liu 1,2 , Cheng-Ting Yeh 3,4 , Tieming Ji 5,6 , Kai Ying 1,2 , Haiyan Wu 5¤ , Ho Man Tang 3 , Yan Fu 4,7 , Dan Nettleton 6 , Patrick S. Schnable 1,2,3,4,5,7 * 1 Interdepartmental Genetics Graduate Program, Iowa State University, Ames, Iowa, United States of America, 2 Department of Genetics, Development, and Cell Biology, Iowa State University, Ames, Iowa, United States of America, 3 Center for Plant Genomics, Iowa State University, Ames, Iowa, United States of America, 4 Department of Agronomy, Iowa State University, Ames, Iowa, United States of America, 5 Bioinformatics and Computational Biology Program, Iowa State University, Ames, Iowa, United States of America, 6 Department of Statistics, Iowa State University, Ames, Iowa, United States of America, 7 Center for Carbon Capturing Crops, Iowa State University, Ames, Iowa, United States of America Abstract The Mu transposon system of maize is highly active, with each of the ,50–100 copies transposing on average once each generation. The approximately one dozen distinct Mu transposons contain highly similar ,215 bp terminal inverted repeats (TIRs) and generate 9-bp target site duplications (TSDs) upon insertion. Using a novel genome walking strategy that uses these conserved TIRs as primer binding sites, Mu insertion sites were amplified from Mu stocks and sequenced via 454 technology. 94% of ,965,000 reads carried Mu TIRs, demonstrating the specificity of this strategy. Among these TIRs, 21 novel Mu TIRs were discovered, revealing additional complexity of the Mu transposon system. The distribution of .40,000 non-redundant Mu insertion sites was strikingly non-uniform, such that rates increased in proportion to distance from the centromere. An identified putative Mu transposase binding consensus site does not explain this non-uniformity. An integrated genetic map containing more than 10,000 genetic markers was constructed and aligned to the sequence of the maize reference genome. Recombination rates (cM/Mb) are also strikingly non-uniform, with rates increasing in proportion to distance from the centromere. Mu insertion site frequencies are strongly correlated with recombination rates. Gene density does not fully explain the chromosomal distribution of Mu insertion and recombination sites, because pronounced preferences for the distal portion of chromosome are still observed even after accounting for gene density. The similarity of the distributions of Mu insertions and meiotic recombination sites suggests that common features, such as chromatin structure, are involved in site selection for both Mu insertion and meiotic recombination. The finding that Mu insertions and meiotic recombination sites both concentrate in genomic regions marked with epigenetic marks of open chromatin provides support for the hypothesis that open chromatin enhances rates of both Mu insertion and meiotic recombination. Citation: Liu S, Yeh C-T, Ji T, Ying K, Wu H, et al. (2009) Mu Transposon Insertion Sites and Meiotic Recombination Events Co-Localize with Epigenetic Marks for Open Chromatin across the Maize Genome. PLoS Genet 5(11): e1000733. doi:10.1371/journal.pgen.1000733 Editor: Harmit S. Malik, Fred Hutchinson Cancer Research Center, United States of America Received June 30, 2009; Accepted October 19, 2009; Published November 20, 2009 Copyright: ß 2009 Liu et al. This is an open-access article distributed under the terms of the Creative Commons Attribution License, which permits unrestricted use, distribution, and reproduction in any medium, provided the original author and source are credited. Funding: This research was supported by a grant from the National Research Initiative of the USDA Cooperative State Research, Education, and Extension Service, grant no. 2005-35301-15715 to P. S. Schnable. The funders had no role in study design, data collection and analysis, decision to publish, or preparation of the manuscript. Competing Interests: The authors have declared that no competing interests exist. * E-mail: [email protected] ¤ Current address: Roche Global Pharma Development Center, Shanghai, China Introduction Gene knockouts are indispensable tools for genetic and functional genomics. The maize Mutator (Mu) transposon is the most active DNA transposon in plants [1]. In maize, a model species for which transformation can be achieved at only a low efficiency, Mu insertion mutagenesis has been an important tool for cloning genes due to its high copy numbers and high rate of germinal transposition [1,2,3]. In addition, because Mu elements do not exhibit a preference for transposition to nearby sites [4], as is the case for Ac/Ds transposons [5], they are ideally suited for genome-wide mutagenesis screens. The Mutator transposon family is a two-component system. MuDR controls the transposition of itself and the other classes of the 12 nonautonomous Mu elements that have been reported so far [6]. All Mu elements share highly similar ,215 bp terminal inverted repeats (TIRs) and upon insertion generate 9-bp target site duplications (TSDs) directly flanking Mu elements. Mu exhibits a preference for insertion in genes [7,8,9]. In addition, a few case studies reported a preference for insertion within 59-UTRs or exons of genes [7,8,9,10]. Although many investigations have been conducted on Mutator transposons, little is known about the genome-wide distribution of Mu insertions sites and the mechanisms by which these sites are selected. In this study, ,965,000 Mu flanking sequences (MFSs) were obtained from 454 pyrosequencing libraries generated via Digestion- Ligation- Amplification [11], a novel approach for amplifying unknown sequences flanking known sequences. Anal- yses of these MFSs revealed 21 novel Mu TIR sequences and 324 genic Mu insertion hotspots that each contains $9 independent PLoS Genetics | www.plosgenetics.org 1 November 2009 | Volume 5 | Issue 11 | e1000733
Transcript of Mu Transposon Insertion Sites and Meiotic Recombination Events Co-Localize with Epigenetic Marks for...
Mu Transposon Insertion Sites and MeioticRecombination Events Co-Localize with Epigenetic Marksfor Open Chromatin across the Maize GenomeSanzhen Liu1,2, Cheng-Ting Yeh3,4, Tieming Ji5,6, Kai Ying1,2, Haiyan Wu5¤, Ho Man Tang3, Yan Fu4,7, Dan
Nettleton6, Patrick S. Schnable1,2,3,4,5,7*
1 Interdepartmental Genetics Graduate Program, Iowa State University, Ames, Iowa, United States of America, 2 Department of Genetics, Development, and Cell Biology,
Iowa State University, Ames, Iowa, United States of America, 3 Center for Plant Genomics, Iowa State University, Ames, Iowa, United States of America, 4 Department of
Agronomy, Iowa State University, Ames, Iowa, United States of America, 5 Bioinformatics and Computational Biology Program, Iowa State University, Ames, Iowa, United
States of America, 6 Department of Statistics, Iowa State University, Ames, Iowa, United States of America, 7 Center for Carbon Capturing Crops, Iowa State University,
Ames, Iowa, United States of America
Abstract
The Mu transposon system of maize is highly active, with each of the ,50–100 copies transposing on average once eachgeneration. The approximately one dozen distinct Mu transposons contain highly similar ,215 bp terminal inverted repeats(TIRs) and generate 9-bp target site duplications (TSDs) upon insertion. Using a novel genome walking strategy that usesthese conserved TIRs as primer binding sites, Mu insertion sites were amplified from Mu stocks and sequenced via 454technology. 94% of ,965,000 reads carried Mu TIRs, demonstrating the specificity of this strategy. Among these TIRs, 21novel Mu TIRs were discovered, revealing additional complexity of the Mu transposon system. The distribution of .40,000non-redundant Mu insertion sites was strikingly non-uniform, such that rates increased in proportion to distance from thecentromere. An identified putative Mu transposase binding consensus site does not explain this non-uniformity. Anintegrated genetic map containing more than 10,000 genetic markers was constructed and aligned to the sequence of themaize reference genome. Recombination rates (cM/Mb) are also strikingly non-uniform, with rates increasing in proportionto distance from the centromere. Mu insertion site frequencies are strongly correlated with recombination rates. Genedensity does not fully explain the chromosomal distribution of Mu insertion and recombination sites, because pronouncedpreferences for the distal portion of chromosome are still observed even after accounting for gene density. The similarity ofthe distributions of Mu insertions and meiotic recombination sites suggests that common features, such as chromatinstructure, are involved in site selection for both Mu insertion and meiotic recombination. The finding that Mu insertions andmeiotic recombination sites both concentrate in genomic regions marked with epigenetic marks of open chromatinprovides support for the hypothesis that open chromatin enhances rates of both Mu insertion and meiotic recombination.
Citation: Liu S, Yeh C-T, Ji T, Ying K, Wu H, et al. (2009) Mu Transposon Insertion Sites and Meiotic Recombination Events Co-Localize with Epigenetic Marks forOpen Chromatin across the Maize Genome. PLoS Genet 5(11): e1000733. doi:10.1371/journal.pgen.1000733
Editor: Harmit S. Malik, Fred Hutchinson Cancer Research Center, United States of America
Received June 30, 2009; Accepted October 19, 2009; Published November 20, 2009
Copyright: � 2009 Liu et al. This is an open-access article distributed under the terms of the Creative Commons Attribution License, which permits unrestricteduse, distribution, and reproduction in any medium, provided the original author and source are credited.
Funding: This research was supported by a grant from the National Research Initiative of the USDA Cooperative State Research, Education, and ExtensionService, grant no. 2005-35301-15715 to P. S. Schnable. The funders had no role in study design, data collection and analysis, decision to publish, or preparation ofthe manuscript.
Competing Interests: The authors have declared that no competing interests exist.
* E-mail: [email protected]
¤ Current address: Roche Global Pharma Development Center, Shanghai, China
Introduction
Gene knockouts are indispensable tools for genetic and
functional genomics. The maize Mutator (Mu) transposon is the
most active DNA transposon in plants [1]. In maize, a model
species for which transformation can be achieved at only a low
efficiency, Mu insertion mutagenesis has been an important tool
for cloning genes due to its high copy numbers and high rate of
germinal transposition [1,2,3]. In addition, because Mu elements
do not exhibit a preference for transposition to nearby sites [4], as
is the case for Ac/Ds transposons [5], they are ideally suited for
genome-wide mutagenesis screens.
The Mutator transposon family is a two-component system.
MuDR controls the transposition of itself and the other classes of
the 12 nonautonomous Mu elements that have been reported so
far [6]. All Mu elements share highly similar ,215 bp terminal
inverted repeats (TIRs) and upon insertion generate 9-bp target
site duplications (TSDs) directly flanking Mu elements. Mu exhibits
a preference for insertion in genes [7,8,9]. In addition, a few case
studies reported a preference for insertion within 59-UTRs or
exons of genes [7,8,9,10].
Although many investigations have been conducted on Mutator
transposons, little is known about the genome-wide distribution of
Mu insertions sites and the mechanisms by which these sites are
selected. In this study, ,965,000 Mu flanking sequences (MFSs)
were obtained from 454 pyrosequencing libraries generated via
Digestion-Ligation-Amplification [11], a novel approach for
amplifying unknown sequences flanking known sequences. Anal-
yses of these MFSs revealed 21 novel Mu TIR sequences and 324
genic Mu insertion hotspots that each contains $9 independent
PLoS Genetics | www.plosgenetics.org 1 November 2009 | Volume 5 | Issue 11 | e1000733
Mu insertions. Within genes, the Mu insertions exhibited a
pronounced preference for 59-ends with the strongest preference
near transcription start sites. Additionally, regions close to the ends
of chromosomes experience more Mu insertions than do peri-
centromeric regions. This non-uniform pattern is similar to
chromosomal distributions of recombination events and gene
density. However, gene density does not fully explain the non-
uniformity in genome distribution of Mu and recombination.
Analyses using both cytosine methylation and histone modification
data [12,13] revealed a strong correlation between Mu insertion
and cytosine methylation, H3K4me3 and H3K9ac modifications.
Mu insertions and meiotic recombination sites both concentrate in
genomic regions marked with epigenetic marks of open chromatin.
We, therefore, hypothesize that open chromatin structure plays a
key role in determining site selection of both Mu insertions and
meiotic recombination events.
Results
The application of DLA-454 strategy in sequencing MFSsDLA is a PCR-based method to amplify unknown sequences
flanking known sequences [11]. DLA was adapted to sequence Mu
flanking sequences using 454 pyrosequencing, a strategy that is
termed DLA-454 [11]. DLA is a novel adaptor-mediated PCR-
based method that uses a single-stranded oligo as an adaptor and
the conserved ,215 bp TIRs of Mu transposons as primer binding
sites to amplify MFSs. In DLA-454, 6-bp barcodes [14] are
inserted between the 454 primer A and a Mu-specific primer, while
an adaptor primer, Nsp-P, is appended to the 454 primer B. The
resulting library is sequenced using 454 primer A. By doing so,
sequencing reads should begin at the barcode, followed by the Mu-
specific primer and a portion of the TIR (pTIR), and end with the
MFS or in cases of short MFSs the Nsp-P primer. From two
technically replicated 454 GS-FLX runs, ,964,808 reads were
obtained. 99% of these sequences can be unambiguously
categorized using the barcodes because the first 6 bp of each read
exactly matched one of the barcode sequences. A two-step
trimming strategy (Methods) was applied to remove barcodes,
Mu primer, amplified Mu TIR, 454 primer B and the Nsp-P
adaptor primer to obtain MFSs. Based on the results of this two-
step trimming process, almost all (99.7%) reads include the Mu-
specific primer and over 94% carry amplified Mu TIR sequences,
demonstrating that most reads are generated from sites that
contain a Mu insertion. Those trimmed MFSs (638,492) that were
associated with TIR sequences were aligned to the maize B73
reference genome (B73 RefGen_v1) provided by the Maize
Genome Sequencing Project (MGSP) using BLASTN (Figure
S1). 58% (370,632/638,492) of the trimmed MFSs satisfied our
stringent alignment cut-offs (Methods). This rate of mapping is
comparable to that obtained by aligning Mo17 reads (sequenced
by Joint Genome Institute using 454 pyrosequencing) to the B73
RefGen_v1 using the same criteria (data not shown). Of the
aligning MFSs, 98.6% (365,600/370,632) could be uniquely
mapped to a single position on the B73 RefGen_v1 and the
positions of the corresponding Mu insertions determined. SNP
identified between the MFSs and the sequences of the B73
RefGen_v1 were used to distinguish independent Mu insertions in
different plants at the same genomic positions.
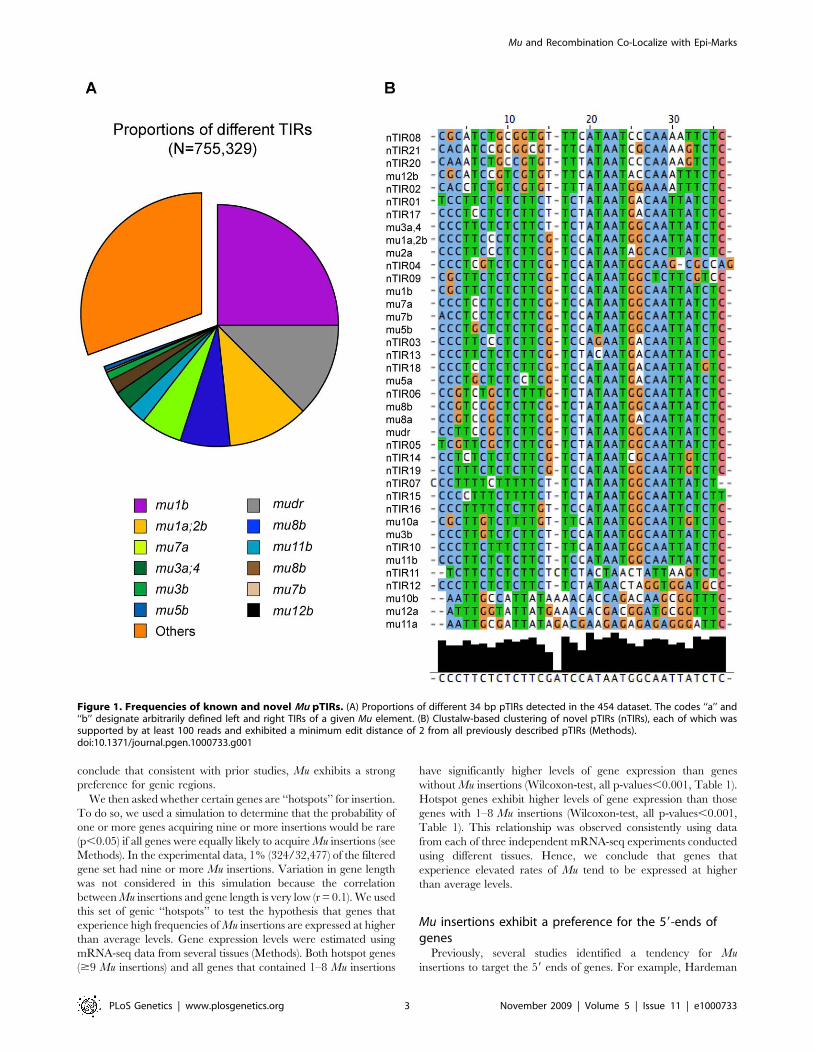
Novel Mu elementsAbout 70% (524,696/755,329) of the 454 reads that resulted
from the first trimming contained 34 bp pTIR sequences that
perfectly matched known pTIRs. pTIRs from all but one of the
previously described Mu elements were detected. Assuming the
frequency at which pTIRs were recovered is correlated with the
frequency of the corresponding classes of Mu elements in the Mu
stocks, we can conclude that Mu1 and MuDR have the highest
copy numbers (Figure 1A). Only a few 454 reads contained pTIRs
from Mu12 and none contained Mu10 pTIRs. The two TIRs (left
and right) of most Mu elements are not perfectly conserved. This
allowed us to determine that TIRs from both sides of six classes of
Mu elements (Mu1, Mu3, Mu4, Mu7, Mu8 and MuDR) could be
successfully amplified via DLA-454. MFS from only one side of
four classes of Mu elements (Mu2, Mu5, Mu11 and Mu12) were
recovered in the DLA-454 data set (Figure 1).
Approximately, 31% of the DLA-454 reads contain pTIRs that
do not perfectly match any known pTIRs. These novel sequences
could be the result of sequencing errors or be evidence for the
presence of novel pTIRs. We stringently required 34-bp pTIRs to
have a minimum edited distance (MED) of at least 2 relative to all
known pTIRs before classifying them as potentially novel pTIRs
(Methods). A total of 21 novel pTIRs each of which has at least
100 supporting reads were identified (Figure 1B, Table S1). Eight
of the Mu elements associated with these novel pTIRs were PCR
amplified using the TIR primer in combination with primers
designed based on the MFSs associated with the novel pTIR.
Seven of the PCR products were successfully sequenced using
Sanger technology. All seven novel pTIRs contained the expected
polymorphisms relative to known pTIRs, suggesting that this data
set has defined 21 novel Mu TIRs. Among the 21 novel TIRs
(nTIRs), 13 were associated with multiple independent MFSs (and
one, nTIR14, was associated with over 100 independent MFSs),
suggesting that they are or were mobile.
Genic hotspots for Mu insertionsIt has previously been established that Mu insertions exhibit a
preference for typically low-copy genes as compared to non-genes
[7,8,9]. Our first observation in support of this preference was that
only ,6% of all trimmed MFSs (600,139/638,492) contain repeat
sequences as per Emrich et al., 2004 [15]. In addition, more than
98% of mappable MFSs (365,600/370,632) could be uniquely
mapped to the genome even though up to 80% maize genome is
repetitive [16,17,18]. To more directly test whether this preference
of Mu elements to insert into genes holds true in our data set, we
examined the numbers of Mu insertions in all of the 32,540
annotated genes in the MGSP’s ‘‘filtered gene set’’ [18]. Even
though the filtered gene set comprises only 7.5% of the genome,
almost 75% of the mapped insertions are located within the 13,307
filtered genes. Similar results were obtained when these analyses
were repeated with less stringently called gene sets. We therefore
Author Summary
Genomic insertion sites of Mu transposons were amplifiedand sequenced via next generation technology, revealingmore than 40,000 non-redundant Mu insertion sites thatare non-uniformly distributed across the maize genomeand within genes. Along chromosomes, frequencies of Mutransposon insertions are strongly correlated with recom-bination rates. Although both Mu and recombinationoccur preferentially in genes, gene density does not fullyexplain these patterns. Instead, the finding that Muinsertions and meiotic recombination sites both concen-trate in genomic regions marked with epigenetic marks ofopen chromatin provides support for the hypothesis thatopen chromatin enhances rates of both Mu insertion andmeiotic recombination.
Mu and Recombination Co-Localize with Epi-Marks
PLoS Genetics | www.plosgenetics.org 2 November 2009 | Volume 5 | Issue 11 | e1000733
conclude that consistent with prior studies, Mu exhibits a strong
preference for genic regions.
We then asked whether certain genes are ‘‘hotspots’’ for insertion.
To do so, we used a simulation to determine that the probability of
one or more genes acquiring nine or more insertions would be rare
(p,0.05) if all genes were equally likely to acquire Mu insertions (see
Methods). In the experimental data, 1% (324/32,477) of the filtered
gene set had nine or more Mu insertions. Variation in gene length
was not considered in this simulation because the correlation
between Mu insertions and gene length is very low (r = 0.1). We used
this set of genic ‘‘hotspots’’ to test the hypothesis that genes that
experience high frequencies of Mu insertions are expressed at higher
than average levels. Gene expression levels were estimated using
mRNA-seq data from several tissues (Methods). Both hotspot genes
($9 Mu insertions) and all genes that contained 1–8 Mu insertions
have significantly higher levels of gene expression than genes
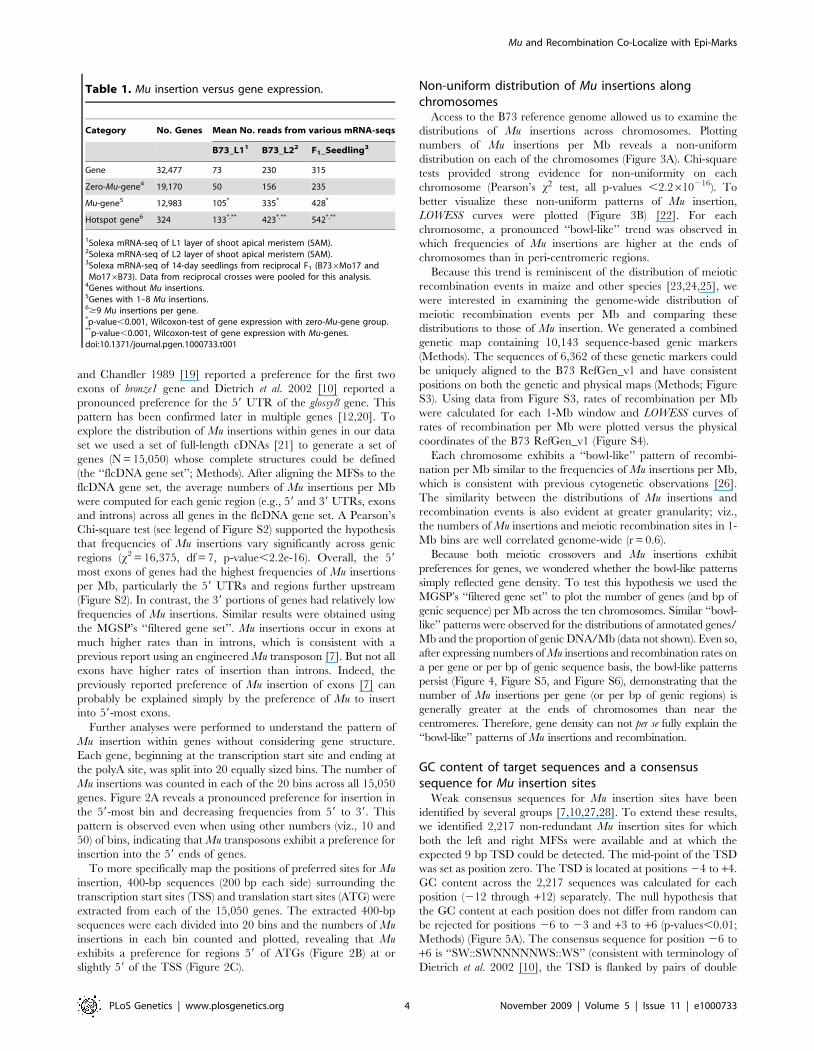
without Mu insertions (Wilcoxon-test, all p-values,0.001, Table 1).
Hotspot genes exhibit higher levels of gene expression than those
genes with 1–8 Mu insertions (Wilcoxon-test, all p-values,0.001,
Table 1). This relationship was observed consistently using data
from each of three independent mRNA-seq experiments conducted
using different tissues. Hence, we conclude that genes that
experience elevated rates of Mu tend to be expressed at higher
than average levels.
Mu insertions exhibit a preference for the 59-ends ofgenes
Previously, several studies identified a tendency for Mu
insertions to target the 59 ends of genes. For example, Hardeman
Figure 1. Frequencies of known and novel Mu pTIRs. (A) Proportions of different 34 bp pTIRs detected in the 454 dataset. The codes ‘‘a’’ and‘‘b’’ designate arbitrarily defined left and right TIRs of a given Mu element. (B) Clustalw-based clustering of novel pTIRs (nTIRs), each of which wassupported by at least 100 reads and exhibited a minimum edit distance of 2 from all previously described pTIRs (Methods).doi:10.1371/journal.pgen.1000733.g001
Mu and Recombination Co-Localize with Epi-Marks
PLoS Genetics | www.plosgenetics.org 3 November 2009 | Volume 5 | Issue 11 | e1000733
and Chandler 1989 [19] reported a preference for the first two
exons of bronze1 gene and Dietrich et al. 2002 [10] reported a
pronounced preference for the 59 UTR of the glossy8 gene. This
pattern has been confirmed later in multiple genes [12,20]. To
explore the distribution of Mu insertions within genes in our data
set we used a set of full-length cDNAs [21] to generate a set of
genes (N = 15,050) whose complete structures could be defined
(the ‘‘flcDNA gene set’’; Methods). After aligning the MFSs to the
flcDNA gene set, the average numbers of Mu insertions per Mb
were computed for each genic region (e.g., 59 and 39 UTRs, exons
and introns) across all genes in the flcDNA gene set. A Pearson’s
Chi-square test (see legend of Figure S2) supported the hypothesis
that frequencies of Mu insertions vary significantly across genic
regions (x2 = 16,375, df = 7, p-value,2.2e-16). Overall, the 59
most exons of genes had the highest frequencies of Mu insertions
per Mb, particularly the 59 UTRs and regions further upstream
(Figure S2). In contrast, the 39 portions of genes had relatively low
frequencies of Mu insertions. Similar results were obtained using
the MGSP’s ‘‘filtered gene set’’. Mu insertions occur in exons at
much higher rates than in introns, which is consistent with a
previous report using an engineered Mu transposon [7]. But not all
exons have higher rates of insertion than introns. Indeed, the
previously reported preference of Mu insertion of exons [7] can
probably be explained simply by the preference of Mu to insert
into 59-most exons.
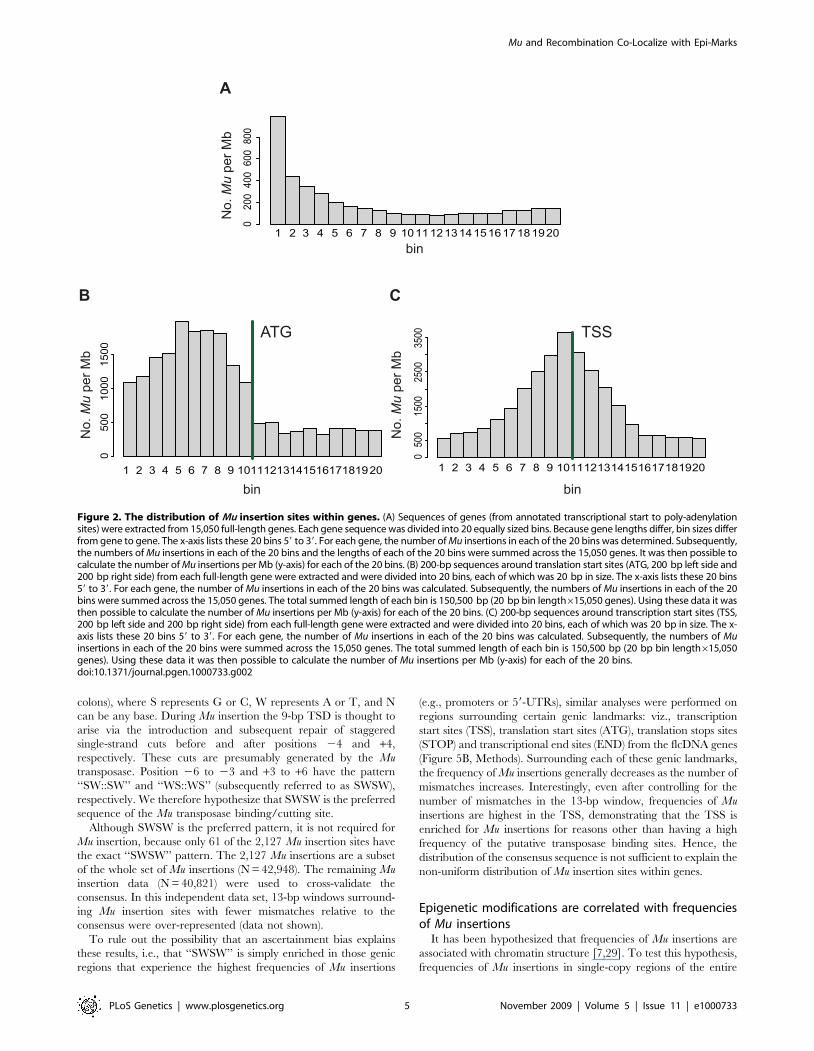
Further analyses were performed to understand the pattern of
Mu insertion within genes without considering gene structure.
Each gene, beginning at the transcription start site and ending at
the polyA site, was split into 20 equally sized bins. The number of
Mu insertions was counted in each of the 20 bins across all 15,050
genes. Figure 2A reveals a pronounced preference for insertion in
the 59-most bin and decreasing frequencies from 59 to 39. This
pattern is observed even when using other numbers (viz., 10 and
50) of bins, indicating that Mu transposons exhibit a preference for
insertion into the 59 ends of genes.
To more specifically map the positions of preferred sites for Mu
insertion, 400-bp sequences (200 bp each side) surrounding the
transcription start sites (TSS) and translation start sites (ATG) were
extracted from each of the 15,050 genes. The extracted 400-bp
sequences were each divided into 20 bins and the numbers of Mu
insertions in each bin counted and plotted, revealing that Mu
exhibits a preference for regions 59 of ATGs (Figure 2B) at or
slightly 59 of the TSS (Figure 2C).
Non-uniform distribution of Mu insertions alongchromosomes
Access to the B73 reference genome allowed us to examine the
distributions of Mu insertions across chromosomes. Plotting
numbers of Mu insertions per Mb reveals a non-uniform
distribution on each of the chromosomes (Figure 3A). Chi-square
tests provided strong evidence for non-uniformity on each
chromosome (Pearson’s x2 test, all p-values ,2.2610216). To
better visualize these non-uniform patterns of Mu insertion,
LOWESS curves were plotted (Figure 3B) [22]. For each
chromosome, a pronounced ‘‘bowl-like’’ trend was observed in
which frequencies of Mu insertions are higher at the ends of
chromosomes than in peri-centromeric regions.
Because this trend is reminiscent of the distribution of meiotic
recombination events in maize and other species [23,24,25], we
were interested in examining the genome-wide distribution of
meiotic recombination events per Mb and comparing these
distributions to those of Mu insertion. We generated a combined
genetic map containing 10,143 sequence-based genic markers
(Methods). The sequences of 6,362 of these genetic markers could
be uniquely aligned to the B73 RefGen_v1 and have consistent
positions on both the genetic and physical maps (Methods; Figure
S3). Using data from Figure S3, rates of recombination per Mb
were calculated for each 1-Mb window and LOWESS curves of
rates of recombination per Mb were plotted versus the physical
coordinates of the B73 RefGen_v1 (Figure S4).
Each chromosome exhibits a ‘‘bowl-like’’ pattern of recombi-
nation per Mb similar to the frequencies of Mu insertions per Mb,
which is consistent with previous cytogenetic observations [26].
The similarity between the distributions of Mu insertions and
recombination events is also evident at greater granularity; viz.,
the numbers of Mu insertions and meiotic recombination sites in 1-
Mb bins are well correlated genome-wide (r = 0.6).
Because both meiotic crossovers and Mu insertions exhibit
preferences for genes, we wondered whether the bowl-like patterns
simply reflected gene density. To test this hypothesis we used the
MGSP’s ‘‘filtered gene set’’ to plot the number of genes (and bp of
genic sequence) per Mb across the ten chromosomes. Similar ‘‘bowl-
like’’ patterns were observed for the distributions of annotated genes/
Mb and the proportion of genic DNA/Mb (data not shown). Even so,
after expressing numbers of Mu insertions and recombination rates on
a per gene or per bp of genic sequence basis, the bowl-like patterns
persist (Figure 4, Figure S5, and Figure S6), demonstrating that the
number of Mu insertions per gene (or per bp of genic regions) is
generally greater at the ends of chromosomes than near the
centromeres. Therefore, gene density can not per se fully explain the
‘‘bowl-like’’ patterns of Mu insertions and recombination.
GC content of target sequences and a consensussequence for Mu insertion sites
Weak consensus sequences for Mu insertion sites have been
identified by several groups [7,10,27,28]. To extend these results,
we identified 2,217 non-redundant Mu insertion sites for which
both the left and right MFSs were available and at which the
expected 9 bp TSD could be detected. The mid-point of the TSD
was set as position zero. The TSD is located at positions 24 to +4.
GC content across the 2,217 sequences was calculated for each
position (212 through +12) separately. The null hypothesis that
the GC content at each position does not differ from random can
be rejected for positions 26 to 23 and +3 to +6 (p-values,0.01;
Methods) (Figure 5A). The consensus sequence for position 26 to
+6 is ‘‘SW::SWNNNNNWS::WS’’ (consistent with terminology of
Dietrich et al. 2002 [10], the TSD is flanked by pairs of double
Table 1. Mu insertion versus gene expression.
Category No. Genes Mean No. reads from various mRNA-seqs
B73_L11 B73_L22 F1_Seedling3
Gene 32,477 73 230 315
Zero-Mu-gene4 19,170 50 156 235
Mu-gene5 12,983 105* 335* 428*
Hotspot gene6 324 133*,** 423*,** 542*,**
1Solexa mRNA-seq of L1 layer of shoot apical meristem (SAM).2Solexa mRNA-seq of L2 layer of shoot apical meristem (SAM).3Solexa mRNA-seq of 14-day seedlings from reciprocal F1 (B736Mo17 andMo176B73). Data from reciprocal crosses were pooled for this analysis.
4Genes without Mu insertions.5Genes with 1–8 Mu insertions.6$9 Mu insertions per gene.*p-value,0.001, Wilcoxon-test of gene expression with zero-Mu-gene group.**p-value,0.001, Wilcoxon-test of gene expression with Mu-genes.doi:10.1371/journal.pgen.1000733.t001
Mu and Recombination Co-Localize with Epi-Marks
PLoS Genetics | www.plosgenetics.org 4 November 2009 | Volume 5 | Issue 11 | e1000733
colons), where S represents G or C, W represents A or T, and N
can be any base. During Mu insertion the 9-bp TSD is thought to
arise via the introduction and subsequent repair of staggered
single-strand cuts before and after positions 24 and +4,
respectively. These cuts are presumably generated by the Mu
transposase. Position 26 to 23 and +3 to +6 have the pattern
‘‘SW::SW’’ and ‘‘WS::WS’’ (subsequently referred to as SWSW),
respectively. We therefore hypothesize that SWSW is the preferred
sequence of the Mu transposase binding/cutting site.
Although SWSW is the preferred pattern, it is not required for
Mu insertion, because only 61 of the 2,127 Mu insertion sites have
the exact ‘‘SWSW’’ pattern. The 2,127 Mu insertions are a subset
of the whole set of Mu insertions (N = 42,948). The remaining Mu
insertion data (N = 40,821) were used to cross-validate the
consensus. In this independent data set, 13-bp windows surround-
ing Mu insertion sites with fewer mismatches relative to the
consensus were over-represented (data not shown).
To rule out the possibility that an ascertainment bias explains
these results, i.e., that ‘‘SWSW’’ is simply enriched in those genic
regions that experience the highest frequencies of Mu insertions
(e.g., promoters or 59-UTRs), similar analyses were performed on
regions surrounding certain genic landmarks: viz., transcription
start sites (TSS), translation start sites (ATG), translation stops sites
(STOP) and transcriptional end sites (END) from the flcDNA genes
(Figure 5B, Methods). Surrounding each of these genic landmarks,
the frequency of Mu insertions generally decreases as the number of
mismatches increases. Interestingly, even after controlling for the
number of mismatches in the 13-bp window, frequencies of Mu
insertions are highest in the TSS, demonstrating that the TSS is
enriched for Mu insertions for reasons other than having a high
frequency of the putative transposase binding sites. Hence, the
distribution of the consensus sequence is not sufficient to explain the
non-uniform distribution of Mu insertion sites within genes.
Epigenetic modifications are correlated with frequenciesof Mu insertions
It has been hypothesized that frequencies of Mu insertions are
associated with chromatin structure [7,29]. To test this hypothesis,
frequencies of Mu insertions in single-copy regions of the entire
Figure 2. The distribution of Mu insertion sites within genes. (A) Sequences of genes (from annotated transcriptional start to poly-adenylationsites) were extracted from 15,050 full-length genes. Each gene sequence was divided into 20 equally sized bins. Because gene lengths differ, bin sizes differfrom gene to gene. The x-axis lists these 20 bins 59 to 39. For each gene, the number of Mu insertions in each of the 20 bins was determined. Subsequently,the numbers of Mu insertions in each of the 20 bins and the lengths of each of the 20 bins were summed across the 15,050 genes. It was then possible tocalculate the number of Mu insertions per Mb (y-axis) for each of the 20 bins. (B) 200-bp sequences around translation start sites (ATG, 200 bp left side and200 bp right side) from each full-length gene were extracted and were divided into 20 bins, each of which was 20 bp in size. The x-axis lists these 20 bins59 to 39. For each gene, the number of Mu insertions in each of the 20 bins was calculated. Subsequently, the numbers of Mu insertions in each of the 20bins were summed across the 15,050 genes. The total summed length of each bin is 150,500 bp (20 bp bin length615,050 genes). Using these data it wasthen possible to calculate the number of Mu insertions per Mb (y-axis) for each of the 20 bins. (C) 200-bp sequences around transcription start sites (TSS,200 bp left side and 200 bp right side) from each full-length gene were extracted and were divided into 20 bins, each of which was 20 bp in size. The x-axis lists these 20 bins 59 to 39. For each gene, the number of Mu insertions in each of the 20 bins was calculated. Subsequently, the numbers of Muinsertions in each of the 20 bins were summed across the 15,050 genes. The total summed length of each bin is 150,500 bp (20 bp bin length615,050genes). Using these data it was then possible to calculate the number of Mu insertions per Mb (y-axis) for each of the 20 bins.doi:10.1371/journal.pgen.1000733.g002
Mu and Recombination Co-Localize with Epi-Marks
PLoS Genetics | www.plosgenetics.org 5 November 2009 | Volume 5 | Issue 11 | e1000733

genome associated with various types of histone modifications
(Table 2, Methods) were compared. The average number of Mu
insertions per Mb was significantly greater for regions that
contained H3K4me3 modifications than for regions that con-
tained no H3K4me3 modification (Wilcoxon rank-sum p-value
,0.0001). The same held true for H3K9ac and H3K36me3
modifications. However, for H3K27me3 modification, the situa-
tion was reversed in that the presence of H3K27me3 modifications
was associated with a statistically significant decrease (Wilcoxon
rank-sum p-value ,0.0001) in the average number of Mu
insertions per Mb.
To check for possible interactions among histone modifications
with respect to Mu insertions, a linear model with the number of
Mu insertions per Mb as the response variable and the presence or
absence of each histone modification and all possible interactions
as explanatory variables was fit to the data. Each term in the
model was significant at the 0.01 level except for two of the four
three-way interactions and the four-way interaction among the
four indicator variables corresponding to the four histone
modifications. Thus, there is good evidence that the effects of
the histone modifications on Mu insertion rates are not simply
additive.
Table S2 shows that average number of Mu insertions per Mb
for all 16 possible combinations of the four histone modifications.
A second linear model was fit to the data used to generate Table
S2. This model allowed each of the 16 possible histone
modification patterns to have a different underlying Mu insertion
rate. After testing for differences between each pair of patterns
using the Tukey-Kramer method [30] for all pairwise compari-
sons, many significant differences across histone modification
Figure 3. The distribution of Mu insertion sites in the maize genome. (A) Each horizontal line on chromosomes represents a 1-Mb window.Lines are intensity- and color-coded to indicate the number of Mu insertions per Mb. Grey vertical lines represent the approximate positions ofcentromeres [67]. (B) The locally-weighted polynomial regression (LOWESS) curve with smooth span (f) equaling to 0.4 of the number of Mu insertionsper 1-Mb window (y-axis) was plotted versus the corresponding window’s coordinates (Mb, x-axis). The vertical paired grey lines representapproximate centromere positions [67]. Those patterns we observed are unlikely to be artifacts of the removal of repetitive MFS, because only a smallproportion of all MFSs (1.4%) were removed based on their ability to map to multiple positions in the genome.doi:10.1371/journal.pgen.1000733.g003
Mu and Recombination Co-Localize with Epi-Marks
PLoS Genetics | www.plosgenetics.org 6 November 2009 | Volume 5 | Issue 11 | e1000733

patterns were identified. In particular, regions with all histone
modifications except H3K27me3 had a significantly higher
average number of Mu per Mb than each of the other 15 patterns.
Generally speaking, the H3K9ac or H3K4me3 modifications were
most associated with elevated frequencies of Mu insertions among
four examined histone modifications. H3K27me3 regions had
relatively low frequency of Mu insertions even when other
modifications were co-located. In contrast, H3K36me3 regions
with H3K4me3 and/or H3K9ac co-located had much higher
frequencies of Mu insertions than did H3K36me3 regions without
Figure 4. Number of Mu insertions and recombination rate (cM) per Mb corrected by gene number and gene length onchromosome 1. (A) Numbers of Mu insertions per gene per Mb (red line) and cM per gene per Mb (green line) are standardized as described inMethods. Locally-weighted polynomial regression (LOWESS) curves with smooth span (f) equaling to 0.4 for both standardized values were plottedagainst the physical coordinates of chromosome 1 (Mb, x-axis). The approximate centromere position is shown in grey [67]. (B) Numbers of Muinsertions per bp of genic sequence per Mb (red line) and cM per bp of genic sequence per Mb (green line) are standardized as described in Methods.Locally-weighted polynomial regression (LOWESS) curves with smooth span (f) equaling to 0.4 for both standardized values were plotted against thephysical coordinates of chromosome 1 (Mb, x-axis). The approximate centromere position is shown in grey [67].doi:10.1371/journal.pgen.1000733.g004
Figure 5. GC patterns at Mu insertion sites. (A) More than 2,000 non-redundant Mu insertion sites for which MFSs were available on both sidesand exhibiting 9-bp TSDs were collected. The mid-point of each TSD was set as position 0. Relative positions decrease to the left and increase to theright. Average GC% was calculated for each position separately across .2,000 sequences and plotted against the relative positions. Regions betweenthe dashed lines represent the 99% confidence interval of randomly sampling 10,000 GC percentages (Methods). The shaded boxes cover positionswith GC% that differ significantly from expected by chance (Methods). Boxed regions are hypothesized to be Mu transposase binding sites. (B) 101-bpsequences centered at transcription start sites (TSS), translation start sites (ATG), translational end sites (STOP) and transcriptional end sites (END)were extracted from over 15,000 full-length genes, respectively. All 13-bp windows sliding from 1 to the end of each 101-bp sequence was comparedto the consensus sequence: ‘‘SW::SWNNNNNWS::WS’’. The number of mismatches was computed and sequences of these windows were assigned tonine groups containing 0–8 mismatches (x-axis). 13-bp sequences of Mu insertion sites were categorized into these nine groups as well. Thefrequency of sequences with Mu insertions (y-axis) in each group was plotted for four sets of sequences (TSS, ATG, STOP and END) respectively.doi:10.1371/journal.pgen.1000733.g005
Mu and Recombination Co-Localize with Epi-Marks
PLoS Genetics | www.plosgenetics.org 7 November 2009 | Volume 5 | Issue 11 | e1000733

H3K4me3 and/or H3K9ac co-located (Table S2). This illustrates
one example of the type of interaction identified in our initial
linear model analysis.
We also examined the relationship between DNA methylation
and Mu insertion rates. This was done by identifying single-copy
regions that either have evidence of containing DNA methylation
(McrBC sensitive) or evidence of being hypomethylated (methyl-
ation filtration data). Regions with evidence of being methylated
and being hypomethylated have frequencies of Mu insertions per
Mb 56 lower or 56higher than the WGS-GSS control, indicating
that at least in single-copy regions methylation is strongly
negatively correlated with frequencies of Mu insertions.
Discussion
The stocks used in this study exhibited a high rate of Mu
element transposition based on standard Robertson’s seedling test
assays [31]. Consequently, most Mu insertions investigated in this
study were recently generated. Most of them are far less likely to
have been subjected to selection than are less active elements.
Hence, their distributions are expected to better reflect insertion
site preferences than do the distributions of ‘‘ancient’’ transposons
detected during genome sequencing projects.
Although there are some exceptions (viz., the long arms of Chr 2
and 5), overall the distributions of Mu insertions and meiotic
recombination are similar, suggesting that common features may
be involved in site selection for both kinds of events. Both types of
events cluster in genes (this study and [32]), but we have
demonstrated that gene density is not sufficient to explain the
non-uniform distributions of Mu insertions and recombination
events along chromosomes.
Both types of events share a preference for GC-rich regions.
Meiotic recombination events cluster in GC-rich regions in
humans and yeast [33,34]. Similarly, our data are consistent with
a prior report [7] that Mu insertion sites exhibit a bias toward GC-
rich regions. The average GC content of the 100-bp intervals
surrounding Mu insertion sites is 56% in our data set versus the
average 47% GC in the filtered gene set. In addition, like the P
elements of Drosophila [35,36] to which they have been compared
mechanistically [37], Mu transposons exhibit a strong preference
for 59-ends of genes, which are typically enriched for GC relative
to 39 ends [38].
What is not clear from these data is whether the high GC
content of preferred Mu insertion sites is a cause or an effect of Mu
insertion site preference. The finding that the preferred Mu
insertion site consensus sequence does not exhibit a strong GC
signal (50% GC) suggests that although Mu transposon exhibits a
preference for regions that happen to have a high GC content,
they do so for reasons other than the GC content of these regions.
The overall frequency of Mu insertions in a given sequence is
related to its similarity to the preferential consensus sequence
(SW::SWNNNNNWS::WS). However, in different genic contexts
(e.g., 59-UTRs, 39-UTRs) this preferential sequence has dramat-
ically different impacts on Mu insertion frequency, strongly
indicating that Mu insertion site selection is more dependent on
genic context than on DNA sequences per se.
If DNA sequences are not a major factor in site selection for Mu
insertions, what are the causal factor(s)? Frequencies of Mu
insertions and meiotic recombination are both low in pericen-
tromeric regions, which are rich in heterochromatin, suggesting an
association with chromatin structure. Indeed, our genome-wide
results demonstrate that various types of epigenetic modifications
are differentially correlated with frequencies of Mu insertions. In
addition, the 59-ends of genes, which are preferred sites for both
Mu insertion in maize and meiotic recombination in yeast and
maize [25,33,34,35,36] have distinctive epigenetic modifications.
We demonstrated that Mu insertions particularly favor regions
surrounding the TSS, which also exhibit strong signal for both
H3K4me3 and H3K9ac [13,39] and exhibit low levels of cytosine
methylation [13,40,41]. In addition, H3K4me3 modifications
which cluster at DSB hotspots in yeast [42] were highly correlated
with Mu insertions in this study. Both of these epigenetic
modifications are associated with open chromatin structure
[39,40,43,44,45,46]. Hence, it is likely that chromatin structure
plays a key, and perhaps even a causal role, in site selection for
both Mu insertion and meiotic recombination. A number of other
transposons (e.g., Ac/Ds, P elements, MITEs, and Tos17) exhibit
preferences for low-copy genic regions [3,29,35,47,48,49,50,51],
which cluster in the euchromatin. It is therefore possible that these
transposons may share a common mechanism of insertion site
selection. To further test the hypothesis that chromatin structure is
a common feature driving transposon insertion site preferences,
the co-localization of new transposon insertion sites and/or
transposase binding site with epigenetic marks could be assayed
in mutants such as mop1 [52] that would be expected to alter the
distribution of epigenetic marks.
Methods
Genetic stocksThe Mu activity of Mu stocks was determined using Robertson’s
standard seedling test assays [31] that detects the effects of Mu
transposition via the appearance of new mutations. The progeny
of crosses between Mu active lines and various inbreds and hybrids
were self-pollinated to produce the Mu stocks used in this study.
The resulting kernels were planted and leaves harvested for
Table 2. Mu insertions in single-copy regions with different epigenetic modifications.
H3K4me31 H3K9ac2 H3K36me33 H3K27me34 Meth5 MF6 WGS-GSS7
Total length (Mb) 34.3 44.2 31.2 7.7 15.5 77.7 11.3
No. Mu 22,871 24,866 15,552 599 156 21,864 623
No. Mu/Mb 668 563 499 78 10 281 55
1CHIP-seq of trimethylation of lysine 4 in histone 3 [13].2CHIP-seq of acetylation of lysine 9 in histone 3 [13].3CHIP-seq of trimethylation of lysine 36 in histone 3 [13].4CHIP-seq of trimethylation of lysine 27 in histone 3 [13].5DNA methylation (McrBC sensitive, [13]).6Methylation filtration (hypomethylated, [12]).7Whole genome shotgun (WGS) - genome survey sequences (GSS) as per [66].doi:10.1371/journal.pgen.1000733.t002
Mu and Recombination Co-Localize with Epi-Marks
PLoS Genetics | www.plosgenetics.org 8 November 2009 | Volume 5 | Issue 11 | e1000733
genomic DNA isolation. Mu flanking sequences were amplified
from these genomic DNAs via DLA [11].
Genetic mapping was conducted using (N#357) of the IBM
(Intermated B736Mo17) Recombinant Inbred Lines (RILs) as
shown in Figure S7 and listed in Table S3. The IBM RILs are the
standard mapping population for the maize genetics community.
DLA for amplification, primer design, and barcode designDLA-454 was conducting following the protocol in [11]. As
compared to Liu et al., additional barcode primers were used:
AaMu
59 GCCTCCCTCGCGCCATCAGTCTGAGGCCTCYATT-
TCGTCGAATC
AbMu
59 GCCTCCCTCGCGCCATCAGGTTAGCGCCTCYATT-
TCGTCGAATC
AcMu
59 GCCTCCCTCGCGCCATCAGGGTACTGCCTCYATT-
TCGTCGAATC
AdMu
59 GCCTCCCTCGCGCCATCAGCATGTGGCCTCYATT-
TCGTCGAATC
AhMu
59 GCCTCCCTCGCGCCATCAGATTCTGGCCTCYATT-
TCGTCGAATC
Data processing of Mu 454 readsCategorization of reads based on barcodes and
trimming. Raw 454 reads were categorized by their barcodes.
SeqClean (http://compbio.dfci.harvard.edu/tgi/software/) was
used to trim barcodes, primers and partial Mu TIR sequences. A
two-step trimming strategy was applied. First, the Mu primer and
adaptor primer (default overlapping requirement, $80% identity
with primers) were removed. Trimmed sequences with the size
$60bp were subjected to a second round trimming to remove Mu
TIR regions ($30 bp overlapping, $80% identity with known,
novel and putative pTIRs (34 bp)).
Mapping MFS to the B73 reference genome (B73
RefGen_v1). Trimmed MFSs with size $40 bp were aligned
to the B73 RefGen_v1 using BLASTN. Only if there was a single
best BLAST alignment (lowest E-value hit) with $95% identity
and $40 bp covering the 59 region of the query MFS, was a MFS
considered to be unambiguously mapped onto the genome, which
allowed the corresponding Mu insertion site to be determined. The
requirement for a 59 match was established because the exact Mu
insertion sites were inferred by aligning the first 59 bases of MFSs
to the reference B73 genome. Failure of MFSs to align to the B73
RefGen_v1 could be due to DNA sequence polymorphisms
between B73 and the Mu stocks and/or DNA sequencing errors
and/or incomplete trimming.
Identification of SNPs between MFSs and the B73
RefGen_v1. SNPs were identified within unique alignments of
MFSs and the B73 RefGen_v1. For individual B73 genomic
regions where multiple MFSs were mapped, MOSAIK, a
reference-guided read aligner, was used to conduct realignment
of all sequences in the region ($95% identity) (http://
bioinformatics.bc.edu/marthlab/Mosaik) and SNPs were
identified using an updated version of PolyBayes [53] (http://
bioinformatics.bc.edu/marthlab/PolyBayes). SNP calls required at
least two 454 reads of support and the proportion of reads with a
given SNP among the total reads that cover a SNP site must have
been $20%. The probability of called SNPs being correct (as
calculated by PolyBayes) was larger than 0.9. Among the
,1.5 Mb of the B73 RefGen_v1 with at least 26 MFSs
coverage, 19,252 SNPs were identified. These SNPs were used
to distinguish among unique Mu insertions at the same genomic
positions.
Determination of non-redundant Mu insertions. To
conservatively correct for errors in trimming MFS 454 reads,
insertion sites with the same orientation that clustered within 3 bp
of each other were regarded as the same site. Those MFS with
different orientations could be the result of the same or different
insertion events. Therefore, if the distance between two sites was 8-
bp, indicating a 9-bp target site duplication (TSD), they were
counted as paired insertions. Otherwise, they were regarded as
different insertions.
MFSs were further distinguished using TIR and SNP data if
multiple reads were aligned to the same insertion sites. Different
types of TIRs indicate independent insertions from different
genetic lines. To avoid inappropriately separating MFSs at the
same position based on sequence errors in TIRs, additional
criteria were used. MFSs were treated as independent insertion
events if either of the criteria below was satisfied:
a) Both TIRs and SNPs provide evidence of independence.
b) A TIR was supported by at least two reads and the total
number of reads containing this TIR is not less than 20% of
the total reads at this site.
Identification of novel Mu TIRs. An edit distance between
two sequences is the minimum number of base modifications,
including base substitution, deletion and insertion, required to
change one sequence into the other sequence [14]. The first 34-bp
sequence was extracted from each of 454 reads after the first step
of trimming. Edit distances were calculated between the 34-bp
sequence and all known 34-bp pTIRs. The smallest edit distance
was obtained for this 34-bp sequence versus all known pTIRs. This
procedure was repeated for additional 34-bp windows obtained by
starting at nucleotide positions 2 to 7. Among seven smallest edit
distances from seven repeats of each read, the smallest value was
considered the minimum edit distance (MED) between possible
pTIRs and known pTIRs. If the MED was between 2 and 10, the
corresponding 34-bp sequence was extracted and treated as the
putative pTIR. In total, 153,136 reads with unknown pTIRs were
obtained. After removing redundancy, 292 non-redundant
putative pTIRs that had at least 100 reads of support were
obtained and imported to Sequencher 4.7 for sequence clustering.
Finally, 21 novel pTIRs were obtained.
Calculation of a cut-off to identify Mu insertion hotspot
genes. A total of 31,838 unique Mu insertions were mapped
onto 32,477 annotated genes (including 500 bp extensions
upstream and downstream from the transcription start and poly-
adenylation sites). We randomly assigned each of the 31,838 Mu
insertions to one of the 32,477 genes. When making each random
assignment, each gene was equally likely to receive an insertion.
This simulates a scenario in which no genes are preferential targets
for insertion. After all assignments were made, we noted the
maximum number of insertions received by any one gene. The
entire process was repeated 10,000 times to obtain 10,000
maximum numbers of insertions. For 95% of the 10,000
simulation runs, the maximum number of insertions in any one
gene was less than 9. Thus, we declared genes with 9 or more
insertions to be hotspot genes.
Approximately 1% [4,54] or fewer [37] of gametes carry
deletions adjacent to a given Mu insertion. Such events could
potentially cause mis-classifications of the same insertion as two (or
more) independent events. To determine if this rare event could
account for the observed hotspots. All of the Mu insertions at eight
Mu and Recombination Co-Localize with Epi-Marks
PLoS Genetics | www.plosgenetics.org 9 November 2009 | Volume 5 | Issue 11 | e1000733

hotspot genes were manually checked for independence using data
from the pTIRs, SNPs in the MFSs and TSDs. These analyses
found no evidence that Mu insertion hotspots artifacts caused by
Mu adjacent deletions.
mRNA-seq of B73 SAMs. Shoot apical meristems (SAMs) L1
and L2 were harvested from 14-day B73 seedlings. SAMs were
fixed, embedded in paraffin, sectioned and tissues collected via
LCM as described previously [55]. L1 and L2 were collected
separately from the same SAMs. RNA extraction, amplification
and synthesis of double-stranded cDNA were conducted according
to previous procedures [55].
mRNA-seq of B736Mo17 hybrid seedlings. RNAs of
B736Mo17 hybrids (F1) were extracted from 14-day-old F1
seedlings. RNAs were purified using DNaseI treatment followed
by cleanup with the RNeasy Plant Mini Kit (Qiagen, Valencia,
CA) as per manufacturer instructions. Sequencing library
construction was constructed using the Illumina mRNA-Seq
sample preparation kit.
Alignments of mRNA–seq reads. Illumina reads were
aligned to the B73 RefGen_v1 [18] with the short read aligner
NOVOALIGN (http://www.novocraft.com). One and two
mismatches per read were allowed in B73 and F1 RNA-seq
data, respectively. Only reads that uniquely mapped to the B73
RefGen_v1 were considered for further analysis.
Generation of the full-length gene set. A total of 22,490
full-length cDNAs [21] were mapped to the B73 RefGen_v1 using
GMAP [56]. Alignments were accepted only if a cDNA mapped to
a single location with $95% identity for all exons, $90% cDNA
coverage and #60 bp tail lengths. Gene structure was defined by
the original annotation in combination with the GMAP splice-
alignment results.
Statistical test of significant GC content at Mu insertion
sites. 2,127 highly reliable non-redundant Mu insertion sites
with both sides of MFSs and 9 bp TSDs were used to study the
sequence characteristics of Mu insertion sites (e.g. GC content). All
sequences were aligned at the mid-point of the TSD, which was set
as position 0. Relative positions decreased to the left and increased
to the right. Average GC content was calculated at each specific
position separately across 2,127 sequences. To obtain the
probability of observed GC% at each given position, one base
was randomly extracted from each of the 2,127 Mu insertion sites.
An insertion site for purposes of this analysis is a 400 bp region
centered on the 0 position of the TSD. Mean GC% was computed
across all extracted nucleotides (2,127 bases). This procedure was
repeated 10,000 times to obtain 10,000 GC% values. 99% of these
10,000 GC% values were between the dashed lines on Figure 4A.
GC percentages falling outside this range were considered
significant.
Consensus analysis of Mu insertion sites in different
genic regions. 101-bp sequences centered at transcription start
sites (TSS), translation start sites (ATG), translation stops sites
(STOP) and transcriptional end sites (END) were extracted from
each of the 15,050 flcDNA genes. The number of mismatches of
13-bp-window sequence compared with ‘‘SW::SWNNNN-
NWS::WS’’ was computed and sequences of all sliding windows
(1-bp stepping) from 101-bp sequences were categorized to nine
groups with 0–8 mismatches, respectively. 13-bp of Mu insertion
sites presumably centered at the midpoints of TSDs were
categorized to these nine groups as well. The frequency of Mu
insertions of each group was plotted (Figure 5B).
Recombination and Mu insertionConstruction of an integrated genetic map. An integrated
genetic map of maize was constructed using 10,188 markers
generated by multiple mapping projects (Missouri Mapping
Project [57,58], Genoplante [59], and our ISU mapping project
([60,61] and unpublished work). All of these markers had been
used to genotype overlapping sets of recombinant inbred lines
(RILs) from the IBM population (Figure S7). As part of this study
some of the ISU IDP markers were used to genotype additional
IBM RILs (Figure S8). All downloaded and newly generated
genotyping scores were analyzed using the MultiPoint mapping
software (Initial threshold recombination rate: 0.05; Final
threshold recombination rate: 0.35; Kosambi function for
genetic distances calculation) [62,63]. The genetic positions of
10,143 (,99%) mapped markers (Table S4) were quality checked
with previous map builds to repair inconsistencies.
Mapping genetic markers to physical positions. Most of
the genetic markers included in the integrated genetic map were
developed from known sequences. The source sequences (genomic
DNAs and ESTs) of these mapped markers were trimmed using
Seqclean against the UniCore vector database (dated: April 22nd,
2008). Sequences of 9,127 markers were successfully mapped to
the B73 RefGen_v1 genome reference sequence via BLASTN
($99% identity, #20 bp tails) and GMAP (#10 kb intron span,
$95% identity of all exons, $90% coverage, #5% tails or
#60 bp tails) for the genomic DNAs and ESTs, respectively. Only
sequences that mapped to a single location in the genome were
used for subsequent analyses (N = 7,185). For the purposes of this
analysis, we assumed that the structure of the B73 reference
genome was correct. Hence, 823 markers that aligned to the B73
RefGen_v1 were removed because they had genetic positions that
were inconsistent with the reference genome sequence. It is,
however, expected that in subsequent analyses these currently
excluded genetic markers may be useful in improving the structure
of the B73 reference genome. Using the pipeline described above,
6,362 of the markers could be anchored to the B73 RefGen_v1.
Estimation of genetic positions. The 6,362 genetic
markers that were anchored to the reference genome were used
to draw physical-genetic curves for each chromosome by fitting a
General Additive Model (GAM) using the gam function of R
[64,65]. The fitted curve was then used to estimate genetic
positions based on physical positions for estimating recombination
rates.
Estimation of recombination rates (cM/Mb). Each
chromosome was divided into non-overlapping 1-Mb bins. The
genetic positions of the starting and ending positions (expressed in
cM) of bins were estimated based on the fitted physical-genetic
curves. The physical positions of the starting and ending positions
of bins (expressed in Mb) were determined based on the B73
reference genome. The estimated recombination rate of a bin
(cM/Mb) is calculated by dividing the genetic length of the bin
expressed in cM by the physical length of the bin expressed in Mb
(physical length).
Correction of recombination rates and Mu insertion
frequencies by gene numbers and genic lengths. Numbers
of Mu insertions and genetic length (cM) were determined in each
of non-overlapping 1-Mb bins in each chromosome of the
reference genome. The number of genes and the total genic
length (bp) were calculated for the each 1-Mb bin as well.
Numbers of Mu insertions per gene (or bp) per Mb and cM per
gene (or bp) per Mb were then computed as the gene numbers (or
genic lengths) corrected Mu insertion frequencies and
recombination rates, respectively.
Standardization of recombination rates and Mu insertion
frequencies. To visualize recombination rates and Mu insertion
frequencies on the same plot, both values were standardized.
Values were standardized using the formula:x{�xx
sd(x), where x is
Mu and Recombination Co-Localize with Epi-Marks
PLoS Genetics | www.plosgenetics.org 10 November 2009 | Volume 5 | Issue 11 | e1000733
either recombination rate (cM/Mb) or Mu insertion frequency
(number of Mu insertions per Mb). �xx represents the mean of all xvalues in the same chromosome; sd(x) represents the standard
deviation of these x values. Gene and genic length corrected
recombination rates and Mu insertion frequencies were
standardized using the same method.
Epigenetic modifications and Mu insertionThe positions of histone modifications (H3K4me3, H3K9ac,
H3K36me3 and H3K27me3) and cytosine methylation relative to
BAC sequences from [13] were downloaded from http://www.
ncbi.nlm.nih.gov/geo/ and mapped to the B73 RefGen_v1 (100%
identity, 100% coverage). The 80–90% of sequences from each
data set that uniquely mapped to the genome were used for further
analysis. Whole genome shotgun genomic survey sequences
(WGS-GSS, N = 17,232) and methylation filtration (MF) sequenc-
es (N = 349,950) [12] (http://magi.plantgenomics.iastate.edu/)
[66] were mapped to the B73 RefGen_v1 ($98% identity,
$95% coverage). Only reads with a single best alignment (lowest
e-value) were considered for the further analysis, resulting in the
mapping of 81% (13,938/17,232) and 87% (304,490/349,950) of
the WGS-GSS and MF reads, respectively.
Accession numbersSequence read archive accession no: SRX007377, SRX007378.
Supporting Information
Figure S1 Clustering of 454 MFSs via alignment to the B73
RefGen_v1. Reads were categorized by their barcodes. A two-step
trimming strategy was applied to remove barcodes, primers and
amplified TIR sequences. Trimmed MFSs were mapped to the
B73 RefGen_v1. Alignments were required to exhibit $95%
identity, $40 bp overlap and have no 59 tails that failed to align to
the B73 RefGen_v1. Only reads with a single best hit (lowest
e-value) were used for further analyses (Methods). Finally,
redundancy was removed to obtain a non-redundant set of Mu
insertions.
Found at: doi:10.1371/journal.pgen.1000733.s001 (1.50 MB TIF)
Figure S2 Distribution of Mu insertion sites in different gene
regions. The numbers of Mu insertions were calculated for eight
different genic regions (100 bp upstream of the TSS: purple; the 59
UTR: orange; 59-most exons, all internal exons [as a group], and
39-most exons: blue; all introns [as a group]: black lines) of the
,12,000 full-length genes (excluding single-exon genes from the
15,050 full-length gene set). These regions are listed on the x-axis.
For each gene, the number of Mu insertions in each of the eight
genic regions was determined. Subsequently, the numbers of Mu
insertions in each of the eight genic regions and the lengths of each
of eight genic regions were summed across the 15,050 genes. It was
then possible to calculate the number of Mu insertions per Mb (y-
axis) for each of the eight genic regions. A Pearson’s Chi-square
test was used to test the null hypothesis that the probability of an
insertion in each genic region is proportional to its total length.
This null hypothesis was rejected (p-value ,2.2e-16), providing
strong evidence that frequencies of Mu insertion vary across genic
regions.
Found at: doi:10.1371/journal.pgen.1000733.s002 (0.40 MB EPS)
Figure S3 Genetic-physical map of 6,362 genetic markers. The
genetic position (cM) of each marker was plotted against its
physical coordinates on the 10 chromosomes of the B73 reference
genome (Mb) (Methods). Approximate centromere positions
(Wolfgruber et al., [67]) are flanked by pairs of vertical grey lines.
Those chromosomal regions with a paucity of polymorphic genetic
markers are, based on comparative genomic hybridization (CGH)
data (from Springer et al., PLoS Genetics 2009 [doi:10.1371/
journal.pgen.1000734]), highly conserved between B73 and
Mo17. The log intensity ratio of Mo17 to B73 (log2(Mo17/B73),
y-axis) for each CGH probe is plotted versus its physical position
on the B73 RefGen_v1 (Mb). CGH probes with statistically
significant values of log2(Mo17/B73) (q-value,0.05) are indicated
in red (Mo17.B73) and blue (B73.Mo17), while non-significant
probes are indicated in green (B73 = Mo17).
Found at: doi:10.1371/journal.pgen.1000733.s003 (2.51 MB TIF)
Figure S4 The distribution of recombination events on reference
chromosomes. The recombination rate was estimated for every
non-overlapping 1-Mb window across the genome (Methods). The
locally-weighted polynomial regression (LOWESS) curve with
smooth span (f) equaling to 0.4 was plotted (green line) using the
recombination rate (cM) per 1-Mb window (y-axis) versus the
corresponding window’s coordinates on the B73 reference
chromosome (Mb, x-axis). Approximate centromere positions
from Wolfgruber et al. [67] are shown in grey.
Found at: doi:10.1371/journal.pgen.1000733.s004 (0.33 MB EPS)
Figure S5 Numbers of Mu insertions and recombination rates
per Mb corrected by numbers of genes on reference chromosomes
2–10. Numbers of Mu insertions per gene per Mb (red lines) and
cM per gene per Mb (green lines), respectively were standardized
as described in Methods. The locally-weighted polynomial
regression (LOWESS) curves with smooth span (f) equaling to
0.4 of both standardized values were plotted against the physical
coordinates (Mb, x-axis) on reference chromosomes 2–10.
Approximate centromere positions from Wolfgruber et al. [67]
are shown in grey.
Found at: doi:10.1371/journal.pgen.1000733.s005 (0.38 MB EPS)
Figure S6 Numbers of Mu insertions and recombination rates
per Mb corrected by bp of genic sequences on reference
chromosomes 2–10. Numbers of Mu insertions per bp of genic
sequence per Mb (red lines) and cM per bp of genic sequence per
Mb (green lines), respectively were standardized as described in
Methods. The locally-weighted polynomial regression (LOWESS)
curves with smooth span (f) equaling to 0.4 of both standardized
values were plotted against the physical coordinates (Mb, x-axis)
on reference chromosomes 2–10. Approximate centromere
positions from Wolfgruber et al. [67] are shown in grey.
Found at: doi:10.1371/journal.pgen.1000733.s006 (0.38 MB EPS)
Figure S7 IBM RILs used to generate various genetic maps.
Venn diagram shows numbers of IBM RILs used in each of
several genetic mapping studies (Table S3). Data from these
mapping projects, supplemented with additional data (Figure S8),
were used to construct the integrated genetic map presented in
Table S4.
Found at: doi:10.1371/journal.pgen.1000733.s007 (0.48 MB EPS)
Figure S8 Markers used to construct the integrated genetic map.
An integrated genetic map of maize was constructed based on
genotyping data from 10,143 markers from multiple mapping
projects (Missouri Mapping Project (MMP) (Coe et al., Plant Phys
2002, Cone et al., Plant Phys 2002), Genoplante (Falque et al.,
Genetics 2005), ISU-IDP/TIDP (Map 7) (unpublished), ISU SNP
(Liu et al., Genetics 2010)). Some IDP markers were used to
genotype additional IBM RILs as part of this study. This flowchart
provides types and numbers of markers used to genotype RILs.
See also Figure S7 and Tables S3 and S4.
Found at: doi:10.1371/journal.pgen.1000733.s008 (0.56 MB TIF)
Mu and Recombination Co-Localize with Epi-Marks
PLoS Genetics | www.plosgenetics.org 11 November 2009 | Volume 5 | Issue 11 | e1000733

Table S1 Novel pTIRs.
Found at: doi:10.1371/journal.pgen.1000733.s009 (0.10 MB
DOC)
Table S2 Frequencies of Mu insertions in different combinations
of four epigenetic modifications in histone 3.
Found at: doi:10.1371/journal.pgen.1000733.s010 (0.05 MB
DOC)
Table S3 List of 357 RILs in the integrated genetic map.
Found at: doi:10.1371/journal.pgen.1000733.s011 (0.38 MB
DOC)
Table S4 10,143 genetic markers in the integrated map.
Found at: doi:10.1371/journal.pgen.1000733.s012 (9.95 MB
XLS)
Acknowledgments
We thank Ms. Natasha Zazubovich (McGill University) for constructing
the genetic map; Drs. Abraham Korol, Yefim I. Ronin, and David I.
Mester (University of Haifa) for assistance using the MultiPoint mapping
software; Ms. Jia-Ling Pik for experimental wet lab assistance; Dr.
Kazuhiro Ohtsu and graduate student Yi Jia for sharing unpublished
RNA-seq data; Drs. Alain Murigneux, Laurent Decousset, and Jorge
Duarte for discussions regarding the relationship between physical and
genetic distances; Drs. Jeffery Essner, Thomas Peterson, Hui-Hsien Chou,
Xiaoqiu Huang, An-Ping Hsia, and graduate student Ruth Swanson-
Wagner for useful discussions. In addition we thank the following consortia
for sharing data prior to publication: the Maize Genome Sequencing
Project for sharing genome sequences and annotation, the Maize
Centromere Project for sharing the positions of centromeres, Maize
Transposable Element Consortium for sharing the transposon data, and
Dr. Dan Rokhsar of the DOE’s Joint Genome Institute for sharing
unpublished whole genome shotgun sequences of the Mo17 genome.
Author Contributions
Conceived and designed the experiments: SL PSS. Performed the
experiments: SL HMT. Analyzed the data: SL CTY TJ KY HW YF
DN PSS. Contributed reagents/materials/analysis tools: SL CTY TJ KY
HW DN PSS. Wrote the paper: SL CTY YF DN PSS.
References
1. Lisch D (2002) Mutator transposons. Trends Plant Sci 7: 498–504.
2. McCarty DR, Settles AM, Suzuki M, Tan BC, Latshaw S, et al. (2005) Steady-
state transposon mutagenesis in inbred maize. Plant J 44: 52–61.
3. Candela H, Hake S (2008) The art and design of genetic screens: maize. Nat Rev
Genet 9: 192–203.
4. Lisch D, Chomet P, Freeling M (1995) Genetic characterization of the Mutator
system in maize: behavior and regulation of Mu transposons in a minimal line.
Genetics 139: 1777–1796.
5. Brutnell TP (2002) Transposon tagging in maize. Funct Integr Genomics 2:
4–12.
6. Walbot V, Rudenko GN (2002) MuDR/Mu transposons of maize. Washington,
D. C.: Amer. Soc. Microbiology.
7. Fernandes J, Dong Q, Schneider B, Morrow DJ, Nan GL, et al. (2004) Genome-
wide mutagenesis of Zea mays L. using RescueMu transposons. Genome Biol 5:
R82.
8. Cresse AD, Hulbert SH, Brown WE, Lucas JR, Bennetzen JL (1995) Mu1-
related transposable elements of maize preferentially insert into low copy
number DNA. Genetics 140: 315–324.
9. Settles AM, Latshaw S, McCarty DR (2004) Molecular analysis of high-copy
insertion sites in maize. Nucleic Acids Res 32: e54.
10. Dietrich CR, Cui F, Packila ML, Li J, Ashlock DA, et al. (2002) Maize Mu
transposons are targeted to the 59 untranslated region of the gl8 gene and
sequences flanking Mu target-site duplications exhibit nonrandom nucleotide
composition throughout the genome. Genetics 160: 697–716.
11. Liu S, Dietrich CR, Schnable PS (2009) DLA-Based Strategies for Cloning
Insertion Mutants: Cloning the gl4 Locus of Maize using Mu Transposon
Tagged Alleles. Genetics in press.
12. Palmer LE, Rabinowicz PD, O’Shaughnessy AL, Balija VS, Nascimento LU,
et al. (2003) Maize genome sequencing by methylation filtration. Science 302:
2115–2117.
13. Wang X, Elling AA, Li X, Li N, Peng Z, et al. (2009) Genome-wide and organ-
specific landscapes of epigenetic modifications and their relationships to mRNA
and small RNA transcriptomes in Maize. Plant Cell.
14. Qiu F, Guo L, Wen TJ, Liu F, Ashlock DA, et al. (2003) DNA sequence-based
‘‘bar codes’’ for tracking the origins of expressed sequence tags from a maize
cDNA library constructed using multiple mRNA sources. Plant Physiol 133:
475–481.
15. Emrich SJ, Aluru S, Fu Y, Wen TJ, Narayanan M, et al. (2004) A strategy for
assembling the maize (Zea mays L.) genome. Bioinformatics 20: 140–147.
16. SanMiguel P, Tikhonov A, Jin YK, Motchoulskaia N, Zakharov D, et al. (1996)
Nested retrotransposons in the intergenic regions of the maize genome. Science
274: 765–768.
17. Hake S, Walbot V (1980) The genome of Zea mays, its organization and
homology to related grasses. Chromosoma 79: 251–270.
18. Schnable PS, Ware D, Fulton RS, Stein JC, Wei F (2009) The B73 maize genome:
complexity, diversity, and dynamics. Science 326: doi:1126/science.1178534.
19. Hardeman KJ, Chandler VL (1989) Characterization of bz1 mutants isolated
from mutator stocks with high and low numbers of Mu1 elements. Dev Genet
10: 460–472.
20. May BP, Liu H, Vollbrecht E, Senior L, Rabinowicz PD, et al. (2003) Maize-
targeted mutagenesis: A knockout resource for maize. Proc Natl Acad Sci U S A
100: 11541–11546.
21. Soderlund C, Descour A, Kudrna D, Bomhoff M, Boyd L, et al. (2009)
Sequencing, Mapping and Analysis of 27,455 Maize Full-length cDNAs. PLoS
Genet 5: e740. doi: 10.1371/journal.pgen.1000740.
22. Cleveland WS (1979) Robust locally weighted regression and smoothingscatterplots. Journal of the American Statistical Association 74: 829–836.
23. Kong A, Gudbjartsson DF, Sainz J, Jonsdottir GM, Gudjonsson SA, et al. (2002)
A high-resolution recombination map of the human genome. Nat Genet 31:
241–247.
24. Akhunov ED, Goodyear AW, Geng S, Qi LL, Echalier B, et al. (2003) The
organization and rate of evolution of wheat genomes are correlated withrecombination rates along chromosome arms. Genome Res 13: 753–763.
25. Fengler K, Allen SM, Li B, Rafalski A (2007) Distribution of genes,
recombination, and repetitive elements in the maize genome. the Plant Genome
47: S83–S95.
26. Wang CJ, Harper L, Cande WZ (2006) High-resolution single-copy gene
fluorescence in situ hybridization and its use in the construction of a cytogeneticmap of maize chromosome 9. Plant Cell 18: 529–544.
27. Hanley S, Edwards D, Stevenson D, Haines S, Hegarty M, et al. (2000)
Identification of transposon-tagged genes by the random sequencing of Mutator-
tagged DNA fragments from Zea mays. Plant J 23: 557–566.
28. Raizada MN, Walbot V (2000) The late developmental pattern of Mu
transposon excision is conferred by a cauliflower mosaic virus 35S -drivenMURA cDNA in transgenic maize. Plant Cell 12: 5–21.
29. Bennetzen JL (2000) Transposable element contributions to plant gene and
genome evolution. Plant Mol Biol 42: 251–269.
30. Kramer CY (1956) Extension of multiple range tests to group means with
unequal numbers of replications. Biometrics 12: 307–310.
31. Robertson DS (1978) Characterization of a Mutator system in maize. Mutation
Research 51: 21–28.
32. Dooner HK, Hsia AP, Schnable PS (2009) Homologous recombination in
maize. Springer. pp 377–402.
33. Fullerton SM, Bernardo Carvalho A, Clark AG (2001) Local rates of
recombination are positively correlated with GC content in the human genome.Mol Biol Evol 18: 1139–1142.
34. Gerton JL, DeRisi J, Shroff R, Lichten M, Brown PO, et al. (2000) Inauguralarticle: global mapping of meiotic recombination hotspots and coldspots in the
yeast Saccharomyces cerevisiae. Proc Natl Acad Sci U S A 97: 11383–11390.
35. Liao GC, Rehm EJ, Rubin GM (2000) Insertion site preferences of the P
transposable element in Drosophila melanogaster. Proc Natl Acad Sci U S A 97:3347–3351.
36. Spradling AC, Stern DM, Kiss I, Roote J, Laverty T, et al. (1995) Genedisruptions using P transposable elements: an integral component of the
Drosophila genome project. Proc Natl Acad Sci U S A 92: 10824–10830.
37. Li J, Wen TJ, Schnable PS (2008) Role of RAD51 in the repair of MuDR-
induced double-strand breaks in maize (Zea mays L.). Genetics 178: 57–66.
38. Wong GK, Wang J, Tao L, Tan J, Zhang J, et al. (2002) Compositional
gradients in Gramineae genes. Genome Res 12: 851–856.
39. Zhang X, Bernatavichute YV, Cokus S, Pellegrini M, Jacobsen SE (2009)Genome-wide analysis of mono-, di- and trimethylation of histone H3 lysine 4 in
Arabidopsis thaliana. Genome Biol 10: R62.
40. Lister R, O’Malley RC, Tonti-Filippini J, Gregory BD, Berry CC, et al. (2008)
Highly integrated single-base resolution maps of the epigenome in Arabidopsis.
Cell 133: 523–536.
41. Ball MP, Li JB, Gao Y, Lee JH, LeProust EM, et al. (2009) Targeted andgenome-scale strategies reveal gene-body methylation signatures in human cells.
Nat Biotechnol 27: 361–368.
42. Borde V, Robine N, Lin W, Bonfils S, Geli V, et al. (2009) Histone H3 lysine 4
trimethylation marks meiotic recombination initiation sites. EMBO J 28:
99–111.
Mu and Recombination Co-Localize with Epi-Marks
PLoS Genetics | www.plosgenetics.org 12 November 2009 | Volume 5 | Issue 11 | e1000733
43. Santos-Rosa H, Schneider R, Bannister AJ, Sherriff J, Bernstein BE, et al. (2002)
Active genes are tri-methylated at K4 of histone H3. Nature 419: 407–411.44. Yan C, Boyd DD (2006) Histone H3 acetylation and H3 K4 methylation define
distinct chromatin regions permissive for transgene expression. Mol Cell Biol 26:
6357–6371.45. Li X, Wang X, He K, Ma Y, Su N, et al. (2008) High-resolution mapping of
epigenetic modifications of the rice genome uncovers interplay between DNAmethylation, histone methylation, and gene expression. Plant Cell 20: 259–276.
46. Cokus SJ, Feng S, Zhang X, Chen Z, Merriman B, et al. (2008) Shotgun
bisulphite sequencing of the Arabidopsis genome reveals DNA methylationpatterning. Nature 452: 215–219.
47. Yamazaki M, Tsugawa H, Miyao A, Yano M, Wu J, et al. (2001) The riceretrotransposon Tos17 prefers low-copy-number sequences as integration
targets. Mol Genet Genomics 265: 336–344.48. Feschotte C, Jiang N, Wessler SR (2002) Plant transposable elements: where
genetics meets genomics. Nat Rev Genet 3: 329–341.
49. Kolkman JM, Conrad LJ, Farmer PR, Hardeman K, Ahern KR, et al. (2005)Distribution of Activator (Ac) throughout the maize genome for use in regional
mutagenesis. Genetics 169: 981–995.50. Miyao A, Tanaka K, Murata K, Sawaki H, Takeda S, et al. (2003) Target site
specificity of the Tos17 retrotransposon shows a preference for insertion within
genes and against insertion in retrotransposon-rich regions of the genome. PlantCell 15: 1771–1780.
51. Jiang N, Bao Z, Zhang X, Hirochika H, Eddy SR, et al. (2003) An active DNAtransposon family in rice. Nature 421: 163–167.
52. Alleman M, Sidorenko L, McGinnis K, Seshadri V, Dorweiler JE, et al. (2006)An RNA-dependent RNA polymerase is required for paramutation in maize.
Nature 442: 295–298.
53. Marth GT, Korf I, Yandell MD, Yeh RT, Gu Z, et al. (1999) A generalapproach to single-nucleotide polymorphism discovery. Nat Genet 23: 452–456.
54. Das L, Martienssen R (1995) Site-selected transposon mutagenesis at the hcf106locus in maize. Plant Cell 7: 287–294.
55. Ohtsu K, Smith MB, Emrich SJ, Borsuk LA, Zhou R, et al. (2007) Global gene
expression analysis of the shoot apical meristem of maize (Zea mays L.). Plant J52: 391–404.
56. Wu TD, Watanabe CK (2005) GMAP: a genomic mapping and alignment
program for mRNA and EST sequences. Bioinformatics 21: 1859–1875.
57. Coe E, Cone K, McMullen M, Chen SS, Davis G, et al. (2002) Access to the
maize genome: an integrated physical and genetic map. Plant Physiol 128: 9–12.
58. Cone KC, McMullen MD, Bi IV, Davis GL, Yim YS, et al. (2002) Genetic,
physical, and informatics resources for maize. On the road to an integrated map.
Plant Physiol 130: 1598–1605.
59. Falque M, Decousset L, Dervins D, Jacob AM, Joets J, et al. (2005) Linkage
mapping of 1454 new maize candidate gene Loci. Genetics 170: 1957–1966.
60. Fu Y, Wen TJ, Ronin YI, Chen HD, Guo L, et al. (2006) Genetic dissection of
intermated recombinant inbred lines using a new genetic map of maize. Genetics
174: 1671–1683.
61. Liu S, Chen HD, Makarevitch I, Shirmer R, Emrich SJ, et al. (2010) High-
Throughput Genetic Mapping of Mutants via Quantitative SNP-typing.
Genetics in press.
62. Mester D, Ronin Y, Minkov D, Nevo E, Korol A (2003) Constructing large-scale
genetic maps using an evolutionary strategy algorithm. Genetics 165:
2269–2282.
63. Mester DI, Ronin YI, Nevo E, Korol AB (2004) Fast and high precision
algorithms for optimization in large-scale genomic problems. Comput Biol
Chem 28: 281–290.
64. Wood SN (2008) Fast stable direct fitting and smoothness selection for
generalized additive models. Journal of the Royal Statistical Society: Series B
70: 495–518.
65. Wood SN (2001) mgcv:GAMs and Generalized Ridge Regression for R. R News
1: 20–25.
66. Fu Y, Emrich SJ, Guo L, Wen TJ, Ashlock DA, et al. (2005) Quality assessment
of maize assembled genomic islands (MAGIs) and large-scale experimental
verification of predicted genes. Proc Natl Acad Sci U S A 102: 12282–12287.
67. Wolfgruber TK, Sharma A, Schneider KL, Albert PS, Koo D, et al. (2009)
Maize centromere structure and evolution: sequence analysis of centromeres 2
and 5 reveals dynamic loci shaped primarily by retrotransposons. PLoS Genet 5:
e743. doi:10.1371/journal.pgen.1000743.
Mu and Recombination Co-Localize with Epi-Marks
PLoS Genetics | www.plosgenetics.org 13 November 2009 | Volume 5 | Issue 11 | e1000733