Making Politics Work for Development - Pubdocs.worldbank.org.
Upload
khangminh22Category
view
1download
0
MP4San OANK OF THE PHILIPPINES
21 July 2016
MR. SUDIPTO SARKAR Sector Leaded Task Team Leader The World Bank East Asia and Urban Development Unit Sustainable Development Department 25th Floor, One Global Place 5th Ave. corner 25th Street Bonifacio Global City Taguig City
Attention Mr. Tomas A. Sta, Maria, Jr. Financial Management Specialist, WBOM
Subject Audited Entity Financial Statements Metro Manila Wastewater Management Project (MWMP) Loan Number 8162-PH
Dear Mr. Sarkar:
In accordance with Paragraph 3, Clause B — Financial Management, Financial Reports and Audits of Section II — Project Monitoring, Reporting and Evaluation of the loan agreement entered into by and between LANDBANK and World Bank, we are submitting herewith the LANDBANK's audited financial statements for the period ending December 31, 2015.
Also, please be informed that we already requested LANDBANK's Corporate Affairs Department (CAD) to upload the audited project financial statements for the period ending December 31, 2015.
Thank you.
Sincerely yours,
• //
;24/ GENFROSO-S. DAVID Head, Programs Management Department - II
cc: LPMG Corporate Banking Department 1
L ';
LANDBANK Plaza, 1598 M.H.del Pilar corner Dr.J.Quintos Sts., Malate,Manaa 1004 - Tel. Nos. 522-0000 • 551-2200 • 450-7001 www.landbank.com Nei 97/0 ,21b4 P\1\
Republic of the Philippines
COMMISSION ON AUDIT Commonwealth Ave., Quezon City
ANNUAL AUDIT REPORT
on the
LAND BANK OF THE PHILIPPINES
For the years ended December 31, 2015 and 2014
PART I
AUDITED FINANCIAL STATEMENTS
Republic of the Philippines COMMISSION ON AUDIT
Commonwealth Ave., Quezon City CORPORATE GOVERNMENT SECTOR
CLUSTER 1 - BANKING AND CREDIT
INDEPENDENT AUDITOR'S REPORT
The Board of Directors Land Bank of the Philippines Manila
We have audited the accompanying financial statements of Land Bank of the Philippines (LBP), and its subsidiaries (referred to as the "Group") which comprise the statements of financial position as at December 31, 2015 and 2014, and the statements of comprehensive income, statements of changes In capital funds and statements of cash flows for the years then ended, and a summary of significant accounting policies and other explanatory information.
Management's Responsibility for the Financial Statements
Management is responsible for the preparation and fair presentation of these financial statements in accordance with Philippine Financial Reporting Standards, and for such internal control as management determines is necessary to enable the preparation of financial statements that are free from material misstatement, whether due to fraud or error.
Auditor's Responsibility
Our responsibility is to express an opinion on these financial statements based on our audits, We conducted our audits in accordance with Philippine Public Sector Standards on Auditing. Those standards require that we comply with ethical requirements and plan and perform the audit to obtain reasonable assurance about whether the financial statements are free from material misstatement.
An audit involves performing procedures to obtain audit evidence about the amounts and cfisclosures in the financial statements. The procedures Selected depend On the auditor's judgment, including the assessment of the risks of material misstatement of the financial statements, whether due to fraud or error. In making those risk assessments, the auditor considers internal control relevant to the entity's preparation and fair presentation of the financial statements in order to design audit procedures that are appropriate in the circumstances, but not for the purpose of expressing an opinion on the effectiveness of the entity's internal control. An audit also includes evaluating the appropriateness of accounting policies used and the reasonableness of =Punting estimates made by management, as well as evaluating the overall presentation of the financial statements.
We believe that the audit evidence we have obtained is sufficient and appropriate to provide a basis for our audit opinion.
Opinion
In our opinion the financial statements present fairly, in all material respects, the financial position of the Group as at December 31, 2015 and 2014, and its financial performance and its cash flows for the years then ended in accordance with Philippine Financial Reporting Standards.
Emphasis of Matter
We draw attention to Note No. 10 to the 2015 and 2D14 Financial Statements which disclosed, among others, that the LBP's Available-for-sale - Domestic-Private investments account include unrestored 3,366,800 MERALCO shares with fair value of P1,077.376 million and P861.901 million in 2015 and 2014, respectively. Likewise, the corresponding cash and property dividends earned amounting to P212.647 million and P169.448 million in 2015 and 2014, respectively, and 9,488,394 shares of stock in Rockwell Land Corporation, respectively, were still unpaid to LBP.
To compel MERALCO to comply with the Supreme Court decision, LBP filed the Petition to Cite MERALCO and other Respondents in Indirect Contempt before the Supreme Court on April 14, 2015. On May 30, 2016, LBP filed its reply to the Comment of MERALCO.
Our opinion is not modified in respect of the above matter.
COMMISSION ON AUDIT
CORA D. Supervising Audito
17 June 2016
tis LAND BANK OF THE PHILIPPINES —.—„
STATEMENT OF MANAGEMENTS RESPONSIBILITY FOR FINANCIAL STATEMENTS
The management of the Land Bank of the Philippines and Subsidiaries (the Group) and the Land Bank of the Philippines (the Parent) is responsible for the preparation and fair presentation of the financial statements as at and for the years ended December 31, 2015 and 2014, including the additional components attached therein in accordance with the prescribed financial reporting framework indicated therein. This responsibility includes designing and implementing internal controls relevant to the preparation and fair presentation of financial statements that are free from material misstatement, whether due to fraud or error, selecting and applying appropriate accounting policies and making accounting estimates that are reasonable in the circumstances.
The Board of Directors reviews and approves the financial statements before such statements are issued to the regulators, creditors and other users.
The Commission on Audit has examined the financial statements of ti 4. Group and of the Parent Company in accordance with the Philippine Standards on Auditing and has expressed opinion on the fairness of presentation upon completion of such audit, in its report to the Board of Directors.
ANDRES C. SARMIENTO EVP, Operations Sector
ANTONIO HUGO, JR. FVP, Controllership Group
4telI/tE. PICO President and CEO
Signed this t3 f's' day of 2016
LANORAtik Pb 1598M, H. del Pity comer Dra Quint°, 5t.t., MalamMaotia 1004 -Tel. Nos. 522-OCCO. 551-2200. 450-7001 wverdandbankcmn
e fecal,
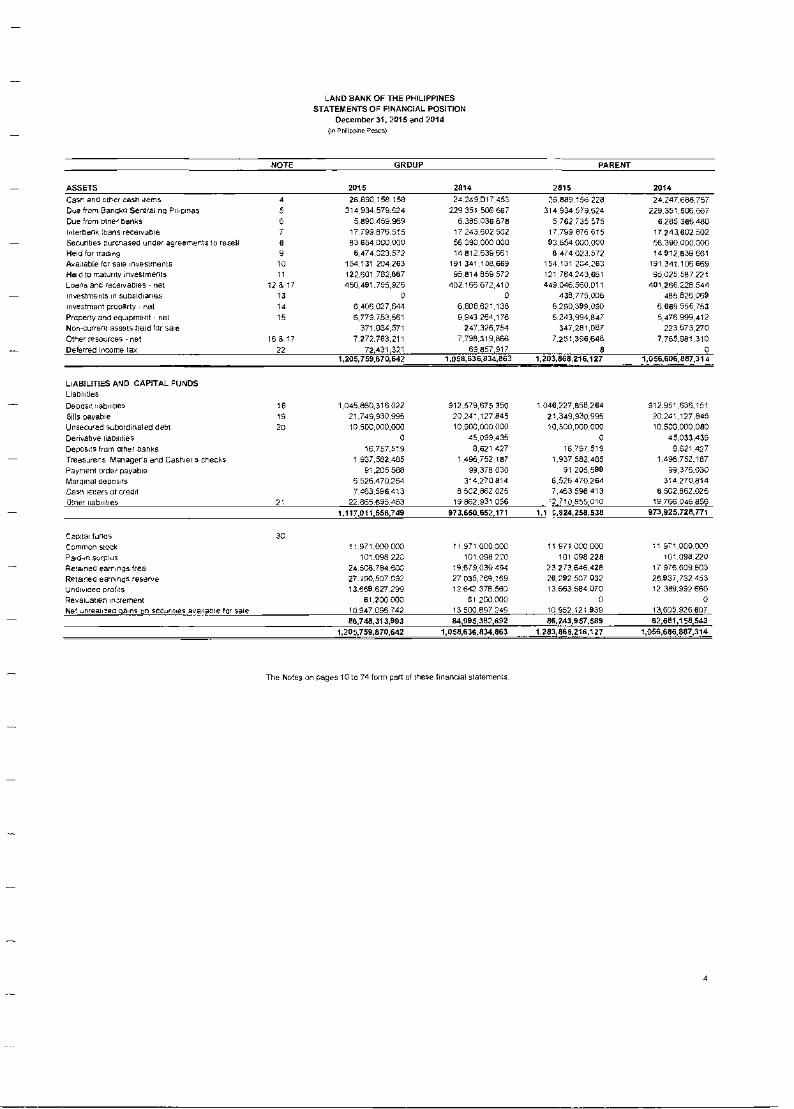
LAND BANK OF THE PHILIPPINES STATEMENTS OF FINANCIAL POSITION
December 31, 201 S and 2014
Prolipere Pews)
NOTE GROUP PARENT
ASSETS 2015 2014 2015 2014
Casr and mner cash earns 26,098155.119 24 249.01. 455 26089.156226 24 247.688 75/
Duz from Banqko Sentral ng Papinas 314.934 579.624 229 351 506 667 314 934 579.524 X351.506.557
Due 4rern °tie, banks 5.890 459 969 6 385.038 878 5 782 735 575 6285.385480 785 480
interbank loans receivable 17 799 876 515 17 243.602 502 17.799 576 515 17.243,802.502
Securities eurcnased under agreeraer1s 10 resell 83 654 030.000 56 390.000 000 83.654 000.000 56.390.000800
Held for trading 8,474.023.572 14 812.839 661 8.474.023.572 14 812.839 661
Available for sale investments 154131 204 263 191 341.100.669 154.131 204.263 191.341.108 669
Held to maturity investments 122,601,752,887 95,814 059 572 121 704 243.661 95.025 587 221
Loans and receivables net 128 17 450,481,755,326 402.186 672,410 449046,560.011 401,265228504
Investments in subsidiaries 1 0 0 438775.006 085 826,068
Investment property net 1 5,406.027,644 6,800,621,136 6.290.389.090 6.689 559,753
Properly and equipment net 1 6,778753,581 5,943264,176 6243,904,847 5,478999,412
Non-current assets held for sale 371.034,571 207.326,754 347.201,067 223.573,270
Other resources-net 16 7.272.783,211 7,798.319,868 7.251.396.645 7.755.981.310
Deferred income tax 2 72.431 321 63 857 317 0 0
205,759,570,642 .058,675.034.063 L 203,068,216,127 055,606,557,314
LIABILITIES AND CAPITAL FUNDS Liabilities
Depose. abaties 19 1,045860,316022 912.579675 350 1046,227,858,264 912951.636151
Bills payable 19 21.749,930995 20.241.127 845 21.349,930,995 20241.127.845
Unsecured subordinated debt 20 10.500,004000 10,500,000 000 18500.000 000 10 5.%,000,000
Derivative habaties 0 46033 435 0 45,033,435
Deposes from other banks 16.757.519 8,621 427 16'757519 519 8.621.427
Treasurers Managers and Cashier s checks 1 937,582.495 1,4,752.187 1 937 582005 1496.762187
Payment order payable 91,205588 99 378 030 91 205588 99,378,030
Marginal deposes 6526,470264 3''4270 814 6,525470,264 314270814
Casn lerers of credit 7.463.598 413 8 528662 025 7.053 590 413 5502,062026
ID1ne, 21 22 665 695 463 19 862.931 058 2 710 855 010
1.117.011,558,749 973,650.552,171 4,824,268538 973,925,728,771
Caeaal tunes 30
Common sled< -,- 971 730 COO 11 971 000 riCC. 11 971 000 000 I I 971 000 000
Paean sure us 101 098 220 101 048 220 101 098 220 101 098 220
Retained earrees free 2462784.800 19 673 039 494 23 273 646 420 17 8.76 609 603
Retained earned, reserve 27190,507032 507 032 27 035 769 169 26,282.507 032 266377772 453 772 453
UndivICEC pro is 13 968 627 299 12 642 378 560 13 663 554 070 2 389 392 660
Revaluation increment 61 200 000 61 2G0 000 0 0
Nee ,nreahzea gains on Securities available for sale 10 907 096 702 13 500.897. 249 10 952 121 839 13505.325.507
88,745,313.893 04.905,382,692 86,243,957,589 82,681,158,543
1,205,759,870,642 1,055.636,034,863 1,203.065,216,127
The Notes on pages 10 to 74 form pan of these financial statements.
4
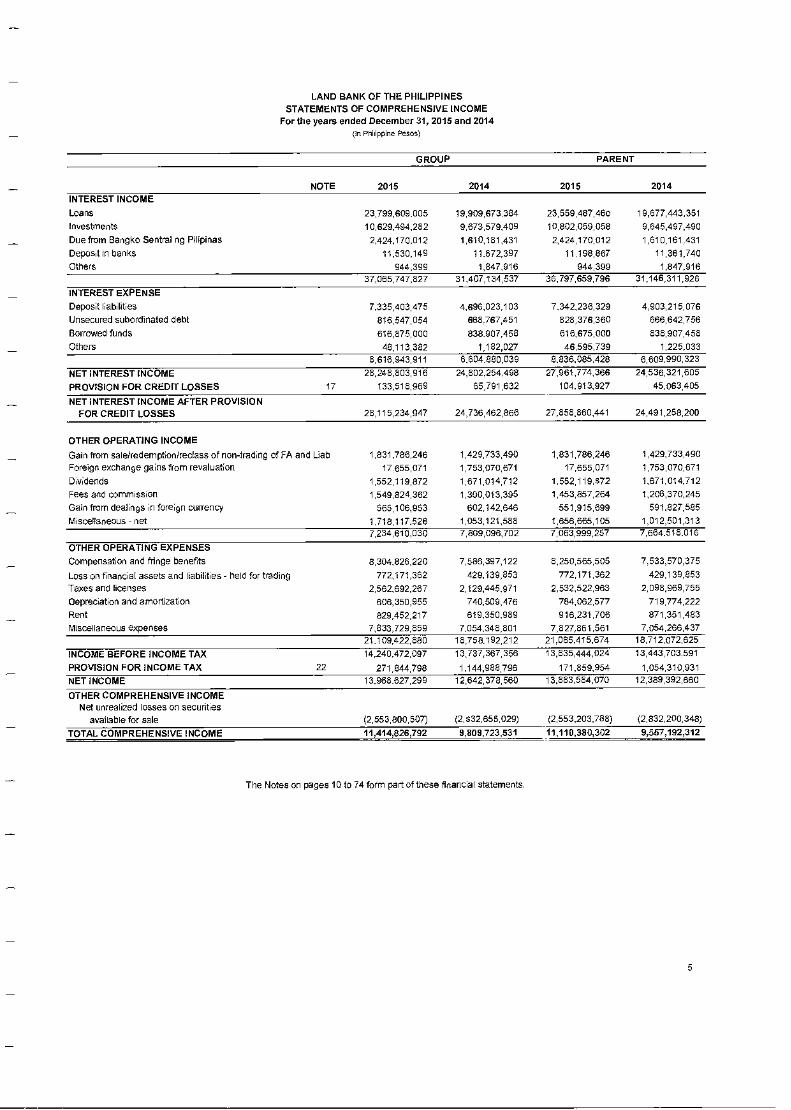
LAND BANK OF THE PHILIPPINES STATEMENTS OF COMPREHENSIVE INCOME
For the years ended December 31, 2015 and 2014
(1F Philippine Pesos)
GROUP PARENT
NOTE 2015 2014 2015 2014
INTEREST INCOME
Loans 23,799,609005 19,909,873.384 23,559,487,460 19,677.443.351
Investments 10,829,494,262 9,673,579,409 10,802,059,058 9,645,497,490
Due from Bangko Sentral ng Primes 2,424.170012 1,810,161,431 2,424,170,012 1,810,161.431
Deposit In banks 11,530,149 11872,397 11.198,867 11,361,740
Others 944,399 1,847,916 944,399 1,847.916 37,085,747,827 31,407,134,537 36,797,859,796 31,146.311,928
INTEREST EXPENSE
Deposit liabilities 7.335,408,475 4,896,023 103 7,342,236,329 4.903.215,078
Unsecured subordinated debt 816,547,054 868 767,451 828,378,360 866,642,756
Borrowed funds 618875,000 838,907458 616,875,000 838,907,458
Others 484 13,382 1,182,027 48,595,739 1,225,033 8,816 943,911 6.604.880,039 8,836.085,428 6,609990,323
NET INTEREST INCOME 28,248,803,916 24,802.254 498 27,961,774,368 24,536,321,605
PROVISION FOR CREDIT LOSSES 17 133,518,969 65,791,632 104.913,927 45,063,405
NET INTEREST INCOME AFTER PROVISION FOR CREDIT LOSSES 28,115,284,947 24,736,462,866 27,856,880,441 24,491,258,200
OTHER OPERATING INCOME
Gain from saleiredemption/reclass of non-trading of FA and Liab 1,831,786,246 1,429,733,490 1,831,786,246 1,429,733,490
Foreign exchange gains from revaluation 17 655,071 1,753,070,671 17,655,071 1,753,070,671
Dividends 1,552,119,872 1,671,014,712 1,552,119,872 1,671,014,712
Fees and commission 1,549,824,362 1,300,013,395 1,453,857,264 1,206,370,245
Gain from dealings in foreign currency 565,106,953 602,142,846 551,915,699 591.827,585
Miscellaneous-net 1.718,117.526 1,053,121,588 1,656,665,105 1,012,501,313 7,234,610,030 7,809,096,702 7,063,999,257 7,664.518,016
OTHER OPERATING EXPENSES
Compensation and fringe benefits 8,304,826,220 7,586,397,122 8,250,565,505 7.538,570,875
Loss on financial assets and liabilities - held for trading 772,171,362 429,139,853 772,171,362 429,139 853
Taxes and licenses 2,562,892,287 2,129,445,971 2,532,522,963 2,098,969,755
Depreciation and amorlization 806,350,955 740,509,476 784,062,577 719 774,222
Rent 829,452,217 818,350,989 918,231,706 871,351,483
Miscellaneous expenses 7,833,729,859 7,054,348,801 7,827,861,561 7,054,266,437 21,109,422,880 18.758192,212 21.085,415,674 18,712,072,625
INCOME BEFORE INCOME TAX 14 240 472,097 13,787,367,356 13,835,444,024 13,443,703 591
PROVISION FOR INCOME TAX 22 271,844,798 1,144,988,796 171.859,954 1R54810,931
NET INCOME 13.968 627,299 12,642,378,560 13,663,584,070 12,389,392,660
OTHER COMPREHENSIVE INCOME Net unrealized losses on securities
available for sale (2,553,800,507) (2,832,655,029) (2,553,203,788) (2,832,200,348)
TOTAL COMPREHENSIVE INCOME 11,414,826,792 9,809,723,531 11,110,390 302 9,557,192,312
The Notes on pages 10 to 74 form part of these financial statements.
5
The Notes on pages 10 to 74 form pan of these nnancial 2
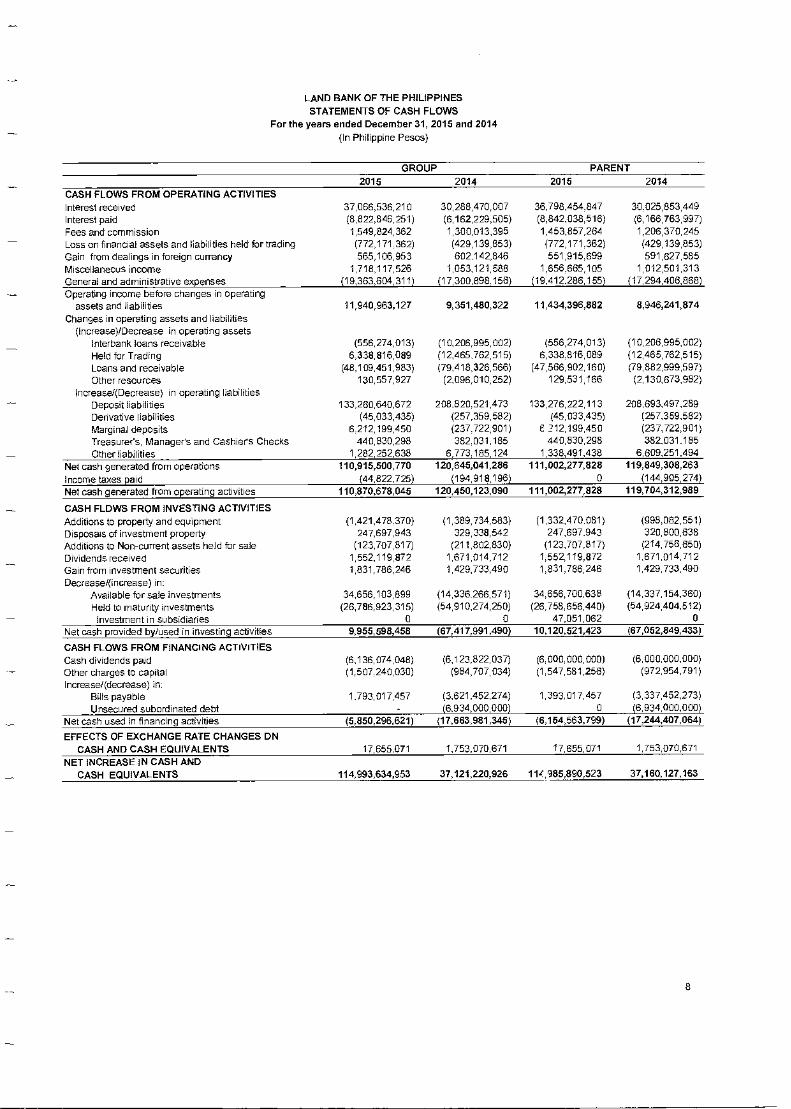
LAND BANK OF THE PHILIPPINES STATEMENTS OF CASH FLOWS
For the years ended December 31, 2015 and 2014 (In Philippine Pesos)
G OU PARENT 2015 2014 2015 2014
CASH FLOWS FROM OPERATING ACTIVITIES Interest received Interest paid Fees and commission Loss on financial assets and liabilities held for trading Gain from dealings in foreign currency Miscellaneous income General and administrative expenses
37,066,536,210 (8,822,846,251) 1,549,824,362 (772,171 362) 565,106,953
1,718,117,526 (19,363,604,311)
30,288,470,007 (6,162,229,505) 1,300,013,395 (429,139,853) 602.142,846
1,053,121,588 (17,300,898.156)
36,798,454.847 (8,842,038,516) 1,453,857,264 (772,171.362) 551,915.699
1,656.665,105 (19,412.286,155)
30.025,853,449 (6,166,763,997) 1,206,370,245 (429,139,853) 591,827,585
1 012,501,313 (17 294,406,868)
Operating income before changes in operating assets and liabilities 11,940,963,127 9,351,480,322 11,434,396,882 8,946,241,874
Changes in operating assets and liabilities (Increase)/Decrease in operating assets
Interbank loans receivable (556,274,013) (10,206,995,002) (556,274,013) (10,206,995,002)
Held for Trading 6,338,816,089 (12,465.762,515) 6,338 616,089 (12,465,762,515) Loans and receivable (48,109,451,983) (79,418,326,566) (47,566,902,160) (79,882,999,597) Other resources 130,557,927 (2,096,010,252) 129,531,166 (2,130,873,982)
Increase/(Decrease) in operating liabilities Deposit liabilities 133,280,640,672 208.820.521,473 133,276,222,113 208,893,497,289 Derivative liabilities (45 033,435) (257,359,582) (45,033,435) (257,359,582) Marginal deposits 6 212,199,450 (237.722,901) E 212,199,450 (237,722,901) Treasurer's, Manager's and Cashier's Checks 440,830298 298 382.031,185 440,830,298 382.031.185
Other liabilities 1,282,252,638 6,773.185,124 1,338,491,438 6,809,251,494
Net cash generated from operations 110,915,500,770 120,645,041,286 111,002,277,828 119,849,308,263
Income taxes paid 725) (44,822725) (194,918,196) 0 (144,995,274)
Net cash generated from operating activities 110,870,678,045 120,450,123,090 111,002,277,828 119,704,312,989
CASH FLOWS FROM INVESTING ACTIVITIES Additions to property and equipment (1,421,478.370) (1,389,734,583) (1,332,470 081) (998,082,551) Disposals of investment property 247,697,943 329,338,542 247,697.943 320,800,638
Additions to Non-current assets held for sale (123,707,817) (211,802,830) (123,707 817) (214,756,850)
Dividends received 1,552,119,872 1,671,014,712 1,552,119,872 1,671,014,712
Gain from investment securities 1,831,786,246 1,429,733.490 1,831.786,246 1,429,733,490
Decrease/(increase) in Available for sale investments 34,656,103,899 (14,336 266,571) 34,656,700,638 (14,337,154,360)
Held to maturity investments (26,786,923,315) (54,910,274,250) (26,758.656,440) (54,924,404,512)
Investment in subsidiaries 0 0 47,051,062 0 Net cash provided by/used in investing activities 9,955,598,458 (67,417,991,490) 10,120,521,423 (67,052,849,433)
CASH FLOWS FROM FINANCING ACTIVITIES Cash dividends paid (6,136,074,048) (6,123,822,037) (6 000 000,000) (6,000,000,000) Other charges to capital (1,507 240,030) (984,707,034) (1,547,581,256) (972,954,791)
Increase/(decrease) in. Bills payable 1.793,017,457 (3,621,452,274) 1,393 017,457 (3,337,452,273) Unsecured subordinated debt (6,934,000,000) (6,934,000,000)
Net cash used in financing activities (5,850,296,621) (17,663,981,345) (6,154,563,799) (17,244,407,064)
EFFECTS OF EXCHANGE RATE CHANGES ON CASH AND CASH EQUIVALENTS 17,655,071 1,753,070,671 17,655,071 1,753,070,671
NET INCREASE IN CASH AND CASH EQUIVALENTS 114,993,634,953 37,121,220,926 11A 985,890,523 37,160,127,163
8
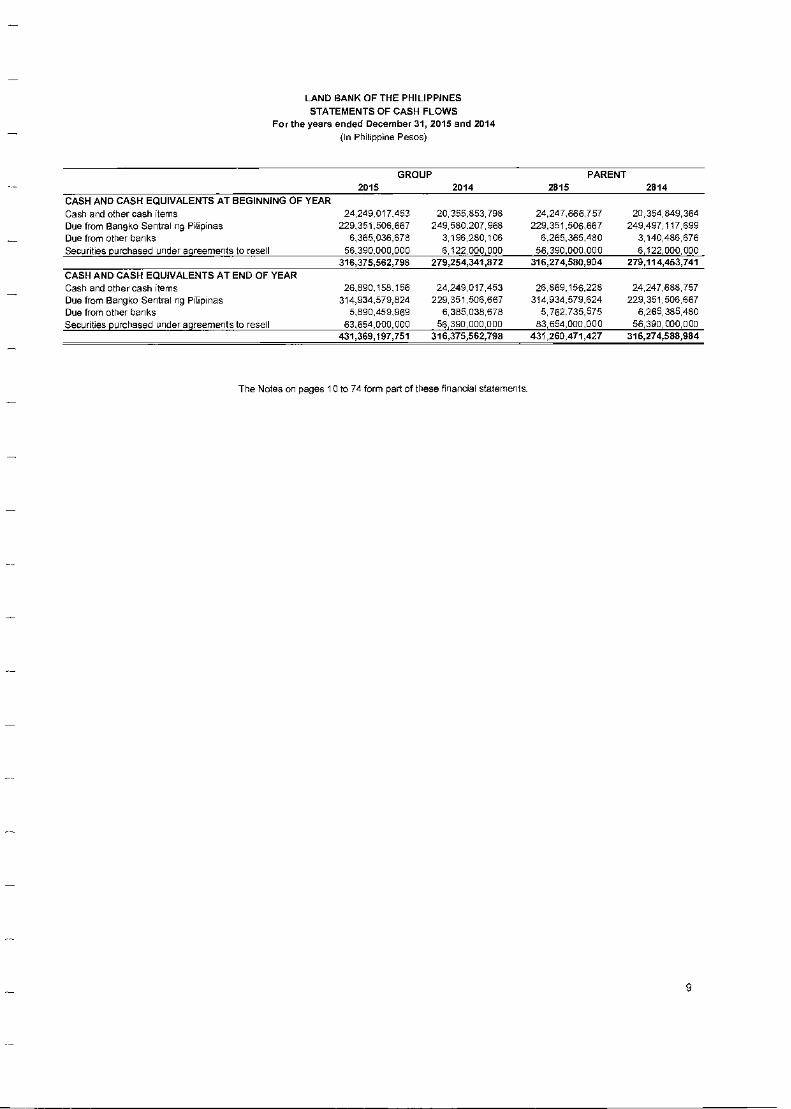
LAND BANK OF THE PHILIPPINES STATEMENTS OF CASH FLOWS
For the years ended December 31, 2015 and 2014 (In Philippine Pesos)
GROUP 2015 2014
PARENT 2015 2014
CASH AND CASH EQUIVALENTS AT BEGINNING OF YEAR Cash and other cash items 24 249 017.453 20,355,853,798 24,247,638,757 2E35E849,364 Due from Bangko Sentral ng Filipinas 229.351.506,667 249,580.207,968 229,351,50E667 249,497,117,699 Due from other banks 6,385,038,678 3,196,280,106 6.285,385,480 3,140,486,678 Securities purchased under agreements to resell 56.390.000,000 6,122,000 000 56.390.000,000 6 122 000,000
316,375,562,798 279,254,341,872 316,274,580,904 279,114,453,741 CASH AND CASH EQUIVALENTS AT END OF YEAR Cash and other cash items 26,690.158.158 24,249,017,453 26 889,156,228 24,247,688,757 Due from Bangko Rental ng Pajamas 314,934,579.624 229,351,506,667 314,934,579,624 229,351,506,667 Due from other banks 5,890,459.969 6,385,038,678 5,782 735,575 6,285,385,480 Securities purchased under agreements to resell 83.654,000,000 56,390,000,000 83,654,000.000 58,390,000,000
431,369,197,751 316,375,562,798 431,260,471,427 316,274,580,904
The Notes on pages 10 to 74 form part of these financial statements.
9
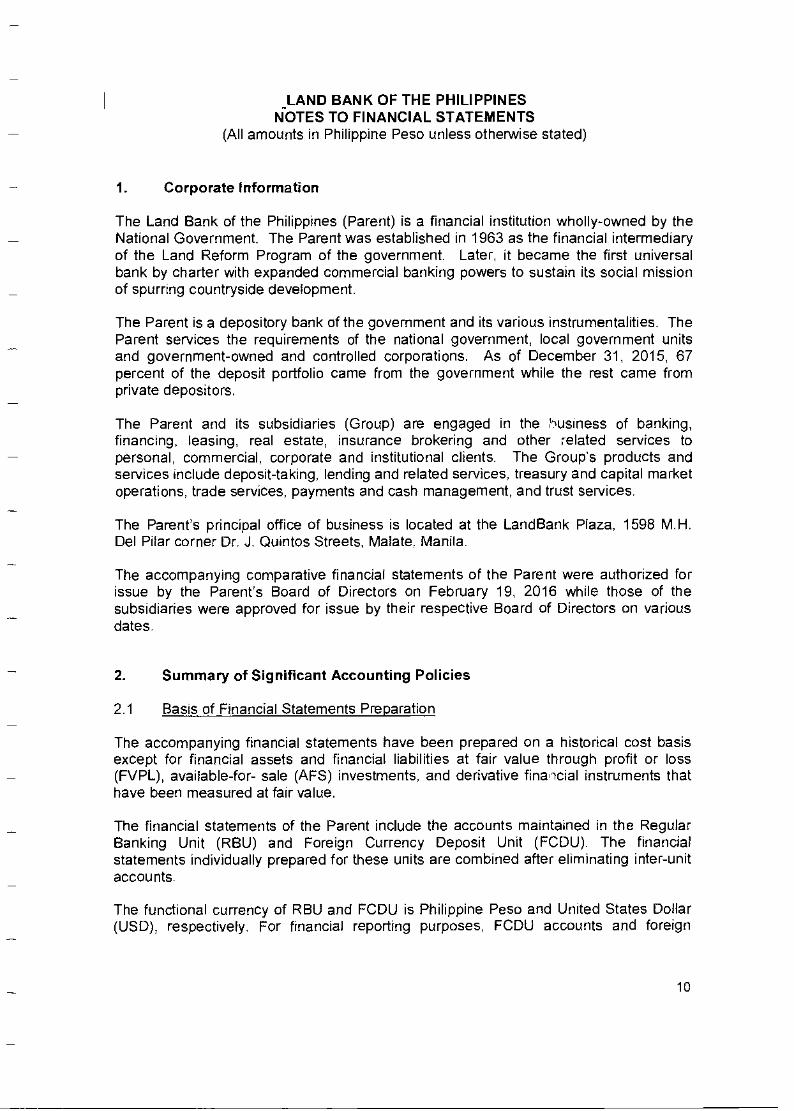
LAND BANK OF THE PHILIPPINES NOTES TO FINANCIAL STATEMENTS
(All amounts in Philippine Peso unless otherwise stated)
1. Corporate Information
The Land Bank of the Philippines (Parent) is a financial institution wholly-owned by the National Government. The Parent was established in 1963 as the financial intermediary of the Land Reform Program of the government. Later, it became the first universal bank by charter with expanded commercial banking powers to sustain its social mission of spurring countryside development.
The Parent is a depository bank of the government and its various instrumentalities. The Parent services the requirements of the national government, local government units and government-owned and controlled corporations. As of December 31, 2015, 67 percent of the deposit portfolio came from the government while the rest came from private depositors.
The Parent and its subsidiaries (Group) are engaged in the 5usiness of banking, financing, leasing, real estate, insurance brokering and other related services to personal, commercial, corporate and institutional clients. The Group's products and services include deposit-taking, lending and related services, treasury and capital market operations, trade services, payments and cash management, and trust services.
The Parents principal office of business is located at the LandBank Plaza, 1598 M.H. Del Pilar corner Dr. J. Quintos Streets, Malate, Manila.
The accompanying comparative financial statements of the Parent were authorized for issue by the Parent's Board of Directors on February 19, 2016 while those of the subsidiaries were approved for issue by their respective Board of Directors on various dates.
2. Summary of Significant Accounting Policies
2.1 Basis of Financial Statements Preparation
The accompanying financial statements have been prepared on a historical cost basis except for financial assets and financial liabilities at fair value through profit or loss (FVPL), available-for- sale (AFS) investments, and derivative financial instruments that have been measured at fair value.
The financial statements of the Parent include the accounts maintained in the Regular Banking Unit (RBU) and Foreign Currency Deposit Unit (FCDU). The financial statements individually prepared for these units are combined after eliminating inter-unit accounts.
The functional currency of RBU and FCDU is Philippine Peso and United States Dollar (USD), respectively. For financial reporting purposes, FCDU accounts and foreign
10
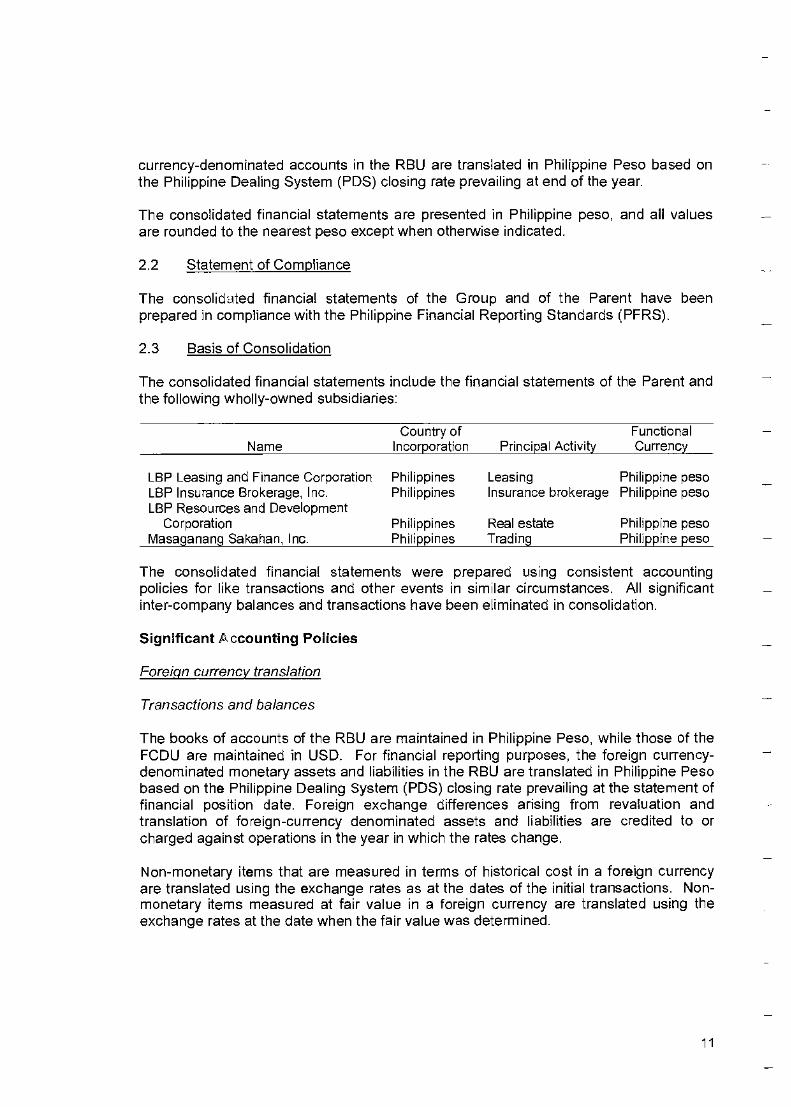
currency-denominated accounts in the RBU are translated in Philippine Peso based on the Philippine Dealing System (PDS) closing rate prevailing at end of the year.
The consolidated financial statements are presented in Philippine peso, and all values are rounded to the nearest peso except when otherwise indicated.
2.2 Statement of Compliance
The consolidated financial statements of the Group and of the Parent have been prepared in compliance with the Philippine Financial Reporting Standards (PFRS).
2.3 Basis of Consolidation
The consolidated financial statements include the financial statements of the Parent and the following wholly-owned subsidiaries:
Name Country of
Incorporation Principal Activity Functional Currency
LBP Leasing and Finance Corporation Philippines Leasing Philippine peso LBP Insurance Brokerage, Inc. Philippines Insurance brokerage Philippine peso LBP Resources and Development
Corporation Philippines Real estate Philippine peso Masaganang Sakahan, Inc. Philippines Trading Philippine peso
The consolidated financial statements were prepared using consistent accounting policies for like transactions and other events in similar circumstances. All significant inter-company balances and transactions have been eliminated in consolidation.
Significant Accounting Policies
Foreign currency translation
Transactions and balances
The books of accounts of the RBU are maintained in Philippine Peso, while those of the FCDU are maintained in USD. For financial reporting purposes, the foreign currency-denominated monetary assets and liabilities in the RBU are translated in Philippine Peso based on the Philippine Dealing System (PDS) closing rate prevailing at the statement of financial position date. Foreign exchange differences arising from revaluation and translation of foreign-currency denominated assets and liabilities are credited to or charged against operations in the year in which the rates change.
Non-monetary items that are measured in terms of historical cost in a foreign currency are translated using the exchange rates as at the dates of the initial transactions. Non-monetary items measured at fair value in a foreign currency are translated using the exchange rates at the date when the fair value was determined.
11
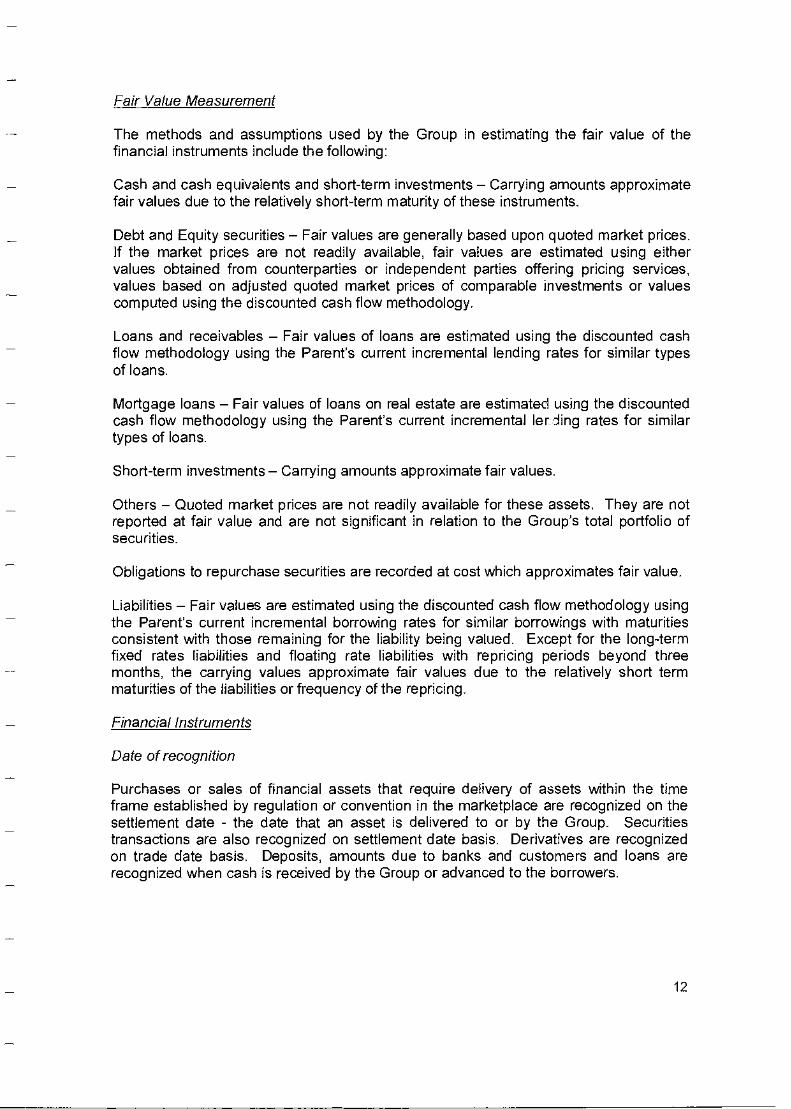
Fair Value Measurement
The methods and assumptions used by the Group in estimating the fair value of the financial instruments include the following:
Cash and cash equivalents and short-term investments — Carrying amounts approximate fair values due to the relatively short-term maturity of these instruments.
Debt and Equity securities — Fair values are generally based upon quoted market prices. If the market prices are not readily available, fair values are estimated using either values obtained from counterparties or independent parties offering pricing services, values based on adjusted quoted market prices of comparable investments or values computed using the discounted cash flow methodology.
Loans and receivables — Fair values of loans are estimated using the discounted cash flow methodology using the Parent's current incremental lending rates for similar types of loans.
Mortgage loans — Fair values of loans on real estate are estimated using the discounted cash flow methodology using the Parent's current incremental ler ding rates for similar types of loans.
Short-term investments — Carrying amounts approximate fair values.
Others — Quoted market prices are not readily available for these assets. They are not reported at fair value and are not significant in relation to the Group's total portfolio of securities.
Obligations to repurchase securities are recorded at cost which approximates fair value.
Liabilities — Fair values are estimated using the discounted cash flow methodology using the Parent's current incremental borrowing rates for similar borrowings with maturities consistent with those remaining for the liability being valued. Except for the long-term fixed rates liabilities and floating rate liabilities with repricing periods beyond three months, the carrying values approximate fair values due to the relatively short term maturities of the liabilities or frequency of the repricing.
Financial Instruments
Date of recognition
Purchases or sales of financial assets that require delivery of assets within the time frame established by regulation or convention in the marketplace are recognized on the settlement date - the date that an asset is delivered to or by the Group. Securities transactions are also recognized on settlement date basis. Derivatives are recognized on trade date basis. Deposits, amounts due to banks and customers and loans are recognized when cash is received by the Group or advanced to the borrowers.
12
Initial recognition of financial instruments
All financial instruments, including trading and investment securities and loans and receivables, are initially measured at fair value. Except for financial assets and financial liabilities valued at FVPL, the initial measurement of financial instruments includes transaction costs. The Group classifies its financial assets in the following categories: financial assets at FVPL, HTM investments, AFS investments, and loans and receivables while financial liabilities are classified as financial liabilities at FVPL and financial liabilities carried at amortized cost. The classification depends on the purpose for which the investments were acquired and whether they are quoted in an active market. Management determines the classification of its investments at initial recognition and, where allowed and appropriate, re-evaluates such designation at every reporting date.
Determination of fair value
The fair value for financial instruments traded in active markets at the statement of financial position date is based on their quoted market price or dealer price quotations (bid price for long positions and ask price for short positions), without any deduction for transaction costs. In the absence of an available current bid and asking prices, the price of the most recent transaction is used because it provides evidence of the current fair value as long as there has not been a significant change in economic circumstances since the time of the transaction.
For all other financial instruments not listed in an active market, the fair value is determined by using appropriate valuation techniques. Valuation techniques include net present value techniques, comparison to similar instruments for which market observable prices exist, options pricing models, and other relevant valuation models.
Derivative Instruments
The Parent enters into derivative contracts such as currency forwards and currency swaps to manage its foreign exchange exposure. These derivative financial instruments are initially recorded at fair value on the date at which the derivative contract is entered into and are subsequently remeasured at fair value. Any gains or losses arising from changes in fair values of derivatives (except those accounted for as accounting hedges) are taken directly to the statement of comprehensive income. Derivatives are carried as assets when the fair value is positive and as liabilities when the fair value is negative. Derivative instruments are booked at its notional amount under contingent account on trade date and subsequently measured using the mark to forward methods. Any gains/(losses) arising from the market valuation are booked under asset account "Derivatives with positive fair value' if the market valuation is positive and under the liability account "Derivatives with negative fair value" if the market valuation is negative contra foreign exchange gain/(loss) account.
The Parent did not apply hedge accounting treatment for its derivative transactions.
(a) Held for trading
Financial assets held for trading are debt and equity securities recorded in the statement of financial position at fair value. Changes in fair value relating to the held for trading
13
positions are recognized in Gain on Financial Assets HFT. Interest earned or incurred is recorded in 'Interest income' or 'Interest expense', respectively, while dividend income is recorded in 'Dividends' when the right to receive payment has been established. Included in this classification are debt and equity securities which have been acquired principally for the purpose of selling or repurchasing in the near tern.
(b) Loans and receivables, amounts due from BSP and other banks. interbank loans receivable and securities purchased under resale agreements
These are financial assets with fixed or determinable payments and fixed maturities that are not quoted in an active market. They are not entered into with the intention of immediate or short-term resale and are not classified as other financial assets held for trading, designated as AFS investments.
(c) Held-to-Maturity (HTM) investments
HTM investments are financial assets with fixed or determinable payments and fixed maturities for which the Group's management has the positive intention and ability to hold to maturity. These investments are carried at amortized cost using the effective interest rate (ER) method, reduced by any impairment in value. Gains and losses are recognized in statement of comprehensive income when the HTM investments are derecognized, impaired or revalued (in case of foreign currency denominated), as well as through the amortization process.
(d) Available-for-sale (AFS) investments
AFS investments are debt and equity securities which do not qualfy to be classified as HFT, HTM or loans and receivables. They are purchased and held indefinitely, but which the Group anticipates to sell in response to liquidity requirements or changes in market conditions. AFS investments are carried at fair market value. The effective yield component (including premium, discounts and directly attributable transaction costs) and foreign exchange restatement results of AFS debt securities are reported in earnings. Dividends on AFS equity instruments are recognized in the statement of comprehensive income when the entity's right to receive payment is established. The unrealized gains and losses arising from the recognition of fair value changes on AFS assets are reported as a separate component of capital funds in the statement of financial position.
Impairment of Financial Assets
The Group determines at each reporting date whether there is objective evidence that a financial asset may be impaired.
Financial assets carried at amortized cost
A financial asset or a group of financial assets is impaired and impairment losses are incurred if, and only if, there is objective evidence of impairment as a result of one or more events that occurred after the initial recognition of the asset (a 'loss event') and that loss event has an impact on the estimated future cash flows of the financial asset or group of financial assets that can be reliably estimated.
14
The Group fir assesses whether objective evidence of impairment exists individually for financial assets that are individually significant, and individually or collectively for assets that are not individually significant. If it is determined that no objective evidence of impairment exists for individually assessed financial asset, whether significant or not, the asset is included in a group of financial assets with similar credit risk characteristics (i.e., on the basis of the Group's scoring process that considers asset term, industry and collateral) and that group of assets is collectively assessed for impairment. Those characteristics are relevant to the estimation of future cash flows for group of such assets by being indicative of the debtors' ability to pay all amounts due according to the contractual terms of the assets being evaluated. Assets that are individually assessed for impairment and for which an impairment loss is or continues to be recognized are not included in a collective assessment for impairment.
If there is objective evidence that an impairment loss on loans and receivables carried at amortized cost has been incurred, the amount of the loss is measured as the difference between the asset's carrying amount and the present value of the estimated future cash flows (excluding future credit losses that have not been incurred) discounted at the financial asset's original effective interest rate. The carrying amount of the asset is reduced through use of an allowance account.
The amount of loss is charged to current operations. If a loan or HTM investment has a variable inter,: st rate, the discount rate for measuring any impairment loss is the current effective interest rate determined under the contract.
If, in a subsequent year. the amount of the estimated impairment loss decreases because of an event occurring after the impairment was recognized, any amounts formerly charged are credited to 'Provision for credit and impairment losses' in the statement of comprehensive income and the allowance account, reduced. The HTM investments, together with the associated allowance accounts, are written off when there is no realistic prospect of future recovery and all collateral has been realized.
The calculation of the present value of the estimated future cash flows of a collateralized financial asset reflects the cash flows that may result from foreclosure less costs for obtaining and selling the collateral, whether or not foreclosure is probable.
Future cash flows in a group of financial assets that are collectively evaluated for impairment are estimated on the basis of the contractual cash flows of the assets and historical loss experience for assets with similar credit risk characteristics. Historical loss experience is adjusted on the basis of current observable data to reflect the effects of current conditions that did not affect the period on which the historical loss experience is based and to remove the effects of conditions in the historical period that do not exist currently.
Estimates of changes in future cash flows for groups of assets are made to reflect and be directionally consistent with changes in related observable data from period to period (such as changes in unemployment rates, property prices, payment status, or other factors indicative of changes in the probability of losses in the group and their magnitude). The methodology and assumptions used for estimating future cash flows are reviewed regularly by the Group to reduce any differences between loss estimates and actual loss experience.
15
When a loan is uncollectible, it is written off against the related allowance for loan impairment. Such loans are written off after all the necessary procedures have been completed and the amount of the loss has been determined. Subsequent recoveries of amounts previously written off are charged to income.
Restructured loans
Where possible, the Group seeks to restructure loans rather than to take possession of collateral. This may involve extending the payment arrangements and the agreement of new loan conditions. Once the terms have been renegotiated, the loan is no longer considered past due. Management continuously reviews restructured loans to ensure that all criteria are met and that future payments are likely to occur. The loans continue to be subject to an individual or collective impairment assessment, calculated using the loan's original effective interest rate. The difference between the recorded value of the original loan and the present value of the restructured cash flows, discounted at the original effective interest rate, is recognized in 'Provision for credit losses' in the statement of comprehensive income.
Assets Carried at Cost
If there is objective evidence that an impairment loss on an unquoted equity instruments that are not carried at fair value because its fair value cannot be reliably measured, or on a derivative asset that is linked to and must be settled by delivery of such unquoted equity instrument has been incurred, the amount of the loss is measured as the difference between the asset's carrying amount and the present value of estimated future cash flows discounted at the current market rate of return for a similar financial asset.
AFS Investments
If an AFS investment is impaired, an amount comprising the difference between its cost (net of any principal payment and amortization) and its current fair value, less any impairment loss on that security previously recognized in profit or loss — is removed from equity and recognized in the statement of comprehensive income. Impairment losses on equity instruments recognized in the statement of comprehensive income are not reversed through the statement of comprehensive income. If, in a subsequent period, the fair value of a debt instrument classified as AFS investment increases and the increase can be objectively related to an event occurring after the impairment loss was recognized in profit or loss, the impairment loss is reversed through the statement of comprehensive income.
Derecognition of Financial Assets and Liabilities
Financial Assets. A financial asset (or, where applicable, a part of a financial asset or part of a group of similar financial assets) is derecognized when:
• the rights to receive cash flows from the asset have expired;
• the Group retains the right to receive cash flows from the asset, but has assumed an obligation to pay them in full without material delay to a third party under a 'pass-through' arrangement; or
16
• the Group has transferred its rights to receive cash flows from the asset and either (a) has transferred substantially all the risks and rewards of the asset, or (b) has neither transferred nor retained substantially all the risks and rewards of the asset, but has transferred control of the asset.
Where the Group has transferred its rights to receive cash flows from an asset and has neither transferred nor retained substantially all the risks and rewards of the asset nor transferred control of the asset, the asset is recognized to the extent of the Group's continuing involvement in the asset. Continuing involvement that takes the form of a guarantee over the transferred asset is measured at the lower of the original carrying amount of the asset and the maximum amount of consideration that the Group could be required to repay.
Financial Liabilities. Derecognition of a financial liability happens when the obligation under the liability is discharged or cancelled or expired. When an existing financial liability is replaced by another from the same lender on substantially different terms, or the terms of an existing liability are substantially modified, such an exchange or modification is treated as a derecognition of the original liability and the recognition of a new liability, and the difference in the respective carrying amounts is recognized in profit or loss.
Offsetting financial instruments
Offsetting of financial assets and financial liabilities are only made and the net amount are reported in the statement of financial position when there is a legally enforceable right to offset the recognized amounts and the Group intends to either settle on a net basis, or to realize the asset and the liability simultaneously.
Fiduciary Activities
Assets and income arising from fiduciary activities together with related undertakings to return such assets to customers are excluded from the financial statements where the Group acts in a fiduciary capacity such as nominee, trustee or agent.
Subsequent Events
Any post-year-end event that provides additional information about the Group's position at the statement of financial position date (adjusting event) is reflected in the financial statements. Post-year-end events that are non adjusting events, if any, are disclosed in the Notes to the financial statements, when material.
Impairment of Property and Equipment, Investment Property and Other Resources
At each reporting date, the Group assesses whether there is any indication that the property and equipment and investment properties may be impaired_
Where an indicator of impairment exists, the Group makes a formal estimate of recoverable amount. Where the carrying amount of an asset exceeds its recoverable amount, the asset is considered impaired and is written down to its recoverable amount. Recoverable amount is the higher of an asset's or cash-generating unit's fair value less
17
costs to sell and its value in use and is determined for an individual asset, unless the asset does not generate cash inflows that are largely independent of those from other assets or group of assets.
Investments in Subsidiaries
The Parent's investments in subsidiaries and entities in which the Parent has control are accounted for under the cost method of accounting in the separate financial statements. These are carried in the statement of financial position at cost less any impairment in value.
Property and Equipment
Property and equipment are carried at cost less accumulated depreciation and amortization and any impairment in value. When the assets are sold or retired, their cost and accumulated depreciation and amortization are eliminated from the accounts and any gain or loss resulting from their disposal is included In the statement of comprehensive income.
The initial cost of property and equipment comprises its purchase price and any directly attributable cost of bringing the asset to its working condition and location for its intended use. Expenditures incurred after the fixed assets have been put into operation, such as repairs and maintenance costs, are normally charged to profit and loss in the period in which the costs are incurred.
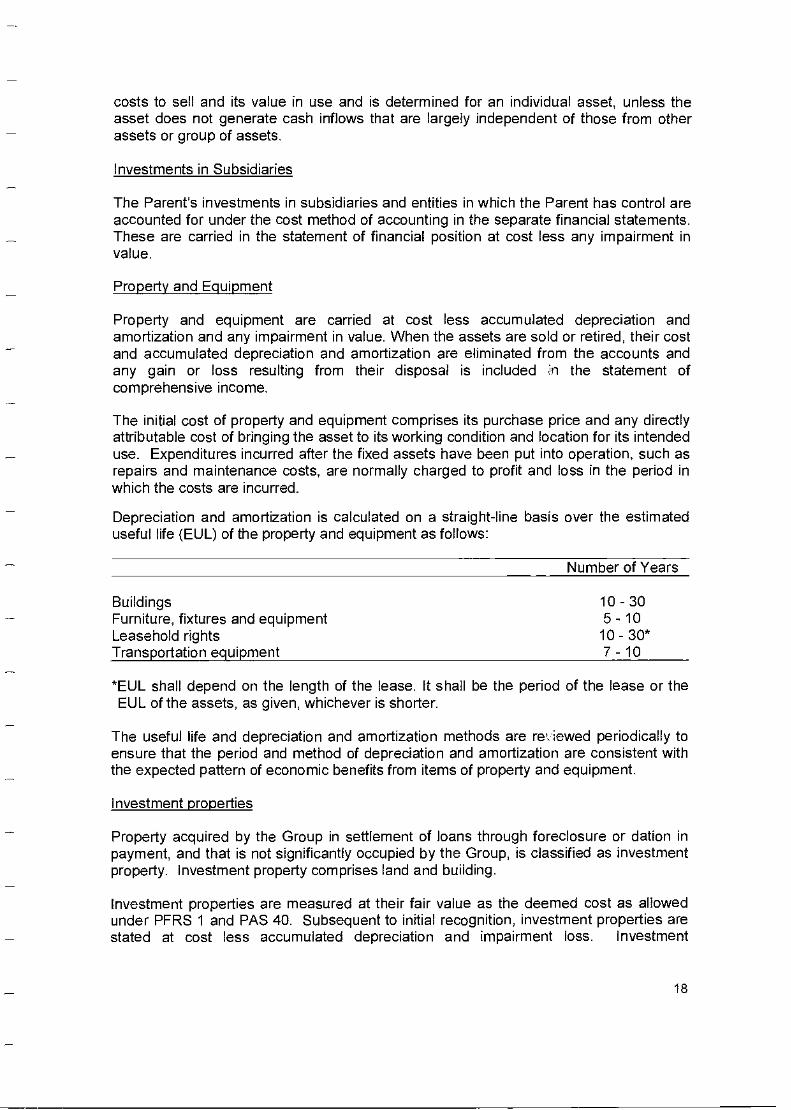
Depreciation and amortization is calculated on a straight-line basis over the estimated useful life (EUL) of the property and equipment as follows:
Number of Years
Buildings 10 - 30 Furniture, fixtures and equipment 5 - 10 Leasehold rights 10 - 30* Transportation equipment 7 - 10
*EUL shall depend on the length of the lease. It shall be the period of the lease or the EUL of the assets, as given, whichever is shorter.
The useful life and depreciation and amortization methods are reviewed periodically to ensure that the period and method of depreciation and amortization are consistent with the expected pattern of economic benefits from items of property and equipment.
Investment properties
Property acquired by the Group in settlement of loans through foreclosure or dation in payment, and that is not significantly occupied by the Group, is classified as investment property. Investment property comprises land and building.
Investment properties are measured at their fair value as the deemed cost as allowed under PFRS 1 and PAS 40. Subsequent to initial recognition, investment properties are stated at cost less accumulated depreciation and impairment loss. Investment
18
properties are derecognized when they have either been disposed of or when the investment property is permanently withdrawn from use and no future benefit is expected from its disposal. Any gains or losses on derecognition of an investment property are recognized in the profit and loss in the year of derecognition.
Expenditures incurred after the fixed investment properties have been put into operation, such as repairs and maintenance costs, are normally charged to income in the period in which the costs are incurred.
Depreciation is calculated on a straight-line basis over 10 to 30 years, which is the estimated useful life of the investment properties.
Intangible Assets
Computer software
Acquired computer software licenses are capitalized on the basis of the costs incurred to acquire and bring to use the specific software. These costs are amortized on the basis of the expected useful lives (three to five years).
Costs associated with developing or maintaining computer software programs are recognized as an expense as incurred.
Income Taxes
Income tax on the profit for the year comprises current tax only. Income tax is recognized in the statement of comprehensive income except to the extent that it relates to items recognized directly in equity. Current income tax is the expected tax payable on the taxable income for the year using tax rates enacted or substantially enacted as of the reporting date, and any adjustment to tax payable in respect to previous years.
Deferred tax assets are recognized for the future tax consequences attributable to temporary differences between the carrying amounts of assets and liabilities for financial reporting purposes and the amount used for taxation purposes and the carry forward benefits of the net operating loss carryover (NOLCO) and the minimum corporate income tax (MCIT) over the regular corporate income tax. The amount of deferred tax provided is based on the expected manner of realization or settlement of the carrying amounts of assets and liabilities, using tax rates that have been enacted or substantially enacted as of the reporting date. A deferred tax asset is recognized only to the extent that it is probable that future taxable profits will be available against which the asset can be utilized. Deferred tax assets are reduced to the extent that it is no longer probable that the related tax benefit will be realized. The carrying amount of the deferred tax asset is reviewed at each reporting date and reduced, if appropriate.
Employee Benefits
The Group maintains a defined contribution plan which provides for estimated pension benefits on its contributory retirement plan covering all regular employees.
19
Leases
(a) LBP Group is the lessee
Operating lease - leases in which substantially all risks and rewards of ownership are retained by another party, the lessor, are classified as operating leases. Payments. including prepayments, made under operating leases (net of any incentives received from the lessor) are charged to the statement of comprehensive income on a straight-line basis over the period of the lease.
Financial lease - leases of assets where the LBP Group has substantially all the risks and rewards of ownership are classified as finance leases. Finance leases are capitalized at the lease's commencement at the lower of the fair value of the leased property and the present value of the minimum lease payments. Each lease payment is allocated between the liability and the finance charges so as to achieve a constant rate on the finance balance outstanding. The corresponding rental obligations, net of finance charges, are included in deferred credits and other liabilities. The interest element of the finance cost is charged to the statement of comprehensive income over the lease period so as to produce a constant periodic rate of interest on the remaining balance of the liability for each period.
(b) LBP Group is the lessor
(i) Operating lease - properties leased out under operating leases are included in investment property in the statement of financial position. Rental income under operating leases is recognized in the statement of comprehensive income on a straight-line basis over the period of lease.
Finance lease - when assets are leased out under a finance lease, the present value of the lease payments is recognized as a receivable. The difference between the gross receivable and the present value of the receivable is recognized as unearned income.
Lease income under finance lease is recognized over the term of the lease using the net investment method before tax, which reflects a constant periodic rate of return.
Revenue Recognition
Interest income and fees which are considered an integral part of the effective yield of a financial asset are recognized using the effective interest method, unless collectibility is in doubt.
Interest is recognized on impaired loans and other financial assets based on the rate used to discount future cash flows to their net present value.
Dividend income is recognized when the right to receive payment is established.
Gains or losses arising from the trading of securities and foreign currency are reported in the statement of comprehensive income.
20
Generally, commissions, service charges and fees are recognized only upon collection or accrued where there is reasonable degree of certainty as to its conectibility.
Commitment fees received to originate a loan when the loan commitment is outside the scope of PAS 39 are deferred and recognized as an adjustment to the effective interest rate. If the loan commitment expires, the fee is recognized as revenue on expiry.
Borrowing Costs
Borrowing co ,ts are expensed when incurred.
Changes in Accounting Policies and Disclosures
New and amended Standards and Interpretations
The Group applied the following applicable new and revised accounting standards. Unless otherwise indicated, these new and revised accounting standards have no impact to the Group. Except for these standards and amended PFRS which were adopted as of January 1, 2014, the accounting policies adopted are consistent with those of the previous financial year.
PAS 32, Financial Instruments: Presentation — Offsetting Financial Assets and Financial Liabilities (Amendments)
The amendments clarify the meaning of 'currently has a legally enforceable right to set-off and also clarify the application of the PAS 32 offsetting criteria to settlement systems (such as central clearing house systems) which apply gross settlement mechanisms that are not simultaneous. The amendments have no impact on the Group's financial position or performance.
PAS 36, Imp 9irment of Assets — Recoverable Amount Disclosures for Non-Financial Assets (Amendments)
These amendments remove the unintended consequences of PFRS 13 on the disclosures required under PAS 36. In addition, these amendments require disclosure of the recoverable amounts for the assets or cash-generating units (CGUs) for which impairment loss has been recognized or reversed during the period. These amendments are effective retrospectively for annual periods beginning on or after January 1, 2014 with earlier application permitted, provided PFRS 13 is also applied. The amendments have no impact on the Group's financial position or performance.
Investment Entities (Amendments to PFRS 10, PFRS 12 and PAS 27)
These amendments provide an exception to the consolidation requirement for entities that meet the definition of an investment entity under PFRS 10. The exception to consolidation requires investment entities to account for subsidiaries at fair value through profit or loss. This amendment is not relevant to the Group since none of the entities in the Group qualifies as an investment entity under PFRS 10.
21
Annual Improvements to PFRS/PAS (2010-2012 cycle.'
In the 2010-2012 annual improvement cycle, seven amendments to six standards were issued, which included an amendment to PFRS 13, Fair Value Measurement. The amendment to PFRS 13 is effective immediately and it clarifies that short-term receivables and payables with no stated interest rates can be measured at invoice amounts when the effect of discounting is immaterial. This amendment has no impact on the Group's financial position or performance.
New Standards, Amendments and Interpretations not yet adopted
The Group intends to adopt the following standards when they become effective. Except as otherwise indicated, the Group does not expect the adoption of these new and amended standards to have significant impact on its financial statements.
New Standards
PFRS 9, Financial Instruments — Classification and Measurement (2010 version) —
PFRS 9 (2010 version) reflects the first phase on the replacement of PAS 39 and applies to the classification and measurement of financial assets and liabilities as defined in PAS 39, Financial Instruments: Recognition and Measurement. PFRS 9 requires all financial assets to be measured at fair value at initial recognition. A debt financial asset may, if the fair value option (FVO) is not invoked, be subsequently measured at amortized cost if it is held within a business model that has the objective to hold the assets to collect the contractual cash flows and its contractual terms give rise, on specified dates, to cash flows that are solely payments of principal and interest on the principal outstanding. All other debt instruments are subsequently measured at fair value through profit or loss. All equity financial assets are measured at fair value either through other comprehensive income (OCI) or profit or loss. Equity financial assets held for traditg must be measured at fair value through profit or loss. For FVO liabilities, the amount of change in the fair value of a liability that is attributable to changes in credit risk must be presented in OCI. The remainder of the change in fair value is presented in profit or loss, unless presentation of the fair value change in respect of the liability's credit risk in OCI would create or enlarge an accounting mismatch in profit or loss. All other PAS 39 classification and measurement requirements for financial liabilities have been carried forward into PFRS 9, including the embedded derivative separation rules and the criteria for using FVO. The adoption of the first phase of PFRS 9 will have an effect on the classification and measurement of the Group's financial assets, but will potentially have no impact on the classification and measurement of financial liabilities.
PFRS 9 (2010 version) is effective for annual period beginning on or after January 1, 2015. This mandatory adoption date was moved to January 1, 2018 when the final version of PFRS 9 was adopted by the Philippine Financial Reporting Standards Council (FRSC). Such adoption, however, is still for approval by the Board of Accountancy (BOA).
Philippine Interpretation IFRIC 15, Agreements for the Construction of Real Estate
This Interpretation covers accounting for revenue and associated expenses by entities that undertake the construction of real estate directly or through subcontractors. The
22
Securities and Exchange Commission (SEC) and the FRSC have deferred the effectivity of this interpretation until the final Revenue standard is issued by the International Accounting Standards Board (IASB) and an evaluation of the requirements of the final Revenue standard against the practices of the Philippine real estate industry is completed. Adoption of the interpretation when it becomes effective will not have any impact on the financial statements of the Group.
The following new standards and amendments issued by the IASB were already adopted by the FRSC but are still for approval by BOA.
Amendments
PAS 16, Property, Plant and Equipment and PAS 38, Intangible Assets — Clarification of Acceptable Methods of Depreciation and Amortization
The revised PAS 16 and PAS 38 both establish the principle for the basis of depreciation and amortization as being the expected pattern of consumption of the future economic benefits of an asset. The amendments to PAS 16 explicitly prohibits revenue-based depreciation if property, plant and equipment while the amendments to PAS 38 introduce a rebuttable presumption that a revenue-based amortization method for intangible assets is inappropriate for the same reason that there are multiple factors that influence revenue and that not all these factors are related to the way the asset is used or consumed. The revised standards are effective for periods beginning January 1, 2016, with earlier application permitted.
PAS 16, Property, Plant and Equipment and PAS 41, Agriculture — Change in Financial Reporting for Bearer Plants
The amendments require entities to account for bearer plants in the same way as property, plant and equipment in PAS 16, Property, Plant and Equipment, because their operation is similar to that of manufacturing, bringing them within the scope of PAS 16, instead of PAS 41. The produce growing on bearer plants will remain within the scope of PAS 41. The amended standards are effective for annual periods beginning on or after January 1, 2016, with earlier application permitted. The amendments are not applicable to the Group.
PAS 27, Separate Financial Statements — Equity Method in Separate Financial Statements
The amendm,mts will allow entities to use the equity method to account for investments in subsidiaries, joint ventures and associates in their separate financial statements. Entities already applying PFRS and electing to change to the equity method in its separate financial statements will have to apply that change retrospectively. For first-time adopters of PFRS electing to use the equity method in its separate financial statements, they will be required to apply this method from the date of transition to PFRS. The amendments are effective for annual periods beginning on or after January 1, 2016, with early adoption permitted. These amendments will not have any impact on the Group's consolidated financial statements.
23
PFRS 10, Consolidated Financial Statements and PAS 28, Investments in Associates and Joint Ventures — Sale or Contribution of Assets between an Investor and its Associate or Joint Venture
These amendments address an acknowledged inconsistency between the requirements in PFRS 10 and those in PAS 28 (2011) in dealing with the sale or contribution of assets between an investor and its associate or joint venture. The amendments require that a full gain or loss is recognized when a transaction involves a business (whether it is housed in a subsidiary or not). A partial gain or loss is recognized when a transaction involves assets that do not constitute a business, even if these assets are housed in a subsidiary These amendments are effective from annual periods beginning on or after January 1, 2016.
Annual Improvements to PFRSs (2010 - 2012 cycle)
The Annual Improvements to PFRSs (2010 - 2012 cycle) which will take effect for annual periods beginning on or after January 1, 2015, contain non-urgent but necessary amendments to the following standards:
PFRS 2, Share-based Payment — Definition of Vesting Condition
The amendment revised the definitions of vesting condition and market condition and added the definitions of performance condition and service condition to clarify various issues. This amendment shall be prospectively applied to share-based payment transactions for which the grant date is on or after January 1, 2015. This amendment does not apply to the Group as it has no share-based payments.
PFRS 3, Business Combinations — Accounting for Contingent Consideration in a Business Combination
The amendment clarifies that a contingent consideration that meets the definition of a financial instrument should be classified as a financial liability or as equity in accordance with PAS 32.
Contingent consideration that is not classified as equity is subsequently measured at fair value through profit or loss whether or not it falls within the scope of PFRS 9 (or PAS 39, if PFRS 9 is not yet adopted). The amendment shall be prospectively applied to business combinations for which the acquisition date is on or after January 1, 2015. The Group shall consider this amendment for future business combinations.
Revaluation Method (Amendments to PAS 16 and PAS 38 — Proportionate Restatement of Accumulated Depreciation and Amortization)
The amendment clarifies that, upon revaluation of an item of property, plant and equipment, and intangible assets, the carrying amount of the asset shall be adjusted to the revalued amount, and the asset shall be treated in one of the following ways:
a. The gross carrying amount is adjusted in a manner that is consistent with the revaluation of the carrying amount of the asset. The accumulated depreciation or amortization at the date of revaluation is adjusted to equal the difference
24
between the gross carrying amount and the carrying amount of the asset after taking into account any accumulated impairment losses.
b. The accumulated depreciation or amortization is eliminated against the gross carrying amount of the asset.
The amendments also clarify that the amount of the adjustment of the accumulated amortization should form part of the increase or decrease in the carrying amount accounted for in accordance with the standard.
The amendment shall apply to all revaluations recognized in annual periods beginning on or after the date of initial application of this amendment and in the immediately preceding annual period.
PAS 24, Related Party Disclosures — Key Management Personnel
The amendments clarify that an entity is a related party of the reporting entity if the said entity, or any member of a group for which it is a part of, provides key management personnel services to the reporting entity or to the parent company of the reporting entity. The amendments also clarify that a reporting entity that obtains management personnel services from another entity (also referred to as management entity) is not required to disclose the compensation paid or payable by the management entity to its employees or directors. The reporting entity is required to disclose the amounts incurred for the key management personnel services provided by a separate management entity. The amendments are applied retrospectively and affect disclosures only.
Annual Improvement to PFRSs (2011-2013 cycle)
The Annual Improvements to PFRSs (2011 - 2013 cycle) contain non-urgent but necessary amendments to the following standards:
PFRS 1, First-time Adoption of Philippine Financial Reporting Standards — Meaning of 'Effective PFRSs'
The amendment clarifies that an entity may choose to apply either a current standard or a new standard that is not yet mandatory, but that permits early application, provided either standard is applied consistently throughout the periods presented in the entity's first PFRS financial statements. This amendment is not applicable to the Group as it is not a first-time adopter of PFRS.
PFRS 13, Fair Value Measurement — Portfolio Exception
The amendment clarifies that the portfolio exception in PFRS 13 can be applied to financial assets, financial liabilities and other contracts. The amendment is effective for annual periods beginning on or after July 1, 2014 and is applied prospectively.
PAS 40, Investment Property
The amendment clarifies the interrelationship between PFRS 3 and PM 40 when classifying property as investment property or owner-occupied property. The amendment stated that judgment is needed when determining whether the acquisition of
25
investment property is the acquisition of an asset or a group of assets or a business combination within the scope of PFRS 3. This judgment is based on the guidance of PFRS 3. This amendment is effective for annual periods beginning on or after July 1, 2014 and is applied prospectively. The amendment has no significant impact on the Group's financial position or performance.
Annual Improvements to PFRSs (2012 - 2014 cycle)
The Annual Improvements to PFRSs (2012 - 2014 cycle) are effective for annual periods beginning on or after January 1, 2016 and are not expected to have a material impact on the Group. They include:
PFRS 5, Non-current Assets Held for Sale and Discontinued Operations — Changes in Methods of Disposal
The amendment is applied prospectively and clarifies that changing from a disposal through sale to a disposal through distribution to owners and vice-versa should not be considered to be a new plan of disposal, rather it is a continuation of the original plan. There is, therefore, no interruption of the application of the requirements in PFRS 5. The amendment also clarifies that changing the disposal method does not change the date of classification.
PFRS 7, Financial Instruments: Disclosures— Servicing Contracts
PFRS 7 requires an entity to provide disclosures for any continuing involvement in a transferred asset that is derecognized in its entirety. The amendment clarifies that a servicing contract that includes a fee can constitute continuing involvement in a financial asset. An entity must assess the nature of the fee and arrangement against the guidance in PFRS 7 in order to assess whether the disclosures are required. The amendment is to be applied such that the assessment of which servicing contracts constitute continuing involvement will need to be done retrospectively. However, comparative disclosures are not required to be provided for any period beginning before the annual period in which the entity first applies the amendments.
PFRS 7 — Applicability of the Amendments to PFRS 7 to Condensed Interim Financial Statements
This amendment is applied retrospectively and clarifies that the disclosures on offsetting of financial assets and financial liabilities are not required in the condensed interim financial report unless they provide a significant update to the information reported in the most recent annual report.
PAS 19, Employee Benefits — Regional Market Issue regarding Discount Rate
This amendment is applied prospectively and clarifies that market depth of high quality corporate bonds is assessed based on the currency in which the obligation is denominated, rather than the country where the obligation is located. When there is no deep market for high quality corporate bonds in that currency, government bond rates must be used.
26
PAS 34, Interim Financial Reporting — Disclosures of Information Elsewhere in the Interim Financial Report'
This amendment is applied retrospectively and clarifies that the required interim disclosures must either be in the interim financial statements or incorporated by cross-reference between the interim financial statements and wherever they are included within the greeter interim financial report (e.g., in the management commentary or risk report).
Effective January 1, 2018
PFRS 9, Financial Instruments — Hedge Accounting and Amendments to PFRS 9, PFRS 7 and PAS 39 (2013 version)
PFRS 9 (2013 version) already includes the third phase of the project to replace PAS 39 which pertains to hedge accounting. This version of PFRS 9 replaces the rules-based hedge accounting model of PAS 39 with a more principles-based approach. Changes include replacing the rules based hedge effectiveness test with an objectives-based test that focuses on the economic relationship between the hedged item and the hedging instrument, and the effect of credit risk on that economic relationship; allowing risk components to be designated as the hedged item, not only for financial items but also for non-financial items, provided that the risk component is separately identifiable and reliably measurable; and allowing the time value of an option, the forward element of a forward contract and any foreign currency basis spread to be excluded from the designation of a derivative instrument as the hedging instrument and accounted for as costs of hedging. PFRS 9 also requires more extensive disclosures for hedge accounting.
PFRS 9 (2013 version) has no mandatory effective date. The mandatory effective date of January 1. 2018 was eventually set when the final version of PFRS 9 was adopted by the FRSC. The adoption of the final version of PFRS 9, however, is still for approval by BOA.
The adoption of PFRS 9 will have an effect on the classification and measurement of the Group's financial assets but will have no impact on the classification and measurement of the Group's financial liabilities. The adoption will also have an effect on the Group's application of hedge accounting.
PFRS 9, Financial Instruments (2014 or final version)
In July 2014, the final version of PFRS 9, Financial Instruments, was issued. PFRS 9 reflects all phases of the financial instruments project and replaces PAS 39, Financial Instruments: Recognition and Measurement, and all previous versions of PFRS 9. The standard introduces new requirements for classification and measurement, impairment, and hedge accounting. PFRS 9 is effective for annual periods beginning on or after January 1, 2018, with early application permitted. Retrospective application is required, but comparative information is not compulsory. Early application of previous versions of PFRS 9 is permitted if the date of initial application is before February 1, 2015.
The adoption of PFRS 9 will have an effect on the classification and measurement of the Group's financial assets and impairment methodology for financial assets, but will have
27
no impact on the classification and measurement of the Group's financial liabilities. The adoption will also have an effect on the Group's application of hedge accounting. The Group is currently assessing the impact of adopting this standard.
The Group conducted an evaluation of the financial impact of the adoption of PFRS 9 based on the audited financial statements as of December 31, 2013 and decided not to early adopt PFRS 9 in its 2014 financial reporting.
3. Significant Accounting Judgments and Estimates
The preparation of the financial statements in compliance with PFRS requires the Group to make estimates and assumptions that affect the reported amounts of resources liabilities, income and expenses and disclosure of contingent resources and contingent liabilities. Future events may occur which will cause the assumptions used in arriving at the estimates to change. The effects of any change in estimates are reflected in the financial statements as they become reasonably determinable.
Estimates and judgments are continually evaluated and are based on historical experience and other factors, including expectations of future events that are believed to be reasonable under the circumstances.
Judgments
In the process of applying the Group's accounting policies, Management has made the following judgments, apart from those involving estimations, which have the most significant effect on the amounts recognized in the financial statements:
a. Operating lease commitments
The entity has entered into commercial property leases on its investment property portfolio. The entity has determined that it retains all the significant risks and rewards of ownership of these properties which are leased out on operating leases.
b. Impairment losses on loans and receivables and HTM investments
The Group reviews its loans and receivables and HTM investments to assess impairment at least on an annual basis or earlier when an indicator of impairment exists. In determining whether an impairment loss should be recorded in the statement of comprehensive income, the Group makes judgments as to whether there is any observable data indicating that there is a measurable decrease in the estimated future cash flows from a portfolio of financial asset before the decrease can be identified with an individual asset in that portfolio. This evidence may include observable data indicating that there has been an adverse change in the payment status of borrowers in a group, or national or local economic conditions that correlate with defaults on assets in the group. Management uses estimates based on historical loss eexperience for assets with credit risk characteristics and objective evidence of impairment similar to those in the portfolio when scheduling its future cash flows. The methodology and assumptions used for estimating both the amount and timing of future cash flows are reviewed regularly to reduce any differences between loss estimates and actual loss experience. The carrying values of receivables from customers and HTM investments of the Group
28
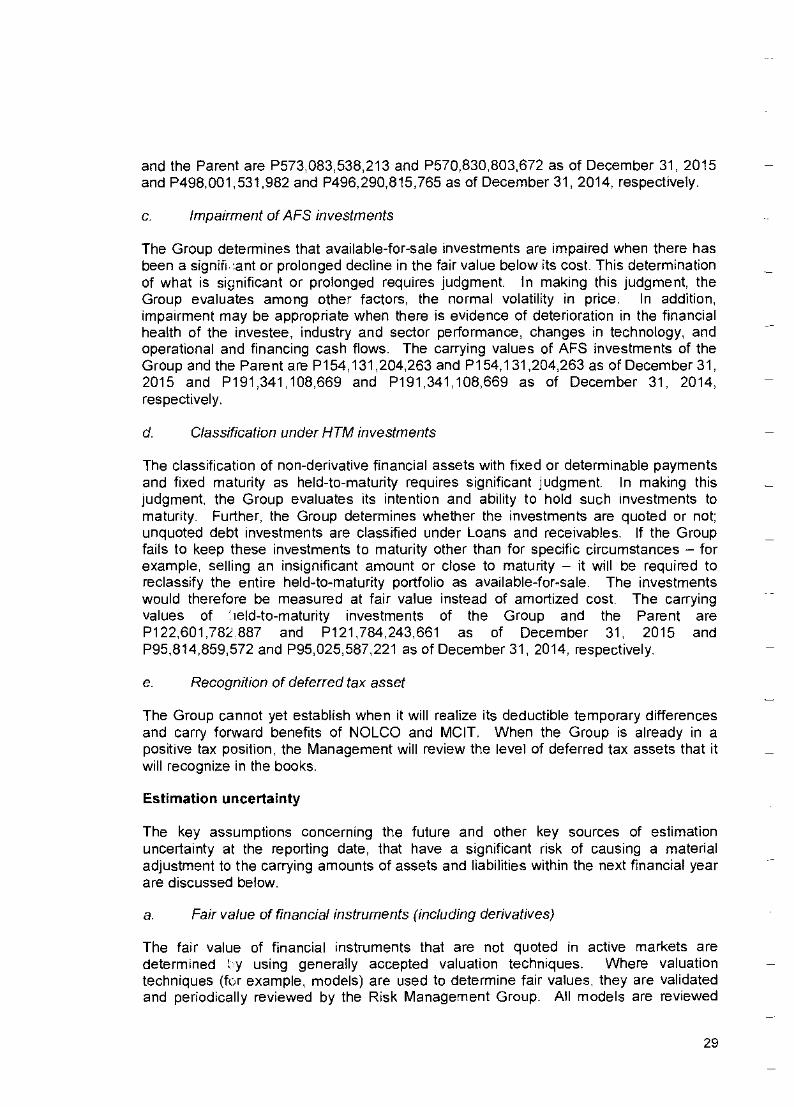
and the Parent are P573.083,538,213 and P570,830,803,672 as of December 31, 2015 and P498,001,531,982 and P496,290,815,765 as of December 31, 2014. respectively.
c. Impairment of AFS investments
The Group determines that available-for-sale investments are impaired when there has been a signifi.lant or prolonged decline in the fair value below its cost. This determination of what is significant or prolonged requires judgment. In making this judgment, the Group evaluates among other factors, the normal volatility in price. In addition, impairment may be appropriate when there is evidence of deterioration in the financial health of the investee, industry and sector performance, changes in technology, and operational and financing cash flows. The carrying values of AFS investments of the Group and the Parent are P154,131,204,263 and P154,131,204,263 as of December 31, 2015 and P191,341,108,669 and P191,341,108,669 as of December 31, 2014, respectively.
d. Classification under HTM investments
The classification of non-derivative financial assets with fixed or determinable payments and fixed maturity as held-to-maturity requires significant judgment. In making this judgment, the Group evaluates its intention and ability to hold such investments to maturity. Further, the Group determines whether the investments are quoted or not; unquoted debt investments are classified under Loans and receivables. If the Group fails to keep these investments to maturity other than for specific circumstances — for example, selling an insignificant amount or close to maturity — it will be required to reclassify the entire held-to-maturity portfolio as available-for-sale. The investments would therefore be measured at fair value instead of amortized cost. The carrying values of lield-to-maturity investments of the Group and the Parent are P122,601,782 887 and P121,784,243,661 as of December 31, 2015 and P95,814,859,572 and P95,025,587,221 as of December 31, 2014, respectively.
e. Recognition of deferred tax asset
The Group cannot yet establish when it will realize its deductible temporary differences and carry forward benefits of NOLCO and MCIT. When the Group is already in a positive tax position, the Management will review the level of deferred tax assets that it will recognize in the books.
Estimation uncertainty
The key assumptions concerning the future and other key sources of estimation uncertainty at the reporting date, that have a significant risk of causing a material adjustment to the carrying amounts of assets and liabilities within the next financial year are discussed below.
a. Fair value of financial instruments (including derivatives)
The fair value of financial instruments that are not quoted in active markets are determined ty using generally accepted valuation techniques. Where valuation techniques (for example, models) are used to determine fair values, they are validated and periodically reviewed by the Risk Management Group. All models are reviewed
29
before they are used to ensure that outputs reflect actual data and comparative market prices. To the extent practicable, models use only observable data, however, areas such as credit risk (both own and counterparty), volatilities and correlations require Management to make estimates. Changes in assumptions about these factors could affect reported fair values of financial instruments.
b. Useful lives of property and equipment
The Group's Management determines the estimated useful lives and related depreciation charges for its property and equipment. The Bank will increase the depreciation charge where useful lives are less than previously estimated, or it will write-off or write-down technically obsolete or non-strategic assets that have been abandoned or sold. The carrying values of property and equipment of the Group and the Parent are P6,779,753,581 and P6,243,994,847 as of December 31, 2015 and P5,943,264,176 and P5,478,999,412 as of December 31, 2014, respectively.
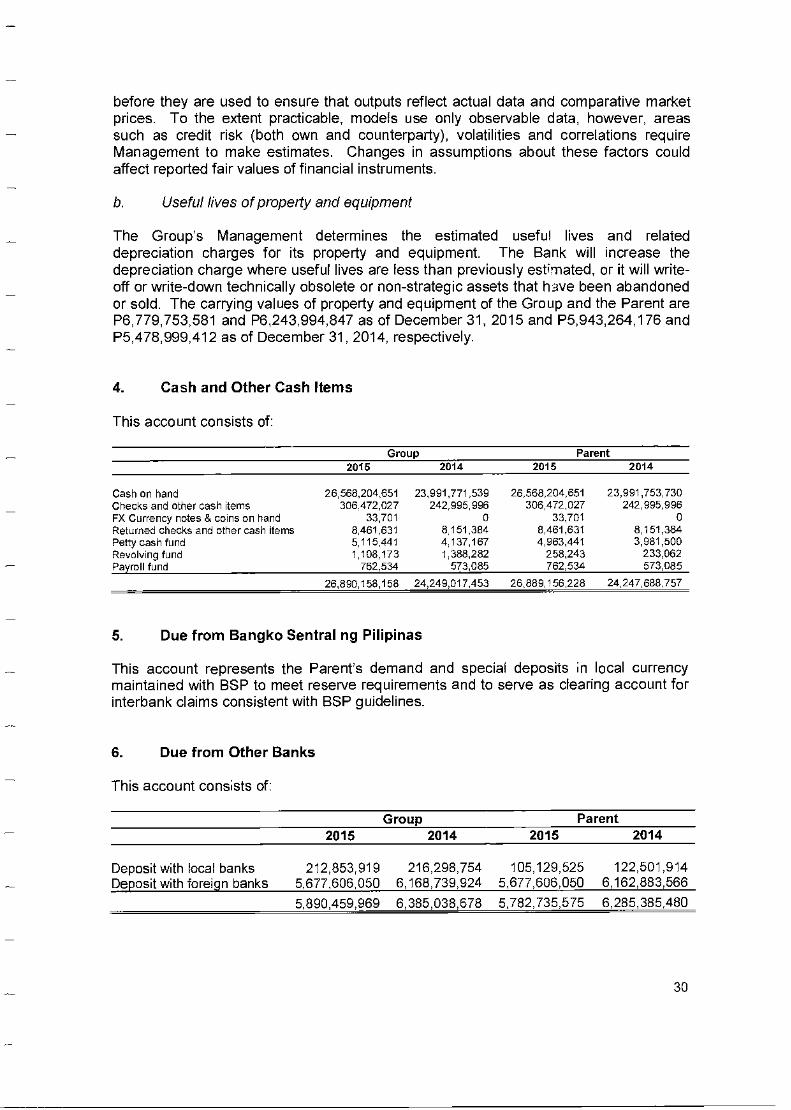
4. Cash and Other Cash Items
This account consists of:
Group Parent 2015 2014 2015 2014
Cash on hand 26568,204651 23,991,771,539 26,568,204,651 23,991,753730 Checks and other cash items 306.472,027 242,995,996 306472,027 242,995,996 FX Currency notes 8 coins on hand 33,701 0 33,701 0 Returned checks and other cash items 6461,631 8 151,384 8461,631 8,151,384 Petty cash fund 6115,441 4 137,167 4,963,441 3,981,500 Revolving fund 1,108,173 1 388,282 258,243 233,062 Payroll fund 752,534 573,085 762,534 573,085
26,890,158,158 24,249,017,453 26889,156228 24247,688,757
5. Due from Bangko Sentral ng Pilipinas
This account represents the Parent's demand and special deposits in local currency maintained with BSP to meet reserve requirements and to serve as clearing account for interbank claims consistent with BSP guidelines.
6. Due from Other Banks
This account consists of:
Group Parent 2015 2014 2015 2014
Deposit with local banks Deposit with foreign banks
212,853,919 5,677,606,050
216,298,754 6,168,739,924
105,129,525 5,677,606,050
122,501,914 6,162,883,566
5,890459,969 6,385,038,678 5,782,735,575 6,285,385,480
30
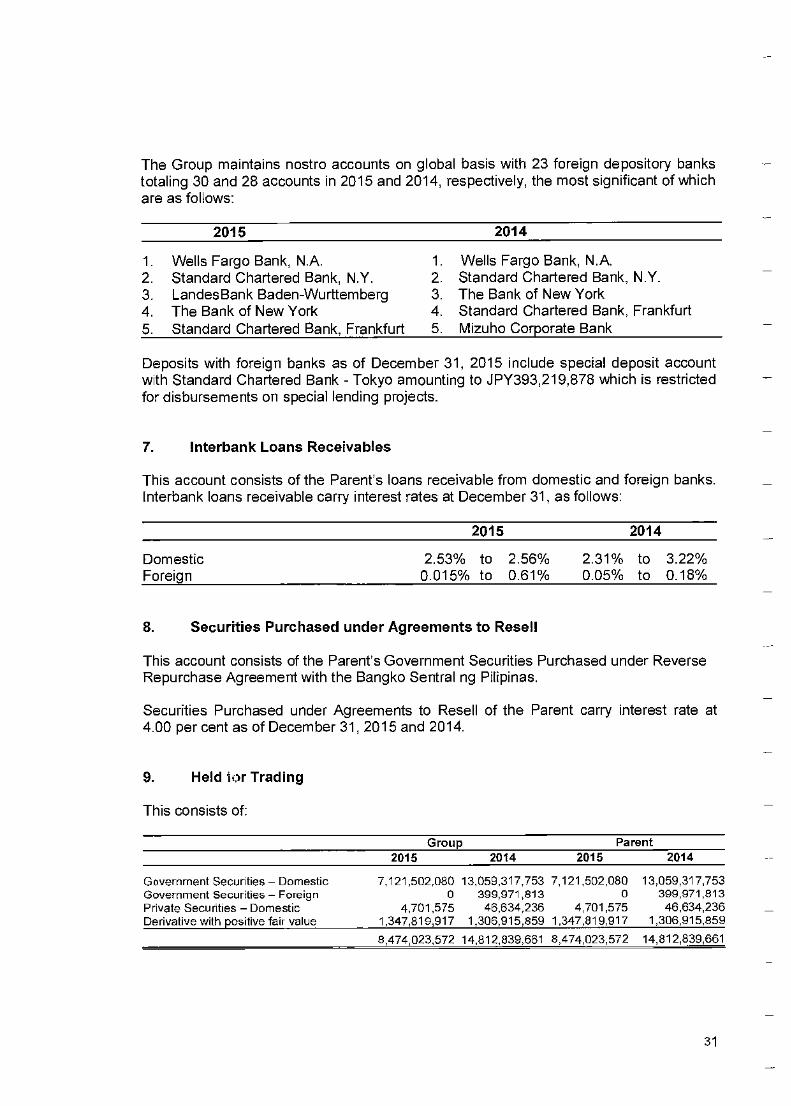
7,121,502,080 0
4,701,575 1,347,819,917
8,474,023,572
13,059,317,753 399,971,813 46,634,236
1,306,915,859
14,812,839,661
7,121,502,080 0
4,701,575 1,347,819,917
8,474,023,572
13,059,317,753 399,971,813 46,634,236
1,306,915,859
14,812,839,661
Government Securities — Domestic Government Securities — Foreign Private Securities — Domestic Derivative with positive fair value
The Group maintains nostro accounts on global basis with 23 foreign depository banks totaling 30 and 28 accounts in 2015 and 2014, respectively, the most significant of which are as follows:
2015 2014
1. Wells Fargo Bank, N.A. 2. Standard Chartered Bank, N.Y. 3. LandesBank Baden-Wurttemberg 4. The Bank of New York 5. Standard Chartered Bank, Frankfurt
1. Wells Fargo Bank, N.A. 2. Standard Chartered Bank, N.Y. 3. The Bank of New York 4. Standard Chartered Bank, Frankfurt 5. Mizuho Corporate Bank
Deposits with foreign banks as of December 31, 2015 include special deposit account with Standard Chartered Bank - Tokyo amounting to JPY393,219,878 which is restricted for disbursements on special lending projects.
7. Interbank Loans Receivables
This account consists of the Parent's loans receivable from domestic and foreign banks. Interbank loans receivable carry interest rates at December 31, as follows:
2015 2014
Domestic
2.53% to 2.56% 2.31% to 3.22% Foreign
0.015% to 0.61% 0.05% to 0.18%
8. Securities Purchased under Agreements to Resell
This account consists of the Parent's Government Securities Purchased under Reverse Repurchase Agreement with the Bangko Sentral ng Pilipinas.
Securities Purchased under Agreements to Resell of the Parent carry interest rate at 4.00 per cent as of December 31, 2015 and 2014.
9. Held for Trading
This consists of:
Group
Parent 2015 2014 2015
2014
31
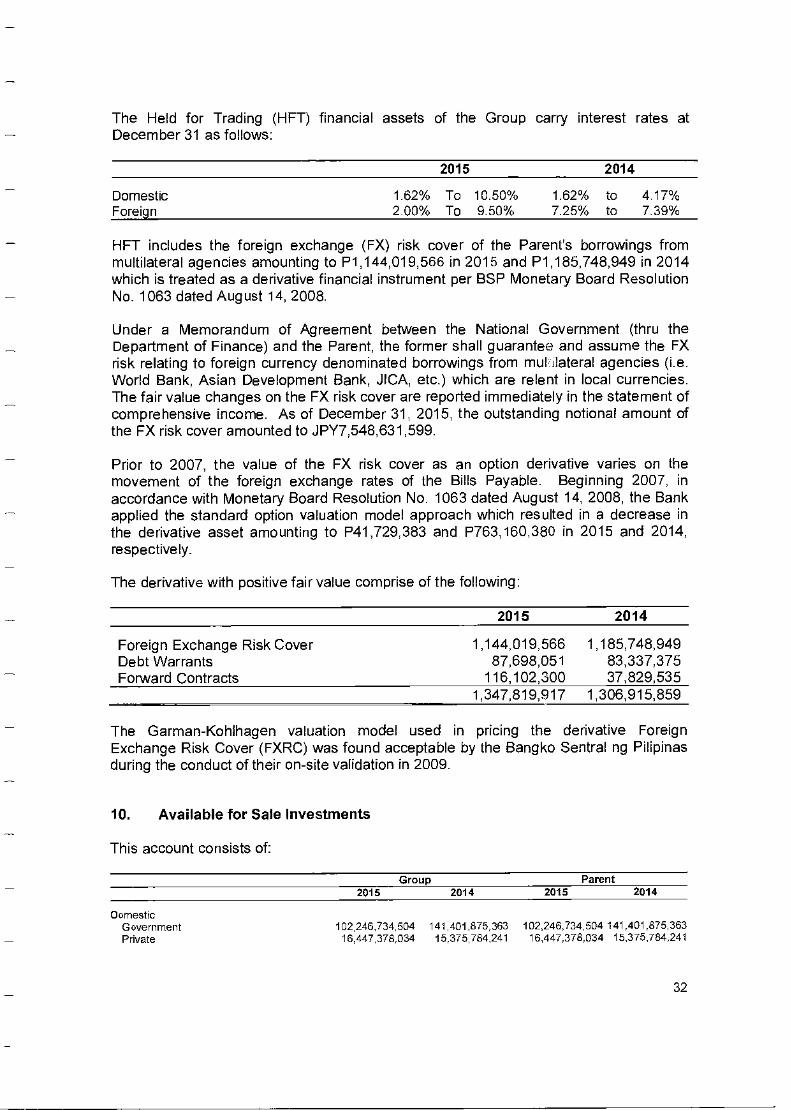
The Held for Trading (HFT) financial assets of the Group carry interest rates at December 31 as follows:
2015 2014
Domestic Foreign
1.62% 2.00%
To To
10.50% 9.50%
1.62% 7.25%
to to
4.17% 7.39%
HFT includes the foreign exchange (FX) risk cover of the Parent's borrowings from multilateral agencies amounting to P1,144,019,566 in 2015 and P1,185,748,949 in 2014 which is treated as a derivative financial instrument per BSP Monetary Board Resolution No. 1063 dated August 14, 2008.
Under a Memorandum of Agreement between the National Government (thru the Department of Finance) and the Parent, the former shall guarantee and assume the FX risk relating to foreign currency denominated borrowings from multilateral agencies (i.e. World Bank, Asian Development Bank, JICA, etc.) which are relent in local currencies. The fair value changes on the FX risk cover are reported immediately in the statement of comprehensive income. As of December 31, 2015, the outstanding notional amount of the FX risk cover amounted to JPY7,548,631,599.
Prior to 2007, the value of the FX risk cover as an option derivative varies on the movement of the foreign exchange rates of the Bills Payable. Beginning 2007, in accordance with Monetary Board Resolution No. 1063 dated August 14, 2008, the Bank applied the standard option valuation model approach which resulted in a decrease in the derivative asset amounting to P41,729,383 and P763,160,380 in 2015 and 2014, respectively.
The derivative with positive fair value comprise of the following:
2015 2014
Foreign Exchange Risk Cover 1,144,019,566 1,185,748,949 Debt Warrants 87,698,051 83,337,375 Forward Contracts 116,102,300 37,829,535
1.347.819.917 1,306,915,859
The Garman-Kohlhagen valuation model used in pricing the derivative Foreign Exchange Risk Cover (FXRC) was found acceptable by the Bangko Sentral ng Pilipinas during the conduct of their on-site validation in 2009.
10. Available for Sale Investments
This account consists of:
Group Parent
2015 2014
2015
2014
Domestic Government
102,246,734,504 141,401,875,363 102,246,734,504 141,401,875,363 Private
16,447,378,034 15,375,784,241 16,447,378,034 15,375,784,241
32
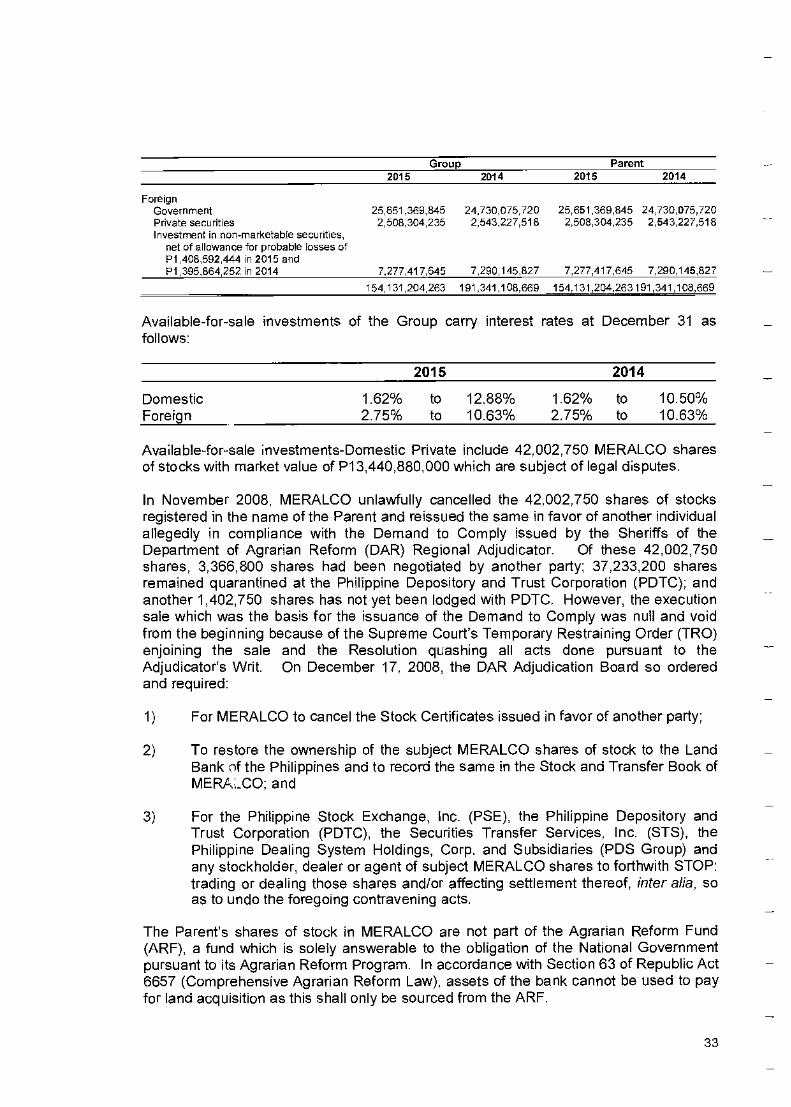
Group Parent 2015
2014
2015 2014
Foreign Government Private securities Investment in non-marketable securities,
net of allowance for probable losses of P1,408,592444 in 2015 and P1,395,864,252 in 2014
25,551,369,845 2,508,304,235
7,277,417,645
24,730,075 720 2,543,227,518
7,290,145,827
25.651,369,845 24 730,075,720 2.508,304,235 2.543227,518
7,277,417,645 7,290,145,827
154.131,204,263191,341,108,669
154,131,204,263 191,341,108,669
Available-for-sale investments of the Group carry interest rates at December 31 as follows:
2015 2014
Domestic
1.62% to 12.88% 1.62% to 10.50% Foreign
2.75% to 10.63% 2.75% to 10.63%
Available-for-sale investments-Domestic Private include 42,002,750 MERALCO shares of stocks with market value of P13,440,880,000 which are subject of legal disputes.
In November 2008, MERALCO unlawfully cancelled the 42,002,750 shares of stocks registered in the name of the Parent and reissued the same in favor of another individual allegedly in compliance with the Demand to Comply issued by the Sheriffs of the Department of Agrarian Reform (DAR) Regional Adjudicator. Of these 42,002,750 shares, 3,366,800 shares had been negotiated by another party; 37,233,200 shares remained quarantined at the Philippine Depository and Trust Corporation (PDTC); and another 1,402,750 shares has not yet been lodged with PDTC. However, the execution sale which was the basis for the issuance of the Demand to Comply was null and void from the beginning because of the Supreme Court's Temporary Restraining Order (TRO) enjoining the sale and the Resolution quashing all acts done pursuant to the Adjudicator's Writ. On December 17, 2008, the DAR Adjudication Board so ordered and required:
1) For MERALCO to cancel the Stock Certificates issued in favor of another party;
2) To restore the ownership of the subject MERALCO shares of stock to the Land Bank of the Philippines and to record the same in the Stock and Transfer Book of MERAi_CO; and
3) For the Philippine Stock Exchange, Inc. (PSE), the Philippine Depository and Trust Corporation (PDTC), the Securities Transfer Services, Inc. (STS), the Philippine Dealing System Holdings, Corp. and Subsidiaries (PDS Group) and any stockholder, dealer or agent of subject MERALCO shares to forthwith STOP: trading or dealing those shares and/or affecting settlement thereof, inter alia, so as to undo the foregoing contravening acts.
The Parent's shares of stock in MERALCO are not part of the Agrarian Reform Fund (ARF), a fund which is solely answerable to the obligation of the National Government pursuant to its Agrarian Reform Program. In accordance with Section 63 of Republic Act 6657 (Comprehensive Agrarian Reform Law), assets of the bank cannot be used to pay for land acquisition as this shall only be sourced from the ARF.
33
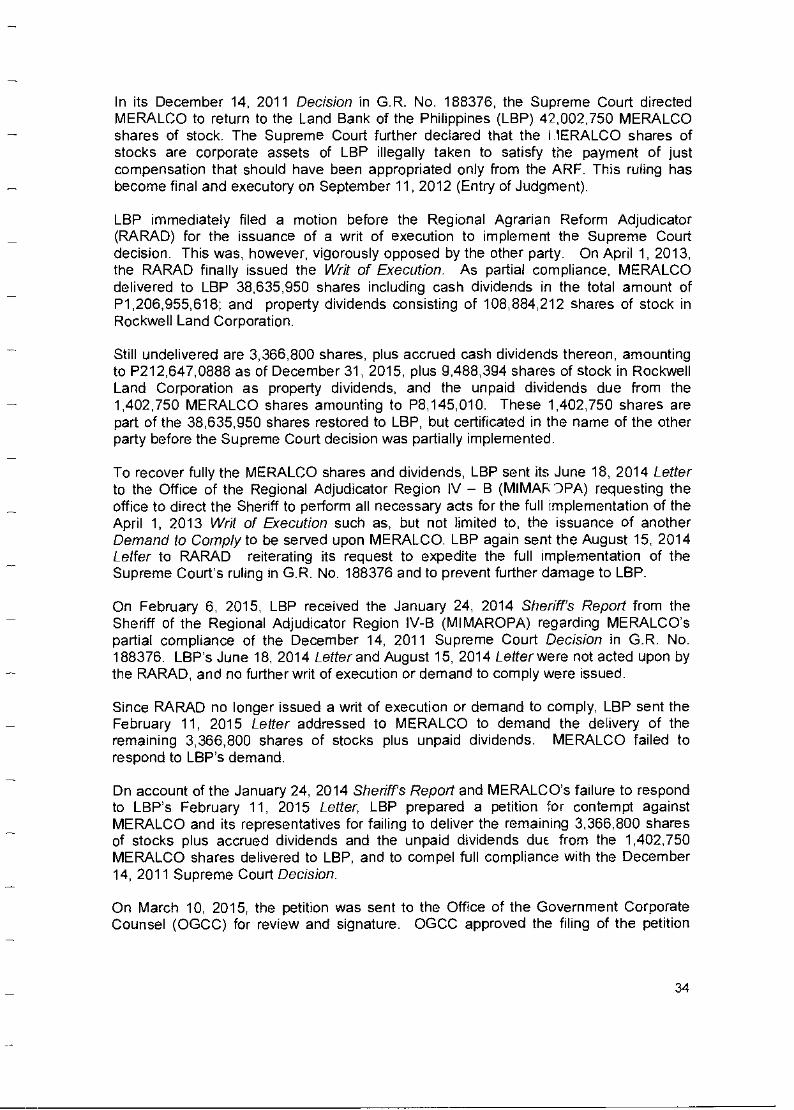
In its December 14, 2011 Decision in G.R. No. 186376, the Supreme Court directed MERALCO to return to the Land Bank of the Philippines (LBP) 42,002,750 MERALCO shares of stock. The Supreme Court further declared that the I IERALCO shares of stocks are corporate assets of LBP illegally taken to satisfy the payment of just compensation that should have been appropriated only from the ARF. This ruling has become final and executory on September 11, 2012 (Entry of Judgment).
LBP immediately filed a motion before the Regional Agrarian Reform Adjudicator (RARAD) for the issuance of a writ of execution to implement the Supreme Court decision. This was, however, vigorously opposed by the other party. On April 1, 2013, the RARAD finally issued the Writ of Execution. As partial compliance, MERALCO delivered to LBP 38 635 950 shares including cash dividends in the total amount of P1,206,955,618; and property dividends consisting of 108,884,212 shares of stock in Rockwell Land Corporation.
Still undelivered are 3,366,800 shares, plus accrued cash dividends thereon, amounting to P212,647,0888 as of December 31, 2015, plus 9,488,394 shares of stock in Rockwell Land Corporation as property dividends, and the unpaid dividends due from the 1,402,750 MERALCO shares amounting to P8,145,010. These 1,402,750 shares are part of the 38,635,950 shares restored to LBP, but certificated in the name of the other party before the Supreme Court decision was partially implemented.
To recover fully the MERALCO shares and dividends, LBP sent its June 18, 2014 Letter to the Office of the Regional Adjudicator Region IV — B (MIMAR 'DEA) requesting the office to direct the Sheriff to perform all necessary acts for the full implementation of the April 1, 2013 Writ of Execution such as, but not limited to, the issuance of another Demand to Comply to be served upon MERALCO LBP again sent the August 15, 2014 Letter to RARAD reiterating its request to expedite the full implementation of the Supreme Court's ruling in G.R. No. 188376 and to prevent further damage to LBP.
On February 6, 2015, LBP received the January 24, 2014 Sheriffs Report from the Sheriff of the Regional Adjudicator Region IV-B (MIMAROPA) regarding MERALCO's partial compliance of the December 14, 2011 Supreme Court Decision in G.R. No. 188376. LBP's June 18, 2014 Letter and August 15, 2014 Letter were not acted upon by the RARAD, and no further writ of execution or demand to comply were issued.
Since RARAD no longer issued a writ of execution or demand to comply, LBP sent the February 11, 2015 Letter addressed to MERALCO to demand the delivery of the remaining 3,366,800 shares of stocks plus unpaid dividends. MERALCO failed to respond to LBP's demand.
On account of the January 24, 2014 Sheriff's Report and MERALCO's failure to respond to LBP's February 11, 2015 Letter, LBP prepared a petition for contempt against MERALCO and its representatives for failing to deliver the remaining 3,366,800 shares of stocks plus accrued dividends and the unpaid dividends due from the 1,402,750 MERALCO shares delivered to LBP, and to compel full compliance with the December 14, 2011 Supreme Court Decision.
On March 10, 2015, the petition was sent to the Office of the Government Corporate Counsel (OGCC) for review and signature. OGCC approved the filing of the petition
34
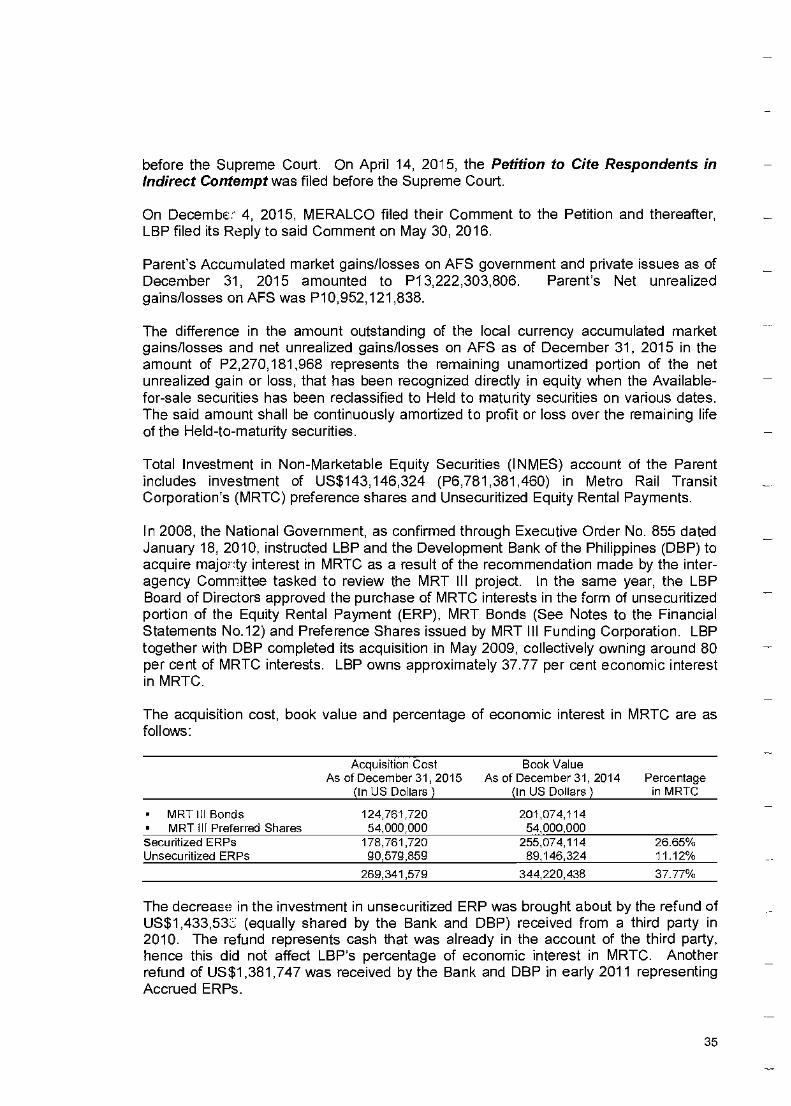
before the Supreme Court. On April 14, 2015, the Petition to Cite Respondents in Indirect Contempt was filed before the Supreme Court.
On Decembe: 4, 2015, MERALCO filed their Comment to the Petition and thereafter, LBP filed its Reply to said Comment on May 30, 2016.
Parent's Accumulated market gains/losses on AFS government and private issues as of December 31, 2015 amounted to P13,222,303,806. Parent's Net unrealized gains/losses on AFS was P10,952,121,838.
The difference in the amount outstanding of the local currency accumulated market gains/losses and net unrealized gains/losses on AFS as of December 31, 2015 in the amount of P2,270,181,968 represents the remaining unamortized portion of the net unrealized gain or loss, that has been recognized directly in equity when the Available-for-sale securities has been reclassified to Held to maturity securities on various dates. The said amount shall be continuously amortized to profit or loss over the remaining life of the Held-to-maturity securities.
Total Investment in Non-Marketable Equity Securities (INMES) account of the Parent includes investment of US$143,146,324 (P6,781,381,460) in Metro Rail Transit Corporation's (MRTC) preference shares and Unsecuritized Equity Rental Payments.
In 2008, the National Government, as confirmed through Executive Order No. 855 dated January 18, 2010, instructed LBP and the Development Bank of the Philippines (DBP) to acquire majorty interest in MRTC as a result of the recommendation made by the inter-agency Committee tasked to review the MRT III project. In the same year, the LBP Board of Directors approved the purchase of MRTC interests in the form of unsecuritized portion of the Equity Rental Payment (ERP), MRT Bonds (See Notes to the Financial Statements No.12) and Preference Shares issued by MRT III Funding Corporation LBP together with DBP completed its acquisition in May 2009, collectively owning around 80 per cent of MRTC interests. LBP owns approximately 37.77 per cent economic interest in MRTC.
The acquisition cost, book value and percentage of economic interest in MRTC are as follows:
Acquisition Cost
Book Value As of December 31, 2015
As of December 31, 2014 Percentage
(In US Dollars )
(In US Dollars ) in MRTC
• MRT Ill Bonds 124,761,720 201,074,114 • MRT III Preferred Shares 54,000,000 54,000,000 Securitized ERPs 178,761,720 255,074,114 26.65% Unsecuntized ERPs 90,579,859 89,146,324 11.12%
269,341,579 344,220,438 37.77%
The decrease in the investment in unsecuritized ERP was brought about by the refund of US$1,433,51-2 (equally shared by the Bank and DBP) received from a third party in 2010. The refund represents cash that was already in the account of the third party, hence this did not affect LBP's percentage of economic interest in MRTC. Another refund of US$1,381,747 was received by the Bank and DBP in early 2011 representing Accrued ERPs.
35
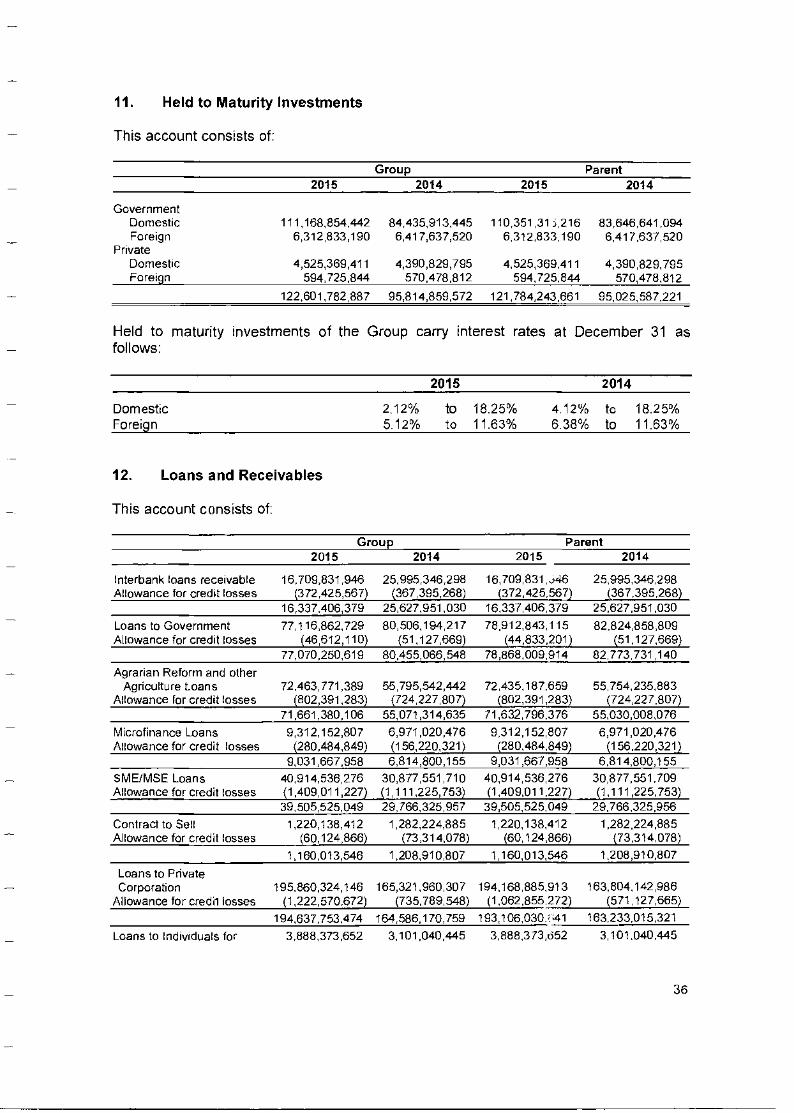
11. Held to Maturity Investments
This account consists of
Group Parent 2015 2014 2015 2014
Government Domestic 111,168,854.442 84,435,913,445 110,351,31 1216 83,646,641,094 Foreign 6,312633,190 6,417,637,520 6,312833,190 6,417.637,520
Private Domestic 4,525,369,411 4,390,829,795 4,525,369411 4,390,829,795 Foreign 594,725,844 570,478,812 594,725.844 570,478,812
122,601,782,887 95,814,859,572 121,784,243.661 95,025,587,221
Held to maturity investments of the Group carry interest rates at December 31 as follows:
2015 2014
Domestic 2.12% to 18.25% 4 12% to 18.25% Foreign 5.12% to 11.63% 6.38% to 11.63%
12. Loans and Receivables
This account consists of:
Group Parent 2015 2014 2015 2014
Interbank loans receivable 16.709,831,946 25,995,346,298 16,709,831_146 25,995,346,298 Allowance for credit losses (372,425,567) (367,395,268) (372,425,567) (367,395,268)
16,337406,379 25,627,951,030 16,337,406,379 25,627,951,030
Loans to Government 77,116,862,729 80,506,194,217 78912,843,115 82,824,858,809 Allowance for credit losses (46R12,110) (51,127,669) (44,833,201) (51,127,669)
77,070,250,619 80,455,066,548 78,868,009,914 82,773,731,140
Agrarian Reform and other Agriculture Loans 72,463,771,389 55,795,542,442 72,435,187.659 55,754,235,883
Allowance for credit losses (802,391,283) (724,227,807) (802,391,283) (724,227,807) 71,661,380,106 55,071,314,635 71,632,796.376 55,030,008,076
Microfinance Loans 9,312,152,807 6,971,020,476 9,312,152,807 6,971,020,476 Allowance for credit losses (280,484,849) (156,220,321) (280,484,849) (156.220,321)
9,031,667,958 6,814,800,155 9,031,667,958 6.814,800,155
SME/MSE Loans 40,914,536,276 30,877,551,710 40,914,536,276 30,877,551,709 Allowance for credit losses (1,409,011227) (1,111,225,753) (1,409,011227) (1,111,225,753)
39,505,525,049 29,766,325,957 39,505,525,049 29.766.325,956
Contract to Sell 1,220,138,412 1,282,224,885 1,220,138,412 1,282,224,885 Allowance for credit losses (60,124,866) (73,314,078) (60,124,866) (73,314,078)
1,160,013,546 1,208,910,807 1,160,013,546 1,208,910,807
Loans to Private Corporation 195.860,324,146 165,321,960,307 194,168,885,913 163.804,142,986
Allowance for credit losses (1,222,570,672) (735,789,548) (1,062.855 272) (571,127,665)
194,637,753.474 164,586,170,759 193,106,030:41 163,233.015,321
Loans to Individuals for 3,888,373,652 3,101,040445 3,888373,652 3,101 R40.445
36
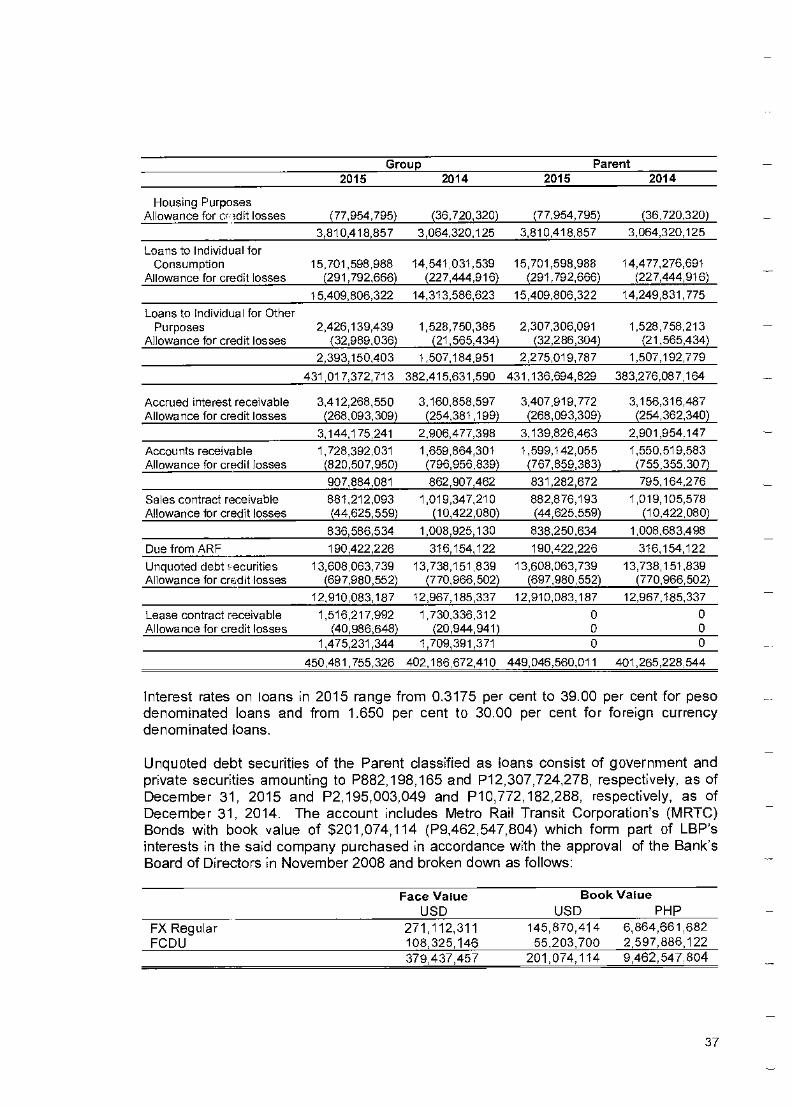
Group Parent 2015 2014 2015 2014
Housing Purposes Allowance for cs milt losses (77,954,795) (36,720,320) (77,954,795) (36,720,320)
3,810,418,857 3,064,320,125 3,810,418,857 3,064,320,125
Loans to Individual for Consumption 15,701,598,988 14,541,031,539 15,701,598,988 14,477,276,691
Allowance for credit losses (291,792,666) (227,444,916) (291792,666) (227,444,916)
15,409,806,322 14,313,586,623 15,409,806,322 14,249,831,775
Loans to Individual for Other Purposes 2,426,139,439 1,528,750,385 2,307,306,091 1,528,758,213
Allowance for credit losses (32,989,036) (21,565,434) (32,286,304) (21,565,434)
2,393,150,403 1,507,184,951 2,275,019,787 1,507,192779
431,017,372,713 382,415,631,590 431,136,694,829 383,276,087,164
Accrued interest receivable 3,412,268,550 3,160,858,597 3,407,919,772 3,156,316487 Allowance for credit losses (268,093,309) (254,381,199) (268,093,309) (254,362,340)
3,144,175241 2,906,477,398 3,139,826,463 2,901,954.147
Accounts receivable 1,728,392,031 1,659,864,301 1,599,142.055 1,550,519,583 Allowance for credit losses (820,507,950) (796,956,839) (767,859,383) (755,355,307)
907,884,081 862,907,462 831,282,672 795,164,276
Sales contract receivable 881,212,093 1,019,347,210 882,876,193 1,019,105,578 Allowance for credit losses (44,625,559) (10,422,080) (44,625,559) (10,422,080)
836,586,534 1,008,925,130 838,250,634 1,008,683.498
Due from ARF 190,422,226 316,154,122 190,422,226 316,154,122
Unquoted debt securities 13,608,063,739 13,738,151,839 13,608,063,739 13,738,151,839 Allowance for credit losses (697,980,552) (770,966,502) (697,980,552) (770,966,502)
12,910,083,187 12967,185337 12,910,083,187 12,967,185,337
Lease contract receivable 1,516,217,992 1,730,336,312 0 0 Allowance for credit losses (40,986,648) (20,944,941) 0 0
1,475,231,344 1,709,391,371 0 0
450,481,755,326 402,186,672,410 449,046,560,011 401,265,228 544
Interest rates on loans in 2015 range from 0.3175 per cent to 39.00 per cent for peso denominated loans and from 1.650 per cent to 30.00 per cent for foreign currency denominated loans.
Unquoted debt securities of the Parent classified as loans consist of government and private securities amounting to P882,198,165 and P12,307,724,278, respectively, as of December 31, 2015 and P2,195,003,049 and P10,772,182,288, respectively, as of December 31, 2014. The account includes Metro Rail Transit Corporation's (MRTC) Bonds with book value of $201,074,114 (P9,462,547,804) which form part of LBP's interests in the said company purchased in accordance with the approval of the Bank's Board of Directors in November 2008 and broken down as follows:
Face Value
Book Value
USD
USD PHP FX Regular 271,11Z 311 145,870,414 6,864,661.682 FCDU 108,325,146 55,203,700 2,597,886,122
379,437,457 201,074,114 9,462,547 804
37
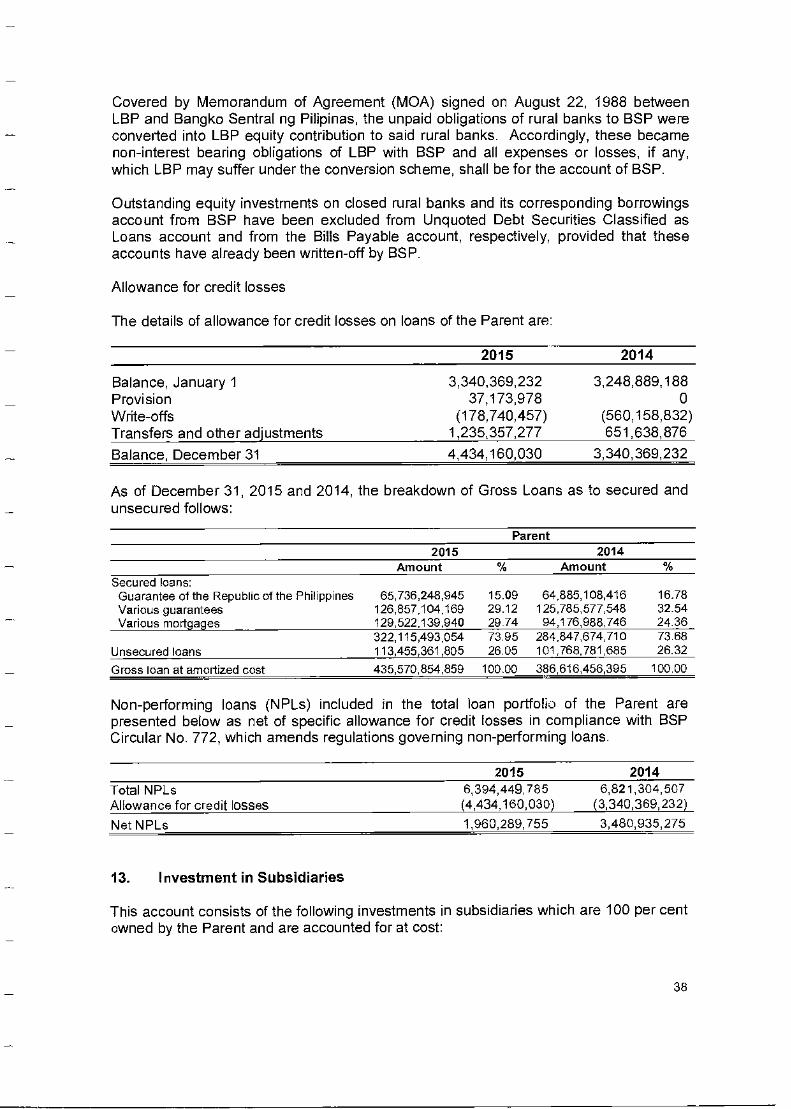
Covered by Memorandum of Agreement (MOA) signed on August 22, 1988 between LBP and Bangko Sentral ng Pilipinas, the unpaid obligations of rural banks to BSP were converted into LBP equity contribution to said rural banks. Accordingly, these became non-interest bearing obligations of LBP with BSP and all expenses or losses, if any, which LBP may suffer under the conversion scheme, shall be for the account of BSP.
Outstanding equity investments on closed rural banks and its corresponding borrowings account from BSP have been excluded from Unquoted Debt Securities Classified as Loans account and from the Bills Payable account, respectively, provided that these accounts have already been written-off by BSP.
Allowance for credit losses
The details of allowance for credit losses on loans of the Parent are:
2015 2014
Balance, January 1 3,340,369,232 3,248,889,188 Provision 37,173,978 0 Write-offs (178,740,457) (560,158,832) Transfers and other adjustments 1,235,357,277 651,638,876
Balance, December 31 4,434,160,030 3,340,369,232
As of December 31, 2015 and 2014, the breakdown of Gross Loans as to secured and unsecured follows:
Parent 2015 2014
Amount Amount Secured bans: Guarantee of the Republic of the Philippines 65,736,248,945 15.09 64,885,108,416 16.78 Various guarantees 126,857,104,169 29.12 125,785,577,548 32.54 Various mortgages 129,522,139,940 29 74 94,176,988,746 24.36
322,115,493,054 73.95 284,847,674,710 73.68 Unsecured loans 113,455,361,805 26.05 101,768,781,685 26.32
Gross loan at amortized cost 435,570,854,859 100.00 386,616,456,395 100.00
Non-performing loans (NPLs) included in the total loan portfolio of the Parent are presented below as net of specific allowance for credit losses in compliance with BSP Circular No. 772, which amends regulations governing non-performing loans.
2015 2014 Total NPLs 6,394,449,785 6,821,304,507 Allowance for credit losses (4,434,160,030) (3,340,369,232)
Net NPLs 1,960,289,755 3,480,935,275
13. Investment in Subsidiaries
This account consists of the following investments in subsidiaries which are 100 per cent owned by the Parent and are accounted for at cost:
38
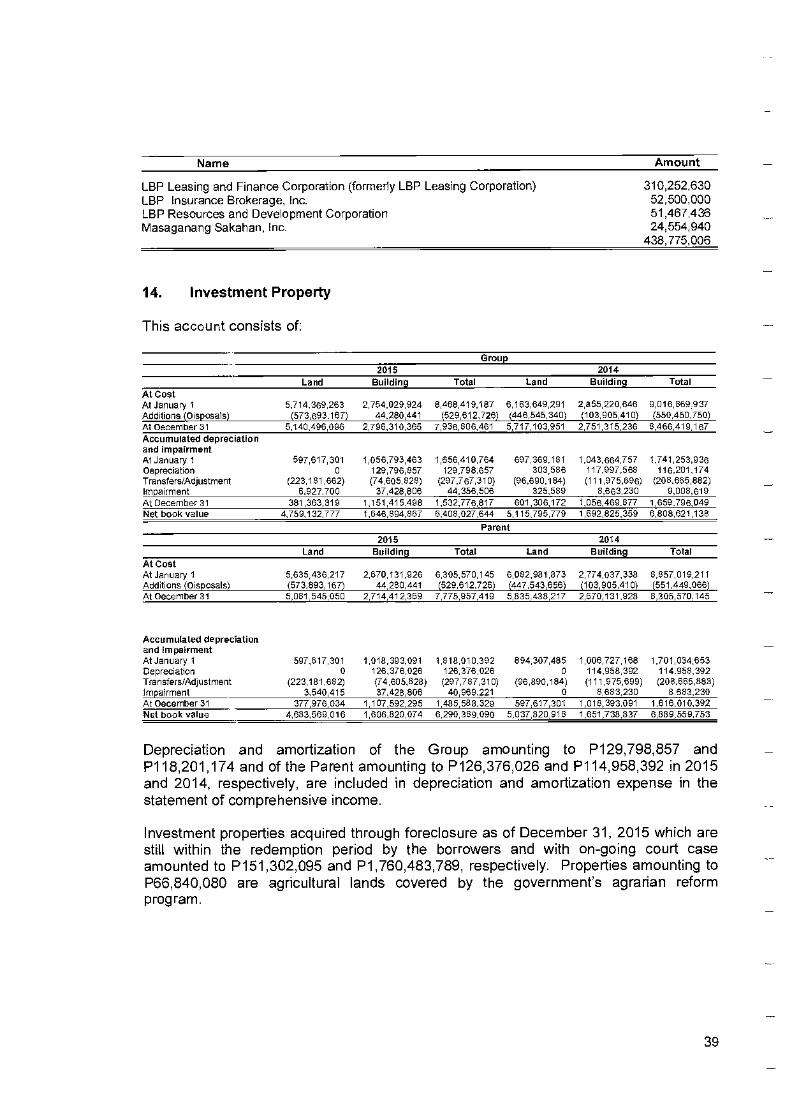
Name Amount
LBP Leasing and Finance Corporation (formerly LBP Leasing Corporation) 310,252630 LBP Insurance Brokerage, Inc. 52,500,000 LBP Resources and Development Corporation 51,467,436 Masaganang Sakahan, Inc, 24,554,940
438,775,006
14. Investment Property
This account consists of:
Group 2015 2014
Land Building Total Land Building Total
At Cost At January 1 Additions (Disposals)
5,714389,263 (573,893.167)
2756026924 44,280,441
8,468,419,187 (529,612,726)
6.163646291 (446,545,340)
Z85A 220,646 (103,905,410)
9,018,869,937 (550,450,750)
At December 31 5.140,496,096 2,798.310,365 7,938,806,461 5,717,103,951 2,751,315,236 8,468,419 187
Accumulated depreciation and impairment At January 1 Depreciation Tran3fers/AdjuStMent Impairment
597,617,301 0
(223,181,682) 6.927,700
1,058,793,463 129,798,957 (74,605,828)
37,428,806
1,656,410,764 129,798,857
(297,787,310) 44,356,506
897 369.181 303,586
(96.890,184) 325589
1,043,884,757 117,897,588 (111,975,698)
8683,230
1.741,253,938 118,201,174
(208.665,882) 9,009,819
At December 31 381,363,319 1,151,415.498 1.532.778,817 601,308,172 1,058,489.877 1,859.798,049 Net book value 4,759,132,777 1,646,894,887 5,408,027,644 5,115,795,779 1,692,825,359 6,806,621,138
Parent 2015 2014
Land Building Total Land Building Total
At cost At January 1 Additions (Disposals)
5,635,438,217 (573,893,167)
2,670,131,928 44.280.441
8,305,570,145
(529,612,726) 6,082,981,873 (447,543 656)
2,774,037,338 (103 905,410)
8,857,019,211 (551,449,066)
At December 31 5,061 545,050 2,714,412,369 7,775,957,419 5,635.438,217 2,670,131928 8,305,570.145
Accumulated depreciation and impairment At January 1 Depreciation Transfers/Adjustment Impairment
597,517,301 0
(223,181 682) 3,540,415
1,018,393,091 126,376,026 (74,605,628) 37,428,806
1,816,010,392 126,376,026 (297,797,310)
40,969,221
694,307,485 0
(96,690,184) 0
1,006,727,168 114,958,392 (111,975,699)
8,683,230
1,701,034,653 114.958,392 (208.665,883)
8683,230 At December 31 377,976,034 1,107,592,295 1,485,568.329 597.617,301 1.018,393,091 1,616,010,392 Net book value 4,683,569,016 1,606,820,074 6,290,389,090 5,037,820 916 1,651,738,837 6,689,559.753
Depreciation and amortization of the Group amounting to P129,798,857 and P118,201,174 and of the Parent amounting to P126,376,026 and P114,958,392 in 2015 and 2014, respectively, are included in depreciation and amortization expense in the statement of comprehensive income.
Investment properties acquired through foreclosure as of December 31, 2015 which are still within the redemption period by the borrowers and with on-going court case amounted to P151,302,095 and P1,760,483,789, respectively. Properties amounting to P66,840,080 are agricultural lands covered by the government's agrarian reform program.
39
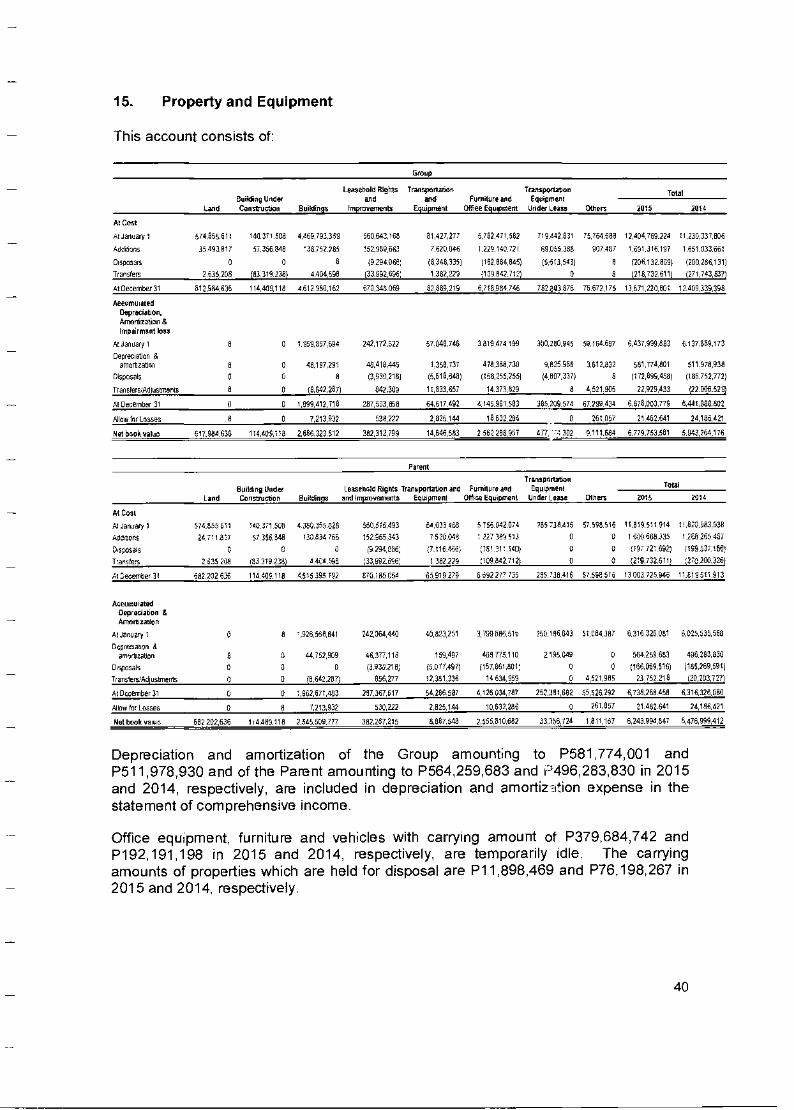
15. Property and Equipment
This account consists of:
Gm
Land
Bulking Under
Construction EleikEnds
Leasehold Rights and
Improvements
TranspOilafion
arid
Equipment
Furniture and
Office Equipment
Tiampohaton
Equipment
Under Lease
Total
Others 2015 2014
At Cost
Ar January 1
Addiaons
Disposals
Transfers
574.855.611
75 493.817
0
2535.208
140 37.1 506.
57.356.848
0
833192331 238}
4.469.793.359
'39.752.205
0
4.404.598
560.649.168
15298.9 683
(9294086',
(33.992,696:
81,427,277
7.620.048
(6340,335)
1.382,229
5.702.471.582
1.229.140.721
(192.684.845)
;13988712)
719.442 031
(5.613.543)
9
75.754688
907.487
0
0
12.404.769.221
1.691.316.197
(206928091
(218,732 611)
11.230.337.806
1.651.033661
)200.288.131)
(271,743,937)
At Decenter 31 612.964.636 114.409.118 4612 950,162 670.343 069 62.089,219 6,718,984 746 79283}816 870 75 672.175 11671.220.001 12.409.339.398
Accumulated
DepreCiatiOn, Amorhiation 8
Impairment lose
At January 1
Depreciabon .4 amolzatiori
Disposals
7ransfers1Adjusuten6s
n
8
0
0
0
0
0
0
1.959.857.694
48,197,291
0
(8,642,267)
242,172,522
48.418445
(3,930 218)
842309
57 049.746
151, 36156:763478)
11,833,657
3 819474 199
(41750:3258-85:7251
14 373.829
300,700.945
9,825 968
(4607,137)
0
59.154.697
3.612.832
0
4.521 905
6.437.999003
581.774.001
072,699,4581
22.929.433
6.137.669,173
511 978,930
(165.752,772)
(72405529)
Al December 31 0 G 1,999412,718 28750,858 64,617 492 4.145.901.503 305.209.574 67.299 434 6.870,003.779 6.441,889.802
Mow for Losses 0 0 7,213,932 530,222 2.925 144 10 632.206 0 261 057 21 462.641 24,186421
Net book value 612984.638 1/4,409,119 2,606 323 512 382,312.789 14,646.563 2 562 290.957 111, 302 op 11,054 6.779.753.581 5.943,264,176
Parent
Land Building Under Constniceon Buildings
Leasehold Rights Transportation and Furniture and vdImprovemertts Equipment Office Equipment
Transportation Equipment
Under Lease
Total
Oln es 3015 2014
At Cost
Ai Janda" 1 574 855 511 149371505 4 3.50 35582P 550 515 493 61035463 483 5 756 042074 285 733 416 57.595516 516 IT 819 511 914 I' 020 983 5.‘B
AdftenS 24 711 817 986846 8U 130634 765 152 555343 7 520048 1 227 lEri 513 0 0 1 600668235 1168165457
D,S20:SiS 0 0 i) (9294, 086', i.7 lit 4860 r 81 31' 140) 0 0 097 724 692) 159951. lee
Pansfers 2 635 288 183319238) 238) d 4t.• 599. n38,enznnnn I 382 229 ;IN 842 712) 0 0 /2187326111 Gill :270.20032Q
Al L'ecernver 31 602 202 636 114.409,116 4 515 a95 C92 670.185054 05019 279 6 692 277 735 215 ',IA 416 57598546 0003725945 1' 819 511 903
Accumulated Depredation 6 Amortilation
At January 1 0 9 "26,550,841 242,964,440 46,823.251 3,799 686.519 250.186.613 51004.387 6.316 326 001 6,825,535,568
DepnSiation &
amorlization 0 a 44.752,909 48,377,118 159,497 408 775 110 2195049 0 554.259 603 496.283,030
Disposals 0 a 0 (3 6562771 (5.077,497) (157,061,901: 0 0 (166,069,516) 085,289,591)
TransfersAdiusVen% 0 a (8.642.267) 656,277 12,381,338 14 634.959 0 4.520.905 23.752.219 (20,203,727).
Al December 31 0 9 1,962671,403 287.367.817 54,286 507 4,126034,797 252.381.992 55,526.292 6,738,268 458 6.316.326.080
Allow far Losses 0 CI 7,213,932 530,212 2.825.144 10.832,286 0 261,057 21.482.641 24,186.421
Net book value 602 292,636 114.409.118 2.545.509.777 382,287,215 0,00,548 2.555.610.662 33.356.724 1,811.167 6,243.991047 5,478,999,412
Depreciation and amortization of the Group amounting to P581,774,001 and P511,978,930 and of the Parent amounting to P564,259,683 and '496,283,830 in 2015 and 2014, respectively, are included in depreciation and amortization expense in the statement of comprehensive income.
Office equipment, furniture and vehicles with carrying amount of P379,684,742 and P192,191,198 in 2015 and 2014, respectively, are temporarily idle. The carrying amounts of properties which are held for disposal are P11,898,469 and P76,198,267 in 2015 and 2014, respectively.
40
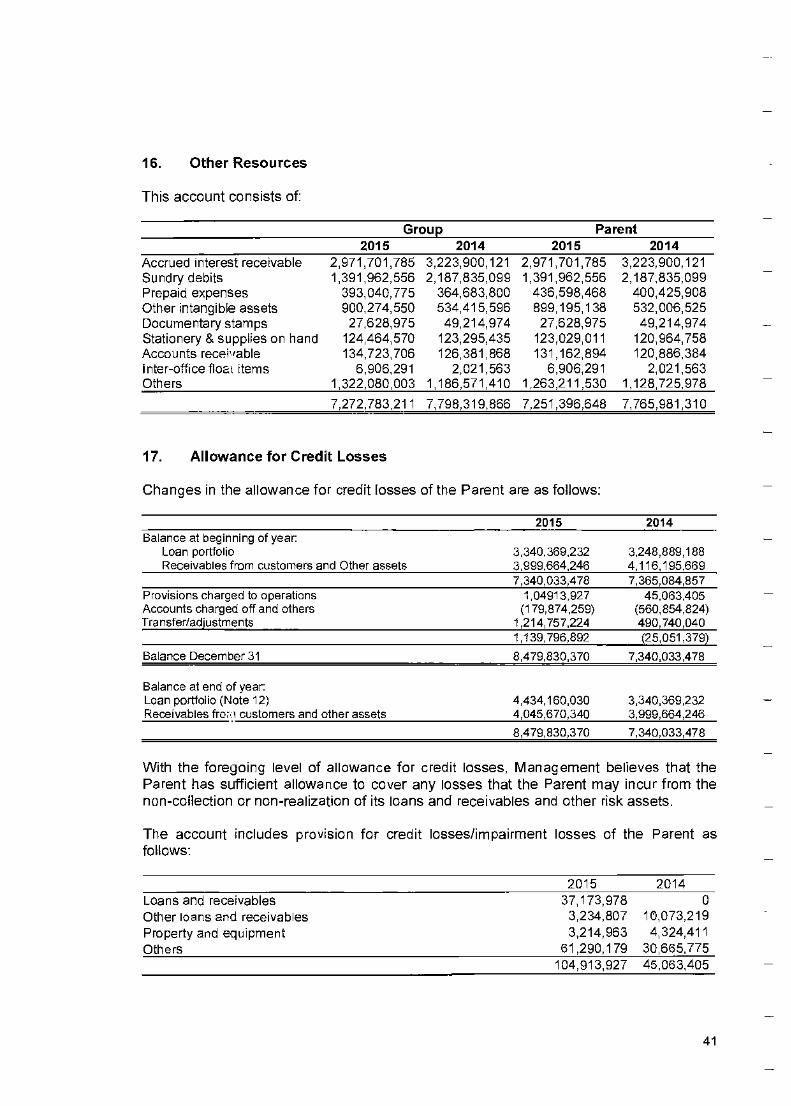
16. Other Resources
This account consists of:
Group Parent 2015 2014 2015 2014
Accrued interest receivable 2,971,701,785 3,223,900,121 2,971,701,785 3,223,900,121 Sundry debits 1,391,962,556 2,187,835,099 1,391,962,556 2,187,835,099 Prepaid expenses 393,040,775 364,683,800 436,598,468 400,425,908 Other intangible assets 900,274,550 534,415,596 899,195,138 532,006,525 Documentary stamps 27,628,975 49,214,974 27,628,975 49,214,974 Stationery & supplies on hand 124,464,570 123,295,435 123,029,011 120,964,758 Accounts receivable 134,723,706 126,381,868 131,162,894 120,886,384 Inter-office floe items 6,906,291 2,021,563 6,906,291 2,021,563 Others 1,322,080,003 1,186,571,410 1,263,211,530 1,128,725,978
7,272,783,211 7,798,319,866 7,251,396,648 7,765,981,310
17. Allowance for Credit Losses
Changes in the allowance for credit losses of the Parent are as follows:
2015 2014 Balance at beginning of year:
Loan portfolio Receivables from customers and Other assets
3,340,369,232 3,999,664,246
3,248,889,188 4,116,195,669
7,340,033,478 7,365,084,857 Provisions charged to operations 1,04913,927 45,063,405 Accounts charged off and others (179,874,259) (560,854,824) Transfer/adjustments 1,214,757,224 490,740,040
1,139,796,892 (25,051,379)
Balance December 31 8,479,830,370 7,340,033,478
Balance at end of year: Loan portfolio (Note 12) 4,434,160,030 3,340,369,232 Receivables from customers and other assets 4,045,670,340 3,999,664,246
8,479,830,370 7,340,033,478
With the foregoing level of allowance for credit losses, Management believes that the Parent has sufficient allowance to cover any losses that the Parent may incur from the non-collection or non-realization of its loans and receivables and other risk assets.
The account includes provision for credit losses/impairment losses of the Parent as follows:
2015 2014 Loans and receivables 37,173,978 0 Other loans and receivables 3,234,807 10,073,219 Property and equipment 3,214,963 4,324,411 Others 61,290,179 30,665,775
104,913,927 45,063,405
41
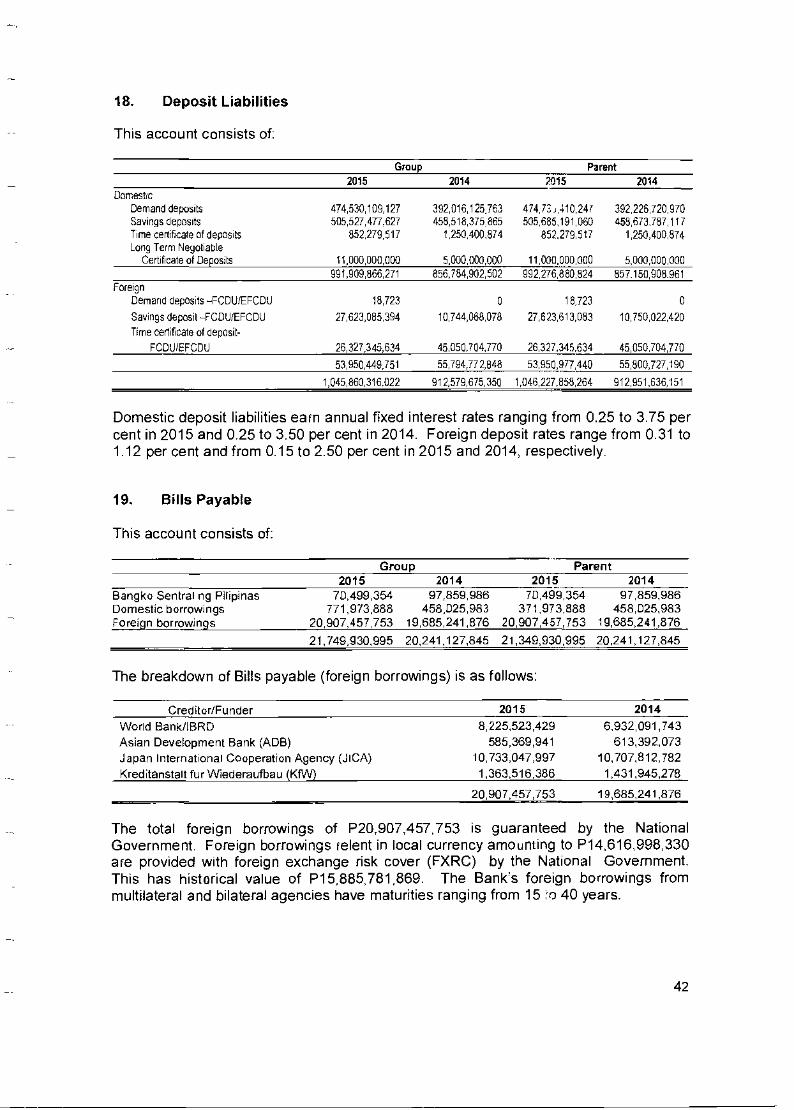
18. Deposit Liabilities
This account consists of:
Group Parent 2015 2014 2015 2014
Domestic Demand deposits 474,530,109.127 392,016,125 763 474,73.,410,247 392,226,720,970 Savings deposits 505,527,477.627 458,518,375 865 505,685,191,060 458,673.787,117 Time certificate of deposits 852,279,517 1,250,400,874 852.279,517 1,250,400,874 Long Term Negotiable
Certificate of Deposits 11,000600,000 5,000,000,000 11,000.000,000 5,000,000,000 991,909,866,271 856784602,502 992,276,880,824 857.150,908.961
Foreign Demand deposits -FCDU/EFCDU 18723 0 15,723 0 Savings deposit -FCDU/EFCDU 27,623,085,394 10,744,068,078 27,623,613,083 10,750,022,420
Time certificate of deposit-
FCDUiEFCDU 26,327,345,634 45,056704,770 26,327,345,634 45,050,704,770
53,950,449,751 55,794,772,848 53,950,977,440 55,800,727,190
1,045,860,316.022 912,579,675,350 1,046,227,858,264 912,951,636,151
Domestic deposit liabilities earn annual fixed interest rates ranging from 0.25 to 3.75 per cent in 2015 and 0.25 to 3.50 per cent in 2014. Foreign deposit rates range from 0.31 to 1.12 per cent and from 0.15 to 2.50 per cent in 2015 and 2014, respectively.
19. Bills Payable
This account consists of:
Group
Parent 2015
Bangko Sentral ng Pilipinas 70,499,354 Domestic borrowings 771,973,888 Foreign borrowings 20,907,457,753
21,749,930,995
2014 97859,986
458025,983 19,685,241,876
20,241,127,845
2015 70499,354
371,973,888 20,907457,753
21,349,930.995
2014 97,859,986
458,025,983 19,685,241,876
20,241,127845
The breakdown of Bills payable (foreign borrowings) is as follows:
Creditor/Funder
World Bank/IBRD Asian Development Bank (ADB) Japan International Cooperation Agency (JICA) Kreditanstalt fur Wiederaufbau (KfVV)
2015
8,225,523,429 585,369,941
10,733,047,997 1,363,516,386
2014
6,932,091,743 613,392,073
10,707,812,782 1,431,945,278
20,907A57,753 19,685,241,876
The total foreign borrowings of P20,907,457,753 is guaranteed by the National Government. Foreign borrowings relent in local currency amounting to P14,616,998,330 are provided with foreign exchange risk cover (FXRC) by the National Government. This has historical value of P15,885,781,869. The Bank's foreign borrowings from multilateral and bilateral agencies have maturities ranging from 15 ill) 40 years.
42
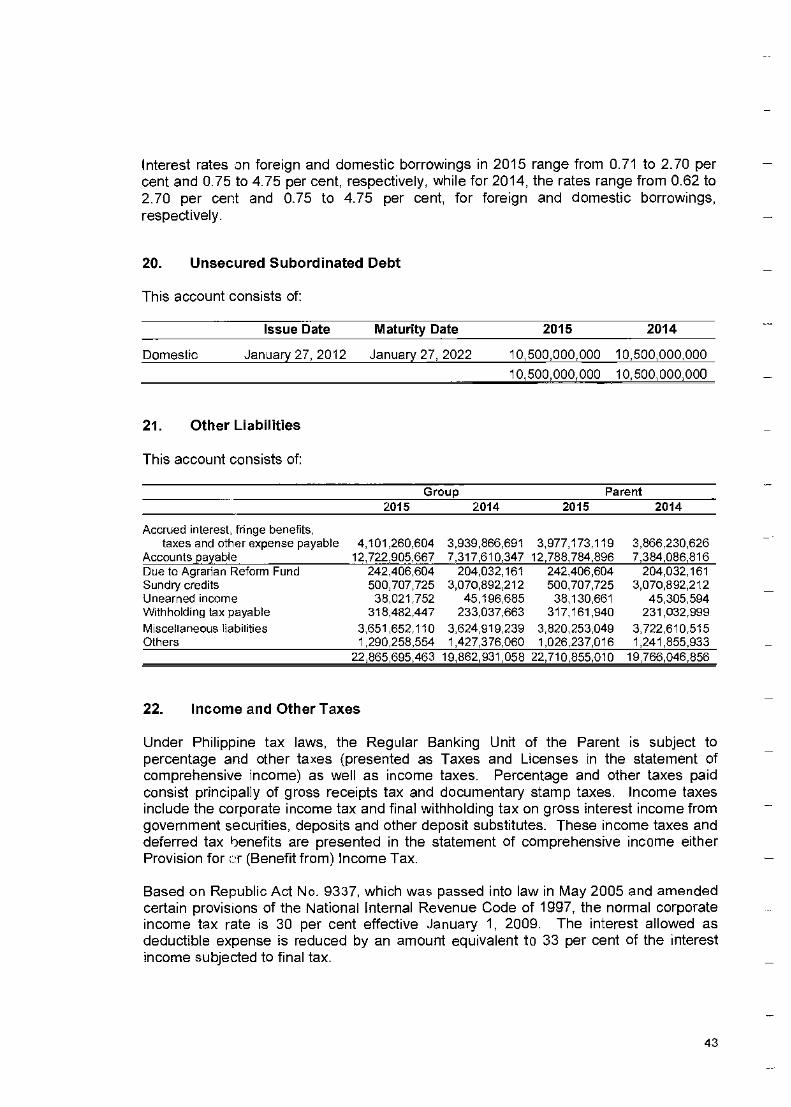
Interest rates on foreign and domestic borrowings in 2015 range from 0.71 to 2.70 per cent and 0.75 to 4.75 per cent, respectively, while for 2014, the rates range from 0.62 to 2.70 per cent and 0.75 to 4.75 per cent, for foreign and domestic borrowings, respectively.
20. Unsecured Subordinated Debt
This account consists of:
Issue Date Maturity Date 2015 2014
Domestic January 27, 2012 January 27, 2022 10, 500,000,000 10,500,000,000
10 500,000000 10 500,000,000
21. Other Liabilities
This account consists of:
Group Parent 2015 2014 2015 2014
Accrued interest, fringe benefits, taxes and other expense payable 4,101,260,604 3,939,866,691 3,977,173,119 3,866,230,626
Accounts payable 12,722,905,667 7,317,610,347 12,788,784,896 7,384,086,816 Due to Agrarian Reform Fund 242,406,604 204,032,161 242,406,604 204,032,161 Sundry credits 500,707,725 3,070,892,212 500,707,725 3,070,892,212 Unearned income 38,021,752 45,196,685 38,130,661 45,305,594 Withholding tax payable 318,482,447 233,037,663 317,161,940 231,032,999 Miscellaneous liabilities 3,651,652,110 3,624,919,239 3,820,253,049 3,722,610,515 Others 1290258,554 1,427,376,060 1,026,237,016 1,241,855,933
22,865,695,463 19,862,931,058 22,710,855,010 19,766,046,856
22. Income and Other Taxes
Under Philippine tax laws, the Regular Banking Unit of the Parent is subject to percentage and other taxes (presented as Taxes and Licenses in the statement of comprehensive income) as well as income taxes. Percentage and other taxes paid consist principally of gross receipts tax and documentary stamp taxes. Income taxes include the corporate income tax and final withholding tax on gross interest income from government securities, deposits and other deposit substitutes. These income taxes and deferred tax benefits are presented in the statement of comprehensive income either Provision for cr (Benefit from) Income Tax.
Based on Republic Act No. 9337, which was passed into law in May 2005 and amended certain provisions of the National Internal Revenue Code of 1997, the normal corporate income tax rate is 30 per cent effective January 1, 2009. The interest allowed as deductible expense is reduced by an amount equivalent to 33 per cent of the interest income subjected to final tax.
43
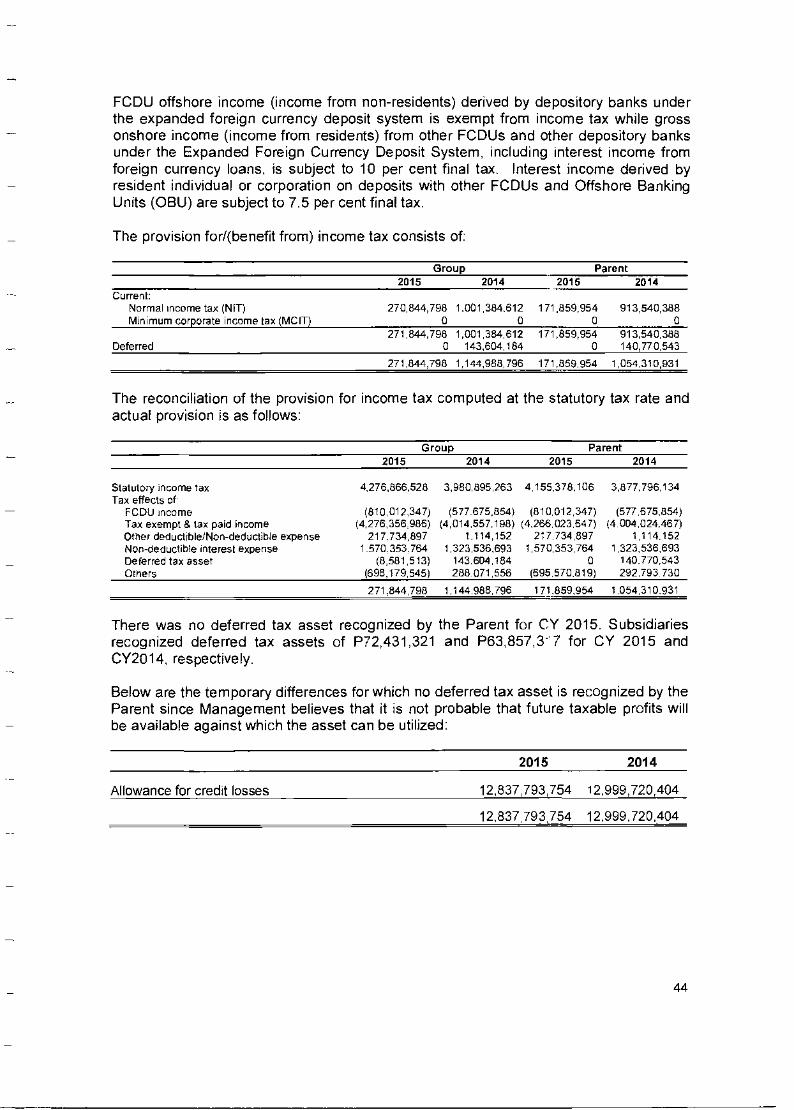
FCDU offshore income (income from non-residents) derived by depository banks under the expanded foreign currency deposit system is exempt from income tax while gross onshore income (income from residents) from other FCDUs and other depository banks under the Expanded Foreign Currency Deposit System, including interest income from foreign currency loans, is subject to 10 per cent final tax. Interest income derived by resident individual or corporation on deposits with other FCDUs and Offshore Banking Units (OBU) are subject to 7.5 per cent final tax.
The provision for/(benefit from) income tax consists of:
Group Parent 2015 2014 2015 2014
Current: Normal income tax (NIT) 270,844,798 1.001,384,612 171,859,954 913,540,388 Minimum corporate income tax (MCIT) 0 0 0
271,844,798 1,001,384,612 171,859,954 913,540,388 Deferred 0 143,604,184 a 140,770,543
271,844,798 1,144,986796 171659,954 1054310 931
The reconciliation of the provision for income tax computed at the statutory tax rate and actual provision is as follows:
Group Parent 2015 2014 2015 2014
Statutory income tax 4,276,866,528 3,980.895.263 4.155.378,106 3.877.796134 Tax effects of
FCDU income (810,012,347) (577.675,854) (810.012,347) (577.675,854) Tax exempt 8 tax paid income (4,276,356.986) (4,014,557,198) (4,266 023 647) (4 D04,024,467) Other deducible/Non-deductible expense 217734,897 1.114,152 217.734,897 1,114152 Non-deductible Interest expense 1570.353.764 1,323,536.693 1,570,353,764 1,323,536,693 Deferred tax asset (8,581,513) 143.604,184 0 140,770,543 Others (698,179,545) 288 071,556 (695 570,819) 292,793 730
271.844,798 1,144.988,796 171.859,954 1.054,310.931
There was no deferred tax asset recognized by the Parent for CY 2015. Subsidiaries recognized deferred tax assets of P72,431,321 and P63,857,3-'7 for CY 2015 and CY2014, respectively.
Below are the temporary differences for which no deferred tax asset is recognized by the Parent since Management believes that it is not probable that future taxable profits will be available against which the asset can be utilized:
2015 2014
12,837,793,754 12,999,720,404
12,837,793,754 12,999,720,404
Allowance for credit losses
44

Supplementary Information Required Under Revenue Regulations (RR) No. 19-2011 and 15-2010
Supplementary information Under RR No. 19-2011
In addition to the required supplementary information under RR No. 15-2010, on December 9, 2011, the BIR issued RR No. 19-2011 (and as further amended by RR No. 2-2014 dated January 24, 2014) which prescribes the new annual income tax forms that will be used for filing effective taxable year 2011. Specifically, companies are required to disclose certain tax information in their respective notes to financial statements. For the taxable year December 31, 2015, the Parent Company reported the following revenues and expenses for income tax purposes:
Revenues Services/operations 21,675,475,757 Non-operating and taxable other income:
Trading and securities gain 1,419,709,815 Service charges, fees and commissions 1,434,544,912 Profit from assets sold 407,756,284 Income from trust operations 158,022,442 Others 845,372,101
4,265,405,554
Expenses Cost of services:
Compensation and fringe benefits 6,668,597,825 Others 7,533,806,046
14,202,403,871 Itemized deductions:
Compensation and fringe benefits 1,252,856,746 Taxes and licenses 2,468,137,845 Security, messengerial and janitorial 568,241,785 Communications, light and water 374,702,977 Information technology expenses 340,343,072 Depreciation and amortization 251,749,720 Bad debts 179,877,259 Repairs and maintenance 168,246,146 Transportation and travel 196,106,345 Management and professional fees 110,371,296 Rent 54,171,608 Representation and entertainment 98,128,893 Others 3,024,271,876
9,087,205,568
Supplementary information Under RR No. 15-2010
On November 25, 2010, the BIR issued RR No. 15-2010 to amend certain provisions of RR No. 21-2002 which provides that starting 2010 the notes to financial statements shall include information on taxes, duties and license fees paid or accrued during the taxable year.
45
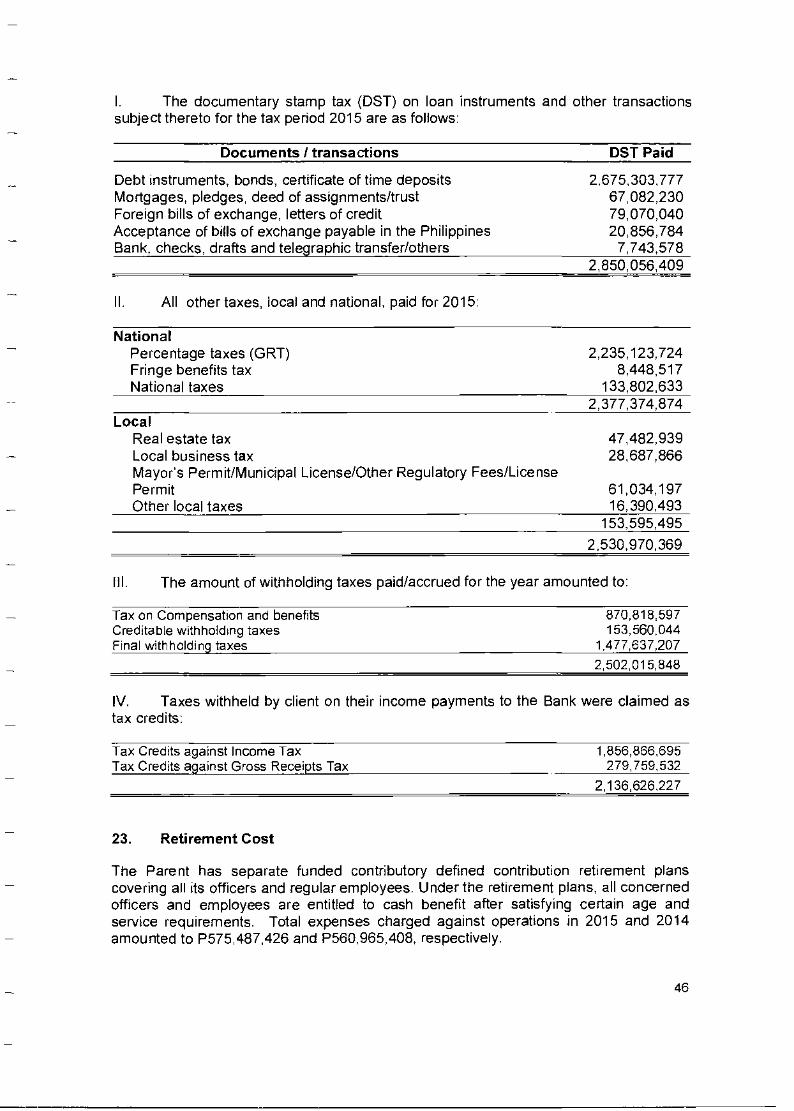
I. The documentary stamp tax (DST) on loan instruments and other transactions subject thereto for the tax period 2015 are as follows:
Documents / transactions DST Paid
Debt instruments, bonds, certificate of time deposits Mortgages, pledges, deed of assignments/trust Foreign bills of exchange, letters of credit Acceptance of bills of exchange payable in the Philippines Bank, checks, drafts and telegraphic transfer/others
2.675,303,777 67,082,230 79,070,040 20,856,784 7,743,578
2.850.056.409
II. All other taxes, local and national, paid for 2015:
National Percentage taxes (GRT) 2,235,123,724 Fringe benefits tax 8,448,517 National taxes 133,802,633
2,377,374,874 Local
Real estate tax 47,482,939 Local business tax 28,687,866 Mayors Permit/Municipal License/Other Regulatory Fees/License Permit 61,034,197 Other local taxes 16,390,493
153,595,495
2,530,970,369
The amount of withholding taxes paid/accrued for the year amounted to:
Tax on Compensation and benefits 870,818,597 Creditable withholding taxes 153,560,044 Final withholding taxes 1,477,637,207
2,502,015,848
IV. Taxes withheld by client on their income payments to the Bank were claimed as tax credits:
Tax Credits against Income Tax 1,856,866,695 Tax Credits against Gross Receipts Tax 279,759,532
2,136,626,227
23. Retirement Cost
The Parent has separate funded contributory defined contribution retirement plans covering all its officers and regular employees. Under the retirement plans, all concerned officers and employees are entitled to cash benefit after satisfying certain age and service requirements. Total expenses charged against operations in 2015 and 2014 amounted to P575,487,426 and P560,965,408, respectively.
46
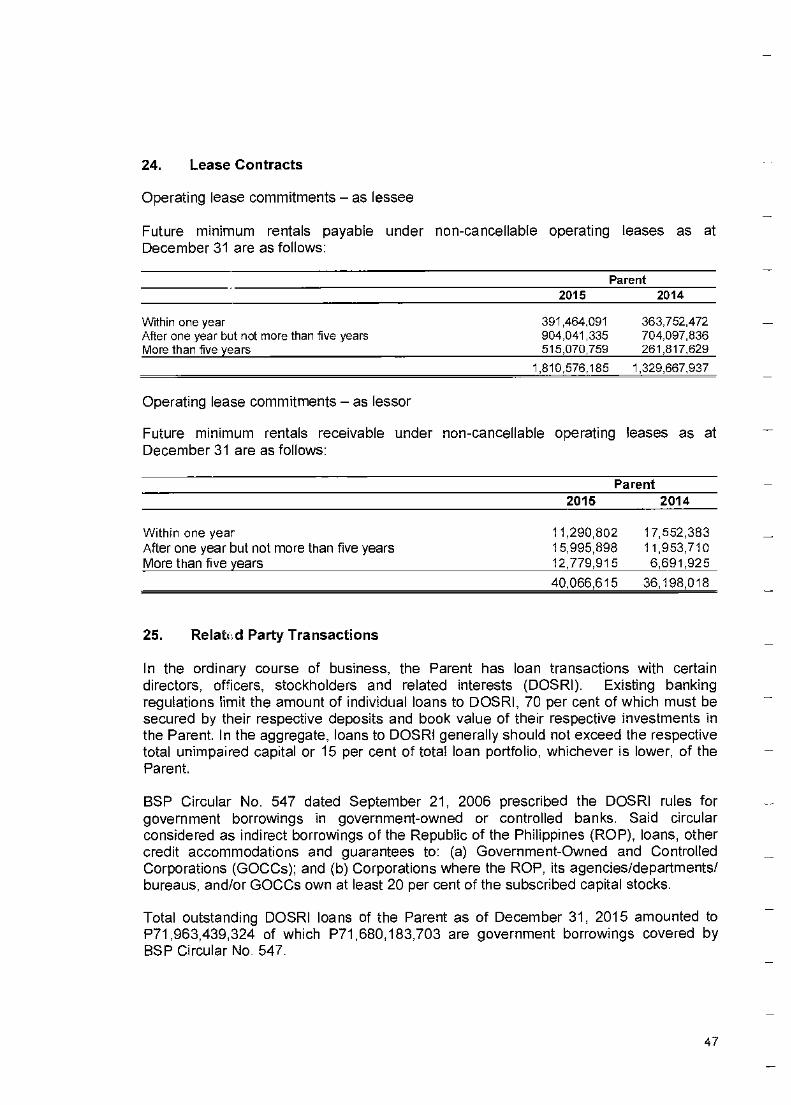
24. Lease Contracts
Operating lease commitments — as lessee
Future minimum rentals payable under non-cancellable operating leases as at December 31 are as follows:
Parent 2015
2014
Within one year
391,464,091
363,752,472 After one year but not more than five years
904,041,335
704,097,836 More than five years
515,070,759
261,817,629
1,810,576,185
1,329,667,937
Operating lease commitments — as lessor
Future minimum rentals receivable under non-cancellable operating leases as at December 31 are as follows:
Parent 2015
2014
Within one year After one year but not more than five years More than five years
11,290,802 17,552,383
15,995,898 11,953,710
12,779,915 6,691,925
40,066,615 36,198,018
25. Related Party Transactions
In the ordinary course of business, the Parent has loan transactions with certain directors, officers, stockholders and related interests (DOSRI). Existing banking regulations limit the amount of individual loans to DOSRI, 70 per cent of which must be secured by their respective deposits and book value of their respective investments in the Parent. In the aggregate, loans to DOSRI generally should not exceed the respective total unimpaired capital or 15 per cent of total loan portfolio, whichever is lower, of the Parent.
BSP Circular No. 547 dated September 21, 2006 prescribed the DOSRI rules for government borrowings in government-owned or controlled banks. Said circular considered as indirect borrowings of the Republic of the Philippines (ROP), loans, other credit accommodations and guarantees to: (a) Government-Owned and Controlled Corporations (GOCCs); and (b) Corporations where the ROP, its agencies/departments/ bureaus, and/or GOCCs own at least 20 per cent of the subscribed capital stocks.
Total outstanding DOSRI loans of the Parent as of December 31, 2015 amounted to P71,963,439,324 of which P71,680,183,703 are government borrowings covered by BSP Circular Na 547.
47
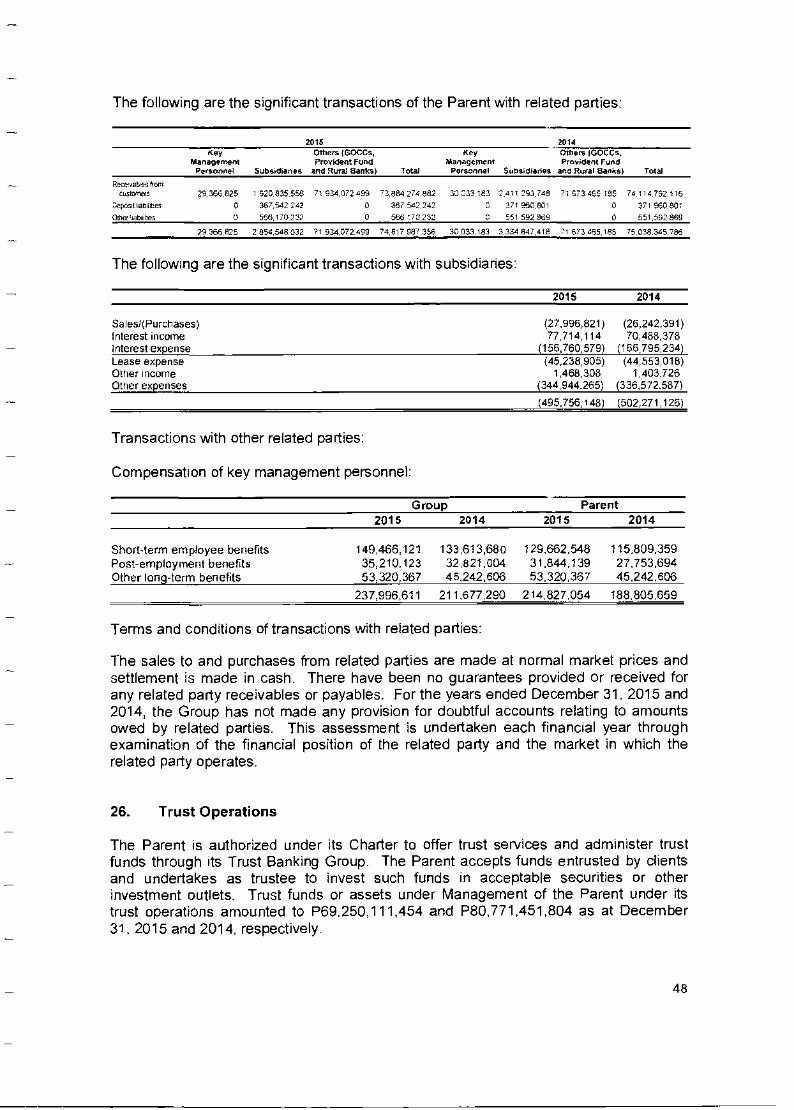
The following are the significant transactions of the Parent with related parties:
2015 2011 Key Others (GM s. Key Othem !CMGs.
Management Provident Fund Management Provident Fund Personnel subsidiaries and Rural Banks) Total Personnel Subsidiaries and Rural Banks) Total
ReieYeeeS NFL Ceeertele 29 366 625 1 920 835 553 71 934 G72 495 33 884 274 882 30 033 183 2.411 253 748 71 573 466 /95 74 114 792 116
'RpOSit labites 0 367.542 242 0 367 542 242 0 371 260 801 0 371 960801
Other lat11111e5 0 566 170 232 0 566 '70 232 0 551 592. 809 0 869 551,592869
29 566 825 2 854 548 032 71 934 072 499 74.617 GG7 356 30033.183 183 3 334 847 418 71 6/3 465 185 75 038 345 786
The following are the significant transactions with subsidiaries:
2015 2014
SalesePurchases) (27.995,821) (25,242,391) Interest income 77,714,114 70,488,378 Interest expense (156760,579) (166795,234) Lease expense (45,236,905) (44,553,018) Other income 1,458,308 1,403.726 Other expenses (344,944.265) (336,572,587)
(495,756,148) (502,271,126)
Transactions with other related parties:
Compensation of key management personnel:
Group Parent 2015 2014 2015 2014
Short-term employee benefits 149,466,121 133,613,680 129,662.548 115.809.359 Post-employment benefits 35,210.123 32,821.004 31.844,139 27,753,694 Other long-term benefits 53,320,367 45,242,606 53,320,367 45.242.606
237,996,611 211677,290 214,827,054 188,805,659
Terms and conditions of transactions with related parties:
The sales to and purchases from related parties are made at normal market prices and settlement is made in cash. There have been no guarantees provided or received for any related party receivables or payables. For the years ended December 31, 2015 and 2014, the Group has not made any provision for doubtful accounts relating to amounts owed by related parties. This assessment is undertaken each financial year through examination of the financial position of the related party and the market in which the related party operates.
26. Trust Operations
The Parent is authorized under its Charter to offer trust services and administer trust funds through its Trust Banking Group. The Parent accepts funds entrusted by clients and undertakes as trustee to invest such funds in acceptable securities or other investment outlets. Trust funds or assets under Management of the Parent under its trust operations amounted to P69,250,111,454 and P80,771,451,804 as at December 31, 2015 and 2014, respectively.
48
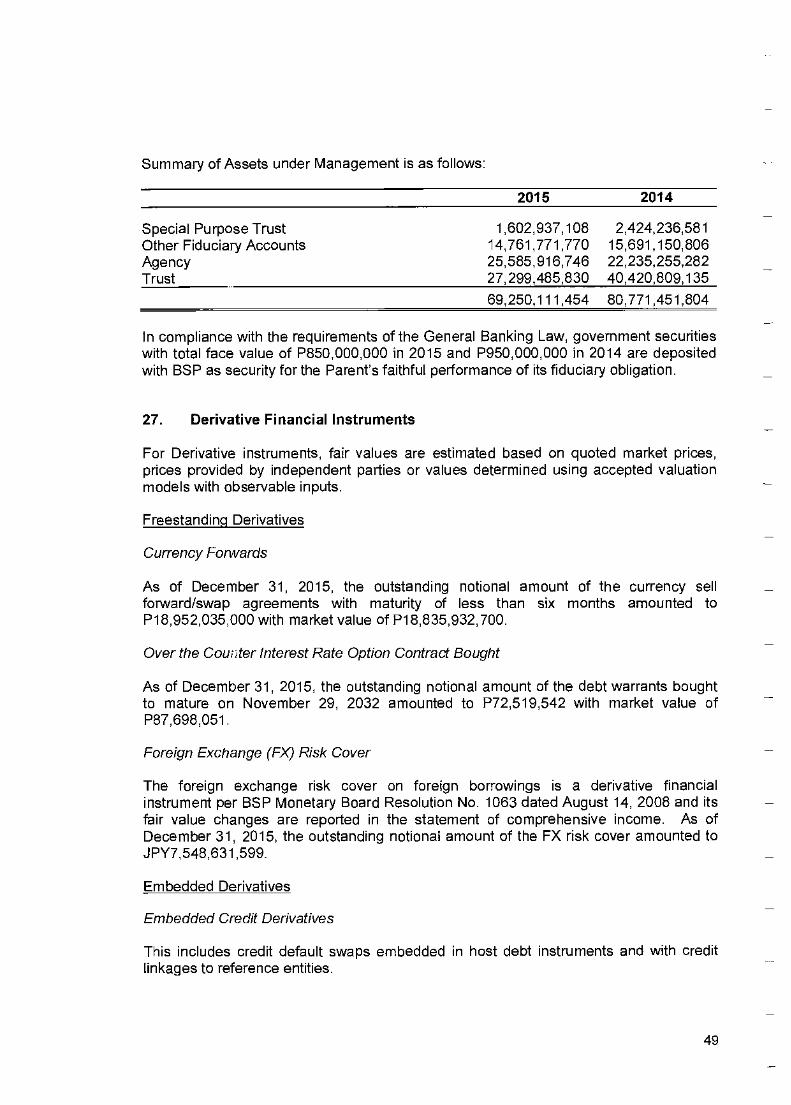
Summary of Assets under Management is as follows:
2015 2014
Special Purpose Trust 1,602,937,108 2,424,236,581 Other Fiduciary Accounts 14,761,771,770 15,691,150,806 Agency 25,585,916,746 22,235,255,282 Trust 27,299,485,830 40,420,809,135
69,250,111,454 80,771,451,804
In compliance with the requirements of the General Banking Law, government securities with total face value of P850,000,000 in 2015 and P950,000,000 in 2014 are deposited with BSP as security for the Parent's faithful performance of its fiduciary obligation.
27. Derivative Financial Instruments
For Derivative instruments, fair values are estimated based on quoted market prices, prices provided by independent parties or values determined using accepted valuation models with observable inputs.
Freestanding Derivatives
Currency Forwards
As of December 31, 2015, the outstanding notional amount of the currency sell forward/swap agreements with maturity of less than six months amounted to P18,952,035,000 with market value of P18,835,932,700.
Over the Counter Interest Rate Option Contract Bought
As of December 31, 2015, the outstanding notional amount of the debt warrants bought to mature on November 29, 2032 amounted to P72,519,542 with market value of P87,698,051.
Foreign Exchange (FX) Risk Cover
The foreign exchange risk cover on foreign borrowings is a derivative financial instrument per BSP Monetary Board Resolution No. 1063 dated August 14, 2008 and its fair value changes are reported in the statement of comprehensive income. As of December 31, 2015, the outstanding notional amount of the FX risk cover amounted to JPY7,548,631,599.
Embedded Derivatives
Embedded Credit Derivatives
This includes credit default swaps embedded in host debt instruments and with credit linkages to reference entities.
49
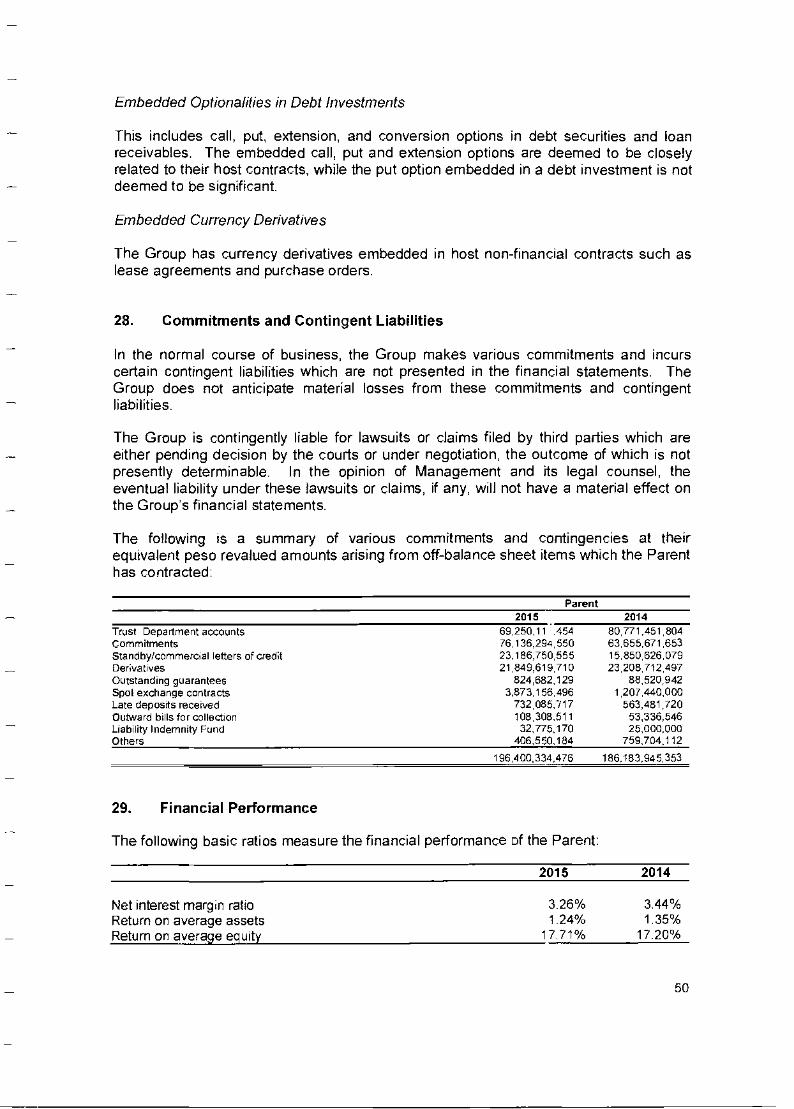
Embedded Optionalities in Debt Investments
This includes call, put, extension, and conversion options in debt securities and loan receivables. The embedded call, put and extension options are deemed to be closely related to their host contracts, while the put option embedded in a debt investment is not deemed to be significant.
Embedded Currency Derivatives
The Group has currency derivatives embedded in host non-financial contracts such as lease agreements and purchase orders.
28. Commitments and Contingent Liabilities
In the normal course of business, the Group makes various commitments and incurs certain contingent liabilities which are not presented in the financial statements. The Group does not anticipate material losses from these commitments and contingent liabilities.
The Group is contingently liable for lawsuits or claims filed by third parties which are either pending decision by the courts or under negotiation, the outcome of which is not presently determinable. In the opinion of Management and its legal counsel, the eventual liability under these lawsuits or claims, if any, will not have a material effect on the Group's financial statements.
The following is a summary of various commitments and contingencies at their equivalent peso revalued amounts arising from off-balance sheet items which the Parent has contracted:
Parent 2015 2014
Trust Department accounts 69,250,11 .454 80,771,451,804 Commitments 76,136,294,550 63,655,671,653 Standby/commercial letters of credit 23,186,750,555 15,850,626,079 Derivatives 21,840,619,710 23,208,712,497 Outstanding guarantees 824,682,129 88,520,942 Spot exchange contracts 3,873,156,496 1,207440,000 Late deposits received 732,085,717 563,481725 Outward bills for collection 108,308,511 53,336.546 Liability Indemnity Fund 32,775,170 25,000,000 Others 406,550,184 759,704,112
196,400,334475 186.183,945,353
29. Financial Performance
The following basic ratios measure the financial performance of the Parent:
2015 2014
Net interest margin ratio 3.26% 3.44% Return on average assets 1.24% 1.35% Return on average equity 17.71% 17.20%
50
30. Capital Funds
As of December 31, 2015, the Parent's authorized capital was P25.0 billion comprised of 2 billion common shares with par value of P10.0 per share and an aggregate par value of P20 billion and 500 million preferred shares with par value of P10 per share, and an aggregate par value of P5.0 billion and P12.0 billion of the Parent's authorized capital had been issued in the form of 1.2 billion fully paid-up common shares.
The Parent complies with the provision of RA No. 7656 on dividend declaration to the National Government (NG) and with the loan and guarantee agreements between the World Bank, the Parent and the Department of Finance (DOF).
On March 31, 2015, the Parent remitted cash dividends to the National Government in the amount of P6.0 billion covering its CY2014 net income.
For CY2015 r et income, the Parent remitted P6.6 billion cash dividend on April 6, 2016.
Capital Management
The overall capital management objective of the Group is to create a more efficient capital structure while ensuring compliance with externally imposed capital requirements.
The Group manages its capital by maintaining strong credit ratings and healthy capital ratios to support its business and sustain its mandate. Adjustments to the Group's capital structure are made in the light of changes in economic conditions and the risk characteristics of its activities. In order to maintain or adjust the capital structure, the Group may issue capital securities. No changes were made in the objectives, policies and processes from the previous years.
Regulatory Qualifying Capital
Under existing BSP regulations, the Parent's compliance with regulatory requirements and ratios is determined based on the amount of the Parent's unimpaired capital (regulatory net worth) as reported to the BSP.
In addition, the risk-based capital ratio of a bank, expressed as a percentage of qualifying capital to risk-weighted assets, should not be less than 10 per cent for both stand-alone basis (head office and branches) and consolidated basis (Parent and subsidiaries engaged in financial allied undertakings but excluding insurance companies). Qualifying capital and risk-weighted assets are computed based on BSP regulations. Risk-weighted assets consist of total assets less cash on hand, due from BSP, loans covered by hold-out on or assignment of deposits, loans or acceptances under letters of credit to the extent covered by margin deposits and other non-risk items determined by the Monetary Board (MB) of the BSP.
The Bank adopted BASEL 3 CAR computation pursuant to BSP Circular No. 781 effective January 31, 2014. INMES and AFS Equity were included as regulatory adjustments/deduction to Tier 1 capital.
51
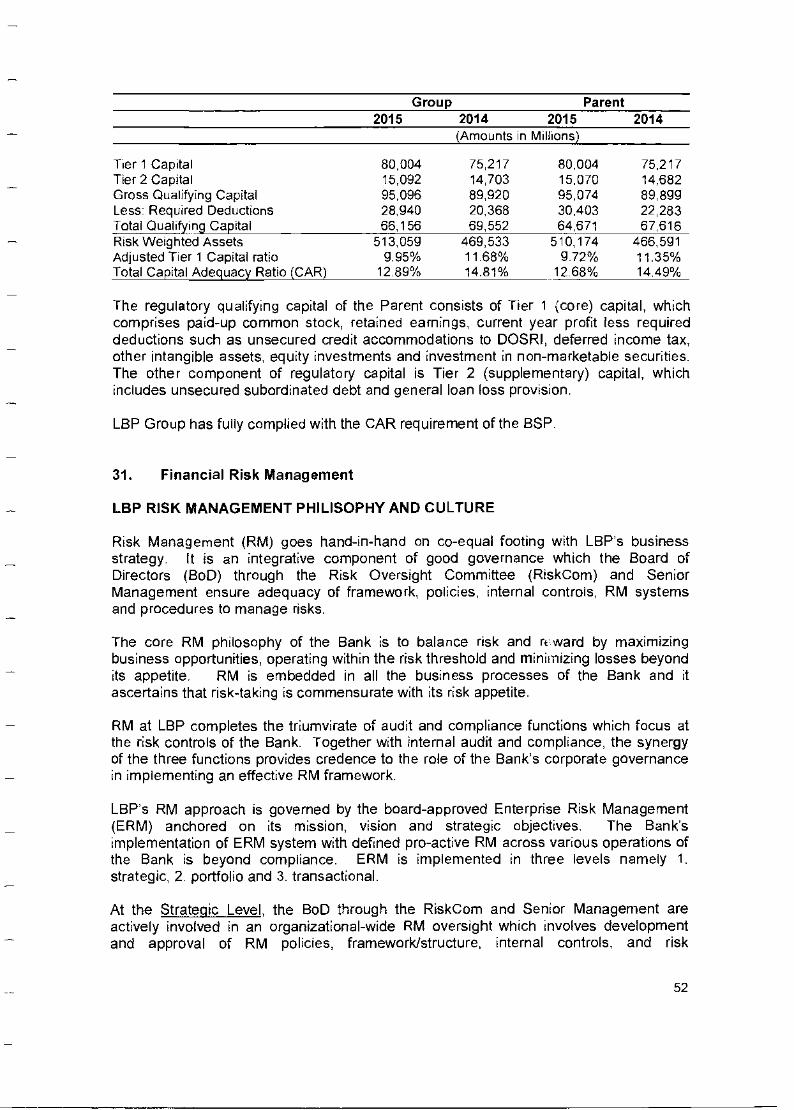
Group Parent 2015 2014 2015 2014
(Amounts in Millions)
Tier 1 Capital 80,004 75,217 80.004 75.217 Tier 2 Capital 15,092 14,703 15.070 14,682 Gross Qualifying Capital 95,096 89,920 95,074 89,899 Less: Required Deductions 28,940 20,368 30.403 22,283 Total Qualifying Capital 66,156 69,552 64,671 67,616 Risk Weighted Assets 513,059 469,533 510,174 466,591 Adjusted Tier 1 Capital ratio 9.95% 11.68% 9.72% 11.35% Total Capital Adequacy Ratio (CAR) 12.89% 14.81% 12.68% 14.49%
The regulatory qualifying capital of the Parent consists of Tier 1 (core) capital, which comprises paid-up common stock, retained earnings, current year profit less required deductions such as unsecured credit accommodations to DOSRI, deferred income tax, other intangible assets, equity investments and investment in non-marketable securities. The other component of regulatory capital is Tier 2 (supplementary) capital, which includes unsecured subordinated debt and general loan loss provision.
LBP Group has fully complied with the CAR requirement of the BSP.
31. Financial Risk Management
LBP RISK MANAGEMENT PHILISOPHY AND CULTURE
Risk Management (RM) goes hand-in-hand on co-equal footing with LBP's business strategy. It is an integrative component of good governance which the Board of Directors (BoD) through the Risk Oversight Committee (RiskCom) and Senior Management ensure adequacy of framework, policies, internal controls, RM systems and procedures to manage risks.
The core RM philosophy of the Bank is to balance risk and re. by maximizing business opportunities, operating within the risk threshold and minimizing losses beyond its appetite. RM is embedded in all the business processes of the Bank and it ascertains that risk-taking is commensurate with its risk appetite.
RM at LBP completes the triumvirate of audit and compliance functions which focus at the risk controls of the Bank. Together with internal audit and compliance, the synergy of the three functions provides credence to the role of the Bank's corporate governance in implementing an effective RM framework.
LBP's RM approach is governed by the board-approved Enterprise Risk Management (ERM) anchored on its mission, vision and strategic objectives. The Bank's implementation of ERM system with defined pro-active RM across various operations of the Bank is beyond compliance. ERM is implemented in three levels namely 1. strategic, 2. portfolio and 3. transactional.
At the Strategic Level the BoD through the RiskCom and Senior Management are actively involved in an organizational-wide RM oversight which involves development and approval of RM policies, framework/structure, internal controls, and risk
52
management system as well as the annual review thereof. The BoD and Senior Management are also involved in an organizational-wide risk monitoring and reporting which are used as basis for decision-making.
At the Portfolio Level the Groups or Departments oversee the implementation of policies and processes and monitor possible breaches. Risk Management Group (RMG) recommends policies, processes and changes based on risk reports submitted by the risk taking Business Units (BUs) to address risk occurrences that cannot be solved at the level of the risk taking BUs.
At the Transactional Level the Authorized Risk Takers (ARTS) are involved in the actual implementation of risk policies and procedures. At LBP, the ARTs embrace the continuous management of risk events and immediately escalate the risk occurrences that cannot be solved at their level to the Department or Group level.
RM involves the oversight function covering risk identification, assessment, measurement control, monitoring and reporting of risks inherent in all activities of the Bank. The RMG as an independent unit performs the oversight function for all major risk areas (credit, market, and liquidity, operational, among others) of the Bank. RMG reports functionally to the RiskCom and administratively to the President & Chief Executive Officer (CEO) of the Bank.
In 2015, the notable accomplishments of RMG include the development of two treasury valuation models and five credit scoring models as part of the Bank's commitments to Governance Commission for GOCCs (GCG) Sector. The completion of bow-tie analysis for LBP-DBP merger risks and the dissemination of ERM Audio Visual Presentation (AVP) were completed as part of the bank-wide implementation of ERM. Also, RMG facilitated the preparation of the Bank's 2015 Internal Capital Adequacy Assessment Process (ICAAP) document which was submitted to Bangko Sentral ng Pilipinas (BSP) before the deadline.
The bank-wide implementation of operational RM tools was strengthened as RMG conducted walkthroughs to Bank's BUs on Risk & Control Self-Assessment (RCSA), Risk Assessment Register (RAR) & Risk Treatment Register (RTR), Business Impact Analysis (BIA), Business Continuity Questionnaire (BCQ) and ICAAP.
Management of Information Technology (IT) and security risks was intensified as the Information Security & Technology Risk Management Office (ISTRMO) was created to be responsible and accountable for the organization-wide IT and security risk program.
Regular review and revision of risk guidelines and manuals were conducted in accordance with regulators' policies and industry best practices. The shock absorption capabilities of the Bank were ascertained through the regular conduct of credit and treasury risk stress testing. Moreover, regular and special market, credit and operational risk reports were prepared and presented to the RiskCom which substantiate that appropriate RM tools are embedded in the Bank's processes to ensure compliance with regulatory and internal risk control measures.
53
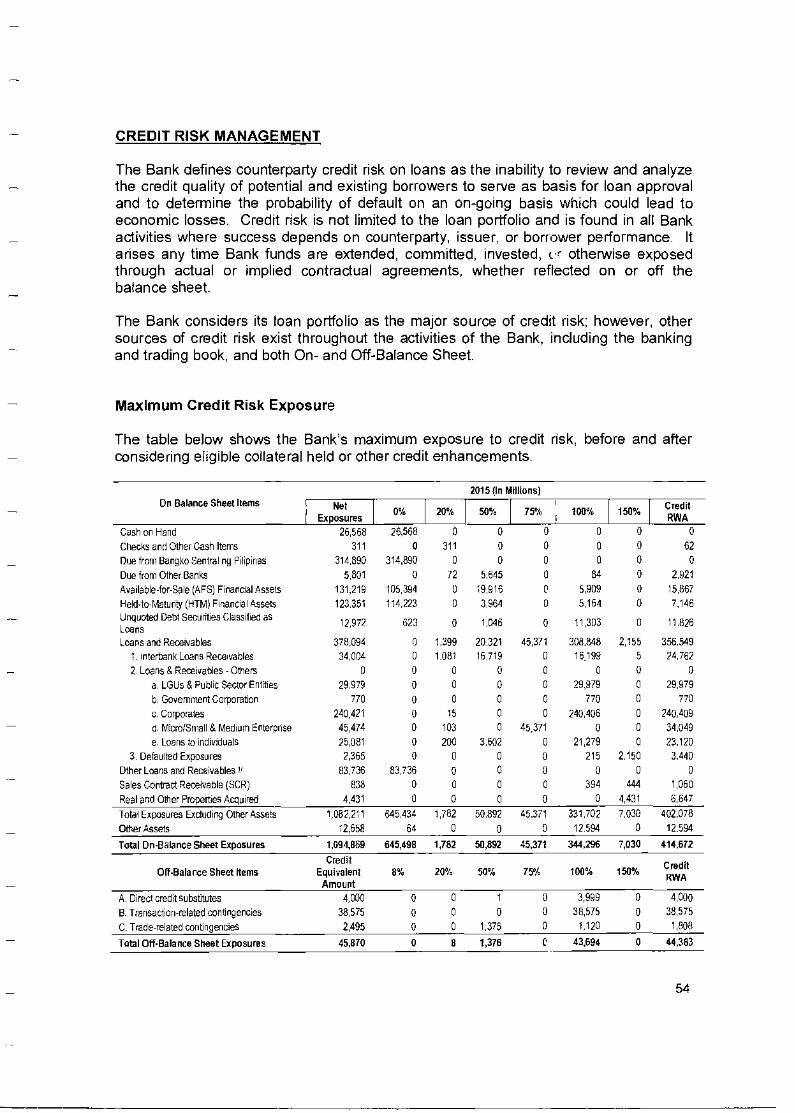
CREDIT RISK MANAGEMENT
The Bank defines counterparty credit risk on loans as the inability to review and analyze the credit quality of potential and existing borrowers to serve as basis for loan approval and to determine the probability of default on an on-going basis which could lead to economic losses. Credit risk is not limited to the loan portfolio and is found in all Bank activities where success depends on counterparty, issuer, or borrower performance. It arises any time Bank funds are extended, committed, invested, cc otherwise exposed through actual or implied contractual agreements, whether reflected on or off the balance sheet.
The Bank considers its loan portfolio as the major source of credit risk; however, other sources of credit risk exist throughout the activities of the Bank, including the banking and trading book, and both On- and Off-Balance Sheet.
Maximum Credit Risk Exposure
The table below shows the Bank's maximum exposure to credit risk: before and after considering eligible collateral held or other credit enhancements.
On Balance Sheet Items 2015 (In Millions)
Net Exposures
0% 20% 50% 75% [
100% Credit RWA
Cash on Hand 26,568 26,568 0 0 0 0 0 0
Checks and Other Cash Items 311 0 311 0 0 0 0 62
Due from Bangko Sentral ng Filipinas 314,890 314,890 0 0 0 0 0 0
Due from Other Banks 0 72 5,645 0 84 0 2,921
Available-for-Sale (AFS) Financial Assets 80 1361:2191 105,394 0 19,916 0 5,909 0 15,867
Held-to-Malunty (HTM) Financial Assets 123.351 114.223 0 3.964 0 5,164 0 7,146 Unquoted Debt Securities Classified as 12,972 623 0 1,046 0 11,303 0 11.826 Loans Leans am Receivables 378.694 0 1.399 20.321 45,371 308.848 2,155 356,549
I. Interbank Loans Receivables 34,004 0 1.081 16719 0 16.199 5 24,782
2 Loans 8 Receivables-Others 0 0 0 0 0 0 0 0
a. LGtis & Public Sector Entities 29.979 0 0 0 0 29,979 0 29,979
b. Government Cmparation 770 0 0 0 0 770 0 770
c. Corporates 240,421 0 15 0 0 240,406 0 240,409
d. Micro/Small & Medium Enterprise 45,474 0 103 0 45,371 0 0 34,049 e. Loans to individuals 25,081 0 200 3,602 0 21,279 0 23120
3. Defaulted Exposures 2,365 0 0 0 0 215 2,150 3.440
Other Loans and Receivables 11 83,736 83,736 0 0 0 0 0
Sales Contract Receivable (SCR) 838 0 D 0 0 394 444 1,0600
Real and Other Properties Acquired 4,431 0 0 0 0 0 4,431
6 Total Exposures Excluding Other Assets 1,082.211 545,434 1782 50,892 45.371 331,702 7,030 402.'067487
Other Assets 12.658 64 0 0 0 12 594 0 12594
Total On-Balance Sheet Exposures 1,094,869 645,498 1,782 50,892 45,371 344,296 1,030 414,672
Credit Credit
Off-Balance Sheet Items Equivalent 0% 20% 50% 75% 100% 150% RWA
Amount
A. Direct credit substitutes 4,000 0 0 1 0 3,999 0 4,000
B. Transaction-related contingencies 38,575 0 0 0 0 38,575 0 38,575
C. Trade-related contingencies 2,495 0 0 1,375 0 1,120 0 1,808
Total Off-Balance Sheet Exposures 45,070 0 0 1,376 0 43,694 0 44,383
54
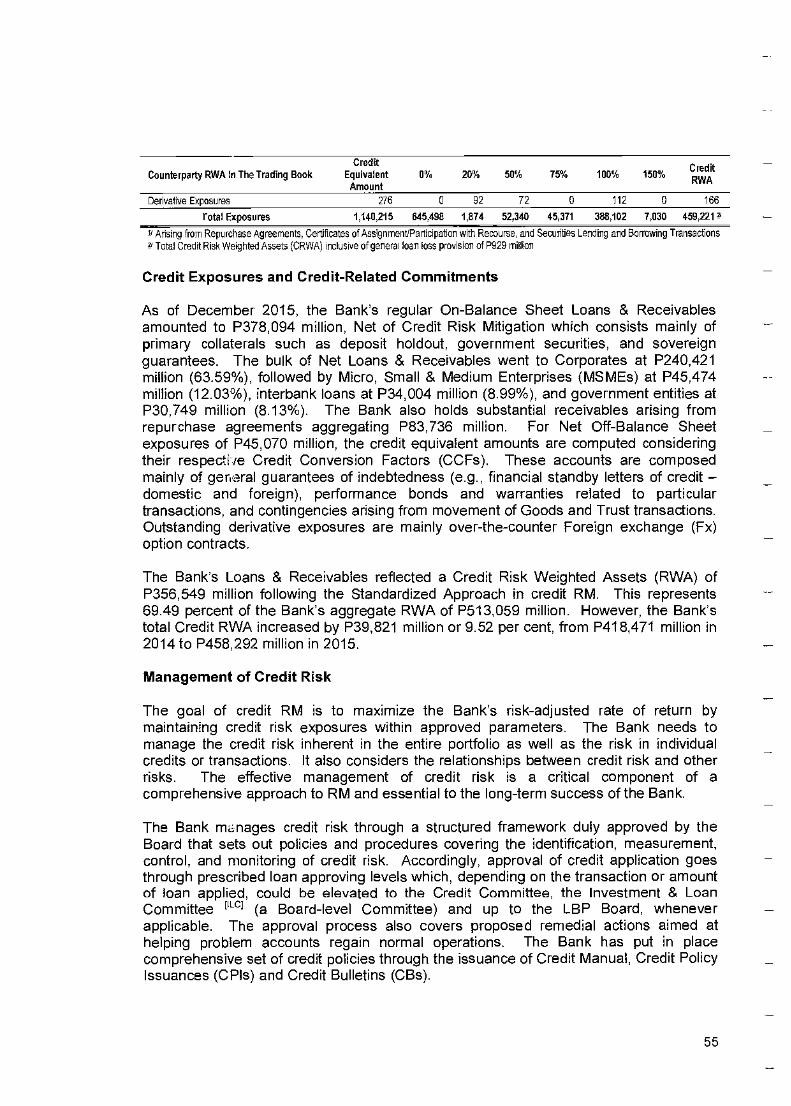
Credit Credit
Counterparty RWA In The Trading Book Equivalent 0% 20% 50% 75% 100% 150% RWA
Amount
Derivative Exposures 276 0 92 72 0 112 0 166
Total Exposures 40,2 5 645.498 1,874 52,340 45,371 388,102 7,030 459,221 24
1? Arising from Repurchase Agreements, Certificates of Assignment/Participation with Recourse, and Secudlies Lending and Borrowing Transactions Total Credit Risk Weighted Assets (CRWA) inclusive of general loan loss provision of P929 million
Credit Exposures and Credit-Related Commitments
As of December 2015, the Bank's regular On-Balance Sheet Loans & Receivables amounted to P378,094 million, Net of Credit Risk Mitigation which consists mainly of primary collaterals such as deposit holdout, government securities, and sovereign guarantees. The bulk of Net Loans & Receivables went to Corporates at P240,421 million (63.59%), followed by Micro, Small & Medium Enterprises (MSMEs) at P45,474 million (12.03%), interbank loans at P34,004 million (8.99%), and government entities at P30,749 million (8.13%). The Bank also holds substantial receivables arising from repurchase agreements aggregating P83,736 million. For Net Off-Balance Sheet exposures of P45,070 million, the credit equivalent amounts are computed considering their respecti ie Credit Conversion Factors (CCFs). These accounts are composed mainly of general guarantees of indebtedness (e.g., financial standby letters of credit —domestic and foreign), performance bonds and warranties related to particular transactions, and contingencies arising from movement of Goods and Trust transactions. Outstanding derivative exposures are mainly over-the-counter Foreign exchange (Fx) option contracts.
The Bank's Loans & Receivables reflected a Credit Risk Weighted Assets (RWA) of P356,549 million following the Standardized Approach in credit RM. This represents 69.49 percent of the Bank's aggregate RWA of P513,059 million. However, the Bank's total Credit RWA increased by P39,821 million or 9.52 per cent, from P418,471 million in 2014 to P458,292 million in 2015.
Management of Credit Risk
The goal of credit RM is to maximize the Bank's risk-adjusted rate of return by maintaining credit risk exposures within approved parameters. The Bank needs to manage the credit risk inherent in the entire portfolio as well as the risk in individual credits or transactions. It also considers the relationships between credit risk and other risks. The effective management of credit risk is a critical component of a comprehensive approach to RM and essential to the long-term success of the Bank.
The Bank menages credit risk through a structured framework duly approved by the Board that sets out policies and procedures covering the identification, measurement, control, and monitoring of credit risk. Accordingly, approval of credit application goes through prescribed loan approving levels which, depending on the transaction or amount of loan applied, could be elevated to the Credit Committee, the Investment & Loan Committee [' el (a Board-level Committee) and up to the LBP Board, whenever applicable. The approval process also covers proposed remedial actions aimed at helping problem accounts regain normal operations. The Bank has put in place comprehensive set of credit policies through the issuance of Credit Manual, Credit Policy Issuances (CPIs) and Credit Bulletins (CBs).
55
As the middle office for credit risk, the Bank's Credit Policy & Risk Management Department (CPRMD) handles credit risk oversight, policy issuance, risk measurement and risk rating of Bank borrowers.
To effectively monitor and maintain the quality of its loan portfolio, the Bank conducts annual qualitative and impairment review to assure proper loan classification and setting-up of valuation reserves. As of December 2015, the Bank's net Non-Performing Loan (NPL) stood at P790 million or 0.15 percent: and that only P2,210 million or 1.32 percent of loan accounts (i.e., corporate type of borrower) under its Internal Credit Risk Rating System (ICRRS) are rated below the Acceptable level. In addition, the Bank sets applicable limits on its real estate loans, large exposures, industry concentration and single borrower limit.
Credit Risk Rating
In compliance with BSP requirements, the Bank establishes its ICRRS for the purpose of measuring credit risk for corporate borrowers in a consistent manner, as accurately as possible, and thereafter uses the risk information as one of the bases in making credit decision. The ICRRS rating scale consists of ten grades, six of which fall under unclassified accounts, with the remaining four falling under classified accounts in accordance with regulatory provisioning guidelines. The Bank has also sets up similar expert-based credit risk rating on its other loan streams.
Moreover, it undertakes continuing development and implementation of automated credit risk rating models through its Credit Risk Engine System (ORES) Scoring Facility (CSF) to enhance its capability to determine the credit worthiness of its borrowers. In line with this, it has recently approved the implementation of the followttg automated credit scoring models:
• Application Scoring Model for Individual Home Buyers • Application Scoring Model for Salary Loan Availers • Behavioral Scoring Model for Local Government Units (LGUs) • Behavioral Scoring Model for Small Medium Entrepreneurs (SMEs) • Behavioral Scoring Model for Corporates
Credit Risk Monitoring
Periodic escalation of credit risk exposures and underlying risk events is being undertaken via a formal reporting system. This enables the Bank through the ILC, RiskCom and the LBP Board to keep tab of major credit issues or concerns that need priority action or resolution.
Collateral and Other Credit Enhancements
The required amount and type of loan collateral depend on borrower type and assessment of the credit risk of the borrower. The Bank's Credit Manual and credit policy issuances provide the guidelines on the acceptability ct loan collateral and maximum valuation for each type of collateral.
56
The following are the primary collaterals accepted by the Bank:
• Holdout on Deposits • Government Securities • Real Estat.r Mortgage • Chattel Mortgage
The Bank also accepts government guarantees, cross suretyship from corporations and such other eligible guarantees. In the case of agricultural and agriculture-related loans that are vulnerable to the effects of climate and weather disturbances, borrowers are encouraged to avail of crop insurance guarantees and other insurance mechanisms to shield them from these risks.
Credit Stress Testing
The Bank regularly conducts stress testing of its loan portfolio taking into account risk events with high probability of occurrence. Utilizing such scenarios, tests are done to determine the magnitude of their impact on the Bank's loan portfolio, on the Credit RWA, and finally on the Capital Adequacy Ratio (CAR). The stress testing also includes prescribed regulatory tests such as uniform stress test and real estate stress test.
MARKET RISK MANAGEMENT
Market Risk Management Framework
LBP is exposed to market risks in both its trading and non-trading banking activities. The Bank assumes market risk in market making and position taking in Government Securities (GS) and other debt instruments, equity, Fx and other securities, as well as, in derivatives or financial instruments that derive their values from price, price fluctuations and price expectations of an underlying instrument (e.g., share, bond, Fx or index).
LBP's exposure on derivatives is currently limited to currency swaps and currency forwards to manage Fx exposure. Although the Bank is also exposed to derivatives that are embedded in some financial contracts, these are relatively insignificant in volume.
The Bank uses a combination of risk sensitivities, Value-at-Risk (VaR), stress testing, CAR and capital metrics to manage market risks and establish limits. The LBP's BoD, RiskCom and the Asset & Liability Committee (ALCO - Senior Management level) define and set the various market risks limit for each trading portfolio. The Treasury & Investment Banking Sector (TIBS), particularly the Financial Markets Group (FMG) which manages the Bank's trading units as well as the Asset & Liability Management Group (ALMG) which manages the Bank's liquidity and reserve positions, conducts risk-taking activities within limits at all times and ensures that breaches are escalated to Senior Management for appropriate action.
A managemr it alert is activated whenever losses during a specified period equal or exceed specified management alert level. LBP controls and minimizes the losses that may be incurred in daily trading activities through the VaR and Management Action Triggers (MATs).
57
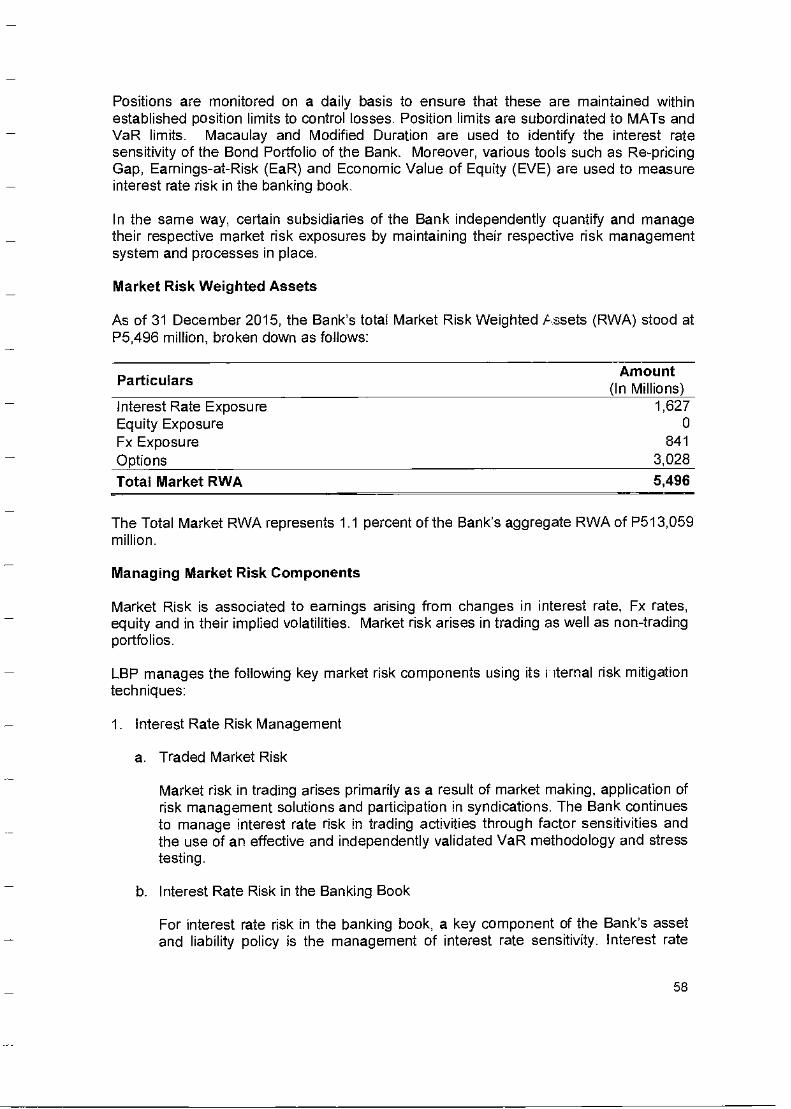
Positions are monitored on a daily basis to ensure that these are maintained within established position limits to control losses. Position limits are subordinated to MATs and VaR limits. Macaulay and Modified Duration are used to identify the interest rate sensitivity of the Bond Portfolio of the Bank. Moreover, various tools such as Re-pricing Gap, Earnings-at-Risk (EaR) and Economic Value of Equity (EVE) are used to measure interest rate risk in the banking book.
In the same way, certain subsidiaries of the Bank independently quantify and manage their respective market risk exposures by maintaining their respective risk management system and processes in place.
Market Risk Weighted Assets
As of 31 December 2015, the Bank's total Market Risk Weighted Assets (RWA) stood at P5,496 million, broken down as follows:
Particulars Amount
(In Millions) Interest Rate Exposure 1,627 Equity Exposure 0 Fx Exposure 841 Options 3,028
Total Market RWA 5,496
The Total Market RWA represents 1.1 percent of the Bank's aggregate RWA of P513,059 million.
Managing Market Risk Components
Market Risk is associated to earnings arising from changes in interest rate, Fx rates, equity and in their implied volatilities. Market risk arises in trading as well as non-trading portfolios.
LBP manages the following key market risk components using its iternal risk mitigation techniques:
1. Interest Rate Risk Management
a. Traded Market Risk
Market risk in trading arises primarily as a result of market making, application of risk management solutions and participation in syndications. The Bank continues to manage interest rate risk in trading activities through factor sensitivities and the use of an effective and independently validated VaR methodology and stress testing.
b. Interest Rate Risk in the Banking Book
For interest rate risk in the banking book, a key component of the Bank's asset and liability policy is the management of interest rate sensitivity. Interest rate
58
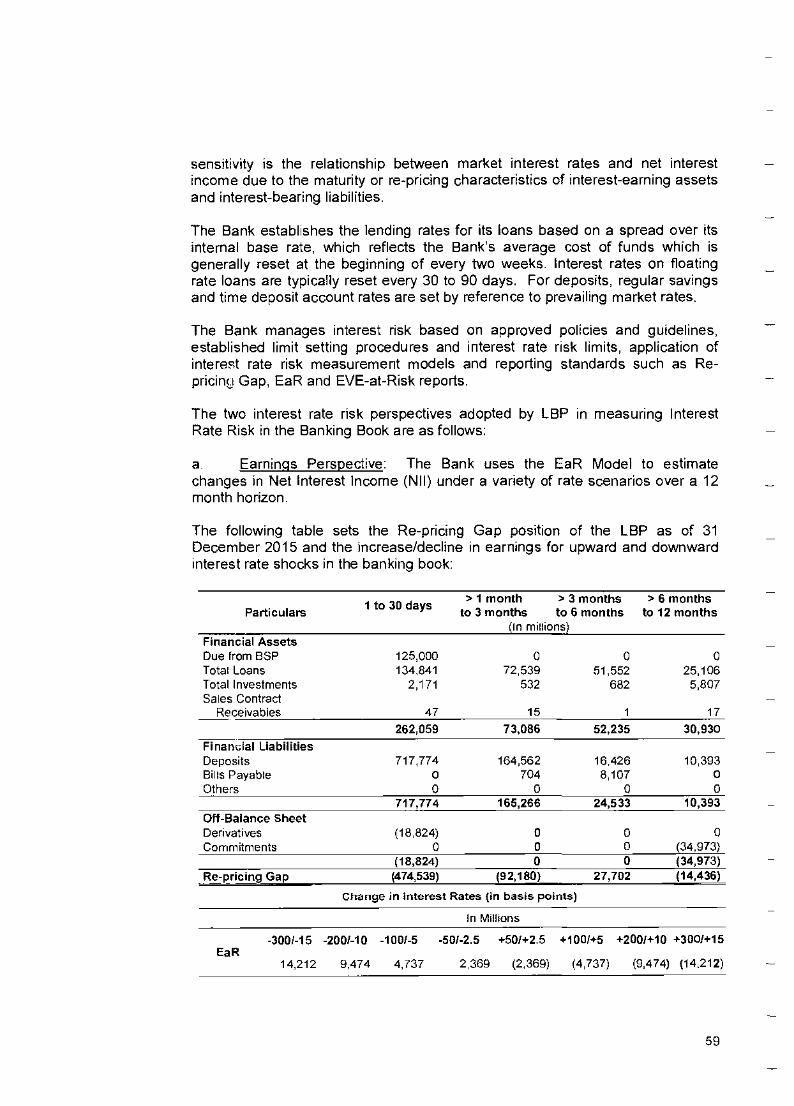
sensitivity is the relationship between market interest rates and net interest income due to the maturity or re-pricing characteristics of interest-earning assets and interest-bearing liabilities.
The Bank establishes the lending rates for its loans based on a spread over its internal base rate, which reflects the Bank's average cost of funds which is generally reset at the beginning of every two weeks. Interest rates on floating rate loans are typically reset every 30 to 90 days. For deposits, regular savings and time deposit account rates are set by reference to prevailing market rates.
The Bank manages interest risk based on approved policies and guidelines, established limit setting procedures and interest rate risk limits, application of interest rate risk measurement models and reporting standards such as Re-pricing Gap, EaR and EVE-at-Risk reports.
The two interest rate risk perspectives adopted by LBP in measuring Interest Rate Risk in the Banking Book are as follows:
a Earnings Perspective: The Bank uses the EaR Model to estimate changes in Net Interest Income (NII) under a variety of rate scenarios over a 12 month horizon.
The following table sets the Re-pricing Gap position of the LBP as of 31 December 2015 and the increase/decline in earnings for upward and downward interest rate shocks in the banking book:
Particulars > 1 month > 3 months > 6 months
1 to 30 days to 3 months to 6 months to 12 months
(In millions) Financial Assets Due from BSP 125,000 0 0 0 Total Loans 134,841 72,539 51,552 25,106 Total Investments 2,171 532 682 5,807 Sales Contract
Receivables 47 15 1 17
262,059 73,086 52,235 30,930
Financial Liabilities Deposits 717,774 164,562 16,426 10,393 Bills Payable 0 704 8,107 0 Others 0 0 0 0
717,774 165,266 24,533 10,393
Off-Balance Sheet Derivatives (18,824) 0 0 0 Commitments 0 0 0 (34,973)
(18 824) 0 0 (34,973)
Re-pricing Gap (474,539) (92,180) 27,702 (14,436)
Change in Interest Rates (in basis points)
In Millions
-300/-15 -200/-10 -1001-5 -50/-2.5 +501+2.5 +1001+5 +2001+10 +3001+15 EaR
14,212 9,474 4,737 2,369 (2,369) (4,737) (9,474) (14212)
59
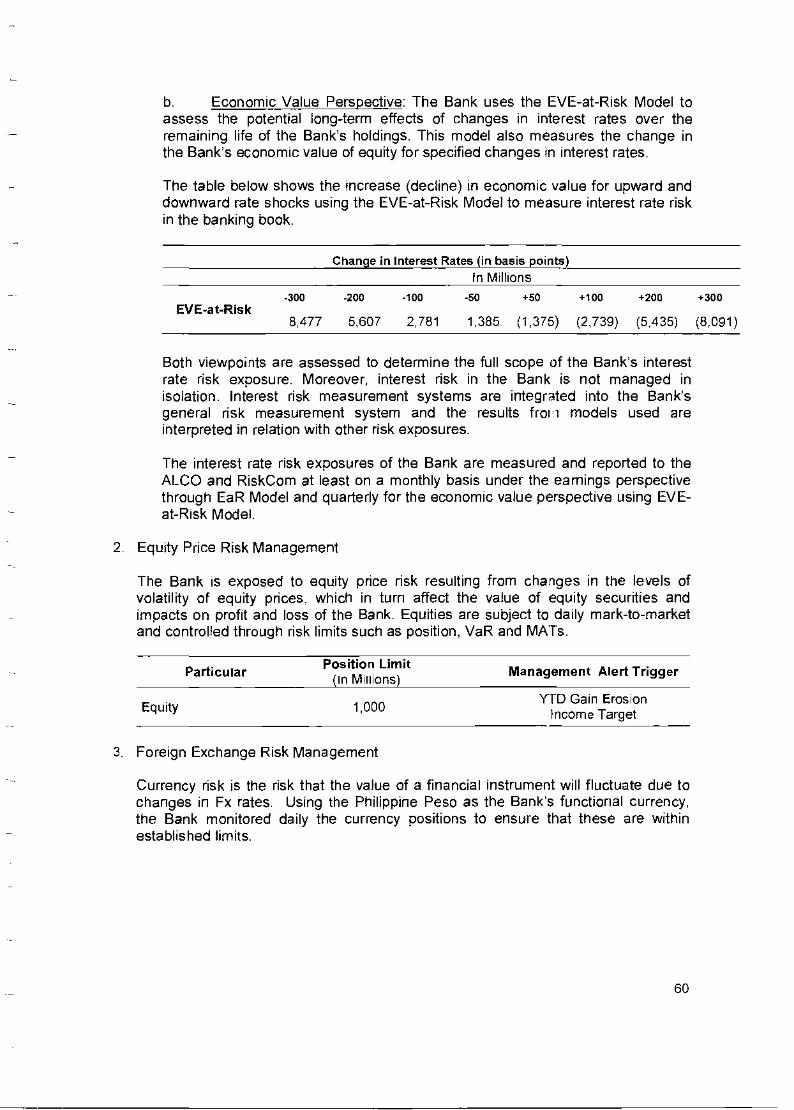
b. Economic Value Perspective: The Bank uses the EVE-at-Risk Model to assess the potential long-term effects of changes in interest rates over the remaining life of the Bank's holdings. This model also measures the change in the Bank's economic value of equity for specified changes in interest rates.
The table below shows the increase (decline) in economic value for upward and downward rate shocks using the EVE-at-Risk Model to measure interest rate risk in the banking book.
Change in Interest Rates (in basis points) In Millions
-300 -200 -100 -50 +50 +100 +200 +300 EVE-at-Risk
8,477 5,607 2,781 1,385 (1,375) (2,739) (5,435) (8,091)
Both viewpoints are assessed to determine the full scope of the Bank's interest rate risk exposure. Moreover, interest risk in the Bank is not managed in isolation. Interest risk measurement systems are integrated into the Bank's general risk measurement system and the results from models used are interpreted in relation with other risk exposures.
The interest rate risk exposures of the Bank are measured and reported to the ALCO and RiskCom at least on a monthly basis under the earnings perspective through EaR Model and quarterly for the economic value perspective using EVE-at-Risk Model.
2. Equity Price Risk Management
The Bank is exposed to equity price risk resulting from changes in the levels of volatility of equity prices, which in turn affect the value of equity securities and impacts on profit and loss of the Bank. Equities are subject to daily mark-to-market and controlled through risk limits such as position, VaR and MATs.
Particular Position Limit
(In Millions) Management Alert Trigger
Equity 1,000 YTD Gain Erosion
Income Target
3. Foreign Exchange Risk Management
Currency risk is the risk that the value of a financial instrument will fluctuate due to changes in Fx rates. Using the Philippine Peso as the Bank's functional currency, the Bank monitored daily the currency positions to ensure that these are within established limits.
60
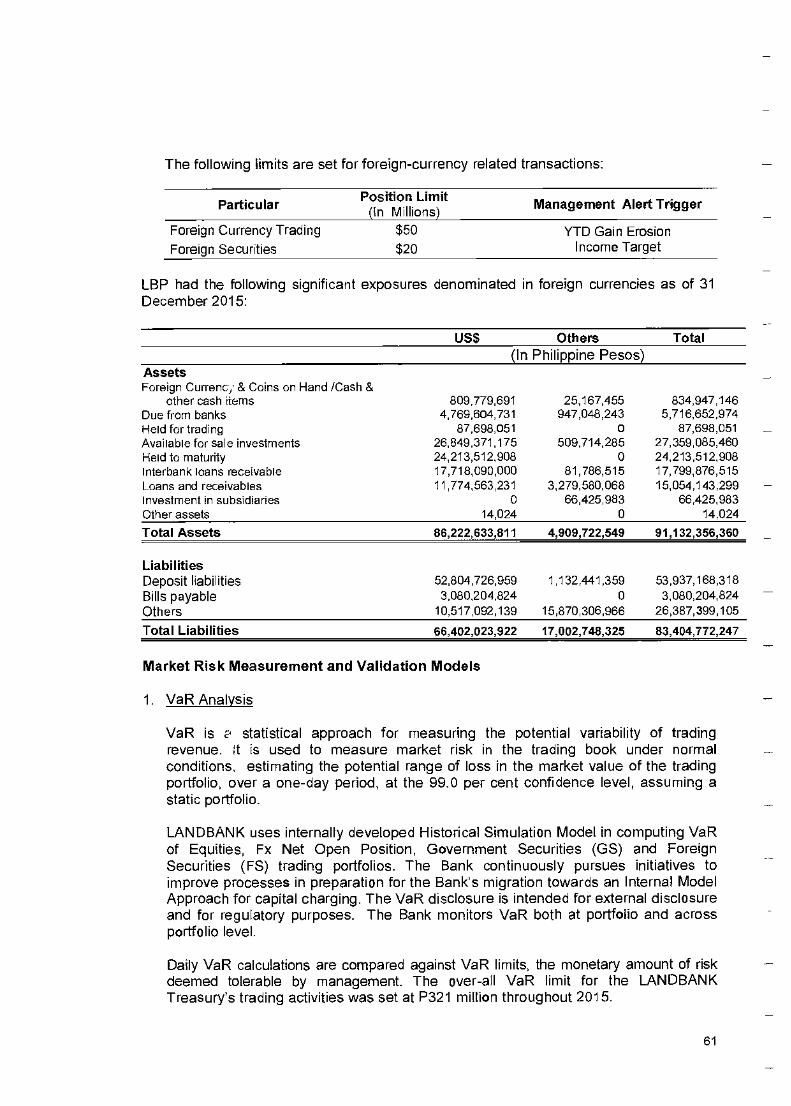
The following limits are set for foreign-currency related transactions:
Particular Position Limit
(in Millions) Management Alert Trigger
Foreign Currency Trading
$50
YTD Gain Erosion Foreign Securities
$20
Income Target
LBP had the following significant exposures denominated in foreign currencies as of 31 December 2015:
US$ Others Total (In Philippine Pesos)
Assets Foreign Currency & Coins on Hand /Cash &
other cash items 809,779,691 25,167,455 834,947,146 Due from banks 4,769,604,731 947,048,243 5,716,652,974 Held for trading 87,698,051 0 87,698,051 Available for sale investments 26,849,371,175 509,714,285 27,359,085,460 Held to maturity 24,213,512,908 0 24,213,512,908 Interbank loans receivable 17,718,090,000 81,786,515 17,799,876,515 Loans and receivables 11,774,563,231 3,279,580,068 15,054,143,299 Investment in subsidiaries 0 66,425,983 66,425,983 Other assets 14,024 0 14.024
Total Assets 86,222,633,811 4,909,722,549 91,132,356,360
Liabilities Deposit liabilities 52,804,726,959 1,132,441,359 53,937,168,318 Bills payable 3,080,204,824 0 3,080,204,824 Others 10,517,092,139 15,870,306,966 26,387,399,105
Total Liabilities 66,402,023,922 17,002,748,325 83,404,772,247
Market Risk Measurement and Validation Models
1. VaR Analysis
VaR is 0 statistical approach for measuring the potential variability of trading revenue. it is used to measure market risk in the trading book under normal conditions, estimating the potential range of loss in the market value of the trading portfolio, over a one-day period, at the 99.0 per cent confidence level, assuming a static portfolio.
LANDBANK uses internally developed Historical Simulation Model in computing VaR of Equities, Fx Net Open Position, Government Securities (GS) and Foreign Securities (FS) trading portfolios. The Bank continuously pursues initiatives to improve processes in preparation for the Bank's migration towards an Internal Model Approach for capital charging. The VaR disclosure is intended for external disclosure and for regulatory purposes. The Bank monitors VaR both at portfolio and across portfolio level.
Daily VaR calculations are compared against VaR limits, the monetary amount of risk deemed tolerable by management. The over-all VaR limit for the LANDBANK Treasury's trading activities was set at P321 million throughout 2015.
61
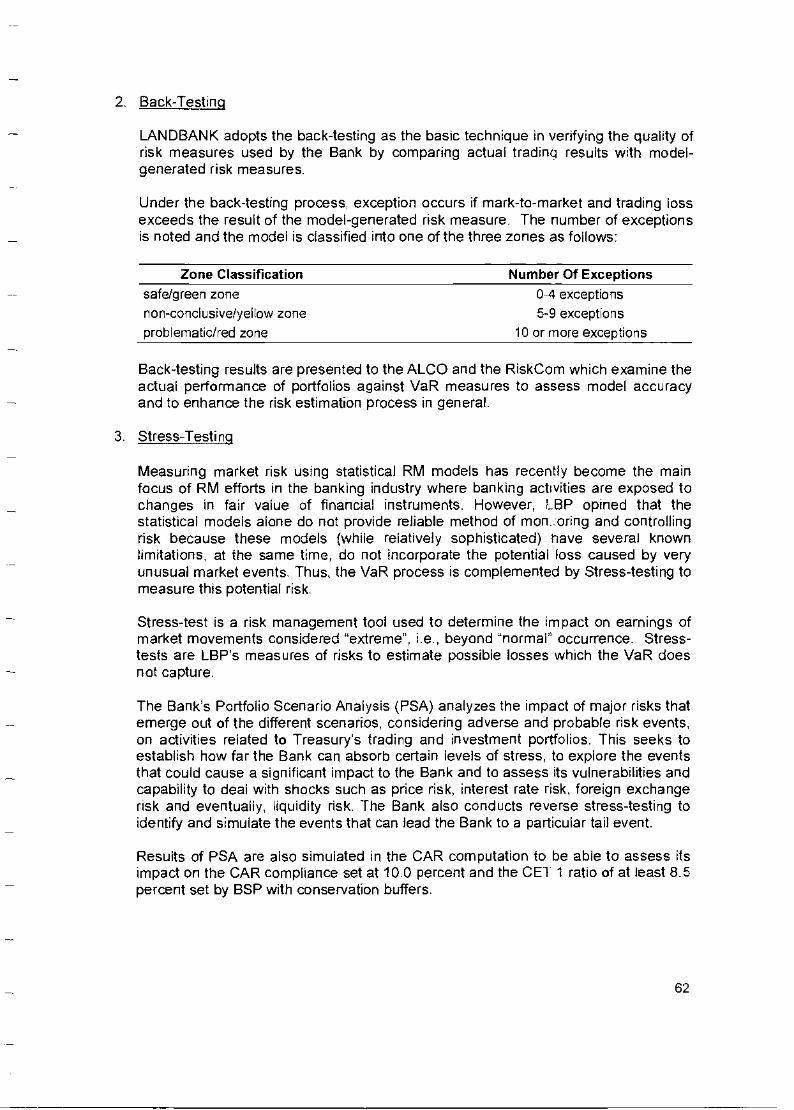
2. Back-Testing
LANDBANK adopts the back-testing as the basic technique in verifying the quality of risk measures used by the Bank by comparing actual trading results with model-generated risk measures.
Under the back-testing process, exception occurs if mark-to-market and trading loss exceeds the result of the model-generated risk measure. The number of exceptions is noted and the model is classified into one of the three zones as follows:
Zone Classification Number Of Exceptions safe/green zone
0-4 exceptions non-conclusive/yellow zone
5-9 exceptions
problematic/red zone
10 or more exceptions
Back-testing results are presented to the ALCO and the RiskCom which examine the actual performance of portfolios against VaR measures to assess model accuracy and to enhance the risk estimation process in general.
3. Stress-Testinq
Measuring market risk using statistical RM models has recently become the main focus of RM efforts in the banking industry where banking activities are exposed to changes in fair value of financial instruments. However, LBP opined that the statistical models alone do not provide reliable method of mon.:oring and controlling risk because these models (while relatively sophisticated) nave several known limitations, at the same time, do not incorporate the potential loss caused by very unusual market events. Thus, the VaR process is complemented by Stress-testing to measure this potential risk.
Stress-test is a risk management tool used to determine the impact on earnings of market movements considered "extreme", i.e., beyond 'normal" occurrence. Stress-tests are LBP's measures of risks to estimate possible losses which the VaR does not capture.
The Bank's Portfolio Scenario Analysis (PSA) analyzes the impact of major risks that emerge out of the different scenarios, considering adverse and probable risk events, on activities related to Treasury's trading and investment portfolios. This seeks to establish how far the Bank can absorb certain levels of stress, to explore the events that could cause a significant impact to the Bank and to assess its vulnerabilities and capability to deal with shocks such as price risk, interest rate risk, foreign exchange risk and eventually, liquidity risk. The Bank also conducts reverse stress-testing to identify and simulate the events that can lead the Bank to a particular tail event.
Results of PSA are also simulated in the CAR computation to be able to assess its impact on the CAR compliance set at 10.0 percent and the CET 1 ratio of at least 8.5 percent set by BSP with conservation buffers.
62
LIQUIDITY R.SK MANAGEMENT
Liquidity Risk Management Framework
LANDBANK's liquidity risk management process is consistent with the general risk management framework of the Bank covering risk identification, measurement and analysis, monitoring and control. The policies that govern liquidity risk management are reviewed and approved on a regular basis by ALCO and RiskCom. The Bank's liquidity policy is to maintain fund availability at all times and hence, to be in a position to meet all of its obligations, in normal course of business.
The Bank considers liquidity risk based on Market and Funding Liquidity Risk perspectives. Trading or Market liquidity risk refers to inability to unwind positions created from market, exchanges and counterparties due to temporary or permanent factors. The Bank cannot easily eliminate or offset a particular position because of inadequate liquidity in the market. This may be associated with large transactions having significant effect on market prices that lack sufficient depth, or with structured or complex investments having small potential buyers. This liquidity risk perspective is captured through stress testing or scenario analysis.
Funding liquidity risk refers to current and prospective risk arising from the inability to meet investrr ant and funding requirements arising from cash flow mismatches without incurring unacceptable losses. It occurs from the mismatch of asset, liability, exchange contract and contingent commitment maturities. Funding liquidity risk is being monitored and controlled through the classification of maturities of assets and liabilities over time bands and across functional currencies as reflected in the Liquidity Gap Report (LGR).
The LBP's BoD exercises oversight through RiskCom and delegated the responsibility of managing the overall liquidity of the Bank to the ALCO. The ALCO and the TIBS are responsible for the daily implementation and monitoring of relevant variables affecting LBP's liquidity position. The ALCO reviews the Bank's assets and liabilities position on a regular basis and, in coordination with the TIBS, recommends measures to promote diversification of its liabilities according to source, instrument and currency to minimize liquidity risks resulting from concentration in funding sources. The ALCO meets twice a month or more frequently as required by prevailing situations. The Risk Management Group (RMG), through the Treasury Risk Management Department (TRMD) is responsible for the oversight monitoring of the Bank's liquidity risk positions and ensures that reports on the Bank's current risk are prepared and provided to ALCO and RiskCom in a timely manner.
Although the Bank pursues what it believes to be a prudent policy in managing liquidity risk, a maturity gap does, from time to time, exists between the Bank's assets and liabilities. In )art, this comes about as a result of the Bank's policy to seek higher yielding assets, a policy which will generally lead to the average maturity of its financial assets exceeding that of its liabilities.
LBP performs a comprehensive liquidity risk measurement and control using as tool the Consolidated Liquidity Gap Report (LGR) covering the bank-wide balance sheet. Risk models used in liquidity RM are subjected to independent model validation as conducted by the Internal Audit Group (IAG).
63
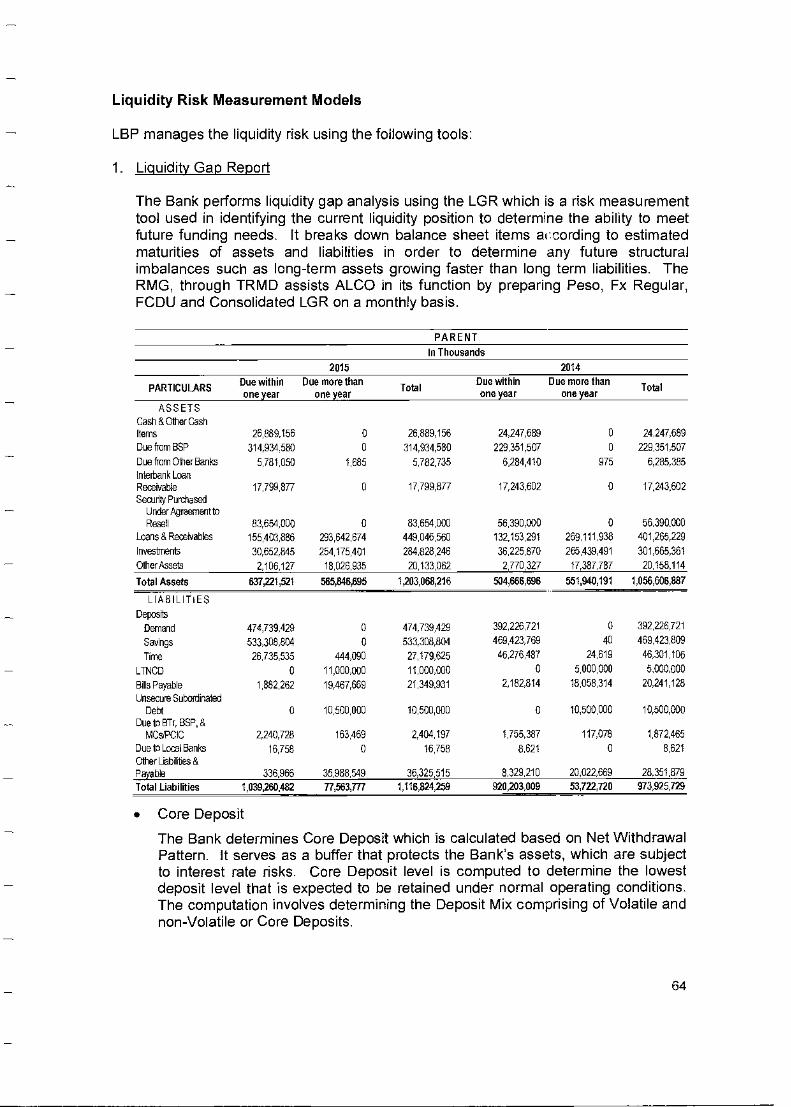
Liquidity Risk Measurement Models
LBP manages the liquidity risk using the following tools:
1. Liquidity Gap Report
The Bank performs liquidity gap analysis using the LGR which is a risk measurement tool used in identifying the current liquidity position to determine the ability to meet future funding needs. It breaks down balance sheet items according to estimated maturities of assets and liabilities in order to determine any future structural imbalances such as long-term assets growing faster than long term liabilities. The RMG, through TRMD assists ALCO in its function by preparing Peso, Fx Regular, FCDU and Consolidated LGR on a monthly basis.
PARENT
In Thousands
2015 2014
PARTICULARS Due within one year
Due more than one year
Total Due within one year
Due more than one year Total
ASSETS Cash 8 Other Cash Items 26,889.156 0 26,889,156 24247,689 0 24,247,689 Due from BSP 314,934.580 0 314,934,580 229,351,507 0 229,351,507
Due from (Thar Banks 5,781,050 1,685 5.782,735 6.2840410 975 6,285,385 Interbank Loan ReceWable 17,799,877 0 17,799,877 17,243,602 0 17,243,602 See" Putnased
Under Agreement to Resell 83,654,000 0 83,654,000 56,390,000 0 56,390,000
Loans & Reoeivables 155,403,886 293,642,674 449,046,560 132,153,291 269.111.938 401,265,229 Inyeslments 30,652,845 254,175,401 284.828,246 36,225,870 265,439,491 301,665,361 Other Assets 2,106,127 18,026,935 20,133,062 2,770,327 17,387,787 20,158,114
Total Assets 637,221,521 565,846,695 1,203,068,216 504,666,696 551040,191 1,056,606,887
LIABILITIES
Depost Demand 474,739,429 0 474,739,429 392,226721 0 392,226,721
Savings 533,308,804 0 533,308,804 469,423,769 40 469.423.809
Time 26,735,535 444,090 27,179,625 46,276,487 24,619 46,301,106
LTTICD 0 11,000,000 11,000,000 0 5,000,000 5,000,000
Bills Payable 1,882,262 19,467,669 21,349,931 2,182,814 18,058,314 20,241,128
Unsecure Subordinated Debt 0 10,500,000 10,500,000 0 10,500,000 10,500,000
Due to BTr, BSP, 8 MCs/PCIC 2,240,728 163,469 2,404,197 1,755.387 117,078 1,872,465
Due to Local Banks 16,758 0 16,758 8621 0 8,621 Other Litiltties & Payable 336,966 35,988,549 36,325,515 8,329,210 20,022,669 28.351,879
Total Liabilities 1,039,260,402 77,563,777 1,116,824,259 920,203,009 53,722,720 973,925,729
• Core Deposit
The Bank determines Core Deposit which is calculated based on Net Withdrawal Pattern. It serves as a buffer that protects the Bank's assets, which are subject to interest rate risks. Core Deposit level is computed to determine the lowest deposit level that is expected to be retained under normal operating conditions. The computation involves determining the Deposit Mix comprising of Volatile and non-Volatile or Core Deposits.
64
■■■
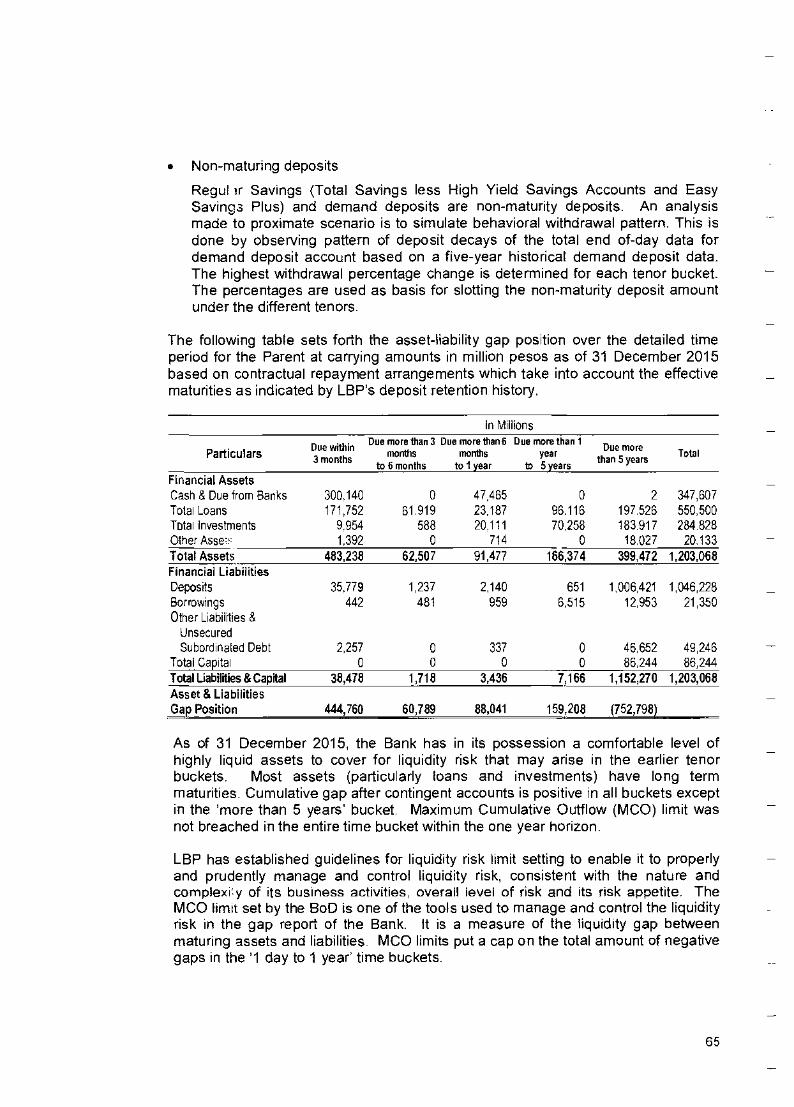
• Non-maturing deposits
Regul it Savings (Total Savings less High Yield Savings Accounts and Easy Savings Plus) and demand deposits are non-maturity deposits. An analysis made to proximate scenario is to simulate behavioral withdrawal pattern. This is done by observing pattern of deposit decays of the total end of-day data for demand deposit account based on a five-year historical demand deposit data. The highest withdrawal percentage change is determined for each tenor bucket. The percentages are used as basis for slotting the non-maturity deposit amount under the different tenors.
The following table sets forth the asset-liability gap position over the detailed time period for the Parent at carrying amounts in million pesos as of 31 December 2015 based on contractual repayment arrangements which take into account the effective maturities as indicated by LBP's deposit retention history.
In Millions
Particulars Due within 3 months
Due more Than 3 Due more than 6 months months
to 6 months to 1 year
Due more than 1 year
to 5 years
Due more than 5 years Total
Financial Assets Cash & Due from Banks 300.140 0 47 465 0 2 347,607 Total Loans 171,752 61.919 23,187 96.116 197.526 550,50D Total Investments 9.954 588 20,111 70.258 183.917 284.828 Other Assew 1.392 0 714 0 18.027 20. 133 Total Assets 483,238 62,507 91,477 166,374 399,472 1,203,068 Financial Liabilities Deposits 35.779 1,237 2,140 651 1,006,421 1,046,228 Borrowings 442 481 959 6,515 12953 21,350 Other Liabilities &
Unsecured Subordinated Debt 2257 0 337 0 46652 49,246
Total Capital 0 0 0 0 86244 86,244 Total Liabilities 8 Capital 38,478 1,718 3,436 7,166 1,152,270 1,203,068 Asset & Liabilities Gap Position 444,760 60,789 88,041 159,208 (752,798)
As of 31 December 2015, the Bank has in its possession a comfortable level of highly liquid assets to cover for liquidity risk that may arise in the earlier tenor buckets. Most assets (particularly bans and investments) have long term maturities. Cumulative gap after contingent accounts is positive in all buckets except in the more than 5 years' bucket. Maximum Cumulative Outflow (MCO) limit was not breached in the entire time bucket within the one year horizon.
LBP has established guidelines for liquidity risk limit setting to enable it to properly and prudently manage and control liquidity risk, consistent with the nature and complexVy of its business activities, overall level of risk and its risk appetite. The MCO limit set by the BoD is one of the tools used to manage and control the liquidity risk in the gap report of the Bank. It is a measure of the liquidity gap between maturing assets and liabilities. MCO limits put a cap on the total amount of negative gaps in the '1 day to 1 year' time buckets.
65
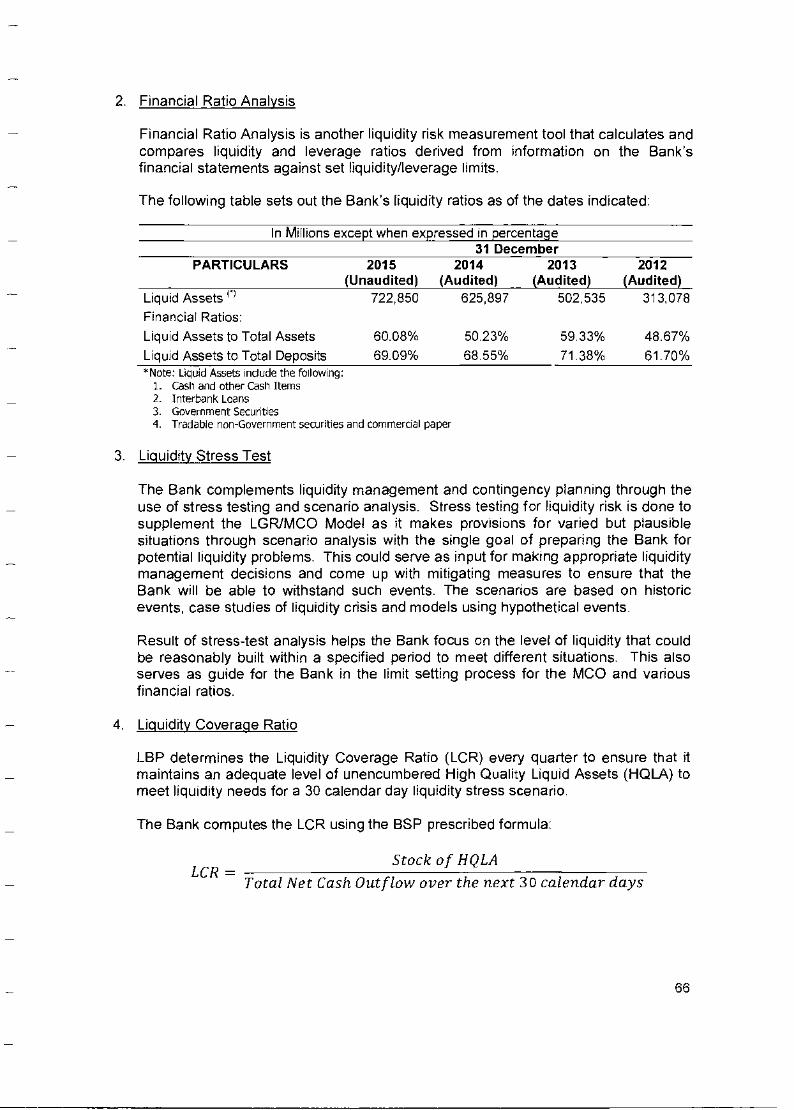
2. Financial Ratio Analysis
Financial Ratio Analysis is another liquidity risk measurement tool that calculates and compares liquidity and leverage ratios derived from information on the Bank's financial statements against set liquidity/leverage limits.
The following table sets out the Bank's liquidity ratios as of the dates indicated:
In Millions except when expressed in percentage 31 December
PARTICULARS 2015 (Unaudited)
2014 (Audited)
2013 (Audited)
2012 (Audited)
Liquid Assets (*) 722,850 625,897 502,535 313,078
Financial Ratios:
Liquid Assets to Total Assets 60.08% 50.23% 59.33% 48.67%
Liquid Assets to Total Deposits 69.09% 68.55% 71.38% 61.70% *Note: Liquid Assets include the following:
1 Cash and other Cash Items 2. Interbank Loans 3. Government Securities 4. Tradable non-Government securities and commercial paper
3. Liquidity Stress Test
The Bank complements liquidity management and contingency planning through the use of stress testing and scenario analysis Stress testing for liquidity risk is done to supplement the LGR/MCO Model as it makes provisions for varied but plausible situations through scenario analysis with the single goal of preparing the Bank for potential liquidity problems. This could serve as input for making appropriate liquidity management decisions and come up with mitigating measures to ensure that the Bank will be able to withstand such events. The scenarios are based on historic events, case studies of liquidity crisis and models using hypothetical events.
Result of stress-test analysis helps the Bank focus on the level of liquidity that could be reasonably built within a specified period to meet different situations. This also serves as guide for the Bank in the limit setting process for the MCO and various financial ratios.
4. Liquidity Coverage Ratio
LBP determines the Liquidity Coverage Ratio (LCR) every quarter to ensure that it maintains an adequate level of unencumbered High Quality Liquid Assets (HQLA) to meet liquidity needs for a 30 calendar day liquidity stress scenario
The Bank computes the LCR using the BSP prescribed formula:
LCR = Stock of BOLA
Total Net Cash Outflow over the next 30 calendar days
66
Where:
High Quality Liquid Assets - Comprised of cash or assets that can be converted into cash at little or no loss of value in private markets, to offset the net cash outflows it could encounter under a liquidity stress scenario
Total Net Cash Outflows - the total expected cash outflows minus total expected cash inflows, in the specified stress scenario for the subsequent 30 calendar days
As of 31 December 2015, the Bank's simulation using the BSP's LCR template as indicated in the BSP Circular 905 Series of 2016 resulted to LCR higher than the 90 percent minimum requirement for the CY 2018 and maximum LCR trigger alert of 100 percent targeted for the CY 2019.
5. Liquidity Contingency Plan (LCP)
The Bank formulated the LCP using extreme scenarios of adverse conditions to ensure that the Bank has sufficient liquidity at all times. The LCP evaluates the Bank's ability to withstand the extreme scenarios. The contingency plan focuses on the Bank's strategy for coordinating managerial action during a crisis and includes procedures for making up cash flow shortfalls in adverse situations.
In the event of a liquidity crisis, the Bank activates the contingency plan based on the recommendation of the ALCO which has the over-all responsibility for the management and execution of the plan, unless otherwise elevated to the Crisis Management Committee (CMC).
Although deposit liabilities remain to be the major source of fund, the Bank identifies the different alternative funding sources like cash from operations, stock of marketable assets, government and retail deposit sources and various credit lines from Banks, among others which are available within 1 day to 6 months. In 2015, the Bank's LGP was enhanced to include the procedures in conducting the liquidity testing.
OPERATIONAL RISK MANAGEMENT
In 2015, LBP continued to strengthen its operational performance to attain its financial target. With reference to the business excellence theme for 2015, the Bank pursued operational alignment during the year. The Bank attained its overall strategic objectives through operational alignment where all BUs, support units and employees were made to understand how each individual performance is tied to the attainment of Bank's goal. The alignment of operations with that of organizational goals translated to solid financial gains and operational excellence.
Similarly LBP focused on enhancing internal business processes and continued its initiatives on International Organization for Standardization Ilsol (i.e., Environmental Management System lEms1 and Quality Management System Km!). Moreover, the Bank took on a major challenge by applying for the Philippine Quality Award (PQA) Program as part of its thrust to continually improve business processes and develop world class operations.
67
A significant achievement of the Bank in 2015 in the area of Operational Risk Management (ORM) was the implementation and embedding of RM at the BU level. ORM across the institution was becoming a way of life, with the BUs becoming aware of the specific operational risks they confronted, taking a proactive stance in managing these and escalating breaches as soon as they occur. BUs conduct self-assessment using various RM tools such as RCSA, RAR & RTR, BIA, BCQ, heat maps, and hazard maps to quantify potential operational losses which serve as their daily dashboard in monitoring operational risk. RMG regularly monitors and escalate to RiskCom and Management Committee (ManCom) the actual losses versus estimated losses.
Operational Risk Exposure
LBP uses the Basic Indicator Approach for calculating the capital charge for operations risk under Pillar 1. The Bank used the average Gross Revenues of the Bank for the last three years to calculate the Operational RWA. In compliance with BSP Circular #900 dated 18 January 2016, the scope of the Operational Risk was expanded to include event and legal risks.
As of 31 December 2015, the Bank's RWA for Operational Risk using the Basic Indicator Approach was P49,271 million or 9.6 percent of the Bank's aggregate RWA of P513,059 million. Cognizant that Gross Revenues (BSP proxy data) is but a shadow indicator of operational risks in the Basic Indicator Approach calculation, LBP conducted a simulation of the computation of the 2015 estimated losses using actual historical losses of the Bank and estimated probability of occurrence in 2016 to determine the variance from the Basic Indicator Approach model.
Self-risk assessment of operations showed that the total estimated loss was way below the Operational RWA under the Basic Indicator Approach.
While the banking industry perceives system risk as high risks among the operational risk LBP has conducted a forward-looking risk assessment and put the following controls in place to avoid/mitigate the estimated losses from system risk.
• Enhancement and implementation of the Bank's IT Risk Management System • Creation of the IT-Quality Management Office • Strengthen the function of the ISTRMO under the RMG • Upgrading of Automated Teller Machines (ATMs) • Compliance with Europay Mastercard VISA (EMV) • Continued upgrading of IT infrastructure • Conduct of full cycle testing • Implementation of IT governance • Enhancement of Business Continuity Plan (BCP) and Disaster Recovery Plan (DRP)
for IT • Enhancement of IT standards • Observance of strict procurement process and monitoring of the performance of
service providers • Full compliance to information security policies • Insurance coverage for fixed assets and electronic crimes, and • Monitoring and oversight of the Senior Management, ITCom and RiskCom.
68
Equally important LBP has started to embark on other initiatives to mitigate system risk such as implementation of the Enterprise Fraud Risk Management System, upgrading of Security & Network Infrastructure and delivery channels such as internet and phone banking.
ENTERPRISE RISK MANAGEMENT
Risk Categories
As the Bank recognizes all risks inherent to its mandate and its various business activities, it embarks on an Enterprise Risk Management (ERM) approach to capture all risk events categorized under BSP Circular No. 510 dated 03 February 2006 (re: Guidelines on Supervision by Risk): 1. credit risks, 2. market risks, 3. compliance risks, 4. liquidity risks, 5. interest rate risks, 6. operations risks, 7. reputation risks and 8. strategic risks. The 52 risks that comprise the Bank's Risk Universe and falling under the above eight categories are defined, customized and given substance in the LBP Risk Dictionary developed under the ERM initiative.
Through the Risk Self-Assessment (RSA) process under the ERM, Senior Management prioritized critical risks in terms of inherent impact and effectiveness of RM practices. This resulted in the prioritization of 26 critical risks, from which the top five risks of the Bank were selected, as follows:
1. Market Risk: The failure to anticipate and manage fluctuations in the values of the Bank's investments; could lead to economic losses.
2. Counterparty Credit Risk-Loans: The inability to review and analyze the credit quality of potential/existing borrowers to serve as basis for loan approval (at application) and to determine the probability of default (on an ongoing basis); could lead to economic losses.
3. IT Management Risk: The failure to effectively prioritize IT initiatives and administer IT resources may lead to lost business and hinder the achievement of the Bank's goals and objectives.
4. People Risks:
• People Development and Performance Risk: The inability to develop and enhance employee skills and provide a sound employee performance management system may reduce employee motivation and may adversely impact the achievement of desired performance and conduct.
• Recruiting and Retention Risk: The inability of the Bank to attract, retain and develop competent employees might lead to organizational dysfunction and low morale.
• Succession Planning Risk: The failure to create and implement a feasible continuance plan for key bank positions and employees might adversely affect the stability of organizational leadership and business continuity.
69
5. Client Relationship Management Risk: The inability to effectively identify and address the customers' needs will negatively affect the Bank's reputation and relationship with customers.
The risk profile of the Bank is subjected to regular review and the RSA yielded the following seven risks (part of the 26 critical risks) that needed to be immediately addressed.
1. Strategic Planning Risk: The failure to develop, implement and monitor institutional strategies and direction will threaten the Bank's overall viability and growth prospects.
2. Socio-Political Risk: The failure to understand, address and anticipate political mandates and social & cultural developments will affect the Bank's overall operations.
3. Technology Identification Risk: The failure to identify and prioritize the appropriate system and technology to support business processes or major initiatives may lead to costly investments and work inefficiencies and may compromise product or service delivery.
4, Measuring & Monitoring of Major Initiatives Risk: The failure to identify appropriate performance metrics and standards to monitor attainment of objectives and targets may prevent the achievement of desired output and performance.
5. Lending Capacity Risk: The failure to maximize loanable funds might lead to loss of business opportunities for the Bank.
6. Liquidity Risk: The failure to properly manage the Bank's cash flows and have sufficient available alternative fund sources at reasonable cost could affect the Bank's ability to meet its obligation as they fall due.
7. Banking Regulations Risk: The failure to comply with the circulars, memoranda, advisories and other issuances of regulatory bodies as applicable to the banking industry, may result in loss of business, administrative/criminal penalties/sanctions and loss to reputations. It is also the failure to set the stage for higher capital requirement in order to strategically align economic capital with regulatory requirements like Basel III, Anti-Money Laundering Act (AMLA) amendments, etc.
In light of the impending merger and consolidation of LBP and DBP, a re-assessment of the Bank's risk profile was conducted and six emerging risks were identified in 2015:
1. People Risk: Failure to retain and motivate key personnel due to the changes brought about by the merger will lead to organizational dysfunction and low morale.
2. IT Identification & Implementation: Failure to identify and implement the appropriate system and technology to support business processes or major initiatives of the merged bank may lead to costly investments and work inefficiencies, and may compromise product or service delivery.
70
3. Asset Quality & Valuation: Failure to establish the appropriate valuation of assets and liabilities of DBP and its subsidiaries that will be absorbed by the Bank, including commitments and contingencies on unrecorded assets and liabilities, might cause financial losses.
4. Capital Reserve: Failure to maintain capital surplus (on top of the increased minimum regulatory requirements) to serve as a reserve from unforeseen losses arising from the merger and to support planned expansion may lead to regulatory sanctions and bank insolvency.
5. Socio-Political: Failure to understand, address and anticipate policy mandates, as defined in the law and Executive Order, will affect the Bank's plan in its execution of the merger.
6. Tone at the Top and Vision & Direction: Inability of the BoD and Senior Management to establish a culture of accountability, integrity, professionalism and competency may result in an unfavorable working environment and lack of integrity in the way the merged Bank will conduct business. Failure to establish, align and communicate the merged Bank's vision and direction to the employees and customers, including its major initiatives, services, products and programs, may hamper the achievement of its objectives and strategies.
Formulation of risk management strategies to mitigate the risk and its root causes were performed by risk teams from various risk-taking BUs using Bow-Tie Analysis. The Bow-Tie Analysis map clearly displays the links between the potential causes, preventative and mitigating controls and consequences of the risks related to merger.
The Bank's Risk Universe also was revisited and from a total of 52 risks, the Risk Universe increased to 62 risks and these were defined and included in the Bank's Risk Dictionary.
INTERNAL CAPITAL ADEQUACY ASSESSMENT PROCESS
For 2015, the Bank's conducted a thorough and comprehensive Internal Capital Adequacy Assessment Process (ICAAP) process to determine the quality and adequacy of the Bank's capital, given the existing risks exposure as well as future risks arising from growth, new markets and expansion of the product portfolio. The BoD and the Senior Management performed collaborative governance and provided directions to enhance the RM process and strengthen the capital position of the Bank.
ICAAP's primary purpose is to inform the BoD and Senior Management of the ongoing self-assessment of the bank's risk profile, how the Bank intends to mitigate significant risks and how much additional future capital is necessary having considered other mitigating factors.
Enhancement of Risk Assessment
To align with the local and global best practices, the Bank has strengthened and enhanced its ICAAP development process with the following major revisions:
71
• Linking the Bank's ERM Framework with ICAAP Model by relating the forward-looking risk assessment with the Risk Driver Maps containing the corresponding strategies
• Adopting the enterprise-wide view of risk, cross risk analysis & identification and management of emerging risk across the institution.
• Linking the RCSA process in determining risk drivers and potential losses • Institutionalizing the ICAAP Communication Process • Implementation of the "ICAAP Quarterly Monitoring Report" • Defining the primary risk owners and secondary risk owners
ICAAP Culture
The ICAAP is embedded in the Bank's operating philosophy and has been cascaded down to the BUs level, forming an integral part of LBP's RM process. This process enables its BoD and Senior Management Team to assess, on a continuing basis, the risks that are inherent in the daily activities of the BUs.
All BUs of the Bank use ICAAP in the day-to-day operations and they are aware of the corresponding capital charge for every single transaction or business they will generate and implement. In monitoring the efficient performance of the BUs across the organization in the area of RM and utilization of capital, the Bank adopts a rigorous escalation and thorough monitoring process via regular reports.
Strengthening Capital Planning
For 2015, the Bank has sufficient and strong capital to deliver its mandated services and to cover the risk inherent in its operations. Under the most probable scenario, LBP estimated the 2015 year-end Capital Adequacy Ratio (CAR) at 12.8 percent vs. 10 percent required CAR. The actual CAR recorded as of 31 December 2015 was 12.9 percent implying a very objective risk assessment and capital planning. Similarly the actual Common Equity Tier 1 (CET 1) ratio of 9.9 percent as of 31 December 2015 was not too far from the 9.7 percent projected CET 1 ratio. The actual CAR and CET 1 ratios of the Bank were more than the BSP minimum requirements of 10 percent CAR and 8.5 percent CET 1 ratio and were compliant with Basel Ill requirements.
The projected ICAAP ratios of CAR and CET 1 being very near the actual values of these ratios at the end of December 2015 indicate that the ICAAP process has been conducted diligently and appropriately.
As a policy, the Bank maintains a strong capital base at all times to boost customer confidence, enhance competitiveness, ensure stability, and sustain long-term growth and viability. As such, the Bank continues to adhere to BSP's policies, rules and more specifically, comply with regulatory requirements on capital structure, as well as capital adequacy and leverage ratios.
The Bank shall likewise continue to vigorously preserve real capital to sustain developmental pursuit and service its mandated clients while maintaining acceptable Return on Equity (RoE) of at least equal to the average RoE of the commercial banking industry.
72
The Bank's General Policy on Capital Planning was enhanced to establish capital levels that will adequately support the Bank's business plans; and ensure continued compliance with the evolving capital and capital ratio requirements of the BSP. Given the fact that internal capital generation through earnings remains the principal source of LBP's capital accumulation, the primary thrust of the Bank's capital planning activities was maximizing its profitability (and consequently, high retained earnings) in the foreseeable future.
To address capital concerns on a more permanent basis, the Bank requested the National Government for P20 billion additional equity infusions for LBP in the 2016 General Appropriations Act (GAA). This will give the Bank enough capital buffer to support the national development programs and expand loans to the mandated and priority sectors.
RISK OVERSIGHT COMMITTEE
The Risk Oversight Committee (RiskCom) is primarily responsible for the Bank's risk management framework, policies and guidelines and ensures the alignment of risk management objectives with the Bank's overall business strategies and performance goals.
The RiskCom oversees the risk management program of the Bank ensuring that risk management systems are in place, limits and tolerances are observed, system of limits remain effective and immediate corrective actions are taken whenever there are breaches.
The RiskCom is chaired by Director Tomas T. de Leon, Jr. with the Finance Secretary represented by Usec Jeremias N. Paul, Jr. as Vice-Chairman. Directors Domingo I. Diaz and Crispino T. Aguelo, and the Agriculture Secretary represented by Usec Antonio A. Fleta (later replaced by Usec Allan Q. Umali) complete the Committee members.
For 2015, the RiskCom held 18 meetings with an average attendance of 83 percent wherein 310 regular and special credit, treasury, operational and enterprise-wide risk reports were discussed, including stress testing reports on the Bank's loan and investment exposures. The Committee deliberated on and approved 11 major initiatives as well as 17 new/enhanced guidelines, the Legal Risk Manual and the Bank's action plan to comply with the provisions of BSP Circular No. 855 dated 29 October 2014 (re: Guidelines on Sound Credit Risk Management Practices).
The Commit -ee also approved the valuation models for Investments in Non-Marketable Securities (INMES) and Unquoted Debt Securities Classified as Loans (UDSCL), which are part of the Bank's commitments to the GCG Sector for 2015. The Committee also approved the medium term plan of the RMG as expressed in the document "Journey to Advanced Approach in Calculating Risk Weighted Assets.'
Under the direction of the RiskCom, the ERM Phase Ill which analyzed the risk drivers, risk management strategies (preventive and mitigating) and the impact of the LBP-DBP merger was conducted and completed with SGV consultants. Another
73
major initiative was the completion of the ERM - AVP which was distributed to all BUs.
In the Performance Evaluation conducted by the RiskCom members, the Committee was rated "Superior"/"Exemplary."
INVESTMENT AND LOAN COMMITTEE
The Investment & Loan Committee (ILC) provides support to the LBP BoD in the evaluation and approval of loan and investment proposals, in accordance with the Bank's Codified Approving/Signing Authority (CASA).
The ILC also evaluates and approves credit policies and guidelines including, but not limited to limits on the Bank's total lending exposures to different industries/sectors, terms and conditions for each type of credit accommodation, remedial measures such as restructuring and foreclosures, dacion en pago and other settlement options. In addition, the ILC reviews and recommends to the LBP Board approval of investment policies and guidelines that define the structure, eligible investments and management of investment portfolios.
The ILC is composed of LBP President & CEO Gilda E. Pico as Chairperson with Director Domingo I. Diaz served as the Vice Chairperson, and Directors Crispino T. Aguelo, Victor Gerardo J. Bulatao and Tomas T. De Leon, Jr. as members. The Committee meets weekly and held a total of 47 meetings in 2015 with an average attendance of 83 percent.
The ILC approved 378 loan accounts and endorsed 235 accounts to the LBP Board for approval or confirmation. A total of 36 credit-related policies and programs were deliberated and approved for implementation. It likewise evaluated 53 investment accounts which were endorsed for approval of LBP Board.
The ILC approved five automated credit scorecards developed by the Credit Policy & Risk Management Department (CPRMD) which includes credit scorecards for 1. Local Government Units (LGUs), 2. Corporate Accounts, 3. Small & Medium Enterprises (SMEs), 4. Livelihood Loan and 5. Easy Home Loan (EHL) Availers. These five scorecards were part of the commitments of the Bank to the GCG Sector.
All Board level Committees, including the ILC, submitted Performance Rating Scorecards with parameters on Composition, Processes and Tasks. The overall rating of the ILC was Exemplary.
74
Copyright © 2022 FDOKUMEN