Seizing a Brighter Future for All - Pubdocs.worldbank.org.
330
Seizing a Brighter Future for All FORMER YUGOSLAV REPUBLIC OF MACEDONIA SYSTEMATIC COUNTRY DIAGNOSTIC
-
Upload
khangminh22 -
Category
Documents
-
view
0 -
download
0
Transcript of Seizing a Brighter Future for All - Pubdocs.worldbank.org.
Seizing a BrighterFuture for All
FORMER YUGOSLAV REPUBLIC OF MACEDONIASYSTEMATIC COUNTRY DIAGNOSTIC

People forge ideas, people mold dreams, and people create art. To connect local artists to a broader audience, this report features art from Macedonian artists. The World Bank would like to thank the Museum of Contemporary Art in Skopje for their support and cooperation.
Front cover paintings:1. Tanya Tanevska (IV/IV-0403)2. Nove Frangovski (Folk Dance)3. Zaneta Gelevska Veljanovska (City of Joy)4. Nikola Martinovski (Girlfriends)5. Ordan Petlevski (Macedonian Village)6. Zani Gelevska (By the Lake)7. Simonida Filipova Kitanovska (Birds Family)
Back cover paintings:8. Dijana Tomic Radevska (Rhythm)9. Lazar Lichenoski (Poppies)10. Vladimir Simeonov (Peacock from Stobi I)11. Dragutin Avramovski Gute (Morning in Lombardy)12. Reshat Ameti (Would Like to Fly)13. Done Miljanovski (Ohrid Spring)
Front coverBack cover
18 9 23
4
511
612
713 10
November 2018
Report Number 121840-MK
Seizing a BrighterFuture for AllFORMER YUGOSLAV REPUBLIC OF MACEDONIASYSTEMATIC COUNTRY DIAGNOSTIC
© 2018 International Bank for Reconstruction and Development / The World Bank1818 H Street NWWashington DC 20433Telephone: 202-473-1000Internet: www.worldbank.org
This work is a product of the staff of The World Bank with external contributions. The findings, interpretations, and conclusions expressed in this work do not necessarily reflect the views of The World Bank, its Board of Executive Directors, or the governments they represent.
The World Bank does not guarantee the accuracy of the data included in this work. The boundaries, colors, denominations, and other information shown on any map in this work do not imply any judgment on the part of The World Bank concerning the legal status of any territory or the endorsement or acceptance of such boundaries.
Rights and Permissions
The material in this work is subject to copyright. Because The World Bank encourages dissemination of its knowledge, this work may be reproduced, in whole or in part, for noncommercial purposes as long as full attribution to this work is given. Any queries on rights and licenses, including subsidiary rights, should be addressed to World Bank Publications, The World Bank Group, 1818 H Street NW, Washington, DC 20433, USA; fax: 202-522-2625; e-mail: [email protected]
Translations—If you create a translation of this work, please add the following disclaimer along with the attribution: This translation was not created by The World Bank and should not be considered an official World Bank translation. The World Bank shall not be liable for any content or error in this translation.
Adaptations—If you create an adaptation of this work, please add the following disclaimer along with the attribution: This is an adaptation of an original work by The World Bank. Views and opinions expressed in the adaptation are the sole responsibility of the author or authors of the adaptation and are not endorsed by The World Bank.
Third-party content—The World Bank does not necessarily own each component of the content contained within the work. The World Bank therefore does not warrant that the use of any third-party-owned individual component or part contained in the work will not infringe on the rights of those third parties. The risk of claims resulting from such infringement rests solely with you. If you wish to re-use a component of the work, it is your responsibility to determine whether permission is needed for that re-use and to obtain permission from the copyright owner. Examples of components can include, but are not limited to, tables, figures, or images.
Contents
Acknowledgements xvii
Abbreviations and Acronyms xviii
Executive Summary xxi
Overview of the Diagnostic O-10.1 A Determined Start in a Difficult Context O-20.2 Progress, though Modest, on Economic, Social, and Environmental Goals O-30.3 The Growth Challenge: Improving the Allocation of Physical and Human Capital to
Sustainably Increase Productivity O-80.4 The Inclusion Challenge: Providing More and Better Income-Generating Opportunities
for All Macedonians O-110.5 The Sustainability Challenge: Establishing a Solid Institutional Foundation for Long-
Term Growth O-140.6 Toward Faster, More Inclusive, and Sustainable Growth: Three Mutually Reinforcing
Pathways O-160.7 Pathway I: Fostering a More Dynamic and Competitive Private Sector O-18
0.7.1 Enhance Trade Connectivity and Value Chain Integration O-180.7.2 Promote Market Competition and Establish a World-Class Business Climate O-190.7.3 Strengthen Firm Capabilities and the Ecosystem for Technology Adoption and
Access of Firms to Finance O-190.7.4 Foster Agricultural Modernization O-20
0.8 Pathway II: Developing Competitive and Adaptive Human Capital and Closing Opportunity Gaps O-200.8.1 Endow People with Quality and Relevant Skills Throughout the Life Cycle O-200.8.2 Reduce Disincentives and Remove Barriers to Labor Market Participation,
Especially for Women O-210.8.3 Protect Human Capital by Shielding Poor and Vulnerable Households From Shocks
and Investing in Preventive Medicine and Primary Care O-210.9 Pathway III: Achieving Sustainability through Effective Governance, Fiscal Prudence,
Enhanced Environmental Management, and Resilience to Natural Hazards O-220.9.1 Secure Rule of Law and Build Capable Public Institutions That Are Accountable to
Citizens O-220.9.2 Ensure Fiscal Sustainability by Reducing Fiscal Risks, Improving the Efficiency of
Spending, and Enhancing Revenue Mobilization O-220.9.3 Invest in an Integrated Strategy to Reduce Air Pollution, Promote Low-Carbon
Growth, and Build Resilience to Natural Hazards and Climate Change O-230.10 Seizing Emerging Opportunities Now to Shift Gears and Advance Key Objectives O-230.11 Process, Knowledge Gaps, and Data O-270.12 Structure of the SCD O-28
SEIZING A BRIGHTER FUTURE FOR ALL
IIICONTENTS
Chapter 1. Country Context 11.1 FYR Macedonia Is a Small Middle-Income Country with a Strategic but Natural Hazard-
Prone Location and Demographic Challenges 21.2 Since Independence, the Country Has Managed a Peaceful Political Transition as It
Pursued Global Integration 51.3 FYR Macedonia Established Solid Macroeconomic Fundamentals and Attracted Foreign
Investment 81.4 An Incomplete Economic Transition and Vulnerable State Institutions are Serious
Structural Challenges 11
Chapter 2. Poverty, Shared Prosperity, and the Labor Market 152.1 Progress in Poverty Reduction and Shared Prosperity in Recent Years 162.2 Yet, Poverty Is Persistent in Certain Groups and Regions 222.3 Employment Opportunities Affect Prospects of Escaping Poverty 282.4 Labor Market Structural Issues Are a Significant Jobs Challenge 322.5 A Shrinking Workforce and Emigration Compound the Jobs Challenge 342.6 Conclusion 36
Chapter 3. Economic Growth and Jobs 373.1 Growth Trends 383.2 Drivers of Growth 413.3 Growth and Jobs by Sector 483.4 Firm Dynamics, Productivity, and Jobs 53
3.4.1 Inefficient Allocation of Resources Is Dragging on Productivity Growth 573.4.2 High-Productivity Firms Create High-Quality Jobs 613.4.3 A Burdensome Business Climate Slows Firm Productivity Growth 65
3.5 Conclusion 66
Chapter 4. Pathway I: Fostering a More Dynamic and Competitive Private Sector 694.1 Deepening Integration with Global Markets to Boost Economic Growth 72
4.1.1 Progress in Export Growth and Sophistication 734.1.2 Logistics Are Still Not Conducive to Exporting 844.1.3 To Enter Global Markets, Local Firms Need to Become More Competitive 874.1.4 The Existing Transport Infrastructure Needs to Be Maximized 89
4.2 Enhancing Competition and Ensuring a Level Playing Field 924.2.1 Opening Markets and Removing Anti-Competitive Regulation 934.2.2 Boosting the Effectiveness of FYR Macedonia’s Competition Policy Enforcement 954.2.3 State Aid 96
4.3 Improving Firm Capabilities and Technology Adoption 984.4 Creating a World-Class Business Environment 102
4.4.1 Impressive progress in international measures of business environment 1024.4.2 Mind the Implementation Gap and Further Streamline Business Regulations 1034.4.3 Unpredictable Regulations Create Uncertainty for Investors 104
4.5 Improving Access to Finance for New Firms and SMEs 1054.6 Developing a Digital Economy 108
FYR MACEDONIA SYSTEMATIC COUNTRY DIAGNOSTIC
IV CONTENTS
4.7 Fostering Agricultural Modernization and Competitiveness 1114.8 Selected Industries and their Growth Challenges 117
Chapter 5. Pathway II: Developing Competitive and Adaptive Human Capital and Closing Opportunity Gaps 121
5.1 Joblessness Is a Barrier to Social Inclusion 1225.2 Causes of Low Employment Are Rooted in Demand and Supply 124
5.2.1 Building Human Capital and Improving Education are Important for Both Inclusion in the Economy and Personal Well-Being 128
5.3 Barriers and Disincentives Deter Labor Force Participation and Employment 1395.3.1 Design of Taxation and Benefits Can Be Improved So As Not To Discourage Work 140
Chapter 6. Pathway III: Achieving Sustainability through Effective Governance, Fiscal Prudence, Enhanced Environmental Management and Resilience to Natural Hazards 151
6.1 Better-Quality Institutions for Faster, Sustainable, and More Broad-Based Growth 1526.1.1 Obstacles to Social Trust and State Effectiveness 156
6.2 Ensuring Fiscal Sustainability 1616.2.1 Reestablishing Fiscal Sustainability to Lay the Foundation for Inclusive Growth 1616.2.2 Ensuring Debt Sustainability 1626.2.3 Improving the Flexibility and Efficiency of Public Spending 1646.2.4 Addressing Fiscal Risks 1676.2.5 Mobilizing More Revenue 1686.2.6 Strengthening Fiscal Policymaking 170
6.3 Strengthening Environmental Management and Resilience to Natural Hazards and Climate Change 1716.3.1 The Threat of Air Pollution 1716.3.2 Mitigation of Greenhouse Gas Emissions 1746.3.3 Resilience to Natural Disasters and Climate Change 1786.3.4 Natural Resource Management 182
Chapter 7. Priorities for Achieving Faster, More Inclusive, and Sustainable Growth 1837.1 Prioritization Criteria 1867.2 Pathway I: Fostering a More Dynamic and Competitive Private Sector 190
7.2.1 Enhance Trade Connectivity and Value Chain Integration 1927.2.2 Promote Market Competition and Establish a World-Class Business Climate 1947.2.3 Strengthen Firm Capabilities and the Ecosystem for Technology Adoption and
Access of Firms to Finance 1967.2.4 Foster Agricultural Modernization 197
7.3 Pathway II: Developing Competitive and Adaptive Human Capital and Closing Opportunity Gaps 1997.3.1 Endow People with Quality and Relevant Skills Throughout the Life Cycle 2007.3.2 Reduce Disincentives and Remove Barriers to Labor Market Participation,
Especially for Women 2037.3.3 Protect Human Capital by Shielding Poor and Vulnerable Households from Shocks
and Investing in Preventive Medicine and Primary Care 204
SEIZING A BRIGHTER FUTURE FOR ALL
VCONTENTS
7.4 Pathway III: Achieving Sustainability through Effective Governance, Fiscal Prudence, and Enhanced Environmental Management and Resilience to Natural Hazards 2067.4.1 Secure Rule of Law and Develop Capable Public Institutions that are Accountable
to Citizens 2077.4.2 Ensure Fiscal Sustainability by Reducing Fiscal Risks, Improving the Efficiency of
Spending, and Enhancing Revenue Mobilization 2097.4.3 Invest in an Integrated Strategy to Reduce Air Pollution, Promote Low-Carbon
Growth, and Build Resilience to Natural Hazards and Climate Change 2117.5 Conclusion 213
References 215
Annex 1: Structural and Aspirational Peer Economies Identification 228
Annex 2: Benchmarking Development Indicators 230
Annex 3: Engagement Process 241
Annex 4: Growth Challenges for Selected Industries 242A4.1 Agriculture and Agribusiness 244A4.2 Motor Vehicles 246A4.3 Textiles and Apparel 249A4.4 Tourism 251A4.5 Information and Communication Technologies (ICT) 253
Annex 5: Poverty Regressions 264
Annex 6: Sociodemographic Characteristics by Welfare Status 266
Annex 7: Employment Regressions 270
Annex 8: Methodology for Barriers and Disincentives Indices 271
FYR MACEDONIA SYSTEMATIC COUNTRY DIAGNOSTIC
VI CONTENTS
List of Figures
Figure O.1: FYR Macedonia’s economy has not grown fast enough to close the income gap with the EU O-4
Figure O.2: Household consumption has been the main driver of growth in the past… O-4Figure O.3: …but exports and investment gained importance thereafter O-4Figure O.4: In FYR Macedonia a relatively large share of labor is employed in low-productivity
sectors O-5Figure O.5: Wages tend to be higher at more-productive firms… O-6Figure O.6: …and wage growth is associated with productivity growth O-6Figure O.7: Welfare has improved on average, yet the share of vulnerable has remained constant O-6Figure O.8: Too many Macedonians are not working, creating a significant jobs challenge O-7Figure O.9: While motor vehicle firms in the Special Economic Zones (SEZs) created many new
jobs, the number of textile and apparel jobs destroyed outside the SEZs equaled the number created inside the SEZs O-9
Figure O.10: Export-oriented firms do not rely on local suppliers O-9Figure O.11: Returns on investment have declined O-9Figure O.12: Employment and employment growth are relatively low in the most productive firms O-9Figure O.13: While some aspects of the business climate contribute to a firm’s productivity in
FYR Macedonia, trade costs. business regulations, and others inhibit it O-11Figure O.14: In FYR Macedonia, deficiencies in human capital development begin in childhood
and compound over time O-12Figure O.15: Macedonian students perform poorly on standardized tests O-13Figure O.16: Macedonians lose on average about 25 years of employment because of poor labor
market outcomes O-13Figure O.17: Selected examples of inequality in income and opportunities in FYR Macedonia O-14Figure O.18: FYR Macedonia’s governance is far below that of aspirational peers before they
joined the EU O-15Figure O.19: A gap between law and practice undermines state effectiveness and social trust O-15Figure O.20: The key elements for faster, more inclusive, sustainable growth in FYR Macedonia O-17Figure O.21: Pathways to faster, more inclusive, and sustainable growth in FYR Macedonia O-18Figure 1.1: FYR Macedonia has a multi-ethnic society 3Figure 1.2: FYR Macedonia has an aging population 3Figure 1.3: FYR Macedonia has among the largest diasporas in the world 3Figure 1.4: Natural hazards could derail economic growth 3Figure 1.5: FYR Macedonia’s economic outcomes are affected by political events 9Figure 1.6: Ease of doing business has improved significantly in FYR Macedonia 10Figure 1.7: Early reforms in price liberalization, trade and forex liberalization, and privatization,
while governance and competition reforms lagged 12Figure 2.1: Poverty in FYR Macedonia fell considerably after the global financial crisis 17Figure 2.2: More equitable income distribution has contributed much to recent poverty reduction 17Figure 2.3: Unlike the pre-crisis period, in 2009–15, income growth was higher in the poorer deciles 17
SEIZING A BRIGHTER FUTURE FOR ALL
VIICONTENTS
Figure 2.4: Recent progress in poverty reduction brought FYR Macedonia closer to the level expected given its stage of development, but poverty remains high 19
Figure 2.5: Shared prosperity has increased in recent years 20Figure 2.6: FYR Macedonia in 2015 still highly unequal among peer countries 20Figure 2.7: The decrease in poverty has not been matched by a decrease in vulnerability 21Figure 2.8: The middle class in FYR Macedonia is still smaller than in aspirational peers 21Figure 2.9: Life satisfaction in FYR Macedonia is very low compared to peer countries 22Figure 2.10: Lack of employment, children in the household and low educational attainment are
closely correlated with poverty status 25Figure 2.11: Ethnicity affects welfare 25Figure 2.12: Ethnicity explains much of differences in access to income opportunities 26Figure 2.13: Urban-rural disparities in poverty persist… 27Figure 2.14: …as do regional disparities 27Figure 2.15: The poor are concentrated in the northern regions 27Figure 2.16: Most of the poor are working-age adults 28Figure 2.17: The poor work more in agriculture and less in services than the nonpoor 28Figure 2.18: Access to employment is one of the main determinants of poverty 28Figure 2.19: Labor is the most important income source for the poor 28Figure 2.20: Employment opportunities were reflected in better labor market outcomes across
the distribution… 31Figure 2.21: …and translated into poverty reduction from both higher salaries and new jobs 31Figure 2.22: Manufacturing and services were the most important sectors for poverty reduction 31Figure 2.23: Pensions in FYR Macedonia are among the highest in the region relative to average
wages 31Figure 2.24: Too many Macedonians are not working 32Figure 2.25: Despite improvements in employment in recent years… 33Figure 2.26: …FYR Macedonia is one of the world’s worst performers in labor market outcomes 33Figure 2.27: Long-term unemployment has been high for more than 12 years. 33Figure 2.28: Macedonian workers lose on average about 25 years of employment 34Figure 2.29: FYR Macedonia has more informal workers than most peer countries 34Figure 2.30: On current trends the share of working-age Macedonians will fall 35Figure 2.31: FYR Macedonia emigrants mainly work in Western Europe and Turkey 35Figure 2.32: Lack of opportunities encourage emigration, making the future even more uncertain 35Figure 2.33: With sustained economic growth, by 2030 FYR Macedonia can reduce poverty and
expand the middle class, but without further action, too many Macedonians will still be vulnerable and poor 36
Figure 3.1: Economic growth in FYR Macedonia has been moderate… 39Figure 3.2: …though less volatile than in peer countries 39Figure 3.3: Prudent macroeconomic policies helped FYR Macedonia prevent deep recessions
during the global crisis of 2008–09 and the Greek crisis of 2011–12 39Figure 3.4: FYR Macedonia’s economy has not grown fast enough to close its income gap with the EU 40Figure 3.5: Increasing and sustaining growth would cut the time to reach high-income status to
less than one generation 40Figure 3.6: Until 2008 household consumption had been the main driver of growth… 41Figure 3.7: …but thereafter, until the political crisis, exports and investment gained importance 41
FYR MACEDONIA SYSTEMATIC COUNTRY DIAGNOSTIC
VIII CONTENTS
Figure 3.8: Until the global financial crisis, domestic demand drove growth… 42Figure 3.9: …but thereafter external demand drove growth 42Figure 3.10: Growth in private investment is slowing down, while public investment has gained
importance 42Figure 3.11: Returns on investments have declined… 43Figure 3.12: …more than in peer economies 43Figure 3.13: In 2006–16, exports increased and became more sophisticated, but imports,
especially of intermediate goods, also rose 44Figure 3.14: The decline in the structural component of growth indicates lower potential GDP growth 44Figure 3.15: The contribution of TFP to growth has been negative since 2009… 45Figure 3.16: …and labor productivity has stagnated 45Figure 3.17: Higher employment drove per capita growth; productivity contributed little 45Figure 3.18: Pre-crisis, wholesale and retail trade, transport, and other services drove growth;
post-crisis, construction and manufacturing did so as the poverty rate fell 49Figure 3.19: Post-crisis, construction, manufacturing, and public administration drove job
creation, which was associated with a decline in poverty 49Figure 3.20: Sectoral Contribution to Value-Added Growth 49Figure 3.21: Sectoral Contribution to Employment Growth 49Figure 3.22: Average real wages have not improved, as most industries failed to sustain wage
growth, though real wages in construction and manufacturing saw some increases 50Figure 3.23: Employment in FYR Macedonia has been expanding continuously since the global crisis 51Figure 3.24: Recent job growth has been concentrated in sectors with low labor productivity… 52Figure 3.25: …and in sectors with low wages 52Figure 3.26: A relatively large share of Macedonian workers are employed in low-productivity sectors 52Figure 3.27: Intersectoral reallocation of labor has contributed little to productivity growth 53Figure 3.28: The only real improvement in labor productivity has been in ICT, financial services,
and more recently manufacturing (from a low base) 53Figure 3.29: Firm productivity in FYR Macedonia is lower than in peer countries 54Figure 3.30: Since 2012, firm productivity growth has been low or negative every year except 2015 54Figure 3.31: Productivity dispersion is high, especially in services 58Figure 3.32: Larger firms are not more productive than smaller firms, except for a small group at
the top end of the distribution 58Figure 3.33: From 2013 to 2016, between-firm productivity contributed negatively to
productivity growth in numerous sectors in FYR Macedonia 59Figure 3.34: The negative contribution of between-firm productivity growth in FYR Macedonia
is large relative to peers 59Figure 3.35: The rates of firm entry and exit in FYR Macedonia are below those of peer countries 60Figure 3.36: Many high-growth firms are in manufacturing; only a few are in services 60Figure 3.37: FYR Macedonia has fewer “gazelle” firms than peer countries… 61Figure 3.38: …while the many lagging firms that provide a large share of employment stay in business 61Figure 3.39: Many industries with negative productivity growth created more jobs 62Figure 3.40: Employment and employment growth are relatively low in the most productive firms… 62Figure 3.41: …and firms with the highest rates of TFPR growth contribute least to job creation 62Figure 3.42: Employment is concentrated in services, especially retail and wholesale trade; in
manufacturing, textiles and apparel are the largest employers 63
SEIZING A BRIGHTER FUTURE FOR ALL
IxCONTENTS

Figure 3.43: Between 2011 and 2016 the motor vehicle industry created 11,220 jobs, the most of any sector 63
Figure 3.44: In services, most jobs are in small firms; most in manufacturing are in large firms 63Figure 3.45: Services jobs are mostly created by new small firms, manufacturing jobs by
established large firms 63Figure 3.46: Wages tend to be higher at more productive firms… 64Figure 3.47: …and growth in productivity is associated with wage growth 64Figure 3.48: While motor vehicle firms in the SEZs created many new jobs, for textile and
apparel firms, the number of jobs destroyed outside the SEZs equaled the number created inside the SEZs 64
Figure 3.49: While some aspects of the business climate contribute to a firm’s productivity in FYR Macedonia, others—including trade costs and business regulations—inhibit productivity 65
Figure 4.1: Themes for Pathway I 70Figure 4.2: Improving the business climate can lead to substantive productivity gains 72Figure 4.3: FYR Macedonia has become more integrated into the global economy 74Figure 4.4: At the same time, its basket of export goods has become more sophisticated 74Figure 4.5: FYR Macedonia is competitively placed to expand international trade 74Figure 4.6: FYR Macedonia’s main comparative advantage is still in food and textiles, but there
have been improvements in chemicals and machinery and electrical components 74Figure 4.7: FDI in manufacturing after the global financial crisis more than compensated for a
decrease in FDI in services 75Figure 4.8: FDI in the automotive sub-sector has been the most important within the
manufacturing industry after the global financial crisis 75Figure 4.9: FDI levels have fluctuated over time and have not recovered to the peaks observed at
the onset of the global financial crisis 76Figure 4.10: The increase in FDI changed the structure of exports, introducing important new
export goods 76Figure 4.11: FDI in FYR Macedonia is about what can be expected for it’s the size of its economy,
but is less than in peer economies 76Figure 4.12: FYR Macedonia has a fairly diversified group of country sources of FDI 76Figure 4.13: Most greenfield FDI projects went to construction and trade sectors before the
global financial crisis… 78Figure 4.14: …but in recent years most greenfield FDI projects have been in automotives and textiles 78Figure 4.15: The most important imports are products incorporated into export products 80Figure 4.16: Export-oriented firms do not rely on local suppliers 80Figure 4.17: Manufacturing services, transport, and travel are the most important services
exports, andmost subsectors have grown in recent years 80Figure 4.18: FYR Macedonia’s services trade ranks close to the average of structural and
aspirational peers 80Figure 4.19: The increase in exports driven by FDI has also led to a concentration of exports in
destination markets not previously seen in FYR Macedonia’s independent history 81Figure 4.20: The high concentration in FYR Macedonia market destinations is driven by
automotive-related exports 81
FYR MACEDONIA SYSTEMATIC COUNTRY DIAGNOSTIC
x CONTENTS

Figure 4.21: However, product concentration is lower, and also diminishes considerably when the 5 most important automotive exports are excluded 81
Figure 4.22: FYR Macedonia’ progress in integration into global markets is not yet suficient for it to catch up with aspirational peers 82
Figure 4.23: FYR Macedonia still trails considerably in terms of exports per capita to the EU 82Figure 4.24: Limited trade between Western Balkan countries signals an opportunity for deeper
integration 83Figure 4.25: There is room for FYR Macedonia to increase its export markets and the quantity of
its export products 83Figure 4.26: FYR Macedonia’s export basket is somewhat diversified, but it still trails aspirational
peers like Latvia, Slovenia or Estonia 84Figure 4.27: FYR Macedonia trails aspirational peers and most structural peers in logistics
performance 85Figure 4.28: Most exporting firms are small, but large firms represent two-thirds of the value of
exports 87Figure 4.29: Exporting firms tend to be more productive than firms that cater only to the local
market 87Figure 4.30: Survival rates for exports in FYR Macedonia have increased in the last decade… 88Figure 4.31: …though they still remain below that of aspirational peers and even some structural
peers 88Figure 4.32: Although smaller exporters are prevalent, their export survival rates are lower 88Figure 4.33: Many FDI and export-oriented local industries are located along major transport
corridors 89Figure 4.34: Road infrastructure is not considered a major constraint to agriculture in the main
cropland areas 90Figure 4.35: Two-thirds of the national road network is ranked as dangerous 91Figure 4.36: Road Attributes Snapshot 91Figure 4.37: Market dominance, which is increasing, is perceived as a concern for market
competition 92Figure 4.38: Vested interest is the risk perceived as most important for market competition 92Figure 4.39: In the gas sector, there is legal structural separation, but retail tariffs are not regulated 95Figure 4.40: Binding minimum prices exist for key professional services in FYR Macedonia 95Figure 4.41: Macedonian firms trail in managerial and organizational practices… 99Figure 4.42: …and show lower levels of innovation than firms in aspirational peer economies 99Figure 4.43: FYR Macedonia has made significant efforts to streamline business regulations 103Figure 4.44: FYR Macedonia lags in some areas of the business environment like contract
enforcement 104Figure 4.45: Financial intermediation is growing, but FYR Macedonia still trails peer economies 106Figure 4.46: The financial sector is far from diversified 106Figure 4.47: Firms in FYR Macedonia have difficulties accessing finance 107Figure 4.48: ICT services are not very affordable 109Figure 4.49: Despite relatively high broadband penetration, FYR Macedonia’s does not have
much fiber optic connectivity 109Figure 4.50: FYR Macedonia’s wholesale broadband market structure is not competitive 109
SEIZING A BRIGHTER FUTURE FOR ALL
xICONTENTS
Figure 4.51: The energy sector could support development of the wholesale broadband market through infrastructure sharing arrangements 109
Figure 4.52: There is minimal penetration of broadband services beyond major urban centers 110Figure 4.53: Growth in agri-food systems has been dropping since 2010 112Figure 4.54: Exports of agricultural primary products have increased... 112Figure 4.55: …but the trade balance for processed goods is worsening 112Figure 4.56: FYR Macedonia’s agricultural labor productivity is one of the lowest in Europe 114Figure 4.57: FYR Macedonia needs to continue redirecting public spending from MSDP to rural
development 115Figure 5.1: Themes for Pathway II 122Figure 5.2: Different factors affect labor force participation and unemployment in FYR Macedonia 123Figure 5.3: FYR Macedonia has a large deficit in employment 124Figure 5.4: Youth unemployment is among the highest in ECA 125Figure 5.5: Employment rates are especially low for women, youth, and all workers older than 54 125Figure 5.6: Experience and technical skills are the most severe problems for firms 126Figure 5.7: Many firms report that workers lack the right skills for their positions 126Figure 5.8: Macedonian workers lack the experience needed to access jobs… 127Figure 5.9: …and their unemployment spells are long 127Figure 5.10: Most Macedonian students perform below the basic level in math 129Figure 5.11: FYR Macedonia’s PISA scores are falling below their expected level 129Figure 5.12: Pre-primary enrollment and attendance are low, especially for the poor… 130Figure 5.13: …and there are large disparities between rural and urban areas 130Figure 5.14: Lower secondary completion has declined 130Figure 5.15: School enrollment rates are below peers 131Figure 5.16: Education is not delivering enough skills 131Figure 5.17: Since 2017 the number of students has fallen and the number of teachers has risen 133Figure 5.18: Apparently, by rewarding diplomas more than skills, labor markets are not giving
workers the right signals 134Figure 5.19: Returns to education (relative to primary) have risen in the last decade, despite
expanded tertiary attainment 134Figure 5.20: Infant and under-5 mortality rates have declined but remain high 136Figure 5.21: Close to 20,000 productive life years are lost to NCDs annually 137Figure 5.22: Health spending is relatively low in FYR Macedonia 137Figure 5.23: Distorted incentives may be skewing the labor supply in FYR Macedonia 140Figure 5.24: The lowered tax wedge is still high for very low wage earners 141Figure 5.25: At very low wages, the marginal tax rate is high 141Figure 5.26: Among high-skilled workers, those with managerial skills are most likely to emigrate 142Figure 5.27: The public-private wage gap is large 142Figure 5.28: Household member wages and pensions are the main source of income for inactive
adults 144Figure 5.29: Over half of young unemployed NEET (15–29) expect to earn above the minimum
wage 144Figure 5.30: Wages in FYR Macedonia are in line with the Western Balkan average 145Figure 5.31: Social assistance covers less than one-fourth of the poor population 148
FYR MACEDONIA SYSTEMATIC COUNTRY DIAGNOSTIC
xII CONTENTS
Figure 5.32: Over three-fourths of beneficiaries of the means-tested program are from the poorest quintile 148
Figure 5.33: Most employed workers are in full-time, permanent jobs 149Figure 5.34: Ethnic minorities of both genders are more likely to be out of the labor force or
unemployed 150Figure 6.1: Themes for Pathway III 152Figure 6.2: Building trust implies strengthening rules, capacity, and accountability 153Figure 6.3: FYR Macedonia’s governance level is far below that of aspirational peers before they
joined the EU 153Figure 6.4: FYR Macedonia's governance rankings are especially low in political stability,
accountability, and rule of law 154Figure 6.5: Governance issues are one of the top 5 constraints on doing business in FYR Macedonia 155Figure 6.6: The perception of corruption has worsened in recent years 156Figure 6.7: Judicial independence and accountability ratings have fallen in FYR Macedonia
(1991–2015) 158Figure 6.8: Judicial transparency and accountability 158Figure 6.9: Judicial independence, freedom of the press, and EU standards 159Figure 6.10: Judicial independence ratings, structural and aspirational peers 159Figure 6.11: The gap between law and practice, percent 160Figure 6.12: Government effectiveness in FYR Macedonia, 2016 160Figure 6.13: Fiscal deficits have persisted since 2009… 161Figure 6.14: …as revenues deteriorated and spending rose 161Figure 6.15: The fiscal policy response has been shifting 162Figure 6.16: The fiscal deficit is structural 162Figure 6.17: Poor fiscal discipline led to a steep increase in public debt 163Figure 6.18: Macedonian debt is now close to the average for new EU members 163Figure 6.19: Public debt will increase significantly if not contained… 163Figure 6.20: …as will gross financing needs 163Figure 6.21: Debt makes the country vulnerable to shocks 163Figure 6.22: Public spending in FYR Macedonia is moderate relative to peers, but it is less efficient 164Figure 6.23: Social and capital spending have grown relative to other items 165Figure 6.24: Public revenues are comparatively low 169Figure 6.25: Revenue from taxation and social security contributions, percent of GDP 169Figure 6.26: Full fiscal transparency is now needed 170Figure 6.27: FYR Macedonia’s cities have the world’s highest levels of ambient particulate matter 172Figure 6.28: Large industry is concentrated in Bitola, Kicevo, Kavadarci, and Skopje 172Figure 6.29: Pollutants associated with residential heating, road traffic, and industry explain
most of the air pollution in urban centers 172Figure 6.30: With policies and measures that have negative costs, by 2030 CO2 emissions may
bereduced for more than 4 million tons 175Figure 6.31: By meetings its NDC measures, FYR Macedonia can stabilize emissions and start to
reduce them by 2032 175Figure 6.32: FYR Macedonia could create up to 6,000 green jobs by 2030 by adopting NDC
environmental measures 175Figure 6.33: The energy sector is the main generator of CO2e emissions 176
SEIZING A BRIGHTER FUTURE FOR ALL
xIIICONTENTS

Figure 6.34: Coal remains the main fuel for generating electricity 177Figure 6.35: Imports have covered a steady share of electricity demand 177Figure 6.36: FYR Macedonia has more to do to implement Western Balkan energy commitments 177Figure 6.37: FYR Macedonia is highly vulnerable to natural hazards 180Figure 7.1: The keys for faster, more inclusive, and sustainable growth in FYR Macedonia 186Figure 7.2: Pathways to faster, more inclusive, and sustainable growth in FYR Macedonia 187Figure A2.1: Development Indicators for FYR Macedonia and Gap to Best Performer 232Figure A4.1: ICB Analysis of the Agriculture Industry 245Figure A4.2: ICB Analysis of the Motor Vehicles Industry (Automotive Components) 248Figure A4.3: ICB Analysis of the Motor Vehicles Industry (Original Equipment Manufacturer) 248Figure A4.4: ICB Analysis of the Textiles and Apparel Industry 250Figure A4.5: ICB Analysis of the Tourism Industry 252Figure A4.6: ICB Analysis of the ICT Industry (Communications Sector) 254Figure A4.7: ICB Analysis of the ICT Industry (Software and IT Services) 255
FYR MACEDONIA SYSTEMATIC COUNTRY DIAGNOSTIC
xIV CONTENTS
List of Tables
Table O.1: The Prioritization Criteria for Policy Areas O-24Table O.2: Summary of Priority Areas for FYR Macedonia and Selected Policy Actions O-25Table 4.1: The public sector has a significant footprint in key network industries 94Table 4.2: Selected Innovation Outputs, FYR Macedonia and the Western Balkans, 2016 100Table 4.3: Tobacco is FYR Macedonia’s key agricultural export commodity 113Table 4.4: FYR Macedonia’s main agriculture and agribusiness trading partners are Serbia,
Russia, and the EU 113Table 4.5: Bottlenecks for Investment in Selected Industries in FYR Macedonia 118Table 6.1: Statutory tax rates, FYR Macedonia and peers, 2017 169Table 6.2: Annual deaths in FYR Macedonia due to air pollution cost over €750 million 173Table 6.3: Feed-in tariffs provide support for renewable energy 178Table 7.1: Policy Areas According to the Prioritization Criteria 188Table 7.2: Summary of Key Challenges by Priority Area 188Table 7.3: Priority Areas and Policy Actions to Support Pathway I 191Table 7.4: Priority Areas and Policy Actions to Support Pathway II 199Table 7.5: Priority Areas and Policy Actions to Support Pathway III 206Table A1.1: FYR Macedonia’s Structural Peers, Selected Indicators 228Table A1.2: FYR Macedonia’s Aspirational Peers, Selected Indicators 229Table A2.1: Criteria for Selecting Priority Levels 230Table A2.2: Number of Comparison Countries by Indicator 236Table A3.1: SCD Coffee Sessions on Development Challenges and Opportunities in FYR Macedonia 241Table A4.1: Selected Indicators Capturing Country Competitiveness 256Table A4.2: Financial Times Sector and Activity Classifications 261Table A4.3: Definitions of Business Activity 262Table A4.4: Classification of Business Activities by Level of Value Addition 263Table A5.1 OLS estimation on probability of being poor, FYR Macedonia 2015 264Table A6.1 Average Income by Components, 2016 SILC (Reference year: 2015) 266Table A6.2: Household characteristics of poor, non-poor and bottom 40 populations, 2015 266Table A6.3: Individual characteristics of poor, non-poor and bottom 40 populations, 2015 267Table A7.1: Employment Regressions, Controlling for Individual Characteristics and Nonlabor
Income with Employment as the Dependent Variable. 270Table A8.1: Indicators used for Disincentives, Barriers, and Protection Indices 271
SEIZING A BRIGHTER FUTURE FOR ALL
xVCONTENTS
List of Boxes
Box 1.1: The Ohrid Framework Agreement 6Box 1.2: FYR Macedonia’s EU Accession Process 7Box 1.3: Connectivity Is Central to FYR Macedonia’s Global Integration and Development 11Box 2.1: Measuring Poverty in FYR Macedonia Before and After 2009 18Box 2.2: The Status of Women in FYR Macedonia 23Box 2.3: Lesbian, Gay, Bisexual, Transgender, and Intersex Macedonians 24Box 3.1: Measuring Productivity 46Box 3.2: Reforms and Growth: FYR Macedonia and Latvia 46Box 3.3: Using Satellite Data to Assess Spatial Economic Activity 55Box 3.4: The 2016–17 Macedonian Political Crisis and its Impact on Economic Growth, Firm
Dynamics, and Jobs 56Box 4.1: Bringing Investment to FYR Macedonia 79Box 4.2: Opportunities for Growth for FYR Macedonia Through Regional Economic Integration 83Box 4.3: The Legal Basis for State Aid in FYR Macedonia 97Box 4.4: The Innovation Paradox and its Implications for FYR Macedonia 101Box 4.5: Transforming FYR Macedonia’s Wine Industry 116Box 5.1: The Future of Work in FYR Macedonia 127Box 5.2: Ensuring Quality Standards in Tertiary Education in FYR Macedonia 132Box 5.3: “Yes, You Can!”: Building the Socioemotional Skills of Lower-Secondary Students 135Box 5.4: Less Access to Economic Opportunities for Vulnerable Roma Communities 138Box 5.5: Using LinkedIn Data to Identify Skills in Demand and Migration of Talent 143Box 5.6: Social Norms Affect Women’s Labor Market Participation in FYR Macedonia 146Box 6.1: Whose Voice Is Heard for the Design of Public Policies in FYR Macedonia? 153Box 6.2: Making Public Spending in FYR Macedonia More Efficient 166Box A2.1: Methodology for Benchmarking Development Indicators in FYR Macedonia 231Box A4.1: What Do FDI Firms Look For? An Investment Competitiveness Benchmarking
Analysis for FYR Macedonia 243
FYR MACEDONIA SYSTEMATIC COUNTRY DIAGNOSTIC
xVI CONTENTS

Acknowledgements
We would like to thank the members of the World Bank FYR Macedonia Country Team from all Global Practices, the International Finance Corporation (IFC), and the Multilateral Investment Guarantee Agency (MIGA), as well as stakeholders in FYR Macedonia (government authorities, think-tanks, academia, civil society organizations, private sector representatives, development partners, and media representatives), who contributed to the preparation of this Systematic Country Diagnostic (SCD). We are very grateful for their support.
The SCD team was led by Marco Antonio Hernandez Ore (Program Leader and Lead Economist) and Cesar A. Cancho (Economist), under the overall guidance of Linda Van Gelder (Regional Director for the Western Balkans), Marco Mantovanelli (Country Manager for FYR Macedonia), Gallina A. Vincelette (Practice Manager, Macroeconomics, Trade, and Investment), Luis Felipe Lopez-Calva (Practice Manager, Poverty and Equity), and Thomas Lubeck (Manager, IFC).
The SCD team included: Ana Maria Oviedo, Ana Maria Muñoz, Montserrat Avila, xinxin Lyu, Tingting Zhu, Hongxi Zhao, Marjan Petreski, Cristina Chiarella, Biljana Tashevska (Poverty and Equity); Luis Alvaro Sanchez, Sanja Madzarevic-Sujster, Bojan Shimbov, Barbara Cunha, Harald Jedlicka, Massimiliano Santini, Graciela Miralles, Philana Mugyenyi, Seidu Dauda, Guillermo Arenas, Sean Lothrop, Erika Jorgensen, Suzana Jukic, Oscar Parlback, Maria Reinholdt Andersen, Zenia Ann Rogatschnig (Macroeconomics, Trade, and Investment); Melissa Metz, Gunhild Berg, Gordana Popovic, Elwyn Davies, Ana Paula Cusolito, Jorge Pena, Paulo Guilherme Correa, Juni Zhu, Jan Kazimierz, Johanna Jaeger, Kalina Sukarova (Finance, Competitiveness, and Innovation); Bojana Naceva, Katia Herrera (Education); Mediha Agar, Srdjan Svircev, Georgia Harley, Gladys Senderayi, Kathrin Plangemann (Governance); Svetlana Edmeades, Edinaldo Tebaldi (Agriculture); Liljana Sekerinska, Sandra Sargent, Natalija Gelvanovska, Baher El-Hifnawi (Transport and Digital Development); Rhedon Begolli, Dejan Ostojic (Energy and Extractives); Dorothee Chen, Alessia Thiebaud (Health, Nutrition, and Population); Yewande Awe, Maja Murisic (Environment and Natural Resources); Marina Petrovic, Maddalena Honorati, Johannes Koettl-Brodmann (Social Protection and Jobs); Bekim Ymeri, Alanna Simpson, Dean Cira, Tamara Nikolic, Tatyana Shadrunova, Clifton Cortez, Dominik Koehler (Social, Urban, Rural, and Resilience); Stjepan Gabric, Patricia Lopez (Water); Reyes Aterrido (Jobs Community of Practice); Caglar Ozden (Development Economics); Trevor Monroe, Brad Bottoms (Knowledge Management); Anita Bozinovska (External Communications); Levent Karadayi, Zoran Martinovski, George Konda (IFC); Gianfilippo Carboni, Gero Verheyen (MIGA); Simon Ellis, Timothy Johnston, Goran Tinjic (Western Balkans Country Management Unit). Excellent organizational administrative assistance was provided by Nejme Kotere and Jasminka Sopova. Anne Grant provided assistance in editing, and Budy Wirasmo in designing the report.
The team would also like to thank the peer reviewers, Maria Davalos and Rafael Muñoz, for their comments and advice.
The team is especially grateful to the Government of FYR Macedonia and representatives of all state agencies for their fruitful cooperation, and for providing knowledge, data, and advice.
SEIZING A BRIGHTER FUTURE FOR ALL
xVIIACKNOWLEDGEMENTS

AEC Agency for Electronic Communications
AFSARD Agency for Financial Support in Agriculture and Rural Development
ALMP Active Labor Market PoliciesASYCUDA Automated System for Customs
DataATM average time of maturityCA child allowanceCAD Current Account DeficitCEFTA Central European Free Trade
AgreementCEM Country Economic MemorandumCESEE-EU Central, Eastern and Southeastern
EuropeCIMAP Comparative Indicator-based
Monitoring of Anti-Corruption Progress
CIT corporate income taxCMT cut-make-trimCPC Commission for the Protection of
CompetitionCPI Corruption Perception IndexCSOs civil society organizationsDALYs disability-adjusted life yearsDB Doing BusinessDEA data envelopment analysesDMPS-OLS Defense Meteorological Satellite
ProgramDUI Democratic Union for IntegrationEBRD European Bank for Reconstruction
and DevelopmentEC European CommissionECA Europe and Central AsiaECA-HIC Europe and Central Asia High
Income CountriesECA-MIC Europe and Central Asia Middle
Income CountriesECD Early Childhood DevelopmentECE early childhood educationELEM Elektrani na MakedonijaEM-DAT Emergency Events DatabaseERC Energy Regulatory Commission
ESA Employment Service AgencyEU European UnionEU28 European UnionEurostat European Statistics Office FAO Food and Agriculture OrganizationFDI Foreign Direct InvestmentFRA Agency for Fundamental RightsFSAP Financial Sector Assessment
ProgramFSVA Food Safety and Veterinary AgencyFYR Former Yugoslav RepublicGCI Global Competitiveness IndexGDP Gross Domestic ProductGHG greenhouse gasGIZ German Corporation for
International CooperationGMA guaranteed minimum assistanceGMI guaranteed minimum incomeGNI Gross National IncomeGVC Global Value ChainsHACCP Hazard Analysis and Critical
Control PointHBS Household Budget SurveyHHI Herfindahl-Hirschman IndexHS Harmonized Commodity
Description and Coding SystemsICB Investment Competitive
BenchmarkingICT Information and Communication
TechnologyIFAC International Federation of
AccountantsIFC International Finance CorporationILO International Labor OrganizationIMF International Monetary FundIP Intellectual PropertyIPA Instrument for Pre-accession
AssistanceIPARD Instrument for Pre-Accession
Assistance for Rural DevelopmentiRAP International Road Assessment
Programme
Abbreviations and Acronyms
FYR MACEDONIA SYSTEMATIC COUNTRY DIAGNOSTIC
xVIII ABBREVIATIONS AND ACRONYMS
ISO International Organization for Standardisation
IT Information TechnologyITS Intelligent Transport SystemsLFS Labor Force SurveyLGBTI lesbian, gay, bisexual, transgender
and intersexLiTS Life in Transition SurveyLMIS labor market information systemsLPI Logistics Performance IndicatorMBDP Macedonian Bank for Development
PromotionMbps Megabits Per SecondMIC Multiple Indicator ClusterMKD FYR MacedoniaMSDP market support and direct
paymentsNATO North Atlantic Treaty OrganizationNBRM National Bank of the Republic of
MacedoniaNCD Non-Communicable DiseaseNEET Not in employment, education, or
trainingNPAA National Programme for Adoption
of the AcquisNPLs Non-performing LoansNTDS National Tourism Development
StrategyOBI Open Budget IndexOECD Organization for Economic
Cooperation and DevelopmentOECD SDBS Organization for Economic
Cooperation and Development Structural and Demographic Business Statistics
OFA Ohrid Framework AgreementOLS Ordinary Least Squares OOP Out of PocketOSCE/ODIHR
Organization for Security and Cooperation in Europe/Office for Democratic Institutions and Human Rights
PAYG Pay As You GoPEFA Public Expenditure and Financial
AccountabilityPFM Public Finance ManagementPHC Primary Health Care
PIAAC Program for International Assessment of Adult Competences
PISA Programme for International Student Assessment
PIT Personal Income TaxPM Particular MatterPMR Product Market RegulationPPG Public and Publicly Guaranteed
DebtPPP Public-Private PartnershipPPS Purchasing Power StandardsR&D Research and DevelopmentRCA Revealed Comparative AdvantageRFID radio-frequency identificationRoA Return on AssetsRSBSP Republican Council for Road SafetySAA Stabilization and Association
AgreementSCD Systematic Country DiagnosticSCPC State Commission for the
Prevention of CorruptionSDSM Social Democratic Union of
MacedoniaSEE South East EuropeSEEC CRIF Southeastern Europe and Caucasus
Catastrophe Risk Insurance FacilitySEETO South East Europe Transport
ObservatorySEZ Special Economic ZonesSFA Social Financial AssistanceSFRY Socialist Federal Republic of
YugoslaviaSIGMA Support for Improvement in
Governance and ManagementSILC Survey on Income and Living
ConditionsSITC Standard International Trade
ClassificationSME Small Medium EnterpriseSOAL State Owned Agricultural LandSOE State Owned EnterpriseSOGI sexual orientation and gender
identitySSO State Statistical OfficeSTEEs Small Transition European
EconomiesSTEPS Skills Towards Employment and
Productivity Survey
SEIZING A BRIGHTER FUTURE FOR ALL
xIxABBREVIATIONS AND ACRONYMS
SWD Staff Working DocumentTFEU Treaty for the Functioning of the
European UnionTFP Total Factor ProductivityTFPQ Physical Total Factor ProductivityTFPR Revenue Total Factor ProductivityTIDZ Technological Industrial
Development ZonesTIMSS Trends in International
Mathematics and Science StudiesTIVA Trade in Value-AddedTSO Transmission Service OperatorsTTCR Travel & Tourism Competitiveness
ReportTVET Technical and Vocational Education
and TrainingUMIC Upper Middle Income CountriesUN United NationsUNICEF United Nations Children’s FundUN COMTRADE
United Nations Commodity Trade
UNCTAD United Nations Conference on Trade and Development
UNDP United Nations Development Programme
UNESCO United Nations Educational, Scientific and Cultural Organization
UNFCCC United Nations Framework Convention on Climate Change
USAID United States Agency for International Development
VAT Value Added TaxVET Vocational Education and TrainingVIIRS DNB Visible Infrared Imaging
Radiometer Suite Day/Night BandWDR World Development ReportWEF World Economic ForumWEO World Economic OutlookVMRO-DPMNE
Internal Macedonian Revolutionary Organization - Democratic Party for Macedonian National Unity
WB6 Western Balkans 6WBG World Bank GroupWDI World Development IndicatorsWBTLP Western Balkans Trade Logistics
ProjectWCO World Customs OrganizationWEF World Economic Forum
WGI Worldwide Governance IndicatorsWHO World Health OrganizationWiiW Vienna Institute for International
Economic StudiesWITS World Integrated Trade SolutionWTO World Trade Organization
FYR MACEDONIA SYSTEMATIC COUNTRY DIAGNOSTIC
xx ABBREVIATIONS AND ACRONYMS

Executive Summary
Executive Summary
FYR Macedonia stands at a turning point in its history as an independent nation. In 2018, the country took decisive steps to resolve a long-standing dispute with Greece about its official name, when the two countries reached an agreement that needs to be confirmed. Resolution of the name issue—which has been inflicting political and economic damage since 1991—is essential to consolidate FYR Macedonia’s European Union (EU) and NATO accession process and enable it to become more deeply integrated with regional and global markets.
FYR Macedonia is well-positioned to seize the opportunities that EU accession can bring. Its early market-oriented reforms, openness to trade, and prudent macroeconomic management have created an environment of economic stability that has attracted private investment and boosted exports, particularly in manufacturing. In the last two decades, its economic growth was the most stable in the Western Balkans, income per capita doubled, and the country moved from low-middle- to upper-middle-income status. Its strategic geographical location is also a major asset, given the largely untapped export potential of its agriculture and services sectors.
Seizing opportunities requires full awareness of the country’s challenges. Despite reforms, its economic growth has been lower than in peer countries, and close to 25 percent of Macedonians still live in poverty. Jobs, their main route to prosperity, are scarce: only 50 percent of working-age Macedonians is employed. Moreover, low birth rates and emigration are shrinking the workforce. In terms of governance, the country trails peers in such categories as political stability, voice and accountability, rule of law, and control of corruption—the 2015–17 political crisis is a reminder of the detrimental effects of political instability on economic growth and job creation, and the need to ensure transparent and effective rule of law. Finally, elements central to the current economic model undermine its sustainability. Though countercyclical fiscal policies helped to stimulate growth and employment, now, as fiscal buffers are dwindling, maintaining the current model of public support for growth is neither desirable nor feasible. Meanwhile, passive management of growing environmental threats like air pollution and natural hazards is jeopardizing the well-being of the population. In sum, taking full advantage of the new opportunities that arise with joining the EU will only be possible if FYR Macedonia shifts gears and makes its economy more competitive, inclusive, and sustainable. Otherwise it risks losing even more of its workforce to emigration.
Where can FYR Macedonia change how it does things? This Systematic Country Diagnostic (SCD) identifies not only opportunities for FYR Macedonia to grow faster and more inclusively, but also barriers to be dismantled, while ensuring that benefits are sustained over the long term. The SCD presents a wealth of evidence about the country’s progress in reducing poverty and advancing shared prosperity that suggests in turn policy priorities.
Three findings stand out. First, productivity—which is critical to boost growth and create more and better-paying jobs—is low and has been growing slowly. In the last decade the structure of the economy has changed little. Increased foreign direct investment (FDI) in export-oriented sectors has not created many backward links to domestic firms, and service exports represent only about 25 percent of total
FYR MACEDONIA SYSTEMATIC COUNTRY DIAGNOSTIC
xxII ExECUTIVE SUMMARY
exports. Among private firms, resources are not moving from less-productive to more-productive firms. Indeed, most jobs are in low-productivity sectors, and too many firms are small and uncompetitive. In advanced economies like the United States, the top 10 percent most productive firms are only twice as productive as firms in the bottom 10 percent; in FYR Macedonia, the top 10 percent are over 7 times more productive. Agricultural support policies exacerbate inefficiency and slow structural transformation by discouraging workers from shifting to more productive jobs, not only in agriculture, but also in industry or services. Human capital inadequacies also hinder productivity: the average worker in manufacturing and services in Europe and Central Asia is four times more productive than a Macedonian worker. Low skills are at the core of the issue: about 70 percent of Macedonian 15-year-olds fall short of basic reading and numeracy proficiency, and employers cite lack of skills as a main obstacle for doing business.
Second, social inclusion is hindered by the lack of jobs and opportunity gaps. Among working-age Macedonians (15–64 years old), the low employment rate (49 percent) results from the combination of high unemployment (16 percent of all working-age) and high inactivity (35 percent). For the unemployed, prospects are grim: over 80 percent have searched for a job for more than a year, and over 70 percent have no prior work experience. Further, with 25 percent of workers retiring between 55 and 64 years old, productive human capital is severely underutilized. As a result, over his lifetime the average Macedonian man loses about 25 potential productive years and women lose 30. Employment is critical to overcome poverty. Among the poor, unemployment is almost triple that of the nonpoor; unemployment is the main predictor of poverty, even after controlling for other individual and household characteristics. Women, youth, and ethnic minorities are more likely to be out of the labor force, unemployed, or in precarious employment. Besides the insufficient level of job creation, policy distortions and social norms create additional disincentives and barriers to accessing job opportunities. Opportunity gaps are also evident in health outcomes. Macedonian children, for example, have a higher mortality risk than those in other Western Balkan or European countries, while poor nutrition outcomes affect their ability to learn, as well as their productivity throughout the lifecycle.
Third, social, fiscal, and environmental risks may jeopardize the country’s future prosperity. Citizens’ perceptions of political accountability and the quality of public services are lower than in European peer countries and have been worsening in recent years. There is also a need to address fiscal risks: between 2008 and 2017 a lack of adequate fiscal discipline led to the doubling of public debt; without reforms, public debt will expand, as so will financing needs. The pension deficit is now over 4 percent of GDP, and the accumulation of public sector arrears is a complex and recurrent issue that threatens fiscal sustainability. Inefficiencies in public spending suggest there is ample potential to improve resource allocation. Finally, growing environmental threats imply high economic costs, both present and future. Every year air pollution, caused mostly by fossil fuels, generates losses equivalent to 3.2 percent of GDP. Meanwhile, the combination of high exposure and low resilience to natural hazards, which are being amplified by climate change, is expected to cause damages to critical infrastructure that can be expected to grow exponentially. Reinforcing emergency preparedness and other aspects of resilience is ever more urgent.
What will it take for FYR Macedonia to take charge of its future? Through an iterative process of evidence-gathering and stakeholder consultations, the SCD aims to inform government, civil society, representatives of the private sector, and development partners by mapping a sequence of policy options to increase productivity, enhance universal access to job opportunities, and achieve sustainability
SEIZING A BRIGHTER FUTURE FOR ALL
xxIIIExECUTIVE SUMMARY
through effective governance, fiscal prudence, and environmental resilience. These options are grouped in 10 priority areas. For all policy actions the SCD discusses the expected impact and the synergies they create.
1. Secure rule of law and build capable public institutions that are accountable to citizens. A commitment to greater public sector transparency and accountability, a well-defined rule of law respected by all and that serves all equally, and a qualified bureaucracy encouraged to take calculated risks without being punished for failure, would build social trust while improving the business environment and the delivery of public services
2. Endow people with quality and relevant skills throughout the life cycle. Human capital is the country’s main asset, but there is an urgent need to improve its quantity and quality. Investments in early childhood development will ensure school readiness. Better primary, secondary, and tertiary teaching methods will help build critical thinking skills. Quality assurance mechanisms can monitor learning outcomes to assure job-readiness for graduates, especially by facilitating early exposure to the work environment.
3. Strengthen firm capabilities and the ecosystem for technology adoption and access of firms to finance. FYR Macedonia has untapped opportunities to expand trade in both goods and such services as tourism, logistics, information technology, and healthcare. But firms need to be ready to compete in a global market. Programs that support domestic firms—especially smaller ones—to adopt international quality standards and update their management skills would help them access funding, improve their operations, and integrate into value chains.
4. Enhance trade connectivity and value chain integration. On “hard” connectivity, major progress has been achieved in building transport infrastructure; now the need is to complete the main corridors and rebalance spending to invest in maintenance and road safety to protect physical and human capital. “Soft” connectivity also demands attention: streamlining procedures, upgrading customs systems, and coordinating the activities of export-related agencies will forge closer links between export-oriented FDI-firms and domestic firms.
5. Promote market competition and establish a world-class business climate. On paper the Macedonian competition regulations and institutions follow the EU model. In practice, however, there are gaps that create an uneven playing field. Making competition policy more effective by strengthening public sector neutrality, promoting private entry into network industries, and removing barriers to competition in professional services will enhance productivity. Meanwhile, FYR Macedonia can build on its solid track record of reform to enhance the quality and predictability of business regulation.
6. Reduce disincentives and remove barriers to labor market participation, especially for women. Expanding access to quality child and elder care, revising family leave policies, and working to counter traditional social norms and other barriers would give more women in their most productive years the opportunity to work. Better designed tax rates, social benefits, and labor regulations can heighten incentives to work, always keeping in mind the need to carefully balance fairness and flexibility.
FYR MACEDONIA SYSTEMATIC COUNTRY DIAGNOSTIC
xxIV ExECUTIVE SUMMARY
7. Ensure fiscal sustainability by reducing fiscal risks, improving the efficiency of spending, and enhancing revenue mobilization. Reining in pension spending, better controlling the debt of state-owned enterprises, enforcing discipline in local government financial management, improving the efficiency of public spending, and raising tax collection would ensure better public services and provide buffers as needed to stimulate economic activity in times of need.
8. Invest in an integrated strategy to reduce air pollution, promote low-carbon growth, and build resilience to natural hazards and climate change. To counter the dire threat to public health created by air pollution, state-of-the-art technologies and firmer enforcement are needed to ensure compliance with regulations. Reducing dependence on coal; making the energy supply more efficient, and more secure; and investing more in renewable energy would help curb carbon emissions. Crafting national programs and policies to reduce climate and disaster impacts in priority sectors is the first step to reducing risks to infrastructure; these efforts should be supported by advances in emergency response systems. Managing water resources more efficiently by rehabilitating aging infrastructure would help to avoid worsening water scarcity.
9. Protect human capital by shielding poor and vulnerable households from shocks and investing in preventive medicine and primary care. Better-targeted social assistance, expanded social services, better-quality health care, and promotion of healthier lifestyles together would help shield poor and vulnerable households from shocks and improve health standards. There is an urgent need to build up primary health care, especially for children, and increase the productive life span of all Macedonians.
10. Foster agricultural modernization. A well-functioning agricultural sector can foster sustainable use of resources and become an economic engine for rural areas. For this, a more effective land market is needed to improve the intensity of physical capital use and technology adoption in agriculture and agribusiness. That will in turn spur farmer productivity and export-readiness. An urgent priority is to revise state aid to agriculture, which currently distorts the allocation of resources and reduces technological improvements.
FYR Macedonia can use the EU accession process to advance and sustain many of these priorities. The country needs to be ready to compete with its EU peers on an equal footing. The most successful new EU members have frontloaded the EU’s Acquis to modernize institutions and hedge against the risk of policy slippage. Importantly, special attention will be needed to advance priorities that the EU Acquis may not fully cover. For instance, education, workforce skills, and firm capabilities in FYR Macedonia are likely to require attention beyond the Acquis, although the EU and international financial institutions are well-positioned to help.
The success of FYR Macedonia’s economic policy will depend on its ability to hold to a steady reform course. Individuals and businesses planning for the long term will benefit from an environment of stability and trust. Difficult times will come. A clear strategy based on a shared political vision and public awareness will ensure that daily political firefighting does not dilute reform momentum.
SEIZING A BRIGHTER FUTURE FOR ALL
xxVExECUTIVE SUMMARY

FYR Macedonia Systematic Country Diagnostic | Seizing a Brighter Future for All
FYR Macedonia Systematic Country Diagnostic | Seizing a Brighter Future for All
Overview of the Diagnostic
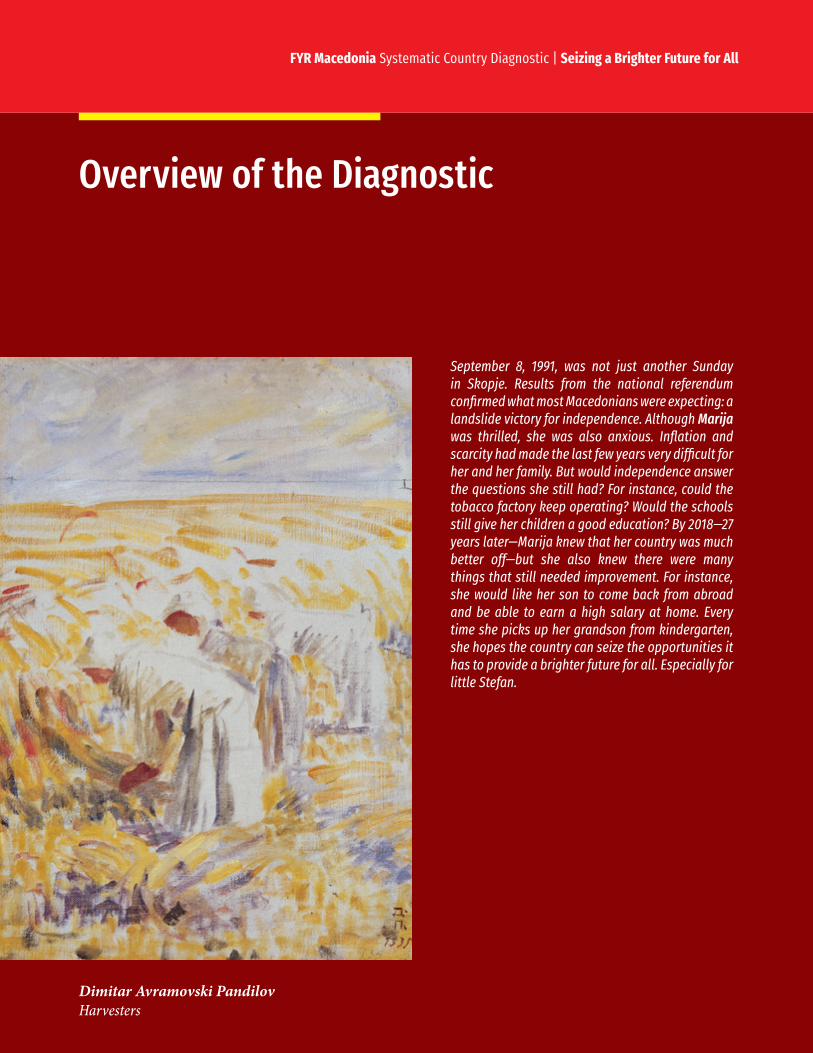
September 8, 1991, was not just another Sunday in Skopje. Results from the national referendum confirmed what most Macedonians were expecting: a landslide victory for independence. Although Marija was thrilled, she was also anxious. Inflation and scarcity had made the last few years very difficult for her and her family. But would independence answer the questions she still had? For instance, could the tobacco factory keep operating? Would the schools still give her children a good education? By 2018—27 years later—Marija knew that her country was much better off—but she also knew there were many things that still needed improvement. For instance, she would like her son to come back from abroad and be able to earn a high salary at home. Every time she picks up her grandson from kindergarten, she hopes the country can seize the opportunities it has to provide a brighter future for all. Especially for little Stefan.
Dimitar Avramovski PandilovHarvesters

Overview of the Diagnostic
i. The Former Yugoslav Republic (FYR) of Macedonia aspires to reach the living standards of the European Union (EU) with a robust middle-class society and access to economic opportunity for all its citizens. Though ambitious, it is not unrealistic to think that in just over two decades, by its 50th anniversary in 2041, FYR Macedonia will have made substantive progress in closing the gap in living standards with EU countries. Similarly, the country may well celebrate its 50th anniversary having equalized opportunities for all citizens, regardless of their location, gender, ethnicity, age, or other personal characteristics. To achieve these noncontroversial goals, however, it must re-think its current development approach, which so far has delivered only modest results in terms of GDP growth, poverty reduction, and the consolidation of the middle class. Instead, the approach since independence has eroded the fiscal space for government delivery of quality public goods and services; it has diminished the trust of citizens in the state; and environmental threats are becoming increasingly acute.
ii. This Systematic Country Diagnostic (SCD) identifies three mutually reinforcing pathways for FYR Macedonia to sustainably accelerate growth, reduce poverty, and consolidate the middle class. An examination of the country’s progress in the 27 years of its independence reveals three strategic pathways for FYR Macedonia to overcome its development challenges and leverage new opportunities. The first is to foster a more dynamic and competitive private sector. The second is to build up human capital to be more competitive and adaptive and close opportunity gaps. And the third is to achieve sustainability through effective governance, fiscal prudence, and enhanced environmental management and resilience to natural hazards. Embarking on these strategic pathways would help sustain the robust and inclusive growth necessary to eliminate extreme poverty—a goal FYR Macedonia can achieve within the next decade—and promote shared prosperity. This SCD identifies short- and medium-term policy priorities to help FYR Macedonia achieve its long-term vision.
0.1 A Determined Start in a Difficult Context
iii. FYR Macedonia’s development challenges and opportunities are rooted in its history and geography. As a small, landlocked country, it depends on close relationships with its neighbors to access larger markets. In addition to its small size, high transportation and transaction costs create barriers to international trade. The history of conflict and instability has tarnished the image of the Western Balkans region as a destination for international investors, and these spillover reputational effects have been costly for FYR Macedonia. Moreover, other neighbors like Bulgaria and Greece and important trading partners like Italy were hit hard by the 2008–09 global financial crisis, which depressed external demand for Macedonian products. Yet, geography also represents considerable opportunity: While FYR Macedonia lacks natural resources that can be easily exported, the export potential of its agriculture and services is largely untapped, and its strategic location at the heart of the Western Balkans could enable it to become an overland logistics hub for the sub-region.
iv. The country’s early transition to a market-oriented economy took place in exceptionally difficult circumstances. While FYR Macedonia largely avoided the violence that afflicted other former Yugoslav
FYR MACEDONIA SYSTEMATIC COUNTRY DIAGNOSTIC
O-2 OVERVIEW OF THE DIAGNOSTIC
republics, economic sanctions on Serbia closed the border with what was then FYR Macedonia’s most important trading partner, while a controversy with Greece over the name of the newly independent nation closed its southern border, cutting off FYR Macedonia’s access to the nearest seaport. The new government had no international reserves, and as it struggled to stabilize its new currency the country had to deal with hyperinflation inherited from the Yugoslav economy. The disruption of former chains of production and the loss of markets forced numerous Macedonian firms to close, so that unemployment rose and living standards deteriorated.
v. Despite its difficult initial circumstances, for over a decade FYR Macedonia undertook market-oriented reforms and kept its macroeconomic policy stable. The country swiftly moved to promote trade openness, privatization, and price liberalization, enabling it to transition to a market economy faster than its Western Balkan neighbors. The government prioritized the signing of trade agreements such as the Central European Free Trade Agreement (CEFTA), and accession to the World Trade Organization (WTO) and EU membership were clearly articulated as national objectives. By 1996, the government had stabilized the economy, and its commitment to fiscal responsibility and sound macroeconomic management bolstered its resilience to subsequent economic shocks, even the global financial crisis. After an initially difficult shift from state planning to a market-driven economy, the following decades were marked by resurgent growth and rising incomes. By 2006, per capita GDP had recovered to its pre-independence level, and in 2008 FYR Macedonia reached upper-middle-income status.
vi. With successive administrations all committed to a market-friendly vision of the future, FYR Macedonia has seen international indicators of the business climate rise considerably. Major regulatory reforms have made it much easier to start and expand a business. In the 2018 Doing Business report, FYR Macedonia ranked 11th of 190 countries ease of doing business and 2nd in the Europe and Central Asia (ECA) region. Meanwhile, an ambitious strategy to attract foreign direct investment (FDI) helped increase the volume and sophistication of Macedonian exports, diversify the country’s export basket, and create jobs. In recent years, FYR Macedonia has outperformed peer countries in attracting greenfield FDI, and in 2017, of 94 countries it received the 3rd largest amount of greenfield FDI per capita.1
0.2 Progress, though Modest, on Economic, Social, and Environmental Goals
vii. For the past two decades, however, economic growth has been too small to narrow the income gap with the EU average. Since the mid-1990s, the economy has grown more slowly in FYR Macedonia than in many comparable countries, delaying its convergence with EU income levels.2 For example, using Germany’s GDP as a benchmark, in 1995 FYR Macedonia‘s economy was about the same size as Latvia’s (Figure O.1); but in 2017 Latvia’s GDP per capita was about twice as high as that of FYR Macedonia (US$13,600). The implications of growth are staggering: Since 2000, FYR Macedonia’s annual GDP
1 Source: fDI Intelligence, 2018. “Greenfield FDI” refers to investments where the parent company builds its operations in the host country from the ground up, constructing production facilities, distribution hubs, offices, or living quarters.
2 This SCD benchmarks FYR Macedonia’s performance against that of “structural peers” (Albania, Bosnia and Herzegovina, Georgia, Jamaica, Jordan, Mauritius, Paraguay, and Serbia) and “aspirational peers” (Bulgaria, Croatia, Estonia, Latvia, Lithuania, the Slovak Republic, and Slovenia). See Annex 1 for the criteria for selecting structural and aspirational peers. Annex 2 presents a benchmarking analysis that assesses FYR Macedonia’s performance across a wide range of development indicators vis-à-vis countries with similar levels of income, both in ECA and globally.
SEIZING A BRIGHTER FUTURE FOR ALL
O-3OVERVIEW OF THE DIAGNOSTIC
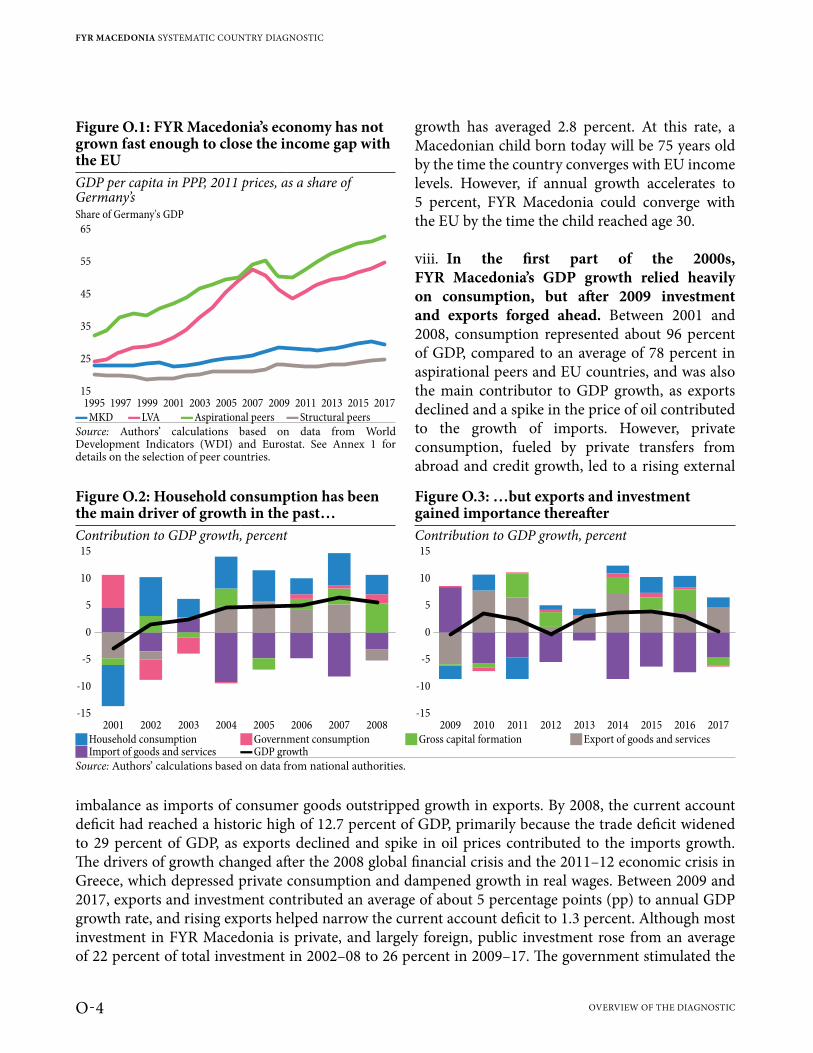
growth has averaged 2.8 percent. At this rate, a Macedonian child born today will be 75 years old by the time the country converges with EU income levels. However, if annual growth accelerates to 5 percent, FYR Macedonia could converge with the EU by the time the child reached age 30.
viii. In the first part of the 2000s, FYR Macedonia’s GDP growth relied heavily on consumption, but after 2009 investment and exports forged ahead. Between 2001 and 2008, consumption represented about 96 percent of GDP, compared to an average of 78 percent in aspirational peers and EU countries, and was also the main contributor to GDP growth, as exports declined and a spike in the price of oil contributed to the growth of imports. However, private consumption, fueled by private transfers from abroad and credit growth, led to a rising external
imbalance as imports of consumer goods outstripped growth in exports. By 2008, the current account deficit had reached a historic high of 12.7 percent of GDP, primarily because the trade deficit widened to 29 percent of GDP, as exports declined and spike in oil prices contributed to the imports growth. The drivers of growth changed after the 2008 global financial crisis and the 2011–12 economic crisis in Greece, which depressed private consumption and dampened growth in real wages. Between 2009 and 2017, exports and investment contributed an average of about 5 percentage points (pp) to annual GDP growth rate, and rising exports helped narrow the current account deficit to 1.3 percent. Although most investment in FYR Macedonia is private, and largely foreign, public investment rose from an average of 22 percent of total investment in 2002–08 to 26 percent in 2009–17. The government stimulated the
Figure O.1: FYR Macedonia’s economy has not grown fast enough to close the income gap with the EUGDP per capita in PPP, 2011 prices, as a share of Germany’sShare of Germany's GDP
65
55
45
35
25
15
1995 1997 1999 20032001 20072005 20172009 20132011 2015
▬MKD ▬LVA ▬Aspirational peers ▬Structural peersSource: Authors’ calculations based on data from World Development Indicators (WDI) and Eurostat. See Annex 1 for details on the selection of peer countries.
Figure O.2: Household consumption has been the main driver of growth in the past…
Figure O.3: …but exports and investment gained importance thereafter
Contribution to GDP growth, percent Contribution to GDP growth, percent15
10
5
0
-5
-10
-15
2001 2002 2003 20052004 20072006 2008
15
10
5
0
-5
-10
-15
2009 2010 2011 20132012 2015 20162014 2017
JHousehold consumption JGovernment consumption JGross capital formation JExport of goods and services J Import of goods and services ▬GDP growth
Source: Authors’ calculations based on data from national authorities.
FYR MACEDONIA SYSTEMATIC COUNTRY DIAGNOSTIC
O-4 OVERVIEW OF THE DIAGNOSTIC
economy by investing primarily in roads and civil construction projects, which went up from 28 percent of total public investment to 43 percent. Personal consumption recovered after 2013 as employment improved, real wages increased and disposable income went up, due in part also to higher pensions and subsidies. FDI in the motor vehicles and electric machinery industries boosted total exports to 55 percent of GDP in 2017 (22 pp higher than in 2000), and there is ample room for improvement while exports as a percent of GDP in FYR Macedonia are lower than in aspirational countries, where exports exceed 80 percent of GDP.
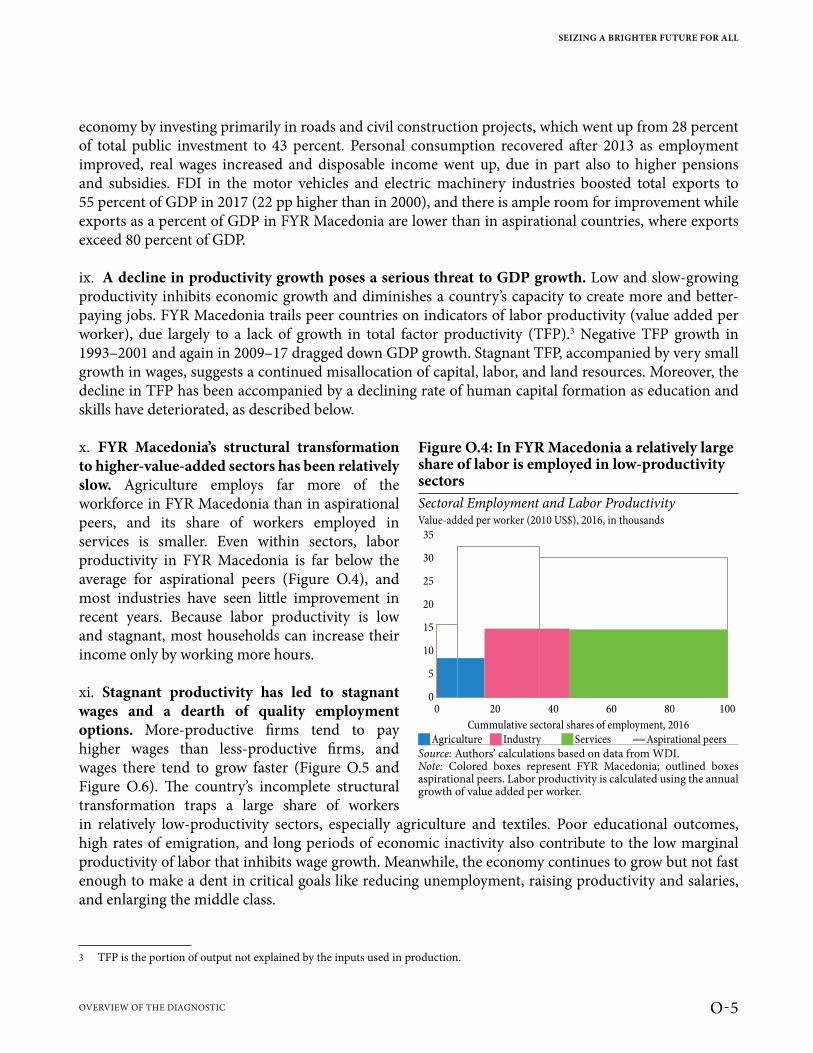
ix. A decline in productivity growth poses a serious threat to GDP growth. Low and slow-growing productivity inhibits economic growth and diminishes a country’s capacity to create more and better-paying jobs. FYR Macedonia trails peer countries on indicators of labor productivity (value added per worker), due largely to a lack of growth in total factor productivity (TFP).3 Negative TFP growth in 1993–2001 and again in 2009–17 dragged down GDP growth. Stagnant TFP, accompanied by very small growth in wages, suggests a continued misallocation of capital, labor, and land resources. Moreover, the decline in TFP has been accompanied by a declining rate of human capital formation as education and skills have deteriorated, as described below.
x. FYR Macedonia’s structural transformation to higher-value-added sectors has been relatively slow. Agriculture employs far more of the workforce in FYR Macedonia than in aspirational peers, and its share of workers employed in services is smaller. Even within sectors, labor productivity in FYR Macedonia is far below the average for aspirational peers (Figure O.4), and most industries have seen little improvement in recent years. Because labor productivity is low and stagnant, most households can increase their income only by working more hours.
xi. Stagnant productivity has led to stagnant wages and a dearth of quality employment options. More-productive firms tend to pay higher wages than less-productive firms, and wages there tend to grow faster (Figure O.5 and Figure O.6). The country’s incomplete structural transformation traps a large share of workers in relatively low-productivity sectors, especially agriculture and textiles. Poor educational outcomes, high rates of emigration, and long periods of economic inactivity also contribute to the low marginal productivity of labor that inhibits wage growth. Meanwhile, the economy continues to grow but not fast enough to make a dent in critical goals like reducing unemployment, raising productivity and salaries, and enlarging the middle class.
3 TFP is the portion of output not explained by the inputs used in production.
Figure O.4: In FYR Macedonia a relatively large share of labor is employed in low-productivity sectorsSectoral Employment and Labor ProductivityValue-added per worker (2010 US$), 2016, in thousands
30
25
20
15
10
5
0
0 20 40 60 80 100
35
Cummulative sectoral shares of employment, 2016 JAgriculture J Industry JServices ▬Aspirational peers
Source: Authors’ calculations based on data from WDI.Note: Colored boxes represent FYR Macedonia; outlined boxes aspirational peers. Labor productivity is calculated using the annual growth of value added per worker.
SEIZING A BRIGHTER FUTURE FOR ALL
O-5OVERVIEW OF THE DIAGNOSTIC
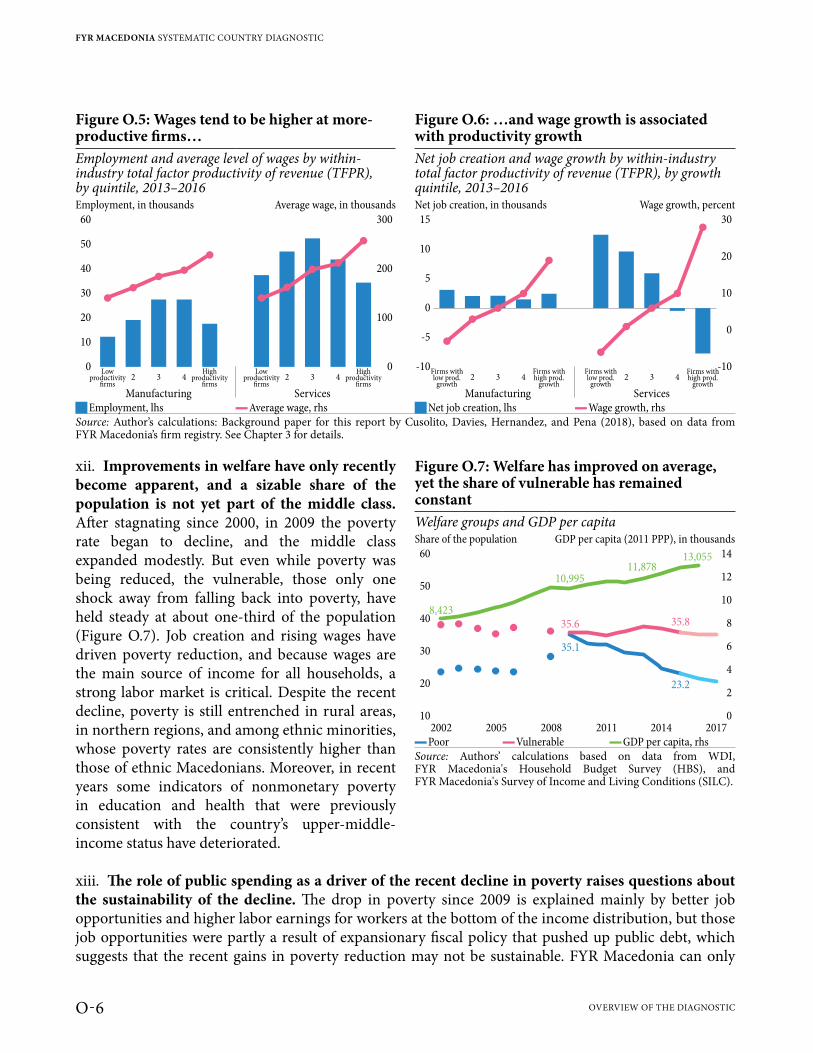
xii. Improvements in welfare have only recently become apparent, and a sizable share of the population is not yet part of the middle class. After stagnating since 2000, in 2009 the poverty rate began to decline, and the middle class expanded modestly. But even while poverty was being reduced, the vulnerable, those only one shock away from falling back into poverty, have held steady at about one-third of the population (Figure O.7). Job creation and rising wages have driven poverty reduction, and because wages are the main source of income for all households, a strong labor market is critical. Despite the recent decline, poverty is still entrenched in rural areas, in northern regions, and among ethnic minorities, whose poverty rates are consistently higher than those of ethnic Macedonians. Moreover, in recent years some indicators of nonmonetary poverty in education and health that were previously consistent with the country’s upper-middle-income status have deteriorated.
xiii. The role of public spending as a driver of the recent decline in poverty raises questions about the sustainability of the decline. The drop in poverty since 2009 is explained mainly by better job opportunities and higher labor earnings for workers at the bottom of the income distribution, but those job opportunities were partly a result of expansionary fiscal policy that pushed up public debt, which suggests that the recent gains in poverty reduction may not be sustainable. FYR Macedonia can only
Figure O.5: Wages tend to be higher at more-productive firms…
Figure O.6: …and wage growth is associated with productivity growth
Employment and average level of wages by within-industry total factor productivity of revenue (TFPR), by quintile, 2013–2016
Net job creation and wage growth by within-industry total factor productivity of revenue (TFPR), by growth quintile, 2013–2016
Employment, in thousands Average wage, in thousands Net job creation, in thousands Wage growth, percent60
50
300
40 200
30
10020
10
0 0
2 3 4Low
productivityfirms
Lowproductivity
firms
Highproductivity
firms
Highproductivity
firms
2 3 4
Manufacturing Services
15 30
1020
5
10
0
-50
-10 -102 3 4 2 3 4
Manufacturing Services
Firms withlow prod.
growth
Firms withlow prod.
growth
Firms withhigh prod.
growth
Firms withhigh prod.
growth
JEmployment, lhs ▬Average wage, rhs JNet job creation, lhs ▬Wage growth, rhsSource: Author’s calculations: Background paper for this report by Cusolito, Davies, Hernandez, and Pena (2018), based on data from FYR Macedonia’s firm registry. See Chapter 3 for details.
Figure O.7: Welfare has improved on average, yet the share of vulnerable has remained constantWelfare groups and GDP per capitaShare of the population GDP per capita (2011 PPP), in thousands
60 14
12
10
8
6
50
40
4
202
10 0
2002 2005 2008 2011 2014 2017
30
8,423
10,995
11,878
13,055
35.6
35.1
35.8
23.2
▬Poor ▬Vulnerable ▬GDP per capita, rhsSource: Authors’ calculations based on data from WDI, FYR Macedonia's Household Budget Survey (HBS), and FYR Macedonia's Survey of Income and Living Conditions (SILC).
FYR MACEDONIA SYSTEMATIC COUNTRY DIAGNOSTIC
O-6 OVERVIEW OF THE DIAGNOSTIC
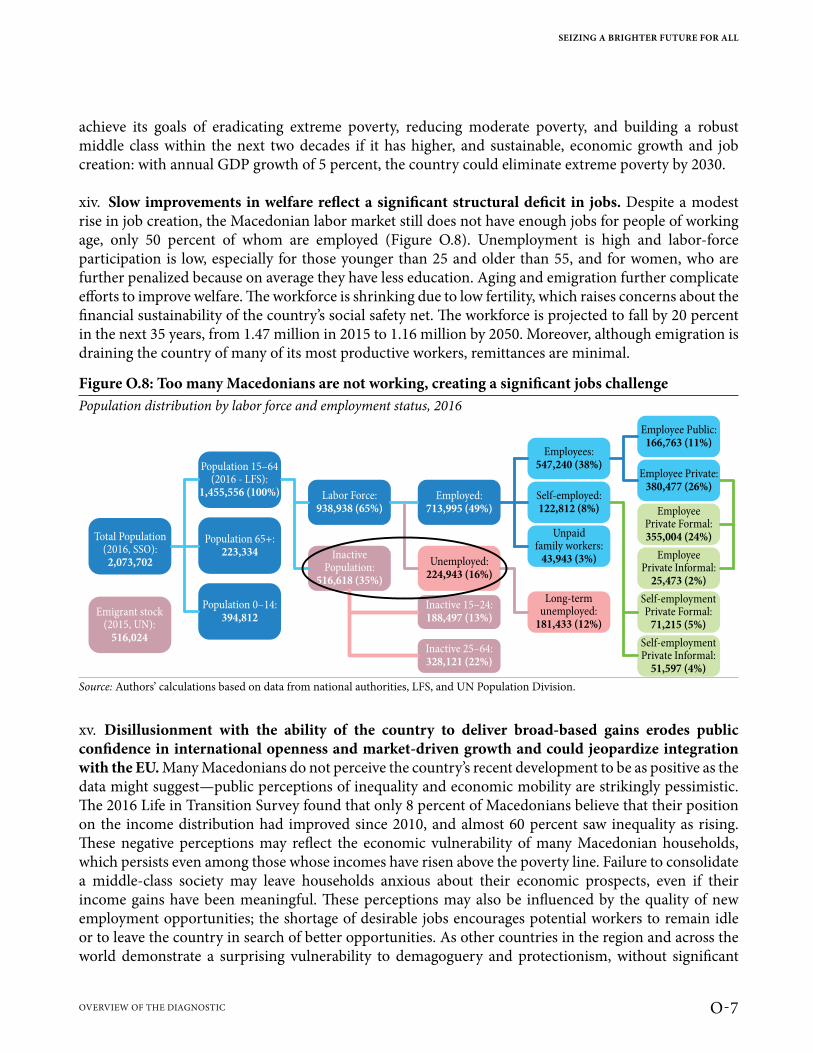
achieve its goals of eradicating extreme poverty, reducing moderate poverty, and building a robust middle class within the next two decades if it has higher, and sustainable, economic growth and job creation: with annual GDP growth of 5 percent, the country could eliminate extreme poverty by 2030.
xiv. Slow improvements in welfare reflect a significant structural deficit in jobs. Despite a modest rise in job creation, the Macedonian labor market still does not have enough jobs for people of working age, only 50 percent of whom are employed (Figure O.8). Unemployment is high and labor-force participation is low, especially for those younger than 25 and older than 55, and for women, who are further penalized because on average they have less education. Aging and emigration further complicate efforts to improve welfare. The workforce is shrinking due to low fertility, which raises concerns about the financial sustainability of the country’s social safety net. The workforce is projected to fall by 20 percent in the next 35 years, from 1.47 million in 2015 to 1.16 million by 2050. Moreover, although emigration is draining the country of many of its most productive workers, remittances are minimal.
xv. Disillusionment with the ability of the country to deliver broad-based gains erodes public confidence in international openness and market-driven growth and could jeopardize integration with the EU. Many Macedonians do not perceive the country’s recent development to be as positive as the data might suggest—public perceptions of inequality and economic mobility are strikingly pessimistic. The 2016 Life in Transition Survey found that only 8 percent of Macedonians believe that their position on the income distribution had improved since 2010, and almost 60 percent saw inequality as rising. These negative perceptions may reflect the economic vulnerability of many Macedonian households, which persists even among those whose incomes have risen above the poverty line. Failure to consolidate a middle-class society may leave households anxious about their economic prospects, even if their income gains have been meaningful. These perceptions may also be influenced by the quality of new employment opportunities; the shortage of desirable jobs encourages potential workers to remain idle or to leave the country in search of better opportunities. As other countries in the region and across the world demonstrate a surprising vulnerability to demagoguery and protectionism, without significant
Figure O.8: Too many Macedonians are not working, creating a significant jobs challengePopulation distribution by labor force and employment status, 2016
Total Population(2016, SSO):
2,073,702
Emigrant stock(2015, UN):
516,024
Population 15–64(2016 - LFS):
1,455,556 (100%)
Population 65+:223,334
Labor Force:938,938 (65%)
InactivePopulation:
516,618 (35%)
Employed:713,995 (49%)
Unemployed:224,943 (16%)
Long-termunemployed:
181,433 (12%)
Inactive 15–24:188,497 (13%)
Inactive 25–64:328,121 (22%)
Employee Public:166,763 (11%)
Employee Private:380,477 (26%)
Employees:547,240 (38%)
Self-employed:122,812 (8%)
Unpaidfamily workers:
43,943 (3%)
Population 0–14:394,812
EmployeePrivate Formal:355,004 (24%)
EmployeePrivate Informal:
25,473 (2%)
Self-employmentPrivate Formal:
71,215 (5%)
Self-employmentPrivate Informal:
51,597 (4%)
Source: Authors’ calculations based on data from national authorities, LFS, and UN Population Division.
SEIZING A BRIGHTER FUTURE FOR ALL
O-7OVERVIEW OF THE DIAGNOSTIC
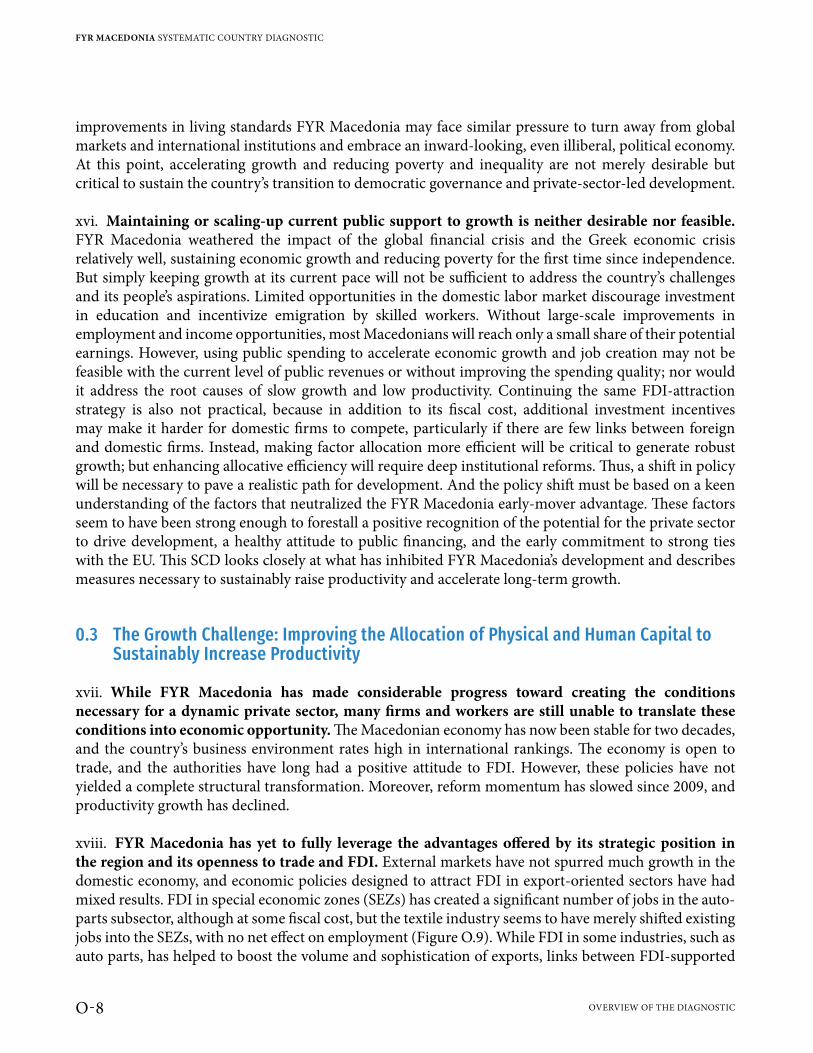
improvements in living standards FYR Macedonia may face similar pressure to turn away from global markets and international institutions and embrace an inward-looking, even illiberal, political economy. At this point, accelerating growth and reducing poverty and inequality are not merely desirable but critical to sustain the country’s transition to democratic governance and private-sector-led development.
xvi. Maintaining or scaling-up current public support to growth is neither desirable nor feasible. FYR Macedonia weathered the impact of the global financial crisis and the Greek economic crisis relatively well, sustaining economic growth and reducing poverty for the first time since independence. But simply keeping growth at its current pace will not be sufficient to address the country’s challenges and its people’s aspirations. Limited opportunities in the domestic labor market discourage investment in education and incentivize emigration by skilled workers. Without large-scale improvements in employment and income opportunities, most Macedonians will reach only a small share of their potential earnings. However, using public spending to accelerate economic growth and job creation may not be feasible with the current level of public revenues or without improving the spending quality; nor would it address the root causes of slow growth and low productivity. Continuing the same FDI-attraction strategy is also not practical, because in addition to its fiscal cost, additional investment incentives may make it harder for domestic firms to compete, particularly if there are few links between foreign and domestic firms. Instead, making factor allocation more efficient will be critical to generate robust growth; but enhancing allocative efficiency will require deep institutional reforms. Thus, a shift in policy will be necessary to pave a realistic path for development. And the policy shift must be based on a keen understanding of the factors that neutralized the FYR Macedonia early-mover advantage. These factors seem to have been strong enough to forestall a positive recognition of the potential for the private sector to drive development, a healthy attitude to public financing, and the early commitment to strong ties with the EU. This SCD looks closely at what has inhibited FYR Macedonia’s development and describes measures necessary to sustainably raise productivity and accelerate long-term growth.
0.3 The Growth Challenge: Improving the Allocation of Physical and Human Capital to Sustainably Increase Productivity
xvii. While FYR Macedonia has made considerable progress toward creating the conditions necessary for a dynamic private sector, many firms and workers are still unable to translate these conditions into economic opportunity. The Macedonian economy has now been stable for two decades, and the country’s business environment rates high in international rankings. The economy is open to trade, and the authorities have long had a positive attitude to FDI. However, these policies have not yielded a complete structural transformation. Moreover, reform momentum has slowed since 2009, and productivity growth has declined.
xviii. FYR Macedonia has yet to fully leverage the advantages offered by its strategic position in the region and its openness to trade and FDI. External markets have not spurred much growth in the domestic economy, and economic policies designed to attract FDI in export-oriented sectors have had mixed results. FDI in special economic zones (SEZs) has created a significant number of jobs in the auto-parts subsector, although at some fiscal cost, but the textile industry seems to have merely shifted existing jobs into the SEZs, with no net effect on employment (Figure O.9). While FDI in some industries, such as auto parts, has helped to boost the volume and sophistication of exports, links between FDI-supported
FYR MACEDONIA SYSTEMATIC COUNTRY DIAGNOSTIC
O-8 OVERVIEW OF THE DIAGNOSTIC
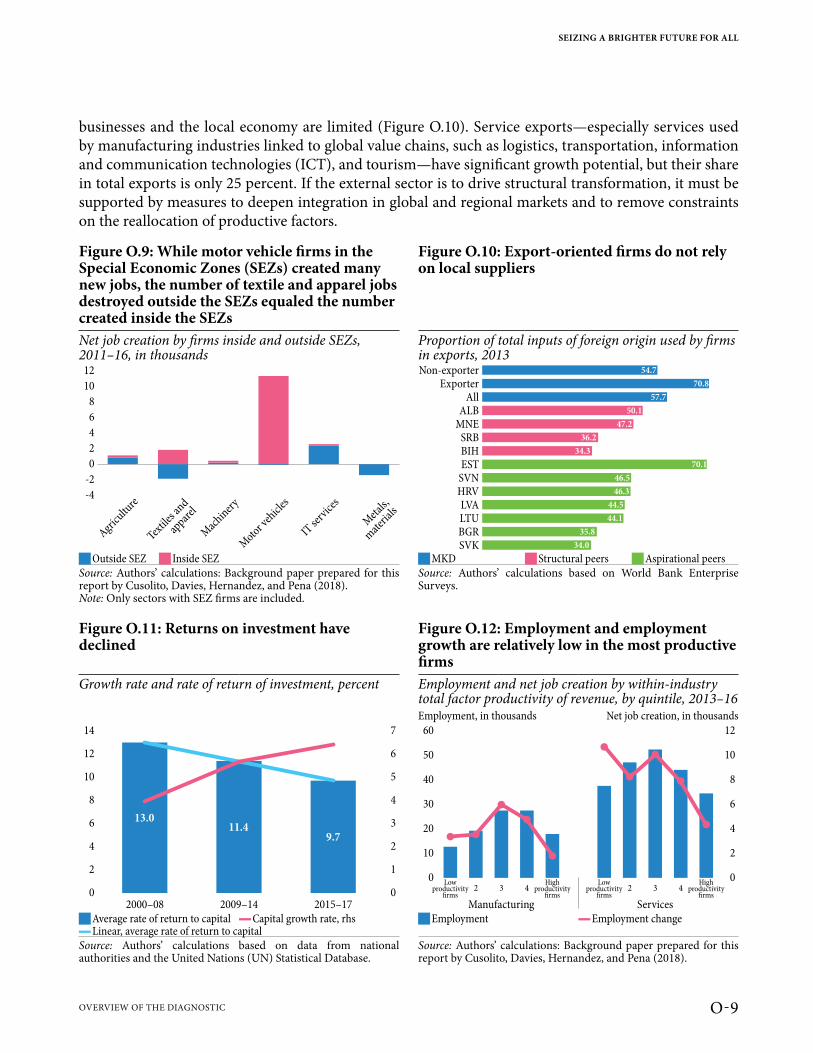
businesses and the local economy are limited (Figure O.10). Service exports—especially services used by manufacturing industries linked to global value chains, such as logistics, transportation, information and communication technologies (ICT), and tourism—have significant growth potential, but their share in total exports is only 25 percent. If the external sector is to drive structural transformation, it must be supported by measures to deepen integration in global and regional markets and to remove constraints on the reallocation of productive factors.
Figure O.9: While motor vehicle firms in the Special Economic Zones (SEZs) created many new jobs, the number of textile and apparel jobs destroyed outside the SEZs equaled the number created inside the SEZs
Figure O.10: Export-oriented firms do not rely on local suppliers
Net job creation by firms inside and outside SEZs, 2011–16, in thousands
Proportion of total inputs of foreign origin used by firms in exports, 2013
12
10
8
6
4
2
0
-2
-4
Agricultu
re
Textil
es an
d
appar
el
Moto
r veh
icles
IT se
rvice
s
Met
als,
mat
erial
s
Mac
hiner
y
Non-ex orterpExporter
AllALB
MNESRBBIHEST
SVN
BGRSVK
HRVLVALTU
57.7
70.8
5 .74
50.1
47.2
36.2
34.3
70.1
46.5
46.3
44.5
44.1
35.8
34.0
JOutside SEZ J Inside SEZ JMKD JStructural peers JAspirational peersSource: Authors’ calculations: Background paper prepared for this report by Cusolito, Davies, Hernandez, and Pena (2018).Note: Only sectors with SEZ firms are included.
Source: Authors’ calculations based on World Bank Enterprise Surveys.
Figure O.11: Returns on investment have declined
Figure O.12: Employment and employment growth are relatively low in the most productive firms
Growth rate and rate of return of investment, percent Employment and net job creation by within-industry total factor productivity of revenue, by quintile, 2013–16Employment, in thousands Net job creation, in thousands
14 7
12 6
10 5
8 4
6 3
4 2
2 1
0 0
2000–08 2009–14 2015–17
11.413.0
9.7
60 12
50 10
40 8
30 6
20 4
10 2
0 0
2 3 4 2 3 4
Manufacturing Services
Lowproductivity
firms
Lowproductivity
firms
Highproductivity
firms
Highproductivity
firms
JAverage rate of return to capital ▬Capital growth rate, rhs JEmployment ▬Employment change ▬Linear, average rate of return to capital
Source: Authors’ calculations based on data from national authorities and the United Nations (UN) Statistical Database.
Source: Authors’ calculations: Background paper prepared for this report by Cusolito, Davies, Hernandez, and Pena (2018).
SEIZING A BRIGHTER FUTURE FOR ALL
O-9OVERVIEW OF THE DIAGNOSTIC
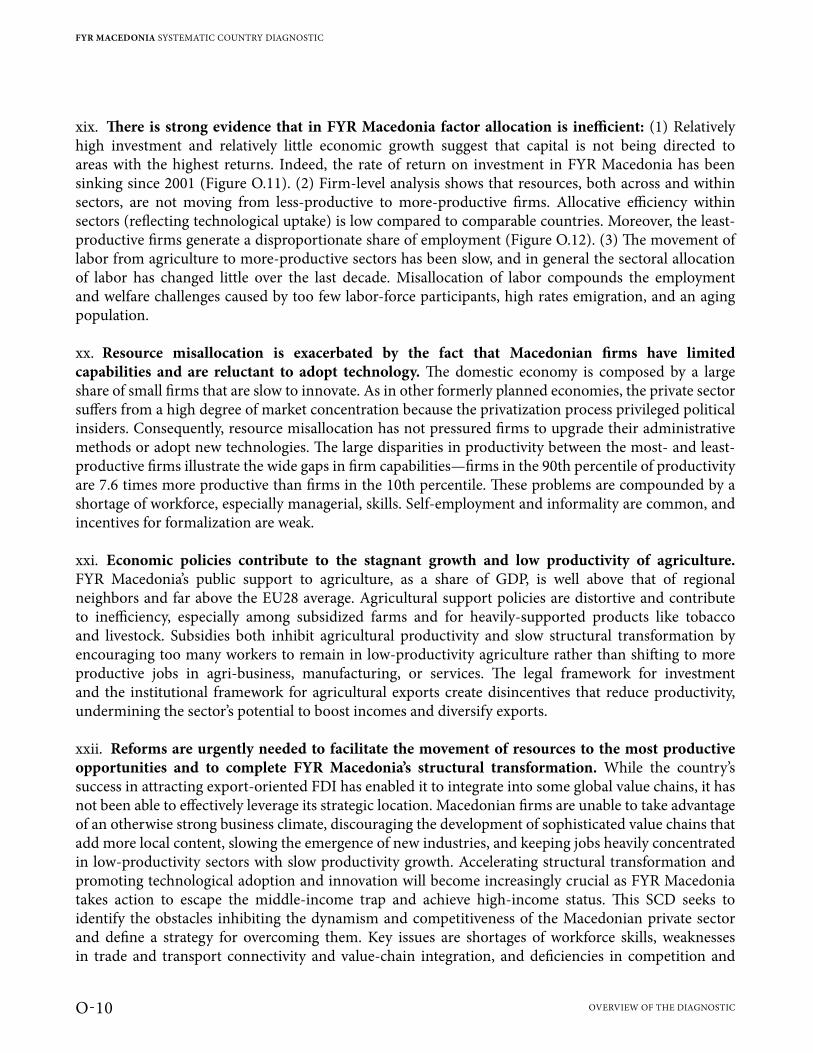
xix. There is strong evidence that in FYR Macedonia factor allocation is inefficient: (1) Relatively high investment and relatively little economic growth suggest that capital is not being directed to areas with the highest returns. Indeed, the rate of return on investment in FYR Macedonia has been sinking since 2001 (Figure O.11). (2) Firm-level analysis shows that resources, both across and within sectors, are not moving from less-productive to more-productive firms. Allocative efficiency within sectors (reflecting technological uptake) is low compared to comparable countries. Moreover, the least-productive firms generate a disproportionate share of employment (Figure O.12). (3) The movement of labor from agriculture to more-productive sectors has been slow, and in general the sectoral allocation of labor has changed little over the last decade. Misallocation of labor compounds the employment and welfare challenges caused by too few labor-force participants, high rates emigration, and an aging population.
xx. Resource misallocation is exacerbated by the fact that Macedonian firms have limited capabilities and are reluctant to adopt technology. The domestic economy is composed by a large share of small firms that are slow to innovate. As in other formerly planned economies, the private sector suffers from a high degree of market concentration because the privatization process privileged political insiders. Consequently, resource misallocation has not pressured firms to upgrade their administrative methods or adopt new technologies. The large disparities in productivity between the most- and least-productive firms illustrate the wide gaps in firm capabilities—firms in the 90th percentile of productivity are 7.6 times more productive than firms in the 10th percentile. These problems are compounded by a shortage of workforce, especially managerial, skills. Self-employment and informality are common, and incentives for formalization are weak.
xxi. Economic policies contribute to the stagnant growth and low productivity of agriculture. FYR Macedonia’s public support to agriculture, as a share of GDP, is well above that of regional neighbors and far above the EU28 average. Agricultural support policies are distortive and contribute to inefficiency, especially among subsidized farms and for heavily-supported products like tobacco and livestock. Subsidies both inhibit agricultural productivity and slow structural transformation by encouraging too many workers to remain in low-productivity agriculture rather than shifting to more productive jobs in agri-business, manufacturing, or services. The legal framework for investment and the institutional framework for agricultural exports create disincentives that reduce productivity, undermining the sector’s potential to boost incomes and diversify exports.
xxii. Reforms are urgently needed to facilitate the movement of resources to the most productive opportunities and to complete FYR Macedonia’s structural transformation. While the country’s success in attracting export-oriented FDI has enabled it to integrate into some global value chains, it has not been able to effectively leverage its strategic location. Macedonian firms are unable to take advantage of an otherwise strong business climate, discouraging the development of sophisticated value chains that add more local content, slowing the emergence of new industries, and keeping jobs heavily concentrated in low-productivity sectors with slow productivity growth. Accelerating structural transformation and promoting technological adoption and innovation will become increasingly crucial as FYR Macedonia takes action to escape the middle-income trap and achieve high-income status. This SCD seeks to identify the obstacles inhibiting the dynamism and competitiveness of the Macedonian private sector and define a strategy for overcoming them. Key issues are shortages of workforce skills, weaknesses in trade and transport connectivity and value-chain integration, and deficiencies in competition and
FYR MACEDONIA SYSTEMATIC COUNTRY DIAGNOSTIC
O-10 OVERVIEW OF THE DIAGNOSTIC
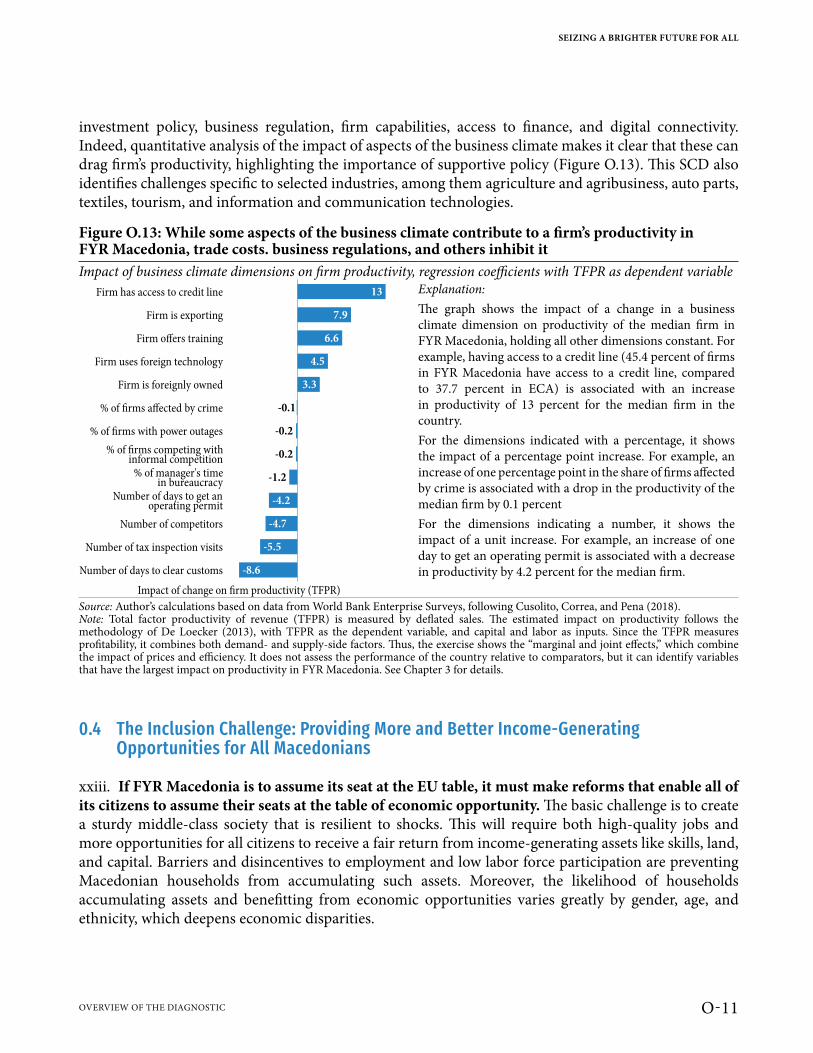
investment policy, business regulation, firm capabilities, access to finance, and digital connectivity. Indeed, quantitative analysis of the impact of aspects of the business climate makes it clear that these can drag firm’s productivity, highlighting the importance of supportive policy (Figure O.13). This SCD also identifies challenges specific to selected industries, among them agriculture and agribusiness, auto parts, textiles, tourism, and information and communication technologies.
0.4 The Inclusion Challenge: Providing More and Better Income-Generating Opportunities for All Macedonians
xxiii. If FYR Macedonia is to assume its seat at the EU table, it must make reforms that enable all of its citizens to assume their seats at the table of economic opportunity. The basic challenge is to create a sturdy middle-class society that is resilient to shocks. This will require both high-quality jobs and more opportunities for all citizens to receive a fair return from income-generating assets like skills, land, and capital. Barriers and disincentives to employment and low labor force participation are preventing Macedonian households from accumulating such assets. Moreover, the likelihood of households accumulating assets and benefitting from economic opportunities varies greatly by gender, age, and ethnicity, which deepens economic disparities.
Figure O.13: While some aspects of the business climate contribute to a firm’s productivity in FYR Macedonia, trade costs. business regulations, and others inhibit itImpact of business climate dimensions on firm productivity, regression coefficients with TFPR as dependent variable
Firm has access to credit line
Firm is exporting
Firm offers training
Firm uses foreign technology
Firm is foreignly owned
% of firms affected by crime
% of firms with power outages
% of firms competing withinformal competition
% of manager's timein bureaucracy
Number of days to get anoperating permit
Number of competitors
Number of tax inspection visits
Number of days to clear customs
13
7.9
6.6
4.5
3.3
-0.1
-0.2
-0.2
-1.2
-4.2
-4.7
-5.5
-8.6
Explanation:The graph shows the impact of a change in a business climate dimension on productivity of the median firm in FYR Macedonia, holding all other dimensions constant. For example, having access to a credit line (45.4 percent of firms in FYR Macedonia have access to a credit line, compared to 37.7 percent in ECA) is associated with an increase in productivity of 13 percent for the median firm in the country.For the dimensions indicated with a percentage, it shows the impact of a percentage point increase. For example, an increase of one percentage point in the share of firms affected by crime is associated with a drop in the productivity of the median firm by 0.1 percentFor the dimensions indicating a number, it shows the impact of a unit increase. For example, an increase of one day to get an operating permit is associated with a decrease in productivity by 4.2 percent for the median firm.
Impact of change on firm productivity (TFPR)Source: Author’s calculations based on data from World Bank Enterprise Surveys, following Cusolito, Correa, and Pena (2018).Note: Total factor productivity of revenue (TFPR) is measured by deflated sales. The estimated impact on productivity follows the methodology of De Loecker (2013), with TFPR as the dependent variable, and capital and labor as inputs. Since the TFPR measures profitability, it combines both demand- and supply-side factors. Thus, the exercise shows the “marginal and joint effects,” which combine the impact of prices and efficiency. It does not assess the performance of the country relative to comparators, but it can identify variables that have the largest impact on productivity in FYR Macedonia. See Chapter 3 for details.
SEIZING A BRIGHTER FUTURE FOR ALL
O-11OVERVIEW OF THE DIAGNOSTIC

xxiv. Opportunities for Macedonians to build human capital are limited and may even be deteriorating, which reduces the capacity of workers to meet the evolving demands of a modern economy and contribute to greater productivity. In FYR Macedonia, gaps in human capital start early and expand over time (Figure O.14). Preschool enrollment is very low, the scores of Macedonian students on international tests are worsening, the majority of the unemployed lack work experience, and firms offer few opportunities for professional development. Neonatal, infant and under-5 mortality rates suggest poor health and nutrition outcomes, which affect individuals’ ability to learn, as well as their productivity throughout the lifecycle. Small countries that have sustained robust growth and successfully escaped the middle-income trap, among them some “East Asian tigers,” have all invested aggressively in education. On the 2015 PISA (Programme for International Student Assessment) standardized tests, Singapore, Taiwan, Hong Kong, and Macau all ranked among the top 10 countries in both reading and mathematics. FYR Macedonia ranked among the bottom 5, far behind comparable countries like Albania, Montenegro, Moldova, and Georgia (Figure O.15). With the workforce shrinking and labor productivity low, FYR Macedonia’s future growth will increasingly rely on formation of human capital.
xxv. Barriers and disincentives to employment and labor force participation make it harder for labor to contribute to growth. Beyond the skills shortages, barriers originate in insufficient support services for workers, such as child and elder care. Moreover, labor laws are not flexible enough to facilitate access to work for women, the young, and the elderly. The tax burden on low wages discourages work. For those who benefit from social assistance and pensions, the potential loss of benefits encourages inactivity. Thus, two forces operating in tandem generate lackluster performance despite the efforts of various governments to address the jobs challenge. On the one hand, job creation has been positive, but concentrated in low-productivity, low-wage, and non-tradable activities, and it may not be sustainable because it was partly driven by fiscal stimulus in infrastructure projects, subsidies, and active labor market policies. On the other hand, rigidities in labor market and social protection institutions discourage participation in the labor market, especially for those in the lower half of the income distribution.
Figure O.14: In FYR Macedonia, deficiencies in human capital development begin in childhood and compound over time
Professional development
School to work transition
General education & TVET
Early childhood development
Only 1 in 4 firms provide on-the-job training(typically mored productive firms).By age 55, 1 in 4 workers is retired.
77% of unemployed adults have no prior work experience(25–34 years old). Among 45–54 year olds,
58% have no experience.
Only country where the scores for the Programme ofInternational Student Assessments (PISA) and Trends inInternational Mathematics and Science Study (TIMMS)
have declined in the last 15 years.
Low enrollment in preschool, especially for the poorest(0.3% in poorest quintile). Among the richest
it is 55% vs. 80% in Serbia.
Source: Authors based on various sources. See Chapter 4 for details.
FYR MACEDONIA SYSTEMATIC COUNTRY DIAGNOSTIC
O-12 OVERVIEW OF THE DIAGNOSTIC

xxvi. Structural labor market deficiencies result in a considerable waste of working years. Based on 2016 labor market indicators, it is estimated that FYR Macedonia’s low employment rates result in about eight years of employment lost for workers aged 15–24, about 12 years lost for those 25–54, and close to 6 years lost for those 55–64. For the average Macedonian male worker this totals about 25 years lost because of high unemployment and inactivity. For women, the loss is 30 years (Figure O.16).
xxvii. Inequality in access to economic opportunities equates to less social inclusion (Figure O.17). Building a stable, robust middle-class society requires enhancing the agency of individuals by expanding access to opportunity. For example, eliminating gender disparities in the labor market could increase FYR Macedonia’s annual GDP by an estimated 16 percent. Because individuals who are economically marginalized and unable to participate fully in growth have difficulty diversifying their assets, they stay vulnerable to shocks. Consequently, efforts to enhance inclusion are critical to both growth and poverty reduction. In FYR Macedonia, many people are still poor and excluded from job opportunities, among whom ethnic minorities are over-represented. Notably, ethnic Albanians account for close to 45 percent of all households in the bottom income quintile, but just 15 percent of those in the top. Roma people in settlements average considerably lower rates
Figure O.15: Macedonian students perform poorly on standardized testsPISA test scores in OECD countries, reading, 2015650
600
550
500
450
400
350
300
250SGP
FINHKG
KORM
ACPOL
SVNCHN
RUSCZE
LVA
HRVVNM
HUNLT
UCHL
SVKM
LT CYPBGR
URYM
YSROU
ARETUR
TTOARG
MNE
CRICOL
KAZM
EXM
DAJO
RTHA
ALBBRA
GEOQAT
PERID
NTUN
DOMM
KD
KOSDZA
LBN
OECD interquartile range
Q25th percentile Q50th percentile Q75th percentile QOECDSource: Authors’ calculations based on PISA 2015.Note: Results for mathematics abilities also show FYR Macedonia at the lower end.
Figure O.16: Macedonians lose on average about 25 years of employment because of poor labor market outcomesAverage years of productive employment lost, 2016
50
40
30
20
10
0AUT
ESTCZE
LTULVA
HUNSVN
POLSVK
BGRROU
ALBHRV
SRBMNE
MKDBIH KOS
J15–24 J25–54 J55–64 QFemalesSource: Authors’ calculations based on data from the South East Europe (SEE) Jobs Gateway (wiiw and World Bank) and Eurostat.Notes: The average years of employment potentially lost is equal to the share of total working years for the age group, multiplied by one minus the employment rate for the same age group in 2016. Methodology based on Arias et al. (2014).
SEIZING A BRIGHTER FUTURE FOR ALL
O-13OVERVIEW OF THE DIAGNOSTIC
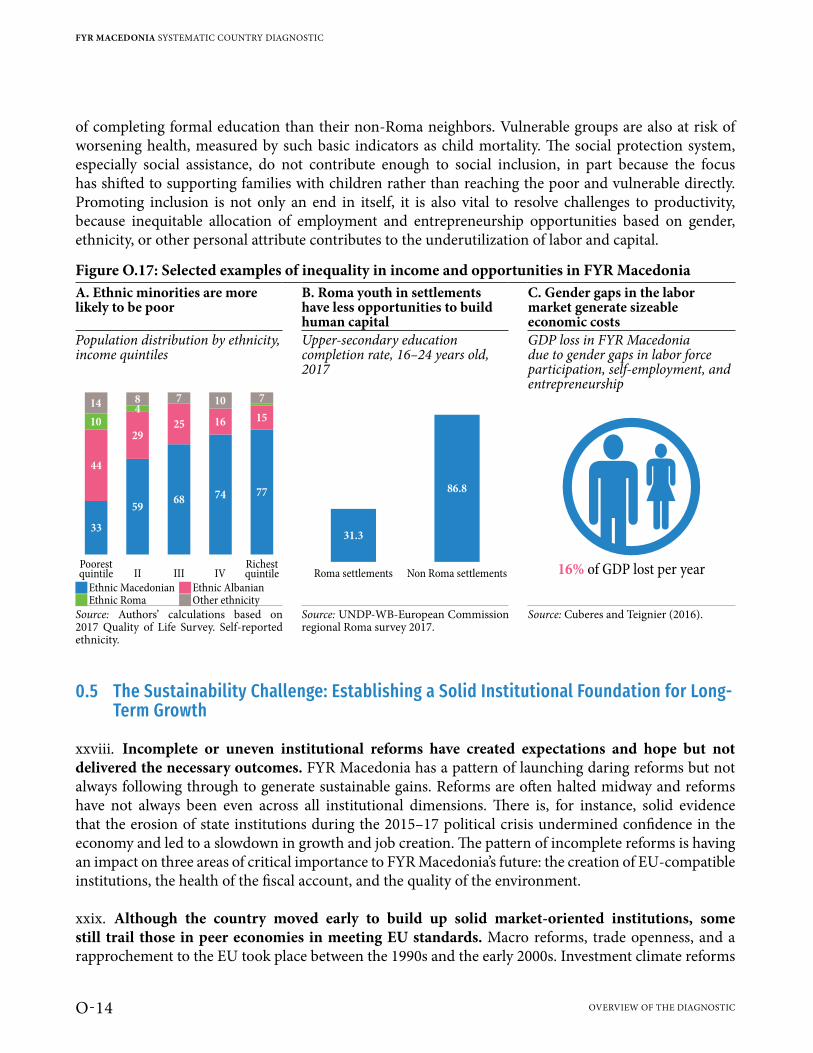
of completing formal education than their non-Roma neighbors. Vulnerable groups are also at risk of worsening health, measured by such basic indicators as child mortality. The social protection system, especially social assistance, do not contribute enough to social inclusion, in part because the focus has shifted to supporting families with children rather than reaching the poor and vulnerable directly. Promoting inclusion is not only an end in itself, it is also vital to resolve challenges to productivity, because inequitable allocation of employment and entrepreneurship opportunities based on gender, ethnicity, or other personal attribute contributes to the underutilization of labor and capital.
0.5 The Sustainability Challenge: Establishing a Solid Institutional Foundation for Long-Term Growth
xxviii. Incomplete or uneven institutional reforms have created expectations and hope but not delivered the necessary outcomes. FYR Macedonia has a pattern of launching daring reforms but not always following through to generate sustainable gains. Reforms are often halted midway and reforms have not always been even across all institutional dimensions. There is, for instance, solid evidence that the erosion of state institutions during the 2015–17 political crisis undermined confidence in the economy and led to a slowdown in growth and job creation. The pattern of incomplete reforms is having an impact on three areas of critical importance to FYR Macedonia’s future: the creation of EU-compatible institutions, the health of the fiscal account, and the quality of the environment.
xxix. Although the country moved early to build up solid market-oriented institutions, some still trail those in peer economies in meeting EU standards. Macro reforms, trade openness, and a rapprochement to the EU took place between the 1990s and the early 2000s. Investment climate reforms
Figure O.17: Selected examples of inequality in income and opportunities in FYR MacedoniaA. Ethnic minorities are more likely to be poor
B. Roma youth in settlements have less opportunities to build human capital
C. Gender gaps in the labor market generate sizeable economic costs
Population distribution by ethnicity, income quintiles
Upper-secondary education completion rate, 16–24 years old, 2017
GDP loss in FYR Macedonia due to gender gaps in labor force participation, self-employment, and entrepreneurship
Poorestquintile
RichestquintileII III IV
59
29
48
68
25
7
74
16
10
77
15
7
33
44
10
14
Roma settlements Non Roma settlements
31.3
86.8
16% of GDP lost per year JEthnic Macedonian JEthnic Albanian JEthnic Roma JOther ethnicity
Source: Authors’ calculations based on 2017 Quality of Life Survey. Self-reported ethnicity.
Source: UNDP-WB-European Commission regional Roma survey 2017.
Source: Cuberes and Teignier (2016).
FYR MACEDONIA SYSTEMATIC COUNTRY DIAGNOSTIC
O-14 OVERVIEW OF THE DIAGNOSTIC

propelled FYR Macedonia up in the Doing Business rankings, and the FDI promotion strategy succeeded in increasing exports. However, political stability, accountability, the rule of law, and corruption did not follow. As illustrated in Figure O.18, taking the average of the six areas of the Worldwide Governance Indicators (WGI) with scores ranging from –2.5 (weak governance) to 2.5 (strong), in 2016 FYR Macedonia had an average of –0.7. The median score for aspirational peers five years before each gained EU accession was +0.5, and their median score in 2016 was about +0.7.4 According to the WEF 2016 Executive Opinion Survey, policy instability and the inefficiency of the bureaucracy are among the top five obstacles to doing business in FYR Macedonia. A gap between law and practice undermines state effectiveness and social trust; for example, in Transparency International’s index of the quality of anti-corruption measures, the Macedonian judiciary scored 93 percent out of 100 for its legal basis but only 60 percent for actual implementation (Figure O.19). Similar large implementation gaps are seen in the legislature and public administration. Moreover, for the last decade, progressive deterioration of the system of checks and balances in the country eroded the trust between people and state. It will therefore be crucial to rebuild and consolidate social trust to ensure that the government has civic people to undertake the reforms necessary to move the country to a path of faster sustained growth and economic integration with the EU and the rest of the world.
xxx. Though fiscal stimulus measures can spur growth, it cannot sustain and accelerate it. The government has little fiscal space to stimulate the economy, and there are risks to fiscal sustainability in doing so that need to be resolved. Thanks to expansive fiscal policy in recent years, the economy grew, generated employment, and reduced poverty. Fiscal policy worked because the previous commitment to a stable macroeconomic environment had created room for countercyclical policy, but that room has
4 In two of the six indicators reported by WGI—regulatory quality and government effectiveness—FYR Macedonia ranks above the world median and higher than most of its structural peers. However, in the other four areas—political stability, voice and accountability, rule of law, and control of corruption—its rankings are far worse.
Figure O.18: FYR Macedonia’s governance is far below that of aspirational peers before they joined the EU
Figure O.19: A gap between law and practice undermines state effectiveness and social trust
Average Worldwide Governance Indicators Scores on anti-corruption requirements (score 0–100)1.0
0.8
0.6
0.4
0.2
-0.2
0
5 years beforeMKD, 2016 Join EU 5 years a�er
Go
vern
an
ce g
ap
Capacity
Governance
Effectiveness
90
80
70
60
50
40
30
20
10
0Capacity
Capacity
Governance
Governance
EffectivenessPublic
procurement
100
Judiciary Legislature Public administration
▬Median - new EU member states QFYR Macedonia JLaw JPractice Q25–75th percentiles - new EU member states
Source: Authors’ calculations based on WGI data and World Bank (2017c) Revving Up the Engines of Growth and Prosperity in the Western Balkans.Note: Average WGI is average of the 6 WGI components. Estimates range from -2.5 (weak) to 2.5 (strong) governance performance.
Source: Data from Transparency International (2011).Note: Solid line shows the average for the law aspects of capacity, governance, and efficiency in public procurement. Dotted line is the average of the practice components.
SEIZING A BRIGHTER FUTURE FOR ALL
O-15OVERVIEW OF THE DIAGNOSTIC
already been used up: the public debt-to-GDP ratio rose from 23 percent of GDP in 2008 to 47.6 percent in 2017. Without increasing public revenues or improving the quality of the spending, fiscal space will not be available to sustain, much less accelerate, economic growth. Moreover, when fiscal measures were expansionary, limited attention was placed on related factors that heighten fiscal risks; for example, the current pension deficit is over 4 percent of GDP, and as the population ages spending on pensions is expected to keep rising. Also, the efficiency of public spending on areas like education, health, infrastructure, and agricultural subsidies received only superficial attention. A comparison of actual spending with the minimums necessary to achieve the same output levels suggests that efficiency reforms could save more than 13 percent of total public spending. Meanwhile, education and health outcomes are deteriorating. And there is ample scope for raising revenues by improving tax collection, which is characterized by broad tax exemptions, compliance challenges, and informality. Paradoxically, the relative success of using fiscal stimulus to promote economic growth, generate low-skilled employment, and reduce poverty have diverted attention from needed fiscal consolidation and public administration reform.
xxxi. Limited public resources and a policy deficit have prevented forceful action to forestall growing environmental threats like air pollution and natural hazards that are amplified by climate change. Air pollution in FYR Macedonia is now among the worst in Europe, and the health risks are severe, with an estimated annual cost equal to 3.2 percent of GDP. The main culprits, responsible for more than 90 percent of emissions, are road traffic, industry and energy production, and residential heating; among other sources are agriculture, waste burning, and construction dust. Air pollution is concentrated, with over 45 percent affecting Skopje, the largest city, and several local production zones. Despite introduction of measures like pollution inventories and air quality monitoring systems have, there is need to enforce environmental regulations more vigorously. FYR Macedonia is also highly exposed to natural hazards like floods, earthquakes, forest fires, droughts, landslides, and extreme temperatures. The annual damage to critical infrastructure from climate-related hazards is expected to double by 2020, and by 2080 it could be more than five times higher. A major flood or earthquake disaster could derail economic growth, affect critical infrastructure, cause losses in agricultural incomes, and disrupt rural livelihoods. For example, a 250-year earthquake would affect more than 40 percent of the Macedonian population and cost 50 percent of GDP. That is why reinforcing emergency preparedness and other aspects of resilience is ever more urgent.
0.6 Toward Faster, More Inclusive, and Sustainable Growth: Three Mutually Reinforcing Pathways
xxxii. To converge with EU incomes and build a strong middle-class society, FYR Macedonia needs to shift gears to promote faster, more inclusive, and sustainable growth (Figure O.20). Achieving productivity growth will require the country to invest more in human and physical capital and create an environment that enables private-sector growth. Heightened allocative efficiency will be necessary to fully exploit the country’s current productive capacity. External markets can provide room for the Macedonian economy to expand and facilitate the reallocation of resources but taking advantage of external opportunities will depend on better domestic and regional connectivity. To become more competitive and dynamic the country will require new technologies and a more highly skilled labor
FYR MACEDONIA SYSTEMATIC COUNTRY DIAGNOSTIC
O-16 OVERVIEW OF THE DIAGNOSTIC

force. The vision is a better-connected, vibrant domestic economy engaged in the region and beyond as it secures its footing in areas of strong comparative advantage.
xxxiii. To generate quality income and employment opportunities, productivity growth must be broad based and crowd in the large stock of unutilized human resources. But the skills deficiencies of the labor force, and especially the recent deterioration in skills could dampen efforts to raise productivity and expand economic activity. That is why it is urgent to facilitate acquisition of skills and refurbish the education system from early education through provision of lifelong opportunities. Unlocking the potential of the local workforce will also require removal of distortions and dismantling of barriers that discourage people—especially women and minorities—from participating in the labor force. Also needing to be addressed to secure are socioeconomic gaps that affect ethnic minorities, women, and inhabitants of certain regions. Only if citizens can fully exploit their productive potential and increase their labor incomes will FYR Macedonia be able to eradicate poverty and expand the middle class.
xxxiv. Sustaining initiatives over the long term depends on the country building resilience in a variety of ways. State institutions must be responsive to the needs of both businesses and citizens so that they coordinate design of policies and—this is critical—ensure the rule of law. Fiscal sustainability is vital to support productivity growth, protect the economy against shocks, and improve delivery of public services. Better environmental management and building resilience against disaster and climate risks would not only help sustain economic growth but also protect the most vulnerable.
xxxv. FYR Macedonia could achieve more robust, inclusive, and sustainable development by advancing along three complementary pathways. The first focuses on encouraging emergence of a dynamic and competitive private sector to drive the reallocation of resources and foster technological uptake and innovation. The second focuses on expanding access to economic opportunity by investing in human capital and removing barriers and disincentives that block working-age Macedonians from the labor market. Central to this route is creating a more efficient and more accurately targeted safety net that shields households from economic shocks. The third pathway focuses on reinforcing government
Figure O.20: The key elements for faster, more inclusive, sustainable growth in FYR Macedonia
Increasingproductivity
Enhancing jobopportunities
for all
Achieving sustainability
Effectivegovernance
Fiscalprudence
Enhanced environmentalmanagement and resilience
to natural hazardsSource: Authors.
SEIZING A BRIGHTER FUTURE FOR ALL
O-17OVERVIEW OF THE DIAGNOSTIC
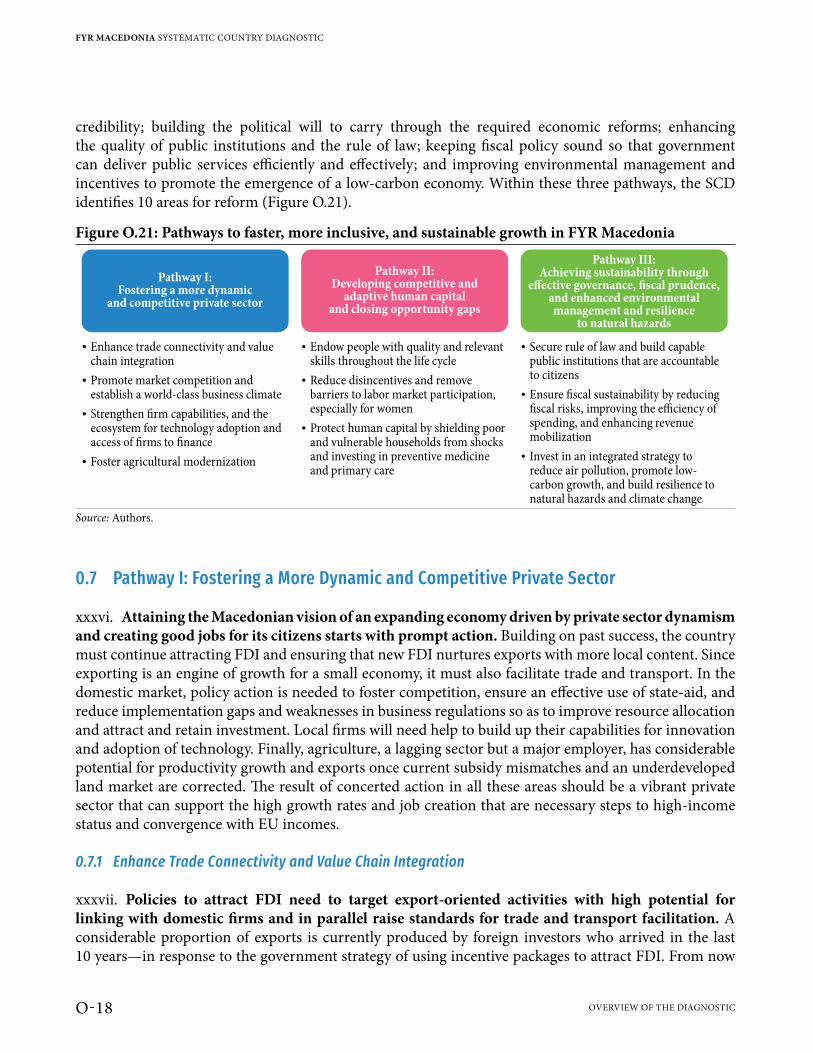
credibility; building the political will to carry through the required economic reforms; enhancing the quality of public institutions and the rule of law; keeping fiscal policy sound so that government can deliver public services efficiently and effectively; and improving environmental management and incentives to promote the emergence of a low-carbon economy. Within these three pathways, the SCD identifies 10 areas for reform (Figure O.21).
0.7 Pathway I: Fostering a More Dynamic and Competitive Private Sector
xxxvi. Attaining the Macedonian vision of an expanding economy driven by private sector dynamism and creating good jobs for its citizens starts with prompt action. Building on past success, the country must continue attracting FDI and ensuring that new FDI nurtures exports with more local content. Since exporting is an engine of growth for a small economy, it must also facilitate trade and transport. In the domestic market, policy action is needed to foster competition, ensure an effective use of state-aid, and reduce implementation gaps and weaknesses in business regulations so as to improve resource allocation and attract and retain investment. Local firms will need help to build up their capabilities for innovation and adoption of technology. Finally, agriculture, a lagging sector but a major employer, has considerable potential for productivity growth and exports once current subsidy mismatches and an underdeveloped land market are corrected. The result of concerted action in all these areas should be a vibrant private sector that can support the high growth rates and job creation that are necessary steps to high-income status and convergence with EU incomes.
0.7.1 Enhance Trade Connectivity and Value Chain Integration
xxxvii. Policies to attract FDI need to target export-oriented activities with high potential for linking with domestic firms and in parallel raise standards for trade and transport facilitation. A considerable proportion of exports is currently produced by foreign investors who arrived in the last 10 years—in response to the government strategy of using incentive packages to attract FDI. From now
Figure O.21: Pathways to faster, more inclusive, and sustainable growth in FYR Macedonia
Pathway I:Fostering a more dynamic
and competitive private sector
Pathway II:Developing competitive and
adaptive human capitaland closing opportunity gaps
Pathway III:Achieving sustainability through
effective governance, fiscal prudence,and enhanced environmentalmanagement and resilience
to natural hazards
� Enhance trade connectivity and valuechain integration
� Promote market competition andestablish a world-class business climate
� Foster agricultural modernization
� Strengthen firm capabilities, and theecosystem for technology adoption andaccess of firms to finance
� Endow people with quality and relevantskills throughout the life cycle
� Reduce disincentives and removebarriers to labor market participation,especially for women
� Protect human capital by shielding poorand vulnerable households from shocksand investing in preventive medicineand primary care
� Invest in an integrated strategy toreduce air pollution, promote low-carbon growth, and build resilience tonatural hazards and climate change
� Ensure fiscal sustainability by reducingfiscal risks, improving the efficiency ofspending, and enhancing revenuemobilization
� Secure rule of law and build capablepublic institutions that are accountableto citizens
Source: Authors.
FYR MACEDONIA SYSTEMATIC COUNTRY DIAGNOSTIC
O-18 OVERVIEW OF THE DIAGNOSTIC
on, however, FYR Macedonia needs to attract export-oriented FDI that connects better with both the domestic economy and global value chains (GVCs). The growing trend of regionalizing production for GVCs offers an opportunity for FYR Macedonia that complements EU integration: the Western Balkans region abounds in untapped opportunities for production integration, in such sectors as agribusiness, ICT, textiles, and tourism. To profit from these opportunities the country must reduce the costs arising from delays in customs clearance. FYR Macedonia needs to streamline procedures, upgrade customs systems, and coordinate the activities of its own agencies with an interest in exports and with the main destination countries. To take full advantage of the opportunities for services exports opened up by surging technologies, greater labor mobility within the Western Balkans (promoted, for example, by mutual recognition of professional qualifications) would allow the countries to build critical masses as markets. Last, closing the remaining gaps in the main transport corridors will give FYR Macedonia better connections to external markets and establish it as a regional trade and transport hub and rebalancing public spending to invest in maintenance of transport infrastructure and road safety will protect human and physical capital.
0.7.2 Promote Market Competition and Establish a World-Class Business Climate
xxxviii. Policies to spur healthy competition in domestic markets and actions to enhance the business climate are central to generating much-needed dynamism in the private sector. In a true competitive environment, the most-productive firms will generate employment by using economic resources efficiently. On paper the Macedonian competition regulations and institutions follow the EU model; in practice, there are gaps. Entry barriers in network industries like electricity and telecommunications and undue restrictions on professionals like attorneys, accountants, and engineers feed concerns about whether private businesses can successfully compete with state-owned enterprises (SOEs). As for business-climate reforms, the country has considerably improved its standings in international indicators, but among areas still needing attention are starting a new enterprise (getting electricity, registering property); the legal framework for firms (resolving insolvency, enforcing contracts); the pattern of continuous and unpredictable changes in regulation; and uneven and discretionary oversight and enforcement.
0.7.3 Strengthen Firm Capabilities and the Ecosystem for Technology Adoption and Access of Firms to Finance
xxxix. Domestic firms, especially small and medium-sized enterprises (SMEs) and start-ups, need support if they are to adopt new technologies, innovate, and have sufficient access to finance to be able to respond to competitive pressures. Today they find it difficult to access technology, finance, and management skills. Current Macedonian public programs subsidize inputs rather than enhancing firm capabilities. Management and technology extension programs should be emphasized; they have proved successful in building firm capabilities in high-income countries and helping entrepreneurs acquire the soft skills increasingly recognized as critical to firm success and adopt international quality standards. They would help firms attract funding and run their businesses efficiently. With regard to access to finance, current programs can be streamlined based on assessment of the market gap. Helping firms to acquire the capabilities to become more competitive and technologically adept will help them to thrive in a world of shifting production patterns and changing sources of foreign investment. Because there
SEIZING A BRIGHTER FUTURE FOR ALL
O-19OVERVIEW OF THE DIAGNOSTIC
has been little study of firm capabilities in FYR Macedonia, it would be important to embed impact evaluations to ensure that public resources achieve the desired outcomes.
0.7.4 Foster Agricultural Modernization
xl. A more dynamic agricultural sector will be critical for broad-based growth and enhanced job opportunities, particularly for those at the bottom of the income distribution. Along with support to an outward-looking private sector, it will be critical to provide the conditions for agriculture to grow and create better employment, which would directly benefit less-skilled workers in rural areas. An urgent priority is to revise state aid to agriculture, which is a misallocation of resources and also prevents changes in techniques and gains in productivity. More efficient use of land will depend on a more effective land market, which in turn will depend on reforming the system for taxing land and applying current land laws to better effect. With incentives improved, the intensity of physical capital and research and development (R&D) in agriculture and agribusiness should to heightened to spur growth and productivity. Policy must thus change to realize the potential of agriculture to export, generate employment, and contribute to growth, especially in agroindustry and tourism.
0.8 Pathway II: Developing Competitive and Adaptive Human Capital and Closing Opportunity Gaps
xli. If it is to realize its aspirations of a middle-class society, it is urgent that FYR Macedonia move quickly to spur accumulation, and heighten the quality of, human capital, and close gaps in access to economic opportunities. As the global economy becomes ever more sophisticated, education and workforce skills will become even more essential, and only investing in human capital can enable Macedonian workers to become and stay competitive. A skilled labor force that can readily adapt as circumstances change is crucial to sustain employment and limit inequality. The country needs to take immediate action to improve both the quantity of its human capital (measured by school enrollment, school completion, and child mortality rates—all currently worse than those of peer countries) and its quality of human capital (measured by the results of international standardized tests, on which its students are currently doing badly). Beyond skills, it is also important to reduce disincentives and dismantle barriers that keep any group away from jobs. Finally, human capital needs to be protected by reducing health risks and shielding the poor and vulnerable from shocks. Raising human capital and closing opportunity gaps will support growth, and higher economic growth will in turn make further human development affordable.
0.8.1 Endow People with Quality and Relevant Skills Throughout the Life Cycle
xlii. Macedonian workers need relevant skills that they can readily adapt to a rapidly changing labor market. Improving the quality of education will depend on improving the quality of teaching; teachers must therefore be trained in modern teaching methods and quality assurance mechanisms to assure both the quality and relevance of what is taught. First, investments in early childhood development and preschool programs are needed to ensure readiness for school, which is vital to the success of later interventions. That means expanding the supply of school spaces for 3–5-year-olds, especially those in rural areas and from poorer households. Primary, secondary, and tertiary education can then be re-
FYR MACEDONIA SYSTEMATIC COUNTRY DIAGNOSTIC
O-20 OVERVIEW OF THE DIAGNOSTIC
engineered to shift from delivering content to building critical thinking skills, which can be promoted by using good metrics to monitor learning outcomes and assure quality. Better teacher quality also requires practical experience and a system for teacher career advancement that will reward exceptional performance. At the tertiary level, internal and external quality assurance could ensure the job-readiness of graduates. Revised funding formulas at each level would create more incentives to deliver quality. Finally, adopting a proactive strategy to facilitate a seamless school-to-work transition for students would encourage their acquisition of job-relevant skills. Tertiary programs need to adopt modern pedagogical practices and job-relevant content, shift from narrow occupational to more general technical education, engage more closely with employers, and provide information to help students choose courses with higher market value. Building skills throughout the life cycle would ensure that Macedonians take full advantage of their productive potential.
0.8.2 Reduce Disincentives and Remove Barriers to Labor Market Participation, Especially for Women
xliii. Expanding labor market participation to reduce current losses to national income will require a variety of interventions. Facilitating support to women by, e.g., expanding access to quality child and elder care would give more women in their most productive years the opportunity to work. Revising family leave policies would help to promote the participation of fathers in the care of newborns. To counter traditional social norms and other barriers that still prevent women from pursuing economic activity, awareness campaigns and gender-sensitive public education can have a major impact on gender equality and female activation. Creating more role models and champions can both change young women’s expectations about what they can achieve and increase the tolerance of men for women’s empowerment outside the home. But it is also vital to support communication campaigns with actual laws to encourage gender parity. For instance, incorporating gender-focused provisions in collective agreements through the Socio-Economic Council, enforcing nondiscrimination laws, and adopting mechanisms to monitor gender equality can foster a more open mindset about the role of women in a productive society. Reducing the tax wedge for below-average salaries and changing social benefit rules so that beneficiaries who work are not penalized would reduce one disincentive to work. Better designed tax brackets for low-income workers can heighten incentives to search for employment and to work more hours. Similarly, reforming the rules of eligibility for social assistance to gradually withdraw benefits when people have paid employment and instead provide complementary benefits to ensure a minimum income, would also make working more attractive. Last, reducing restrictions on part-time, temporary, and seasonal work would allow more employers to test the quality of workers and allow workers to acquire much-needed experience, keeping in mind the need to carefully balance fairness and flexibility.
0.8.3 Protect Human Capital by Shielding Poor and Vulnerable Households From Shocks and Investing in Preventive Medicine and Primary Care
xliv. Targeted social assistance, expanded social services, better access to health care, and promotion of healthier lifestyles could together help shield poor and vulnerable households from shocks. In a tight fiscal environment, social assistance needs to be redirected from categorical to means-tested programs so that more of the poor are protected from shocks that would further reduce their living standards. Current social assistance policies, which give priority to untargeted child-related benefits rather than targeting cash benefits to poor families, need to be reversed and funding expanded for the
SEIZING A BRIGHTER FUTURE FOR ALL
O-21OVERVIEW OF THE DIAGNOSTIC
Social Financial Assistance program, which primarily supports poor families. To promote access to job opportunities, it is important to provide other services that can increase employability and reduce barriers for poor households; special attention to ethnic minorities would help to reduce their systematic exclusion from economic opportunity. Also, FYR Macedonia’s institutional and non-institutional care, which is currently scarce, needs to be expanded beyond children and persons with disabilities to serve other needy adults and the elderly, which would allow family members with care responsibilities to participate more actively in the labor force; in a context of fiscal consolidation these investments would need to be financed from efficiency gains in public financial management and a rebalancing of public spending. There is also an urgent need to build up primary health care to improve health outcomes, especially for infants and children under 5, by, for example, a thorough health care facility analysis to guide the rebalancing of primary care and specialist services, improved pharmaceutical coverage, and aligning medicine pricing with international best practice. Investments in improving or expanding existing physical infrastructure could also be considered. Last, working through an integral strategy for healthier lifestyles (e.g., discouraging smoking and obesity) can reduce the high incidence of noncommunicable disease, especially diabetes and lung cancer, and increase the productive life span of many Macedonians.
0.9 Pathway III: Achieving Sustainability through Effective Governance, Fiscal Prudence, Enhanced Environmental Management, and Resilience to Natural Hazards
xlv. FYR Macedonia needs to move promptly to make sure its efforts to realize its visions for growth and inclusion are sustainable. These actions should be oriented to three critical areas where structural or emerging problems pose risks to inclusive growth. The first area relates to the need to secure the rule of law and government accountability; the second to emerging risks to fiscal sustainability; and the third relates to environmental issues and the need to address low-carbon growth and raise resilience to natural hazards and climate change.
0.9.1 Secure Rule of Law and Build Capable Public Institutions That Are Accountable to Citizens
xlvi. Government capacity and accountability, which are central to the rule of law, should be built up through a series of policy actions. While FYR Macedonia has made considerable progress in elaborating the legal framework to support a market economy, there has been much less progress on government capacity and accountability; the country trails peers in such categories as political stability, voice and accountability, rule of law, and control of corruption. A commitment to policy stability and efforts to improve bureaucratic efficiency would enhance both the business environment and government accountability. Legal, policy, and political support for the media as agents for accountability and for more investigative journalism could over time help reduce politicization and corruption in government institutions.
0.9.2 Ensure Fiscal Sustainability by Reducing Fiscal Risks, Improving the Efficiency of Spending, and Enhancing Revenue Mobilization
xlvii. Reducing risks to fiscal sustainability requires reining in pension spending, better controlling SOE debt, more discipline in local government financial management, addressing the efficiency of
FYR MACEDONIA SYSTEMATIC COUNTRY DIAGNOSTIC
O-22 OVERVIEW OF THE DIAGNOSTIC
public spending, and raising tax collection. Pension spending, the largest source of fiscal risk, needs to be contained by increasing pension contribution rate and limiting indexation to the consumer price index in the short term, and raising retirement ages, over the medium term. SOEs, whose indebtedness has been worsening, require closer monitoring and financial oversight, with special attention to cost recovery. Local governments need more fiscal discipline and greater accountability, especially as related to budget arrears and municipal borrowing, and the capacity to deliver public services efficiently and effectively. Further, they need to have more stable revenue base, through strengthened property taxation. Centrally, more efficient public spending, especially on education, health, infrastructure, and agricultural subsidies, at a time of fiscal consolidation could yield significant savings. Lastly, to address structural weaknesses in FYR Macedonia’s public finances, more tax revenue can be collected, for example, by reviewing and eliminating tax exemptions within a defined transition period. A review of tax rates would also clarify which rates could be raised—perhaps those on ‘sin taxes’ on items that have adverse health or environmental impact, since that might generate some public support, as well as a consideration could be given to increase the progressivity of the personal income taxation. Finally, tax administration desperately needs to be modernized and voluntary taxpayer compliance promoted, which should also help to shrink the informal economy.
0.9.3 Invest in an Integrated Strategy to Reduce Air Pollution, Promote Low-Carbon Growth, and Build Resilience to Natural Hazards and Climate Change
xlviii. Natural resources need to be managed so as to maintain living standards, avoid detrimental impacts to health, move to a low-carbon path without undermining energy supply, and build more resilience to natural hazards and climate change. To avoid worsening water scarcity, inefficient water management must be corrected, which will require rehabilitation of aging infrastructure. To counter the dire threat to public health created by air pollution there is need for firmer enforcement of environmental regulations (based on EU air quality directives) and for investment in updated technologies to ensure compliance with regulations. To manage carbon emissions, the energy sector needs to withdraw from dependence on coal, improve the security and efficiency of energy supply, and scale up energy efficiency by turning to renewable sources (small hydropower, biogas, solar, and wind), and integrating them into the regional energy market. Crafting national programs and policies to reduce climate and disaster impacts in priority sectors is the first step to reducing risks to infrastructure; it should be accompanied by improvements in the emergency response system.
0.10 Seizing Emerging Opportunities Now to Shift Gears and Advance Key Objectives
xlix. The current context offers FYR Macedonia a real opportunity to resume convergence with the EU. Two opportunities stand out. The first arises from the political understandings that have coalesced in the last year and that have transcended the political crisis (2015–17) that generated uncertainty and stalled reforms. Its resolution should allow for renewed progress on reforms agenda. The recent political stabilization has also facilitated a tentative agreement with Greece on the country’s name (which needs to be confirmed), thereby energizing the EU and NATO accession agenda.
l. EU accession can be a powerful device to advance and sustain reform efforts. International experience illustrates clearly how the accession process can catalyze welfare convergence. The most
SEIZING A BRIGHTER FUTURE FOR ALL
O-23OVERVIEW OF THE DIAGNOSTIC
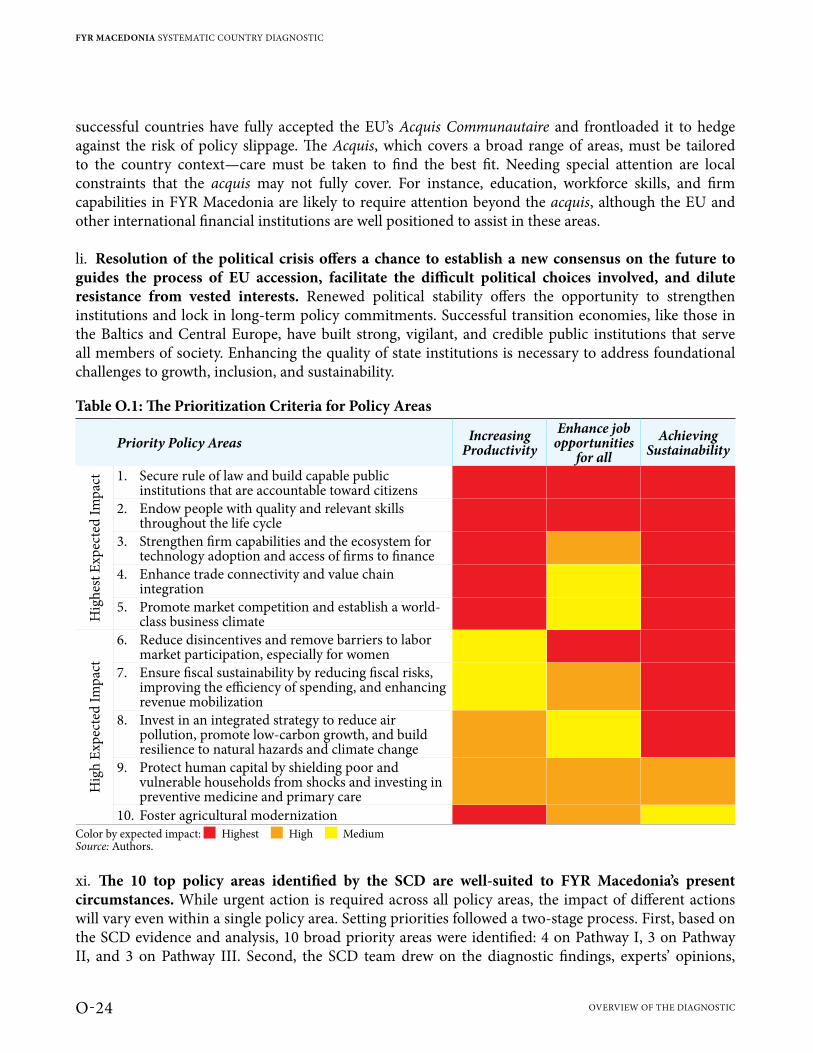
successful countries have fully accepted the EU’s Acquis Communautaire and frontloaded it to hedge against the risk of policy slippage. The Acquis, which covers a broad range of areas, must be tailored to the country context—care must be taken to find the best fit. Needing special attention are local constraints that the acquis may not fully cover. For instance, education, workforce skills, and firm capabilities in FYR Macedonia are likely to require attention beyond the acquis, although the EU and other international financial institutions are well positioned to assist in these areas.
li. Resolution of the political crisis offers a chance to establish a new consensus on the future to guides the process of EU accession, facilitate the difficult political choices involved, and dilute resistance from vested interests. Renewed political stability offers the opportunity to strengthen institutions and lock in long-term policy commitments. Successful transition economies, like those in the Baltics and Central Europe, have built strong, vigilant, and credible public institutions that serve all members of society. Enhancing the quality of state institutions is necessary to address foundational challenges to growth, inclusion, and sustainability.
Table O.1: The Prioritization Criteria for Policy Areas
Priority Policy Areas Increasing Productivity
Enhance job opportunities
for allAchieving
Sustainability
Hig
hest
Exp
ecte
d Im
pact 1. Secure rule of law and build capable public
institutions that are accountable toward citizens2. Endow people with quality and relevant skills
throughout the life cycle3. Strengthen firm capabilities and the ecosystem for
technology adoption and access of firms to finance4. Enhance trade connectivity and value chain
integration5. Promote market competition and establish a world-
class business climate
Hig
h Ex
pect
ed Im
pact
6. Reduce disincentives and remove barriers to labor market participation, especially for women
7. Ensure fiscal sustainability by reducing fiscal risks, improving the efficiency of spending, and enhancing revenue mobilization
8. Invest in an integrated strategy to reduce air pollution, promote low-carbon growth, and build resilience to natural hazards and climate change
9. Protect human capital by shielding poor and vulnerable households from shocks and investing in preventive medicine and primary care
10. Foster agricultural modernization Color by expected impact: J Highest J High J MediumSource: Authors.
xi. The 10 top policy areas identified by the SCD are well-suited to FYR Macedonia’s present circumstances. While urgent action is required across all policy areas, the impact of different actions will vary even within a single policy area. Setting priorities followed a two-stage process. First, based on the SCD evidence and analysis, 10 broad priority areas were identified: 4 on Pathway I, 3 on Pathway II, and 3 on Pathway III. Second, the SCD team drew on the diagnostic findings, experts’ opinions,
FYR MACEDONIA SYSTEMATIC COUNTRY DIAGNOSTIC
O-24 OVERVIEW OF THE DIAGNOSTIC

and stakeholder consultations5 to cluster the 10 priority areas in terms of their expected impact on productivity, enhancing job opportunities for all, and achieving sustainability (Table O.1). Furthermore, for each area, the SCD team proposes policy actions (“What would it take?”) to give more specificity to the policy agenda (Table O.2). These represent a core agenda for shifting to more robust, inclusive, and sustainable growth, including a schedule for completing each policy action based on its expected complexity. There are notable complementarities between priorities. Capturing synergies, drafting sequences, and building institutional capacity to design reforms and get them done will be critical to maximize the impact on productivity, jobs, and sustainability.
Table O.2: Summary of Priority Areas for FYR Macedonia and Selected Policy ActionsPriority Areas Selected Priority Actions
Medium Expected impact High
Secure rule of law and build capable public institutions that are accountable to citizens.
Strengthen mechanisms ensuring freedom of the press and of civil society organizations.
Increase the transparency and accountability of government decision-making and build public sector capacity.
Ensure the independence, accountability, and professionalism of judicial system.
Time horizon for implementation Endow people with quality and relevant skills throughout the life cycle
Invest in workforce development, job readiness, and labor market information systems to support job intermediation.
Put in place a broad-based strategy to strengthen the quality and relevance of primary, secondary, tertiary, and technical education.
Invest in early years (early childhood and pre-school education), especially for the poor.
Strengthen firm capabilities and the ecosystem for technology adoption and access of firms to finance.
Streamline support programs for access of firms to finance.
Consolidate current firm-level programs to achieve economies of scale, and rebalance public support from subsidizing firm inputs to facilitating firm-upgrading.
Combine an investment support strategy for high-potential sectors with export intelligence interventions to reduce firm discovery costs to introduce new products and reach new markets.
Enhance trade connectivity and value chain integration.
Facilitate labor mobility to promote trade in services, reduce nontariff barriers to trade in goods, and strengthen export promotion systems.
Close infrastructure gaps in key transport corridors and rebalance spending to invest in road and railway maintenance and in road safety.
Improve soft connectivity (focusing on border-crossings and trade and transport logistics).
5 The SCD team conducted interviews and workshops in FYR Macedonia with government officials, academics, civil society groups, private sector representatives, and development partners to guide identification of binding constraints and successful experiences of growth and inclusion (see Chapter 7).
SEIZING A BRIGHTER FUTURE FOR ALL
O-25OVERVIEW OF THE DIAGNOSTIC
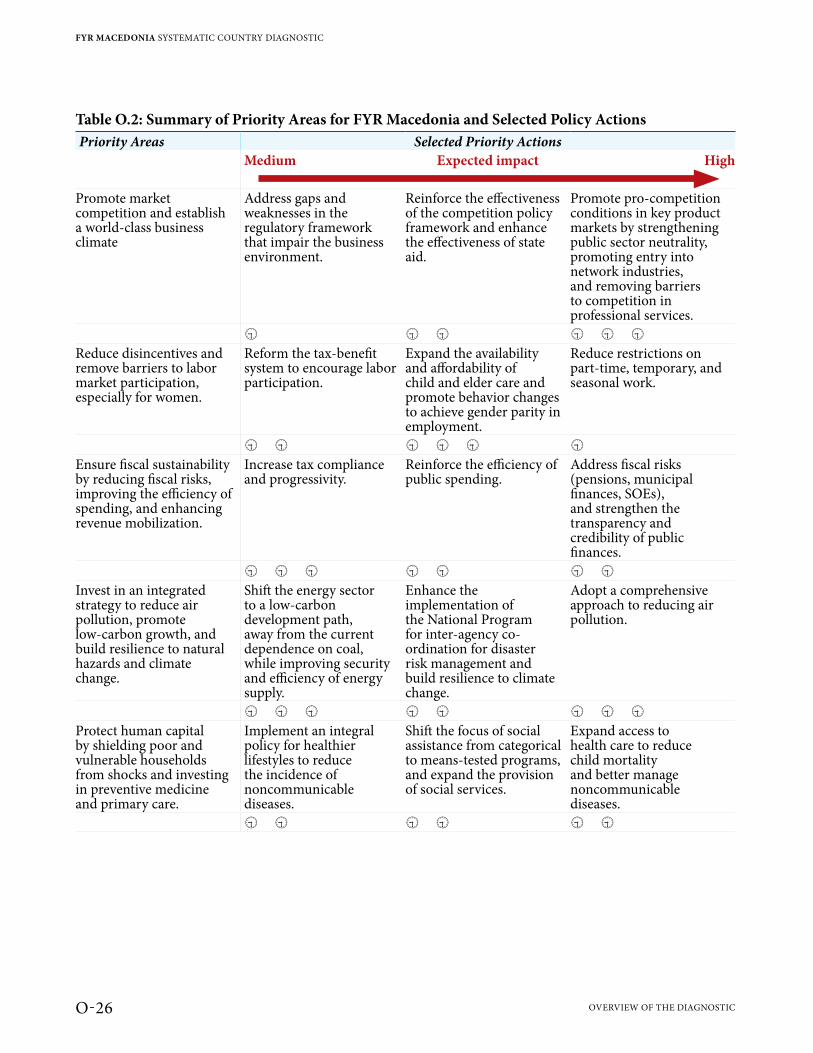
Table O.2: Summary of Priority Areas for FYR Macedonia and Selected Policy ActionsPriority Areas Selected Priority Actions
Medium Expected impact High
Promote market competition and establish a world-class business climate
Address gaps and weaknesses in the regulatory framework that impair the business environment.
Reinforce the effectiveness of the competition policy framework and enhance the effectiveness of state aid.
Promote pro-competition conditions in key product markets by strengthening public sector neutrality, promoting entry into network industries, and removing barriers to competition in professional services.
Reduce disincentives and remove barriers to labor market participation, especially for women.
Reform the tax-benefit system to encourage labor participation.
Expand the availability and affordability of child and elder care and promote behavior changes to achieve gender parity in employment.
Reduce restrictions on part-time, temporary, and seasonal work.
Ensure fiscal sustainability by reducing fiscal risks, improving the efficiency of spending, and enhancing revenue mobilization.
Increase tax compliance and progressivity.
Reinforce the efficiency of public spending.
Address fiscal risks (pensions, municipal finances, SOEs), and strengthen the transparency and credibility of public finances.
Invest in an integrated strategy to reduce air pollution, promote low-carbon growth, and build resilience to natural hazards and climate change.
Shift the energy sector to a low-carbon development path, away from the current dependence on coal, while improving security and efficiency of energy supply.
Enhance the implementation of the National Program for inter-agency co-ordination for disaster risk management and build resilience to climate change.
Adopt a comprehensive approach to reducing air pollution.
Protect human capital by shielding poor and vulnerable households from shocks and investing in preventive medicine and primary care.
Implement an integral policy for healthier lifestyles to reduce the incidence of noncommunicable diseases.
Shift the focus of social assistance from categorical to means-tested programs, and expand the provision of social services.
Expand access to health care to reduce child mortality and better manage noncommunicable diseases.
FYR MACEDONIA SYSTEMATIC COUNTRY DIAGNOSTIC
O-26 OVERVIEW OF THE DIAGNOSTIC
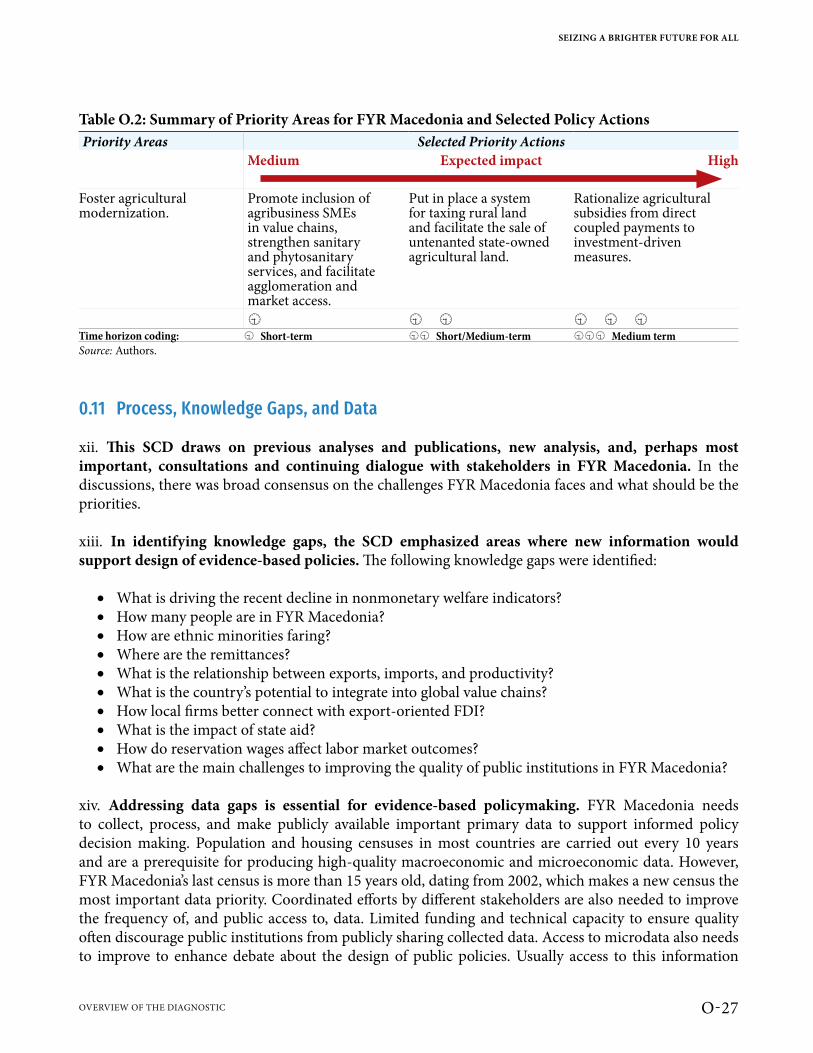
Table O.2: Summary of Priority Areas for FYR Macedonia and Selected Policy ActionsPriority Areas Selected Priority Actions
Medium Expected impact High
Foster agricultural modernization.
Promote inclusion of agribusiness SMEs in value chains, strengthen sanitary and phytosanitary services, and facilitate agglomeration and market access.
Put in place a system for taxing rural land and facilitate the sale of untenanted state-owned agricultural land.
Rationalize agricultural subsidies from direct coupled payments to investment-driven measures.
Time horizon coding: Short-term Short/Medium-term Medium termSource: Authors.
0.11 Process, Knowledge Gaps, and Data
xii. This SCD draws on previous analyses and publications, new analysis, and, perhaps most important, consultations and continuing dialogue with stakeholders in FYR Macedonia. In the discussions, there was broad consensus on the challenges FYR Macedonia faces and what should be the priorities.
xiii. In identifying knowledge gaps, the SCD emphasized areas where new information would support design of evidence-based policies. The following knowledge gaps were identified:
• What is driving the recent decline in nonmonetary welfare indicators? • How many people are in FYR Macedonia? • How are ethnic minorities faring? • Where are the remittances? • What is the relationship between exports, imports, and productivity? • What is the country’s potential to integrate into global value chains? • How local firms better connect with export-oriented FDI? • What is the impact of state aid? • How do reservation wages affect labor market outcomes? • What are the main challenges to improving the quality of public institutions in FYR Macedonia?
xiv. Addressing data gaps is essential for evidence-based policymaking. FYR Macedonia needs to collect, process, and make publicly available important primary data to support informed policy decision making. Population and housing censuses in most countries are carried out every 10 years and are a prerequisite for producing high-quality macroeconomic and microeconomic data. However, FYR Macedonia’s last census is more than 15 years old, dating from 2002, which makes a new census the most important data priority. Coordinated efforts by different stakeholders are also needed to improve the frequency of, and public access to, data. Limited funding and technical capacity to ensure quality often discourage public institutions from publicly sharing collected data. Access to microdata also needs to improve to enhance debate about the design of public policies. Usually access to this information
SEIZING A BRIGHTER FUTURE FOR ALL
O-27OVERVIEW OF THE DIAGNOSTIC
requires lengthy processes and is sometimes only possible through safe-rooms on premises or restrictive agreements. The SCD team is especially grateful to the authorities of FYR Macedonia for granting significant access to data for this analysis, including household- and firm-level microdata.
xv. The policy priorities presented here are grounded in today’s reality; the world of tomorrow will bring additional challenges and opportunities. Rapidly changing technology will call for economies with flexible regulation, resource allocation, firm capacity to absorb new technologies, and capacity to adapt skills to demand. The future may see self-driving trucks in FYR Macedonia, some manufacturing jobs taken by robots, and smart farms that can edit plant DNA. What might all this mean for FYR Macedonia, and what can the country do to prepare for new challenges and seize new opportunities? If the government acts on the areas identified in this SCD, Macedonian workers and firms would be better prepared to learn and to use new technologies, and take advantage of opportunities where markets are growing.
0.12 Structure of the SCD
xvi. Chapter 1 presents the country context. Chapter 2 analyzes poverty, shared prosperity, and the labor market. Chapter 3 assesses trends and drivers of growth and job creation. These chapters thus build the evidence that supports the SCD conclusion that FYR Macedonia needs to increase productivity, enhance job opportunities for all, and ensure the sustainability of development gains. Chapters 4 to 6 present three pathways to achieving these objectives: Fostering a More Dynamic and Competitive Private Sector; Developing More Competitive and Adaptive Human Capital and Closing Opportunity Gaps; and Achieving Sustainability Through Effective Governance, Fiscal Prudence, and Enhanced Environmental Management and Resilience to Natural Hazards. Finally, Chapter 7 offers policy priorities as a foundation for dialogue in FYR Macedonia.
FYR Macedonia Systematic Country Diagnostic | Seizing a Brighter Future for AllFYR MACEDONIA SYSTEMATIC COUNTRY DIAGNOSTIC
O-28 OVERVIEW OF THE DIAGNOSTIC
FYR Macedonia Systematic Country Diagnostic | Seizing a Brighter Future for All
Chapter 1. Country Context
Zarko’s restaurant has always been a popular place in Stip. Patrons like to stay a while to talk over current events. Because he likes to listen, he has collected many stories over the years. Like those from the earthquake in 1963 and how difficult it was for families to start again. Or the stories about children moving to Australia and sending back pictures with kangaroos. He has also seen how
moods about the prospects for the country come and go in response to all the back and forth about the country’s name and the possibility of joining the European Union. He hopes that the name issue gets resolved soon so that together with his fellow citizens they look forward to what the future might bring.
Reshat AmetiFrom Tradition
Chapter 1. Country Context
1.1 FYR Macedonia Is a Small Middle-Income Country with a Strategic but Natural Hazard-Prone Location and Demographic Challenges
1. The Former Yugoslav Republic (FYR) of Macedonia is a small, landlocked, upper-middle-income country in the Balkan peninsula. Based on the last census in 2002, its population is estimated at about 2 million, nearly 25 percent of whom live in the capital, Skopje, and about 40 percent live in rural areas. Covering an area slightly smaller than Belgium, landlocked FYR Macedonia borders Albania, Bulgaria, Greece, Kosovo, and Serbia. Its geography is defined by a central valley formed by the Vardar river and framed along its borders by mountain ranges; about 80 percent of its territory consists of hills and mountains. The country is strategically located at the crossroads of two main European transport corridors, though it depends on its neighbors for the transit of goods. The closest port is Thessaloniki in Greece, about 90 kilometers south of the border by road.6 In 2017, its gross domestic product (GDP) per capita was about US$13,600, some 36 percent of the average for the twenty-eight European Union (EU) member states.
2. FYR Macedonia has been multiethnic throughout its history. Like much of the Western Balkan region, the country has historically been a junction of many cultures and ethnicities. According to the last census in 2002, ethnic Macedonians made up 64 percent of the total population, ethnic Albanians 25 percent, other ethnicities such as Turks about 4 percent, and Roma about 3 percent (Figure 1.1).7 The share of ethnic Macedonians has declined slightly since the 1950s, and between 1953 and 2005 the share of ethnic Albanians went up from 12.5 to 25 percent; however, since it has been 16 years since the last census, it is not possible to accurately estimate the current ethnic distribution. Despite differences, they have been able to coexist in a relatively peaceful manner, but at times there have been tensions that have had serious consequences for the country’s development.
3. An aging population and a long tradition of emigration pose demographic challenges. FYR Macedonia's population is aging and will continue to do so (Figure 1.2). The fertility rate has declined from 2.17 in 1991 to only 1.5 in 2016, lower than the average for Europe and Central Asia (1.94). Estimated population growth is near zero8. The long and continuing tradition of emigration is a further complication. Estimates based on census data from destination countries suggest that more than 500,000 people, about 25 percent of the estimated current domestic population, resides abroad, one of the largest diasporas in the world and only behind Bosnia and Herzegovina and Albania in the Western Balkans (Figure 1.3). Emigrants tend to move to more developed countries, especially those in Western
6 Two pan-European corridors intersect the country (Corridor VIII running east-west and Corridor x running north-south), but road quality and an incomplete rail route for Corridor VIII limit their utility.
7 More recently it has been estimated that Roma could constitute about 12 percent of the population. See Ringold, D., Orenstein, M.A. and Wilkens, E. (2005).
8 World Development Indicators.
FYR MACEDONIA SYSTEMATIC COUNTRY DIAGNOSTIC
2 CHAPTER 1. COUNTRY CONTExT
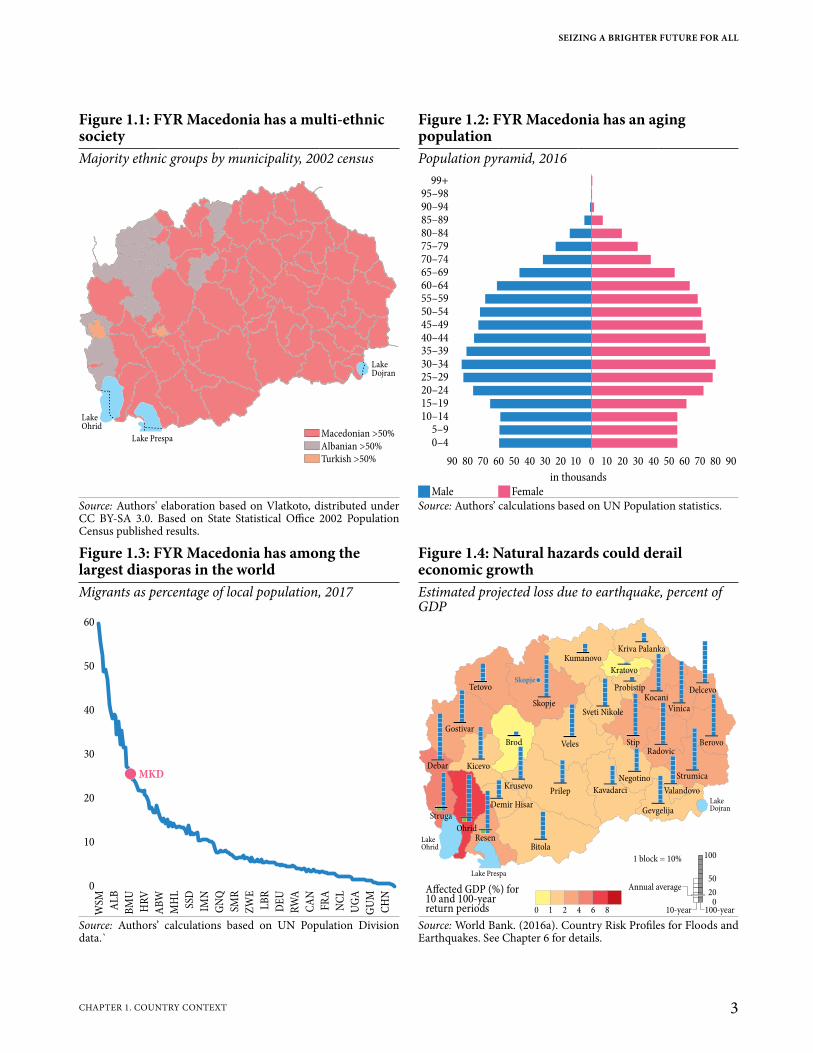
Figure 1.3: FYR Macedonia has among the largest diasporas in the world
Figure 1.4: Natural hazards could derail economic growth
Migrants as percentage of local population, 2017 Estimated projected loss due to earthquake, percent of GDP
60
50
40
30
20
10
0
WSM AL
B
BM
U
HR
V
AB
W
MH
L
SSD
IMN
GN
Q
SMR
ZW
E
LB
R
DE
U
RW
A
CA
N
FR
A
NC
L
UG
A
GU
M
CH
N
MKD
LakeDojran
LakeOhrid
Lake Prespa
Delcevo
Berovo
Strumica
RadovicStip
KocaniProbistip
Kratovo
Kriva PalankaKumanovo
Skopje
Tetovo
Gostivar
Debar
Struga
OhridResen
Bitola
Demir Hisar
KrusevoPrilep
Brod
Kicevo
Kavadarci
Negotino
Veles
Gevgelija
Valandovo
Skopje
Sveti Nikole Vinica
100
50
020
10-year 100-year
Annual average
0 1 2 4 6 8
Affected GDP (%) for10 and 100-yearreturn periods
1 block = 10%
Source: Authors’ calculations based on UN Population Division data.`
Source: World Bank. (2016a). Country Risk Profiles for Floods and Earthquakes. See Chapter 6 for details.
Figure 1.1: FYR Macedonia has a multi-ethnic society
Figure 1.2: FYR Macedonia has an aging population
Majority ethnic groups by municipality, 2002 census Population pyramid, 2016
Macedonian >50%
Albanian >50%
Turkish >50%
LakeDojran
LakeOhrid
Lake Prespa
90 80 70 60 50 40 30 20 10 0 10 20 30 40 50 60 70 80 90
99+
95–98
90–94
85–89
80–84
75–79
70–74
65–69
60–64
55–59
50–54
45–49
40–44
35–39
30–34
25–29
20–24
15–19
10–14
5–9
0–4
in thousands JMale JFemale
Source: Authors' elaboration based on Vlatkoto, distributed under CC BY-SA 3.0. Based on State Statistical Office 2002 Population Census published results.
Source: Authors’ calculations based on UN Population statistics.
SEIZING A BRIGHTER FUTURE FOR ALL
3CHAPTER 1. COUNTRY CONTExT
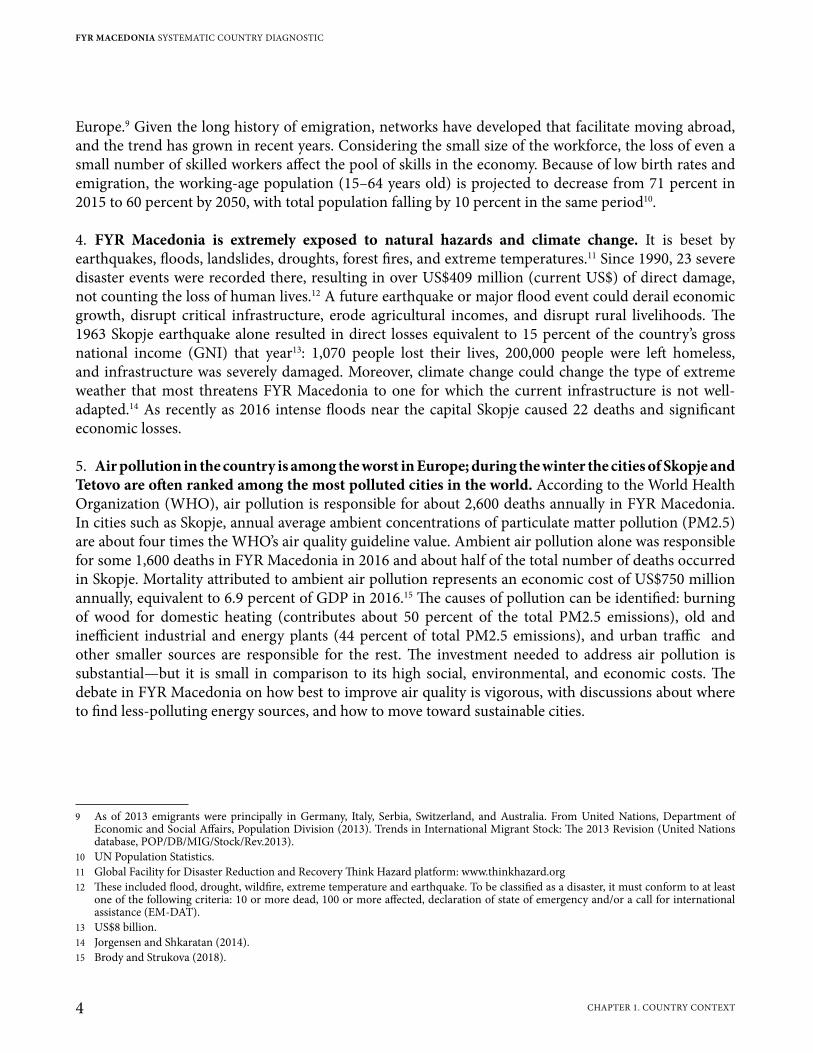
Europe.9 Given the long history of emigration, networks have developed that facilitate moving abroad, and the trend has grown in recent years. Considering the small size of the workforce, the loss of even a small number of skilled workers affect the pool of skills in the economy. Because of low birth rates and emigration, the working-age population (15–64 years old) is projected to decrease from 71 percent in 2015 to 60 percent by 2050, with total population falling by 10 percent in the same period10.
4. FYR Macedonia is extremely exposed to natural hazards and climate change. It is beset by earthquakes, floods, landslides, droughts, forest fires, and extreme temperatures.11 Since 1990, 23 severe disaster events were recorded there, resulting in over US$409 million (current US$) of direct damage, not counting the loss of human lives.12 A future earthquake or major flood event could derail economic growth, disrupt critical infrastructure, erode agricultural incomes, and disrupt rural livelihoods. The 1963 Skopje earthquake alone resulted in direct losses equivalent to 15 percent of the country’s gross national income (GNI) that year13: 1,070 people lost their lives, 200,000 people were left homeless, and infrastructure was severely damaged. Moreover, climate change could change the type of extreme weather that most threatens FYR Macedonia to one for which the current infrastructure is not well-adapted.14 As recently as 2016 intense floods near the capital Skopje caused 22 deaths and significant economic losses.
5. Air pollution in the country is among the worst in Europe; during the winter the cities of Skopje and Tetovo are often ranked among the most polluted cities in the world. According to the World Health Organization (WHO), air pollution is responsible for about 2,600 deaths annually in FYR Macedonia. In cities such as Skopje, annual average ambient concentrations of particulate matter pollution (PM2.5) are about four times the WHO’s air quality guideline value. Ambient air pollution alone was responsible for some 1,600 deaths in FYR Macedonia in 2016 and about half of the total number of deaths occurred in Skopje. Mortality attributed to ambient air pollution represents an economic cost of US$750 million annually, equivalent to 6.9 percent of GDP in 2016.15 The causes of pollution can be identified: burning of wood for domestic heating (contributes about 50 percent of the total PM2.5 emissions), old and inefficient industrial and energy plants (44 percent of total PM2.5 emissions), and urban traffic and other smaller sources are responsible for the rest. The investment needed to address air pollution is substantial—but it is small in comparison to its high social, environmental, and economic costs. The debate in FYR Macedonia on how best to improve air quality is vigorous, with discussions about where to find less-polluting energy sources, and how to move toward sustainable cities.
9 As of 2013 emigrants were principally in Germany, Italy, Serbia, Switzerland, and Australia. From United Nations, Department of Economic and Social Affairs, Population Division (2013). Trends in International Migrant Stock: The 2013 Revision (United Nations database, POP/DB/MIG/Stock/Rev.2013).
10 UN Population Statistics.11 Global Facility for Disaster Reduction and Recovery Think Hazard platform: www.thinkhazard.org12 These included flood, drought, wildfire, extreme temperature and earthquake. To be classified as a disaster, it must conform to at least
one of the following criteria: 10 or more dead, 100 or more affected, declaration of state of emergency and/or a call for international assistance (EM-DAT).
13 US$8 billion.14 Jorgensen and Shkaratan (2014).15 Brody and Strukova (2018).
FYR MACEDONIA SYSTEMATIC COUNTRY DIAGNOSTIC
4 CHAPTER 1. COUNTRY CONTExT
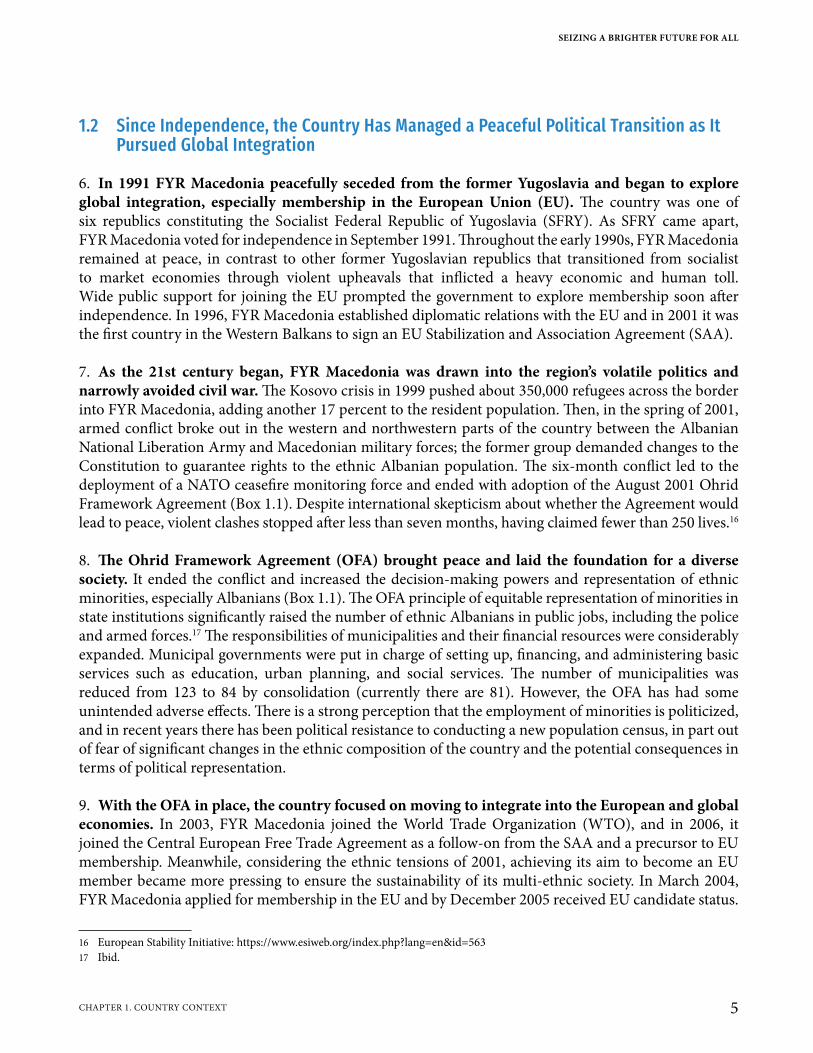
1.2 Since Independence, the Country Has Managed a Peaceful Political Transition as It Pursued Global Integration
6. In 1991 FYR Macedonia peacefully seceded from the former Yugoslavia and began to explore global integration, especially membership in the European Union (EU). The country was one of six republics constituting the Socialist Federal Republic of Yugoslavia (SFRY). As SFRY came apart, FYR Macedonia voted for independence in September 1991. Throughout the early 1990s, FYR Macedonia remained at peace, in contrast to other former Yugoslavian republics that transitioned from socialist to market economies through violent upheavals that inflicted a heavy economic and human toll. Wide public support for joining the EU prompted the government to explore membership soon after independence. In 1996, FYR Macedonia established diplomatic relations with the EU and in 2001 it was the first country in the Western Balkans to sign an EU Stabilization and Association Agreement (SAA).
7. As the 21st century began, FYR Macedonia was drawn into the region’s volatile politics and narrowly avoided civil war. The Kosovo crisis in 1999 pushed about 350,000 refugees across the border into FYR Macedonia, adding another 17 percent to the resident population. Then, in the spring of 2001, armed conflict broke out in the western and northwestern parts of the country between the Albanian National Liberation Army and Macedonian military forces; the former group demanded changes to the Constitution to guarantee rights to the ethnic Albanian population. The six-month conflict led to the deployment of a NATO ceasefire monitoring force and ended with adoption of the August 2001 Ohrid Framework Agreement (Box 1.1). Despite international skepticism about whether the Agreement would lead to peace, violent clashes stopped after less than seven months, having claimed fewer than 250 lives.16
8. The Ohrid Framework Agreement (OFA) brought peace and laid the foundation for a diverse society. It ended the conflict and increased the decision-making powers and representation of ethnic minorities, especially Albanians (Box 1.1). The OFA principle of equitable representation of minorities in state institutions significantly raised the number of ethnic Albanians in public jobs, including the police and armed forces.17 The responsibilities of municipalities and their financial resources were considerably expanded. Municipal governments were put in charge of setting up, financing, and administering basic services such as education, urban planning, and social services. The number of municipalities was reduced from 123 to 84 by consolidation (currently there are 81). However, the OFA has had some unintended adverse effects. There is a strong perception that the employment of minorities is politicized, and in recent years there has been political resistance to conducting a new population census, in part out of fear of significant changes in the ethnic composition of the country and the potential consequences in terms of political representation.
9. With the OFA in place, the country focused on moving to integrate into the European and global economies. In 2003, FYR Macedonia joined the World Trade Organization (WTO), and in 2006, it joined the Central European Free Trade Agreement as a follow-on from the SAA and a precursor to EU membership. Meanwhile, considering the ethnic tensions of 2001, achieving its aim to become an EU member became more pressing to ensure the sustainability of its multi-ethnic society. In March 2004, FYR Macedonia applied for membership in the EU and by December 2005 received EU candidate status.
16 European Stability Initiative: https://www.esiweb.org/index.php?lang=en&id=56317 Ibid.
SEIZING A BRIGHTER FUTURE FOR ALL
5CHAPTER 1. COUNTRY CONTExT

However, as described below, the country’s global integration momentum was diverted by the name issue.
10. A long-standing dispute with Greece over use of the name “Macedonia” has inflicted political, and economic, damage. After FYR Macedonia declared its independence from the former Yugoslavia in 1991, a dispute arose with Greece about the country’s constitutional name (Republic of Macedonia).18 Since 1993, when the country joined the United Nations (UN) under the provisional name “The Former Yugoslav Republic of Macedonia,” negotiations with Greece, mediated by the UN, have been underway to find a permanent and mutually acceptable solution to the name dispute. A Greek trade embargo in 1994–95 closed the border. Relations with Greece then eased until 2008, when Greece vetoed FYR Macedonia’s invitation to join NATO, which renewed the political tensions. Then, accession negotiations with the EU were postponed repeatedly. In 2012, the European Commission (EC) launched a high-level accession dialogue and recommended a parallel start of accession negotiations, subject to resolution of the country’s name; however, the attempt failed. Recent EU progress reports for the country have emphasized the importance of finally resolving this dispute, stating that “It remains essential that decisive steps are taken towards resolving the “Name Dispute” with Greece. The failure of the parties to this dispute to reach a compromise after 19 years of UN-mediated talks is having a direct and adverse impact on the country’s European aspirations” (Box 1.2).19
18 The roots of this conflict can be traced back to Yugoslavian times and involve Greek suspicions about a potential territorial claim by Yugoslavia to the Greek province of Macedonia.
19 European Commission (2014).
Box 1.1: The Ohrid Framework Agreement
The Ohrid Framework Agreement (OFA) was signed in August 2001; its immediate aim was to stop the armed conflict between ethnic Albanians and Macedonians and it had a longer-term goal of promoting ethnic and social cohesion. The OFA was built on five basic principles: (1) It rejected, completely and unconditionally, the use of violence in pursuit of political aims, asserting that only peaceful political solutions can assure a stable and democratic future for FYR Macedonia. (2) FYR Macedonia's sovereignty and territorial integrity and the unitary character of the State are inviolable and must be preserved. There are no territorial solutions to ethnic issues. (3) The multiethnic character of FYR Macedonia's society must be preserved and reflected in public life; for instance, at the municipal level a language becomes official if spoken by 20 percent of the population. (4) A modern democratic State in the natural course of its development and maturation must continually ensure that its Constitution fully meets the needs of all its citizens and meets the highest international standards as they continue to evolve. (5) Local self-government is essential for encouraging the participation of citizens in democratic life, and for promoting respect for the identity of communities. The latter three principles defined a roadmap for social cohesion between the ethnic Macedonian majority and ethnic minorities. Between 2001 and 2003 Parliament ratified these changes. They attracted substantial support from the international community and helped the country advance its EU accession agenda.Source: Authors based on the Ohrid Framework Agreement.
FYR MACEDONIA SYSTEMATIC COUNTRY DIAGNOSTIC
6 CHAPTER 1. COUNTRY CONTExT
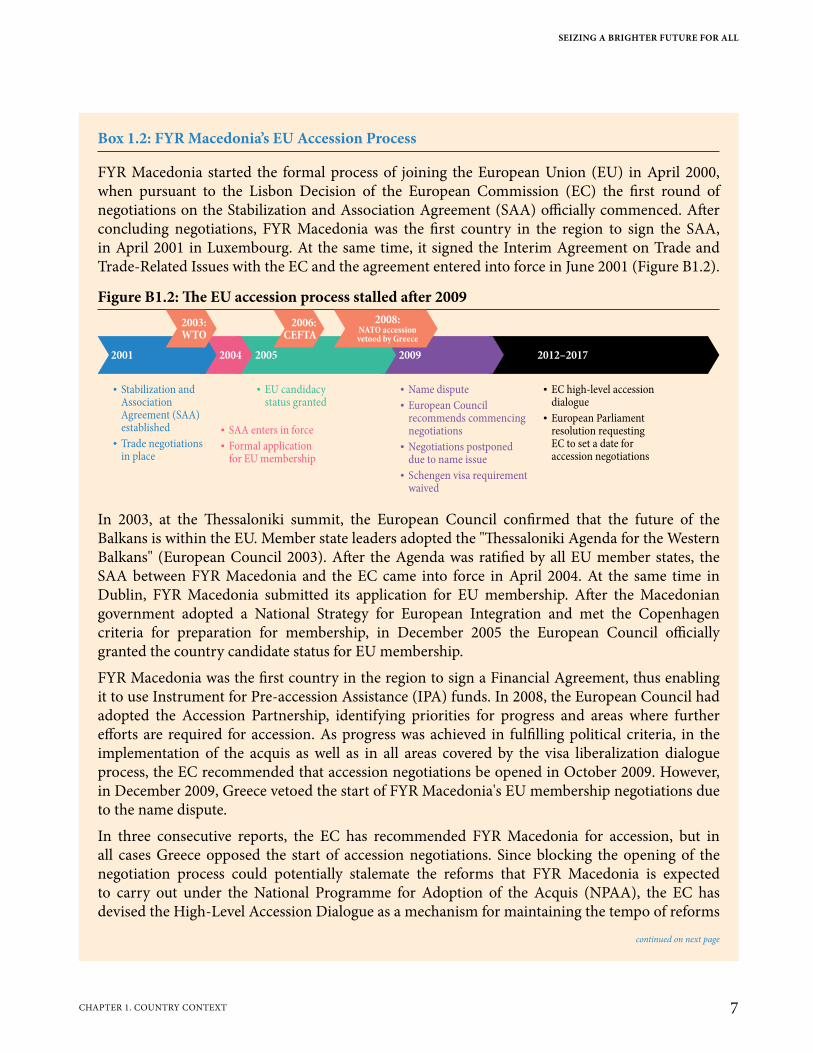
Box 1.2: FYR Macedonia’s EU Accession Process
FYR Macedonia started the formal process of joining the European Union (EU) in April 2000, when pursuant to the Lisbon Decision of the European Commission (EC) the first round of negotiations on the Stabilization and Association Agreement (SAA) officially commenced. After concluding negotiations, FYR Macedonia was the first country in the region to sign the SAA, in April 2001 in Luxembourg. At the same time, it signed the Interim Agreement on Trade and Trade-Related Issues with the EC and the agreement entered into force in June 2001 (Figure B1.2).
Figure B1.2: The EU accession process stalled after 2009
2001 2004 2005 2009 2012–2017
2003:WTO
2006:CEFTA
2008:NATO accessionvetoed by Greece
� Trade negotiationsin place
� Stabilization andAssociationAgreement (SAA)established � SAA enters in force
� Formal applicationfor EU membership
� EU candidacystatus granted
� Name dispute
� European Councilrecommends commencingnegotiations
� Negotiations postponeddue to name issue
� Schengen visa requirementwaived
� EC high-level accessiondialogue
� European Parliamentresolution requestingEC to set a date foraccession negotiations
In 2003, at the Thessaloniki summit, the European Council confirmed that the future of the Balkans is within the EU. Member state leaders adopted the "Thessaloniki Agenda for the Western Balkans" (European Council 2003). After the Agenda was ratified by all EU member states, the SAA between FYR Macedonia and the EC came into force in April 2004. At the same time in Dublin, FYR Macedonia submitted its application for EU membership. After the Macedonian government adopted a National Strategy for European Integration and met the Copenhagen criteria for preparation for membership, in December 2005 the European Council officially granted the country candidate status for EU membership.
FYR Macedonia was the first country in the region to sign a Financial Agreement, thus enabling it to use Instrument for Pre-accession Assistance (IPA) funds. In 2008, the European Council had adopted the Accession Partnership, identifying priorities for progress and areas where further efforts are required for accession. As progress was achieved in fulfilling political criteria, in the implementation of the acquis as well as in all areas covered by the visa liberalization dialogue process, the EC recommended that accession negotiations be opened in October 2009. However, in December 2009, Greece vetoed the start of FYR Macedonia's EU membership negotiations due to the name dispute.
In three consecutive reports, the EC has recommended FYR Macedonia for accession, but in all cases Greece opposed the start of accession negotiations. Since blocking the opening of the negotiation process could potentially stalemate the reforms that FYR Macedonia is expected to carry out under the National Programme for Adoption of the Acquis (NPAA), the EC has devised the High-Level Accession Dialogue as a mechanism for maintaining the tempo of reforms
continued on next page
SEIZING A BRIGHTER FUTURE FOR ALL
7CHAPTER 1. COUNTRY CONTExT
1.3 FYR Macedonia Established Solid Macroeconomic Fundamentals and Attracted Foreign Investment
11. At independence FYR Macedonia inherited difficult economic conditions: it was the second poorest part of the Yugoslavia, with income per capita in 1984 at 65 percent of the SFYR average; it also accounted for only about 5 percent of total SFYR output and 7 percent of its population.20 The Macedonian economy was closely integrated with those of the other republics. By the mid-1980s, SFYR’s economy had fallen into deep recession, and unemployment in FYR Macedonia was almost 20 percent.21 After independence, the new country was confronted by a triple challenge: (1) transition to a market economy; (2) the need to recover from the long economic slump; and (3) the loss of (a) the single Yugoslavian market for its main industrial, agricultural, and other production and service capacities, (b) net transfers from the former Yugoslav federal government, and (c) its foreign exchange savings deposited in the National Bank of Yugoslavia (about US$1.2 billion). Suddenly, the domestic market went from about 20 million to 2 million. As a result, demand for the production of large-scale manufacturing plants in FYR Macedonia suffered, causing a steep decline in industrial output and a fall in GDP. Figure 1.5 shows the country’s trajectory of GDP per capita and highlights key events.
12. Regional conflict and international sanctions after independence exacerbated its economic struggles. The Greek trade embargo of 1994–95, which closed the southern border, cut off access to the port of Thessaloniki, the closest international port. At the same time, international sanctions against
20 FYR Macedonia had relied on solidarity contributions from wealthier regions, even though it had significant autonomy in mobilizing revenues and establishing tax rates. It was a recipient of the Federal Fund for Accelerated Development of the Less-Developed Regions (Bosnia and Herzegovina, FYR Macedonia, Montenegro, and later Kosovo), which was designed to reduce national disparities within Yugoslavia and to which all republics and provinces contributed. FYR Macedonia received about 17 percent of its investment resources from transfers.
21 In the early 1950s, SFRY replaced centralized economic planning with a more decentralized market-based system, introducing ‘worker self-management’ into industrial enterprises. It reduced the power of the federal government and granted the republics significant autonomy with regard to setting tax rates and raising revenue. It was open to trade and the emigration of labor to Western Europe. It was the only socialist economy with high unemployment.
and implementing the NPAA. The Dialogue, launched in March 2012, focused on freedom of expression in media, the rule of law, public administration reform, electoral reform, and building up trade. At the same time, the European Parliament voted on a resolution requesting the Council to set a date for accession negotiations, given the long delays.
In April 2018 the EC recommended opening accession negotiations. On June 12, 2018 an agreement was reached between FYR Macedonia’s Prime Minister and the Greek Prime Minister to resolve the name issue, and the country could be renamed the "Republic of North Macedonia". The Government of FYR Macedonia needs to confirm this agreement. On June 28, 2018 the European Council responded positively to the progress made by FYR Macedonia, and set out the path towards opening accession negotiations with the country in June 2019.Sources: Authors based on European Commission, European Council, and national authorities' data and information.
Box 1.2 continued from previous page
FYR MACEDONIA SYSTEMATIC COUNTRY DIAGNOSTIC
8 CHAPTER 1. COUNTRY CONTExT

FYR Macedonia’s northern neighbor, the Federal Republic of Yugoslavia (now Serbia), which was its main trading partner, interrupted its other main trade route and closed its main export market. These shocks, together with the inherited weaknesses of the economy, brought about a deep recession. After independence in 1991, GDP fell by 21 percent in five years (a pattern like that in other countries of Central and Southeastern Europe and the Baltics).22 In 1996, however, the country recorded its first positive growth rate since 1986.
13. FYR Macedonia sought early on to achieve a stable macroeconomic environment, which served the country well in managing subsequent shocks, especially the global financial crisis of 2008–09. In 1991, the Macedonian authorities had to deal with high inflation and a lack of international reserves. Exchange rate stabilization, introduced in 1994, had the support of the international community. FYR Macedonia introduced a pre-announced crawling peg for its new currency, the denar, against the deutschmark and indexed wages to the inflation rate. The country has kept prices stable ever since, with the exchange rate, now pegged to the euro, holding inflation at single-digit levels. Public debt stock as a percentage of the GDP was below 23 percent until the 2008–09 global financial crisis. Government revenues averaged 32 percent of GDP in 2003–08 and were 30 percent in 2016. Not only did the economy avoid major macroeconomic imbalances that could have deepened the negative impact of external shocks, but the authorities had enough fiscal space to adopt countercyclical policies during the global crisis of 2008–09 and the Greek crisis of 2011–12.
14. Since the early 2000s, the country has undertaken major reforms to promote private investment. Among these have been initiatives to reduce the burden of business regulations and the time to register a business. The government also completed the land cadaster and real estate registry, reinforced the financial system and financial system regulation, and made the labor market more flexible. The result
22 These countries underwent an average of 3.8 consecutive years of output decline following transition and an average cumulative output decline of 23 percent. See World Bank (2003). FYR Macedonia: Country Economic Memorandum—Tackling Unemployment.
Figure 1.5: FYR Macedonia’s economic outcomes are affected by political eventsGDP per capita (2011 PPP USD) and key political events, 1990–2017, and projections for 2018–2019
15,000
14,000
13,000
12,000
11,000
10,000
9,000
8,000
7,000
1990 1993 1996 1999 2002 2005 2008 2011 2014 2017 2018p
2019p
Independence
Greektrade embargo
Kosovoconflict
Internalconflict
Reforms/FDI
Global crisis
Political crisis
Source: Authors’ calculations based on data from national authorities and WDI; World Bank projections for 2018–2019.
SEIZING A BRIGHTER FUTURE FOR ALL
9CHAPTER 1. COUNTRY CONTExT
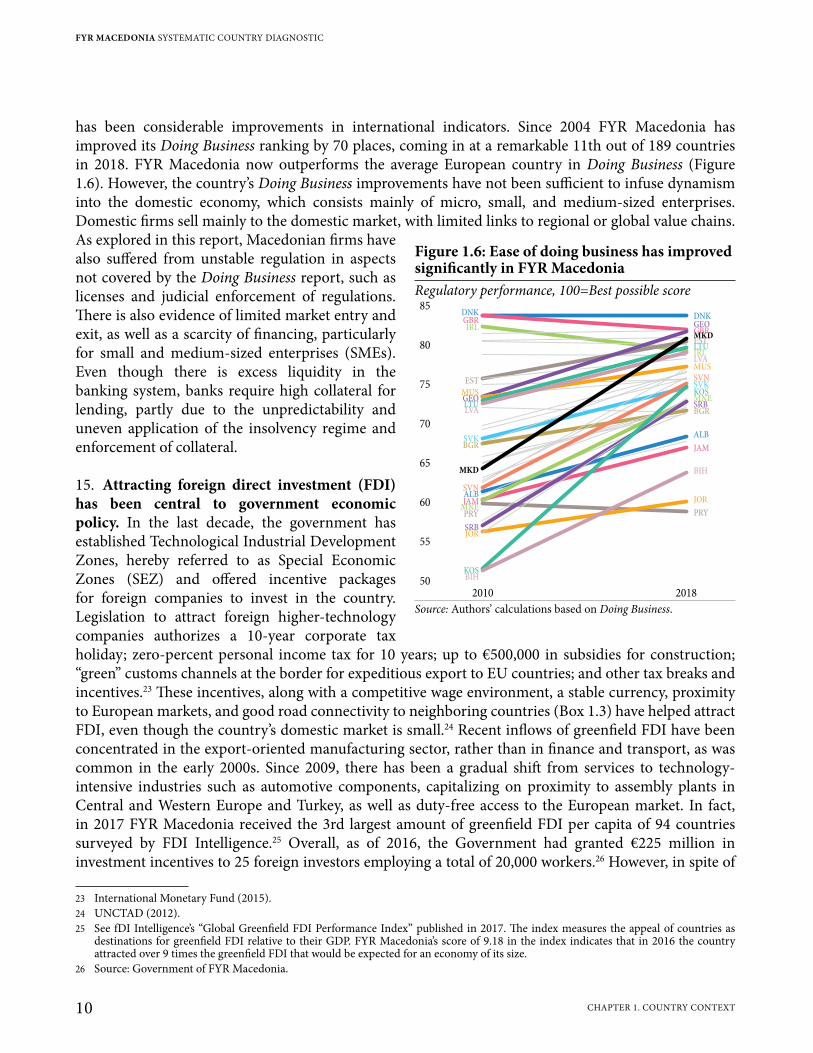
has been considerable improvements in international indicators. Since 2004 FYR Macedonia has improved its Doing Business ranking by 70 places, coming in at a remarkable 11th out of 189 countries in 2018. FYR Macedonia now outperforms the average European country in Doing Business (Figure 1.6). However, the country’s Doing Business improvements have not been sufficient to infuse dynamism into the domestic economy, which consists mainly of micro, small, and medium-sized enterprises. Domestic firms sell mainly to the domestic market, with limited links to regional or global value chains. As explored in this report, Macedonian firms have also suffered from unstable regulation in aspects not covered by the Doing Business report, such as licenses and judicial enforcement of regulations. There is also evidence of limited market entry and exit, as well as a scarcity of financing, particularly for small and medium-sized enterprises (SMEs). Even though there is excess liquidity in the banking system, banks require high collateral for lending, partly due to the unpredictability and uneven application of the insolvency regime and enforcement of collateral.
15. Attracting foreign direct investment (FDI) has been central to government economic policy. In the last decade, the government has established Technological Industrial Development Zones, hereby referred to as Special Economic Zones (SEZ) and offered incentive packages for foreign companies to invest in the country. Legislation to attract foreign higher-technology companies authorizes a 10-year corporate tax holiday; zero-percent personal income tax for 10 years; up to €500,000 in subsidies for construction; “green” customs channels at the border for expeditious export to EU countries; and other tax breaks and incentives.23 These incentives, along with a competitive wage environment, a stable currency, proximity to European markets, and good road connectivity to neighboring countries (Box 1.3) have helped attract FDI, even though the country’s domestic market is small.24 Recent inflows of greenfield FDI have been concentrated in the export-oriented manufacturing sector, rather than in finance and transport, as was common in the early 2000s. Since 2009, there has been a gradual shift from services to technology-intensive industries such as automotive components, capitalizing on proximity to assembly plants in Central and Western Europe and Turkey, as well as duty-free access to the European market. In fact, in 2017 FYR Macedonia received the 3rd largest amount of greenfield FDI per capita of 94 countries surveyed by FDI Intelligence.25 Overall, as of 2016, the Government had granted €225 million in investment incentives to 25 foreign investors employing a total of 20,000 workers.26 However, in spite of
23 International Monetary Fund (2015).24 UNCTAD (2012).25 See fDI Intelligence’s “Global Greenfield FDI Performance Index” published in 2017. The index measures the appeal of countries as
destinations for greenfield FDI relative to their GDP. FYR Macedonia’s score of 9.18 in the index indicates that in 2016 the country attracted over 9 times the greenfield FDI that would be expected for an economy of its size.
26 Source: Government of FYR Macedonia.
Figure 1.6: Ease of doing business has improved significantly in FYR MacedoniaRegulatory performance, 100=Best possible score
MKD
85
80
75
70
65
60
55
502010 2018
DNKGBRIRL
EST
GEOMUS
LVALTU
SVKBGR
MKD
SVNALB
MNEJAM
PRY
SRBJOR
KOSBIH
DNK
GBR
IRL
EST
GEO
MUSLVA
LTU
SVK
BGR
SVN
ALB
MNE
JAM
PRY
SRB
JOR
KOS
BIH
Source: Authors’ calculations based on Doing Business.
FYR MACEDONIA SYSTEMATIC COUNTRY DIAGNOSTIC
10 CHAPTER 1. COUNTRY CONTExT

the sizeable fiscal costs, FYR Macedonia’s exports, which were estimated at 50 percent of GDP in 2016, are below the levels seen in the country’s aspirational peers, where the average is more than 70 percent. There have also been few spillovers to other sectors of the economy; at yearend 2016, domestic purchases by international investors accounted for just 1 percent of total exports that year.
1.4 An Incomplete Economic Transition and Vulnerable State Institutions are Serious Structural Challenges
16. The transition to a well-functioning market economy has not yet been completed. Early progress on macroeconomic stabilization and continuing market reforms are undermined by sluggish advances on governance and institutional capacity-building, although the government now plans to address these problems. A case in point is the Transition Indicators produced by the European Bank for Reconstruction and Development (EBRD), which track progress in structural reforms. As Figure 1.7 shows, it took only 1 year for the country to liberalize prices and to reach a score of 3.7 (equivalent to close-to-large-scale price liberalization and almost full adoption of market-based prices for public procurement). The country was also among the early reformers in trade and foreign exchange systems (it removed most tariff, trade and currency restrictions) and in privatization of small-scale companies (small companies are now fully privatized with tradable ownership rights). However, in three other areas the country has fallen behind in reform outcomes, especially compared to fast-converging countries like Estonia, which in 1989 was at or below FYR Macedonia’s level. For instance, it took Estonia 6 years to reach a score of 4 in large-scale privatizations, but in FYR Macedonia, by 2014 the score was still 3.3, below the 3.5 average
Box 1.3: Connectivity Is Central to FYR Macedonia’s Global Integration and Development
The government has invested heavily in ensuring the connectivity of the country given its strategic location at the crossroads of two transport corridors that link the Western Balkans with EU member states. FYR Macedonia’s closest port is Thessaloniki in Greece, about 90 kilometers by road south of the border. Two pan-European corridors intersect the country, Corridor VIII running east-west and Corridor x, the busiest in the Western Balkans region, running north-south). Significant investment has been mobilized for Corridor x and increasingly it provides a high-quality transit route. The transport network also serves the main industrial areas, TIDZs, tourist sites, and the main agricultural production areas (Figure B1.3). However, business surveys continue to point out the lack of high-quality road infrastructure as a serious constraint on their businesses. Expediting completion of these corridors and addressing backlogged maintenance on the rest of the network is vital if the economy is to be competitive.
Figure B1.3: Important regional corridors connect the countryKey routes and industry locations in FYR Macedonia
30 km
20 mi
Strumica
Radovic
Stip
KocaniSkopjeTetovo
Gostivar
StrugaOhrid
Bitola
Prilep
Kicevo
Kavadarci
Veles
Gevgelija
Sveti Nikole
Kriva PalankaKumanovoTearce
BogovinjeZelino
Lipkovo
To Greece
To Greece
To Sofia
To SerbiaTo Kosovo
To Albania
Tourist routeTrade route
Agricultural land
Auto manufacturingEnergy production
Source: Authors’ elaboration based on data from national authorities.
SEIZING A BRIGHTER FUTURE FOR ALL
11CHAPTER 1. COUNTRY CONTExT
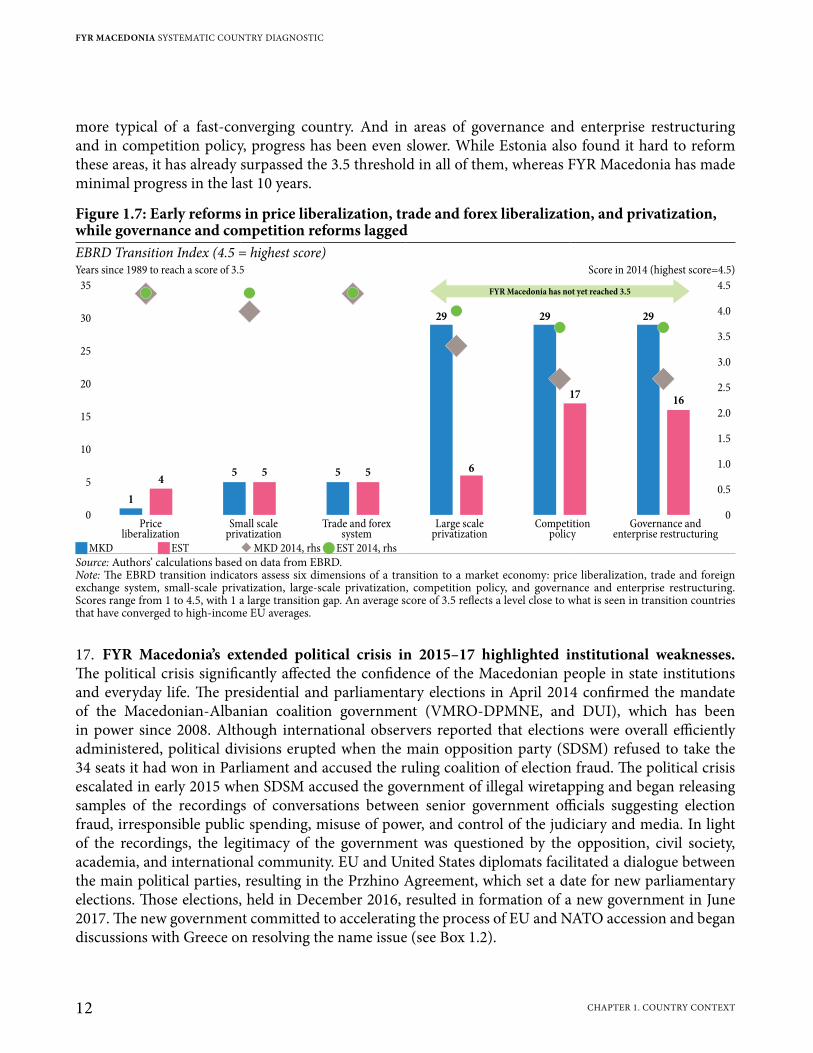
more typical of a fast-converging country. And in areas of governance and enterprise restructuring and in competition policy, progress has been even slower. While Estonia also found it hard to reform these areas, it has already surpassed the 3.5 threshold in all of them, whereas FYR Macedonia has made minimal progress in the last 10 years.
17. FYR Macedonia’s extended political crisis in 2015–17 highlighted institutional weaknesses. The political crisis significantly affected the confidence of the Macedonian people in state institutions and everyday life. The presidential and parliamentary elections in April 2014 confirmed the mandate of the Macedonian-Albanian coalition government (VMRO-DPMNE, and DUI), which has been in power since 2008. Although international observers reported that elections were overall efficiently administered, political divisions erupted when the main opposition party (SDSM) refused to take the 34 seats it had won in Parliament and accused the ruling coalition of election fraud. The political crisis escalated in early 2015 when SDSM accused the government of illegal wiretapping and began releasing samples of the recordings of conversations between senior government officials suggesting election fraud, irresponsible public spending, misuse of power, and control of the judiciary and media. In light of the recordings, the legitimacy of the government was questioned by the opposition, civil society, academia, and international community. EU and United States diplomats facilitated a dialogue between the main political parties, resulting in the Przhino Agreement, which set a date for new parliamentary elections. Those elections, held in December 2016, resulted in formation of a new government in June 2017. The new government committed to accelerating the process of EU and NATO accession and began discussions with Greece on resolving the name issue (see Box 1.2).
Figure 1.7: Early reforms in price liberalization, trade and forex liberalization, and privatization, while governance and competition reforms laggedEBRD Transition Index (4.5 = highest score)Years since 1989 to reach a score of 3.5 Score in 2014 (highest score=4.5)
4.5
4.0
3.5
3.0
2.5
2.0
1.5
1.0
0.5
0Price
liberalizationSmall scale
privatizationTrade and forex
systemLarge scale
privatizationCompetition
policyGovernance and
enterprise restructuring
1
45 5
29 29 29
5 5 6
1716
FYR Macedonia has not yet reached 3.535
30
25
20
15
10
5
0
JMKD JEST �MKD 2014, rhs QEST 2014, rhsSource: Authors’ calculations based on data from EBRD.Note: The EBRD transition indicators assess six dimensions of a transition to a market economy: price liberalization, trade and foreign exchange system, small-scale privatization, large-scale privatization, competition policy, and governance and enterprise restructuring. Scores range from 1 to 4.5, with 1 a large transition gap. An average score of 3.5 reflects a level close to what is seen in transition countries that have converged to high-income EU averages.
FYR MACEDONIA SYSTEMATIC COUNTRY DIAGNOSTIC
12 CHAPTER 1. COUNTRY CONTExT
18. Though not without difficulties, FYR Macedonia had a successful start as an independent country, but now needs accelerated, inclusive, and sustained growth if it is to converge to European income levels and become a middle-class society. Its geographic and demographic characteristics, its political and economic history, and its cultural diversity shape the structural challenges now confronting the country, such as the population decline and its exposure to natural risks. But they also illuminate untapped opportunities, such as the country’s strategic location and its tourism potential.
19. The country now needs a development model that provides for higher, sustainable and equitable growth. It has been building up to such a model already through its early reforms and continuing prudent macroeconomic management, as well as its search for openness and economic integration. As this Systematic Country Diagnostic (SCD) states, FYR Macedonia must complete a number of crucial reforms to boost growth through higher productivity and to create more employment opportunities for its people. Many of these reforms relate to improvements in institutional quality.
20. The next chapters are organized in relation to three strategic pathways to deliver to FYR Macedonia higher growth, inclusive opportunities, and a sustainable development path. Chapter 2 analyzes the recent evolution of poverty, shared prosperity, and their main drivers, especially employment, looking at historical household data to understand progress in providing opportunities to all. Chapter 3 discusses the country’s performance and drivers of growth and job creation, combining macroeconomic and microeconomic analysis to understand the dynamics of productivity. These chapters build the evidence that supports the view of the SCD: FYR Macedonia needs a two-pronged approach to increase productivity and enhance job opportunities for all. Chapter 4 presents the first of the three pathways, with specific policy actions to help achieve these objectives. Pathway I: Fostering a More Dynamic and Competitive Private Sector digs into the specific challenges and opportunities that relate to creating a globally integrated private sector that creates more and more-productive domestic jobs. Chapter 5 presents Pathway II: Developing More Competitive and Adaptive Human Capital and Closing Opportunity Gaps, and discusses the challenges and opportunities of building a productive and dynamic labor force that can not only exploit its full potential but also promote social inclusion by improving health outcomes and shielding the poor and vulnerable from shocks. Chapter 6 presents Pathway III: Achieving Sustainability through Effective Governance, Fiscal Prudence, and Enhanced Environmental Management and Resilience to Natural Hazards, which links the sustainability of the development model to specific challenges and opportunities to improve the quality of institutions and build fiscal and environmental resilience. Finally, Chapter 7 lists policy priorities that would ensure that the country can successfully pursue all three pathways and embark on faster, more inclusive, and sustainable growth.
SEIZING A BRIGHTER FUTURE FOR ALL
13CHAPTER 1. COUNTRY CONTExT

FYR Macedonia Systematic Country Diagnostic | Seizing a Brighter Future for All
FYR Macedonia Systematic Country Diagnostic | Seizing a Brighter Future for All
Nehat BeqiriIdentities
Katerina’s husband, Arben, has been looking for a job for more than two years; she’s been trying to earn some money selling plastic kitchen products in the market at Kriva Palanka. It’s been a difficult time for her family, with she and Arben both piecing together an income from small jobs here and there. Katerina knows her pensioner parents will always be willing to help if they can, but she’s embarrassed to ask again. Fortunately, things now seem to be taking an
upturn. Arben has found a job in construction working on the expansion of a nearby highway. His earnings are giving the family badly needed relief: she can cook better food for him and their two children and buy school materials for the older one. She heard that the construction company may get another big contract—that’s all the employees seem to be talking about—and she hopes that will happen. She can’t bear to go back to how things were.
Chapter 2. Poverty, Shared Prosperity, and the Labor Market
Chapter 2. Poverty, Shared Prosperity, and the Labor Market
If it is to become a middle-class society within the next two decades, FYR Macedonia will have to slash poverty and ensure that people move out of vulnerability and into the middle class. Between 2009 and 2015, 240,000 people moved out of poverty, expanding the middle class from 29 to over 40 percent of the population. However, FYR Macedonia is still much poorer than most EU countries, and close to a third of the population are considered vulnerable—just one shock away from falling back into poverty. And Macedonians think there has been little progress in economic mobility and equal opportunities. Among those with reason to feel left behind are those living in rural areas and in the northern regions of the country, and ethnic minorities. Social assistance programs, small in scale and poorly targeted, do not contribute substantially to alleviate poverty. But the most important predictor of poverty and vulnerability in FYR Macedonia is the lack of jobs: High structural unemployment and low labor force participation mean that half of all working-age Macedonians have no work. Creating more job opportunities is thus critical if the country is to advance to middle-class living standards. If it is to reach the upper-middle-income average employment rate of 62 percent, FYR Macedonia needs 300,000 more jobs; yet, in the past 10 years only 132,000 jobs have been created. With the current income distribution, reducing poverty and expanding the middle class will depend on the country's capacity to generate both many more jobs and sustained economic growth.
2.1 Progress in Poverty Reduction and Shared Prosperity in Recent Years
21. Until the 2008 global financial crisis, economic growth in FYR Macedonia mainly benefited those already at the top of the income distribution; poverty had stagnated. After 2003, despite robust economic growth and some job creation, the poverty rate had even increased slightly, to about 29 percent in 2008 (Figure 2.1). True, the national standard of living, measured by monetary consumption, on average rose close to 1 percent annually, but the average increase hid the fact that the poorest saw their average consumption fall by 1.4 percent annually while for those more comfortably off, living standards improved. The jobs created during the period were primarily unpaid or low-wage, and thus did not help to reduce poverty or increase living standards among those at the bottom of the income distribution. The net formal jobs created during this period were in firms with negative productivity growth.27
22. After 2009 poverty fell and economic growth benefited mainly those at the bottom of the income distribution. Between 2009 and 2015, the cumulative reduction in poverty was about 12 percentage points (from 35 to 23 percent).28 Thus, it appears that in six years 240,000 people were lifted out of poverty, and World Bank staff calculate that the decline continued through 2017 as based on national account calculations, household private consumption continued to grow. The extremely poor, those
27 World Bank (2009), FYR Macedonia 2009 Poverty Assessment. Poverty, Jobs and Firms: An Assessment for 2002–2006.28 Poverty is measured as absolute poverty using the poverty line for upper-middle income countries (UMIC), estimated at $5.5/day
in 2011 purchasing power parity (PPP)—the cost in UMIC countries of satisfying a minimum caloric requirement and typical non-food consumption. The official FYR Macedonia poverty estimate is based on a relative line (http://www.stat.gov.mk/PrikaziSoopstenie_en.aspx?rbrtxt=115), which follows Eurostat guidelines but is not informative for comparisons over time.
FYR MACEDONIA SYSTEMATIC COUNTRY DIAGNOSTIC
16 CHAPTER 2. POVERTY, SHARED PROSPERITY, AND THE LABOR MARKET
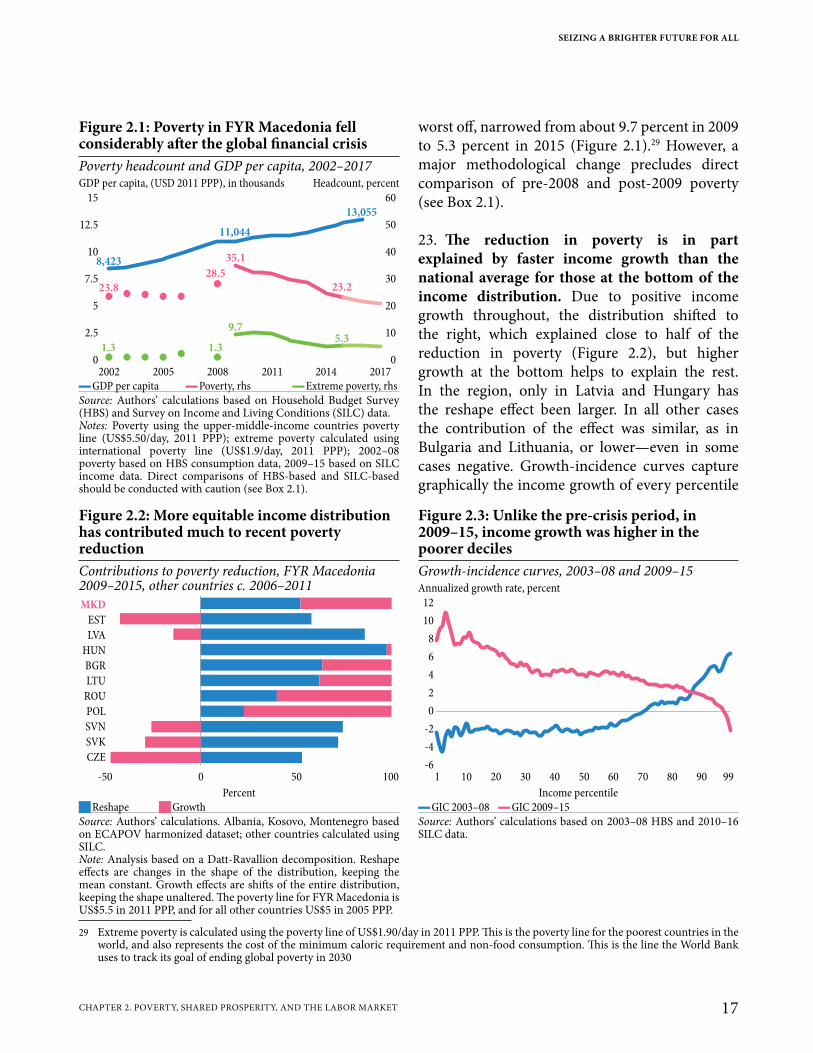
worst off, narrowed from about 9.7 percent in 2009 to 5.3 percent in 2015 (Figure 2.1).29 However, a major methodological change precludes direct comparison of pre-2008 and post-2009 poverty (see Box 2.1).
23. The reduction in poverty is in part explained by faster income growth than the national average for those at the bottom of the income distribution. Due to positive income growth throughout, the distribution shifted to the right, which explained close to half of the reduction in poverty (Figure 2.2), but higher growth at the bottom helps to explain the rest. In the region, only in Latvia and Hungary has the reshape effect been larger. In all other cases the contribution of the effect was similar, as in Bulgaria and Lithuania, or lower—even in some cases negative. Growth-incidence curves capture graphically the income growth of every percentile
29 Extreme poverty is calculated using the poverty line of US$1.90/day in 2011 PPP. This is the poverty line for the poorest countries in the world, and also represents the cost of the minimum caloric requirement and non-food consumption. This is the line the World Bank uses to track its goal of ending global poverty in 2030
Figure 2.1: Poverty in FYR Macedonia fell considerably after the global financial crisisPoverty headcount and GDP per capita, 2002–2017GDP per capita, (USD 2011 PPP), in thousands Headcount, percent
15 60
50
40
30
20
10
12.5
7.5
10
5
2.5
0 0
2002 2005 2008 2011 2014 2017
8,423
11,044
13,055
35.1
9.7
23.2
5.3
23.8
28.5
1.3 1.3
▬GDP per capita ▬Poverty, rhs ▬Extreme poverty, rhsSource: Authors’ calculations based on Household Budget Survey (HBS) and Survey on Income and Living Conditions (SILC) data.Notes: Poverty using the upper-middle-income countries poverty line (US$5.50/day, 2011 PPP); extreme poverty calculated using international poverty line (US$1.9/day, 2011 PPP); 2002–08 poverty based on HBS consumption data, 2009–15 based on SILC income data. Direct comparisons of HBS-based and SILC-based should be conducted with caution (see Box 2.1).
Figure 2.2: More equitable income distribution has contributed much to recent poverty reduction
Figure 2.3: Unlike the pre-crisis period, in 2009–15, income growth was higher in the poorer deciles
Contributions to poverty reduction, FYR Macedonia 2009–2015, other countries c. 2006–2011
Growth-incidence curves, 2003–08 and 2009–15Annualized growth rate, percent
MKD
EST
LVA
HUN
BGR
LTU
ROU
POL
SVN
SVK
CZE
-50 0 50 100
12
10
8
6
4
2
0
-2
-4
-6
1 10 20 30 40 50 60 70 80 90 99
Percent Income percentile JReshape JGrowth ▬GIC 2003–08 ▬GIC 2009–15
Source: Authors’ calculations. Albania, Kosovo, Montenegro based on ECAPOV harmonized dataset; other countries calculated using SILC.Note: Analysis based on a Datt-Ravallion decomposition. Reshape effects are changes in the shape of the distribution, keeping the mean constant. Growth effects are shifts of the entire distribution, keeping the shape unaltered. The poverty line for FYR Macedonia is US$5.5 in 2011 PPP, and for all other countries US$5 in 2005 PPP.
Source: Authors’ calculations based on 2003–08 HBS and 2010–16 SILC data.
SEIZING A BRIGHTER FUTURE FOR ALL
17CHAPTER 2. POVERTY, SHARED PROSPERITY, AND THE LABOR MARKET
of the distribution between two points in time (Figure 2.3). In contrast to the 2003–2008 period, since 2009 in FYR Macedonia, growth as largely been pro-poor (albeit information about the very top of the distribution is limited).30
30 SILC data captures limited information about the top 1 percent of the income distribution. As an illustration, the highest income in the SILC database is close to 2,000 euros per month, close to the threshold for the top 1 percent according to tax-records. The highest income according to tax records is 250,000 euros per month.
Knowledge Gap 2.1: How Many People Are There in FYR Macedonia?
The last population census conducted in FYR Macedonia was in 2002, 16 years ago. A census begun in 2011 was stopped a few days after it started because of a political debate related to the definition of who was a resident. The lack of recent census data not only makes it hard to ascertain the total population, which has no doubt been diminished by emigration in recent years, it also makes it hard to identify accurately the macroeconomic and microeconomic indicators critical for guiding policy decisions. Normally, household surveys used to assess social indicators rely on a sampling frame based on the most recent census. With no recent census data, despite the best State Statistical Office efforts to partially remediate the deficiencies, indicators will not be as precise as they should be. The recent announcement of a census in 2020 is encouraging, but it must prevent the kinds of problems that arose in 2011. Certainly, the Macedonian State Statistical Office has the technical capacity to lead this complex operation; but it will also be important to complement it with a comprehensive communication strategy and an open dialogue with different ethnic groups to resolve any methodological doubts in advance. FYR Macedonia cannot aspire to become a high-income country until its policymaking is evidence-based.
Box 2.1: Measuring Poverty in FYR Macedonia Before and After 2009
Poverty estimates before and after the global crisis should be compared with caution due to the change in how living standards are measured from a consumption-based to an income-based approach. Before 2008, the World Bank tracked poverty in FYR Macedonia using consumption data obtained from the Household Budget Survey (HBS). Since 2009, when the Macedonian State Statistical Office decided to report living standards based on the Survey of Income and Living Conditions (SILC), the World Bank has used SILC household income data to track poverty. Direct comparisons of poverty rates before and after 2008 may therefore be inadvisable.
However, trends in poverty can be compared, because measures based on income and consumption both reflect changes in the resources available to households. This was observed between 2006 and 2011 in Peru and Poland, for example, where income and consumption growth showed very similar trends as poverty was brought down.a Hence, for FYR Macedonia it is possible to compare the stagnation of consumption-based poverty before the global financial crisis to the decline in income-based poverty thereafter.a World Bank (2017a), Poverty Reduction, Shared Prosperity and Inequality in FYR Macedonia in the Post Financial Crisis Period (2009–2013).
FYR MACEDONIA SYSTEMATIC COUNTRY DIAGNOSTIC
18 CHAPTER 2. POVERTY, SHARED PROSPERITY, AND THE LABOR MARKET

24. This progress implies that poverty is now more in line with FYR Macedonia’s level of development. Compared with other countries in the region that measure poverty the same way, poverty in FYR Macedonia is now much closer to what would be expected given its GDP per capita (Figure 2.4). The expected level of poverty is calculated using a linear regression of poverty levels on the logarithm of GDP per capita, with a sample of countries in the region that measure poverty using household income. Among its structural peers, Georgia and Albania have higher poverty but also lower GDP per capita; Serbia, a richer region than FYR Macedonia during Yugoslav times, has almost the same level of poverty and GDP per capita.
25. Between 2010 and 2015, nonmonetary indicators of living conditions also improved. The share of households with bathroom or indoor flushing toilet, already high at about 87 percent in 2010, rose further to over 93 percent. Similarly, households with inadequate dwelling conditions (leaking roof, damp walls, floors, or rot in window frames or floor) dropped from about 25 to 13 percent. By 2017, access to electricity was universal; 92 percent of homes in FYR Macedonia now have piped water—85 percent in rural areas and close to 100 percent in urban areas; and 91 percent of Macedonians have access to at least basic sanitation. Notably, there are also 99 mobile phone subscriptions for every 100 people.
26. Yet, worrying problems have emerged in recent years. For instance, neonatal mortality, which had dropped from 17.2 per 1,000 live births in 1990 to 6.8 in 2011, in 2016 edged back up to 8.3. Similarly, infant mortality plunged from 33.5 per 1,000 live births to 9 but then regressed to 10.7; and under-5 mortality dropped from 37.1 to 10.2 and then back up to 12.2. Between 2005 and 2016, the measles immunization rate for children between 1 and 2 fell from 96 to 82 percent. Although the share of out-of-pocket expenditures in total health spending has been reduced, in 2014 it was still a very high 36.7 percent—down from an estimated 43.0 percent in 2003 but still considerably above EU and comparator averages and the WHO criterion for financial protection of 15–20 percent. As for education, while literacy is almost universal and other education indicators have improved since the 1990s—for instance, tertiary enrollment, calculated at 15 percent in 1991, was a much more encouraging 42 percent in 2015—other indicators seem to have reversed. Secondary enrollment, which had risen from 75 percent in 1993 to 85 percent in 2005 has since regressed to 79 percent. And there are some indications that households may be finding it hard to protect themselves in cold seasons: for 2012 only 51.6 percent of households were bound to be able to keep their homes adequately warm.31
31 Konrad Adenauer Foundation (2013).
Figure 2.4: Recent progress in poverty reduction brought FYR Macedonia closer to the level expected given its stage of development, but poverty remains highPoverty headcount and GDP per capita, 2014Poverty rate at $5.5 2011 PPP
50
40
30
20
10
0
3.9 4.0 4.1 4.2 4.3 4.4 4.5
GEO
ALB
MKD 2009
UMC
SRBKOS
MUS
BGRMNE
HRV
LVA EST
LTU
SVK
SVN
MKD 2015
PRY
R2=0.7462
Log of GDP per capita (2011 PPP) � Income-based QConsumption-based SMixed
Source: Author’s calculation based on data from the World Bank Poverty and Equity database, last updated on 10/24/2017.Note: Linear trend based only on income-based poverty countries. Income-based estimates based on SILC, consumption-based on HBS.
SEIZING A BRIGHTER FUTURE FOR ALL
19CHAPTER 2. POVERTY, SHARED PROSPERITY, AND THE LABOR MARKET

27. The living standards of those at the bottom of the income distribution in recent years have grown faster, at 6.4 percent annually, than those of the rest: the national average was just 2.9 percent. FYR Macedonia may well have had the most inclusive growth in the region (Figure 2.5): Only Georgia reported comparable growth for the bottom 40 percent, and no country reported a larger difference between the bottom 40 and average growth. This breakthrough in shared prosperity marks a sharp turn from the trend before 2008; however, given the drivers of economic growth and job creation in FYR Macedonia since 2009 discussed below, it is not clear whether the positive trends in both poverty and shared prosperity are sustainable.
28. Incomes are still very unequal. By some measures, income inequality declined considerably between 2009 and 2015, during which the Gini index (a measure of inequality of household incomes in which 0 equals perfect equality and 100 complete inequality) dropped from 42 to 36, based on SILC household income data. When the analysis is based on income as declared in personal income tax records, the story is more nuanced: inequality based on personal income was fairly constant between 2014 and 2016, when Gini indices hovered between 44.9 and 44.2.32 But no matter what the measure, FYR Macedonia is still more unequal than aspirational peers and more advanced European economies; only Lithuania and Bulgaria (Figure 2.6) have worse Gini indices, and recent Macedonian Ministry of Finance estimates based on tax records show that participation of the richest 1 percent in total income is higher than in the 12 most advanced European economies for which there are comparable data.33
32 Authors’ calculation based on data from https://www.finance.gov.mk/mk/neednakvost.33 See: https://www.finance.gov.mk/mk/neednakvost.
Figure 2.5: Shared prosperity has increased in recent years
Figure 2.6: FYR Macedonia in 2015 still highly unequal among peer countries
Annualized welfare growth, bottom 40 and national average, 2010–15
Gini index, 2014
Annualized welfare growth, total population8
6
4
2
0
-2
-4
-4 -2 0 2 4 6 8
GEO
ALB
MKD 2010–15
JOR
SRB
MUS
BGR
HRV
LVAEST LTU
SVKSVN
MKD 2003–08
PRY
MKD, 2015LTU, 2014BGR, 2014LVA, 2014EST, 2014
HRV, 2014SVK, 2014SVN, 2014PRY, 2015SRB, 2014GEO, 2015MUS, 2012BIH, 2011JOR, 2010ALB, 2012
20 30 40 50
Annualized welfare growth, bottom 40 percent Gini coefficient �Structural QAspirational JMKD JAspirational peers JStructural peers
Source: Authors’ calculations. FYR Macedonia based on 2011 and 2016 SILC, and 2003 and 2008 HBS. Other countries based on World Bank Poverty and Equity database, years c. 2010–2015. Last Updated: 10/24/2017.
Source: Authors’ calculations. FYR Macedonia data are based on 2016 SILC, data for other countries on the World Bank Poverty and Equity database for 2014 or closest year available. Last Updated: 10/24/2017.
FYR MACEDONIA SYSTEMATIC COUNTRY DIAGNOSTIC
20 CHAPTER 2. POVERTY, SHARED PROSPERITY, AND THE LABOR MARKET

29. Though the middle class has expanded, vulnerability refused to budge. Using the World Bank-defined income threshold applied in the ECA region,34 the middle class expanded from nearly 30 percent in 2009 to over 40 percent in 2015 (Figure 2.7), but progress thus far has not been enough to catch up with the middle class percentages in structural and aspirational peer countries. Eastern European countries that joined the EU, for instance, report a larger middle class (Figure 2.8). Since 2009, the 35 percent share of the Macedonian population that is vulnerable (those between the poor and the middle class) has hardly changed; although not poor, they are at risk of being pushed back into poverty by, e.g., natural disasters, a bout of ill health, or a downturn in the labor market.
34 The line used here is $11/day, 2005 PPP. See World Bank (2018d) “Leveling the Playing Field: Rethinking the Social Contract in Europe and Central Asia."
Figure 2.7: The decrease in poverty has not been matched by a decrease in vulnerability
Figure 2.8: The middle class in FYR Macedonia is still smaller than in aspirational peers
Distribution by welfare status, FYR Macedonia, 2009–15
Distribution by welfare status, FYR Macedonia and comparators, c. 2015
Population shares, percent Population shares, percent100
90
80
70
60
50
40
30
20
10
0
2009 2010 2011 2012 20142013 2015
29.2
35.6
35.1
41.0
35.8
23.2
100
90
80
70
60
50
40
30
20
10
0
ALB KOS MKD SRB MNE LVA BGR HRV LTU EST SVK SVN
JPoor JVulnerable JMiddle-class JPoor JVulnerable JMiddle-classSource: Authors’ calculations based on 2010–16 SILC. Source: Authors’ calculations. Albania, Kosovo, Montenegro based
on ECAPOV harmonized dataset, other countries on SILC.
Knowledge Gap 2.2: What Is Driving the Drop in Nonmonetary Welfare Indicators?
If incomes are to improve, FYR Macedonia needs a healthy and productive labor force. That is why it is necessary to analyze the roots of recent worrisome changes in nonmonetary indicators and propose policy measures to improve them. Important aspects of nonmonetary welfare that need to be better understood relate to health (neonatal and infant mortality, immunization) and education (secondary and tertiary enrollment). Questions that need answers: Is a given decline present in all segments of the population or only among the poor, ethnic minorities, rural residents, or other vulnerable groups? Is it driven mainly by supply factors (e.g., less access to services) or demand factors (e.g., households using a service less) What factors may explain recent changes in the indicator? Other dimensions to consider are access to public services (e.g., sanitation, cooking fuel) and indicators of dwelling conditions, social exclusion (as defined by Eurostat), and the degree of attachment to labor markets.
SEIZING A BRIGHTER FUTURE FOR ALL
21CHAPTER 2. POVERTY, SHARED PROSPERITY, AND THE LABOR MARKET
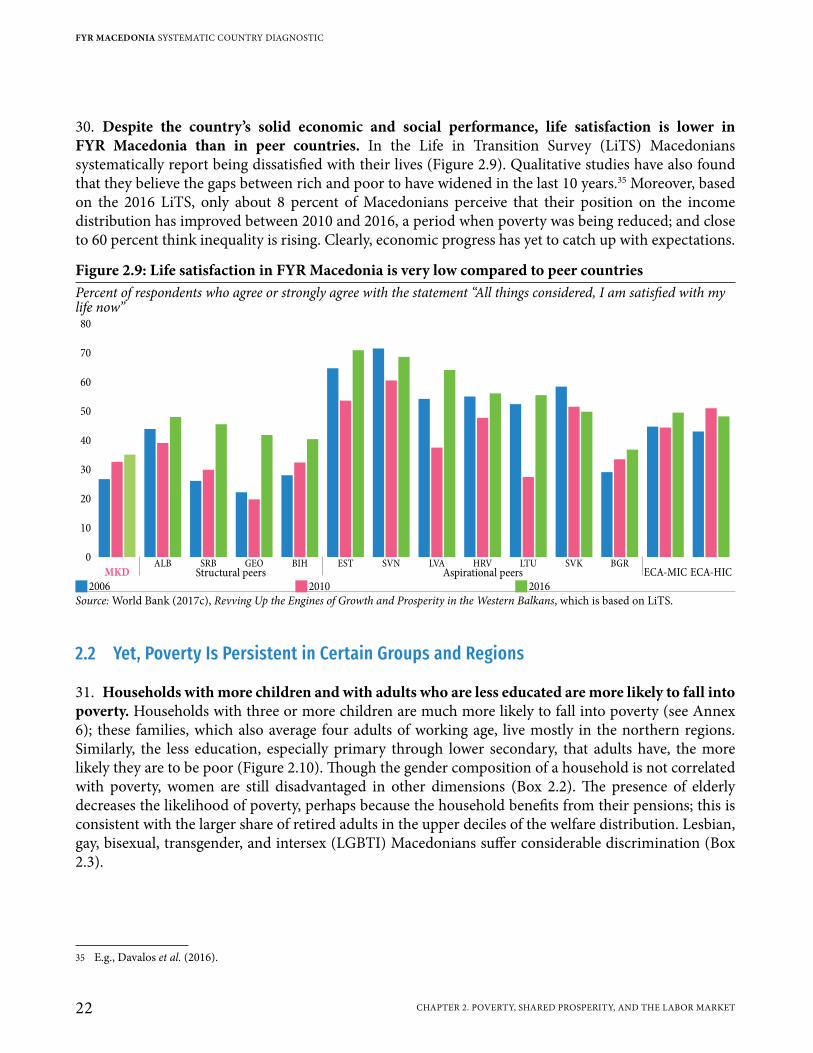
30. Despite the country’s solid economic and social performance, life satisfaction is lower in FYR Macedonia than in peer countries. In the Life in Transition Survey (LiTS) Macedonians systematically report being dissatisfied with their lives (Figure 2.9). Qualitative studies have also found that they believe the gaps between rich and poor to have widened in the last 10 years.35 Moreover, based on the 2016 LiTS, only about 8 percent of Macedonians perceive that their position on the income distribution has improved between 2010 and 2016, a period when poverty was being reduced; and close to 60 percent think inequality is rising. Clearly, economic progress has yet to catch up with expectations.
2.2 Yet, Poverty Is Persistent in Certain Groups and Regions
31. Households with more children and with adults who are less educated are more likely to fall into poverty. Households with three or more children are much more likely to fall into poverty (see Annex 6); these families, which also average four adults of working age, live mostly in the northern regions. Similarly, the less education, especially primary through lower secondary, that adults have, the more likely they are to be poor (Figure 2.10). Though the gender composition of a household is not correlated with poverty, women are still disadvantaged in other dimensions (Box 2.2). The presence of elderly decreases the likelihood of poverty, perhaps because the household benefits from their pensions; this is consistent with the larger share of retired adults in the upper deciles of the welfare distribution. Lesbian, gay, bisexual, transgender, and intersex (LGBTI) Macedonians suffer considerable discrimination (Box 2.3).
35 E.g., Davalos et al. (2016).
Figure 2.9: Life satisfaction in FYR Macedonia is very low compared to peer countriesPercent of respondents who agree or strongly agree with the statement “All things considered, I am satisfied with my life now”
80
70
60
50
40
30
20
10
0
MKDALB SRB GEO BIH EST SVN LVA HRV LTU SVK BGR
ECA-MIC ECA-HICStructural peers Aspirational peers J2006 J2010 J2016
Source: World Bank (2017c), Revving Up the Engines of Growth and Prosperity in the Western Balkans, which is based on LiTS.
FYR MACEDONIA SYSTEMATIC COUNTRY DIAGNOSTIC
22 CHAPTER 2. POVERTY, SHARED PROSPERITY, AND THE LABOR MARKET
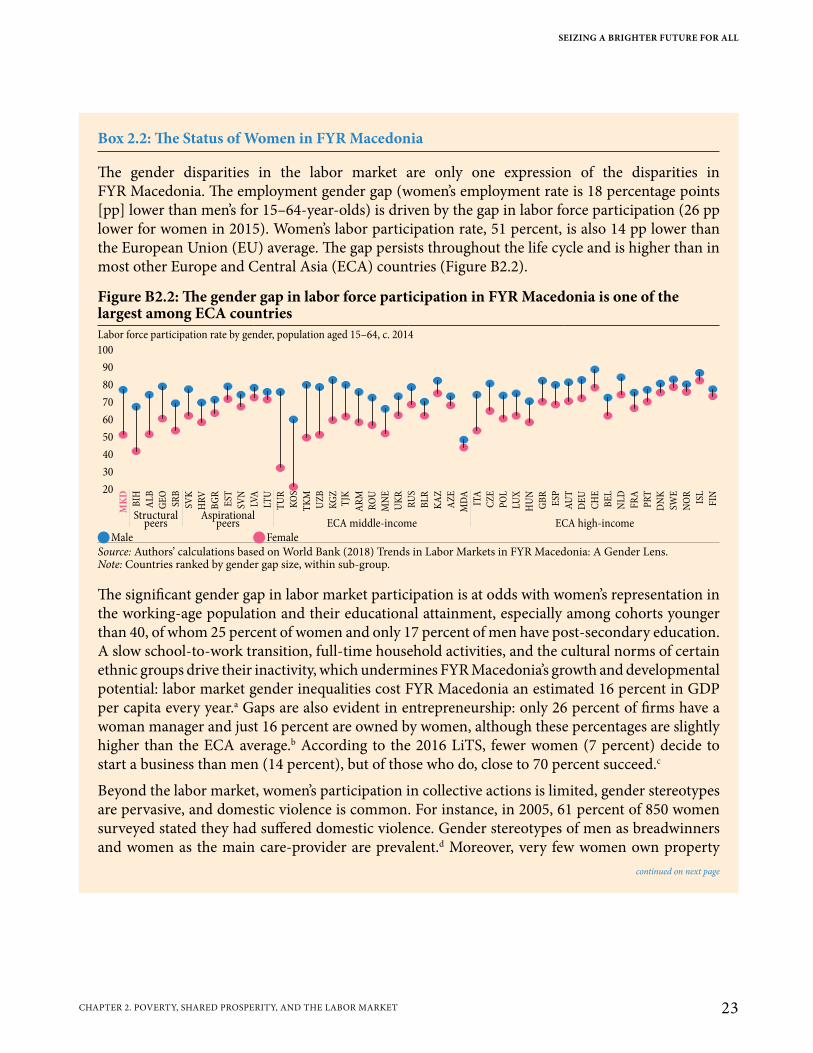
Box 2.2: The Status of Women in FYR Macedonia
The gender disparities in the labor market are only one expression of the disparities in FYR Macedonia. The employment gender gap (women’s employment rate is 18 percentage points [pp] lower than men’s for 15–64-year-olds) is driven by the gap in labor force participation (26 pp lower for women in 2015). Women’s labor participation rate, 51 percent, is also 14 pp lower than the European Union (EU) average. The gap persists throughout the life cycle and is higher than in most other Europe and Central Asia (ECA) countries (Figure B2.2).
The significant gender gap in labor market participation is at odds with women’s representation in the working-age population and their educational attainment, especially among cohorts younger than 40, of whom 25 percent of women and only 17 percent of men have post-secondary education. A slow school-to-work transition, full-time household activities, and the cultural norms of certain ethnic groups drive their inactivity, which undermines FYR Macedonia’s growth and developmental potential: labor market gender inequalities cost FYR Macedonia an estimated 16 percent in GDP per capita every year.a Gaps are also evident in entrepreneurship: only 26 percent of firms have a woman manager and just 16 percent are owned by women, although these percentages are slightly higher than the ECA average.b According to the 2016 LiTS, fewer women (7 percent) decide to start a business than men (14 percent), but of those who do, close to 70 percent succeed.c
Beyond the labor market, women’s participation in collective actions is limited, gender stereotypes are pervasive, and domestic violence is common. For instance, in 2005, 61 percent of 850 women surveyed stated they had suffered domestic violence. Gender stereotypes of men as breadwinners and women as the main care-provider are prevalent.d Moreover, very few women own property
continued on next page
Figure B2.2: The gender gap in labor force participation in FYR Macedonia is one of the largest among ECA countriesLabor force participation rate by gender, population aged 15–64, c. 2014100
90
80
70
60
50
40
30
20
MK
D
BIH
AL
B
GE
O
SRB
SVK
HR
V
BG
R
EST
SVN
LVA
LTU
TU
R
KO
S
TK
M
UZ
B
KG
ZT
JK
AR
M
RO
U
MN
E
UK
R
RU
S
BL
R
KA
Z
AZ
E
MD
A
ITA
CZ
E
PO
L
LUX
HU
N
GB
R
ESP
AU
T
DE
U
CH
E
BE
L
NL
D
FR
A
PR
T
DN
K
SWE
NO
R
ISL
FIN
Structuralpeers
Aspirationalpeers ECA middle-income ECA high-income
QMale QFemaleSource: Authors’ calculations based on World Bank (2018) Trends in Labor Markets in FYR Macedonia: A Gender Lens.Note: Countries ranked by gender gap size, within sub-group.
SEIZING A BRIGHTER FUTURE FOR ALL
23CHAPTER 2. POVERTY, SHARED PROSPERITY, AND THE LABOR MARKET
in FYR Macedonia: only 17 percent of properties have a woman as owner or co-owner because property is usually registered in the name of the husband or a male relative.e This low rate of female ownership also limits women’s productive use of a property and can heighten the difficulty of their accessing finance due to the absence of collateral.a Cuberes and Teigner (2016).b World Bank (2013a). FYR Macedonia Gender Diagnostic: Gaps in Endowments, Access to Economic Opportunities and Agency.c Mojsoska-Blazevski, N. (2018). Trends in labor markets in FYR Macedonia : a gender lens.d World Bank (2013a). FYR Macedonia Gender Diagnostic: Gaps in Endowments, Access to Economic Opportunities and Agency.e FAO and World Bank (2014).
Box 2.2 continued from previous page
Box 2.3: Lesbian, Gay, Bisexual, Transgender, and Intersex Macedonians
Discrimination, exclusion, and violence against lesbian, gay, bisexual, transgender, and intersex (LGBTI) people are widespread in FYR Macedonia. Social exclusion, such as exclusion based on sexual orientation and gender identity, has substantial social, political, and economic costs, and precludes those affected from benefitting equally from development investments. A 2018 World Bank study of LGBTI people found that 51.8 percent of Macedonian respondents had experienced discrimination or harassment in the last 12 months, and 33 percent had experienced violence in the last five years.
The same survey found that LGBTI students had experienced discrimination and reported that the school environment was hostile; 76 percent of Macedonian respondents had witnessed negative comments or conduct toward LGBTI students in school—much higher than the 49 percent average in the 2012 EU Agency for Fundamental Rights (FRA) survey. Although most (67 percent) of Macedonian LGBTI respondents hide their identity at work, 20 percent reported having experienced discrimination in the workplace, and 15 percent experienced discrimination related to leave requests or pension benefits. Discrimination affects all areas of life; for instance, 21 percent were discriminated against by medical staff when seeking health care. Again, this is significantly higher than the 10 percent FRA survey average.
Because the FYR Macedonia Law on Prevention and Protection Against Discrimination (April 8, 2010) does not refer to discrimination on grounds of sexual orientation, gender identity, or sex characteristics, most cases of LGBTI discrimination and violence go unreported. According to the World Bank survey, only 14 percent of LGBTI victims of violence reported the case to the police, much lower than the 22 percent EU average. The lack of legal protections may explain the few reports of violence, but 44 percent of the respondents also feared homophobic or transphobic reactions from the police—much higher than the 29 percent FRA average. Based on the comparison with EU member states, FYR Macedonia needs to better protect and include LGBTI people.Source: World Bank (2018b). Understanding the Experiences of LGBTI People in South East Europe.
FYR MACEDONIA SYSTEMATIC COUNTRY DIAGNOSTIC
24 CHAPTER 2. POVERTY, SHARED PROSPERITY, AND THE LABOR MARKET
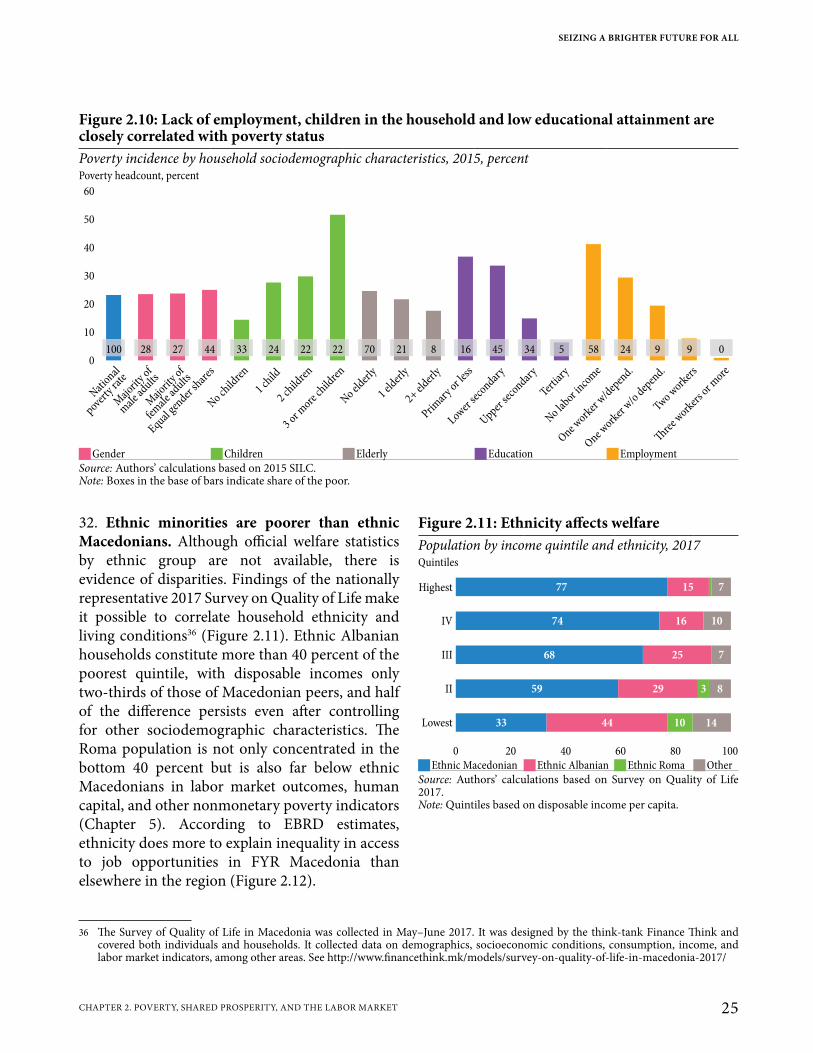
32. Ethnic minorities are poorer than ethnic Macedonians. Although official welfare statistics by ethnic group are not available, there is evidence of disparities. Findings of the nationally representative 2017 Survey on Quality of Life make it possible to correlate household ethnicity and living conditions36 (Figure 2.11). Ethnic Albanian households constitute more than 40 percent of the poorest quintile, with disposable incomes only two-thirds of those of Macedonian peers, and half of the difference persists even after controlling for other sociodemographic characteristics. The Roma population is not only concentrated in the bottom 40 percent but is also far below ethnic Macedonians in labor market outcomes, human capital, and other nonmonetary poverty indicators (Chapter 5). According to EBRD estimates, ethnicity does more to explain inequality in access to job opportunities in FYR Macedonia than elsewhere in the region (Figure 2.12).
36 The Survey of Quality of Life in Macedonia was collected in May–June 2017. It was designed by the think-tank Finance Think and covered both individuals and households. It collected data on demographics, socioeconomic conditions, consumption, income, and labor market indicators, among other areas. See http://www.financethink.mk/models/survey-on-quality-of-life-in-macedonia-2017/
Figure 2.11: Ethnicity affects welfarePopulation by income quintile and ethnicity, 2017Quintiles
Highest
IV
III
II
Lowest
0 20 40 60 80 100
77
74
68
59
33
15
16
25
29
44 10
3
7
10
7
8
14
JEthnic Macedonian JEthnic Albanian JEthnic Roma JOtherSource: Authors’ calculations based on Survey on Quality of Life 2017.Note: Quintiles based on disposable income per capita.
Figure 2.10: Lack of employment, children in the household and low educational attainment are closely correlated with poverty statusPoverty incidence by household sociodemographic characteristics, 2015, percentPoverty headcount, percent
60
50
40
30
20
10
0
Natio
nal
poverty
rate
Majo
rity of
male
adults
Majo
rity of
female
adults
Equal ge
nder sh
ares
No child
ren
1 child
2 child
ren
3 or more
child
ren
No elder
ly
1 elder
ly
2+ elder
ly
Primar
y or l
ess
Lower se
condar
y
Upper se
condar
y
Tertia
ry
No labor i
ncom
e
One work
er w
/dep
end.
One work
er w
/o d
epen
d.
Two work
ers
�re
e work
ers o
r more
100 28 27 44 33 24 22 22 70 21 8 16 45 34 5 58 24 9 9 0
JGender JChildren JElderly JEducation JEmploymentSource: Authors’ calculations based on 2015 SILC.Note: Boxes in the base of bars indicate share of the poor.
SEIZING A BRIGHTER FUTURE FOR ALL
25CHAPTER 2. POVERTY, SHARED PROSPERITY, AND THE LABOR MARKET

33. Poverty is higher in rural areas. The reduction in poverty since 2009 was not sufficient to close geographic gaps in living conditions. An initial difference of 13 pp went down only to 12.5: the urban poverty headcount is 17 percent but the rural is nearly 30 percent (Figure 2.13). The poverty gap—distance to the poverty line—decreased by 50 percent in urban areas but only 40 percent in rural.
Figure 2.12: Ethnicity explains much of differences in access to income opportunitiesDrivers of inequality of opportunity to work, 2016D-index0.35
0.30
0.25
0.20
0.15
0.10
0.05
0
MKD Other Europe high-incomeStructural peers Aspirational peers Other Europe middle-incomeALB GEO BIH SRB HRV BGR EST SVN SVK LTU LVA HUN CZE GRC ITA PLN DEU CYP MNE TUR ROU AZE KOS MDA UKR ARM RUS
JParent member of communist party JEthnic majority/minority JGender JParents' level of education JUrban/rural birthplaceSource: EBRD (2017).
Knowledge Gap 2.3: How Do Ethnic Minorities Fare in FYR Macedonia?
In the 2002 census, ethnic Macedonians constituted about 66 percent of the country’s population, ethnic Albanians close to 25 percent, and ethnic Turks, Roma, Serbs, Bosniaks, and other smaller groups the other 9 percent. The coexistence of different ethnicities requires reliable information on social indicators and outcomes to help inform policies guaranteeing that all citizens have equal opportunities. However, the most important household surveys, the SILC (welfare) and the LFS (employment), do not report results by ethnicity, and sometimes do not even collect information on ethnicity. This issue is of even more concern when nationally-representative sources like the 2017 Survey on Quality of Life or the 2016 Life in Transition Survey highlight welfare and social disparities between ethnic groups.
Reporting social statistics by ethnic group can inform policies, increase accountability, and help to build trust across ethnic lines. The census planned for 2020 should update the population count, but frequent collection and reporting of social statistics is still necessary. It may be necessary to bring together representatives from different ethnic groups beforehand to define indicators to be tracked to minimize the possibility of disagreements after the census. The positive impact of such statistics on policy making is certainly worth the effort.
FYR MACEDONIA SYSTEMATIC COUNTRY DIAGNOSTIC
26 CHAPTER 2. POVERTY, SHARED PROSPERITY, AND THE LABOR MARKET

34. Most of the poor live in the north. Though poverty was reduced more in some regions than others, the ranking of regions, especially the poorest regions, did not vary much between 2009 and 2015 (Figure 2.14). In both the Northeastern and Polog regions, in the extreme northwest and northeast, poverty was close to 40 percent. Rates in Skopje, the capital, and the Southeastern region are very similar to the national rate of 23 percent and poverty in the remaining regions has fallen to 10 to 14 percent. Because the northern regions have higher shares of population, that is where the poor are concentrated (Figure 2.15).
35. Unlike in other developing countries, in FYR Macedonia most of the poor are working-age adults. In both urban and rural areas, close to 70 percent of the poor are aged 15 to 64 (Figure 2.16), reflecting to a large extent the demographic profile of the country. Children constitute about 24 percent, with similar shares in both urban and rural areas, and nationwide the elderly constitute about 7 percent. This profile of the poor highlights the importance of employment if poverty is to be reduced.
36. The poor work more in agriculture and less in services than nonpoor workers. Almost 33 percent of the working poor are in agriculture, compared to only 13 percent of the working nonpoor (Figure 2.17). This implies that to reduce poverty and close the rural-urban divide, policy interventions that promote agricultural productivity and income growth are paramount. The nonpoor work not only in manufacturing and especially in education, public administration, and other services—all relatively skilled occupations.
Figure 2.13: Urban-rural disparities in poverty persist…
Figure 2.14: …as do regional disparities
Poverty headcount by domain, 2009–2015 Poverty headcount by region, 2009 and 201545
40
35
30
25
20
15
10
5
0
2009 2010 2011 2012 20142013 2015
Polog
Skopje
Northeastern
Eastern
Southeastern
Vardar
Pelgonia
Southwestern
45.6 38.1
Lake
Ohrid
36.523.8
52.0 42.8
32.914.0
26.1 23.5
29.414.0
26.310.7
26.413.2
▬Poverty urban … Extreme poverty rural ▬Extreme poverty urban … Poverty rural
Source: Authors’ calculations based on 2010–2016 SILC. Source: Authors’ calculations based on 2010 and 2016 SILC.
Figure 2.15: The poor are concentrated in the northern regionsPoverty distribution by region, re-sized proportional to the share of poor in a given region, 2015
Source: Authors’ calculations based on 2016 SILC.Note: Region size re-scaled proportional to the share of poor in each region. Darker color indicates regions with largest share of the poor.
SEIZING A BRIGHTER FUTURE FOR ALL
27CHAPTER 2. POVERTY, SHARED PROSPERITY, AND THE LABOR MARKET
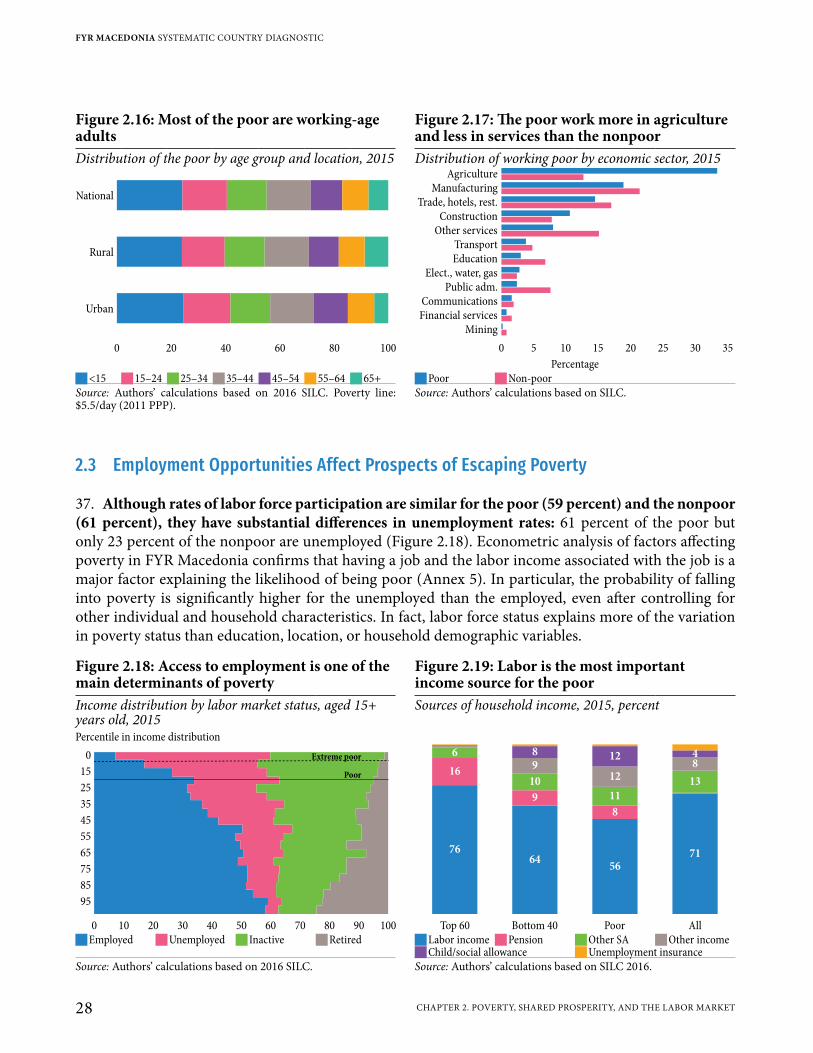
2.3 Employment Opportunities Affect Prospects of Escaping Poverty
37. Although rates of labor force participation are similar for the poor (59 percent) and the nonpoor (61 percent), they have substantial differences in unemployment rates: 61 percent of the poor but only 23 percent of the nonpoor are unemployed (Figure 2.18). Econometric analysis of factors affecting poverty in FYR Macedonia confirms that having a job and the labor income associated with the job is a major factor explaining the likelihood of being poor (Annex 5). In particular, the probability of falling into poverty is significantly higher for the unemployed than the employed, even after controlling for other individual and household characteristics. In fact, labor force status explains more of the variation in poverty status than education, location, or household demographic variables.
Figure 2.16: Most of the poor are working-age adults
Figure 2.17: The poor work more in agriculture and less in services than the nonpoor
Distribution of the poor by age group and location, 2015 Distribution of working poor by economic sector, 2015
National
Rural
Urban
0 20 40 60 80 100
MiningFinancial servicesCommunications
Public adm.Elect., water, gas
EducationTransport
Other servicesConstruction
Trade, hotels, rest.Manufacturing
Agriculture
0 5 10 15 20 25 30 35
Percentage J<15 J15–24 J25–34 J35–44 J45–54 J55–64 J65+ JPoor JNon-poor
Source: Authors’ calculations based on 2016 SILC. Poverty line: $5.5/day (2011 PPP).
Source: Authors’ calculations based on SILC.
Figure 2.18: Access to employment is one of the main determinants of poverty
Figure 2.19: Labor is the most important income source for the poor
Income distribution by labor market status, aged 15+ years old, 2015
Sources of household income, 2015, percent
Percentile in income distribution0
95
85
75
65
55
45
35
25
15
0 10 20 30 40 50 60 70 80 90 100
Extreme poor
Poor
Top 60 Bottom 40 Poor All
7664
5671
16
6
9
10
9
8
11
12 13
848 12
JEmployed JUnemployed J Inactive JRetired JLabor income JPension JOther SA JOther income JChild/social allowance JUnemployment insurance
Source: Authors’ calculations based on 2016 SILC. Source: Authors’ calculations based on SILC 2016.
FYR MACEDONIA SYSTEMATIC COUNTRY DIAGNOSTIC
28 CHAPTER 2. POVERTY, SHARED PROSPERITY, AND THE LABOR MARKET
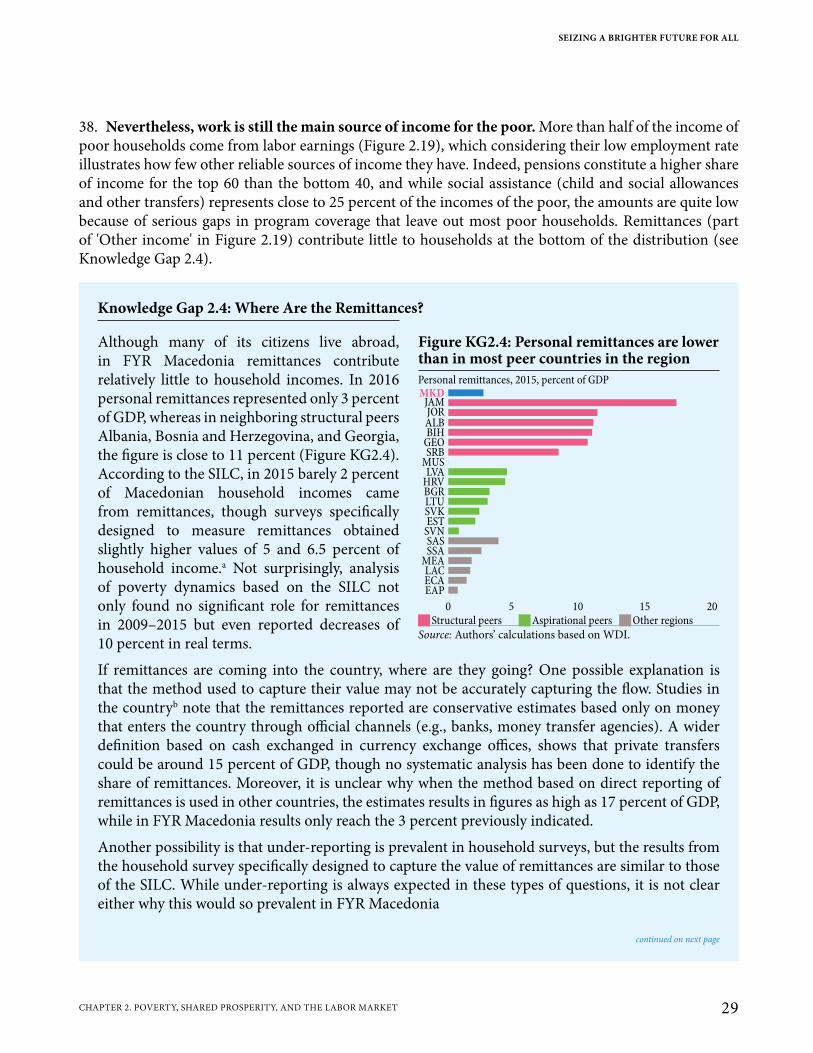
38. Nevertheless, work is still the main source of income for the poor. More than half of the income of poor households come from labor earnings (Figure 2.19), which considering their low employment rate illustrates how few other reliable sources of income they have. Indeed, pensions constitute a higher share of income for the top 60 than the bottom 40, and while social assistance (child and social allowances and other transfers) represents close to 25 percent of the incomes of the poor, the amounts are quite low because of serious gaps in program coverage that leave out most poor households. Remittances (part of 'Other income' in Figure 2.19) contribute little to households at the bottom of the distribution (see Knowledge Gap 2.4).
Knowledge Gap 2.4: Where Are the Remittances?
Although many of its citizens live abroad, in FYR Macedonia remittances contribute relatively little to household incomes. In 2016 personal remittances represented only 3 percent of GDP, whereas in neighboring structural peers Albania, Bosnia and Herzegovina, and Georgia, the figure is close to 11 percent (Figure KG2.4). According to the SILC, in 2015 barely 2 percent of Macedonian household incomes came from remittances, though surveys specifically designed to measure remittances obtained slightly higher values of 5 and 6.5 percent of household income.a Not surprisingly, analysis of poverty dynamics based on the SILC not only found no significant role for remittances in 2009–2015 but even reported decreases of 10 percent in real terms.
If remittances are coming into the country, where are they going? One possible explanation is that the method used to capture their value may not be accurately capturing the flow. Studies in the countryb note that the remittances reported are conservative estimates based only on money that enters the country through official channels (e.g., banks, money transfer agencies). A wider definition based on cash exchanged in currency exchange offices, shows that private transfers could be around 15 percent of GDP, though no systematic analysis has been done to identify the share of remittances. Moreover, it is unclear why when the method based on direct reporting of remittances is used in other countries, the estimates results in figures as high as 17 percent of GDP, while in FYR Macedonia results only reach the 3 percent previously indicated.
Another possibility is that under-reporting is prevalent in household surveys, but the results from the household survey specifically designed to capture the value of remittances are similar to those of the SILC. While under-reporting is always expected in these types of questions, it is not clear either why this would so prevalent in FYR Macedonia
Figure KG2.4: Personal remittances are lower than in most peer countries in the regionPersonal remittances, 2015, percent of GDP
JORALBBIH
GEOSRB
MUSLVA
HRVBGRLTUSVKEST
SVNSASSSA
MEALACECA
JAMMKD
EAP
0 5 10 15 20 JStructural peers JAspirational peers JOther regions
Source: Authors’ calculations based on WDI.
continued on next page
SEIZING A BRIGHTER FUTURE FOR ALL
29CHAPTER 2. POVERTY, SHARED PROSPERITY, AND THE LABOR MARKET
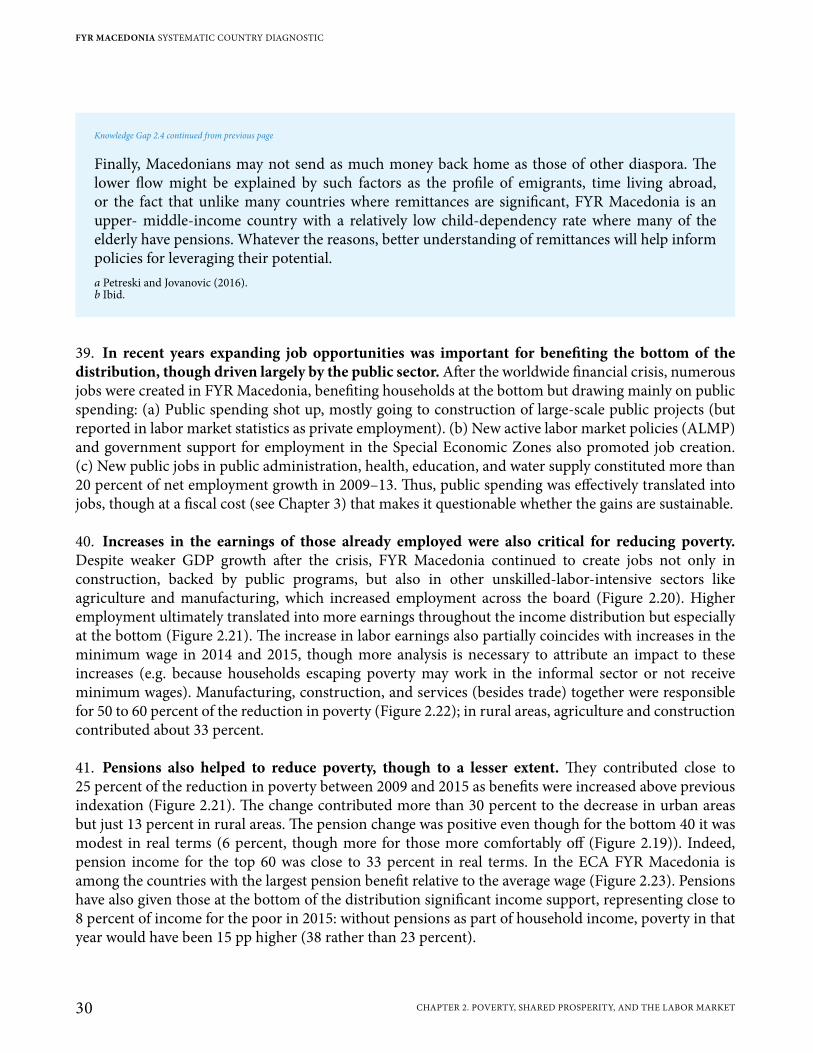
39. In recent years expanding job opportunities was important for benefiting the bottom of the distribution, though driven largely by the public sector. After the worldwide financial crisis, numerous jobs were created in FYR Macedonia, benefiting households at the bottom but drawing mainly on public spending: (a) Public spending shot up, mostly going to construction of large-scale public projects (but reported in labor market statistics as private employment). (b) New active labor market policies (ALMP) and government support for employment in the Special Economic Zones also promoted job creation. (c) New public jobs in public administration, health, education, and water supply constituted more than 20 percent of net employment growth in 2009–13. Thus, public spending was effectively translated into jobs, though at a fiscal cost (see Chapter 3) that makes it questionable whether the gains are sustainable.
40. Increases in the earnings of those already employed were also critical for reducing poverty. Despite weaker GDP growth after the crisis, FYR Macedonia continued to create jobs not only in construction, backed by public programs, but also in other unskilled-labor-intensive sectors like agriculture and manufacturing, which increased employment across the board (Figure 2.20). Higher employment ultimately translated into more earnings throughout the income distribution but especially at the bottom (Figure 2.21). The increase in labor earnings also partially coincides with increases in the minimum wage in 2014 and 2015, though more analysis is necessary to attribute an impact to these increases (e.g. because households escaping poverty may work in the informal sector or not receive minimum wages). Manufacturing, construction, and services (besides trade) together were responsible for 50 to 60 percent of the reduction in poverty (Figure 2.22); in rural areas, agriculture and construction contributed about 33 percent.
41. Pensions also helped to reduce poverty, though to a lesser extent. They contributed close to 25 percent of the reduction in poverty between 2009 and 2015 as benefits were increased above previous indexation (Figure 2.21). The change contributed more than 30 percent to the decrease in urban areas but just 13 percent in rural areas. The pension change was positive even though for the bottom 40 it was modest in real terms (6 percent, though more for those more comfortably off (Figure 2.19)). Indeed, pension income for the top 60 was close to 33 percent in real terms. In the ECA FYR Macedonia is among the countries with the largest pension benefit relative to the average wage (Figure 2.23). Pensions have also given those at the bottom of the distribution significant income support, representing close to 8 percent of income for the poor in 2015: without pensions as part of household income, poverty in that year would have been 15 pp higher (38 rather than 23 percent).
Finally, Macedonians may not send as much money back home as those of other diaspora. The lower flow might be explained by such factors as the profile of emigrants, time living abroad, or the fact that unlike many countries where remittances are significant, FYR Macedonia is an upper- middle-income country with a relatively low child-dependency rate where many of the elderly have pensions. Whatever the reasons, better understanding of remittances will help inform policies for leveraging their potential. a Petreski and Jovanovic (2016). b Ibid.
Knowledge Gap 2.4 continued from previous page
FYR MACEDONIA SYSTEMATIC COUNTRY DIAGNOSTIC
30 CHAPTER 2. POVERTY, SHARED PROSPERITY, AND THE LABOR MARKET

42. Social assistance did little to reduce poverty. The coverage of national safety nets is limited. As discussed in the FYR Macedonia Public Finance Review,37 social assistance spending is relatively low and fragmented, and on several indicators its performance is subpar. Moreover, recently spending has shifted to categorical programs like the parental allowance, even though poverty is still relatively high.
37 World Bank (2018a). FYR Macedonia Public Finance Review.
Figure 2.20: Employment opportunities were reflected in better labor market outcomes across the distribution…
Figure 2.21: …and translated into poverty reduction from both higher salaries and new jobs
Employment by income quintile, ages 16+, 2009–15 Contributors to poverty reduction, 2009–15, percentage points
Employment rate, percent60
50
40
30
20
10
0Lowest Highest2 3
National4 Lowest LowestHighest Highest2 23 34 4
Urban Rural
Outflow
Unempl. Insur.
Child/Social transf.
Other income
Other benefits
Demographics
Pension
New jobs
Salary increases
-6 -5 -4 -3 -2 -1 0 1 2 3
-5.4
-3.2
-2.6
-0.7
-0.7
-0.2
-0.1
0.4
2.2
▬2015 ▬2009 Percentage pointsSource: Authors’ calculations based on SILC.Note: Quintiles based on household disposable income per capita.
Source: Authors’ calculations based on SILC.
Figure 2.22: Manufacturing and services were the most important sectors for poverty reduction
Figure 2.23: Pensions in FYR Macedonia are among the highest in the region relative to average wages
Contribution of labor income to poverty reduction by industry, percentage points, 2009–15
Average pension benefit and average wage compared, c. 2013
0
-2
-4
-6
-8
-12
-10
-14National Urban Rural
60
50
40
30
20
10
0
GEOHRV
ALBLT
U
ECA-MIC
BGRSR
BSVK
EST LVA
BIH-F
edM
KD
BIH-R
S
ECA-HIC
JAgriculture JManufacturing JConstruction JTrade JOther services
Source: Authors’ calculations based on SILC 2010–2016. Source: World Bank (2014e), The Inverting Pyramid: Pension Systems Facing Demographic Challenges in Europe and Central Asia.
SEIZING A BRIGHTER FUTURE FOR ALL
31CHAPTER 2. POVERTY, SHARED PROSPERITY, AND THE LABOR MARKET
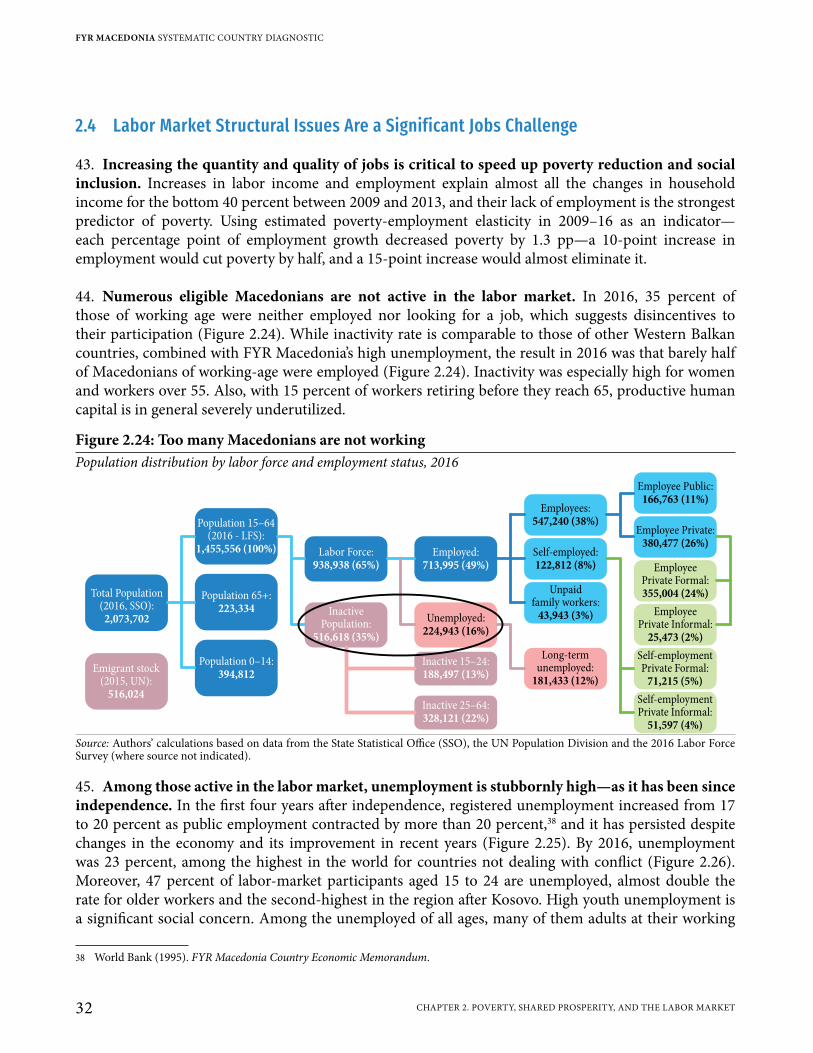
2.4 Labor Market Structural Issues Are a Significant Jobs Challenge
43. Increasing the quantity and quality of jobs is critical to speed up poverty reduction and social inclusion. Increases in labor income and employment explain almost all the changes in household income for the bottom 40 percent between 2009 and 2013, and their lack of employment is the strongest predictor of poverty. Using estimated poverty-employment elasticity in 2009–16 as an indicator—each percentage point of employment growth decreased poverty by 1.3 pp—a 10-point increase in employment would cut poverty by half, and a 15-point increase would almost eliminate it.
44. Numerous eligible Macedonians are not active in the labor market. In 2016, 35 percent of those of working age were neither employed nor looking for a job, which suggests disincentives to their participation (Figure 2.24). While inactivity rate is comparable to those of other Western Balkan countries, combined with FYR Macedonia’s high unemployment, the result in 2016 was that barely half of Macedonians of working-age were employed (Figure 2.24). Inactivity was especially high for women and workers over 55. Also, with 15 percent of workers retiring before they reach 65, productive human capital is in general severely underutilized.
45. Among those active in the labor market, unemployment is stubbornly high—as it has been since independence. In the first four years after independence, registered unemployment increased from 17 to 20 percent as public employment contracted by more than 20 percent,38 and it has persisted despite changes in the economy and its improvement in recent years (Figure 2.25). By 2016, unemployment was 23 percent, among the highest in the world for countries not dealing with conflict (Figure 2.26). Moreover, 47 percent of labor-market participants aged 15 to 24 are unemployed, almost double the rate for older workers and the second-highest in the region after Kosovo. High youth unemployment is a significant social concern. Among the unemployed of all ages, many of them adults at their working
38 World Bank (1995). FYR Macedonia Country Economic Memorandum.
Figure 2.24: Too many Macedonians are not workingPopulation distribution by labor force and employment status, 2016
Total Population(2016, SSO):
2,073,702
Emigrant stock(2015, UN):
516,024
Population 15–64(2016 - LFS):
1,455,556 (100%)
Population 65+:223,334
Labor Force:938,938 (65%)
InactivePopulation:
516,618 (35%)
Employed:713,995 (49%)
Unemployed:224,943 (16%)
Long-termunemployed:
181,433 (12%)
Inactive 15–24:188,497 (13%)
Inactive 25–64:328,121 (22%)
Employee Public:166,763 (11%)
Employee Private:380,477 (26%)
Employees:547,240 (38%)
Self-employed:122,812 (8%)
Unpaidfamily workers:
43,943 (3%)
Population 0–14:394,812
EmployeePrivate Formal:355,004 (24%)
EmployeePrivate Informal:
25,473 (2%)
Self-employmentPrivate Formal:
71,215 (5%)
Self-employmentPrivate Informal:
51,597 (4%)
Source: Authors’ calculations based on data from the State Statistical Office (SSO), the UN Population Division and the 2016 Labor Force Survey (where source not indicated).
FYR MACEDONIA SYSTEMATIC COUNTRY DIAGNOSTIC
32 CHAPTER 2. POVERTY, SHARED PROSPERITY, AND THE LABOR MARKET
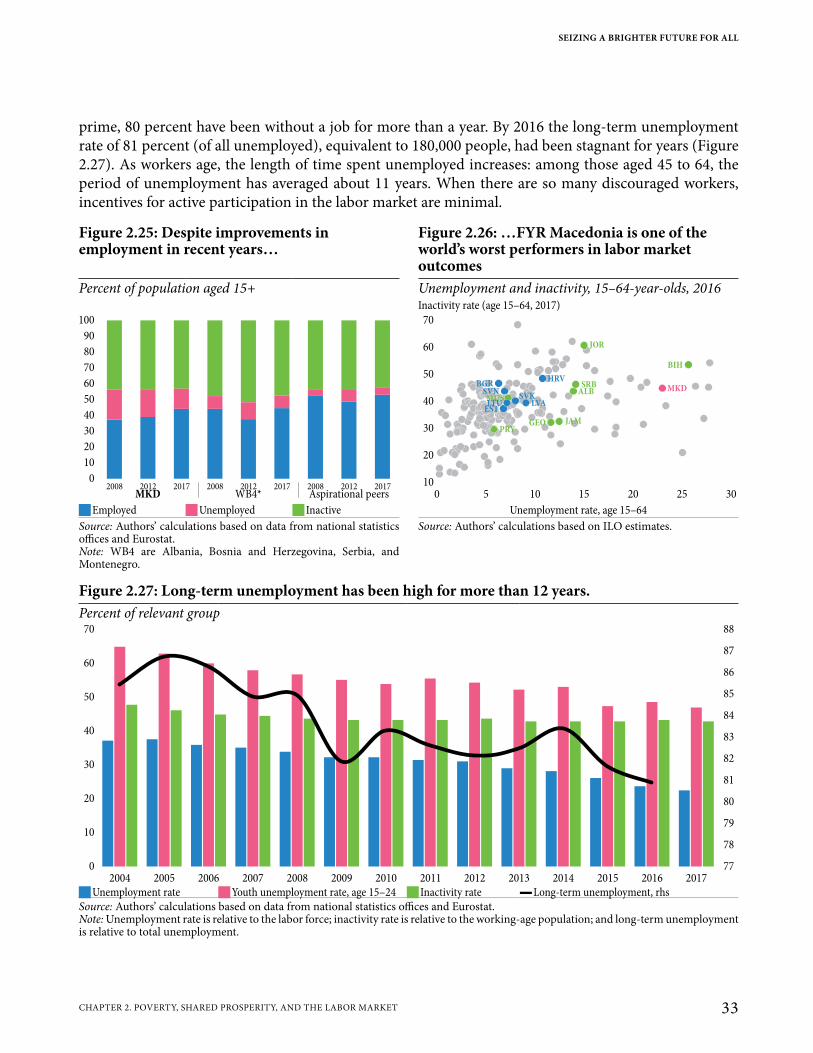
prime, 80 percent have been without a job for more than a year. By 2016 the long-term unemployment rate of 81 percent (of all unemployed), equivalent to 180,000 people, had been stagnant for years (Figure 2.27). As workers age, the length of time spent unemployed increases: among those aged 45 to 64, the period of unemployment has averaged about 11 years. When there are so many discouraged workers, incentives for active participation in the labor market are minimal.
Figure 2.25: Despite improvements in employment in recent years…
Figure 2.26: …FYR Macedonia is one of the world’s worst performers in labor market outcomes
Percent of population aged 15+ Unemployment and inactivity, 15–64-year-olds, 2016Inactivity rate (age 15–64, 2017)
100
90
80
70
60
50
40
30
20
10
02008 2012 2017
MKD WB4* Aspirational peers2008 20082012 20122017 2017
70
60
50
40
30
20
10
0 5 10 15 20 25 30
MKD
BIH
JOR
HRVBGR SRB
ALB
JAMGEOPRY
SVNSVK
ESTLVA
MUSLTU
JEmployed JUnemployed J Inactive Unemployment rate, age 15–64Source: Authors’ calculations based on data from national statistics offices and Eurostat.Note: WB4 are Albania, Bosnia and Herzegovina, Serbia, and Montenegro.
Source: Authors’ calculations based on ILO estimates.
Figure 2.27: Long-term unemployment has been high for more than 12 years.Percent of relevant group
70
60
50
40
30
20
10
0
2004 2005 2006 2007 2008 2009 2010 2011 2012 2013 2014 2015 2016 2017
88
87
86
85
84
83
82
81
80
78
79
77
JUnemployment rate JYouth unemployment rate, age 15–24 J Inactivity rate ▬Long-term unemployment, rhsSource: Authors’ calculations based on data from national statistics offices and Eurostat.Note: Unemployment rate is relative to the labor force; inactivity rate is relative to the working-age population; and long-term unemployment is relative to total unemployment.
SEIZING A BRIGHTER FUTURE FOR ALL
33CHAPTER 2. POVERTY, SHARED PROSPERITY, AND THE LABOR MARKET

46. Macedonian workers thus waste half of their productive lifetimes. Low labor force participation, high unemployment, informal work, and emigration—legacies of its status in the former Yugoslavia as the second poorest region—position FYR Macedonia among the worst performers in the world. As a consequence (Figure 2.28) the average Macedonian worker aged 15–24 loses about 8 years of productive employment: for workers 25–54 the loss is about 12 years and for workers 55–64 close to 6 years. This totals about 25 years of productive employment lost during the average worker lifecycle. For women, the lost productive potential is even worse at 30 years.
47. According to the State Statistical Office, in 2016 informal jobs in FYR Macedonia were a relatively high 18 percent. In 2010, based on LiTS data, informality was an estimated 17.2 percent (Figure 2.29)—higher than in aspirational peer countries, some structural peers, and many other Eastern European economies. Because average earnings are lower for informal than for formal workers, which signals lower productivity, a large informal sector is a drag on growth.39 Indeed, informal competitors are a common complaint about doing business in the country: all firms consume public services, but only formal firms pay taxes. Moreover, when informal and formal firms compete there is an incentive for the latter to evade taxes or ignore regulations to reduce costs, creating a vicious cycle.
2.5 A Shrinking Workforce and Emigration Compound the Jobs Challenge
48. Through 2050 the working-age population will shrink from 71 to 60 percent and the share of elderly will expand from 12.5 to 25 percent (Figure 2.30). FYR Macedonia will then have one of the largest shares of elderly among middle-income countries and will need resources to
39 World Bank (2014c). FYR Macedonia Employment and Job Creation: Labor Market Assessment 2007–2011.
Figure 2.28: Macedonian workers lose on average about 25 years of employmentAverage years of employment potentially lost, 2016
50
40
30
20
10
0AUT EST
CZELTU LVA
HUNSVN POL
SVK BGRROU ALB
HRV SRBMNE
MKDBIH KOS
J15–24 J25–54 J55–64 QFemalesSource: Authors’ calculations based on data from the SEE Jobs Gateway (World Bank and WiiW) and Eurostat.Notes: The average years of employment potentially lost is equal to the share of total working years for the age group minus the employment rate for the same age group in 2016. Methodology based on Arias et al. (2014).
Figure 2.29: FYR Macedonia has more informal workers than most peer countriesInformality rates in peer countries, 2010
SRBBIHSVNBGRLVA
HRVESTSVKLTUTURHUNKGZKOS
MDATJK
GEOUK
ARMUZB
MNEAZEUKRKAZPOLRUSFRAROU
ITASWEDEU
GEOALB
MKD
BLR
0 10 20 30 40 50 60
17.2
JStructural peers JAspirational peers JOther ECASource: Authors’ calculations based on LiTS 2010.
FYR MACEDONIA SYSTEMATIC COUNTRY DIAGNOSTIC
34 CHAPTER 2. POVERTY, SHARED PROSPERITY, AND THE LABOR MARKET
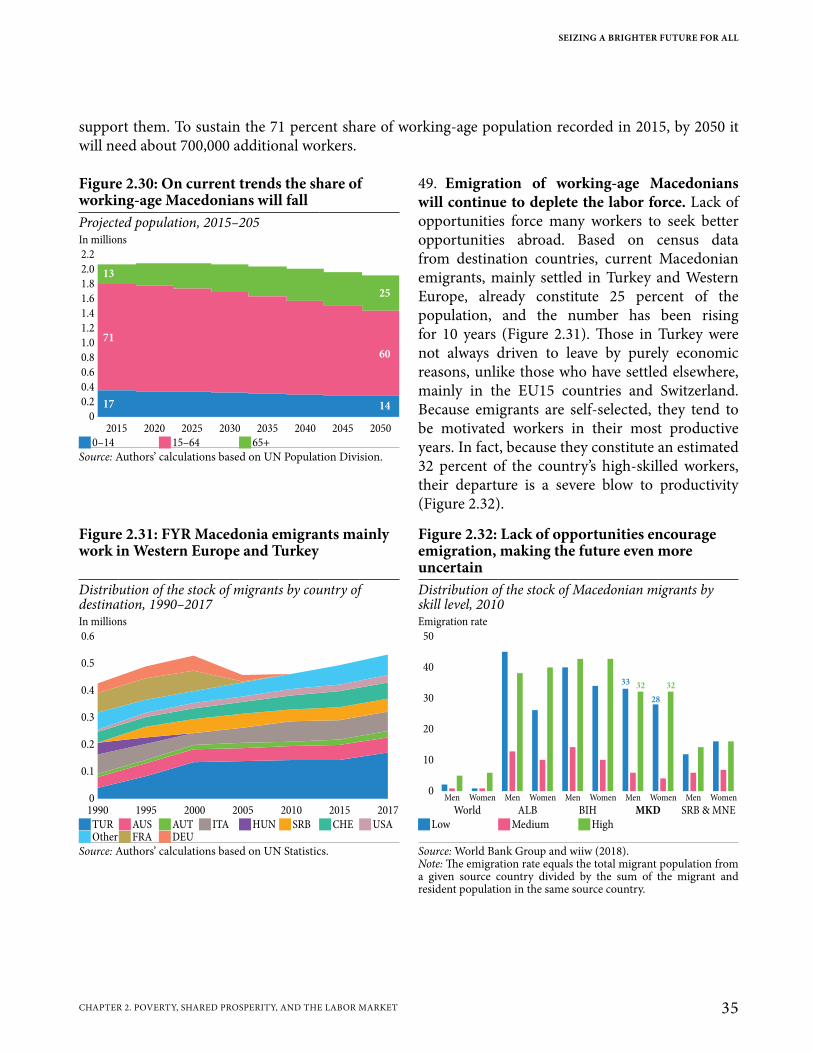
support them. To sustain the 71 percent share of working-age population recorded in 2015, by 2050 it will need about 700,000 additional workers.
49. Emigration of working-age Macedonians will continue to deplete the labor force. Lack of opportunities force many workers to seek better opportunities abroad. Based on census data from destination countries, current Macedonian emigrants, mainly settled in Turkey and Western Europe, already constitute 25 percent of the population, and the number has been rising for 10 years (Figure 2.31). Those in Turkey were not always driven to leave by purely economic reasons, unlike those who have settled elsewhere, mainly in the EU15 countries and Switzerland. Because emigrants are self-selected, they tend to be motivated workers in their most productive years. In fact, because they constitute an estimated 32 percent of the country’s high-skilled workers, their departure is a severe blow to productivity (Figure 2.32).
Figure 2.30: On current trends the share of working-age Macedonians will fallProjected population, 2015–205In millions2.2
2.0
1.8
1.6
1.4
1.2
1.0
0.8
0.4
0.6
0.2
0
2015 2020 2025 2030 20452035 20502040
13
71
17
25
60
14
J0–14 J15–64 J65+Source: Authors’ calculations based on UN Population Division.
Figure 2.31: FYR Macedonia emigrants mainly work in Western Europe and Turkey
Figure 2.32: Lack of opportunities encourage emigration, making the future even more uncertain
Distribution of the stock of migrants by country of destination, 1990–2017
Distribution of the stock of Macedonian migrants by skill level, 2010
In millions Emigration rate0.6
0.5
0.4
0.3
0.2
0.1
0
1990 1995 2000 2005 2010 20172015
50
40
30
20
10
0
WorldMen
ALB BIH MKD SRB & MNEWomen Men Men Men MenWomen Women Women Women
33 32
28
32
JTUR JAUS JAUT J ITA JHUN JSRB JCHE JUSA JLow JMedium JHigh JOther JFRA JDEU
Source: Authors’ calculations based on UN Statistics. Source: World Bank Group and wiiw (2018).Note: The emigration rate equals the total migrant population from a given source country divided by the sum of the migrant and resident population in the same source country.
SEIZING A BRIGHTER FUTURE FOR ALL
35CHAPTER 2. POVERTY, SHARED PROSPERITY, AND THE LABOR MARKET
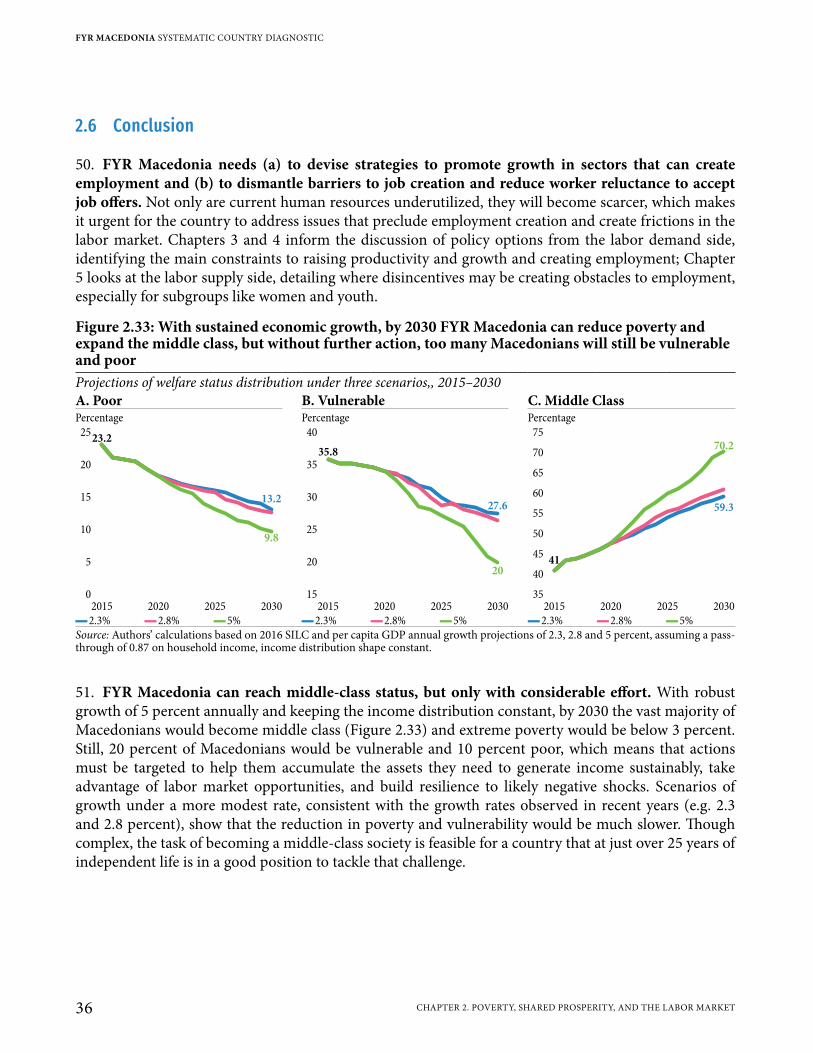
2.6 Conclusion
50. FYR Macedonia needs (a) to devise strategies to promote growth in sectors that can create employment and (b) to dismantle barriers to job creation and reduce worker reluctance to accept job offers. Not only are current human resources underutilized, they will become scarcer, which makes it urgent for the country to address issues that preclude employment creation and create frictions in the labor market. Chapters 3 and 4 inform the discussion of policy options from the labor demand side, identifying the main constraints to raising productivity and growth and creating employment; Chapter 5 looks at the labor supply side, detailing where disincentives may be creating obstacles to employment, especially for subgroups like women and youth.
51. FYR Macedonia can reach middle-class status, but only with considerable effort. With robust growth of 5 percent annually and keeping the income distribution constant, by 2030 the vast majority of Macedonians would become middle class (Figure 2.33) and extreme poverty would be below 3 percent. Still, 20 percent of Macedonians would be vulnerable and 10 percent poor, which means that actions must be targeted to help them accumulate the assets they need to generate income sustainably, take advantage of labor market opportunities, and build resilience to likely negative shocks. Scenarios of growth under a more modest rate, consistent with the growth rates observed in recent years (e.g. 2.3 and 2.8 percent), show that the reduction in poverty and vulnerability would be much slower. Though complex, the task of becoming a middle-class society is feasible for a country that at just over 25 years of independent life is in a good position to tackle that challenge.
Figure 2.33: With sustained economic growth, by 2030 FYR Macedonia can reduce poverty and expand the middle class, but without further action, too many Macedonians will still be vulnerable and poorProjections of welfare status distribution under three scenarios,, 2015–2030A. Poor B. Vulnerable C. Middle ClassPercentage Percentage Percentage
25
20
15
10
5
0
2015 2020 2025 2030
9.8
13.2
23.240
35
30
25
20
15
2015 2020 2025 2030
20
27.6
35.8
75
70
65
60
55
50
45
40
35
2015 2020 2025 2030
59.3
70.2
41
▬2.3% ▬2.8% ▬5% ▬2.3% ▬2.8% ▬5% ▬2.3% ▬2.8% ▬5%Source: Authors’ calculations based on 2016 SILC and per capita GDP annual growth projections of 2.3, 2.8 and 5 percent, assuming a pass-through of 0.87 on household income, income distribution shape constant.
FYR Macedonia Systematic Country Diagnostic | Seizing a Brighter Future for AllFYR MACEDONIA SYSTEMATIC COUNTRY DIAGNOSTIC
36 CHAPTER 2. POVERTY, SHARED PROSPERITY, AND THE LABOR MARKET

FYR Macedonia Systematic Country Diagnostic | Seizing a Brighter Future for All
Tanja TanevskaBirth-II/II-0405
Marjan’s business story is all about beating the odds. When he started a company to produce sophisticated computer software 15 years ago, few people believed he would make it. After all, Skopje is a long way from California, and the Internet connections were unpredictable, to say the least. Keeping in touch with clients wasn’t easy, and Marjan remembers his team often working all night to ensure the quality of a new product, and then racing to the shipping company to make sure it got to the client on time. Fortunately, his company now finds it easier to send products over the Internet, and when he needs to expand, it now takes only a few days to get the new business licenses he needs. That gives his team more time to find creative ways to improve their software and travel to international conferences to market it. Thanks to a steady flow of satisfied clients, he can offer his staff competitive salaries, without needing to worry constantly about the competition poaching his staff. The company has grown to more than 200 staff, though it takes most new hires at least a year of training to get up to speed. Marjan is talking to academia and business associations to see if the provision of computer engineering and programming skills can be strengthened. Marjan has no illusions: he knows how competitive the global market is, and he’s committed to constantly learning so he can make better-quality products, faster, and at a lower cost.
Chapter 3. Economic Growth and Jobs
Chapter 3. Economic Growth and Jobs
Since its independence, FYR Macedonia has advanced from lower-middle- to upper-middle-income status, and from a planned to a market economy aspiring to EU membership. Despite shocks, prudent macroeconomic policies, structural reforms, and measures to attract private investment have produced steady growth, and the country has managed to double its per capita income in the last 18 years. Yet, despite being a regional leader in post-transition economic reform, GDP growth in FYR Macedonia has been slower than in peer countries. At the current per capita GDP growth rates, which assume a continuation of structural reforms, a child born today will be 35 years old by the time FYR Macedonia reaches the level of income of a high-income country. However, if GDP per capita growth accelerates and sustains growth to an annual average of 5 percent, the child would be just 18 by the time the country reaches this high-income level. Achieving and sustaining 5 percent annual GDP per capita growth will be very difficult, but if policymakers and country stakeholders can agree on a shared reform vision, it is possible. A core objective is to increase productivity. Currently, productivity contributes little to growth, and labor and capital are not efficiently reallocated from less- to more-productive activities. Meanwhile, only half of working-age Macedonians have jobs. Evidence shows that the most productive firms in FYR Macedonia not only grow faster, but they also create more and better-paying jobs. Thus, increasing the productivity of the economy is essential to achieve and sustain higher growth rates, and to generate more job opportunities for citizens.
3.1 Growth Trends
52. Since 2000, real per capita income in FYR Macedonia has doubled. For 2000–17, average annual real GDP per capita growth was 2.8 percent, well above the 1.9 percent ECA average. As a result, GDP per capita rose by 51 percent, from US$9,000 in 2000 to US$13,600 in 2017.40 Meanwhile, the ECA region as a whole saw an increase of just over 31 percent.
53. However, though less volatile than in peer countries, GDP growth in FYR Macedonia has in general been moderate: real GDP growth of 2.8 percent for 2000–17 was below the averages of 3.7 percent for structural peers and the 3.4 percent for aspirational peers (Figure 3.1).41 Nevertheless, FYR Macedonia’s less volatile growth highlights the relative resilience of its economy, especially since the global financial crisis (2009–17) when though its annual growth slowed to 2.0 percent, that was above the 1 percent average for aspirational peers (Figure 3.2).
54. With prudent macroeconomic policies, FYR Macedonia was able to create enough fiscal space for a countercyclical fiscal policy42 that mitigated the volatility of growth in 2008–09 and 2011–
40 Real GDP per capita figures are based on purchasing power parity (PPP) in constant 2011 international U.S. dollars.41 Structural peers: Albania, Bosnia and Herzegovina, Georgia, Jamaica, Jordan, Mauritius, Paraguay, and Serbia; aspirational peers:
Bulgaria, Croatia, Estonia, Latvia, Lithuania, the Slovak Republic, and Slovenia (see Annex 1).42 For countries like FYR Macedonia with fixed exchange-rate regimes, where fiscal policy is the primary instrument available to manage
the business cycle, it is imperative during upturns to save resources as fiscal buffers and during downturns to increase public spending, a countercyclical measure.
FYR MACEDONIA SYSTEMATIC COUNTRY DIAGNOSTIC
38 CHAPTER 3. ECONOMIC GROWTH AND JOBS
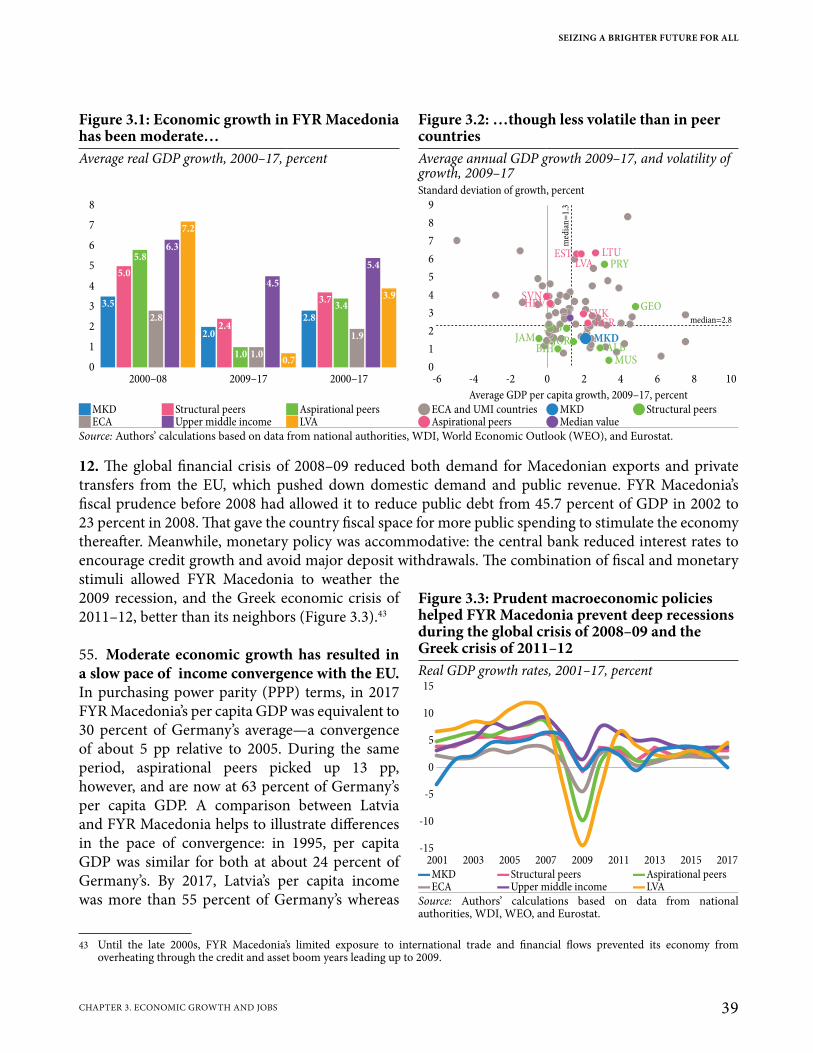
12. The global financial crisis of 2008–09 reduced both demand for Macedonian exports and private transfers from the EU, which pushed down domestic demand and public revenue. FYR Macedonia’s fiscal prudence before 2008 had allowed it to reduce public debt from 45.7 percent of GDP in 2002 to 23 percent in 2008. That gave the country fiscal space for more public spending to stimulate the economy thereafter. Meanwhile, monetary policy was accommodative: the central bank reduced interest rates to encourage credit growth and avoid major deposit withdrawals. The combination of fiscal and monetary stimuli allowed FYR Macedonia to weather the 2009 recession, and the Greek economic crisis of 2011–12, better than its neighbors (Figure 3.3).43
55. Moderate economic growth has resulted in a slow pace of income convergence with the EU. In purchasing power parity (PPP) terms, in 2017 FYR Macedonia’s per capita GDP was equivalent to 30 percent of Germany’s average—a convergence of about 5 pp relative to 2005. During the same period, aspirational peers picked up 13 pp, however, and are now at 63 percent of Germany’s per capita GDP. A comparison between Latvia and FYR Macedonia helps to illustrate differences in the pace of convergence: in 1995, per capita GDP was similar for both at about 24 percent of Germany’s. By 2017, Latvia’s per capita income was more than 55 percent of Germany’s whereas
43 Until the late 2000s, FYR Macedonia’s limited exposure to international trade and financial flows prevented its economy from overheating through the credit and asset boom years leading up to 2009.
Figure 3.1: Economic growth in FYR Macedonia has been moderate…
Figure 3.2: …though less volatile than in peer countries
Average real GDP growth, 2000–17, percent Average annual GDP growth 2009–17, and volatility of growth, 2009–17Standard deviation of growth, percent
8
7
6
5
4
3
2
1
0
2000–08 2009–17 2000–17
3.5
5.0
5.8
2.8
6.3
7.2
2.02.4
1.0 1.0
4.5
0.7
2.8
3.73.4
1.9
5.4
3.9
9
8
7
6
5
4
3
2
1
0-6 -4 -2 0 2 4 6 8 10
EST LTULVA PRY
SVNHRV
SVKGEO
BGR
MKDSRB
JAMBIH ALB
MUS
JOR
median=2.8
med
ian
=1.
3
Average GDP per capita growth, 2009–17, percent JMKD JStructural peers JAspirational peers QECA and UMI countries QMKD QStructural peers JECA JUpper middle income JLVA QAspirational peers QMedian value
Source: Authors’ calculations based on data from national authorities, WDI, World Economic Outlook (WEO), and Eurostat.
Figure 3.3: Prudent macroeconomic policies helped FYR Macedonia prevent deep recessions during the global crisis of 2008–09 and the Greek crisis of 2011–12Real GDP growth rates, 2001–17, percent
15
10
5
0
-5
-10
-15
2001 2003 2005 2007 2009 2011 2013 2015 2017
▬MKD ▬Structural peers ▬Aspirational peers ▬ECA ▬Upper middle income ▬LVA
Source: Authors’ calculations based on data from national authorities, WDI, WEO, and Eurostat.
SEIZING A BRIGHTER FUTURE FOR ALL
39CHAPTER 3. ECONOMIC GROWTH AND JOBS

FYR Macedonia’s had reached about 30 percent (Figure 3.4).
56. To achieve high-income status in a single generation, FYR Macedonia needs to generate faster and sustained growth. The implications of growth are staggering. In 2017 per capita gross national income (GNI) was US$4,880. At the median annual growth rate of 2.6 percent (2009–16), a Macedonian child born today would be 35 years old by the time the country achieves a high-income GNI per capita.44 With more modest annual per capita income growth of 2.3 percent, that would take close to 40 years. However, with higher sustained growth rates the country could reach high-income status faster. For example, increasing its annual per capita growth to 3.5 percent would reduce the time needed to achieve high-income status to 26 years, and with annual per capita growth of 5 percent, it would take just 18 years (Figure 3.5).45 It is thus not surprising that about 50 percent of Macedonian respondents in the Balkan Barometer surveys of 2015–17 mentioned attention to the economic situation as a priority for the country.
57. The rest of this chapter analyzes not only past drivers of growth and jobs in FYR Macedonia but also potential output growth from both macro and micro perspectives. The microeconomic analysis, which combines data from the Macedonian firm registry with data from firm surveys, concludes that to converge faster to EU income levels and create more and better jobs, FYR Macedonia must raise productivity. That will require both more efficient allocation of resources in the economy and technological innovation.
44 This refers to a high-income GNI per capita threshold of US$12,056 for 2017.45 A similar exercise was conducted to simulate the time it would take for FYR Macedonia to converge to the average income level of the
EU28. Note that many countries in the EU are high-income countries, and thus reaching the average income level in the EU28 would take longer than reaching the threshold to become a high-income economy. If we assume that the average income in the EU28 grows at a steady rate of 1.8 percent annually, and FYR Macedonia grows steadily at an annual rate of 2.8 percent (the average growth rate between 2000–17), a Macedonian child born today would be 75 years old by the time she earned the average income in the EU28. With a higher annual growth of 3.5 percent, the time needed to converge with the EU28 would be 50 years; a faster 5 percent growth rate would mean that convergence takes just 30 years. A recent study, “Revving Up the Engines of Growth and Prosperity in the Western Balkans” (World Bank 2017), highlights the importance to income convergence of sustained and faster economic growth for the six countries in the region. On average, with a continuation of 1.8 percent annual growth it would take the Western Balkans 60 years to converge with EU income levels. But the time to converge could be reduced to just 20 years with sustained annual growth rates of 5 percent. See https://openknowledge.worldbank.org/bitstream/handle/ 10986/28894/ACS22690.pdf.
Figure 3.5: Increasing and sustaining growth would cut the time to reach high-income status to less than one generationShare of high-income GNI per capita, for different growth rates100
90
80
70
60
50
40
30
20
10
0
2017 5 10 15 20 25 30 35 40
Years to reach 100 ▬[email protected]% ▬[email protected]% ▬[email protected]% ▬MKD@5%
Source: Authors’ calculations based on data from WDI.Note: The high-income status threshold refers to a GNI per capita of US$12,056.
Figure 3.4: FYR Macedonia’s economy has not grown fast enough to close its income gap with the EUGDP per capita as a share of Germany’s, PPP 2011 prices
65
55
45
35
25
15
1995 2003 2005 2007 2009 2011 2013 2015 201720011997 1999
▬MKD ▬Structural peers ▬Aspirational peers ▬LVA
Source: Authors’ calculations based on data from WDI and Eurostat.
FYR MACEDONIA SYSTEMATIC COUNTRY DIAGNOSTIC
40 CHAPTER 3. ECONOMIC GROWTH AND JOBS

3.2 Drivers of Growth
58. Until 2008, FYR Macedonia’s growth model relied heavily on consumption (Figure 3.6), which represented about 96 percent of GDP for 2001 through 2008, compared to an average of 78 percent among aspirational peers and EU countries. During this period consumption also contributed 110 percent of the country’s growth in GDP (net exports had a negative contribution). However, private consumption, fueled by private transfers from abroad; credit growth (though from a low base); and the recovery in private investments that began in 2004 led to a growing external imbalance as growth in imports of consumer goods surpassed export growth. By 2008, the country’s current account deficit (CAD) had reached a historic high of 12.7 percent of GDP, driven primarily by the deterioration in the trade deficit, which was 29 percent of GDP.
59. However, consumption contributed less to economic growth post-crisis. Both the global and Greek crises depressed Macedonian private consumption as real wage growth slowed from a pre-crisis average of 4 percent to 1.9 percent for 2009–12 (Figure 3.7). After 2013 personal consumption did recover as labor-market conditions improved and disposable income increased. Higher employment post-crisis reflected a combination of employment growth in the public and FDI-oriented sectors, active labor market policies (ALMPs), and higher pensions and subsidies. These factors combined with relatively low inflation to boost disposable incomes.
60. Rising exports and investment post-crisis helped to rebalance drivers of growth away from consumption. In FYR Macedonia, as in many other European countries, the global crisis disrupted the inflow of foreign capital, shifting the sources of growth. In 2009–17 exports and investments on average contributed about 5 pp a year to Macedonian GDP growth (Figure 3.8 and Figure 3.9). While the country depends heavily on imports, rising exports helped narrow the CAD from a record high of 12.7 percent of GDP in 2008 to 1.3 percent in 2017.
Figure 3.6: Until 2008 household consumption had been the main driver of growth…
Figure 3.7: …but thereafter, until the political crisis, exports and investment gained importance
Contribution to GDP growth, percent Contribution to GDP growth, percent20
15
10
5
0
-5
-10
-15
-20
2001 2002 2003 2004 2005 2006 2007 2008
20
15
10
5
0
-5
-10
-15
-20
2009 2010 2011 2012 2013 2014 2015 20172016
JHousehold consumption JGovernment consumption JGross capital formation JExport of goods & services J Import of goods & services ▬GDP growth
Source: Authors’ calculations based on data from national authorities.
SEIZING A BRIGHTER FUTURE FOR ALL
41CHAPTER 3. ECONOMIC GROWTH AND JOBS
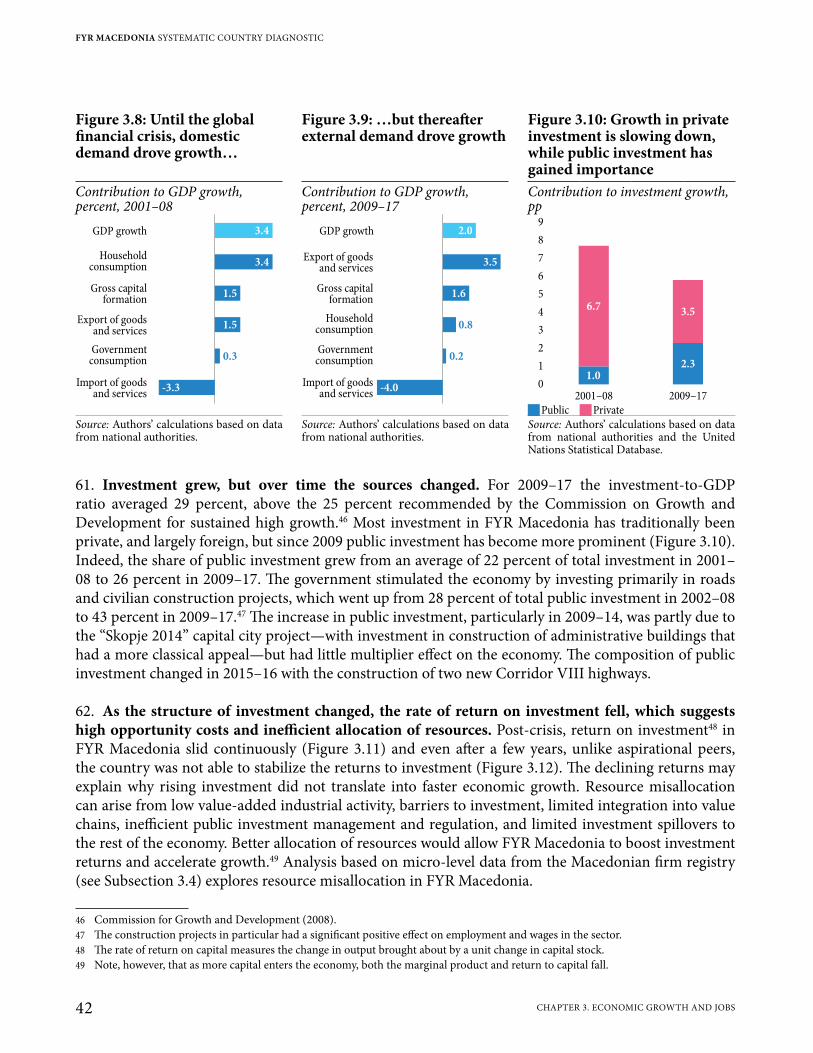
61. Investment grew, but over time the sources changed. For 2009–17 the investment-to-GDP ratio averaged 29 percent, above the 25 percent recommended by the Commission on Growth and Development for sustained high growth.46 Most investment in FYR Macedonia has traditionally been private, and largely foreign, but since 2009 public investment has become more prominent (Figure 3.10). Indeed, the share of public investment grew from an average of 22 percent of total investment in 2001–08 to 26 percent in 2009–17. The government stimulated the economy by investing primarily in roads and civilian construction projects, which went up from 28 percent of total public investment in 2002–08 to 43 percent in 2009–17.47 The increase in public investment, particularly in 2009–14, was partly due to the “Skopje 2014” capital city project—with investment in construction of administrative buildings that had a more classical appeal—but had little multiplier effect on the economy. The composition of public investment changed in 2015–16 with the construction of two new Corridor VIII highways.
62. As the structure of investment changed, the rate of return on investment fell, which suggests high opportunity costs and inefficient allocation of resources. Post-crisis, return on investment48 in FYR Macedonia slid continuously (Figure 3.11) and even after a few years, unlike aspirational peers, the country was not able to stabilize the returns to investment (Figure 3.12). The declining returns may explain why rising investment did not translate into faster economic growth. Resource misallocation can arise from low value-added industrial activity, barriers to investment, limited integration into value chains, inefficient public investment management and regulation, and limited investment spillovers to the rest of the economy. Better allocation of resources would allow FYR Macedonia to boost investment returns and accelerate growth.49 Analysis based on micro-level data from the Macedonian firm registry (see Subsection 3.4) explores resource misallocation in FYR Macedonia.
46 Commission for Growth and Development (2008).47 The construction projects in particular had a significant positive effect on employment and wages in the sector.48 The rate of return on capital measures the change in output brought about by a unit change in capital stock.49 Note, however, that as more capital enters the economy, both the marginal product and return to capital fall.
Figure 3.8: Until the global financial crisis, domestic demand drove growth…
Figure 3.9: …but thereafter external demand drove growth
Figure 3.10: Growth in private investment is slowing down, while public investment has gained importance
Contribution to GDP growth, percent, 2001–08
Contribution to GDP growth, percent, 2009–17
Contribution to investment growth, pp
GDP growth
Householdconsumption
Gross capitalformation
Export of goodsand services
Governmentconsumption
Import of goodsand services
3.4
3.4
1.5
1.5
0.3
-3.3
GDP growth
Householdconsumption
Gross capitalformation
Export of goodsand services
Governmentconsumption
Import of goodsand services
2.0
3.5
1.6
0.8
0.2
-4.0
9
8
7
6
5
4
3
2
1
0
2001–08 2009–17
6.73.5
2.31.0
JPublic JPrivateSource: Authors’ calculations based on data from national authorities.
Source: Authors’ calculations based on data from national authorities.
Source: Authors’ calculations based on data from national authorities and the United Nations Statistical Database.
FYR MACEDONIA SYSTEMATIC COUNTRY DIAGNOSTIC
42 CHAPTER 3. ECONOMIC GROWTH AND JOBS

63. FDI in the motor vehicles and electric machinery industries have boosted total exports and made them more sophisticated. Exports from FDI-supported manufacturers contributed to robust growth in exports (see Chapter 4), which have almost tripled in constant prices in the last 18 years. In 2017 exports reached 55 percent of GDP, which is 22 pp above their 2000 level. Since 2009, exports have become more sophisticated, supported by FDI-manufacturers (Figure 3.13). FYR Macedonia has the highest level of export sophistication in the Western Balkans, just slightly below the average export sophistication of aspirational peers. Disaggregating the export sophistication index for manufactures shows that FYR Macedonia has managed to increase sophistication in medium- and high-skilled and technology-intensity products, while also decreasing the level of low-skilled and low-technology products (Subsection 4.1.1).50
64. Nevertheless, the contribution of net exports to GDP growth has been low or negative, in part because of the high import content of exports. Imports grew from 55 percent of GDP in 2006 to 69 percent in 2017 (Figure 3.13), and a large share was intermediate goods, partly because FDI-financed industries like auto parts have high import content (see Chapter 4 for a detailed discussion of trends and drivers of trade). Imports also increased as consumption and investment recovered. (Imports may have slowed FYR Macedonia’s economic growth in periods of relatively robust growth but they also prevented deeper recessions when economic conditions worsened.) After the global and Greek crises and FYR Macedonia’s political crisis in 2016–17, declining imports partly offset the fall in private consumption and investment.
65. FYR Macedonia’s potential output, referred to as the level of real GDP that can be sustained over the long term, is declining. Potential output, measured by the structural component of growth, highlights what an economy can produce when operating at maximum sustainable employment; it
50 For more details on the evolution of export sophistication in the Western Balkans please see Shimbov et al. (2018, forthcoming).
Figure 3.11: Returns on investments have declined…
Figure 3.12: …more than in peer economies
Growth rate and rate of return of investment, percent Rates of return on investment by country, percent14 7
12 6
10 5
8 4
6 3
4 2
2 1
0 0
2000–08 2009–14 2015–17
11.413.0
9.7
19
17
15
13
11
7
9
1995 97 99 01 03 05 07 09 11 13 15 2017
JAverage rate of return to capital ▬Capital growth rate, rhs ▬MKD ▬LVA ▬SVN ▬HRV ▬SRB ▬Linear (average rate of return to capital
Source: Authors’ calculations based on data from national authorities and the United Nations Statistical Database.
SEIZING A BRIGHTER FUTURE FOR ALL
43CHAPTER 3. ECONOMIC GROWTH AND JOBS
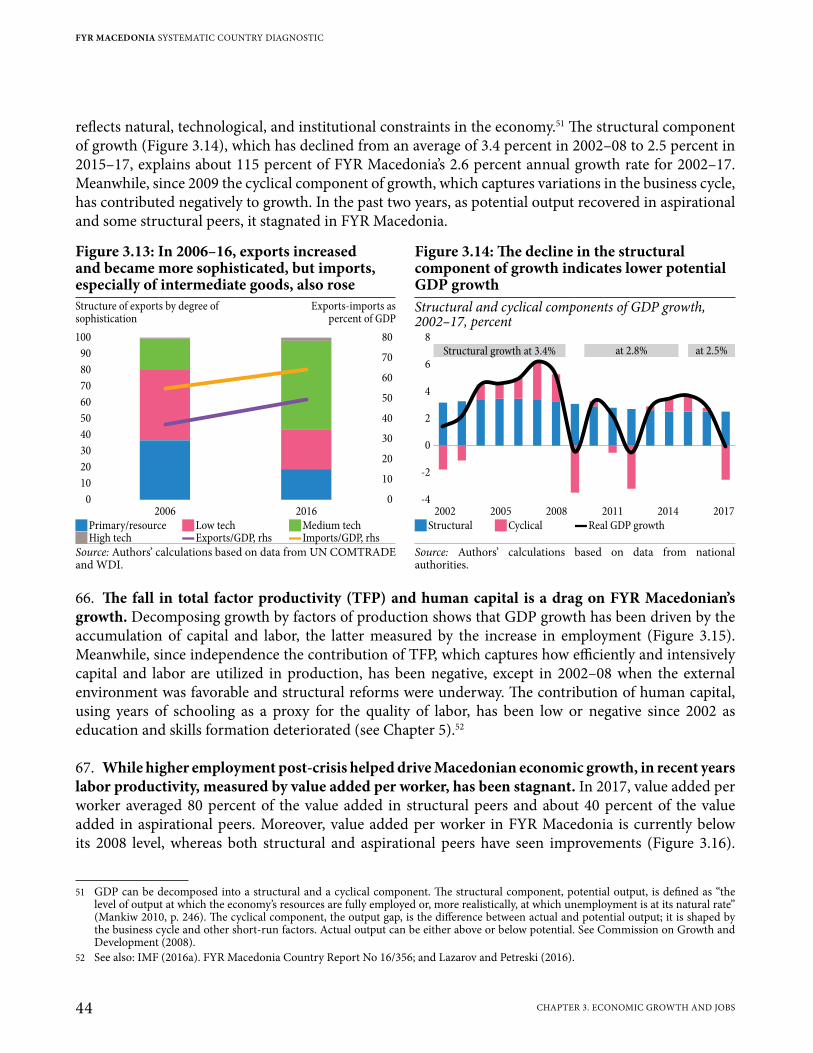
reflects natural, technological, and institutional constraints in the economy.51 The structural component of growth (Figure 3.14), which has declined from an average of 3.4 percent in 2002–08 to 2.5 percent in 2015–17, explains about 115 percent of FYR Macedonia’s 2.6 percent annual growth rate for 2002–17. Meanwhile, since 2009 the cyclical component of growth, which captures variations in the business cycle, has contributed negatively to growth. In the past two years, as potential output recovered in aspirational and some structural peers, it stagnated in FYR Macedonia.
66. The fall in total factor productivity (TFP) and human capital is a drag on FYR Macedonian’s growth. Decomposing growth by factors of production shows that GDP growth has been driven by the accumulation of capital and labor, the latter measured by the increase in employment (Figure 3.15). Meanwhile, since independence the contribution of TFP, which captures how efficiently and intensively capital and labor are utilized in production, has been negative, except in 2002–08 when the external environment was favorable and structural reforms were underway. The contribution of human capital, using years of schooling as a proxy for the quality of labor, has been low or negative since 2002 as education and skills formation deteriorated (see Chapter 5).52
67. While higher employment post-crisis helped drive Macedonian economic growth, in recent years labor productivity, measured by value added per worker, has been stagnant. In 2017, value added per worker averaged 80 percent of the value added in structural peers and about 40 percent of the value added in aspirational peers. Moreover, value added per worker in FYR Macedonia is currently below its 2008 level, whereas both structural and aspirational peers have seen improvements (Figure 3.16).
51 GDP can be decomposed into a structural and a cyclical component. The structural component, potential output, is defined as “the level of output at which the economy’s resources are fully employed or, more realistically, at which unemployment is at its natural rate” (Mankiw 2010, p. 246). The cyclical component, the output gap, is the difference between actual and potential output; it is shaped by the business cycle and other short-run factors. Actual output can be either above or below potential. See Commission on Growth and Development (2008).
52 See also: IMF (2016a). FYR Macedonia Country Report No 16/356; and Lazarov and Petreski (2016).
Figure 3.13: In 2006–16, exports increased and became more sophisticated, but imports, especially of intermediate goods, also rose
Figure 3.14: The decline in the structural component of growth indicates lower potential GDP growth
Structure of exports by degree of sophistication
Exports-imports as percent of GDP
Structural and cyclical components of GDP growth, 2002–17, percent
100
90
80
70
60
50
40
30
20
10
0
80
70
60
50
40
30
20
10
0
2006 2016
8
6
4
2
0
-2
-42002 2005 2008 2011 2014 2017
Structural growth at 3.4% at 2.8% at 2.5%
JPrimary/resource JLow tech JMedium tech JStructural JCyclical ▬Real GDP growth JHigh tech ▬Exports/GDP, rhs ▬ Imports/GDP, rhs
Source: Authors’ calculations based on data from UN COMTRADE and WDI.
Source: Authors’ calculations based on data from national authorities.
FYR MACEDONIA SYSTEMATIC COUNTRY DIAGNOSTIC
44 CHAPTER 3. ECONOMIC GROWTH AND JOBS
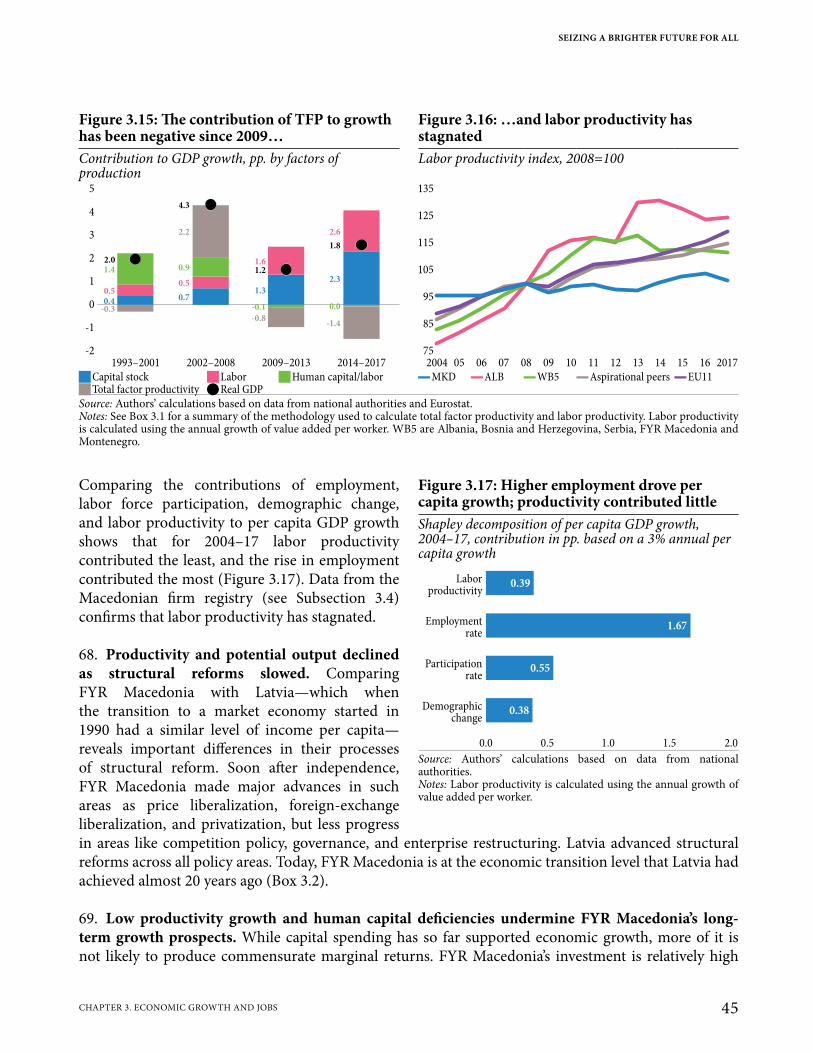
Comparing the contributions of employment, labor force participation, demographic change, and labor productivity to per capita GDP growth shows that for 2004–17 labor productivity contributed the least, and the rise in employment contributed the most (Figure 3.17). Data from the Macedonian firm registry (see Subsection 3.4) confirms that labor productivity has stagnated.
68. Productivity and potential output declined as structural reforms slowed. Comparing FYR Macedonia with Latvia—which when the transition to a market economy started in 1990 had a similar level of income per capita—reveals important differences in their processes of structural reform. Soon after independence, FYR Macedonia made major advances in such areas as price liberalization, foreign-exchange liberalization, and privatization, but less progress in areas like competition policy, governance, and enterprise restructuring. Latvia advanced structural reforms across all policy areas. Today, FYR Macedonia is at the economic transition level that Latvia had achieved almost 20 years ago (Box 3.2).
69. Low productivity growth and human capital deficiencies undermine FYR Macedonia’s long-term growth prospects. While capital spending has so far supported economic growth, more of it is not likely to produce commensurate marginal returns. FYR Macedonia’s investment is relatively high
Figure 3.15: The contribution of TFP to growth has been negative since 2009…
Figure 3.16: …and labor productivity has stagnated
Contribution to GDP growth, pp. by factors of production
Labor productivity index, 2008=100
5
4
3
2
1
0
-1
-2
1993–2001 2002–2008 2009–2013 2014–2017
2.01.4
0.50.4
-0.3
4.3
2.2
0.9
0.5
0.7
1.61.2
1.3
-0.1
-0.8
2.6
1.8
2.3
0.0
-1.4
135
125
115
105
95
85
75
2004 05 06 07 08 09 10 11 12 13 14 15 16 2017
JCapital stock JLabor JHuman capital/labor ▬MKD ▬ALB ▬WB5 ▬Aspirational peers ▬EU11 JTotal factor productivity QReal GDP
Source: Authors’ calculations based on data from national authorities and Eurostat.Notes: See Box 3.1 for a summary of the methodology used to calculate total factor productivity and labor productivity. Labor productivity is calculated using the annual growth of value added per worker. WB5 are Albania, Bosnia and Herzegovina, Serbia, FYR Macedonia and Montenegro.
Figure 3.17: Higher employment drove per capita growth; productivity contributed littleShapley decomposition of per capita GDP growth, 2004–17, contribution in pp. based on a 3% annual per capita growth
Laborproductivity
Employmentrate
Participationrate
Demographicchange
0.0 0.5 1.0 1.5 2.0
0.39
1.67
0.55
0.38
Source: Authors’ calculations based on data from national authorities.Notes: Labor productivity is calculated using the annual growth of value added per worker.
SEIZING A BRIGHTER FUTURE FOR ALL
45CHAPTER 3. ECONOMIC GROWTH AND JOBS
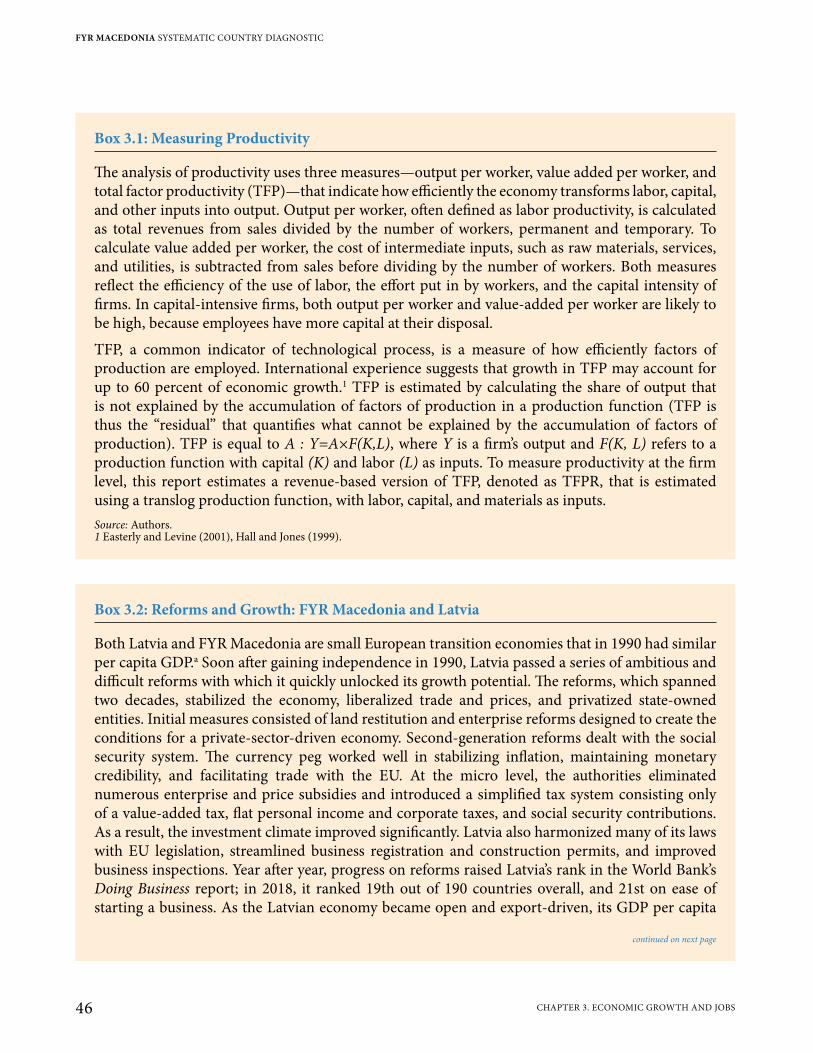
Box 3.1: Measuring Productivity
The analysis of productivity uses three measures—output per worker, value added per worker, and total factor productivity (TFP)—that indicate how efficiently the economy transforms labor, capital, and other inputs into output. Output per worker, often defined as labor productivity, is calculated as total revenues from sales divided by the number of workers, permanent and temporary. To calculate value added per worker, the cost of intermediate inputs, such as raw materials, services, and utilities, is subtracted from sales before dividing by the number of workers. Both measures reflect the efficiency of the use of labor, the effort put in by workers, and the capital intensity of firms. In capital-intensive firms, both output per worker and value-added per worker are likely to be high, because employees have more capital at their disposal.
TFP, a common indicator of technological process, is a measure of how efficiently factors of production are employed. International experience suggests that growth in TFP may account for up to 60 percent of economic growth.1 TFP is estimated by calculating the share of output that is not explained by the accumulation of factors of production in a production function (TFP is thus the “residual” that quantifies what cannot be explained by the accumulation of factors of production). TFP is equal to A : Y=A×F(K,L), where Y is a firm’s output and F(K, L) refers to a production function with capital (K) and labor (L) as inputs. To measure productivity at the firm level, this report estimates a revenue-based version of TFP, denoted as TFPR, that is estimated using a translog production function, with labor, capital, and materials as inputs.Source: Authors.1 Easterly and Levine (2001), Hall and Jones (1999).
Box 3.2: Reforms and Growth: FYR Macedonia and Latvia
Both Latvia and FYR Macedonia are small European transition economies that in 1990 had similar per capita GDP.a Soon after gaining independence in 1990, Latvia passed a series of ambitious and difficult reforms with which it quickly unlocked its growth potential. The reforms, which spanned two decades, stabilized the economy, liberalized trade and prices, and privatized state-owned entities. Initial measures consisted of land restitution and enterprise reforms designed to create the conditions for a private-sector-driven economy. Second-generation reforms dealt with the social security system. The currency peg worked well in stabilizing inflation, maintaining monetary credibility, and facilitating trade with the EU. At the micro level, the authorities eliminated numerous enterprise and price subsidies and introduced a simplified tax system consisting only of a value-added tax, flat personal income and corporate taxes, and social security contributions. As a result, the investment climate improved significantly. Latvia also harmonized many of its laws with EU legislation, streamlined business registration and construction permits, and improved business inspections. Year after year, progress on reforms raised Latvia’s rank in the World Bank’s Doing Business report; in 2018, it ranked 19th out of 190 countries overall, and 21st on ease of starting a business. As the Latvian economy became open and export-driven, its GDP per capita
continued on next page
FYR MACEDONIA SYSTEMATIC COUNTRY DIAGNOSTIC
46 CHAPTER 3. ECONOMIC GROWTH AND JOBS
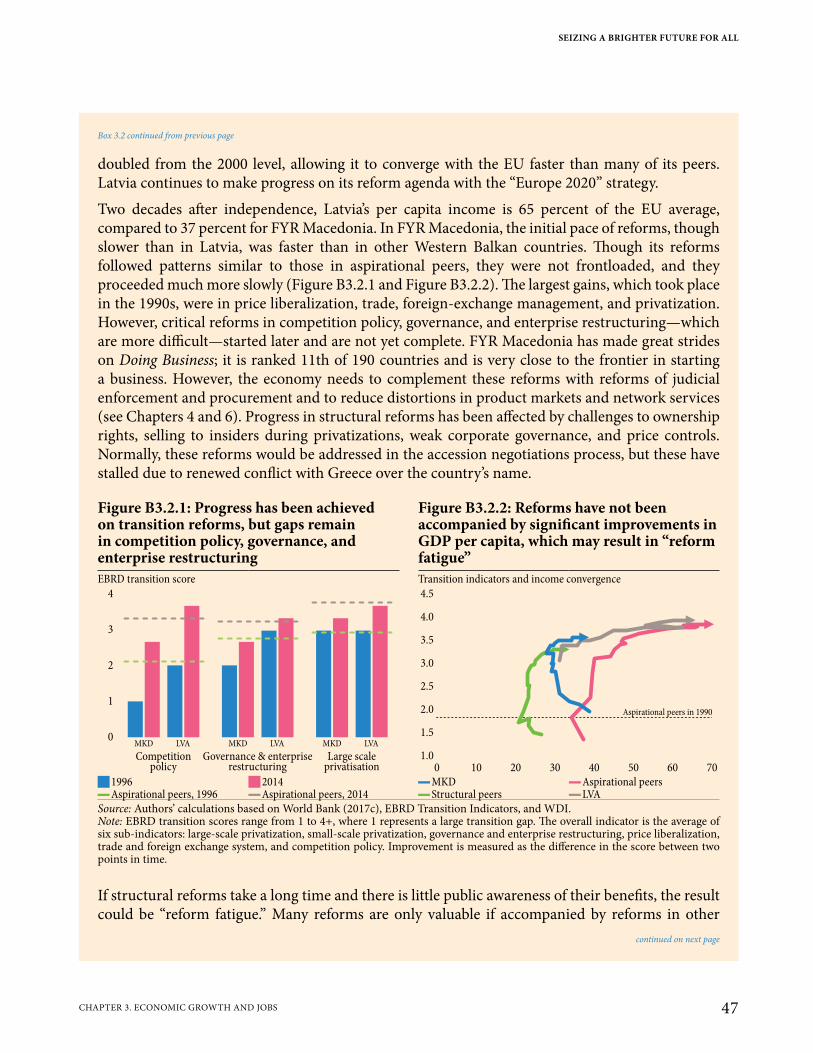
doubled from the 2000 level, allowing it to converge with the EU faster than many of its peers. Latvia continues to make progress on its reform agenda with the “Europe 2020” strategy.
Two decades after independence, Latvia’s per capita income is 65 percent of the EU average, compared to 37 percent for FYR Macedonia. In FYR Macedonia, the initial pace of reforms, though slower than in Latvia, was faster than in other Western Balkan countries. Though its reforms followed patterns similar to those in aspirational peers, they were not frontloaded, and they proceeded much more slowly (Figure B3.2.1 and Figure B3.2.2). The largest gains, which took place in the 1990s, were in price liberalization, trade, foreign-exchange management, and privatization. However, critical reforms in competition policy, governance, and enterprise restructuring—which are more difficult—started later and are not yet complete. FYR Macedonia has made great strides on Doing Business; it is ranked 11th of 190 countries and is very close to the frontier in starting a business. However, the economy needs to complement these reforms with reforms of judicial enforcement and procurement and to reduce distortions in product markets and network services (see Chapters 4 and 6). Progress in structural reforms has been affected by challenges to ownership rights, selling to insiders during privatizations, weak corporate governance, and price controls. Normally, these reforms would be addressed in the accession negotiations process, but these have stalled due to renewed conflict with Greece over the country’s name.
If structural reforms take a long time and there is little public awareness of their benefits, the result could be “reform fatigue.” Many reforms are only valuable if accompanied by reforms in other
Figure B3.2.1: Progress has been achieved on transition reforms, but gaps remain in competition policy, governance, and enterprise restructuring
Figure B3.2.2: Reforms have not been accompanied by significant improvements in GDP per capita, which may result in “reform fatigue”
EBRD transition score Transition indicators and income convergence4
3
2
1
0MKD LVA
Competitionpolicy
MKD MKDLVA LVA
Governance & enterpriserestructuring
Large scaleprivatisation
4.5
4.0
3.5
3.0
2.5
2.0
1.5
1.00 10 20 30 40 50 60 70
Aspirational peers in 1990
J1996 J2014 ▬MKD ▬Aspirational peers ▬Aspirational peers, 1996 ▬Aspirational peers, 2014 ▬Structural peers ▬LVA
Source: Authors’ calculations based on World Bank (2017c), EBRD Transition Indicators, and WDI.Note: EBRD transition scores range from 1 to 4+, where 1 represents a large transition gap. The overall indicator is the average of six sub-indicators: large-scale privatization, small-scale privatization, governance and enterprise restructuring, price liberalization, trade and foreign exchange system, and competition policy. Improvement is measured as the difference in the score between two points in time.
continued on next page
Box 3.2 continued from previous page
SEIZING A BRIGHTER FUTURE FOR ALL
47CHAPTER 3. ECONOMIC GROWTH AND JOBS
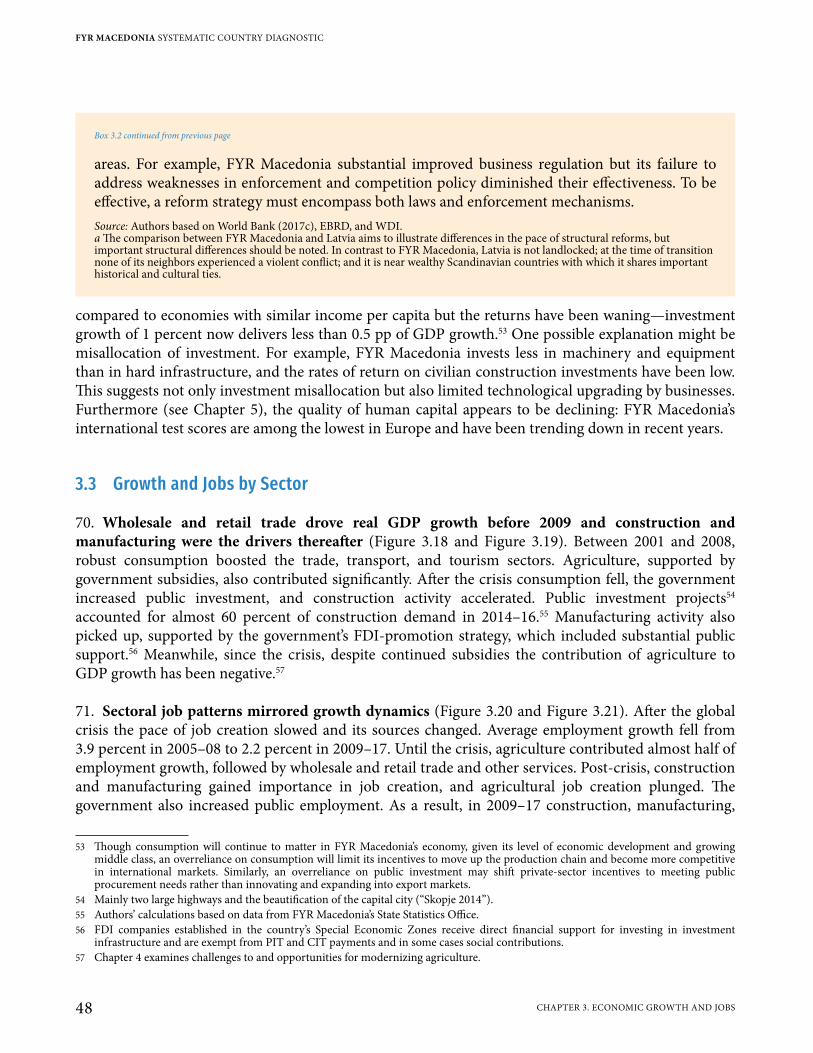
compared to economies with similar income per capita but the returns have been waning—investment growth of 1 percent now delivers less than 0.5 pp of GDP growth.53 One possible explanation might be misallocation of investment. For example, FYR Macedonia invests less in machinery and equipment than in hard infrastructure, and the rates of return on civilian construction investments have been low. This suggests not only investment misallocation but also limited technological upgrading by businesses. Furthermore (see Chapter 5), the quality of human capital appears to be declining: FYR Macedonia’s international test scores are among the lowest in Europe and have been trending down in recent years.
3.3 Growth and Jobs by Sector
70. Wholesale and retail trade drove real GDP growth before 2009 and construction and manufacturing were the drivers thereafter (Figure 3.18 and Figure 3.19). Between 2001 and 2008, robust consumption boosted the trade, transport, and tourism sectors. Agriculture, supported by government subsidies, also contributed significantly. After the crisis consumption fell, the government increased public investment, and construction activity accelerated. Public investment projects54 accounted for almost 60 percent of construction demand in 2014–16.55 Manufacturing activity also picked up, supported by the government’s FDI-promotion strategy, which included substantial public support.56 Meanwhile, since the crisis, despite continued subsidies the contribution of agriculture to GDP growth has been negative.57
71. Sectoral job patterns mirrored growth dynamics (Figure 3.20 and Figure 3.21). After the global crisis the pace of job creation slowed and its sources changed. Average employment growth fell from 3.9 percent in 2005–08 to 2.2 percent in 2009–17. Until the crisis, agriculture contributed almost half of employment growth, followed by wholesale and retail trade and other services. Post-crisis, construction and manufacturing gained importance in job creation, and agricultural job creation plunged. The government also increased public employment. As a result, in 2009–17 construction, manufacturing,
53 Though consumption will continue to matter in FYR Macedonia’s economy, given its level of economic development and growing middle class, an overreliance on consumption will limit its incentives to move up the production chain and become more competitive in international markets. Similarly, an overreliance on public investment may shift private-sector incentives to meeting public procurement needs rather than innovating and expanding into export markets.
54 Mainly two large highways and the beautification of the capital city (“Skopje 2014”).55 Authors’ calculations based on data from FYR Macedonia’s State Statistics Office.56 FDI companies established in the country’s Special Economic Zones receive direct financial support for investing in investment
infrastructure and are exempt from PIT and CIT payments and in some cases social contributions.57 Chapter 4 examines challenges to and opportunities for modernizing agriculture.
areas. For example, FYR Macedonia substantial improved business regulation but its failure to address weaknesses in enforcement and competition policy diminished their effectiveness. To be effective, a reform strategy must encompass both laws and enforcement mechanisms.Source: Authors based on World Bank (2017c), EBRD, and WDI.a The comparison between FYR Macedonia and Latvia aims to illustrate differences in the pace of structural reforms, but important structural differences should be noted. In contrast to FYR Macedonia, Latvia is not landlocked; at the time of transition none of its neighbors experienced a violent conflict; and it is near wealthy Scandinavian countries with which it shares important historical and cultural ties.
Box 3.2 continued from previous page
FYR MACEDONIA SYSTEMATIC COUNTRY DIAGNOSTIC
48 CHAPTER 3. ECONOMIC GROWTH AND JOBS
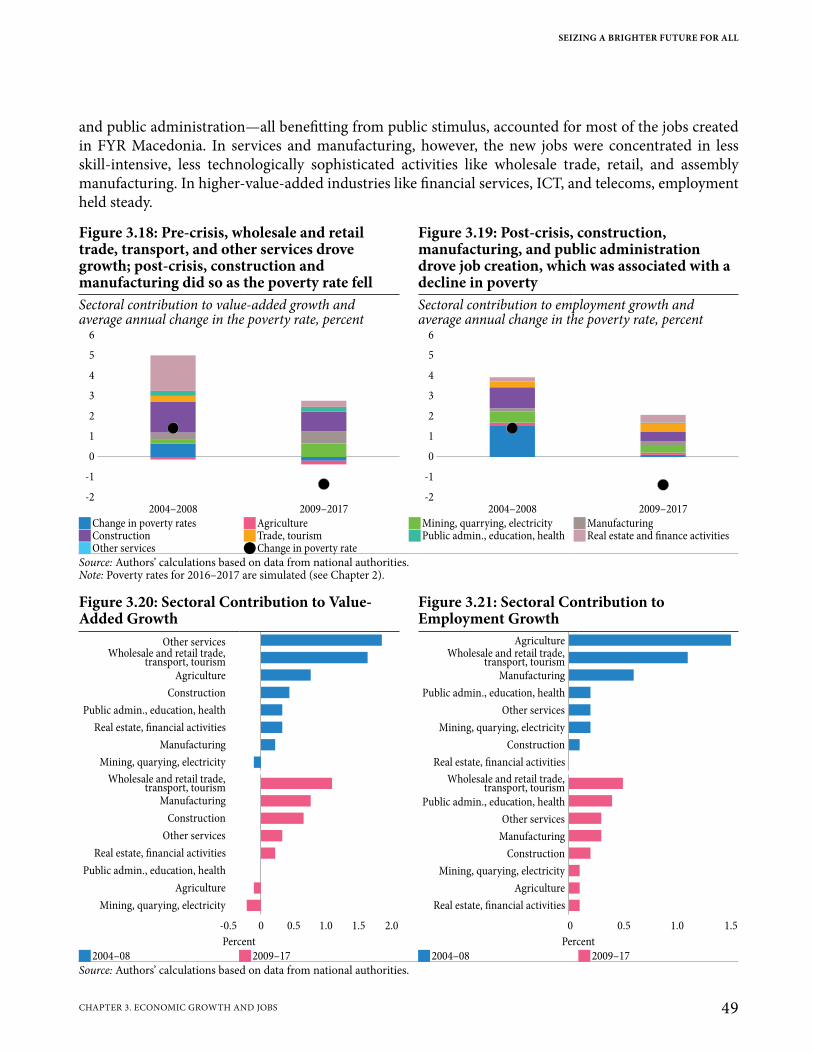
and public administration—all benefitting from public stimulus, accounted for most of the jobs created in FYR Macedonia. In services and manufacturing, however, the new jobs were concentrated in less skill-intensive, less technologically sophisticated activities like wholesale trade, retail, and assembly manufacturing. In higher-value-added industries like financial services, ICT, and telecoms, employment held steady.
Figure 3.18: Pre-crisis, wholesale and retail trade, transport, and other services drove growth; post-crisis, construction and manufacturing did so as the poverty rate fell
Figure 3.19: Post-crisis, construction, manufacturing, and public administration drove job creation, which was associated with a decline in poverty
Sectoral contribution to value-added growth and average annual change in the poverty rate, percent
Sectoral contribution to employment growth and average annual change in the poverty rate, percent
6
5
4
3
2
1
0
-1
-2
2004–2008 2009–2017
5
4
3
2
1
0
-1
-2
2004–2008 2009–2017
6
JChange in poverty rates JAgriculture JMining, quarrying, electricity JManufacturing JConstruction JTrade, tourism JPublic admin., education, health JReal estate and finance activities JOther services QChange in poverty rate
Source: Authors’ calculations based on data from national authorities.Note: Poverty rates for 2016–2017 are simulated (see Chapter 2).
Figure 3.20: Sectoral Contribution to Value-Added Growth
Figure 3.21: Sectoral Contribution to Employment Growth
-0.5 0 0.5 1.0 1.5 2.0
Mining, quarying, electricity
Agriculture
Public admin., education, health
Real estate, financial activities
Other services
Construction
Manufacturing
Wholesale and retail trade,transport, tourism
Other services
Mining, quarying, electricity
Wholesale and retail trade,transport, tourism
Agriculture
Construction
Public admin., education, health
Real estate, financial activities
Manufacturing
0 0.5 1.0 1.5
Other services
Mining, quarying, electricity
Wholesale and retail trade,transport, tourism
Agriculture
Construction
Public admin., education, health
Real estate, financial activities
Manufacturing
Wholesale and retail trade,transport, tourism
Public admin., education, health
Other services
Manufacturing
Construction
Mining, quarying, electricity
Agriculture
Real estate, financial activities
Percent Percent J2004–08 J2009–17 J2004–08 J2009–17
Source: Authors’ calculations based on data from national authorities.
SEIZING A BRIGHTER FUTURE FOR ALL
49CHAPTER 3. ECONOMIC GROWTH AND JOBS
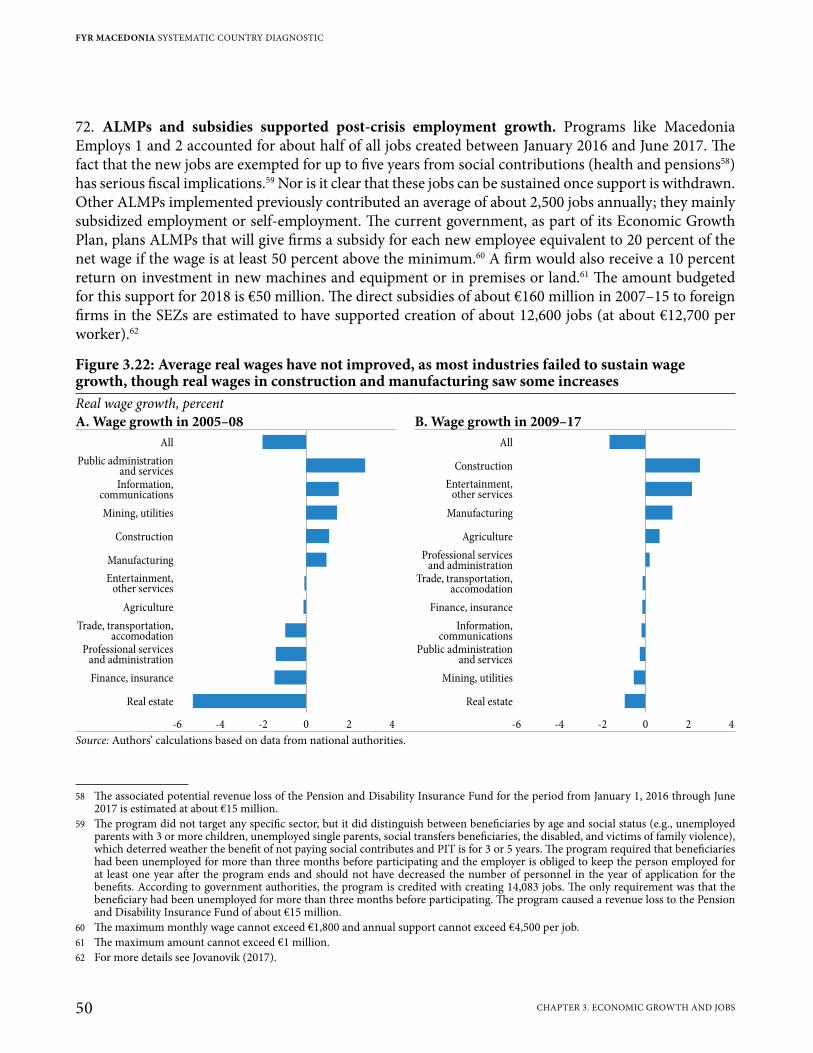
72. ALMPs and subsidies supported post-crisis employment growth. Programs like Macedonia Employs 1 and 2 accounted for about half of all jobs created between January 2016 and June 2017. The fact that the new jobs are exempted for up to five years from social contributions (health and pensions58) has serious fiscal implications.59 Nor is it clear that these jobs can be sustained once support is withdrawn. Other ALMPs implemented previously contributed an average of about 2,500 jobs annually; they mainly subsidized employment or self-employment. The current government, as part of its Economic Growth Plan, plans ALMPs that will give firms a subsidy for each new employee equivalent to 20 percent of the net wage if the wage is at least 50 percent above the minimum.60 A firm would also receive a 10 percent return on investment in new machines and equipment or in premises or land.61 The amount budgeted for this support for 2018 is €50 million. The direct subsidies of about €160 million in 2007–15 to foreign firms in the SEZs are estimated to have supported creation of about 12,600 jobs (at about €12,700 per worker).62
58 The associated potential revenue loss of the Pension and Disability Insurance Fund for the period from January 1, 2016 through June 2017 is estimated at about €15 million.
59 The program did not target any specific sector, but it did distinguish between beneficiaries by age and social status (e.g., unemployed parents with 3 or more children, unemployed single parents, social transfers beneficiaries, the disabled, and victims of family violence), which deterred weather the benefit of not paying social contributes and PIT is for 3 or 5 years. The program required that beneficiaries had been unemployed for more than three months before participating and the employer is obliged to keep the person employed for at least one year after the program ends and should not have decreased the number of personnel in the year of application for the benefits. According to government authorities, the program is credited with creating 14,083 jobs. The only requirement was that the beneficiary had been unemployed for more than three months before participating. The program caused a revenue loss to the Pension and Disability Insurance Fund of about €15 million.
60 The maximum monthly wage cannot exceed €1,800 and annual support cannot exceed €4,500 per job.61 The maximum amount cannot exceed €1 million.62 For more details see Jovanovik (2017).
Figure 3.22: Average real wages have not improved, as most industries failed to sustain wage growth, though real wages in construction and manufacturing saw some increasesReal wage growth, percentA. Wage growth in 2005–08 B. Wage growth in 2009–17
All
Public administrationand servicesInformation,
communications
Mining, utilities
Construction
Manufacturing
Entertainment,other services
Agriculture
Trade, transportation,accomodation
Professional servicesand administration
Finance, insurance
Real estate
-6 -4 -2 0 2 4
All
Public administrationand services
Information,communications
Mining, utilities
Construction
Manufacturing
Entertainment,other services
Agriculture
Trade, transportation,accomodation
Professional servicesand administration
Finance, insurance
Real estate
-6 -4 -2 0 2 4
Source: Authors’ calculations based on data from national authorities.
FYR MACEDONIA SYSTEMATIC COUNTRY DIAGNOSTIC
50 CHAPTER 3. ECONOMIC GROWTH AND JOBS
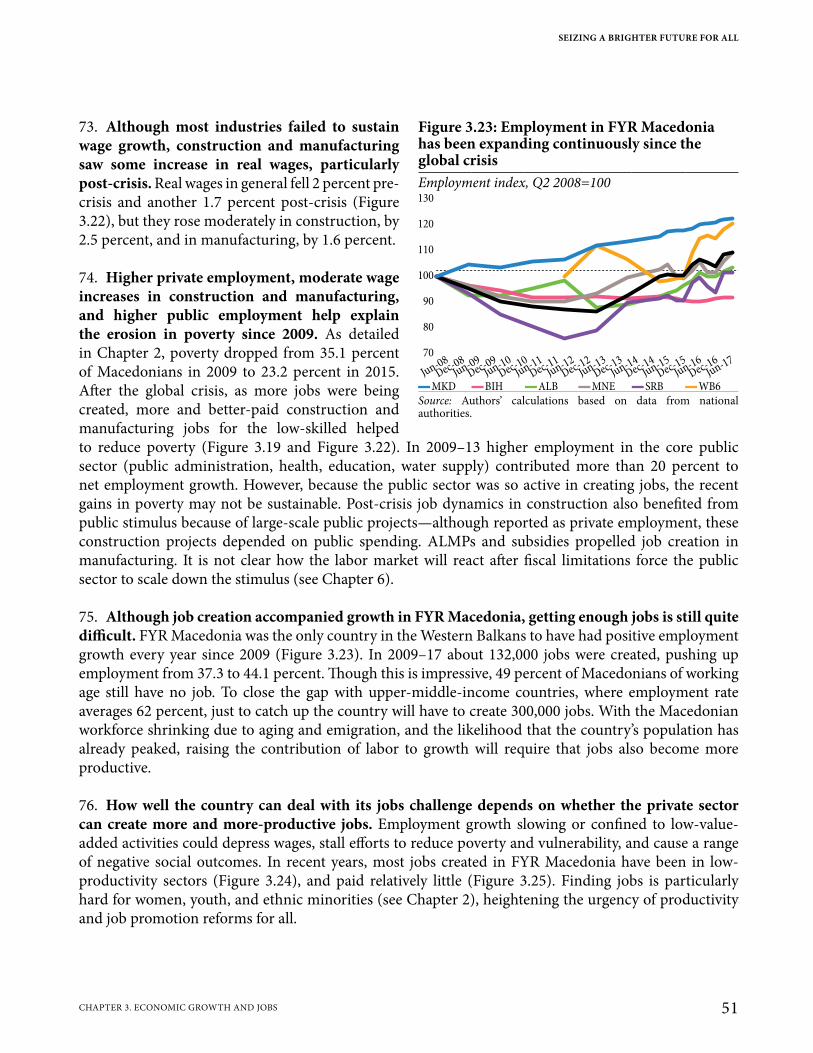
73. Although most industries failed to sustain wage growth, construction and manufacturing saw some increase in real wages, particularly post-crisis. Real wages in general fell 2 percent pre-crisis and another 1.7 percent post-crisis (Figure 3.22), but they rose moderately in construction, by 2.5 percent, and in manufacturing, by 1.6 percent.
74. Higher private employment, moderate wage increases in construction and manufacturing, and higher public employment help explain the erosion in poverty since 2009. As detailed in Chapter 2, poverty dropped from 35.1 percent of Macedonians in 2009 to 23.2 percent in 2015. After the global crisis, as more jobs were being created, more and better-paid construction and manufacturing jobs for the low-skilled helped to reduce poverty (Figure 3.19 and Figure 3.22). In 2009–13 higher employment in the core public sector (public administration, health, education, water supply) contributed more than 20 percent to net employment growth. However, because the public sector was so active in creating jobs, the recent gains in poverty may not be sustainable. Post-crisis job dynamics in construction also benefited from public stimulus because of large-scale public projects—although reported as private employment, these construction projects depended on public spending. ALMPs and subsidies propelled job creation in manufacturing. It is not clear how the labor market will react after fiscal limitations force the public sector to scale down the stimulus (see Chapter 6).
75. Although job creation accompanied growth in FYR Macedonia, getting enough jobs is still quite difficult. FYR Macedonia was the only country in the Western Balkans to have had positive employment growth every year since 2009 (Figure 3.23). In 2009–17 about 132,000 jobs were created, pushing up employment from 37.3 to 44.1 percent. Though this is impressive, 49 percent of Macedonians of working age still have no job. To close the gap with upper-middle-income countries, where employment rate averages 62 percent, just to catch up the country will have to create 300,000 jobs. With the Macedonian workforce shrinking due to aging and emigration, and the likelihood that the country’s population has already peaked, raising the contribution of labor to growth will require that jobs also become more productive.
76. How well the country can deal with its jobs challenge depends on whether the private sector can create more and more-productive jobs. Employment growth slowing or confined to low-value-added activities could depress wages, stall efforts to reduce poverty and vulnerability, and cause a range of negative social outcomes. In recent years, most jobs created in FYR Macedonia have been in low-productivity sectors (Figure 3.24), and paid relatively little (Figure 3.25). Finding jobs is particularly hard for women, youth, and ethnic minorities (see Chapter 2), heightening the urgency of productivity and job promotion reforms for all.
Figure 3.23: Employment in FYR Macedonia has been expanding continuously since the global crisisEmployment index, Q2 2008=100130
120
110
100
90
80
70
Jun-0
8
Dec-08
Jun-0
9
Jun-1
0
Jun-1
1
Jun-1
2
Jun-1
3
Jun-1
4
Jun-1
5
Jun-1
6
Jun-1
7
Dec-09
Dec-10
Dec-11
Dec-12
Dec-13
Dec-14
Dec-15
Dec-16
▬MKD ▬BIH ▬ALB ▬MNE ▬SRB ▬WB6Source: Authors’ calculations based on data from national authorities.
SEIZING A BRIGHTER FUTURE FOR ALL
51CHAPTER 3. ECONOMIC GROWTH AND JOBS
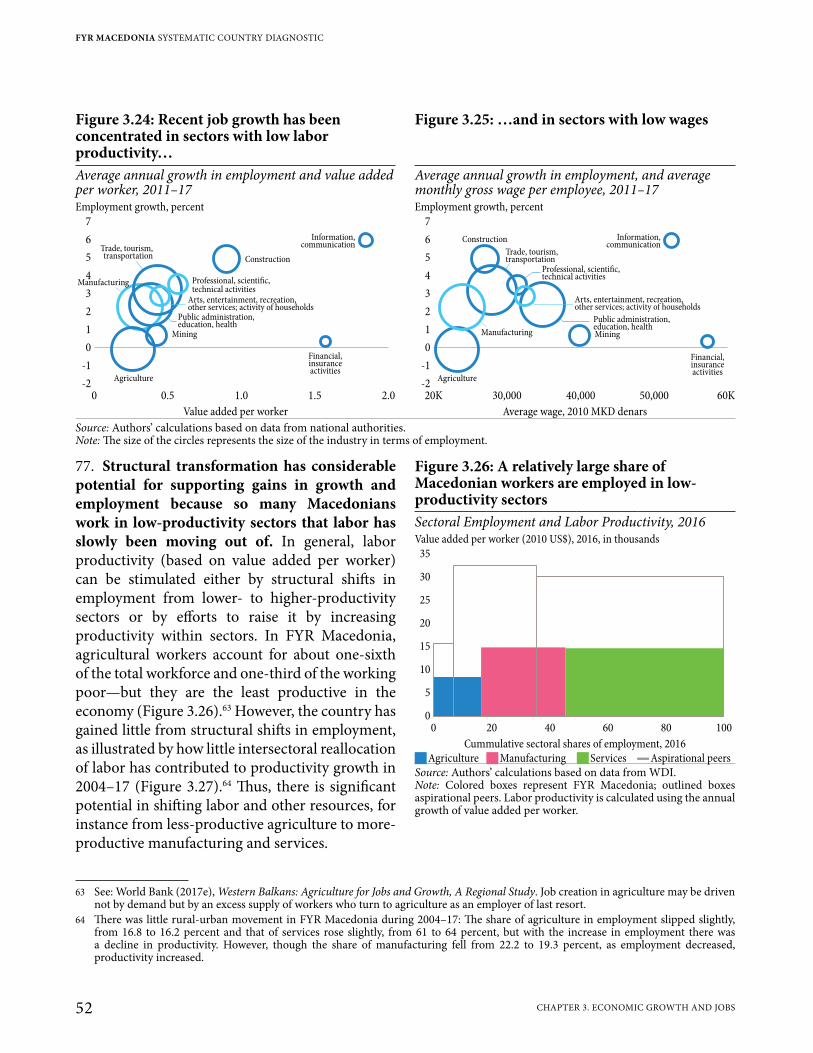
77. Structural transformation has considerable potential for supporting gains in growth and employment because so many Macedonians work in low-productivity sectors that labor has slowly been moving out of. In general, labor productivity (based on value added per worker) can be stimulated either by structural shifts in employment from lower- to higher-productivity sectors or by efforts to raise it by increasing productivity within sectors. In FYR Macedonia, agricultural workers account for about one-sixth of the total workforce and one-third of the working poor—but they are the least productive in the economy (Figure 3.26).63 However, the country has gained little from structural shifts in employment, as illustrated by how little intersectoral reallocation of labor has contributed to productivity growth in 2004–17 (Figure 3.27).64 Thus, there is significant potential in shifting labor and other resources, for instance from less-productive agriculture to more-productive manufacturing and services.
63 See: World Bank (2017e), Western Balkans: Agriculture for Jobs and Growth, A Regional Study. Job creation in agriculture may be driven not by demand but by an excess supply of workers who turn to agriculture as an employer of last resort.
64 There was little rural-urban movement in FYR Macedonia during 2004–17: The share of agriculture in employment slipped slightly, from 16.8 to 16.2 percent and that of services rose slightly, from 61 to 64 percent, but with the increase in employment there was a decline in productivity. However, though the share of manufacturing fell from 22.2 to 19.3 percent, as employment decreased, productivity increased.
Figure 3.26: A relatively large share of Macedonian workers are employed in low-productivity sectorsSectoral Employment and Labor Productivity, 2016Value added per worker (2010 US$), 2016, in thousands
30
25
20
15
10
5
0
0 20 40 60 80 100
35
Cummulative sectoral shares of employment, 2016 JAgriculture JManufacturing JServices ▬Aspirational peers
Source: Authors’ calculations based on data from WDI. Note: Colored boxes represent FYR Macedonia; outlined boxes aspirational peers. Labor productivity is calculated using the annual growth of value added per worker.
Figure 3.24: Recent job growth has been concentrated in sectors with low labor productivity…
Figure 3.25: …and in sectors with low wages
Average annual growth in employment and value added per worker, 2011–17
Average annual growth in employment, and average monthly gross wage per employee, 2011–17
Employment growth, percent Employment growth, percent7
6
5
4
3
2
1
0
-1
-20 0.5 1.0 1.5 2.0
Information,communication
Construction
Professional, scientific,technical activities
Trade, tourism,transportation
Public administration,education, health
Manufacturing
Arts, entertainment, recreation,other services; activity of households
Financial,insuranceactivities
Mining
Agriculture
7
6
5
4
3
2
1
0
-1
-220K 30,000 40,000 50,000 60K
Information,communication
Construction
Financial,insuranceactivities
Mining
Agriculture
Professional, scientific,technical activities
Arts, entertainment, recreation,other services; activity of households
Manufacturing
Public administration,education, health
Trade, tourism,transportation
Value added per worker Average wage, 2010 MKD denarsSource: Authors’ calculations based on data from national authorities. Note: The size of the circles represents the size of the industry in terms of employment.
FYR MACEDONIA SYSTEMATIC COUNTRY DIAGNOSTIC
52 CHAPTER 3. ECONOMIC GROWTH AND JOBS
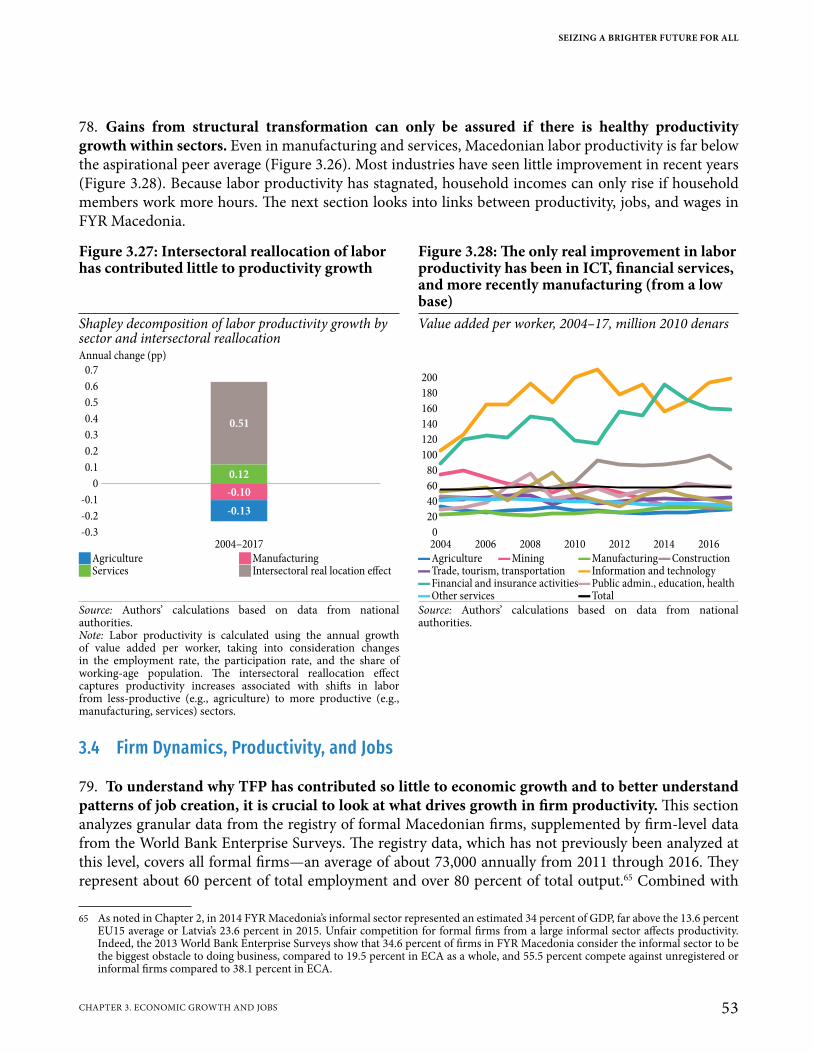
78. Gains from structural transformation can only be assured if there is healthy productivity growth within sectors. Even in manufacturing and services, Macedonian labor productivity is far below the aspirational peer average (Figure 3.26). Most industries have seen little improvement in recent years (Figure 3.28). Because labor productivity has stagnated, household incomes can only rise if household members work more hours. The next section looks into links between productivity, jobs, and wages in FYR Macedonia.
3.4 Firm Dynamics, Productivity, and Jobs
79. To understand why TFP has contributed so little to economic growth and to better understand patterns of job creation, it is crucial to look at what drives growth in firm productivity. This section analyzes granular data from the registry of formal Macedonian firms, supplemented by firm-level data from the World Bank Enterprise Surveys. The registry data, which has not previously been analyzed at this level, covers all formal firms—an average of about 73,000 annually from 2011 through 2016. They represent about 60 percent of total employment and over 80 percent of total output.65 Combined with
65 As noted in Chapter 2, in 2014 FYR Macedonia’s informal sector represented an estimated 34 percent of GDP, far above the 13.6 percent EU15 average or Latvia’s 23.6 percent in 2015. Unfair competition for formal firms from a large informal sector affects productivity. Indeed, the 2013 World Bank Enterprise Surveys show that 34.6 percent of firms in FYR Macedonia consider the informal sector to be the biggest obstacle to doing business, compared to 19.5 percent in ECA as a whole, and 55.5 percent compete against unregistered or informal firms compared to 38.1 percent in ECA.
Figure 3.27: Intersectoral reallocation of labor has contributed little to productivity growth
Figure 3.28: The only real improvement in labor productivity has been in ICT, financial services, and more recently manufacturing (from a low base)
Shapley decomposition of labor productivity growth by sector and intersectoral reallocation
Value added per worker, 2004–17, million 2010 denars
Annual change (pp)
-0.13
-0.10
0.12
0.51
2004–2017
0.7
0.6
0.5
0.4
0.3
0.2
0.1
0
-0.1
-0.3
-0.2
200
180
160
140
120
100
80
60
40
20
0
2004 2006 2008 2010 20142012 2016
JAgriculture JManufacturing ▬Agriculture ▬Mining ▬Manufacturing ▬Construction JServices J Intersectoral real location effect ▬Trade, tourism, transportation ▬ Information and technology
▬Financial and insurance activities ▬Public admin., education, health ▬Other services ▬Total
Source: Authors’ calculations based on data from national authorities.Note: Labor productivity is calculated using the annual growth of value added per worker, taking into consideration changes in the employment rate, the participation rate, and the share of working-age population. The intersectoral reallocation effect captures productivity increases associated with shifts in labor from less-productive (e.g., agriculture) to more productive (e.g., manufacturing, services) sectors.
Source: Authors’ calculations based on data from national authorities.
SEIZING A BRIGHTER FUTURE FOR ALL
53CHAPTER 3. ECONOMIC GROWTH AND JOBS
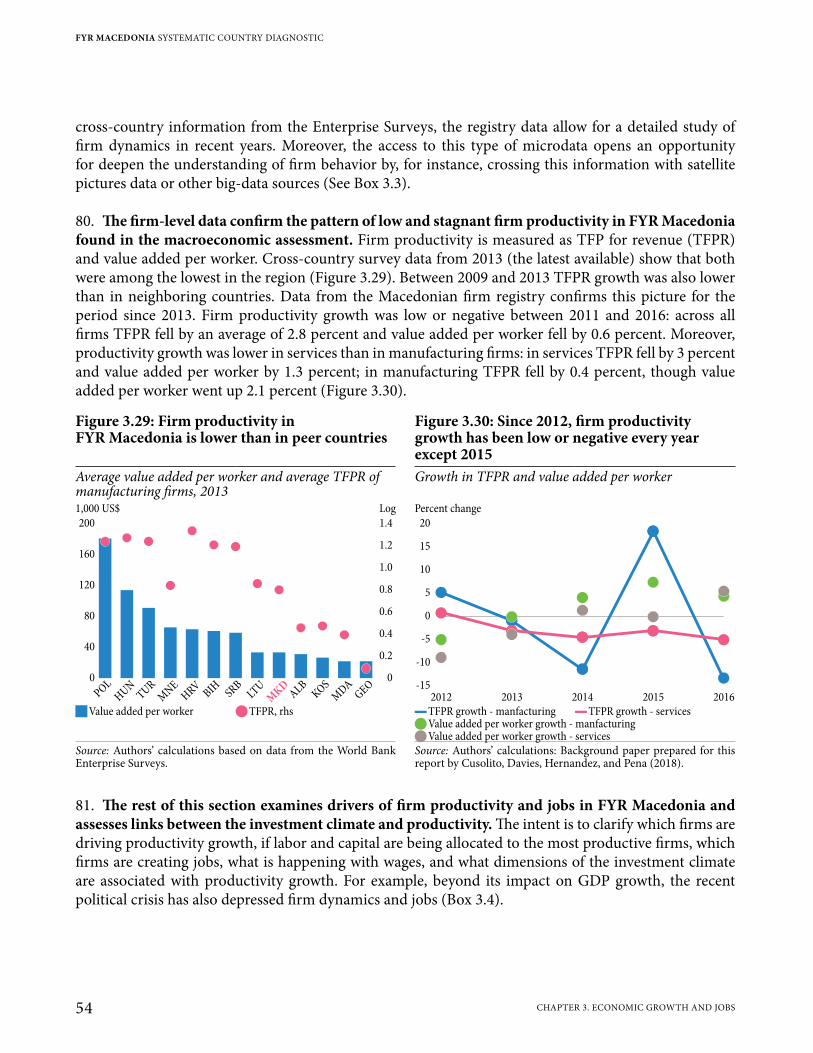
cross-country information from the Enterprise Surveys, the registry data allow for a detailed study of firm dynamics in recent years. Moreover, the access to this type of microdata opens an opportunity for deepen the understanding of firm behavior by, for instance, crossing this information with satellite pictures data or other big-data sources (See Box 3.3).
80. The firm-level data confirm the pattern of low and stagnant firm productivity in FYR Macedonia found in the macroeconomic assessment. Firm productivity is measured as TFP for revenue (TFPR) and value added per worker. Cross-country survey data from 2013 (the latest available) show that both were among the lowest in the region (Figure 3.29). Between 2009 and 2013 TFPR growth was also lower than in neighboring countries. Data from the Macedonian firm registry confirms this picture for the period since 2013. Firm productivity growth was low or negative between 2011 and 2016: across all firms TFPR fell by an average of 2.8 percent and value added per worker fell by 0.6 percent. Moreover, productivity growth was lower in services than in manufacturing firms: in services TFPR fell by 3 percent and value added per worker by 1.3 percent; in manufacturing TFPR fell by 0.4 percent, though value added per worker went up 2.1 percent (Figure 3.30).
81. The rest of this section examines drivers of firm productivity and jobs in FYR Macedonia and assesses links between the investment climate and productivity. The intent is to clarify which firms are driving productivity growth, if labor and capital are being allocated to the most productive firms, which firms are creating jobs, what is happening with wages, and what dimensions of the investment climate are associated with productivity growth. For example, beyond its impact on GDP growth, the recent political crisis has also depressed firm dynamics and jobs (Box 3.4).
Figure 3.29: Firm productivity in FYR Macedonia is lower than in peer countries
Figure 3.30: Since 2012, firm productivity growth has been low or negative every year except 2015
Average value added per worker and average TFPR of manufacturing firms, 2013
Growth in TFPR and value added per worker
1,000 US$ Log Percent change1.4
1.2
1.0
0.8
0.6
0.4
0.2
0
200
160
120
80
40
0
HUNTUR
MNE
HRVBIH SR
BLT
UM
KD
ALBKOS
MDA
GEOPOL
2012 2013 2014 2015 2016
20
15
10
5
0
-5
-10
-15
JValue added per worker QTFPR, rhs ▬TFPR growth - manfacturing ▬TFPR growth - services QValue added per worker growth - manfacturing QValue added per worker growth - services
Source: Authors’ calculations based on data from the World Bank Enterprise Surveys.
Source: Authors’ calculations: Background paper prepared for this report by Cusolito, Davies, Hernandez, and Pena (2018).
FYR MACEDONIA SYSTEMATIC COUNTRY DIAGNOSTIC
54 CHAPTER 3. ECONOMIC GROWTH AND JOBS
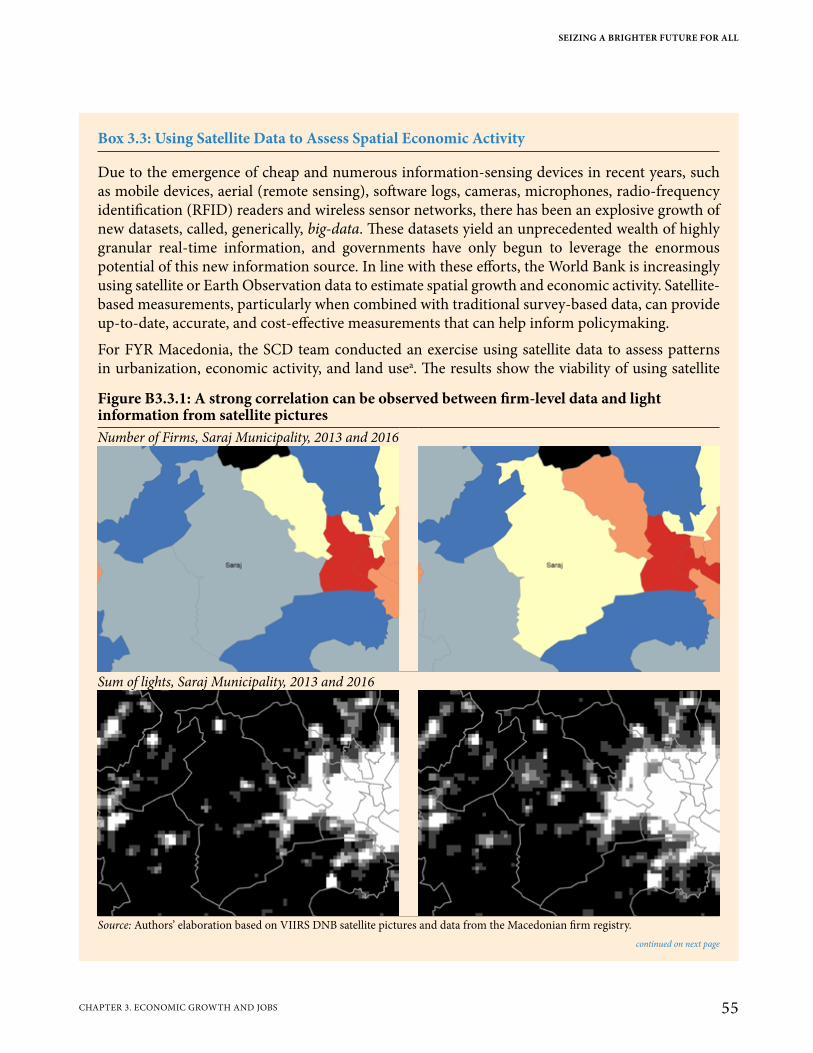
Box 3.3: Using Satellite Data to Assess Spatial Economic Activity
Due to the emergence of cheap and numerous information-sensing devices in recent years, such as mobile devices, aerial (remote sensing), software logs, cameras, microphones, radio-frequency identification (RFID) readers and wireless sensor networks, there has been an explosive growth of new datasets, called, generically, big-data. These datasets yield an unprecedented wealth of highly granular real-time information, and governments have only begun to leverage the enormous potential of this new information source. In line with these efforts, the World Bank is increasingly using satellite or Earth Observation data to estimate spatial growth and economic activity. Satellite-based measurements, particularly when combined with traditional survey-based data, can provide up-to-date, accurate, and cost-effective measurements that can help inform policymaking.
For FYR Macedonia, the SCD team conducted an exercise using satellite data to assess patterns in urbanization, economic activity, and land usea. The results show the viability of using satellite
continued on next page
Figure B3.3.1: A strong correlation can be observed between firm-level data and light information from satellite picturesNumber of Firms, Saraj Municipality, 2013 and 2016
Sum of lights, Saraj Municipality, 2013 and 2016
Source: Authors’ elaboration based on VIIRS DNB satellite pictures and data from the Macedonian firm registry.
SEIZING A BRIGHTER FUTURE FOR ALL
55CHAPTER 3. ECONOMIC GROWTH AND JOBS
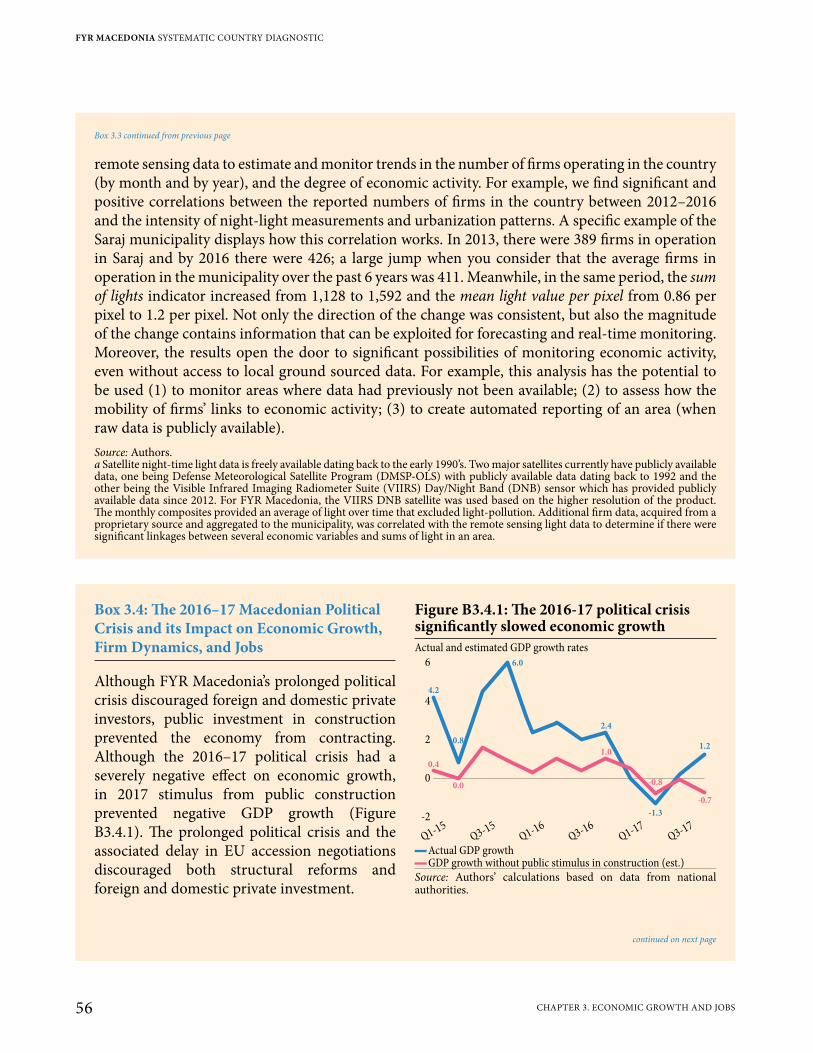
remote sensing data to estimate and monitor trends in the number of firms operating in the country (by month and by year), and the degree of economic activity. For example, we find significant and positive correlations between the reported numbers of firms in the country between 2012–2016 and the intensity of night-light measurements and urbanization patterns. A specific example of the Saraj municipality displays how this correlation works. In 2013, there were 389 firms in operation in Saraj and by 2016 there were 426; a large jump when you consider that the average firms in operation in the municipality over the past 6 years was 411. Meanwhile, in the same period, the sum of lights indicator increased from 1,128 to 1,592 and the mean light value per pixel from 0.86 per pixel to 1.2 per pixel. Not only the direction of the change was consistent, but also the magnitude of the change contains information that can be exploited for forecasting and real-time monitoring. Moreover, the results open the door to significant possibilities of monitoring economic activity, even without access to local ground sourced data. For example, this analysis has the potential to be used (1) to monitor areas where data had previously not been available; (2) to assess how the mobility of firms’ links to economic activity; (3) to create automated reporting of an area (when raw data is publicly available).Source: Authors.a Satellite night-time light data is freely available dating back to the early 1990’s. Two major satellites currently have publicly available data, one being Defense Meteorological Satellite Program (DMSP-OLS) with publicly available data dating back to 1992 and the other being the Visible Infrared Imaging Radiometer Suite (VIIRS) Day/Night Band (DNB) sensor which has provided publicly available data since 2012. For FYR Macedonia, the VIIRS DNB satellite was used based on the higher resolution of the product. The monthly composites provided an average of light over time that excluded light-pollution. Additional firm data, acquired from a proprietary source and aggregated to the municipality, was correlated with the remote sensing light data to determine if there were significant linkages between several economic variables and sums of light in an area.
Box 3.3 continued from previous page
Box 3.4: The 2016–17 Macedonian Political Crisis and its Impact on Economic Growth, Firm Dynamics, and Jobs
Although FYR Macedonia’s prolonged political crisis discouraged foreign and domestic private investors, public investment in construction prevented the economy from contracting. Although the 2016–17 political crisis had a severely negative effect on economic growth, in 2017 stimulus from public construction prevented negative GDP growth (Figure B3.4.1). The prolonged political crisis and the associated delay in EU accession negotiations discouraged both structural reforms and foreign and domestic private investment.
Figure B3.4.1: The 2016-17 political crisis significantly slowed economic growthActual and estimated GDP growth rates
6
4
2
0
-2
Q1-15
Q3-15
Q1-16
Q1-17
Q3-16
Q3-17
4.2
0.8
6.0
2.4
-1.3
1.2
0.4
0.0
1.0
-0.8
-0.7
▬Actual GDP growth ▬GDP growth without public stimulus in construction (est.)
Source: Authors’ calculations based on data from national authorities.
continued on next page
FYR MACEDONIA SYSTEMATIC COUNTRY DIAGNOSTIC
56 CHAPTER 3. ECONOMIC GROWTH AND JOBS

3.4.1 Inefficient Allocation of Resources Is Dragging on Productivity Growth
82. In FYR Macedonia, labor, capital, and other factors of production are not being allocated to the most efficient firms. As a result, the economy is not operating near its production possibility frontier, something that may point to structural and market anomalies that channel labor and capital to less-productive firms and activities. Firms can improve their productivity by innovating, adopting better technologies, and adopting better managerial practices (within-firm productivity growth). Productivity can also improve if labor and capital move from less-efficient to more-efficient firms (between-firm growth), which can happen if highly productive firms enter or less productive firms exit. The declining rate of return on capital discussed earlier suggests high opportunity costs and misallocation of resources.
83. The wide dispersion of productivity among Macedonian firms suggests that productive factors are inefficiently allocated. While this dispersion can be explained by such factors as differences by industry in technology adoption, management capabilities, worker skills, product quality, and markups,
FYR Macedonia’s political crisis in 2016 depressed the performance of the private sector: a statistical test on firm exit rates shows that the rate of firms exiting in 2016 was significantly higher than in previous years (Figure B3.4.2). In 2016, 461 manufacturing firms and 5,457 services firms exited the market and, unlike previous years, more firms left than entered the market. Net job creation also fell significantly, below the 2014 level.
The political crisis may have especially discouraged FDI. A comparison of firms operating inside and outside the special economic zones (SEZs) found that only half as many jobs were created inside the SEZ in 2016 as in 2014. Notably, in 2016 no new firm was established in an SEZ (Figure B3.4.3).Figure B3.4.2: In 2016, more firms closed and net job creation fell
Figure B3.4.3: No new firms entered the SEZs in 2016 and net job creation by SEZ firms halved
Firm entry and exit, and net job creation, in thousands Firm entry and net job creation, SEZ vs. non-SEZ8 20
6 15
4 10
2 5
0 0
-4 -10
-2 -5
-6 -15
-8 -20
2012 2013 2014 2015 2016
15.0 10
12.5
10.0
7.5
5.0
8
4
2.5
6
2
0 0
2011 2013 2014 2015 20162012
JEntry JExit ▬Net job creation, rhs J Inside SEZ - entry, rhs ▬Outside SEZ - net job creation, in thousands ▬ Inside SEZ - net job creation, in thousands
Source: Authors’ calculations: Background paper prepared for this report by Cusolito, Davies, Hernandez, and Pena (2018).
Box 3.4 continued from previous page
SEIZING A BRIGHTER FUTURE FOR ALL
57CHAPTER 3. ECONOMIC GROWTH AND JOBS
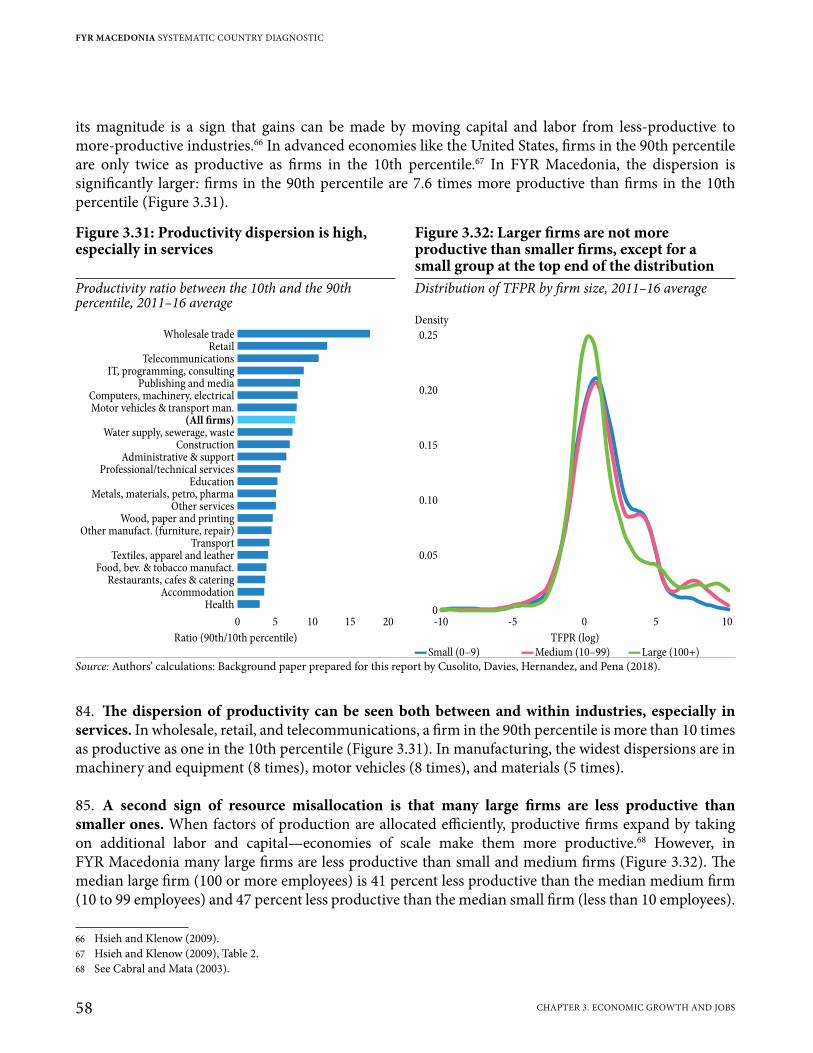
its magnitude is a sign that gains can be made by moving capital and labor from less-productive to more-productive industries.66 In advanced economies like the United States, firms in the 90th percentile are only twice as productive as firms in the 10th percentile.67 In FYR Macedonia, the dispersion is significantly larger: firms in the 90th percentile are 7.6 times more productive than firms in the 10th percentile (Figure 3.31).
84. The dispersion of productivity can be seen both between and within industries, especially in services. In wholesale, retail, and telecommunications, a firm in the 90th percentile is more than 10 times as productive as one in the 10th percentile (Figure 3.31). In manufacturing, the widest dispersions are in machinery and equipment (8 times), motor vehicles (8 times), and materials (5 times).
85. A second sign of resource misallocation is that many large firms are less productive than smaller ones. When factors of production are allocated efficiently, productive firms expand by taking on additional labor and capital—economies of scale make them more productive.68 However, in FYR Macedonia many large firms are less productive than small and medium firms (Figure 3.32). The median large firm (100 or more employees) is 41 percent less productive than the median medium firm (10 to 99 employees) and 47 percent less productive than the median small firm (less than 10 employees).
66 Hsieh and Klenow (2009).67 Hsieh and Klenow (2009), Table 2.68 See Cabral and Mata (2003).
Figure 3.31: Productivity dispersion is high, especially in services
Figure 3.32: Larger firms are not more productive than smaller firms, except for a small group at the top end of the distribution
Productivity ratio between the 10th and the 90th percentile, 2011–16 average
Distribution of TFPR by firm size, 2011–16 average
DensityWholesale trade
RetailTelecommunications
IT, programming, consultingPublishing and media
Computers, machinery, electricalMotor vehicles & transport man.
(All firms)Water supply, sewerage, waste
ConstructionAdministrative & support
Professional/technical servicesEducation
Metals, materials, petro, pharmaOther services
Wood, paper and printingOther manufact. (furniture, repair)
TransportTextiles, apparel and leather
Food, bev. & tobacco manufact.Restaurants, cafes & catering
AccommodationHealth
0 5 10 15 20
0.25
0.20
0.15
0.10
0.05
0
-10 -5 0 5 10
Ratio (90th/10th percentile) TFPR (log) ▬Small (0–9) ▬Medium (10–99) ▬Large (100+)
Source: Authors’ calculations: Background paper prepared for this report by Cusolito, Davies, Hernandez, and Pena (2018).
FYR MACEDONIA SYSTEMATIC COUNTRY DIAGNOSTIC
58 CHAPTER 3. ECONOMIC GROWTH AND JOBS
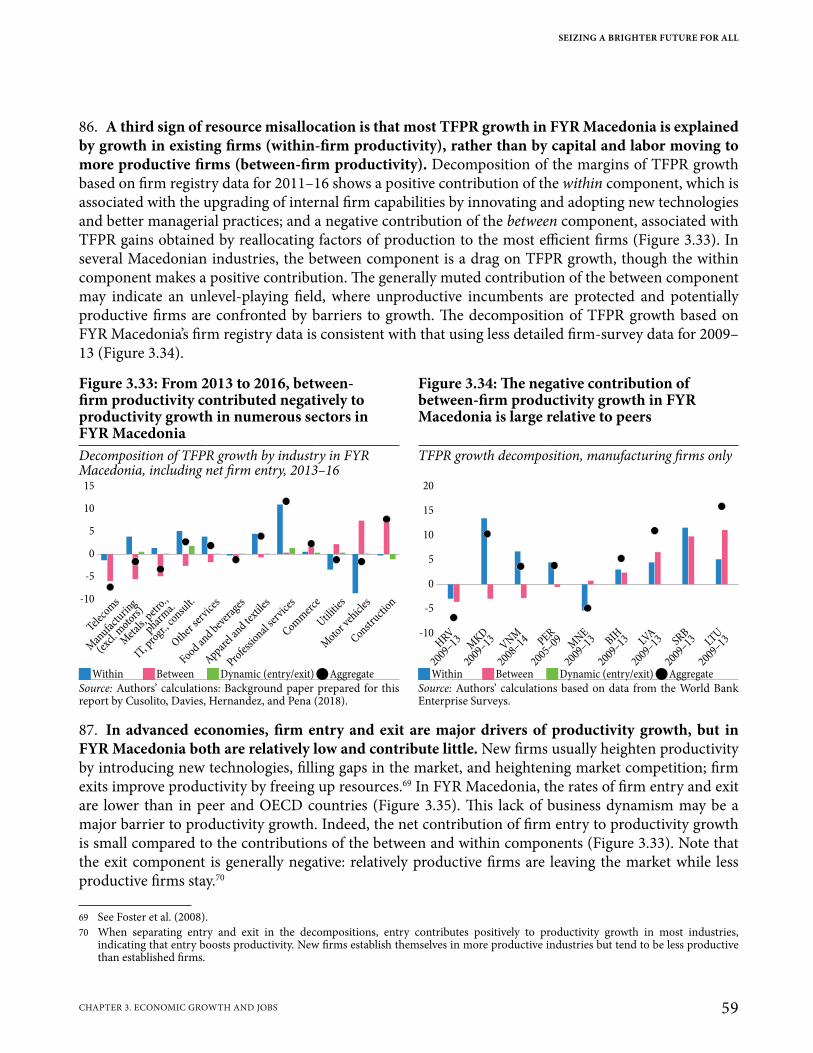
86. A third sign of resource misallocation is that most TFPR growth in FYR Macedonia is explained by growth in existing firms (within-firm productivity), rather than by capital and labor moving to more productive firms (between-firm productivity). Decomposition of the margins of TFPR growth based on firm registry data for 2011–16 shows a positive contribution of the within component, which is associated with the upgrading of internal firm capabilities by innovating and adopting new technologies and better managerial practices; and a negative contribution of the between component, associated with TFPR gains obtained by reallocating factors of production to the most efficient firms (Figure 3.33). In several Macedonian industries, the between component is a drag on TFPR growth, though the within component makes a positive contribution. The generally muted contribution of the between component may indicate an unlevel-playing field, where unproductive incumbents are protected and potentially productive firms are confronted by barriers to growth. The decomposition of TFPR growth based on FYR Macedonia’s firm registry data is consistent with that using less detailed firm-survey data for 2009–13 (Figure 3.34).
87. In advanced economies, firm entry and exit are major drivers of productivity growth, but in FYR Macedonia both are relatively low and contribute little. New firms usually heighten productivity by introducing new technologies, filling gaps in the market, and heightening market competition; firm exits improve productivity by freeing up resources.69 In FYR Macedonia, the rates of firm entry and exit are lower than in peer and OECD countries (Figure 3.35). This lack of business dynamism may be a major barrier to productivity growth. Indeed, the net contribution of firm entry to productivity growth is small compared to the contributions of the between and within components (Figure 3.33). Note that the exit component is generally negative: relatively productive firms are leaving the market while less productive firms stay.70
69 See Foster et al. (2008).70 When separating entry and exit in the decompositions, entry contributes positively to productivity growth in most industries,
indicating that entry boosts productivity. New firms establish themselves in more productive industries but tend to be less productive than established firms.
Figure 3.33: From 2013 to 2016, between-firm productivity contributed negatively to productivity growth in numerous sectors in FYR Macedonia
Figure 3.34: The negative contribution of between-firm productivity growth in FYR Macedonia is large relative to peers
Decomposition of TFPR growth by industry in FYR Macedonia, including net firm entry, 2013–16
TFPR growth decomposition, manufacturing firms only
15
10
5
0
-10
-5
Teleco
ms
Man
ufact
uring
(exc
l. moto
rs)
Met
als, p
etro
.,
pharm
a.
IT, p
rogr
., consu
lt.
Other
serv
ices
Food and b
ever
ages
Apparel
and te
xtiles
Profes
sional
serv
ices
Comm
erce
Moto
r veh
icles
Construct
ion
Utiliti
es
20
15
10
5
0
-10
-5
HRV
2009–13M
KD
2009–13VNM
2008–14 PER
2005–09M
NE
2009–13 BIH
2009–13 LVA
2009–13 SRB
2009–13 LTU
2009–13
JWithin JBetween JDynamic (entry/exit) QAggregate JWithin JBetween JDynamic (entry/exit) QAggregateSource: Authors’ calculations: Background paper prepared for this report by Cusolito, Davies, Hernandez, and Pena (2018).
Source: Authors’ calculations based on data from the World Bank Enterprise Surveys.
SEIZING A BRIGHTER FUTURE FOR ALL
59CHAPTER 3. ECONOMIC GROWTH AND JOBS
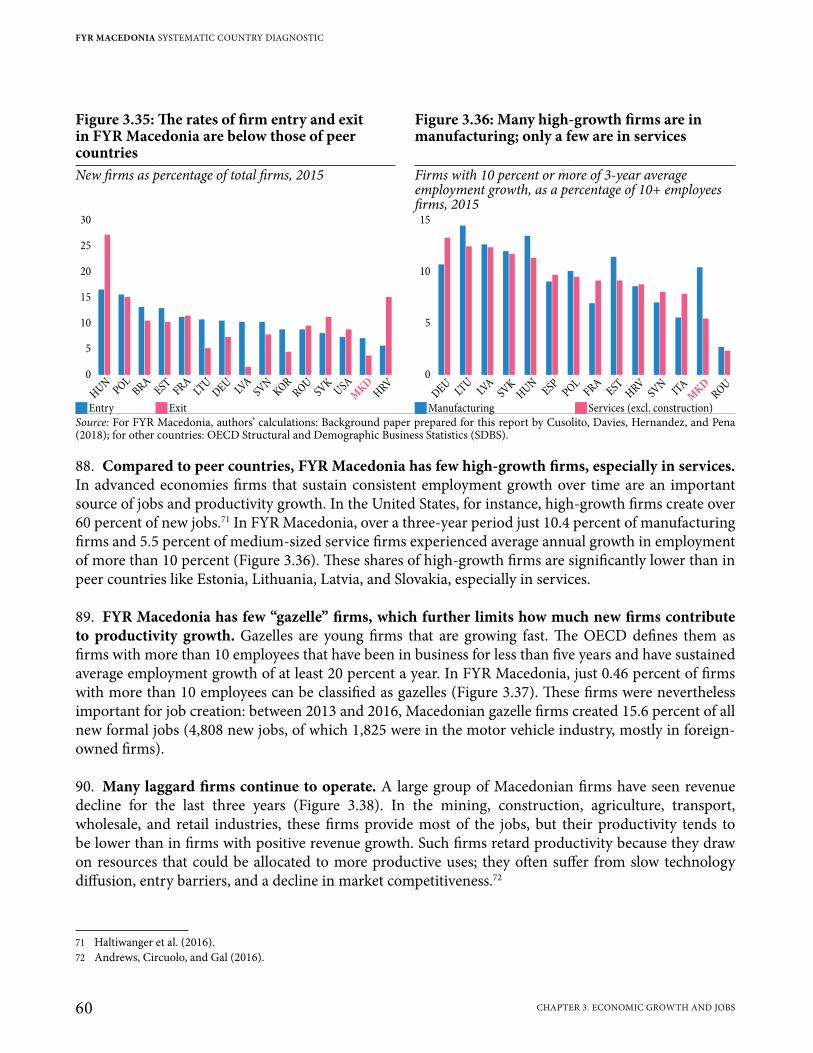
88. Compared to peer countries, FYR Macedonia has few high-growth firms, especially in services. In advanced economies firms that sustain consistent employment growth over time are an important source of jobs and productivity growth. In the United States, for instance, high-growth firms create over 60 percent of new jobs.71 In FYR Macedonia, over a three-year period just 10.4 percent of manufacturing firms and 5.5 percent of medium-sized service firms experienced average annual growth in employment of more than 10 percent (Figure 3.36). These shares of high-growth firms are significantly lower than in peer countries like Estonia, Lithuania, Latvia, and Slovakia, especially in services.
89. FYR Macedonia has few “gazelle” firms, which further limits how much new firms contribute to productivity growth. Gazelles are young firms that are growing fast. The OECD defines them as firms with more than 10 employees that have been in business for less than five years and have sustained average employment growth of at least 20 percent a year. In FYR Macedonia, just 0.46 percent of firms with more than 10 employees can be classified as gazelles (Figure 3.37). These firms were nevertheless important for job creation: between 2013 and 2016, Macedonian gazelle firms created 15.6 percent of all new formal jobs (4,808 new jobs, of which 1,825 were in the motor vehicle industry, mostly in foreign-owned firms).
90. Many laggard firms continue to operate. A large group of Macedonian firms have seen revenue decline for the last three years (Figure 3.38). In the mining, construction, agriculture, transport, wholesale, and retail industries, these firms provide most of the jobs, but their productivity tends to be lower than in firms with positive revenue growth. Such firms retard productivity because they draw on resources that could be allocated to more productive uses; they often suffer from slow technology diffusion, entry barriers, and a decline in market competitiveness.72
71 Haltiwanger et al. (2016).72 Andrews, Circuolo, and Gal (2016).
Figure 3.35: The rates of firm entry and exit in FYR Macedonia are below those of peer countries
Figure 3.36: Many high-growth firms are in manufacturing; only a few are in services
New firms as percentage of total firms, 2015 Firms with 10 percent or more of 3-year average employment growth, as a percentage of 10+ employees firms, 2015
30
25
20
15
10
0
5
HU
NPO
L
BRA
EST
FRA
LTU
DEU
LVA
SVN
KO
R
RO
USV
KU
SA
MK
DH
RV
15
10
0
5
LTU
HUNDEU
LVA
SVKESP
POLFRA
ESTHRV
SVNIT
AM
KD
ROU
JEntry JExit JManufacturing JServices (excl. construction)Source: For FYR Macedonia, authors’ calculations: Background paper prepared for this report by Cusolito, Davies, Hernandez, and Pena (2018); for other countries: OECD Structural and Demographic Business Statistics (SDBS).
FYR MACEDONIA SYSTEMATIC COUNTRY DIAGNOSTIC
60 CHAPTER 3. ECONOMIC GROWTH AND JOBS

3.4.2 High-Productivity Firms Create High-Quality Jobs
91. The formal private sector has done a great deal to create new jobs, but it struggles to create the high-productivity jobs the economy needs. Between 2011 and 2016, FYR Macedonia’s formal private sector created more than 50,000 new jobs, an increase of 14.9 percent during this period.73 However, the increase in formal private-sector employment did not increase productivity: most jobs were created in firms with low productivity and low productivity growth. As discussed below, high-productivity jobs are essential for better and more sustainable employment opportunities that pay more.
92. Many jobs in FYR Macedonia, new as well as old, are in industries with low or negative productivity growth, particularly in services. Many industries that had negative productivity growth in 2011–16 also had the largest increase in employment, indicating that job creation was not associated with growth in productivity, which is crucial for creating high-productivity jobs (Figure 3.39).
93. Moreover, less-productive firms and those with less productivity growth accounted for the majority of employment and net job creation. Most of the country’s jobs, old and new, are in firms further from the productivity frontier: the top 20 percent most-productive firms employ fewer workers
73 Koettl-Brodmann et al. (2017a).
Figure 3.37: FYR Macedonia has fewer “gazelle” firms than peer countries…
Figure 3.38: …while the many lagging firms that provide a large share of employment stay in business
Gazelles as percentage of all firms with 10 or more employees, 2015
Share of firms with 3-year average positive and negative revenue growthTFPR Employment share
4
3
2
0
1
EST BGRBRA
LTU
LVA
SVKHUN
HRVPRT
ITA
ESP FRACAN
NZL
MK
DSVN
ROU
0.46
10 100
580
60
0
40
-520
-10 0
Min
ing
Med
iaE
lect
rici
ty, g
as, s
team
, air
Con
stru
ctio
nA
gric
ult
ure
Tran
spor
tW
hol
esal
e tr
ade
Ret
ail
Met
als,
pet
ro, p
har
ma
Woo
d, p
aper
an
d p
rin
tin
gA
ccom
mod
atio
nTe
leco
mm
un
icat
ion
sE
du
cati
onA
dm
inis
trat
ive
& s
upp
ort
Food
, bev
. & t
obac
coR
esta
ura
nts
& c
ater
ing
Text
iles
, app
arel
& le
ath
erP
rofe
ssio
nal
ser
vice
sC
ompu
ters
, mac
h.,
elec
tric
a lW
ater
, sew
erag
e, w
aste
Oth
er m
anu
fact
uri
ng
Oth
er s
ervi
ces
IT, p
rogr
amm
ing,
con
sult
ing
Tou
r ag
ency
Mot
or v
ehic
les
Hea
lth
Oth
er p
rim
ary
(for
estr
y,fi
shin
g)
JEmployment share (negative rev. growth), rhs JEmployment share (positive rev. growth), rhs QTFPR (positive revenue growth) �TFPR (negative revenue growth)
Source: For FYR Macedonia: authors’ calculations: Background paper prepared for this report by Cusolito, Davies, Hernandez, and Pena (2018); for other countries: OECD Structural and Demographic Business Statistics (SDBS).
SEIZING A BRIGHTER FUTURE FOR ALL
61CHAPTER 3. ECONOMIC GROWTH AND JOBS
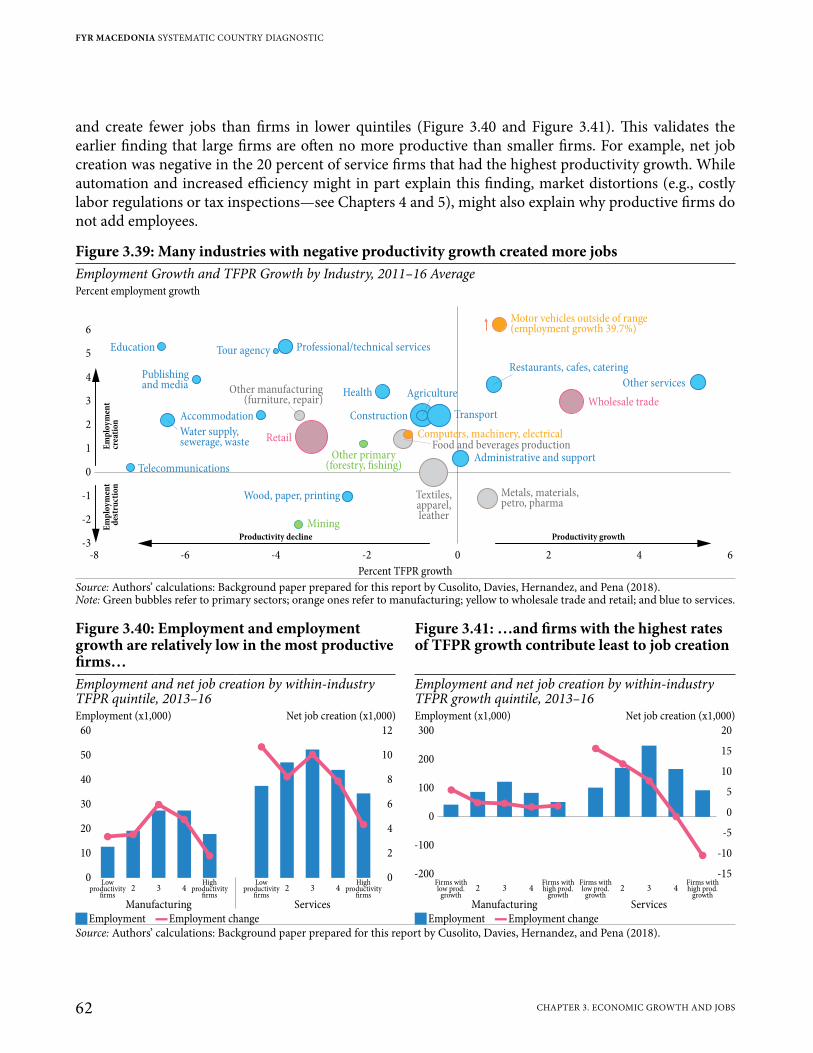
and create fewer jobs than firms in lower quintiles (Figure 3.40 and Figure 3.41). This validates the earlier finding that large firms are often no more productive than smaller firms. For example, net job creation was negative in the 20 percent of service firms that had the highest productivity growth. While automation and increased efficiency might in part explain this finding, market distortions (e.g., costly labor regulations or tax inspections—see Chapters 4 and 5), might also explain why productive firms do not add employees.
Figure 3.39: Many industries with negative productivity growth created more jobsEmployment Growth and TFPR Growth by Industry, 2011–16 AveragePercent employment growth
6
5
4
3
2
1
0
-1
-2
-3-8 -6 -4 -2 0 2 4 6
Motor vehicles outside of range(employment growth 39.7%)
Computers, machinery, electrical
Wholesale trade
Retail
Other primary(forestry, fishing)
Mining
Metals, materials,petro, pharma
Textiles,apparel,leather
Food and beverages production
Other manufacturing(furniture, repair)
Education Professional/technical servicesTour agency
Publishingand media
Water supply,sewerage, waste
Accommodation
Telecommunications
Wood, paper, printing
Administrative and support
Construction
AgricultureHealth
Restaurants, cafes, catering
Other services
Transport
Em
plo
ymen
tcr
eati
on
Productivity growth
Em
plo
ymen
td
estr
uct
ion
Productivity decline
Percent TFPR growthSource: Authors’ calculations: Background paper prepared for this report by Cusolito, Davies, Hernandez, and Pena (2018). Note: Green bubbles refer to primary sectors; orange ones refer to manufacturing; yellow to wholesale trade and retail; and blue to services.
Figure 3.40: Employment and employment growth are relatively low in the most productive firms…
Figure 3.41: …and firms with the highest rates of TFPR growth contribute least to job creation
Employment and net job creation by within-industry TFPR quintile, 2013–16
Employment and net job creation by within-industry TFPR growth quintile, 2013–16
Employment (x1,000) Net job creation (x1,000) Employment (x1,000) Net job creation (x1,000)60 12
50 10
40 8
30 6
20 4
10 2
0 0
2 3 4 2 3 4
Manufacturing Services
Lowproductivity
firms
Lowproductivity
firms
Highproductivity
firms
Highproductivity
firms
300 20
20015
100
10
0
5
-100
0
-5
-10
-200 -152 3 4 2 3 4
Manufacturing Services
Firms withlow prod.
growth
Firms withlow prod.
growth
Firms withhigh prod.
growth
Firms withhigh prod.
growth
JEmployment ▬Employment change JEmployment ▬Employment changeSource: Authors’ calculations: Background paper prepared for this report by Cusolito, Davies, Hernandez, and Pena (2018).
FYR MACEDONIA SYSTEMATIC COUNTRY DIAGNOSTIC
62 CHAPTER 3. ECONOMIC GROWTH AND JOBS
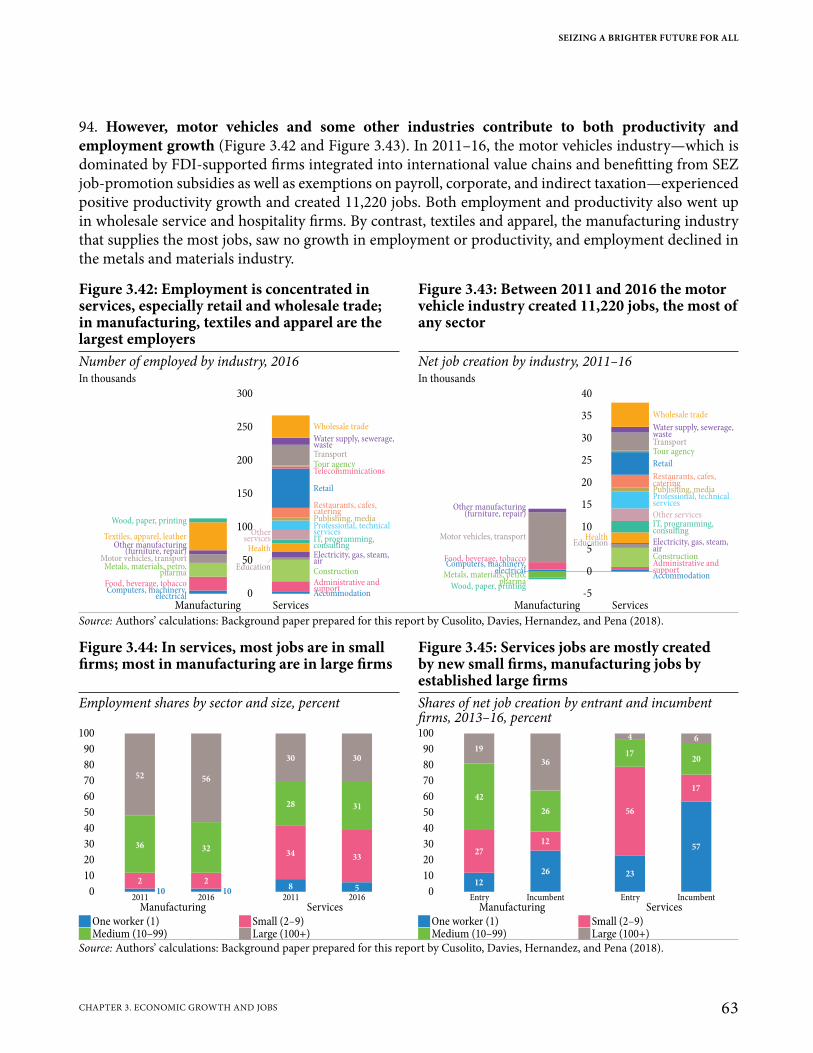
94. However, motor vehicles and some other industries contribute to both productivity and employment growth (Figure 3.42 and Figure 3.43). In 2011–16, the motor vehicles industry—which is dominated by FDI-supported firms integrated into international value chains and benefitting from SEZ job-promotion subsidies as well as exemptions on payroll, corporate, and indirect taxation—experienced positive productivity growth and created 11,220 jobs. Both employment and productivity also went up in wholesale service and hospitality firms. By contrast, textiles and apparel, the manufacturing industry that supplies the most jobs, saw no growth in employment or productivity, and employment declined in the metals and materials industry.
Figure 3.42: Employment is concentrated in services, especially retail and wholesale trade; in manufacturing, textiles and apparel are the largest employers
Figure 3.43: Between 2011 and 2016 the motor vehicle industry created 11,220 jobs, the most of any sector
Number of employed by industry, 2016 Net job creation by industry, 2011–16In thousands In thousands
Computers, machinery,electrical
Food, beverage, tobacco
Metals, materials, petro,pharma
AccommodationAdministrative andsupport
Construction
Manufacturing Services
Education
Electricity, gas, steam,air
HealthIT, programming,consulting
Motor vehicles, transport
Other manufacturing(furniture, repair)
Textiles, apparel, leather
Wood, paper, printing
Otherservices
Professional, technicalservices
Publishing, media
Restaurants, cafes,catering
Retail
TelecommunicationsTour agencyTransport
Water supply, sewerage,waste
Wholesale trade
300
250
200
150
0
100
50 Computers, machinery,electrical
Food, beverage, tobacco
Metals, materials, petro,pharma
Accommodation
Administrative andsupport
Construction
Manufacturing Services
Education Electricity, gas, steam,air
Health
IT, programming,consulting
Motor vehicles, transport
Other manufacturing(furniture, repair)
Wood, paper, printing
Other services
Professional, technicalservices
Publishing, media
Restaurants, cafes,catering
Retail
Tour agencyTransport
Water supply, sewerage,waste
Wholesale trade
40
35
30
25
20
15
10
5
-5
0
Source: Authors’ calculations: Background paper prepared for this report by Cusolito, Davies, Hernandez, and Pena (2018).
Figure 3.44: In services, most jobs are in small firms; most in manufacturing are in large firms
Figure 3.45: Services jobs are mostly created by new small firms, manufacturing jobs by established large firms
Employment shares by sector and size, percent Shares of net job creation by entrant and incumbent firms, 2013–16, percent
100
90
80
70
60
50
40
30
20
10
02011 20112016 2016
Manufacturing Services
52
36
10
2
56
32
10
2
30
28
34
8
30
31
33
5
100
90
80
70
60
50
40
30
20
10
0Entry EntryIncumbent Incumbent
Manufacturing Services
19
42
27
12
36
26
12
26
4
17
56
23
6
20
17
57
JOne worker (1) JSmall (2–9) JOne worker (1) JSmall (2–9) JMedium (10–99) JLarge (100+) JMedium (10–99) JLarge (100+)
Source: Authors’ calculations: Background paper prepared for this report by Cusolito, Davies, Hernandez, and Pena (2018).
SEIZING A BRIGHTER FUTURE FOR ALL
63CHAPTER 3. ECONOMIC GROWTH AND JOBS
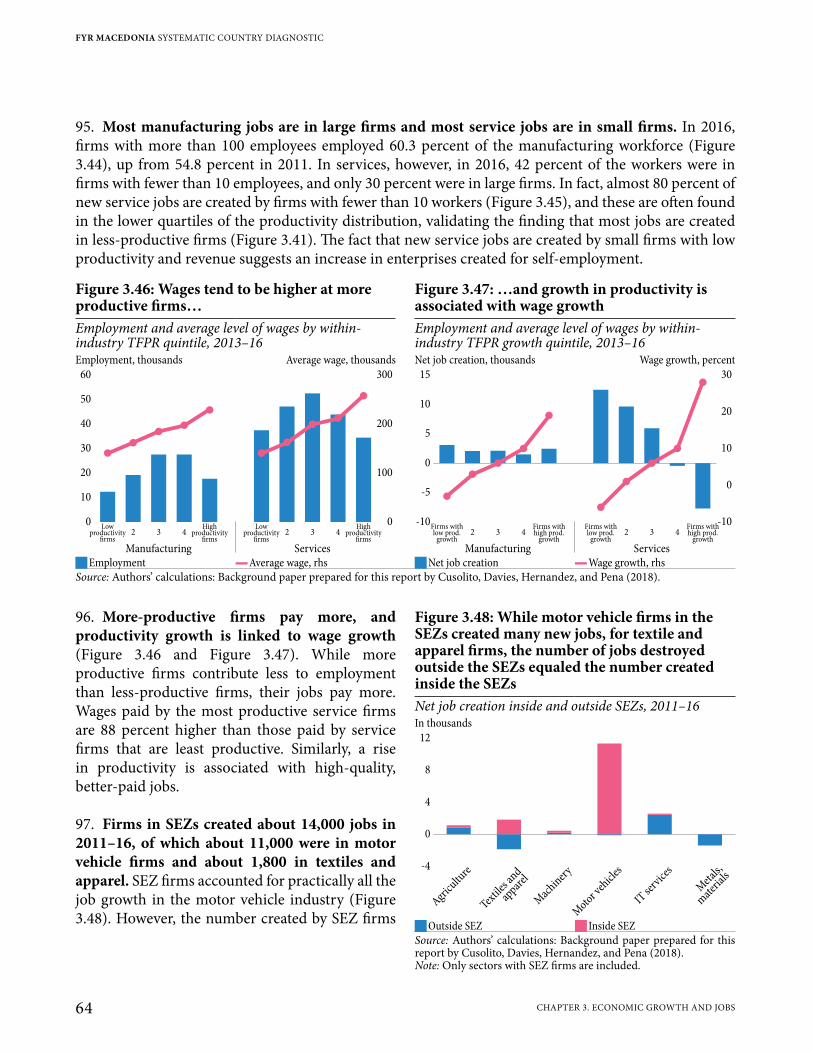
95. Most manufacturing jobs are in large firms and most service jobs are in small firms. In 2016, firms with more than 100 employees employed 60.3 percent of the manufacturing workforce (Figure 3.44), up from 54.8 percent in 2011. In services, however, in 2016, 42 percent of the workers were in firms with fewer than 10 employees, and only 30 percent were in large firms. In fact, almost 80 percent of new service jobs are created by firms with fewer than 10 workers (Figure 3.45), and these are often found in the lower quartiles of the productivity distribution, validating the finding that most jobs are created in less-productive firms (Figure 3.41). The fact that new service jobs are created by small firms with low productivity and revenue suggests an increase in enterprises created for self-employment.
96. More-productive firms pay more, and productivity growth is linked to wage growth (Figure 3.46 and Figure 3.47). While more productive firms contribute less to employment than less-productive firms, their jobs pay more. Wages paid by the most productive service firms are 88 percent higher than those paid by service firms that are least productive. Similarly, a rise in productivity is associated with high-quality, better-paid jobs.
97. Firms in SEZs created about 14,000 jobs in 2011–16, of which about 11,000 were in motor vehicle firms and about 1,800 in textiles and apparel. SEZ firms accounted for practically all the job growth in the motor vehicle industry (Figure 3.48). However, the number created by SEZ firms
Figure 3.46: Wages tend to be higher at more productive firms…
Figure 3.47: …and growth in productivity is associated with wage growth
Employment and average level of wages by within-industry TFPR quintile, 2013–16
Employment and average level of wages by within-industry TFPR growth quintile, 2013–16
Employment, thousands Average wage, thousands Net job creation, thousands Wage growth, percent60
50
300
40 200
30
10020
10
0 0
2 3 4Low
productivityfirms
Lowproductivity
firms
Highproductivity
firms
Highproductivity
firms
2 3 4
Manufacturing Services
15 30
1020
5
10
0
-50
-10 -102 3 4 2 3 4
Manufacturing Services
Firms withlow prod.
growth
Firms withlow prod.
growth
Firms withhigh prod.
growth
Firms withhigh prod.
growth
JEmployment ▬Average wage, rhs JNet job creation ▬Wage growth, rhsSource: Authors’ calculations: Background paper prepared for this report by Cusolito, Davies, Hernandez, and Pena (2018).
Figure 3.48: While motor vehicle firms in the SEZs created many new jobs, for textile and apparel firms, the number of jobs destroyed outside the SEZs equaled the number created inside the SEZsNet job creation inside and outside SEZs, 2011–16In thousands
12
8
4
0
-4
Agricultu
re
Textil
es an
d
appar
el
Mac
hiner
y
Moto
r veh
icles
IT se
rvice
s
Met
als,
mat
erial
s
JOutside SEZ J Inside SEZSource: Authors’ calculations: Background paper prepared for this report by Cusolito, Davies, Hernandez, and Pena (2018).Note: Only sectors with SEZ firms are included.
FYR MACEDONIA SYSTEMATIC COUNTRY DIAGNOSTIC
64 CHAPTER 3. ECONOMIC GROWTH AND JOBS

in the textile and apparel industry equaled the number destroyed in firms not in SEZs—it appears that jobs simply moving from outside to inside SEZs.
3.4.3 A Burdensome Business Climate Slows Firm Productivity Growth
98. FYR Macedonia has achieved remarkable progress in improving its business climate, but lingering weaknesses discourage productivity growth. International good practices demonstrate that, among other elements, cost of trading across borders, tax payment costs, the process for obtaining permits, and ease of access to credit closely correlate with firm productivity. While FYR Macedonia performs well on aggregate indicators of the business climate, weaknesses in areas like trade connectivity, regulatory enforcement, and competition policy impose binding constraints on firm productivity throughout the country.
99. A quantitative analysis of the impact of aspects of the business climate dimensions makes it clear that these can drag firm’s productivity, highlighting the importance of supportive policy. Firm survey data makes it possible to quantify the impact of business climate data on firm productivity (Figure 3.49). Customs red tape, measured as the average number of days it takes to clear customs, reduces firm productivity: one more day in the time needed to clear customs reduces the productivity of the median
Figure 3.49: While some aspects of the business climate contribute to a firm’s productivity in FYR Macedonia, others—including trade costs and business regulations—inhibit productivityImpact of business climate dimensions on firm productivity, regression coefficients with TFPR as dependent variable
Firm has access to credit line
Firm is exporting
Firm offers training
Firm uses foreign technology
Firm is foreignly owned
% of firms affected by crime
% of firms with power outages
% of firms competing withinformal competition
% of manager's timein bureaucracy
Number of days to get anoperating permit
Number of competitors
Number of tax inspection visits
Number of days to clear customs
13
7.9
6.6
4.5
3.3
-0.1
-0.2
-0.2
-1.2
-4.2
-4.7
-5.5
-8.6
Explanation:The graph shows the impact of a change in a business climate dimension on productivity of the median firm in FYR Macedonia, holding all other dimensions constant. For example, having access to a credit line (45.4 percent of firms in FYR Macedonia have access to a credit line, compared to 37.7 percent in ECA) is associated with an increase in productivity of 13 percent for the median firm in the country.For the dimensions indicated with a percentage, it shows the impact of a percentage point increase. For example, an increase of one percentage point in the share of firms affected by crime is associated with a drop in the productivity of the median firm by 0.1 percentFor the dimensions indicating a number, it shows the impact of a unit increase. For example, an increase of one day to get an operating permit is associated with a decrease in productivity by 4.2 percent for the median firm.
Impact of change on firm productivity (TFPR)Source: Author’s calculations based on data from World Bank Enterprise Surveys, following Cusolito, Correa, and Pena (2018).Note: Total factor productivity of revenue (TFPR) is measured by deflated sales. The estimated impact on productivity follows the methodology of De Loecker (2013), with TFPR as the dependent variable, and capital and labor as inputs. Since the TFPR measures profitability, it combines both demand- and supply-side factors. Thus, the exercise shows the “marginal and joint effects,” which combine the impact of prices and efficiency. It does not assess the performance of the country relative to comparators, but it can identify variables that have the largest impact on productivity in FYR Macedonia. See Chapter 3 for details.
SEIZING A BRIGHTER FUTURE FOR ALL
65CHAPTER 3. ECONOMIC GROWTH AND JOBS
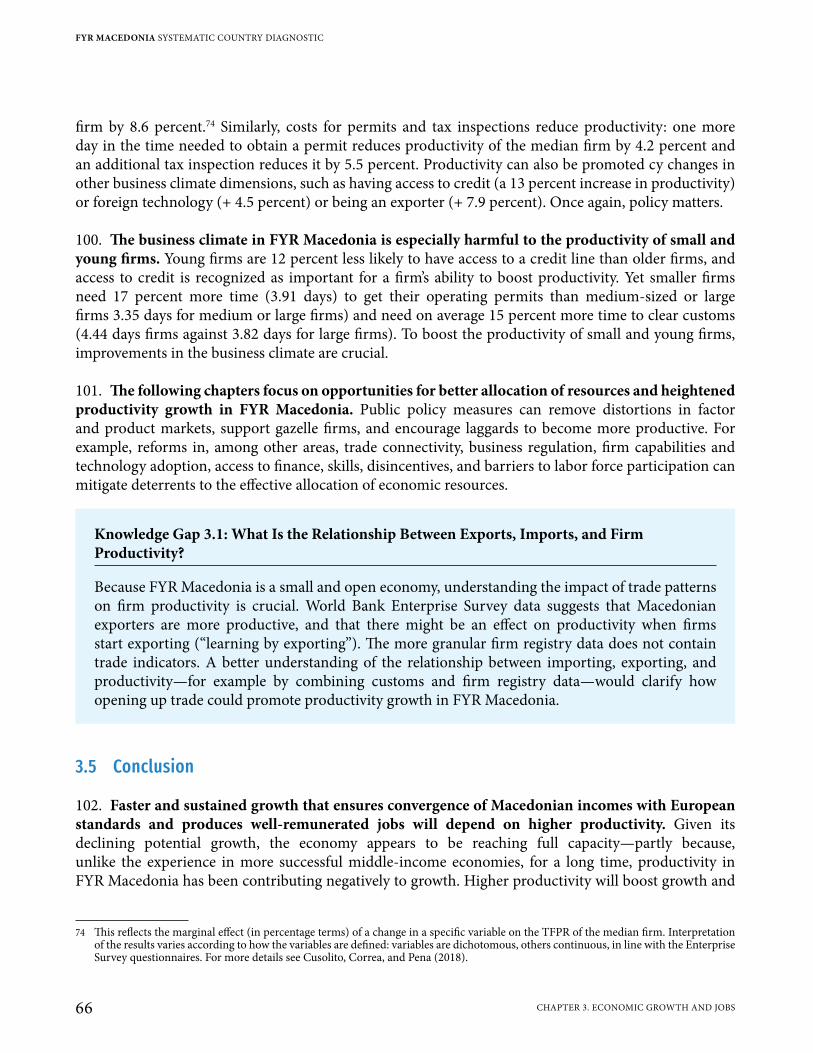
firm by 8.6 percent.74 Similarly, costs for permits and tax inspections reduce productivity: one more day in the time needed to obtain a permit reduces productivity of the median firm by 4.2 percent and an additional tax inspection reduces it by 5.5 percent. Productivity can also be promoted cy changes in other business climate dimensions, such as having access to credit (a 13 percent increase in productivity) or foreign technology (+ 4.5 percent) or being an exporter (+ 7.9 percent). Once again, policy matters.
100. The business climate in FYR Macedonia is especially harmful to the productivity of small and young firms. Young firms are 12 percent less likely to have access to a credit line than older firms, and access to credit is recognized as important for a firm’s ability to boost productivity. Yet smaller firms need 17 percent more time (3.91 days) to get their operating permits than medium-sized or large firms 3.35 days for medium or large firms) and need on average 15 percent more time to clear customs (4.44 days firms against 3.82 days for large firms). To boost the productivity of small and young firms, improvements in the business climate are crucial.
101. The following chapters focus on opportunities for better allocation of resources and heightened productivity growth in FYR Macedonia. Public policy measures can remove distortions in factor and product markets, support gazelle firms, and encourage laggards to become more productive. For example, reforms in, among other areas, trade connectivity, business regulation, firm capabilities and technology adoption, access to finance, skills, disincentives, and barriers to labor force participation can mitigate deterrents to the effective allocation of economic resources.
3.5 Conclusion
102. Faster and sustained growth that ensures convergence of Macedonian incomes with European standards and produces well-remunerated jobs will depend on higher productivity. Given its declining potential growth, the economy appears to be reaching full capacity—partly because, unlike the experience in more successful middle-income economies, for a long time, productivity in FYR Macedonia has been contributing negatively to growth. Higher productivity will boost growth and
74 This reflects the marginal effect (in percentage terms) of a change in a specific variable on the TFPR of the median firm. Interpretation of the results varies according to how the variables are defined: variables are dichotomous, others continuous, in line with the Enterprise Survey questionnaires. For more details see Cusolito, Correa, and Pena (2018).
Knowledge Gap 3.1: What Is the Relationship Between Exports, Imports, and Firm Productivity?
Because FYR Macedonia is a small and open economy, understanding the impact of trade patterns on firm productivity is crucial. World Bank Enterprise Survey data suggests that Macedonian exporters are more productive, and that there might be an effect on productivity when firms start exporting (“learning by exporting”). The more granular firm registry data does not contain trade indicators. A better understanding of the relationship between importing, exporting, and productivity—for example by combining customs and firm registry data—would clarify how opening up trade could promote productivity growth in FYR Macedonia.
FYR MACEDONIA SYSTEMATIC COUNTRY DIAGNOSTIC
66 CHAPTER 3. ECONOMIC GROWTH AND JOBS
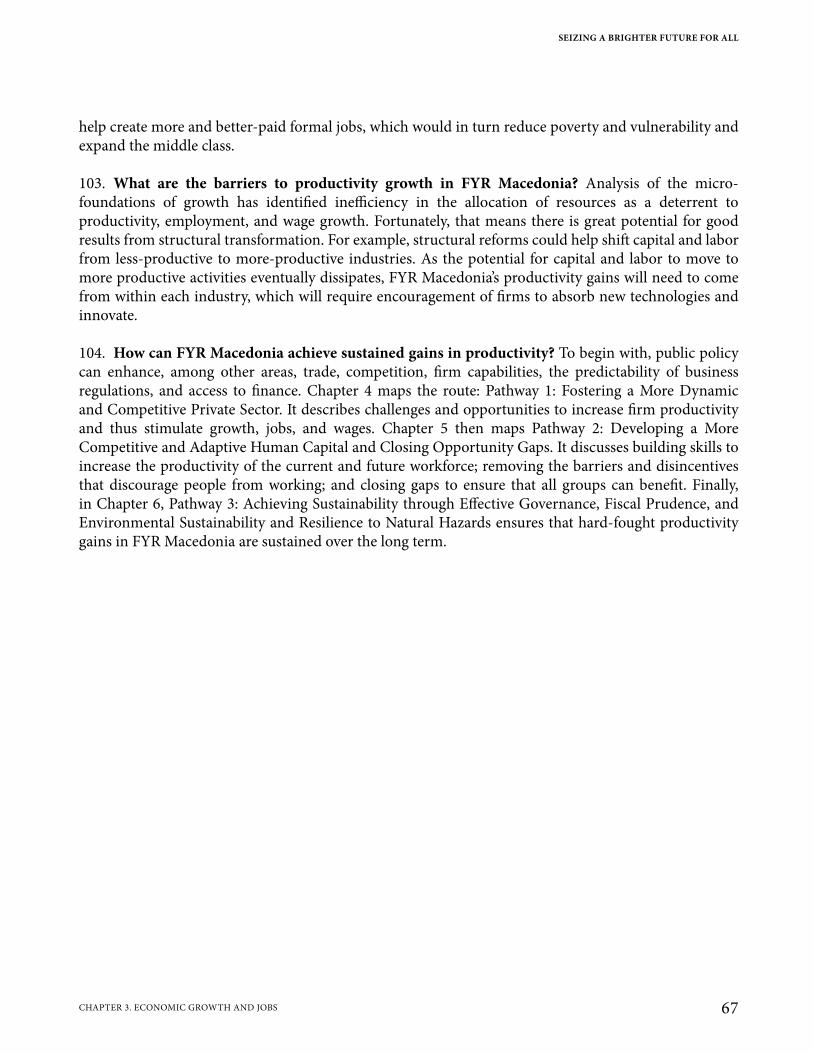
help create more and better-paid formal jobs, which would in turn reduce poverty and vulnerability and expand the middle class.
103. What are the barriers to productivity growth in FYR Macedonia? Analysis of the micro-foundations of growth has identified inefficiency in the allocation of resources as a deterrent to productivity, employment, and wage growth. Fortunately, that means there is great potential for good results from structural transformation. For example, structural reforms could help shift capital and labor from less-productive to more-productive industries. As the potential for capital and labor to move to more productive activities eventually dissipates, FYR Macedonia’s productivity gains will need to come from within each industry, which will require encouragement of firms to absorb new technologies and innovate.
104. How can FYR Macedonia achieve sustained gains in productivity? To begin with, public policy can enhance, among other areas, trade, competition, firm capabilities, the predictability of business regulations, and access to finance. Chapter 4 maps the route: Pathway 1: Fostering a More Dynamic and Competitive Private Sector. It describes challenges and opportunities to increase firm productivity and thus stimulate growth, jobs, and wages. Chapter 5 then maps Pathway 2: Developing a More Competitive and Adaptive Human Capital and Closing Opportunity Gaps. It discusses building skills to increase the productivity of the current and future workforce; removing the barriers and disincentives that discourage people from working; and closing gaps to ensure that all groups can benefit. Finally, in Chapter 6, Pathway 3: Achieving Sustainability through Effective Governance, Fiscal Prudence, and Environmental Sustainability and Resilience to Natural Hazards ensures that hard-fought productivity gains in FYR Macedonia are sustained over the long term.
SEIZING A BRIGHTER FUTURE FOR ALL
67CHAPTER 3. ECONOMIC GROWTH AND JOBS

FYR Macedonia Systematic Country Diagnostic | Seizing a Brighter Future for All
FYR Macedonia Systematic Country Diagnostic | Seizing a Brighter Future for All
Tanja BalacSettled Dreams
Enis recently finished university and opened a tour guide company in Ohrid, catering to the increasing number of visitors the town is attracting. He invested his savings and a loan from his uncle, as he did not find a bank that would finance his business. It took him a while, but he’s up and running and began looking for someone to help him. People who speak English well are scarce, and two candidates he liked were turned off by the salary, though he can’t afford to offer more. When he finally found someone willing to take the job, it took longer than planned to train him as a tour guide. After a couple of months on the job,
however, the person left the company and the city. It took Enis a couple of months to find and train a new person. He is saving money to develop a mobile application to partner with other tour guides and sell services through the internet; a large hotel nearby is asking for tour guides and he hopes he can get the contract. Enis has always kept his paperwork in order, but he’s afraid of another visit from the financial police—they came six weeks ago and though they found nothing irregular, they were very strict, and he still has no idea why they decided to check on him.
Chapter 4. Pathway I: Fostering a More Dynamic and Competitive Private Sector
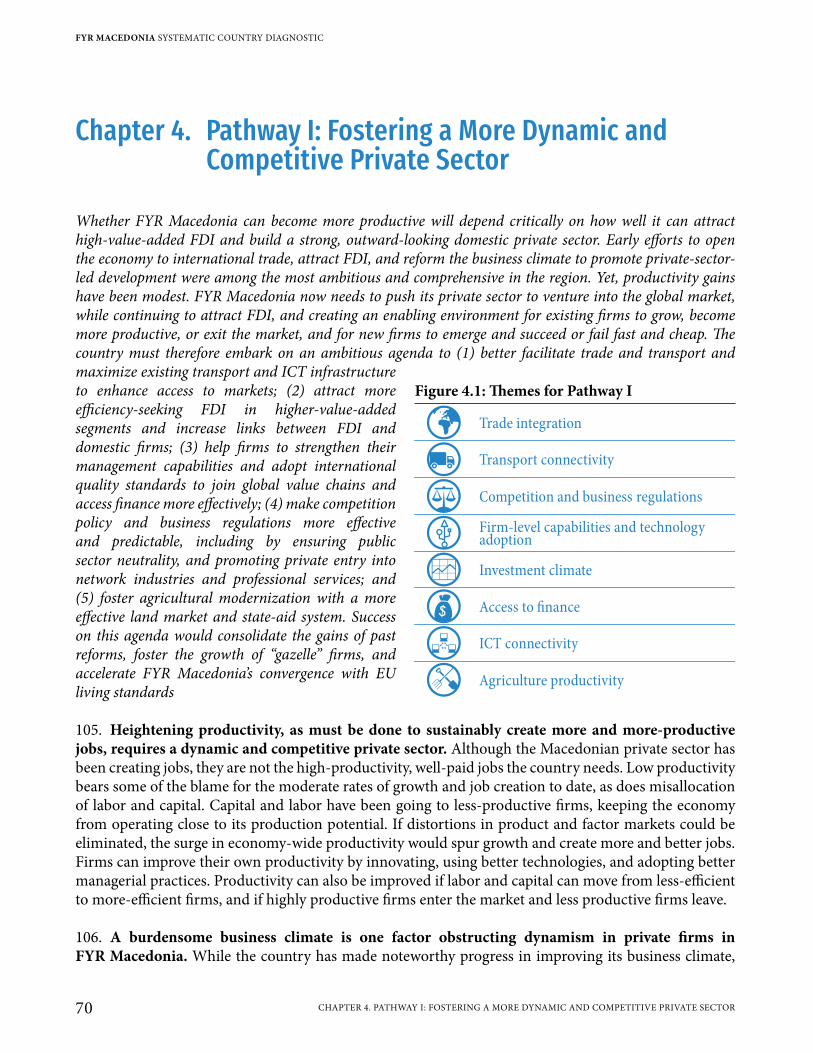
Chapter 4. Pathway I: Fostering a More Dynamic and Competitive Private Sector
Whether FYR Macedonia can become more productive will depend critically on how well it can attract high-value-added FDI and build a strong, outward-looking domestic private sector. Early efforts to open the economy to international trade, attract FDI, and reform the business climate to promote private-sector-led development were among the most ambitious and comprehensive in the region. Yet, productivity gains have been modest. FYR Macedonia now needs to push its private sector to venture into the global market, while continuing to attract FDI, and creating an enabling environment for existing firms to grow, become more productive, or exit the market, and for new firms to emerge and succeed or fail fast and cheap. The country must therefore embark on an ambitious agenda to (1) better facilitate trade and transport and maximize existing transport and ICT infrastructure to enhance access to markets; (2) attract more efficiency-seeking FDI in higher-value-added segments and increase links between FDI and domestic firms; (3) help firms to strengthen their management capabilities and adopt international quality standards to join global value chains and access finance more effectively; (4) make competition policy and business regulations more effective and predictable, including by ensuring public sector neutrality, and promoting private entry into network industries and professional services; and (5) foster agricultural modernization with a more effective land market and state-aid system. Success on this agenda would consolidate the gains of past reforms, foster the growth of “gazelle” firms, and accelerate FYR Macedonia’s convergence with EU living standards
105. Heightening productivity, as must be done to sustainably create more and more-productive jobs, requires a dynamic and competitive private sector. Although the Macedonian private sector has been creating jobs, they are not the high-productivity, well-paid jobs the country needs. Low productivity bears some of the blame for the moderate rates of growth and job creation to date, as does misallocation of labor and capital. Capital and labor have been going to less-productive firms, keeping the economy from operating close to its production potential. If distortions in product and factor markets could be eliminated, the surge in economy-wide productivity would spur growth and create more and better jobs. Firms can improve their own productivity by innovating, using better technologies, and adopting better managerial practices. Productivity can also be improved if labor and capital can move from less-efficient to more-efficient firms, and if highly productive firms enter the market and less productive firms leave.
106. A burdensome business climate is one factor obstructing dynamism in private firms in FYR Macedonia. While the country has made noteworthy progress in improving its business climate,
Figure 4.1: Themes for Pathway I
Trade integration
Transport connectivity
Competition and business regulations
Firm-level capabilities and technologyadoption
Investment climate
Access to finance
ICT connectivity
Agriculture productivity
FYR MACEDONIA SYSTEMATIC COUNTRY DIAGNOSTIC
70 CHAPTER 4. PATHWAY I: FOSTERING A MORE DYNAMIC AND COMPETITIVE PRIVATE SECTOR
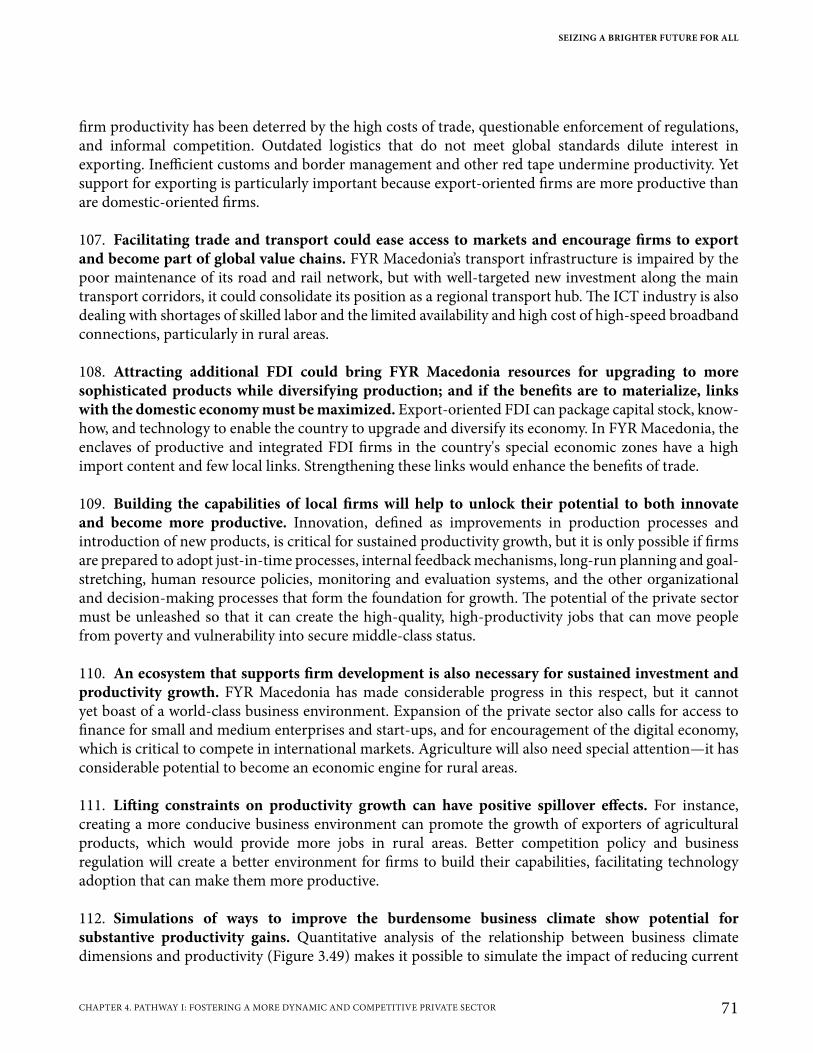
firm productivity has been deterred by the high costs of trade, questionable enforcement of regulations, and informal competition. Outdated logistics that do not meet global standards dilute interest in exporting. Inefficient customs and border management and other red tape undermine productivity. Yet support for exporting is particularly important because export-oriented firms are more productive than are domestic-oriented firms.
107. Facilitating trade and transport could ease access to markets and encourage firms to export and become part of global value chains. FYR Macedonia’s transport infrastructure is impaired by the poor maintenance of its road and rail network, but with well-targeted new investment along the main transport corridors, it could consolidate its position as a regional transport hub. The ICT industry is also dealing with shortages of skilled labor and the limited availability and high cost of high-speed broadband connections, particularly in rural areas.
108. Attracting additional FDI could bring FYR Macedonia resources for upgrading to more sophisticated products while diversifying production; and if the benefits are to materialize, links with the domestic economy must be maximized. Export-oriented FDI can package capital stock, know-how, and technology to enable the country to upgrade and diversify its economy. In FYR Macedonia, the enclaves of productive and integrated FDI firms in the country's special economic zones have a high import content and few local links. Strengthening these links would enhance the benefits of trade.
109. Building the capabilities of local firms will help to unlock their potential to both innovate and become more productive. Innovation, defined as improvements in production processes and introduction of new products, is critical for sustained productivity growth, but it is only possible if firms are prepared to adopt just-in-time processes, internal feedback mechanisms, long-run planning and goal-stretching, human resource policies, monitoring and evaluation systems, and the other organizational and decision-making processes that form the foundation for growth. The potential of the private sector must be unleashed so that it can create the high-quality, high-productivity jobs that can move people from poverty and vulnerability into secure middle-class status.
110. An ecosystem that supports firm development is also necessary for sustained investment and productivity growth. FYR Macedonia has made considerable progress in this respect, but it cannot yet boast of a world-class business environment. Expansion of the private sector also calls for access to finance for small and medium enterprises and start-ups, and for encouragement of the digital economy, which is critical to compete in international markets. Agriculture will also need special attention—it has considerable potential to become an economic engine for rural areas.
111. Lifting constraints on productivity growth can have positive spillover effects. For instance, creating a more conducive business environment can promote the growth of exporters of agricultural products, which would provide more jobs in rural areas. Better competition policy and business regulation will create a better environment for firms to build their capabilities, facilitating technology adoption that can make them more productive.
112. Simulations of ways to improve the burdensome business climate show potential for substantive productivity gains. Quantitative analysis of the relationship between business climate dimensions and productivity (Figure 3.49) makes it possible to simulate the impact of reducing current
SEIZING A BRIGHTER FUTURE FOR ALL
71CHAPTER 4. PATHWAY I: FOSTERING A MORE DYNAMIC AND COMPETITIVE PRIVATE SECTOR
constraints on firms (Figure 4.2). It takes Macedonian firms an average of 4.3 days to get goods through customs; halving the number of days would push up average productivity by 5.2 percent for the median firm. Similarly, halving the time that managers spend on bureaucratic issues would boost productivity by 7.5 percent and halving the share of firms facing power cuts would increase average productivity by 5.0 percent. These simulations demonstrate how alleviating business-climate constraints can stimulate much-needed productivity growth.
113. This chapter focuses on the challenges and opportunities related to firm productivity in FYR Macedonia. Removing obstacles to firms entering the market and competing will increase growth, jobs, and wages, widening the range of opportunities for workers. Similarly (see Chapter 5), building skills and removing barriers to worker entry into the labor force will heighten productivity. Meanwhile (see Chapter 6), effective governance and building fiscal and environmental resilience (given the country’s vulnerability to natural hazards) would ensure that hard-fought development gains are sustained over the long term.
4.1 Deepening Integration with Global Markets to Boost Economic Growth
114. Attaining a faster but sustainable pace of economic growth will require building the country’s export orientation. A small economy like FYR Macedonia, where domestic demand has been undermined by high unemployment and relatively low wages, needs export markets if it is to accelerate growth. Though this is no small challenge for a country without natural resources to export as commodities, it must be dealt with. Increasing the share of exports will enhance the economy because, confronted with intense global competition, exporting firms allocate resources more efficiently, adopt
Figure 4.2: Improving the business climate can lead to substantive productivity gainsSimulated impact of a 50 percent reduction in a given business climate dimension on firm productivityA 50% decrease in ...
Number of days to getan operating permit
Share of managerstime in bureaucracy
Number of daysto clear customs
Share of firmsfacing power cuts
Number of tax visits
Share of firms competingagainst informal firms
9.9
7.5
5.2
5.0
4.7
0.5
Resulting percent increase in TFPR growthSource: Author’s calculations: Background paper prepared for this report by Cusolito, Davies, Hernandez, and Pena (2018, forthcoming), based on data from the World Bank Enterprise Surveys.Note: The impact on firm productivity is based on the average total factor productivity of revenue (TFPR), following the methodology of De Loecker (2013), as explained in Chapter 3.
FYR MACEDONIA SYSTEMATIC COUNTRY DIAGNOSTIC
72 CHAPTER 4. PATHWAY I: FOSTERING A MORE DYNAMIC AND COMPETITIVE PRIVATE SECTOR
better technologies, tap economies of scale, and improve imported inputs, all of which ultimately speed productivity growth.75
4.1.1 Progress in Export Growth and Sophistication
115. Recognizing the limitations imposed by the small size of its economy, after independence FYR Macedonia moved promptly to integrate into the global economy. It joined the World Trade Organization (WTO) in 2003 and became a candidate for EU membership in 2005. In 2006 it signed a series of important regional and bilateral trade agreements, including the Central European Free Trade Agreement (CEFTA), which replaced 32 bilateral trade agreements to smooth intraregional trade.76
116. Efforts to integrate into the global economy have made FYR Macedonia more open to world markets. With the sum of exports and imports representing 113 percent of GDP in 2016, it is the most open economy in the Western Balkans and almost 40 percent more open than developing countries in the ECA (Figure 4.3). Trade with the EU has soared since the early 2000s: between 2001 and 2014 exports to the EU grew by 525 percent and imports from the EU by 265 percent. Trade liberalization, coupled with the country’s proximity to EU markets, encouraged foreign firms to invest in FYR Macedonia. Many large foreign investments are in manufacturing firms that primarily serve EU consumers. Skopje has especially benefited from the country’s transition to an open economy; in 2016 it was classified as one of the top 10 globalization hotspots in the DHL’s Global Connectedness Index, which measures international activity relative to within-city activity (Figure 4.5).
117. FYR Macedonia’s greater economic integration has been accompanied by a rapid increase in export sophistication. Not only has the value of its exports and imports increased, but in only a few years more sophisticated products constituted a larger share of the country’s export basket (Figure 4.4). In the mid-1990s, most exports were primary or resource-based low-technology products. Until 2008, exports were typically semi-processed manufactured goods, such as ferrous metal components, iron, steel, and textiles, and consumer manufactures, primarily footwear and clothing.77 Since 2009, however, FYR Macedonia’s exports have become steadily more sophisticated. As a result, between 2011 and 2016, the share of high- and medium- technology products78 in the country’s export basket increased from 39 to 57 percent. Although the country’s main comparative advantage, measured by the Revealed Comparative Advantage (RCA) index,79 is still in the production of food and textiles, there were considerable declines in footwear, metals, and stone/glass; meanwhile, comparative advantage increased in chemicals and to a lesser extent machinery and electrical components (Figure 4.6).
75 See: World Bank (2017c), Revving up the Engines of Growth and Prosperity in the Western Balkans.76 As of September 2018, the parties to the CEFTA agreement are Albania, Bosnia and Herzegovina, Kosovo, FYR Macedonia, Moldova,
Montenegro, and Serbia. Former signatories that left upon becoming EU members are Bulgaria, Croatia, Czech Republic, Hungary, Poland, Romania, Slovakia, and Slovenia.
77 World Bank (1995), FYR Macedonia Country Economic Memorandum.78 Products are classified as high, medium, or low tech based on R&D intensity. Exports considered to have high R&D intensity are those
associated with the aerospace industry, computers, pharmaceuticals, scientific instruments, and electrical machinery; medium-tech products are those found in industries like basic and fabricated metals. This report uses the Eurostat definition of medium and high-tech exports including those of the following SITC Rev. 3 products: 266, 267, 512, 513, 525, 533, 54, 553, 554, 562, 57, 58, 591, 593, 597, 598, 629, 653, 671, 672, 679, 71, 72, 731, 733, 737, 74, 751, 752, 759, 76, 77, 78, 79, 812, 87, 88 and 891.
79 The Revealed Comparative Advantage (RCA) index refers to the relative advantage or disadvantage of a certain country in a certain class of goods or services, as evidenced by trade flows. RCA values above 1 denote comparative advantages in a given category.
SEIZING A BRIGHTER FUTURE FOR ALL
73CHAPTER 4. PATHWAY I: FOSTERING A MORE DYNAMIC AND COMPETITIVE PRIVATE SECTOR
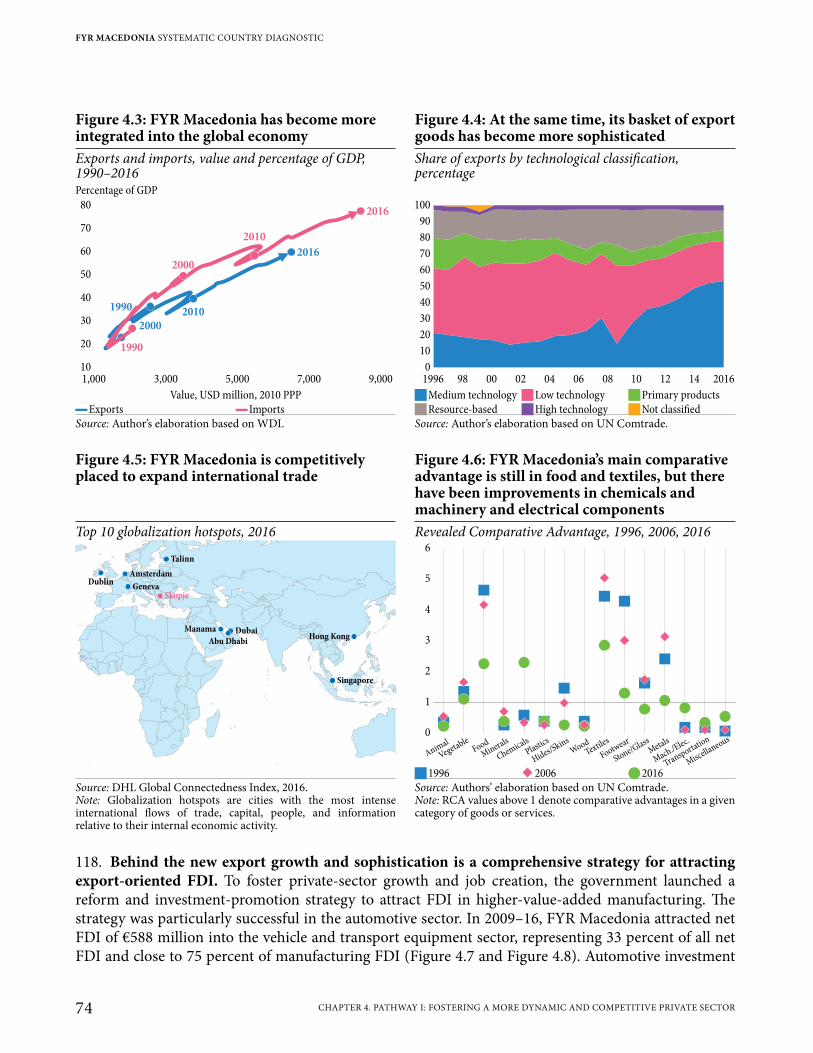
118. Behind the new export growth and sophistication is a comprehensive strategy for attracting export-oriented FDI. To foster private-sector growth and job creation, the government launched a reform and investment-promotion strategy to attract FDI in higher-value-added manufacturing. The strategy was particularly successful in the automotive sector. In 2009–16, FYR Macedonia attracted net FDI of €588 million into the vehicle and transport equipment sector, representing 33 percent of all net FDI and close to 75 percent of manufacturing FDI (Figure 4.7 and Figure 4.8). Automotive investment
Figure 4.3: FYR Macedonia has become more integrated into the global economy
Figure 4.4: At the same time, its basket of export goods has become more sophisticated
Exports and imports, value and percentage of GDP, 1990–2016
Share of exports by technological classification, percentage
Percentage of GDP80
70
60
50
40
30
20
10
1,000 3,000 5,000 7,000 9,000
2016
2010
2000
1990
1990
2000
2010
2016100
90
80
70
60
50
40
30
20
10
0
1996 98 201600 02 04 06 08 10 12 14
Value, USD million, 2010 PPP JMedium technology JLow technology JPrimary products ▬Exports ▬ Imports JResource-based JHigh technology JNot classified
Source: Author’s elaboration based on WDI. Source: Author’s elaboration based on UN Comtrade.
Figure 4.5: FYR Macedonia is competitively placed to expand international trade
Figure 4.6: FYR Macedonia’s main comparative advantage is still in food and textiles, but there have been improvements in chemicals and machinery and electrical components
Top 10 globalization hotspots, 2016 Revealed Comparative Advantage, 1996, 2006, 2016
Talinn
DublinAmsterdam
GenevaSkopje
Manama DubaiAbu Dhabi
Hong Kong
Singapore
6
5
4
3
2
1
0
Animal
VegetableFood
Minerals
Chemicals
Plastics
Hides Skins/ Wood
Textiles
Footwear
Stone/GlassMetals
Mach /Elec.
.
Transportation
Miscellaneous
J1996 �2006 Q2016Source: DHL Global Connectedness Index, 2016.Note: Globalization hotspots are cities with the most intense international flows of trade, capital, people, and information relative to their internal economic activity.
Source: Authors’ elaboration based on UN Comtrade.Note: RCA values above 1 denote comparative advantages in a given category of goods or services.
FYR MACEDONIA SYSTEMATIC COUNTRY DIAGNOSTIC
74 CHAPTER 4. PATHWAY I: FOSTERING A MORE DYNAMIC AND COMPETITIVE PRIVATE SECTOR
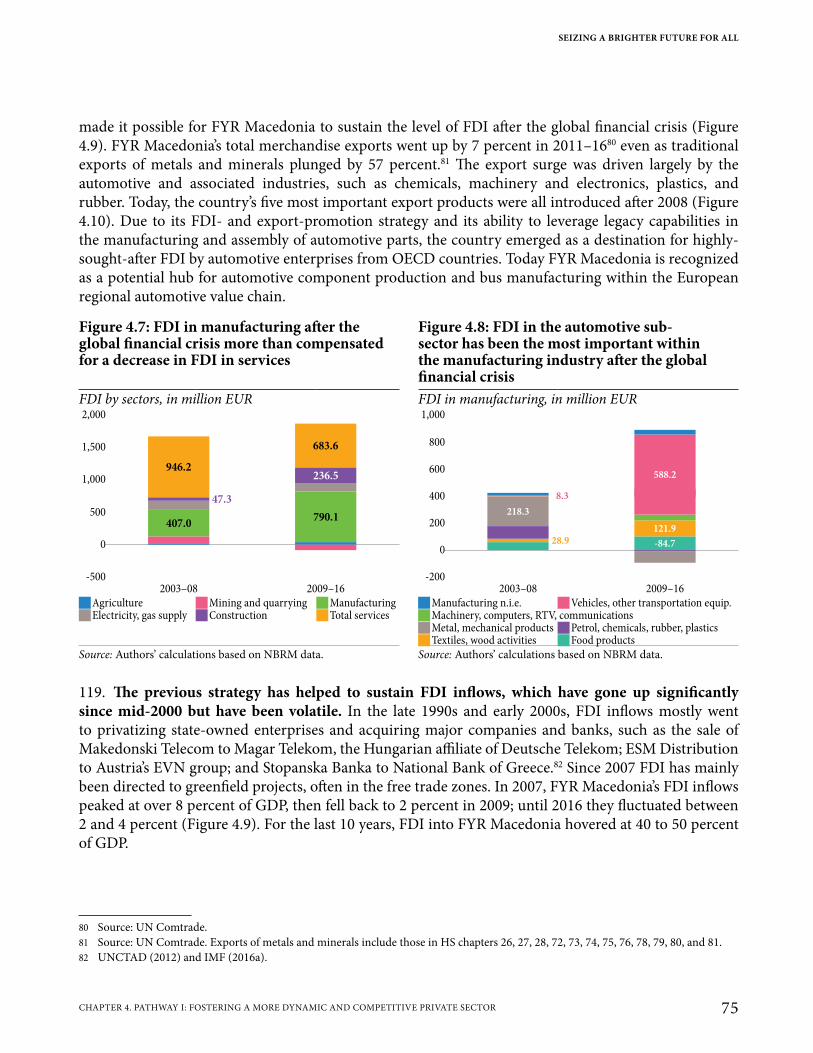
made it possible for FYR Macedonia to sustain the level of FDI after the global financial crisis (Figure 4.9). FYR Macedonia’s total merchandise exports went up by 7 percent in 2011–1680 even as traditional exports of metals and minerals plunged by 57 percent.81 The export surge was driven largely by the automotive and associated industries, such as chemicals, machinery and electronics, plastics, and rubber. Today, the country’s five most important export products were all introduced after 2008 (Figure 4.10). Due to its FDI- and export-promotion strategy and its ability to leverage legacy capabilities in the manufacturing and assembly of automotive parts, the country emerged as a destination for highly-sought-after FDI by automotive enterprises from OECD countries. Today FYR Macedonia is recognized as a potential hub for automotive component production and bus manufacturing within the European regional automotive value chain.
119. The previous strategy has helped to sustain FDI inflows, which have gone up significantly since mid-2000 but have been volatile. In the late 1990s and early 2000s, FDI inflows mostly went to privatizing state-owned enterprises and acquiring major companies and banks, such as the sale of Makedonski Telecom to Magar Telekom, the Hungarian affiliate of Deutsche Telekom; ESM Distribution to Austria’s EVN group; and Stopanska Banka to National Bank of Greece.82 Since 2007 FDI has mainly been directed to greenfield projects, often in the free trade zones. In 2007, FYR Macedonia’s FDI inflows peaked at over 8 percent of GDP, then fell back to 2 percent in 2009; until 2016 they fluctuated between 2 and 4 percent (Figure 4.9). For the last 10 years, FDI into FYR Macedonia hovered at 40 to 50 percent of GDP.
80 Source: UN Comtrade.81 Source: UN Comtrade. Exports of metals and minerals include those in HS chapters 26, 27, 28, 72, 73, 74, 75, 76, 78, 79, 80, and 81.82 UNCTAD (2012) and IMF (2016a).
Figure 4.7: FDI in manufacturing after the global financial crisis more than compensated for a decrease in FDI in services
Figure 4.8: FDI in the automotive sub-sector has been the most important within the manufacturing industry after the global financial crisis
FDI by sectors, in million EUR FDI in manufacturing, in million EUR2,000
1,500
1,000
500
0
-500
2003–08 2009–16
946.2
683.6
47.3
407.0
236.5
790.1
2003–08 2009–16
1,000
800
600
400
200
0
-200
8.3
588.2
218.3
121.9
-84.728.9
JAgriculture JMining and quarrying JManufacturing JManufacturing n.i.e. JVehicles, other transportation equip. JElectricity, gas supply JConstruction JTotal services JMachinery, computers, RTV, communications
JMetal, mechanical products JPetrol, chemicals, rubber, plastics JTextiles, wood activities JFood products
Source: Authors’ calculations based on NBRM data. Source: Authors’ calculations based on NBRM data.
SEIZING A BRIGHTER FUTURE FOR ALL
75CHAPTER 4. PATHWAY I: FOSTERING A MORE DYNAMIC AND COMPETITIVE PRIVATE SECTOR
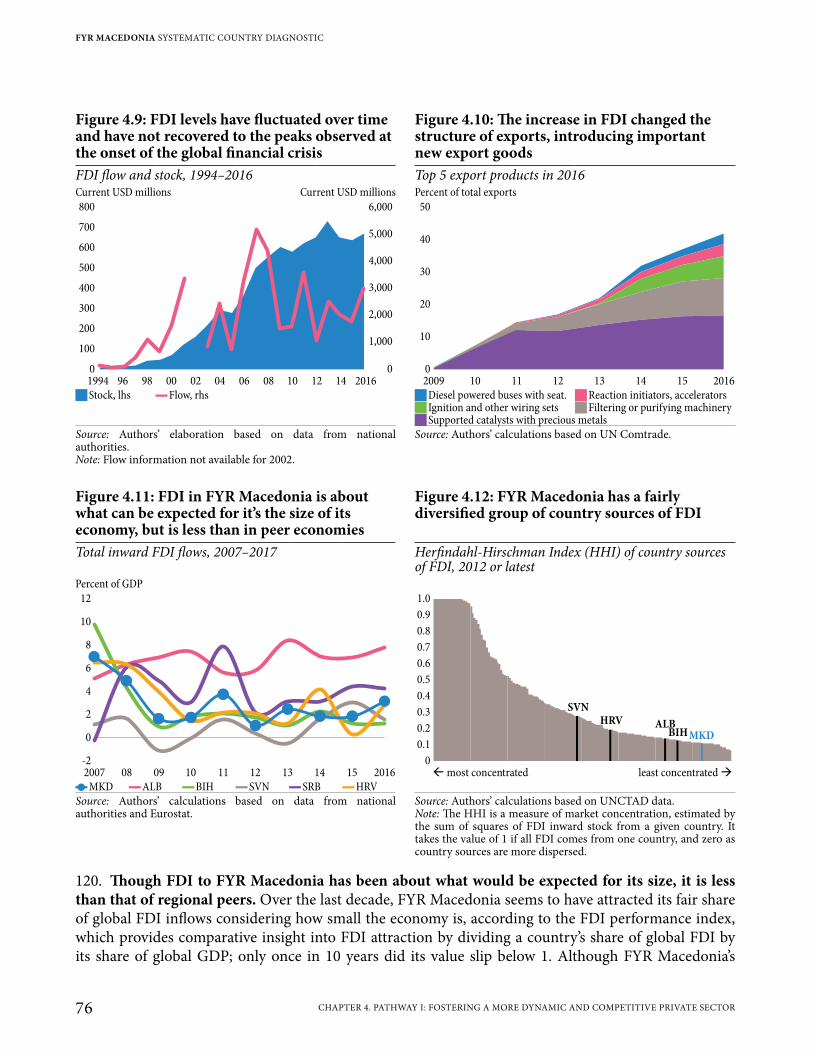
120. Though FDI to FYR Macedonia has been about what would be expected for its size, it is less than that of regional peers. Over the last decade, FYR Macedonia seems to have attracted its fair share of global FDI inflows considering how small the economy is, according to the FDI performance index, which provides comparative insight into FDI attraction by dividing a country’s share of global FDI by its share of global GDP; only once in 10 years did its value slip below 1. Although FYR Macedonia’s
Figure 4.9: FDI levels have fluctuated over time and have not recovered to the peaks observed at the onset of the global financial crisis
Figure 4.10: The increase in FDI changed the structure of exports, introducing important new export goods
FDI flow and stock, 1994–2016 Top 5 export products in 2016Current USD millions Current USD millions Percent of total exports800
700
600
500
400
300
200
100
0
1994 96 98 201600 02 04 06 08 10 12 14
6,000
5,000
4,000
3,000
2,000
1,000
0
50
40
30
20
10
0
2009 10 11 12 13 14 15 2016
JStock, lhs ▬Flow, rhs JDiesel powered buses with seat. JReaction initiators, accelerators J Ignition and other wiring sets JFiltering or purifying machinery JSupported catalysts with precious metals
Source: Authors’ elaboration based on data from national authorities.Note: Flow information not available for 2002.
Source: Authors’ calculations based on UN Comtrade.
Figure 4.11: FDI in FYR Macedonia is about what can be expected for it’s the size of its economy, but is less than in peer economies
Figure 4.12: FYR Macedonia has a fairly diversified group of country sources of FDI
Total inward FDI flows, 2007–2017 Herfindahl-Hirschman Index (HHI) of country sources of FDI, 2012 or latest
Percent of GDP12
10
8
6
4
2
0
-2
2007 10 11 12 13 14 15 20160908
SVNHRV ALB
BIH MKD
1.0
0.9
0.8
0.7
0.6
0.5
0.4
0.3
0.2
0.1
0�most concentrated least concentrated�
▬MKD ▬ALB ▬BIH ▬SVN ▬SRB ▬HRVSource: Authors’ calculations based on data from national authorities and Eurostat.
Source: Authors’ calculations based on UNCTAD data.Note: The HHI is a measure of market concentration, estimated by the sum of squares of FDI inward stock from a given country. It takes the value of 1 if all FDI comes from one country, and zero as country sources are more dispersed.
FYR MACEDONIA SYSTEMATIC COUNTRY DIAGNOSTIC
76 CHAPTER 4. PATHWAY I: FOSTERING A MORE DYNAMIC AND COMPETITIVE PRIVATE SECTOR

performance exceeds that of aspirational peers, like Slovenia, which has usually performed below parity, it is still less than peer economies like Albania or Serbia have been able to attract (Figure 4.11). Where FDI is concerned, FYR Macedonia has room to continue growing.
121. Most of the FDI is greenfield investments from a number of countries. To a large extent, the flows of FDI after the global financial crisis have been directed to greenfield projects (2016 IMF), investments more stable over time in which typically a parent company builds its operations in a foreign country from the ground up, often starting with construction of new production facilities, new distribution hubs, offices, and living quarters. According to fDi Intelligence from the Financial Times, in 2016 FYR Macedonia attracted more than nine times the greenfield investment that could be expected, putting it behind only Serbia and Cambodia among 96 countries.83 For the last decade, the top sources of its greenfield FDI projects have been Turkey, Germany, the United States, and Italy. Most of the Turkish investments have been in foods and textiles; others have been in automotive products, textiles, communications, and electronic components. Before the global financial crisis, greenfield FDI projects
83 Retrieved on 05/23/2018 from: https://www.fdiintelligence.com/Rankings/Serbia-ranks-first-in-2016-greenfield-FDI-Performance-Index.
Knowledge Gap 4.1: What Is the Potential for FYR Macedonia to Integrate into Global Value Chains?
Once concentrated in a few large economies, global flows of goods, services, and capital now reach numerous economies worldwide, creating increasingly dense and complex networks. A major reason has been the rise of global value chains (GVCs). FYR Macedonia’s successful entry into the automotive value chain, after opening borders and attracting FDI, is well-documented. Less well understood is how to integrate GVCs into the national economy to maximize the benefits of trade integration. The main policy challenge is to create and reinforce links between foreign and domestic firms to ensure that the country benefits from technology transfer, knowledge spillovers, and increased value addition. Another challenge is how to use GVC participation to diversify the economy. Over the long term, FYR Macedonia cannot be competitive in GVCs by contributing only a single task (e.g., low-cost assembly); it must offer a bundle of tasks. Diversifying into service tasks within GVCs (e.g., research, testing, software development) could give the country an expansion opportunity that is largely untapped by others.
Measures of GVC participation and domestic value added in trade are not readily available for FYR Macedonia. Two types of data could help inform policy recommendations for GVC integration. Trade in value-added data, like the OECD-WTO TiVA database, estimate the source of value (domestic or foreign, by country and industry) that is added in goods and services produced for export, making it possible to answer questions like: Which countries are sources of foreign value-added used by exporters as inputs? Which countries are the final consumers of value-added in Macedonian exports? Also helpful would be matching firm-level export and import data to balance sheet data to measure direct links in GVCs and provide more granularity for analysis. This type of data makes it possible to answer questions like: Which foreign firms, domestic firms, and country characteristics influence GVC spillovers? Are weak links between foreign and domestic firms the result of low absorptive capacity, a low-quality workforce, or financial constraints?
SEIZING A BRIGHTER FUTURE FOR ALL
77CHAPTER 4. PATHWAY I: FOSTERING A MORE DYNAMIC AND COMPETITIVE PRIVATE SECTOR

had mainly been in construction and trade (Figure 4.13) but automotive products and textiles are now in the lead (Figure 4.14). Among its peers, FYR Macedonia is the least dependent on a small number of FDI source countries. Based on bilateral FDI data, FYR Macedonia has a concentration measure of roughly 0.11 (on a scale of 0 to 1, where 0 is best), which renders it the top performer among comparators in drawing FDI from a diversity of countries (Figure 4.12).
122. Accompanying the FDI-propelled increase in exports has been a rise in imports, driven by the high import content of new export products. Resources like platinum, oil distillates, palladium, and ignition circuits are used mainly by foreign-owned companies for their exports (Figure 4.15). Among peer economies FYR Macedonian exports now have the second highest share after Estonia of total inputs of foreign origin in domestic products (Figure 4.16). The weak connection of export-oriented with local firms illustrates a serious challenge for the country’s export-promotion strategy, however. For instance, automotive catalytic converters are made of combinations of precious metals (platinum, palladium, and rhodium) coated onto the walls of ceramic monolithic structures that are then encased in stainless steel boxes. Platinum, palladium, and ceramic monoliths are among the country’s top 5 imports, accounting for US$1.3 billion, 16 percent of total imports, in 2017.
123. The increase in imports shows the minimal spillover of export-oriented FDI into the economy. Purchases from domestic firms by international investors totaled €48 million for 2016—just 1 percent of that year’s exports. One problem is that local suppliers cannot match the sophistication of imported products. However, managers and staff of export companies point out that local producers are also unable to meet the technical and safety requirements needed to export to the EU.84 Even when support was offered to adjust processes to comply with EU standards, local firms showed little interest.85 The exports
84 Based on selected interviews conducted by the SCD team with private sector representatives and stakeholders.85 Based on interviews with firms located on free trade zones.
Figure 4.13: Most greenfield FDI projects went to construction and trade sectors before the global financial crisis…
Figure 4.14: …but in recent years most greenfield FDI projects have been in automotives and textiles
Greenfield FDI projects by sectors, 2003–2011 Greenfield FDI projects by sectors, 2012–2016
56
19
2
3
41
8
2
3
2
44
11
20
3
4
1
8
7
11
JConstruction and building materials JTrade and retail JAutomotive industry and other transport equipment JFinancial services JPower, utilities, telecomm J IT services J ITC and electronics JTransport and logistics JMachinery and equipment JApparel, textiles, footwear JAutomotive industry and other transport equipment JOther manufacturing JPower, utilities, telecomm JExtractive industry JBusiness services JTransport and logistics JOther sectors J ITC and electronics JOther sectors JTrade and retail
Source: Authors’ calculations based on Financial Times fDi Markets. Source: Authors’ calculations based on Financial Times fDi Markets.
FYR MACEDONIA SYSTEMATIC COUNTRY DIAGNOSTIC
78 CHAPTER 4. PATHWAY I: FOSTERING A MORE DYNAMIC AND COMPETITIVE PRIVATE SECTOR
Box 4.1: Bringing Investment to FYR Macedonia
In recent years the strategy for attracting foreign investment in FYR Macedonia has relied heavily on subsidies and incentives for firms settling in the free economic zones. The zones provide a 10-year corporate tax holiday, and such other incentives as
• Exemption from customs duties or VAT on imported raw materials, equipment, and construction materials
• 0 percent personal income tax for 10 years, unless the contract gets renegotiated • 0 percent property tax • 0 percent excise taxes • Free connection to utilities • Up to €500,000 in subsidies for construction costs • A green-lighted customs channel at the border for expeditious export to EU countries • Land leases for up to 99 years • Grants for training and job creation
While these incentives have attracted a number of firms to the trade zones, the country needs to attract FDI that has more spillovers to the rest of the economy. FYR Macedonia thus needs to attract efficiency-seeking FDI (investments seeking to benefit from factors that enable it to compete in international markets, such as manufacturing or IT services). This type of investment, as opposed to those seeking natural resources or markets, has the most potential for diversifying the economy and transforming economic development. The country will also need to concern itself with investment retention. In today’s global economy, because companies have a multitude of location options, governments must compete to attract the investment mix that will yield the most development benefits. Typically, it is easier to get such benefits from investors already active in the economy. Current investors account for a significant share of total annual FDI inflows in the form of both new investments and reinvested earnings—between 2007 and 2015, reinvested earnings grew from less than 30 percent of FDI flows to about 50 percent.a
a UNCTAD (2016). Source: Authors based on IMF (2015).
Knowledge Gap 4.2: How to Promote Stronger Links Between Local Firms to Export-Oriented FDI?
The evidence suggests that upstream linkages of firms in the Special Economic Zones with domestic firms are limited and that most SEZ firms have both high imports and high exports, with limited productivity spillovers to domestic firms. Integration into the value chains of productive firms within the SEZ could be a lucrative opportunity for domestic firms and could encourage further productivity growth. A better understanding of the linkages between FDI-supported and domestic firms and how they contribute to productivity growth in domestic firms is critical for accurately assessing the current FDI promotion strategy.
SEIZING A BRIGHTER FUTURE FOR ALL
79CHAPTER 4. PATHWAY I: FOSTERING A MORE DYNAMIC AND COMPETITIVE PRIVATE SECTOR

produced by domestic SMEs thus go mainly to neighboring countries, with limited opportunities, or need, to integrate with European supply chains. A discussion on how to improve firm capabilities, as is necessary if the country is to become innovative, is presented in sub-section 4.3.
124. Since the mid-1990s exports of services have continuously expanded, but their share in total exports is still small. Services exports have mainly consisted of manufacturing services for inputs owned by others and the transport and logistics sub-sectors (Figure 4.17). Despite robust growth for the past decade, in 2017 services contributed only 25 percent of the value of FYR Macedonia’s export basket,
Figure 4.15: The most important imports are products incorporated into export products
Figure 4.16: Export-oriented firms do not rely on local suppliers
Distribution by products, top 33 percent of value of imports, 2016
Proportion of total inputs of foreign origin, 2013
Oils petroleum,bituminous, distillates,
except crude
Platinum unwroughtor in powder form
Ceramic laboratory &technical ware
except porcelain
Palladiumunwrought
or in powderform
Electricalenergy
Medium DieselEngine Cars
Chemical industryproducts,
preparations,mixtures ne
Ignition/otherwiring sets
for vehicles/aircra�/ship
Transmit-receive
apparatusfor radio,TV, etc.
Medicamentsnes, in dosage
Hot rolled ironor non-alloy steel,
coil, width>600mm,
t <3mm thick,ne
Electricconductors,
80–1,000volts, no
connectors
Commo-ditiesnot
specifiedaccording
to kind
Road tractorsfor semi-trailers(truck tractors)
Parts forfilter/purifyingmachines for
liquid/gas
Non-ex orterpExporter
AllALB
MNESRBBIHEST
SVN
BGRSVK
HRVLVALTU
57.7
70.8
5 .74
50.1
47.2
36.2
34.3
70.1
46.5
46.3
44.5
44.1
35.8
34.0
JMKD JStructural peers JAspirational peersSource: Authors’ calculations based on UN Comtrade. Source: Authors’ calculations based on World Bank Enterprise
Surveys.
Figure 4.17: Manufacturing services, transport, and travel are the most important services exports, andmost subsectors have grown in recent years
Figure 4.18: FYR Macedonia’s services trade ranks close to the average of structural and aspirational peers
Services exports, 2014; and annualized growth, 1996–2006, 2006–2014; by subsector
Trade (exports plus imports) in services, 2015
US$ millions Annualized growth rate Percentage GDP500 25
20400 15
10300 5
0200-5
-10100-15
0 -20
Man
ufact
ur.
Transp
ort
Trave
l
Other
busines
s
Telec
,
omm
.
com
puter &
info
.
Construct
ion
Perso
nal, cu
ltura
l
eatio
nal
& recr
Inte
llectu
al pro
p.
Govern
men
t
Finan
cial
Main
tenan
ce
& repair
100
90
80
70
60
50
40
30
20
10
0
6 7 8 9 10 11 12
Log (GDP per capita) �96–06 Q06–14 QMKD �Structural peers JAspirational peers
Source: Authors’ calculations based on UN Comtrade. Source: Author’s elaboration based on WDI.
FYR MACEDONIA SYSTEMATIC COUNTRY DIAGNOSTIC
80 CHAPTER 4. PATHWAY I: FOSTERING A MORE DYNAMIC AND COMPETITIVE PRIVATE SECTOR

down from close to 40 percent in 2003. This puts FYR Macedonia close to the average of structural and aspirational peers for trade as a share of GDP (Figure 4.18).
125. The increase in FDI-driven exports has concentrated 47 percent of Macedonian exports in a single market, Germany. The country’s next largest market is Serbia, which accounts for a mere 9 percent of exports (Figure 4.19). The top-10 list of destinations is completed by Belgium, Italy, Greece, Romania, Spain, Croatia, and Bosnia and Herzegovina. Together the 10 receive more than 80 percent of Macedonian exports. Its dependence on Germany as a market, however, is a source of vulnerability for FYR Macedonia. The Herfindahl-Hirschman Index (HHI) of country destinations, in which FYR Macedonia ranks second behind Albania among structural and aspirational peers, also emphasizes its concentration on Germany (Figure 4.20)—when the top 5 automotive-related exports (most of which go to Germany) are removed, the destination concentration
diminishes considerably. A product-level analysis shows that without the top automotive-related exports, the concentration is similarly lower and diminishes considerably, which suggests greater diversification of products than markets (Figure 4.21). Exporting more products to more markets would make Macedonian exports less vulnerable to shocks.
Figure 4.19: The increase in exports driven by FDI has also led to a concentration of exports in destination markets not previously seen in FYR Macedonia’s independent historyExport destination markets, 1995–2016US$ billions
6
5
4
3
2
1
0
1995 1998 2001 2004 2007 2010 2013 2016
SRB
ITA
YUG GRC DEU
CZE
BGR
Source: Authors’ calculations based on UN Comtrade.
Figure 4.20: The high concentration in FYR Macedonia market destinations is driven by automotive-related exports
Figure 4.21: However, product concentration is lower, and also diminishes considerably when the 5 most important automotive exports are excluded
Herfindahl-Hirschman Index of country destinations; 2010, 2016
Herfindahl-Hirschman Index of export products; 2010, 2016
0.35
0.30
0.25
0.20
0.15
0.10
0.5
0
ALBM
KD
JAM
PRYJO
RM
USSVK
EST
MK
D*BIH LV
ASVN
HRVSR
BSE
NLT
UBGR
GEO
0.25
0.20
0.15
0.10
0.5
0
JAM
PRYGEO
MUS
MK
DSE
NJO
RALB
SVKEST LT
UM
KD
*LV
ABIH
BGRSVN
SRB
HRV
J2016 Q2010 J2016 Q2010Source: Authors’ calculations based on UN Comtrade.Note: MKD* excludes the top 5 automotive-related export products.
Source: Authors’ calculations based on UN Comtrade.Note: MKD* excludes the top 5 automotive-related export products.
SEIZING A BRIGHTER FUTURE FOR ALL
81CHAPTER 4. PATHWAY I: FOSTERING A MORE DYNAMIC AND COMPETITIVE PRIVATE SECTOR
126. FYR Macedonia has an opportunity to raise both the volume and the value of its exports. Despite improvements since the 1990s, its economy is still less open than those of aspirational peers (Figure 4.22). For example, Slovakia, Lithuania, and Estonia all have considerably larger trade flows. This indicates an opportunity to expand the country’s exports by exporting more goods (extensive margin) and by raising their value (intensive margin).
127. FYR Macedonia has considerable room to increase the volume of exports to the EU. The increase in exports in recent years and the dominance of Germany as a market, and to a lesser extent Belgium, Italy, Greece and other EU countries, has intensified the country’s trade with the EU, but it could send more. Estimates of the per capita value of goods exported to the EU from FYR Macedonia and its aspirational peers, which are all EU members, put FYR Macedonia near the bottom with Croatia and Bulgaria (Figure 4.23). Best performers like Slovakia and Slovenia export more than five times as much to the EU per capita as FYR Macedonia. The relative size of the EU economy—more than 1,500 times larger than the Macedonian—makes it clear that the EU economy can absorb major expansion of export volumes for the foreseeable future.
128. FYR Macedonia also has potential to deepen its integration with the Western Balkans. In 2016 the share of its exports to Western Balkan countries was only 12.5 percent of total exports. Since this is similar to other countries in the region, except for Montenegro86 (Figure 4.24), it suggests an opportunity to deepen their integration. This would allow those countries not only to expand their local markets but also to better position themselves to enter European and global production networks, as is crucial particularly for heightening manufacturing productivity.87 FYR Macedonia can use existing regional trade agreements to scale up its participation in major European value chains (see Box 4.2).
86 Western Balkan markets constitute 40 percent of Montenegro’s exports.87 World Bank (2017c), Revving Up the Engines for Growth and Prosperity in the Western Balkans.
Figure 4.22: FYR Macedonia’ progress in integration into global markets is not yet suficient for it to catch up with aspirational peers
Figure 4.23: FYR Macedonia still trails considerably in terms of exports per capita to the EU
GDP per capita and trade, 1995–2015 Exports of goods per capita to EU-28, 2016, nominal euros
Total trade, percentage of GDP200
150
100
50
0
10.56.5 7.5 8.5 9.5
SVK
LTU ESTSVN
LVA
HRVMUSPRY
JOR
ALB
SRB
BIH
GEO
BGRMKD
SVK SVN EST LTU LVA BGR MKD HRV
11
,01
6.3
10
,84
6.6
6,6
92
.9
4,8
17
.9
3,9
22
.2
2,2
43
.2
2,0
35
.5
1,9
69
.8
Log (GDP per capita) ▬MYR Macedonia ▬Structural peers ▬Aspirational peers
Source: Authors’ calculations based on WDI. Source: Authors’ calculations based on Eurostat data.
FYR MACEDONIA SYSTEMATIC COUNTRY DIAGNOSTIC
82 CHAPTER 4. PATHWAY I: FOSTERING A MORE DYNAMIC AND COMPETITIVE PRIVATE SECTOR
The country depends on the EU for close to 80 percent of its exports, while the CEFTA accounts for only about 10 percent. The global value chains for the clothing, machinery, and automotive subsectors export a small fraction to CEFTA, and about 90 percent of their intermediate imports from non-CEFTA countries. Moreover, most FDI related to global value chains comes from non-CEFTA countries.
Figure 4.24: Limited trade between Western Balkan countries signals an opportunity for deeper integration
Figure 4.25: There is room for FYR Macedonia to increase its export markets and the quantity of its export products
Export destination markets, Western Balkan countries, 2016
Number of countries and products, 2016
ALB BIHMKD MNESRB
100
90
80
70
60
50
40
30
20
10
0
5,000
4,000
3,000
2,000
1,000
0
2500 50 100 200150
ALB
MNE
BIH
SRB
LVAHRV
ESTLTU
SVKSVNBGR
JAM PRY
GEO JORMUS
MKD
JWB5 JEU JTUR QAll countries JMKD JRest of ECA JRest of Asia JOther countries �Aspirational peers JStructural peers
Source: Authors’ calculations based on WITS data. Source: Authors’ calculations based on UN Comtrade data.
Box 4.2: Opportunities for Growth for FYR Macedonia Through Regional Economic Integration
The most important trade objective for FYR Macedonia and its Western Balkans neighbors is to deepen their integration with the European Union, which offers unparalleled business opportunities. However, integration of the Western Balkans economies can offer myriad opportunities for fostering economic growth that those countries cannot afford to ignore. Although their economies are similar in terms of natural resources, human capital, and demographic profiles, deepening economic integration within the Western Balkans would have the obvious advantage of increasing the size of local markets, which would make the economies more attractive to foreign investment and heighten competition for local firms, which in turn can push up productivity. But the most important opportunities for growth do not come from this effect.
Deepening economic integration, not only in trade but also in other areas of the economy, such as financial, energy, and digital markets; and physical transport infrastructure, among other areas, can contribute critically to political and institutional stability by forcing local institutions to follow supranational regulations and intensifying the rule of law. Regional integration can also reduce risks and vulnerabilities by helping the countries to pool their risks. Finally, and probably most important, it can support the EU accession process by paving the way for adoption of agreements consistent with EU regulations. Source: Authors based on World Bank (2017f), “Western Balkans: Regional Economic Integration Issues Notes.”
SEIZING A BRIGHTER FUTURE FOR ALL
83CHAPTER 4. PATHWAY I: FOSTERING A MORE DYNAMIC AND COMPETITIVE PRIVATE SECTOR
129. Compared with most aspirational peer countries, FYR Macedonia has few export markets and products. Although the concentration of destination countries is high and the diversification of export products reasonable, the numbers of countries reached and products produced are still lower than aspirational and some structural peers (Figure 4.25). A small economy like FYR Macedonia can reach far more export markets than it currently does. Moreover, its export basket is less diversified than those of similarly small countries. FYR Macedonia’s products are somewhat diverse but far less than those of aspirational peers like Latvia, Slovenia, or Estonia (Figure 4.26). The colored dots in Figure 4.26 representing products exported by the three economies are more widespread, signaling a more diverse basket of exports.
4.1.2 Logistics Are Still Not Conducive to Exporting
130. Although FYR Macedonia’s success as an exporting country hinges on the quality of its hard and soft export infrastructure, its logistics performance indicators are worrisome. To expand and sustain the volume of exports needed to become a high-income country, FYR Macedonia needs to go beyond trade agreements (“from the borders out”) and create world-class hard and soft local infrastructure (“from the borders in”). The World Bank’s Logistics Performance Indicator (LPI), a
Figure 4.26: FYR Macedonia’s export basket is somewhat diversified, but it still trails aspirational peers like Latvia, Slovenia or EstoniaProduct space analysis, 2016Panel A: FYR Macedonia Panel B: Latvia
Panel C: Slovenia Panel D: Estonia
Source: The Observatory of Economic Complexity, MIT Media Lab. Retreived on 05/23/2018.Note: The Product Space shows the concept of proximity by illustrating how closely-related are the products traded in the global economy.
FYR MACEDONIA SYSTEMATIC COUNTRY DIAGNOSTIC
84 CHAPTER 4. PATHWAY I: FOSTERING A MORE DYNAMIC AND COMPETITIVE PRIVATE SECTOR

measure of how conducive a country’s infrastructure is to facilitating exports, shows troubling results for FYR Macedonia. The LPI collects data on six areas, grouped into two categories: (1) inputs or areas for policy: hard infrastructure, customs efficiency, and the quality of logistics services, and (2) outcomes or service-delivery indicators: timeliness, ease of arranging international shipments, and the reliability of shipment tracking and tracing tools. In 2016 FYR Macedonia ranked 106th of 160 countries on the LPI, below all aspirational peers and most structural peers (Figure 4.27). Its scores were especially low on customs and the quality of logistics.
131. FYR Macedonia performs significantly worse than peer countries in customs efficiency. Its lowest score (2.21 out of 5) was on the efficiency of customs and border management clearance—a problem that has been confirmed by others. For instance, the 2016 Balkan Barometer found that FYR Macedonia had the most exporting firms concerned and the highest average in days to clear customs in the Western Balkans: 83 percent of firms reported it took over 5 days to clear customs and only 8 percent reported 2 days, the shortest time.
132. The cost of customs clearance red tape is a burden on firms, and on productivity. The World Bank’s 2018 Doing Business reports that border compliance costs exporters 9 hours—one working day and documentary compliance takes 103 hours—nearly 13 days—compared with an average of just 1.6 hours among aspirational peers. In fact, it costs a firm in FYR Macedonia an average of US$148 to complete export procedures, compared with US$54 for firms in aspirational peers. Meanwhile, border and documentary compliance takes importers more than 10 hours at an average cost of about US$200. More efficient customs clearance can have direct positive effects on firm productivity, as shown in Chapter 3: for each additional day a median firm in FYR Macedonia spends clearing customs, its productivity falls by 8.6 percent.
133. Outdated technology and lack of agency coordination worsen logistics. In FYR Macedonia, cross-border traders must produce hard copies of documents and certificates to obtain licenses and permits and undergo unnecessary physical examinations or inspections of shipments. A recent IFC analysis found that the government’s single-window system (ExIM) is customs-centric and needs to be adjusted to be equally convenient for other agencies that must use it.88 According to a 2015 study by the Macedonian Customs Administration, the current paper exchange of information and documents should be done electronically to reduce time and costs, especially for traders in the terminal.89 Other border agencies, such as the State Agriculture Inspectorate, the State Sanitary and Health Inspectorate, and the Food and Veterinary Agency, should also streamline their procedures to expedite movement
88 In 2014, the IFC Western Balkans Trade Logistics Project (WBTLP), as part of the World Bank Programmatic Competitiveness Development Policy Loan series, examined the ExIM system.
89 In cooperation with the World Customs Organization (WCO) and with support from USAID, the Customs Administration conducted a time-release study based on WCO methodology, See: Customs Administration of the Republic of Macedonia, 2015.
Figure 4.27: FYR Macedonia trails aspirational peers and most structural peers in logistics performanceLogistics performance index, 20164.5
4.0
3.5
3.0
2.5
2.0
1.5
Overall
Infrastru
cture
Customs
Logistics quality
Timelin
ess
Int'l. shipments
Tracking
JMKD QStructural peers QAspirational peersSource: World Bank’s 2016 Logistics Performance Indicators.
SEIZING A BRIGHTER FUTURE FOR ALL
85CHAPTER 4. PATHWAY I: FOSTERING A MORE DYNAMIC AND COMPETITIVE PRIVATE SECTOR
of goods. This is an area where reforms can bring considerable potential gains. As noticed by a small exporter interviewed: “Rail infrastructure rehabilitation saved 15 minutes, but then we wait 11 hours at the border crossing post.”90
134. Non-tariff barriers also cause delays in clearing customs. A 2016 review of nontariff barriers in CEFTA by the German development agency GIZ found nonrecognition of certificates (double testing) to be the worst non-tariff obstacle to trade.91 In all CEFTA countries, consignments of goods traded across borders are accompanied by documents proving that a variety of tests related to product quality and safety have been performed. However, authorities in importing countries still carry out their own tests, which add costs and delays.92 Inspections, differential treatment, and other nontariff barriers also push up costs for exporters.
135. The quality of the country’s logistics services is not good. FYR Macedonia underperforms aspirational peers and even most structural peers on the competence and quality of its logistics services: road, rail, and air transport; warehousing, transloading, and distribution; freight forwarders; customs brokers; trade and transport associations; and consignees or shippers. The low quality of services is consistent with the low capabilities of domestic firms. Inefficient customs procedures may also be at the root of inefficient logistics services. For instance, due to border waiting times and compliance procedures, the inventory carrying costs for international trucks can be as much as 10 times that of domestic trucks. The border crossing delays imply that FYR Macedonia needs five times as many trucks and drivers as the average EU country. This affects overall logistical efficiency, resulting in more empty backhauls, longer and uncertain delivery times, and ultimately higher logistics costs, which could be as much as 1 percent of GDP.93
136. FYR Macedonia could boost services exports by removing nontariff barriers and promoting intraregional integration. While the country’s trade in services is relatively open compared with peer countries, authorities could do more to increase the share of services in total exports. Tourism and transport constitute close to 40 percent of FYR Macedonia’s services exports and could well increase, since the country is so close to the EU and it does not have significant nontariff service barriers. Manufacturing services on physical inputs owned by others, which currently represents close to 25 percent of total services exports, can continue growing because their development is closely related to the inflow of export-oriented FDI. Telecommunications and computer and other information services, along with other business services, represent close to 25 percent of service exports and could also be expanded. Conscious of the potential to increase services exports and the positive economic spillovers from regional agglomeration of activities in both innovation-driven industries and high-tech services, Western Balkan countries are cooperating to jointly propose measures to enhance export-oriented services94 by, for example, (a) removing obstacles to the mobility of professionals through mutual recognition agreements of qualifications (for example, doctors of medicine, dentists, architects, and civil
90 Quote from a member of FYR Macedonia’s Transport Association.91 Trade Facilitation and Non-Tariff Measures in Beverages and Auto-Parts Supply Chains in CEFTA Regional Analysis and Policy
Recommendations, Gesellschaft für Internationale Zusammenarbeit (GIZ) GmbH, April 2016.92 The GIZ report focuses on wine and beer, but private sector representatives consulted confirmed that the findings also apply to other
product areas.93 World Bank (2015b), The Regional Balkans Infrastructure Study (REBIS) Update.94 Consolidated Multi-Annual Action Plan for a Regional Economic Area in the Western Balkans Six. 2017.
FYR MACEDONIA SYSTEMATIC COUNTRY DIAGNOSTIC
86 CHAPTER 4. PATHWAY I: FOSTERING A MORE DYNAMIC AND COMPETITIVE PRIVATE SECTOR
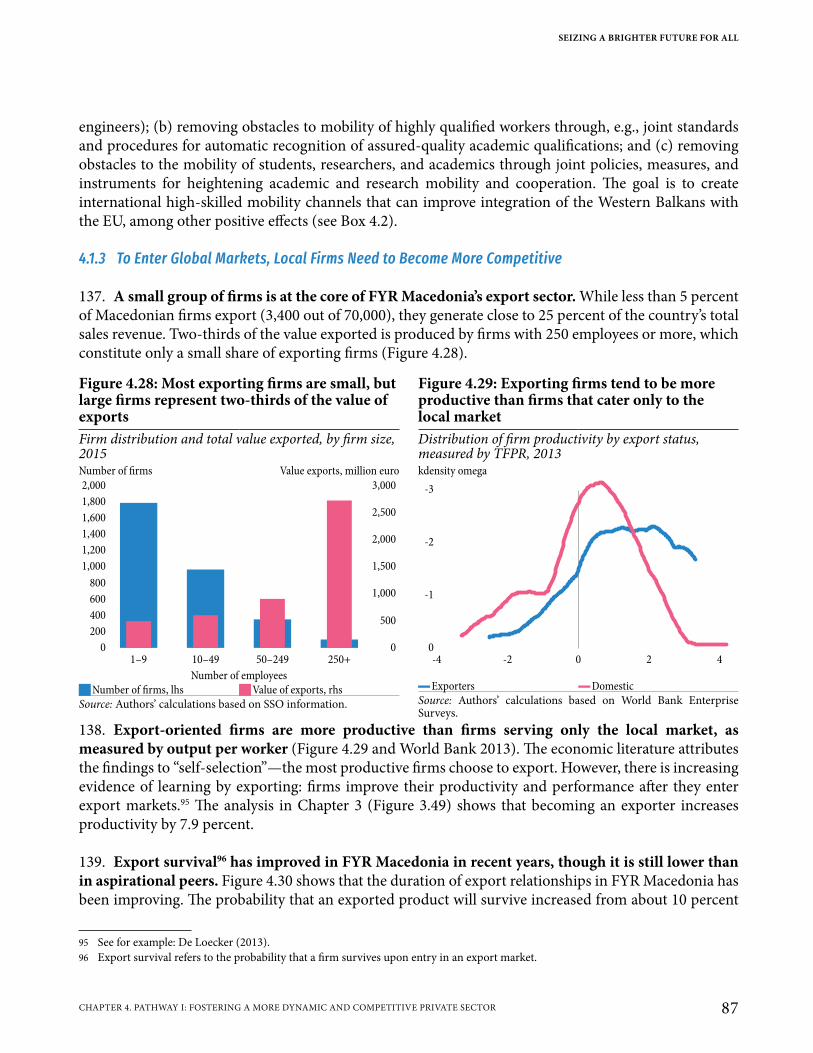
engineers); (b) removing obstacles to mobility of highly qualified workers through, e.g., joint standards and procedures for automatic recognition of assured-quality academic qualifications; and (c) removing obstacles to the mobility of students, researchers, and academics through joint policies, measures, and instruments for heightening academic and research mobility and cooperation. The goal is to create international high-skilled mobility channels that can improve integration of the Western Balkans with the EU, among other positive effects (see Box 4.2).
4.1.3 To Enter Global Markets, Local Firms Need to Become More Competitive
137. A small group of firms is at the core of FYR Macedonia’s export sector. While less than 5 percent of Macedonian firms export (3,400 out of 70,000), they generate close to 25 percent of the country’s total sales revenue. Two-thirds of the value exported is produced by firms with 250 employees or more, which constitute only a small share of exporting firms (Figure 4.28).
138. Export-oriented firms are more productive than firms serving only the local market, as measured by output per worker (Figure 4.29 and World Bank 2013). The economic literature attributes the findings to “self-selection”—the most productive firms choose to export. However, there is increasing evidence of learning by exporting: firms improve their productivity and performance after they enter export markets.95 The analysis in Chapter 3 (Figure 3.49) shows that becoming an exporter increases productivity by 7.9 percent.
139. Export survival96 has improved in FYR Macedonia in recent years, though it is still lower than in aspirational peers. Figure 4.30 shows that the duration of export relationships in FYR Macedonia has been improving. The probability that an exported product will survive increased from about 10 percent
95 See for example: De Loecker (2013).96 Export survival refers to the probability that a firm survives upon entry in an export market.
Figure 4.28: Most exporting firms are small, but large firms represent two-thirds of the value of exportsFirm distribution and total value exported, by firm size, 2015Number of firms Value exports, million euro2,000 3,000
1,800
2,5001,600
2,0001,400
1,500
1,200
1,000
1,000
800
600
400
200
500
0 0
1–9 10–49 50–249 250+
Number of employees JNumber of firms, lhs JValue of exports, rhs
Source: Authors’ calculations based on SSO information.
Figure 4.29: Exporting firms tend to be more productive than firms that cater only to the local marketDistribution of firm productivity by export status, measured by TFPR, 2013kdensity omega
-3
-2
-1
0
4-4 -2 0 2
▬Exporters ▬DomesticSource: Authors’ calculations based on World Bank Enterprise Surveys.
SEIZING A BRIGHTER FUTURE FOR ALL
87CHAPTER 4. PATHWAY I: FOSTERING A MORE DYNAMIC AND COMPETITIVE PRIVATE SECTOR
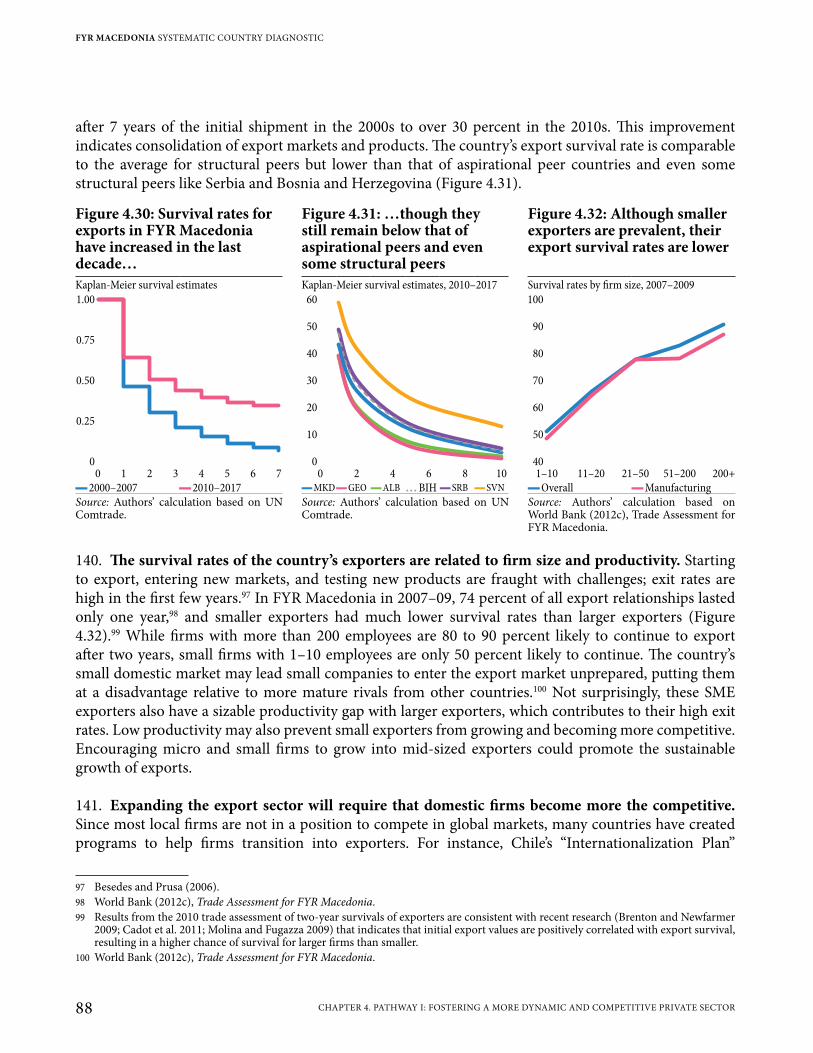
after 7 years of the initial shipment in the 2000s to over 30 percent in the 2010s. This improvement indicates consolidation of export markets and products. The country’s export survival rate is comparable to the average for structural peers but lower than that of aspirational peer countries and even some structural peers like Serbia and Bosnia and Herzegovina (Figure 4.31).
140. The survival rates of the country’s exporters are related to firm size and productivity. Starting to export, entering new markets, and testing new products are fraught with challenges; exit rates are high in the first few years.97 In FYR Macedonia in 2007–09, 74 percent of all export relationships lasted only one year,98 and smaller exporters had much lower survival rates than larger exporters (Figure 4.32).99 While firms with more than 200 employees are 80 to 90 percent likely to continue to export after two years, small firms with 1–10 employees are only 50 percent likely to continue. The country’s small domestic market may lead small companies to enter the export market unprepared, putting them at a disadvantage relative to more mature rivals from other countries.100 Not surprisingly, these SME exporters also have a sizable productivity gap with larger exporters, which contributes to their high exit rates. Low productivity may also prevent small exporters from growing and becoming more competitive. Encouraging micro and small firms to grow into mid-sized exporters could promote the sustainable growth of exports.
141. Expanding the export sector will require that domestic firms become more the competitive. Since most local firms are not in a position to compete in global markets, many countries have created programs to help firms transition into exporters. For instance, Chile’s “Internationalization Plan”
97 Besedes and Prusa (2006).98 World Bank (2012c), Trade Assessment for FYR Macedonia.99 Results from the 2010 trade assessment of two-year survivals of exporters are consistent with recent research (Brenton and Newfarmer
2009; Cadot et al. 2011; Molina and Fugazza 2009) that indicates that initial export values are positively correlated with export survival, resulting in a higher chance of survival for larger firms than smaller.
100 World Bank (2012c), Trade Assessment for FYR Macedonia.
Figure 4.30: Survival rates for exports in FYR Macedonia have increased in the last decade…
Figure 4.31: …though they still remain below that of aspirational peers and even some structural peers
Figure 4.32: Although smaller exporters are prevalent, their export survival rates are lower
Kaplan-Meier survival estimates Kaplan-Meier survival estimates, 2010–2017 Survival rates by firm size, 2007–20091.00
0.75
0.50
0.25
0
760 1 32 54
60
50
40
30
20
10
0
1080 2 4 6
100
90
80
70
60
50
40
200+1–10 11–20 21–50 51–200
▬2000–2007 ▬2010–2017 ▬MKD ▬GEO ▬ALB … BIH ▬SRB ▬SVN ▬Overall ▬ManufacturingSource: Authors’ calculation based on UN Comtrade.
Source: Authors’ calculation based on UN Comtrade.
Source: Authors’ calculation based on World Bank (2012c), Trade Assessment for FYR Macedonia.
FYR MACEDONIA SYSTEMATIC COUNTRY DIAGNOSTIC
88 CHAPTER 4. PATHWAY I: FOSTERING A MORE DYNAMIC AND COMPETITIVE PRIVATE SECTOR
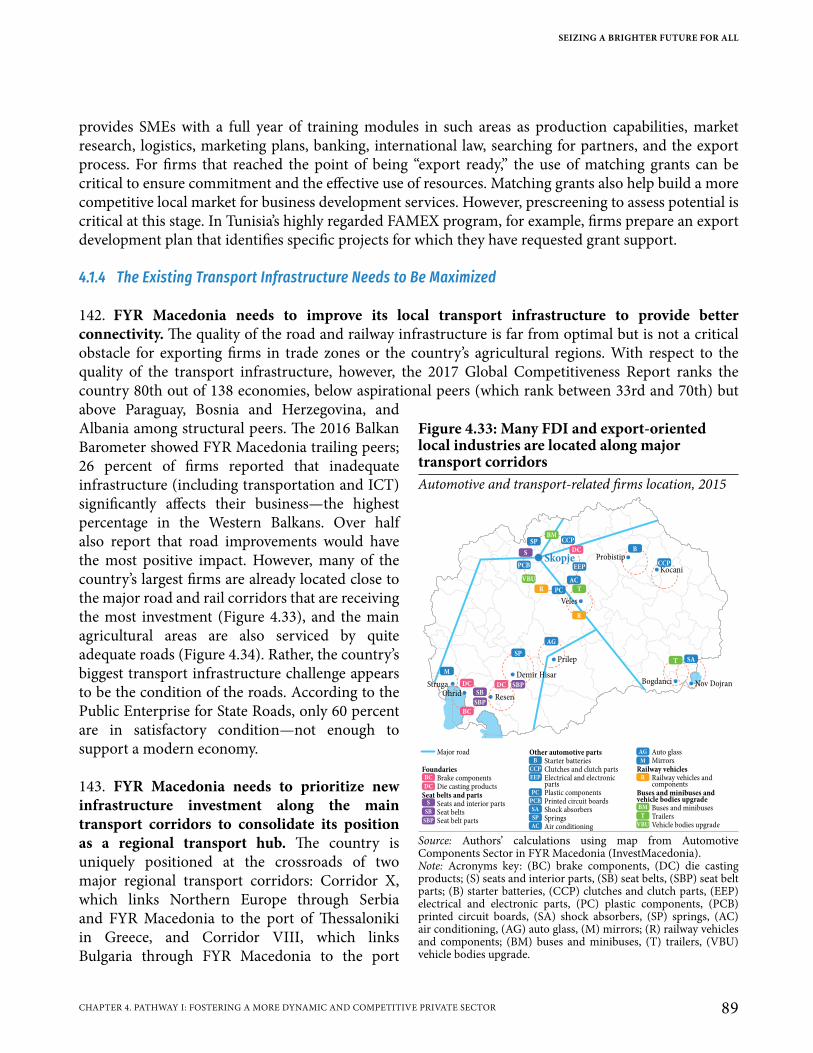
provides SMEs with a full year of training modules in such areas as production capabilities, market research, logistics, marketing plans, banking, international law, searching for partners, and the export process. For firms that reached the point of being “export ready,” the use of matching grants can be critical to ensure commitment and the effective use of resources. Matching grants also help build a more competitive local market for business development services. However, prescreening to assess potential is critical at this stage. In Tunisia’s highly regarded FAMEx program, for example, firms prepare an export development plan that identifies specific projects for which they have requested grant support.
4.1.4 The Existing Transport Infrastructure Needs to Be Maximized
142. FYR Macedonia needs to improve its local transport infrastructure to provide better connectivity. The quality of the road and railway infrastructure is far from optimal but is not a critical obstacle for exporting firms in trade zones or the country’s agricultural regions. With respect to the quality of the transport infrastructure, however, the 2017 Global Competitiveness Report ranks the country 80th out of 138 economies, below aspirational peers (which rank between 33rd and 70th) but above Paraguay, Bosnia and Herzegovina, and Albania among structural peers. The 2016 Balkan Barometer showed FYR Macedonia trailing peers; 26 percent of firms reported that inadequate infrastructure (including transportation and ICT) significantly affects their business—the highest percentage in the Western Balkans. Over half also report that road improvements would have the most positive impact. However, many of the country’s largest firms are already located close to the major road and rail corridors that are receiving the most investment (Figure 4.33), and the main agricultural areas are also serviced by quite adequate roads (Figure 4.34). Rather, the country’s biggest transport infrastructure challenge appears to be the condition of the roads. According to the Public Enterprise for State Roads, only 60 percent are in satisfactory condition—not enough to support a modern economy.
143. FYR Macedonia needs to prioritize new infrastructure investment along the main transport corridors to consolidate its position as a regional transport hub. The country is uniquely positioned at the crossroads of two major regional transport corridors: Corridor x, which links Northern Europe through Serbia and FYR Macedonia to the port of Thessaloniki in Greece, and Corridor VIII, which links Bulgaria through FYR Macedonia to the port
Figure 4.33: Many FDI and export-oriented local industries are located along major transport corridorsAutomotive and transport-related firms location, 2015
Skopje
Demir Hisar
Major road
Brake componentsDie casting products
Seat belts and partsSeats and interior parts
Foundaries
Plastic components
Mirrors
Electrical and electronicparts
Railway vehiclesStarter batteries
Seat belt parts
Other automotive parts
Seat belts Shock absorbersPrinted circuit boards
Vehicle bodies upgrade
Auto glass
Railway vehicles andcomponents
Springs
Buses and minibuses andvehicle bodies upgrade
Trailers
Clutches and clutch parts
Buses and minibuses
Air conditioning
SAT
Bogdanci Nov Dojran
AG
SPPrilep
DC
Resen
M
Struga DC
BC
SBP
SBOhridSBP
CCP
BProbistip
Kocani
T
R
Veles
BMCCP
DC
EEP
AC
PCR
VBU
PCB
S
SP
BC
DC
S
SB
SBP
B
CCP
EEP
PC
PCB
SA
SP
AC
AG
M
R
BM
T
VBU
Source: Authors’ calculations using map from Automotive Components Sector in FYR Macedonia (InvestMacedonia).Note: Acronyms key: (BC) brake components, (DC) die casting products; (S) seats and interior parts, (SB) seat belts, (SBP) seat belt parts; (B) starter batteries, (CCP) clutches and clutch parts, (EEP) electrical and electronic parts, (PC) plastic components, (PCB) printed circuit boards, (SA) shock absorbers, (SP) springs, (AC) air conditioning, (AG) auto glass, (M) mirrors; (R) railway vehicles and components; (BM) buses and minibuses, (T) trailers, (VBU) vehicle bodies upgrade.
SEIZING A BRIGHTER FUTURE FOR ALL
89CHAPTER 4. PATHWAY I: FOSTERING A MORE DYNAMIC AND COMPETITIVE PRIVATE SECTOR
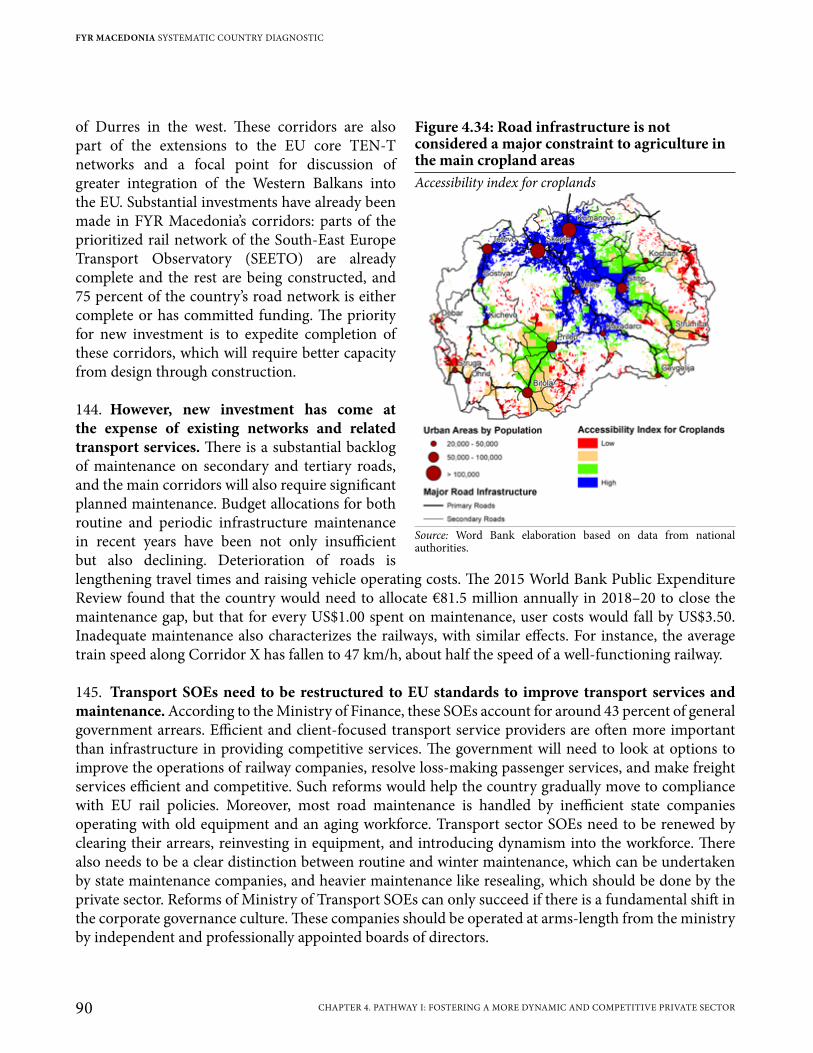
of Durres in the west. These corridors are also part of the extensions to the EU core TEN-T networks and a focal point for discussion of greater integration of the Western Balkans into the EU. Substantial investments have already been made in FYR Macedonia’s corridors: parts of the prioritized rail network of the South-East Europe Transport Observatory (SEETO) are already complete and the rest are being constructed, and 75 percent of the country’s road network is either complete or has committed funding. The priority for new investment is to expedite completion of these corridors, which will require better capacity from design through construction.
144. However, new investment has come at the expense of existing networks and related transport services. There is a substantial backlog of maintenance on secondary and tertiary roads, and the main corridors will also require significant planned maintenance. Budget allocations for both routine and periodic infrastructure maintenance in recent years have been not only insufficient but also declining. Deterioration of roads is lengthening travel times and raising vehicle operating costs. The 2015 World Bank Public Expenditure Review found that the country would need to allocate €81.5 million annually in 2018–20 to close the maintenance gap, but that for every US$1.00 spent on maintenance, user costs would fall by US$3.50. Inadequate maintenance also characterizes the railways, with similar effects. For instance, the average train speed along Corridor x has fallen to 47 km/h, about half the speed of a well-functioning railway.
145. Transport SOEs need to be restructured to EU standards to improve transport services and maintenance. According to the Ministry of Finance, these SOEs account for around 43 percent of general government arrears. Efficient and client-focused transport service providers are often more important than infrastructure in providing competitive services. The government will need to look at options to improve the operations of railway companies, resolve loss-making passenger services, and make freight services efficient and competitive. Such reforms would help the country gradually move to compliance with EU rail policies. Moreover, most road maintenance is handled by inefficient state companies operating with old equipment and an aging workforce. Transport sector SOEs need to be renewed by clearing their arrears, reinvesting in equipment, and introducing dynamism into the workforce. There also needs to be a clear distinction between routine and winter maintenance, which can be undertaken by state maintenance companies, and heavier maintenance like resealing, which should be done by the private sector. Reforms of Ministry of Transport SOEs can only succeed if there is a fundamental shift in the corporate governance culture. These companies should be operated at arms-length from the ministry by independent and professionally appointed boards of directors.
Figure 4.34: Road infrastructure is not considered a major constraint to agriculture in the main cropland areasAccessibility index for croplands
Source: Word Bank elaboration based on data from national authorities.
FYR MACEDONIA SYSTEMATIC COUNTRY DIAGNOSTIC
90 CHAPTER 4. PATHWAY I: FOSTERING A MORE DYNAMIC AND COMPETITIVE PRIVATE SECTOR
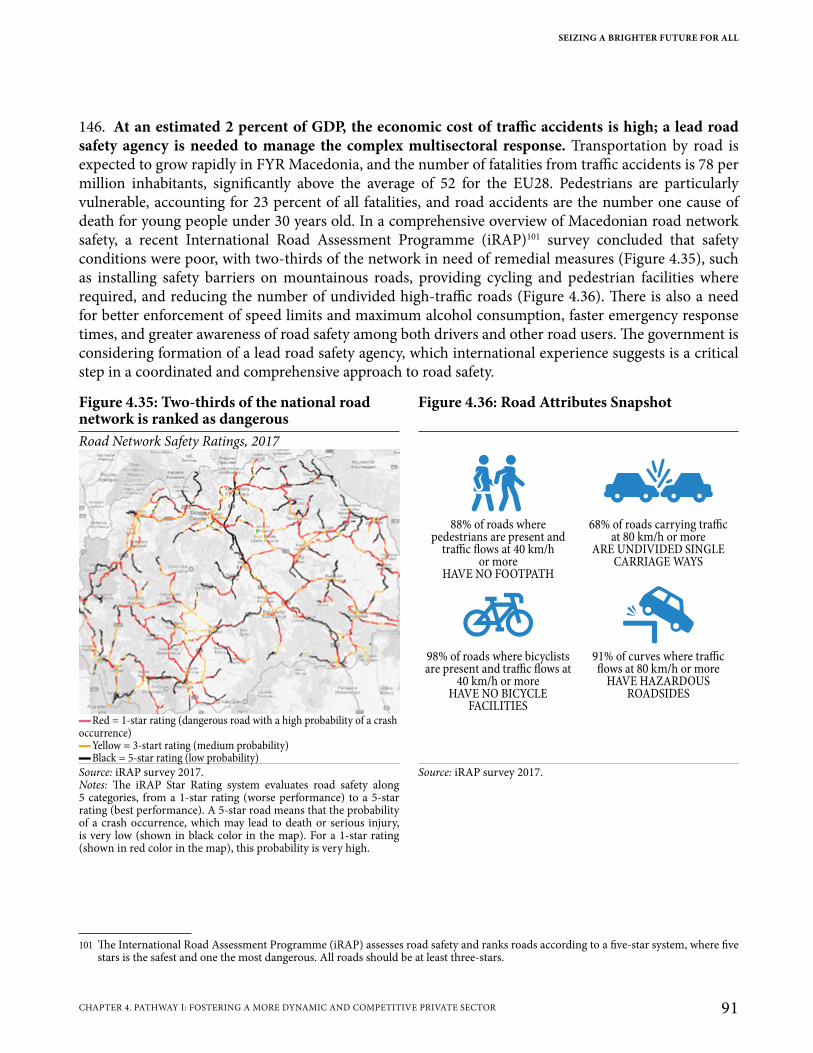
146. At an estimated 2 percent of GDP, the economic cost of traffic accidents is high; a lead road safety agency is needed to manage the complex multisectoral response. Transportation by road is expected to grow rapidly in FYR Macedonia, and the number of fatalities from traffic accidents is 78 per million inhabitants, significantly above the average of 52 for the EU28. Pedestrians are particularly vulnerable, accounting for 23 percent of all fatalities, and road accidents are the number one cause of death for young people under 30 years old. In a comprehensive overview of Macedonian road network safety, a recent International Road Assessment Programme (iRAP)101 survey concluded that safety conditions were poor, with two-thirds of the network in need of remedial measures (Figure 4.35), such as installing safety barriers on mountainous roads, providing cycling and pedestrian facilities where required, and reducing the number of undivided high-traffic roads (Figure 4.36). There is also a need for better enforcement of speed limits and maximum alcohol consumption, faster emergency response times, and greater awareness of road safety among both drivers and other road users. The government is considering formation of a lead road safety agency, which international experience suggests is a critical step in a coordinated and comprehensive approach to road safety.
101 The International Road Assessment Programme (iRAP) assesses road safety and ranks roads according to a five-star system, where five stars is the safest and one the most dangerous. All roads should be at least three-stars.
Figure 4.35: Two-thirds of the national road network is ranked as dangerous
Figure 4.36: Road Attributes Snapshot
Road Network Safety Ratings, 2017
88% of roads wherepedestrians are present and
traffic flows at 40 km/hor more
HAVE NO FOOTPATH
68% of roads carrying trafficat 80 km/h or more
ARE UNDIVIDED SINGLECARRIAGE WAYS
98% of roads where bicyclistsare present and traffic flows at
40 km/h or moreHAVE NO BICYCLE
FACILITIES
91% of curves where trafficflows at 80 km/h or more
HAVE HAZARDOUSROADSIDES
▬Red = 1-star rating (dangerous road with a high probability of a crash occurrence)
▬Yellow = 3-start rating (medium probability) ▬Black = 5-star rating (low probability)
Source: iRAP survey 2017.Notes: The iRAP Star Rating system evaluates road safety along 5 categories, from a 1-star rating (worse performance) to a 5-star rating (best performance). A 5-star road means that the probability of a crash occurrence, which may lead to death or serious injury, is very low (shown in black color in the map). For a 1-star rating (shown in red color in the map), this probability is very high.
Source: iRAP survey 2017.
SEIZING A BRIGHTER FUTURE FOR ALL
91CHAPTER 4. PATHWAY I: FOSTERING A MORE DYNAMIC AND COMPETITIVE PRIVATE SECTOR
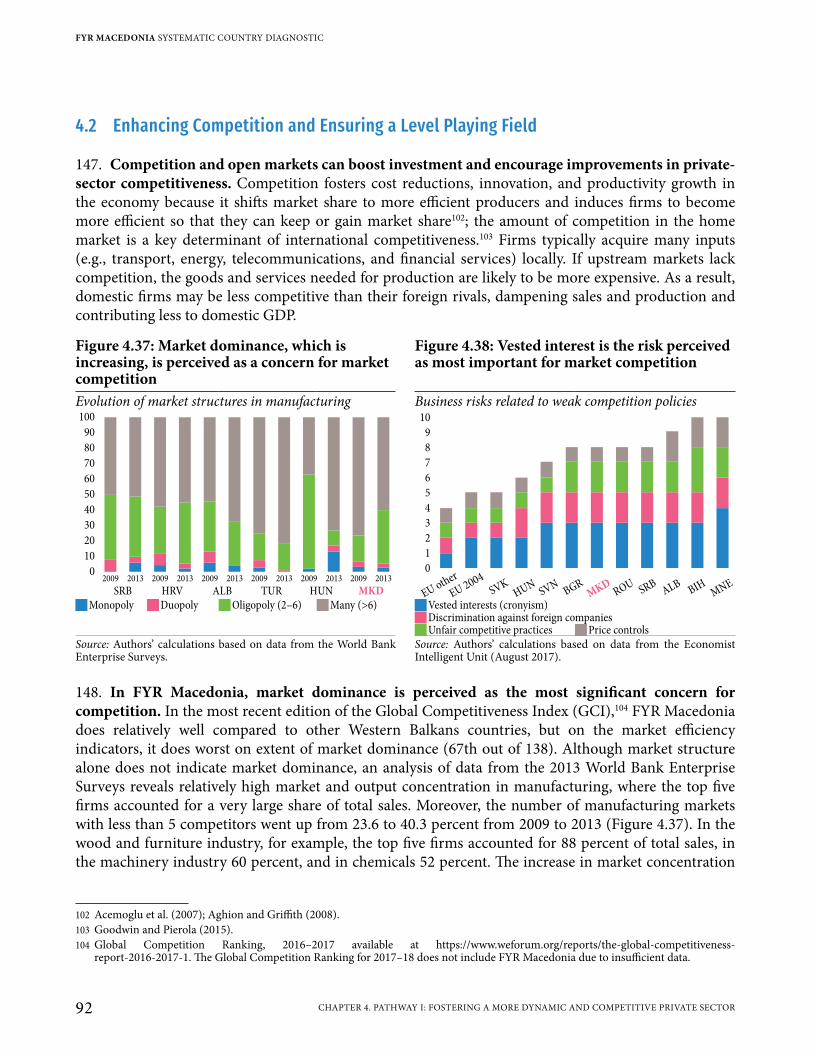
4.2 Enhancing Competition and Ensuring a Level Playing Field
147. Competition and open markets can boost investment and encourage improvements in private-sector competitiveness. Competition fosters cost reductions, innovation, and productivity growth in the economy because it shifts market share to more efficient producers and induces firms to become more efficient so that they can keep or gain market share102; the amount of competition in the home market is a key determinant of international competitiveness.103 Firms typically acquire many inputs (e.g., transport, energy, telecommunications, and financial services) locally. If upstream markets lack competition, the goods and services needed for production are likely to be more expensive. As a result, domestic firms may be less competitive than their foreign rivals, dampening sales and production and contributing less to domestic GDP.
148. In FYR Macedonia, market dominance is perceived as the most significant concern for competition. In the most recent edition of the Global Competitiveness Index (GCI),104 FYR Macedonia does relatively well compared to other Western Balkans countries, but on the market efficiency indicators, it does worst on extent of market dominance (67th out of 138). Although market structure alone does not indicate market dominance, an analysis of data from the 2013 World Bank Enterprise Surveys reveals relatively high market and output concentration in manufacturing, where the top five firms accounted for a very large share of total sales. Moreover, the number of manufacturing markets with less than 5 competitors went up from 23.6 to 40.3 percent from 2009 to 2013 (Figure 4.37). In the wood and furniture industry, for example, the top five firms accounted for 88 percent of total sales, in the machinery industry 60 percent, and in chemicals 52 percent. The increase in market concentration
102 Acemoglu et al. (2007); Aghion and Griffith (2008).103 Goodwin and Pierola (2015).104 Global Competition Ranking, 2016–2017 available at https://www.weforum.org/reports/the-global-competitiveness-
report-2016-2017-1. The Global Competition Ranking for 2017–18 does not include FYR Macedonia due to insufficient data.
Figure 4.37: Market dominance, which is increasing, is perceived as a concern for market competition
Figure 4.38: Vested interest is the risk perceived as most important for market competition
Evolution of market structures in manufacturing Business risks related to weak competition policies100
90
80
70
60
50
40
30
20
10
0
ALB TURHRV MKDHUNSRB
2009 2013 2009 2013 2009 2013 2009 2013 2009 2013 2009 2013
10
9
8
7
6
5
4
3
2
1
0
BGRROU
HUNMNE
ALBEU 2004
MKD SRBSVN BIHSVK
EU other
JMonopoly JDuopoly JOligopoly (2–6) JMany (>6) JVested interests (cronyism) JDiscrimination against foreign companies JUnfair competitive practices JPrice controls
Source: Authors’ calculations based on data from the World Bank Enterprise Surveys.
Source: Authors’ calculations based on data from the Economist Intelligent Unit (August 2017).
FYR MACEDONIA SYSTEMATIC COUNTRY DIAGNOSTIC
92 CHAPTER 4. PATHWAY I: FOSTERING A MORE DYNAMIC AND COMPETITIVE PRIVATE SECTOR

in manufacturing was apparently associated with larger price-cost margins.105 Interviews with private-sector representatives also confirm a perception that major competition concerns are market dominance and limited opportunities for new entrants in some product and service markets (due in part to NTBs, as discussed earlier).106 Similarly, the perception of business risks related to lack of competition identified vested interests and cronyism (Figure 4.38).
149. Restrictive and ineffective regulation both limit market competition. Entry of new firms may be deterred by restrictive regulations or their discretionary application. Ineffective enforcement of competition policies can have a similar effect. For markets to perform properly, these problems must be addressed. However, in 2018 the EC reported that involvement of the government in Macedonian markets appears to undermine private-sector development due to inspections, uneven application of regulations, public procurement procedures, and state aid.107 It will thus be critical to coordinate policy efforts to generate a competitive business environment and promote open markets in FYR Macedonia.
4.2.1 Opening Markets and Removing Anti-Competitive Regulation
150. Despite market-based reforms, certain government interventions appear to limit competitive pressure in certain sectors in FYR Macedonia. Preliminary findings from the OECD-World Bank Group (WBG) Product Market Regulation (PMR) assessment for FYR Macedonia, currently being prepared, suggest that several restrictions are limiting competition.108 PMR indicators capture the degree to which government market regulations promote or restrict competition.109 The PMR data for FYR Macedonia points to concerns about (a) application of the competitive neutrality principle that state-owned and private businesses compete on a level playing field, (b) the existence of entry barriers in network sectors, and (c) undue restrictions on regulated professions.
151. In sectors with SOEs, principles of competitive neutrality are not guaranteed. In FYR Macedonia, where state ownership of public utilities is common,110 direct state interference undermines their governance. For instance, the Ministry of Economy rather than an independent office exercises ownership rights in public enterprises. Moreover, the Chief Executive Officers of SOEs are appointed by
105 See Blažková, I., and Dvouletý, O. (2017). Is the price-cost margin affected by the market concentration? Evidence from the Czech food and beverages industry. Business and Economic Horizons, 13(2), 256-269; Dickson, V. (2005). Price-cost margins, prices and concentration in US manufacturing: a panel study. Applied Economics Letters, 12(2), 79-83; and Setiawan, M., Emvalomatis, G., and Lansink, A. O. (2012). Industrial concentration and price-cost margin of the Indonesian food and beverages sector. Applied Economics, 44(29), 3805-3814
106 European Commission (2016b), The Former Yugoslav Republic of Macedonia 2016 Report.107 The former Yugoslav Republic of Macedonia 2018 Report, European Commission Staff Working Document, SWD (2018) 154
hereinafter “EU Macedonia Report 2018” at p. 46. Available at https://www.pravdiko.mk/wp-content/uploads/2018/04/20180417-the-former-yugoslav-republic-of-macedonia-report.pdf
108 PMR indicators for FYR Macedonia are being created through a joint initiative of the WBG and the OECD and will be available in the Fall of 2018. The PRM methodology and its findings for OECD countries are presented in Nicoletti et al. (1999), Conway et al. (2005) and Wolf et al. (2009).
109 Each of the areas addressed by the PMR methodology sheds light on specific economy-wide and sector-specific regulatory restrictions. The areas also deal with specific sectors of the economy, among them energy, transport, post, water, e-communications and digital economy, professional services, and retail trade. Moreover, they address the design of regulations, the administrative burdens on startups, the treatment of foreign parties, and the governance of publicly controlled enterprises. Additional information on the PMR indicators is available at: http://www.oecd.org/eco/growth/indicatorsofproductmarketregulationhomepage.htm
110 While there is no consolidated registry of Macedonian SOEs, different sources report 15 public enterprises, mostly utilities, in which the central government has control, and the 81 local governments also own public utility enterprises. See FYR Macedonia Commercial Guide by the US State Department Office of Investment Affairs available at https://www.export.gov/article?id=Macedonia-State-Owned-Enterprises
SEIZING A BRIGHTER FUTURE FOR ALL
93CHAPTER 4. PATHWAY I: FOSTERING A MORE DYNAMIC AND COMPETITIVE PRIVATE SECTOR
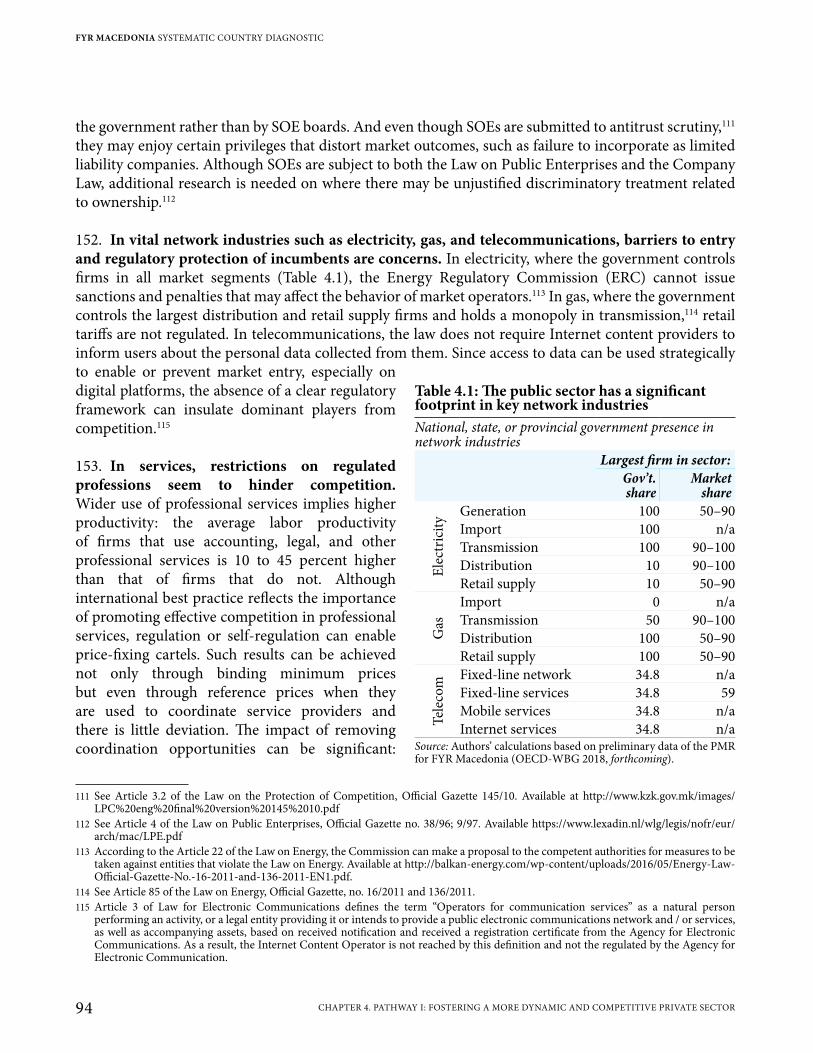
the government rather than by SOE boards. And even though SOEs are submitted to antitrust scrutiny,111 they may enjoy certain privileges that distort market outcomes, such as failure to incorporate as limited liability companies. Although SOEs are subject to both the Law on Public Enterprises and the Company Law, additional research is needed on where there may be unjustified discriminatory treatment related to ownership.112
152. In vital network industries such as electricity, gas, and telecommunications, barriers to entry and regulatory protection of incumbents are concerns. In electricity, where the government controls firms in all market segments (Table 4.1), the Energy Regulatory Commission (ERC) cannot issue sanctions and penalties that may affect the behavior of market operators.113 In gas, where the government controls the largest distribution and retail supply firms and holds a monopoly in transmission,114 retail tariffs are not regulated. In telecommunications, the law does not require Internet content providers to inform users about the personal data collected from them. Since access to data can be used strategically to enable or prevent market entry, especially on digital platforms, the absence of a clear regulatory framework can insulate dominant players from competition.115
153. In services, restrictions on regulated professions seem to hinder competition. Wider use of professional services implies higher productivity: the average labor productivity of firms that use accounting, legal, and other professional services is 10 to 45 percent higher than that of firms that do not. Although international best practice reflects the importance of promoting effective competition in professional services, regulation or self-regulation can enable price-fixing cartels. Such results can be achieved not only through binding minimum prices but even through reference prices when they are used to coordinate service providers and there is little deviation. The impact of removing coordination opportunities can be significant:
111 See Article 3.2 of the Law on the Protection of Competition, Official Gazette 145/10. Available at http://www.kzk.gov.mk/images/LPC%20eng%20final%20version%20145%2010.pdf
112 See Article 4 of the Law on Public Enterprises, Official Gazette no. 38/96; 9/97. Available https://www.lexadin.nl/wlg/legis/nofr/eur/arch/mac/LPE.pdf
113 According to the Article 22 of the Law on Energy, the Commission can make a proposal to the competent authorities for measures to be taken against entities that violate the Law on Energy. Available at http://balkan-energy.com/wp-content/uploads/2016/05/Energy-Law-Official-Gazette-No.-16-2011-and-136-2011-EN1.pdf.
114 See Article 85 of the Law on Energy, Official Gazette, no. 16/2011 and 136/2011.115 Article 3 of Law for Electronic Communications defines the term “Operators for communication services” as a natural person
performing an activity, or a legal entity providing it or intends to provide a public electronic communications network and / or services, as well as accompanying assets, based on received notification and received a registration certificate from the Agency for Electronic Communications. As a result, the Internet Content Operator is not reached by this definition and not the regulated by the Agency for Electronic Communication.
Table 4.1: The public sector has a significant footprint in key network industriesNational, state, or provincial government presence in network industries
Largest firm in sector:Gov’t. share
Market share
Elec
tric
ity
Generation 100 50–90Import 100 n/aTransmission 100 90–100Distribution 10 90–100Retail supply 10 50–90
Gas
Import 0 n/aTransmission 50 90–100Distribution 100 50–90Retail supply 100 50–90
Tele
com Fixed-line network 34.8 n/a
Fixed-line services 34.8 59Mobile services 34.8 n/aInternet services 34.8 n/a
Source: Authors’ calculations based on preliminary data of the PMR for FYR Macedonia (OECD-WBG 2018, forthcoming).
FYR MACEDONIA SYSTEMATIC COUNTRY DIAGNOSTIC
94 CHAPTER 4. PATHWAY I: FOSTERING A MORE DYNAMIC AND COMPETITIVE PRIVATE SECTOR
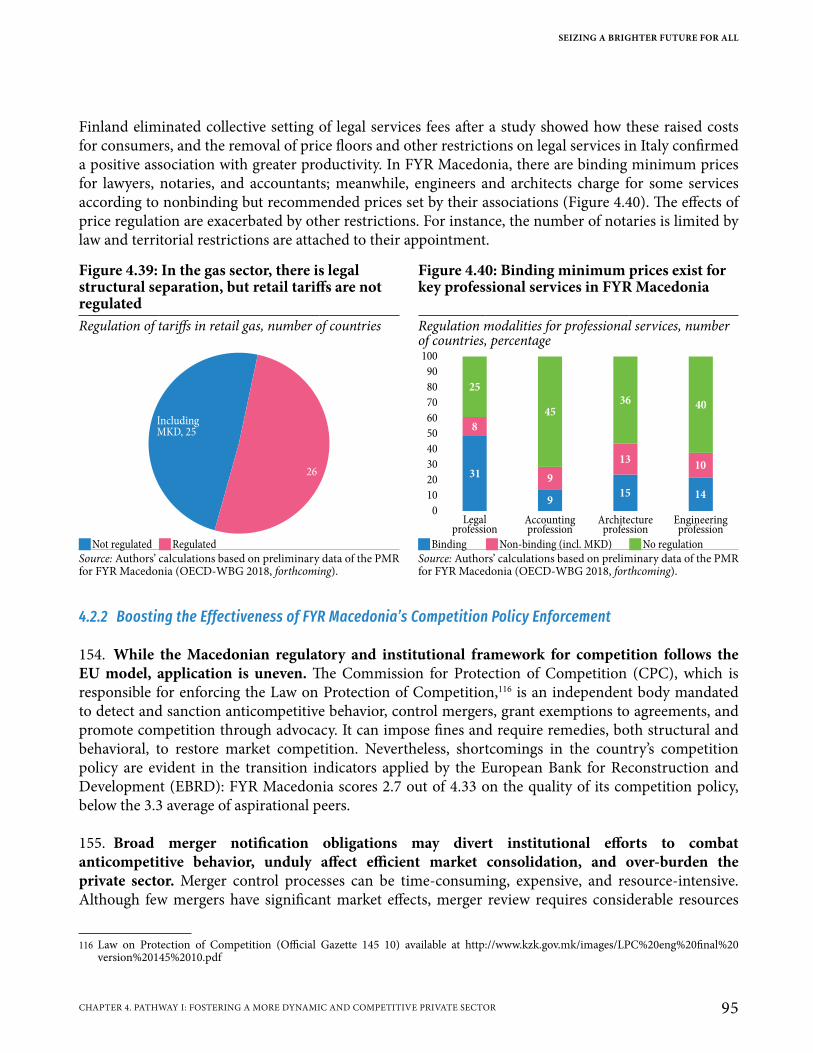
Finland eliminated collective setting of legal services fees after a study showed how these raised costs for consumers, and the removal of price floors and other restrictions on legal services in Italy confirmed a positive association with greater productivity. In FYR Macedonia, there are binding minimum prices for lawyers, notaries, and accountants; meanwhile, engineers and architects charge for some services according to nonbinding but recommended prices set by their associations (Figure 4.40). The effects of price regulation are exacerbated by other restrictions. For instance, the number of notaries is limited by law and territorial restrictions are attached to their appointment.
4.2.2 Boosting the Effectiveness of FYR Macedonia’s Competition Policy Enforcement
154. While the Macedonian regulatory and institutional framework for competition follows the EU model, application is uneven. The Commission for Protection of Competition (CPC), which is responsible for enforcing the Law on Protection of Competition,116 is an independent body mandated to detect and sanction anticompetitive behavior, control mergers, grant exemptions to agreements, and promote competition through advocacy. It can impose fines and require remedies, both structural and behavioral, to restore market competition. Nevertheless, shortcomings in the country’s competition policy are evident in the transition indicators applied by the European Bank for Reconstruction and Development (EBRD): FYR Macedonia scores 2.7 out of 4.33 on the quality of its competition policy, below the 3.3 average of aspirational peers.
155. Broad merger notification obligations may divert institutional efforts to combat anticompetitive behavior, unduly affect efficient market consolidation, and over-burden the private sector. Merger control processes can be time-consuming, expensive, and resource-intensive. Although few mergers have significant market effects, merger review requires considerable resources
116 Law on Protection of Competition (Official Gazette 145 10) available at http://www.kzk.gov.mk/images/LPC%20eng%20final%20version%20145%2010.pdf
Figure 4.39: In the gas sector, there is legal structural separation, but retail tariffs are not regulated
Figure 4.40: Binding minimum prices exist for key professional services in FYR Macedonia
Regulation of tariffs in retail gas, number of countries Regulation modalities for professional services, number of countries, percentage
IncludingMKD, 25
26
100
90
80
70
60
50
40
30
20
10
0Legal
professionAccountingprofession
Architectureprofession
Engineeringprofession
31
8
25
9
9
45
15
13
36
14
10
40
JNot regulated JRegulated JBinding JNon-binding (incl. MKD) JNo regulationSource: Authors’ calculations based on preliminary data of the PMR for FYR Macedonia (OECD-WBG 2018, forthcoming).
Source: Authors’ calculations based on preliminary data of the PMR for FYR Macedonia (OECD-WBG 2018, forthcoming).
SEIZING A BRIGHTER FUTURE FOR ALL
95CHAPTER 4. PATHWAY I: FOSTERING A MORE DYNAMIC AND COMPETITIVE PRIVATE SECTOR
for competition authorities that may be diverted from other enforcement activities. Moreover, the costs for the private sector are significant—not only costs directly associated with merger notification (fees, legal advice, etc.) but also the indirect costs of needing an additional layer of approval to complete a deal. Thus, both (a) notification thresholds that limit merger review to operations that could reduce market competition and (b) time limits for quick clearance of operations with no negative impact are critical to support private sector development in FYR Macedonia.
156. A shortage of institutional resources and analytic and procedural tools inhibits effective enforcement of FYR Macedonia’s competition policy. Budget fluctuations and concerns about CPC independence have been reported as critical challenges to preventing anticompetitive practices. The scarcity of its decisions indicate that the CPC is not often called upon.117 Moreover, the effectiveness of anti-monopoly policy seems to be undercut by the limited ability of the commission to collect evidence through leniency118 and on-site inspections. Moreover, the quality of CPC analysis cannot be properly evaluated because decisions are published without full explanations.119 Finally, the CPC could use its advocacy powers to foster open markets and keep the public informed about market failures that could be ameliorated through legislation or regulation.
4.2.3 State Aid
157. Weaknesses in the procedures for state aid may reduce the willingness of firms to invest. Although FYR Macedonia’s law on state aid generally follows EU principles, a number of state aid schemes have been crafted without careful scrutiny,120 which can lead to significant market distortions. The country’s state aid policy could be improved by (a) creating a more effective state aid notification system; (b) setting up a registry of state aid; and (c) fully aligning the state aid law with current EU regulation.121 (See Box 4.3).
158. Some foreign investment–related policies have resulted in “enclave industries” with few ties to domestic firms. FYR Macedonia’s FDI promotion strategy is based on investment incentives,
117 The report indicates 7 decisions against cartels and abuse of dominance in 2016 and 7 in 2017; merger decisions rose from 31 to 50.118 The term leniency refers to a system of pardon and reduction of fines and sanctions that would otherwise be applicable to a cartel
participant, in exchange for reporting on illegal activities and supplying information or evidence that can strengthen a cartel investigation. Leniency programs provide authorities access to strong evidence at a much lower cost than other investigative techniques, and deter to parties from joining or forming a conspiracy.
119 While the law establishes the possibility of a full exemption from fines for the first cartel member to denounce the existence of a cartel, the Commission has not yet received any applications. Similarly, the law enables the Commission to carry on-site inspections to collect first-hand both physical and digital evidence of a cartel. However, the Commission has reportedly carried out only one inspection. The decisions available on the CPC’s webpage are one or two pages each, and decisions taken in the past few years are not available; the most recent decisions on the webpage are from 2011 on administrative procedures; and 2009 on misdemeanor procedures and decisions of courts. While the Commission can issue opinions on any anticompetitive regulation either on its own motion or in response to a request of a public body, there is no systematic analytical methodology to identify and eliminate anticompetitive restrictions on the CPC and other public/private bodies with regulatory capacity to avoid such restrictions.
120 The key regulatory instruments are the Law on State Aid, adopted in November 2010 (Official Gazette No. 145) and 5 by laws issued in 2014 available at http://www.kzk.gov.mk/eng/zapis.asp?id=8. These rules state that the goal of state aid is to “prohibit gaining advantages in any form whatsoever conferred on a selective basis to undertakings by national public authorities, which could distort competition. In some justified cases (depending on certain policy objectives) state aid could be considered compatible [with competitive markets]. The state aid aquis contains exemptions determining circumstances when state aid could be granted.” See: EU Expert Report on Chapter 8, Competition Policy, 2015.
121 The current FYR Macedonia state aid framework is stricter than EU law as it passed before critical EU reforms in recent years. It would be critical to revise the state aid legislation along the Commission Directive 2006/111/EC, and point (2) may be achieved by implementing other directives documented by the EU in the Expert Report.
FYR MACEDONIA SYSTEMATIC COUNTRY DIAGNOSTIC
96 CHAPTER 4. PATHWAY I: FOSTERING A MORE DYNAMIC AND COMPETITIVE PRIVATE SECTOR
Box 4.3: The Legal Basis for State Aid in FYR Macedonia
The FYR Macedonia Law on State Aid responds to Articles 107 and 108 of the Treaty for the Functioning of the European Union (TFEU) and the Stabilization and Association Agreement:
• Providers of state aid must submit to the CPC a notification of any plan to grant new or alter current state aid, regardless of whether it is granted as individual aid or part of a scheme.
• State aid may not be granted to a recipient before it is formally approved by the CPC. • The CPC examines each possible instance of unlawful state aid and forces the recipient of
unlawful aid to reimburse the government. • Each provider must report annually to the CPC all state aid granted in the previous year,
including its form, the conditions on which it was granted, the act authorizing it, the amount, and the period.
• Each provider and each recipient must keep accurate records of state aid granted or received.
However,
• Nearly every CPC decision has been positive. There have been very few complaints. On occasion, the CPC has issued an opinion that a proposed scheme was not state aid but rather investment. For example, the CPC determined that the proposed Law on Financial Support to Investments was not a state aid scheme but from the EU perspective could have been classified as such. That no subsidies have been found to fall foul of the state aid law may indicate that the CPC may be classifying schemes as not constituting state aid when in fact they do. This may be due to a lack of capacity within the CPC, which has only four staff members in its state aid unit.
• Although awareness of the Law on State Aid has improved, in the past two years the number of CPC decisions has plunged, dropping from more than 25 in 2015 to 13 in 2016 and 6 in 2017. In both 2016 and 2017, reported state aid represented 0.2 percent of the country's GDP, and around 1 percent of GDP was reported as subsidies in the fiscal accounts (without the agricultural subsidies and without tax exemptions). However, the increased number of requests for opinions and notifications, particularly from ministries, could imply greater awareness of state aid rules. Whatever the case, safeguards to ensure that state aid measures are free from conflicts of interest are still needed. For example, the air transport industry continues to receive state aid without the CPC being notified, and its compliance with the rules needs to be established.
• There is no registry of state aid, which makes detailed and transparent monitoring difficult. Currently, the CPC receives the required reports from state aid providers, but it cannot verify that firms are below the de minimis thresholds or in compliance with state aid rules. Moreover, the most recent report on the CPC website is from February 2010, and there are no details on the basis even for those decisions. Current state aid notifications are not published on the website.
Sources: Authors based on CPC Website, The former Yugoslav Republic of Macedonia 2018 Report, European Commission Staff Working Document, SWD (2018) 154, hereinafter “EU Macedonia Report 2018”; Expert Report on Chapter 8, Competition Policy, 2015.
SEIZING A BRIGHTER FUTURE FOR ALL
97CHAPTER 4. PATHWAY I: FOSTERING A MORE DYNAMIC AND COMPETITIVE PRIVATE SECTOR
streamlined regulations, creation of SEZs, and branding and promotion efforts. As of 2016, the government had granted €225 million in investment incentives to 25 foreign investors employing a total of 20,000 workers.122 While the benefits of FDI have been significant in terms of job creation, integration into regional and global value chains, and increased export sophistication, there is evidence that it has generated few upstream linkages with domestic firms and has instead created SEZ enclaves of highly productive firms. Many foreign investors have chosen to locate relatively low-value, labor-intensive activities in FYR Macedonia, and some activities require few outside supplies (e.g., assembly of auto parts from imported components).
159. A transparent investment strategy that puts all firms on an equal footing could be effective for attracting FDI and increasing domestic investment. International experience and interviews with investors revealed that tax incentives are generally not the main reason for location decisions; investors often select FYR Macedonia due to its low-cost environment and its proximity to EU markets. Other factors influencing decisions are labor costs, operating costs, trade and transportation costs, and the perceived quality of the rule of law. Making the state aid framework more transparent would bolster confidence in the business climate. Moreover, competitive distortions arising from state aid could be reduced by (a) building up the capacity of the CPC state aid department, which has only four staff members and an outdated information system, and (b) setting up a registry of state aid to the private sector, including de minimis aid, so that the CPC can better monitor thresholds to ensure that requirements are met. Although FYR Macedonia’s Law on State Aid is generally consistent with EU rules, secondary laws on certain forms of state aid have not been harmonized and there is no inventory of state aid. Also, procedures are not applied consistently by the various entities that grant state aid.123
4.3 Improving Firm Capabilities and Technology Adoption
160. Innovation, defined as improvements in production and the introduction of new products, is critical for sustained growth in productivity. New products, technologies, business processes, and ideas in the market fuel productivity growth, and over the long-term adoption of new technologies may account for half of productivity growth.124 Moreover, the benefits from innovation go beyond income alone. Welfare gains in health and longevity due to innovation are estimated to be almost as large as those measured by GDP per capita.
161. Innovation is only possible when firms have the necessary internal capabilities. Firm capabilities, understood as managerial and organizational practices, are critical to how the firm innovates; lacking them can deter innovation. Good practices involve, among others, just-in-time processes, internal feedback mechanisms, long-run planning and goal stretching, human resource policies, and monitoring and evaluation systems. A study of World Management Survey findings confirms that managerial
122 Source: Macedonian authorities.123 Before granting aid, entities must notify the CPC and await its decision, which is based on the proposed aid scheme’s compatibility with
the rules. Some entities that grant aid notify the CPC late, or not at all. As a result, state aid may not be adhering to the rules. All entities that provide state aid should implement internal procedures for monitoring, control, and reporting of state aid in line with the Law on State Aid Control and in cooperation with the CPC.
124 Easterly and Levine (2001).
FYR MACEDONIA SYSTEMATIC COUNTRY DIAGNOSTIC
98 CHAPTER 4. PATHWAY I: FOSTERING A MORE DYNAMIC AND COMPETITIVE PRIVATE SECTOR
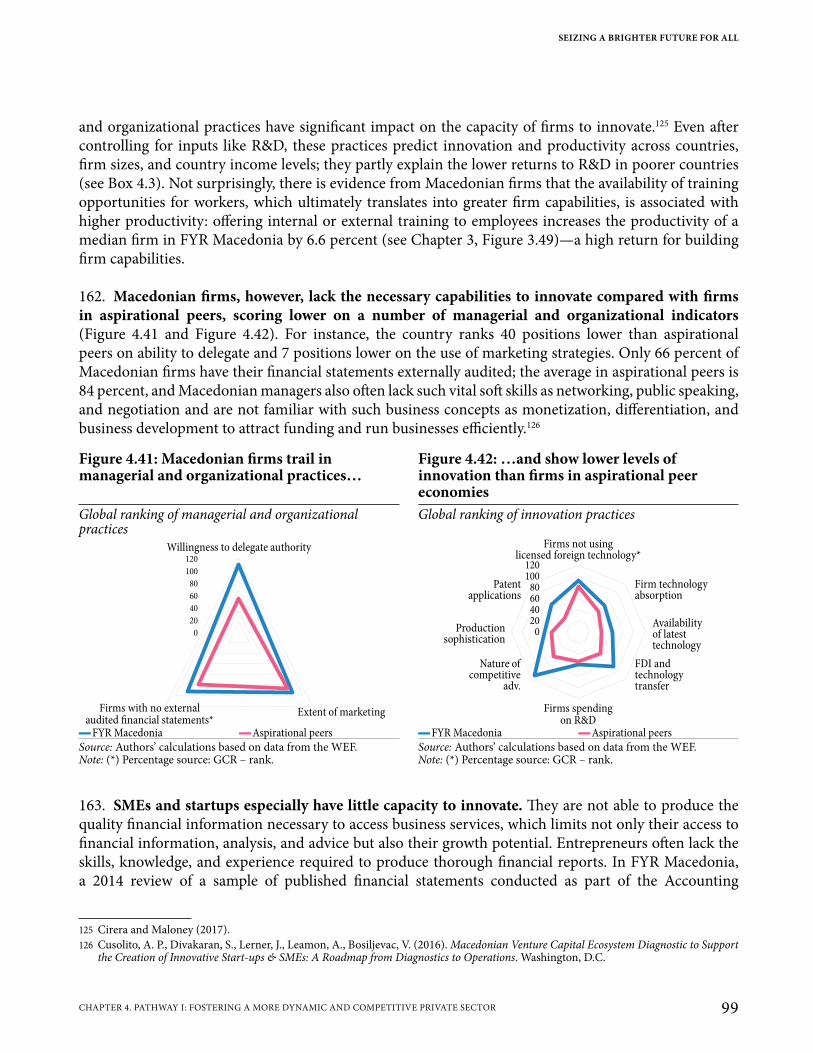
and organizational practices have significant impact on the capacity of firms to innovate.125 Even after controlling for inputs like R&D, these practices predict innovation and productivity across countries, firm sizes, and country income levels; they partly explain the lower returns to R&D in poorer countries (see Box 4.3). Not surprisingly, there is evidence from Macedonian firms that the availability of training opportunities for workers, which ultimately translates into greater firm capabilities, is associated with higher productivity: offering internal or external training to employees increases the productivity of a median firm in FYR Macedonia by 6.6 percent (see Chapter 3, Figure 3.49)—a high return for building firm capabilities.
162. Macedonian firms, however, lack the necessary capabilities to innovate compared with firms in aspirational peers, scoring lower on a number of managerial and organizational indicators (Figure 4.41 and Figure 4.42). For instance, the country ranks 40 positions lower than aspirational peers on ability to delegate and 7 positions lower on the use of marketing strategies. Only 66 percent of Macedonian firms have their financial statements externally audited; the average in aspirational peers is 84 percent, and Macedonian managers also often lack such vital soft skills as networking, public speaking, and negotiation and are not familiar with such business concepts as monetization, differentiation, and business development to attract funding and run businesses efficiently.126
163. SMEs and startups especially have little capacity to innovate. They are not able to produce the quality financial information necessary to access business services, which limits not only their access to financial information, analysis, and advice but also their growth potential. Entrepreneurs often lack the skills, knowledge, and experience required to produce thorough financial reports. In FYR Macedonia, a 2014 review of a sample of published financial statements conducted as part of the Accounting
125 Cirera and Maloney (2017).126 Cusolito, A. P., Divakaran, S., Lerner, J., Leamon, A., Bosiljevac, V. (2016). Macedonian Venture Capital Ecosystem Diagnostic to Support
the Creation of Innovative Start-ups & SMEs: A Roadmap from Diagnostics to Operations. Washington, D.C.
Figure 4.41: Macedonian firms trail in managerial and organizational practices…
Figure 4.42: …and show lower levels of innovation than firms in aspirational peer economies
Global ranking of managerial and organizational practices
Global ranking of innovation practices
Willingness to delegate authority120
80
60
40
20
0
100
Extent of marketingFirms with no externalaudited financial statements*
Firms not usinglicensed foreign technology*
Firms spendingon R&D
120
80604020
0
100Firm technologyabsorption
Availabilityof latesttechnology
FDI andtechnologytransfer
Patentapplications
Productionsophistication
Nature ofcompetitive
adv.
▬FYR Macedonia ▬Aspirational peers ▬FYR Macedonia ▬Aspirational peersSource: Authors’ calculations based on data from the WEF.Note: (*) Percentage source: GCR – rank.
Source: Authors’ calculations based on data from the WEF.Note: (*) Percentage source: GCR – rank.
SEIZING A BRIGHTER FUTURE FOR ALL
99CHAPTER 4. PATHWAY I: FOSTERING A MORE DYNAMIC AND COMPETITIVE PRIVATE SECTOR

and Auditing Report on Observance of Standards and Codes found that the quality of SME financial reporting is inadequate and the skills of their accountancy firms urgently need upgrading.127
164. Because the capabilities of Macedonian firms are limited, innovation in the country is disappointingly low, which will make it harder to accelerate productivity growth. They are outdone by firms in aspirational peers in technology and knowledge, market intelligence, and competitiveness and innovation outcomes (Figure 4.42). Market intelligence indicators, which capture the extent to which the competitive advantage of local firms in international markets is based on low-cost labor or natural resources (low ranking) or unique products and processes (high ranking), illustrate the fact that Macedonian firms also do not perform as well as firms in peer economies, which are ranked more than 40 positions higher. Innovation in FYR Macedonian also compares poorly with that of its immediate neighbors: Albania, Bosnia and Herzegovina, Croatia, Kosovo, Montenegro, and Serbia are all ahead in terms of the ability of their firms to improve products, services, and production or service delivery processes (Table 4.2). Firms in other Western Balkans countries also collaborate more with universities on R&D and spend a larger share of gross expenditures on R&D activities.
Table 4.2: Selected Innovation Outputs, FYR Macedonia and the Western Balkans, 2016Percent
Measure FYR Macedonia
Western Balkans*
Introduced new or significantly improved products and/or services in the past 12 months 49 58
Introduced new or significantly improved production and/or service delivery processes in the past 12 months 37 50
Cooperated with universities on research and development or technology development projects for new products or services in the past 3 years 8 17
Gross spending on R&D by private enterprise 17 37**Sources: Authors’ calculations based on data from Balkan Barometer 2016 Business Opinion Survey and UNESCO.Notes: Western Balkans* = Albania, Bosnia and Herzegovina, Croatia, Kosovo, Montenegro, and Serbia. ** = Average of Croatia, Bosnia and Herzegovina, Serbia, and Montenegro only (no data for Kosovo or Albania).
165. Policies to support the development of firm capabilities in FYR Macedonia need to give priority to supporting the upgrading of processes rather than subsidizing inputs. Current Ministry of Economy programs128 are dedicated to such firm-level inputs as the purchase of equipment and tools, product/service logos and visual identity, advertising materials, and participation in fairs. Among programs that would better promote productivity are funding staff training, optimizing production processes, certifying quality, developing new products and services, and creating effective marketing strategies.
166. Policies also need to focus on reducing programmatic fragmentation and coordinating state aid to firms. Currently, the Ministry of Economy has 14 programs to improve the capacity of domestic firms plus initiatives by the Agency for Entrepreneurship, the Agency for Foreign Investment and Export Promotion (Invest Macedonia), and the Fund for Innovation and Technological Development. The
127 The recent establishment of the Institute of Accountants and Certified Accountants in FYR Macedonia has provided a sustainable foundation for skills development in the accountancy profession.
128 Ministry of Economy programs to support enhancement of firm capabilities are organized in three categories: Support and Development of Small and Medium-sized Enterprises, Implementation of the Industrial Policy, and Support and Development of Clusters.
FYR MACEDONIA SYSTEMATIC COUNTRY DIAGNOSTIC
100 CHAPTER 4. PATHWAY I: FOSTERING A MORE DYNAMIC AND COMPETITIVE PRIVATE SECTOR
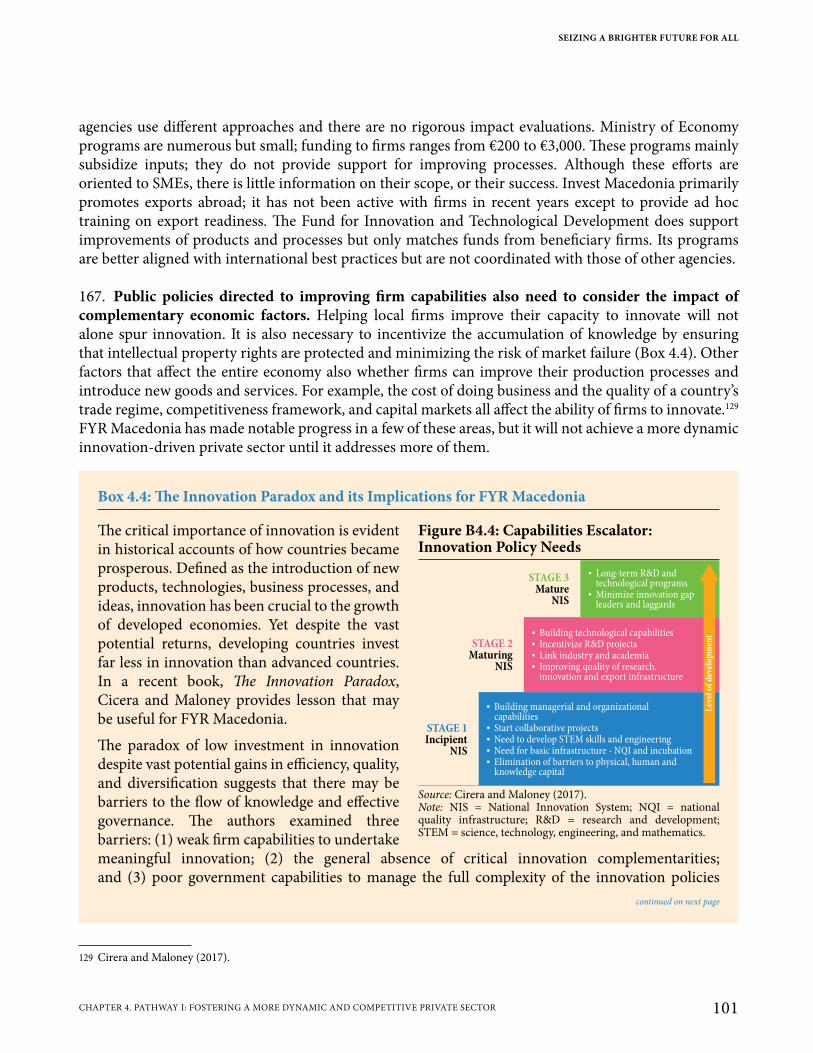
agencies use different approaches and there are no rigorous impact evaluations. Ministry of Economy programs are numerous but small; funding to firms ranges from €200 to €3,000. These programs mainly subsidize inputs; they do not provide support for improving processes. Although these efforts are oriented to SMEs, there is little information on their scope, or their success. Invest Macedonia primarily promotes exports abroad; it has not been active with firms in recent years except to provide ad hoc training on export readiness. The Fund for Innovation and Technological Development does support improvements of products and processes but only matches funds from beneficiary firms. Its programs are better aligned with international best practices but are not coordinated with those of other agencies.
167. Public policies directed to improving firm capabilities also need to consider the impact of complementary economic factors. Helping local firms improve their capacity to innovate will not alone spur innovation. It is also necessary to incentivize the accumulation of knowledge by ensuring that intellectual property rights are protected and minimizing the risk of market failure (Box 4.4). Other factors that affect the entire economy also whether firms can improve their production processes and introduce new goods and services. For example, the cost of doing business and the quality of a country’s trade regime, competitiveness framework, and capital markets all affect the ability of firms to innovate.129 FYR Macedonia has made notable progress in a few of these areas, but it will not achieve a more dynamic innovation-driven private sector until it addresses more of them.
129 Cirera and Maloney (2017).
Box 4.4: The Innovation Paradox and its Implications for FYR Macedonia
The critical importance of innovation is evident in historical accounts of how countries became prosperous. Defined as the introduction of new products, technologies, business processes, and ideas, innovation has been crucial to the growth of developed economies. Yet despite the vast potential returns, developing countries invest far less in innovation than advanced countries. In a recent book, The Innovation Paradox, Cicera and Maloney provides lesson that may be useful for FYR Macedonia.
The paradox of low investment in innovation despite vast potential gains in efficiency, quality, and diversification suggests that there may be barriers to the flow of knowledge and effective governance. The authors examined three barriers: (1) weak firm capabilities to undertake meaningful innovation; (2) the general absence of critical innovation complementarities; and (3) poor government capabilities to manage the full complexity of the innovation policies
Figure B4.4: Capabilities Escalator: Innovation Policy Needs
� Long-term R&D andtechnological programs� Minimize innovation gap
leaders and laggards
� Incentivize R&D projects� Link industry and academia
� Building technological capabilities
� Improving quality of research,innovation and export infrastructure
� Building managerial and organizationalcapabilities
� Need to develop STEM skills and engineering� Start collaborative projects
� Need for basic infrastructure - NQI and incubation� Elimination of barriers to physical, human and
knowledge capital
STAGE 3Mature
NIS
STAGE 1Incipient
NIS
Lev
el o
f d
evel
op
men
t
STAGE 2Maturing
NIS
Source: Cirera and Maloney (2017).Note: NIS = National Innovation System; NQI = national quality infrastructure; R&D = research and development; STEM = science, technology, engineering, and mathematics.
continued on next page
SEIZING A BRIGHTER FUTURE FOR ALL
101CHAPTER 4. PATHWAY I: FOSTERING A MORE DYNAMIC AND COMPETITIVE PRIVATE SECTOR
4.4 Creating a World-Class Business Environment
4.4.1 Impressive progress in international measures of business environment
168. A business climate conducive to investment is critical to spur growth in firm productivity. A supportive climate encourages firms to invest by removing unjustified costs, risks, and barriers to competition. For instance, as a result of improvements in their investment climate in the 1980s and 1990s, private investment as a share of GDP nearly doubled in China and India and more than doubled in Uganda.130 There is also evidence that in the 1990s in Poland, Romania, Russia, Slovakia, and Ukraine, firms that believed their property rights were secure reinvested 14 to 40 percent more of their profits than those that did not.131 It is not just the volume of investment that matters for growth, it is also the productivity gains that ensue. A good investment climate stimulates productivity by providing opportunities and incentives for firms to develop, adapt, and adopt better ways to organize production and distribution and respond to consumers. It is easier for firms to enter and exit markets where there are policies that help heighten productivity. Indeed, net market entry can account for more than 30 percent of productivity growth.132
169. FYR Macedonia has made significant strides in streamlining regulations that affect businesses. In the past 10 years the authorities have conducted highly visible and measurable business-climate reforms, including regulatory improvements (see Chapter 1), and the reforms have led to considerable
130 World Bank (2004), World Development Report 2005: A Better Investment Climate for Everyone.131 Johnson, McMillan, and Woodruff (2002).132 Bartelsman et al. (2004).
implied by the previous two barriers. The highest barrier, they believe, is the absence of such complementarities as physical and human capital, which becomes more acute with distance from the frontier. If a firm, or a country, invests in innovation but cannot import needed machines, contract with trained workers and engineers, or draw on new organizational techniques, the returns on investment will be low. Conditions that interfere with the accumulation of physical and human capital—such as the cost of doing business, the trade regime, the competitiveness framework, or capital markets—and conditions that are particularly important to innovation—such as protection of intellectual property rights or market failures that demotivate the accumulation of knowledge—affect investment returns and thus investment in innovation.
These findings imply the need for a more nuanced approach to heightening innovation: policymakers’ thinking on national innovation systems must go beyond institutions and policies that simply subsidize or promote direct innovation in firms to move to offset innovation-related market failures and respond to broad complementary factors that affect the promotion of innovation (Figure B4.4).Source: Authors based on Cirera and Maloney (2017).
Box 4.4 continued from previous page
FYR MACEDONIA SYSTEMATIC COUNTRY DIAGNOSTIC
102 CHAPTER 4. PATHWAY I: FOSTERING A MORE DYNAMIC AND COMPETITIVE PRIVATE SECTOR
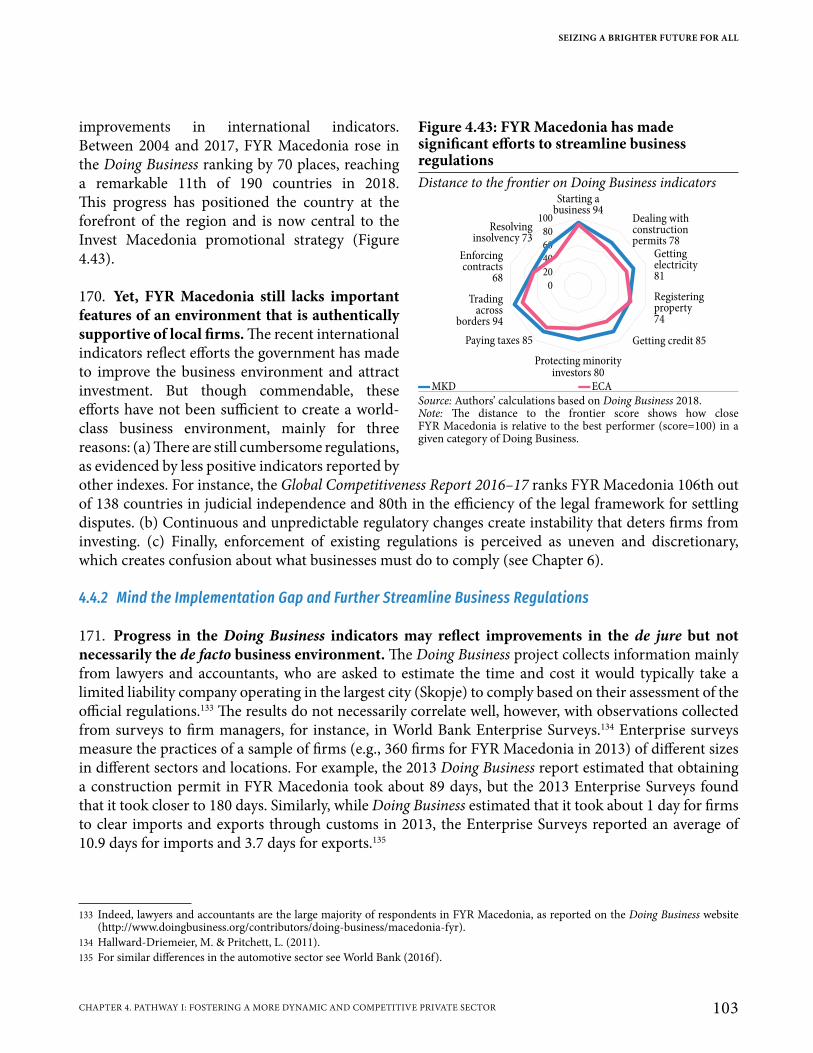
improvements in international indicators. Between 2004 and 2017, FYR Macedonia rose in the Doing Business ranking by 70 places, reaching a remarkable 11th of 190 countries in 2018. This progress has positioned the country at the forefront of the region and is now central to the Invest Macedonia promotional strategy (Figure 4.43).
170. Yet, FYR Macedonia still lacks important features of an environment that is authentically supportive of local firms. The recent international indicators reflect efforts the government has made to improve the business environment and attract investment. But though commendable, these efforts have not been sufficient to create a world-class business environment, mainly for three reasons: (a) There are still cumbersome regulations, as evidenced by less positive indicators reported by other indexes. For instance, the Global Competitiveness Report 2016–17 ranks FYR Macedonia 106th out of 138 countries in judicial independence and 80th in the efficiency of the legal framework for settling disputes. (b) Continuous and unpredictable regulatory changes create instability that deters firms from investing. (c) Finally, enforcement of existing regulations is perceived as uneven and discretionary, which creates confusion about what businesses must do to comply (see Chapter 6).
4.4.2 Mind the Implementation Gap and Further Streamline Business Regulations
171. Progress in the Doing Business indicators may reflect improvements in the de jure but not necessarily the de facto business environment. The Doing Business project collects information mainly from lawyers and accountants, who are asked to estimate the time and cost it would typically take a limited liability company operating in the largest city (Skopje) to comply based on their assessment of the official regulations.133 The results do not necessarily correlate well, however, with observations collected from surveys to firm managers, for instance, in World Bank Enterprise Surveys.134 Enterprise surveys measure the practices of a sample of firms (e.g., 360 firms for FYR Macedonia in 2013) of different sizes in different sectors and locations. For example, the 2013 Doing Business report estimated that obtaining a construction permit in FYR Macedonia took about 89 days, but the 2013 Enterprise Surveys found that it took closer to 180 days. Similarly, while Doing Business estimated that it took about 1 day for firms to clear imports and exports through customs in 2013, the Enterprise Surveys reported an average of 10.9 days for imports and 3.7 days for exports.135
133 Indeed, lawyers and accountants are the large majority of respondents in FYR Macedonia, as reported on the Doing Business website (http://www.doingbusiness.org/contributors/doing-business/macedonia-fyr).
134 Hallward-Driemeier, M. & Pritchett, L. (2011).135 For similar differences in the automotive sector see World Bank (2016f).
Figure 4.43: FYR Macedonia has made significant efforts to streamline business regulationsDistance to the frontier on Doing Business indicators
Starting abusiness 94
Protecting minorityinvestors 80
Dealing withconstructionpermits 78
Gettingelectricity81
Registeringproperty74
Getting credit 85
Resolvinginsolvency 73
Enforcingcontracts
68
Tradingacross
borders 94
Paying taxes 85
100
80
60
40
20
0
▬MKD ▬ECASource: Authors’ calculations based on Doing Business 2018.Note: The distance to the frontier score shows how close FYR Macedonia is relative to the best performer (score=100) in a given category of Doing Business.
SEIZING A BRIGHTER FUTURE FOR ALL
103CHAPTER 4. PATHWAY I: FOSTERING A MORE DYNAMIC AND COMPETITIVE PRIVATE SECTOR
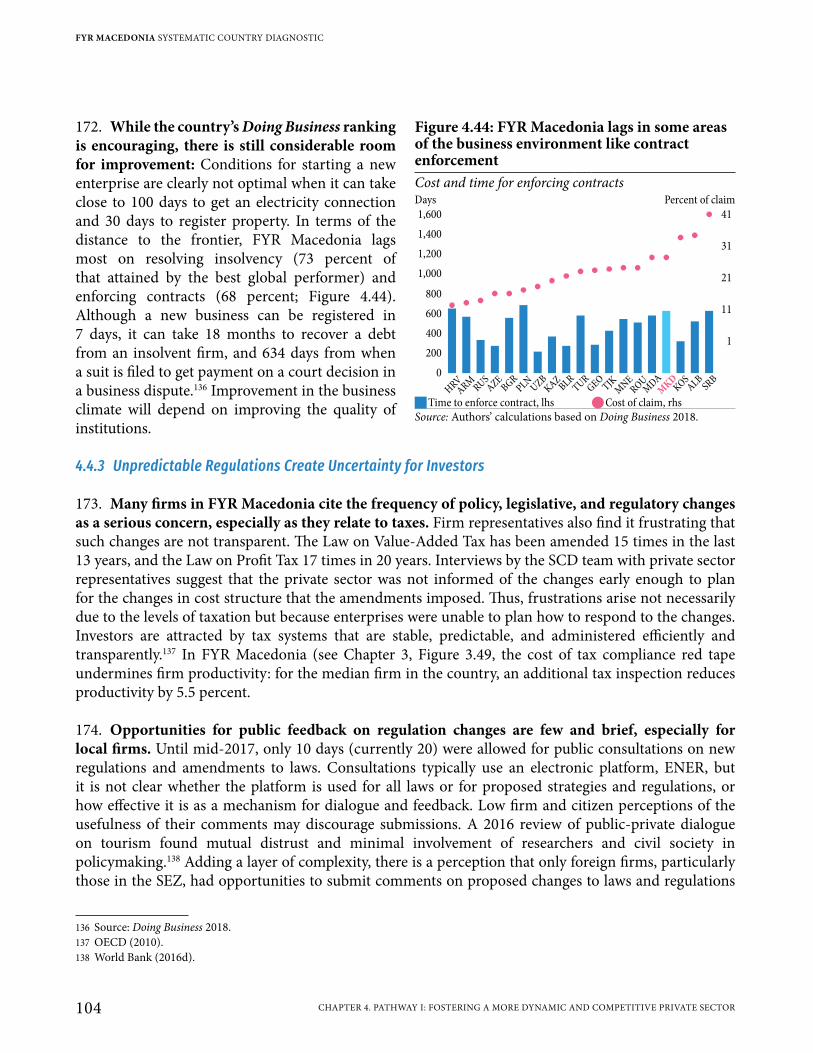
172. While the country’s Doing Business ranking is encouraging, there is still considerable room for improvement: Conditions for starting a new enterprise are clearly not optimal when it can take close to 100 days to get an electricity connection and 30 days to register property. In terms of the distance to the frontier, FYR Macedonia lags most on resolving insolvency (73 percent of that attained by the best global performer) and enforcing contracts (68 percent; Figure 4.44). Although a new business can be registered in 7 days, it can take 18 months to recover a debt from an insolvent firm, and 634 days from when a suit is filed to get payment on a court decision in a business dispute.136 Improvement in the business climate will depend on improving the quality of institutions.
4.4.3 Unpredictable Regulations Create Uncertainty for Investors
173. Many firms in FYR Macedonia cite the frequency of policy, legislative, and regulatory changes as a serious concern, especially as they relate to taxes. Firm representatives also find it frustrating that such changes are not transparent. The Law on Value-Added Tax has been amended 15 times in the last 13 years, and the Law on Profit Tax 17 times in 20 years. Interviews by the SCD team with private sector representatives suggest that the private sector was not informed of the changes early enough to plan for the changes in cost structure that the amendments imposed. Thus, frustrations arise not necessarily due to the levels of taxation but because enterprises were unable to plan how to respond to the changes. Investors are attracted by tax systems that are stable, predictable, and administered efficiently and transparently.137 In FYR Macedonia (see Chapter 3, Figure 3.49, the cost of tax compliance red tape undermines firm productivity: for the median firm in the country, an additional tax inspection reduces productivity by 5.5 percent.
174. Opportunities for public feedback on regulation changes are few and brief, especially for local firms. Until mid-2017, only 10 days (currently 20) were allowed for public consultations on new regulations and amendments to laws. Consultations typically use an electronic platform, ENER, but it is not clear whether the platform is used for all laws or for proposed strategies and regulations, or how effective it is as a mechanism for dialogue and feedback. Low firm and citizen perceptions of the usefulness of their comments may discourage submissions. A 2016 review of public-private dialogue on tourism found mutual distrust and minimal involvement of researchers and civil society in policymaking.138 Adding a layer of complexity, there is a perception that only foreign firms, particularly those in the SEZ, had opportunities to submit comments on proposed changes to laws and regulations
136 Source: Doing Business 2018.137 OECD (2010).138 World Bank (2016d).
Figure 4.44: FYR Macedonia lags in some areas of the business environment like contract enforcementCost and time for enforcing contractsDays Percent of claim1,600 41
1,400
311,200
211,000
11
800
1
600
400
200
0
HRV
ARM
RU
S
AZE
BG
R
PLN
UZB
KA
ZBLR
TU
R
GEO
TJK
MN
E
RO
UM
DA
MK
DKO
SA
LB
SRB
JTime to enforce contract, lhs QCost of claim, rhsSource: Authors’ calculations based on Doing Business 2018.
FYR MACEDONIA SYSTEMATIC COUNTRY DIAGNOSTIC
104 CHAPTER 4. PATHWAY I: FOSTERING A MORE DYNAMIC AND COMPETITIVE PRIVATE SECTOR
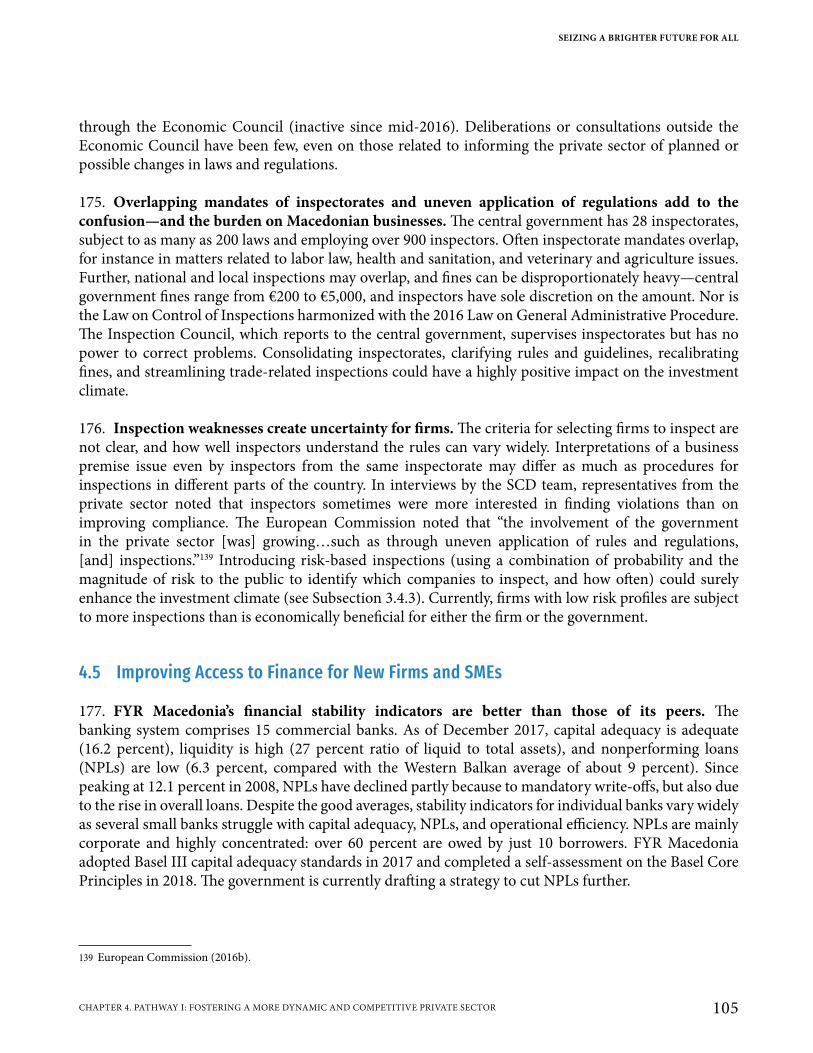
through the Economic Council (inactive since mid-2016). Deliberations or consultations outside the Economic Council have been few, even on those related to informing the private sector of planned or possible changes in laws and regulations.
175. Overlapping mandates of inspectorates and uneven application of regulations add to the confusion—and the burden on Macedonian businesses. The central government has 28 inspectorates, subject to as many as 200 laws and employing over 900 inspectors. Often inspectorate mandates overlap, for instance in matters related to labor law, health and sanitation, and veterinary and agriculture issues. Further, national and local inspections may overlap, and fines can be disproportionately heavy—central government fines range from €200 to €5,000, and inspectors have sole discretion on the amount. Nor is the Law on Control of Inspections harmonized with the 2016 Law on General Administrative Procedure. The Inspection Council, which reports to the central government, supervises inspectorates but has no power to correct problems. Consolidating inspectorates, clarifying rules and guidelines, recalibrating fines, and streamlining trade-related inspections could have a highly positive impact on the investment climate.
176. Inspection weaknesses create uncertainty for firms. The criteria for selecting firms to inspect are not clear, and how well inspectors understand the rules can vary widely. Interpretations of a business premise issue even by inspectors from the same inspectorate may differ as much as procedures for inspections in different parts of the country. In interviews by the SCD team, representatives from the private sector noted that inspectors sometimes were more interested in finding violations than on improving compliance. The European Commission noted that “the involvement of the government in the private sector [was] growing…such as through uneven application of rules and regulations, [and] inspections.”139 Introducing risk-based inspections (using a combination of probability and the magnitude of risk to the public to identify which companies to inspect, and how often) could surely enhance the investment climate (see Subsection 3.4.3). Currently, firms with low risk profiles are subject to more inspections than is economically beneficial for either the firm or the government.
4.5 Improving Access to Finance for New Firms and SMEs
177. FYR Macedonia’s financial stability indicators are better than those of its peers. The banking system comprises 15 commercial banks. As of December 2017, capital adequacy is adequate (16.2 percent), liquidity is high (27 percent ratio of liquid to total assets), and nonperforming loans (NPLs) are low (6.3 percent, compared with the Western Balkan average of about 9 percent). Since peaking at 12.1 percent in 2008, NPLs have declined partly because to mandatory write-offs, but also due to the rise in overall loans. Despite the good averages, stability indicators for individual banks vary widely as several small banks struggle with capital adequacy, NPLs, and operational efficiency. NPLs are mainly corporate and highly concentrated: over 60 percent are owed by just 10 borrowers. FYR Macedonia adopted Basel III capital adequacy standards in 2017 and completed a self-assessment on the Basel Core Principles in 2018. The government is currently drafting a strategy to cut NPLs further.
139 European Commission (2016b).
SEIZING A BRIGHTER FUTURE FOR ALL
105CHAPTER 4. PATHWAY I: FOSTERING A MORE DYNAMIC AND COMPETITIVE PRIVATE SECTOR
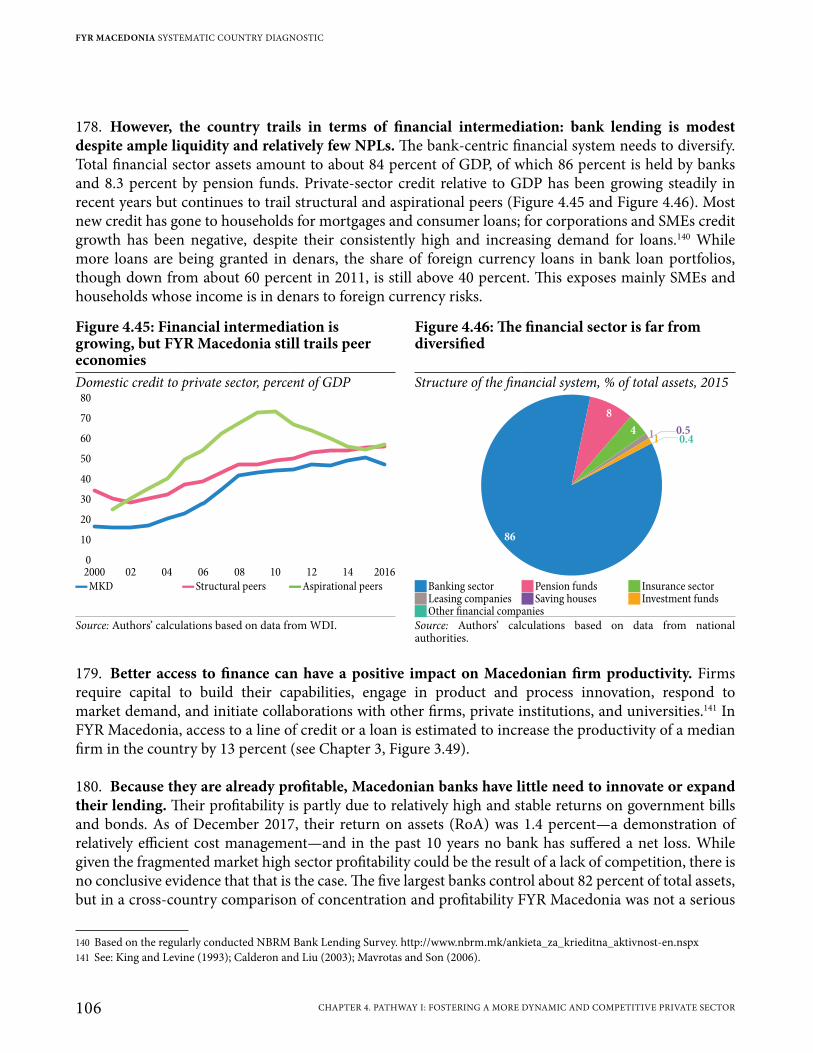
178. However, the country trails in terms of financial intermediation: bank lending is modest despite ample liquidity and relatively few NPLs. The bank-centric financial system needs to diversify. Total financial sector assets amount to about 84 percent of GDP, of which 86 percent is held by banks and 8.3 percent by pension funds. Private-sector credit relative to GDP has been growing steadily in recent years but continues to trail structural and aspirational peers (Figure 4.45 and Figure 4.46). Most new credit has gone to households for mortgages and consumer loans; for corporations and SMEs credit growth has been negative, despite their consistently high and increasing demand for loans.140 While more loans are being granted in denars, the share of foreign currency loans in bank loan portfolios, though down from about 60 percent in 2011, is still above 40 percent. This exposes mainly SMEs and households whose income is in denars to foreign currency risks.
179. Better access to finance can have a positive impact on Macedonian firm productivity. Firms require capital to build their capabilities, engage in product and process innovation, respond to market demand, and initiate collaborations with other firms, private institutions, and universities.141 In FYR Macedonia, access to a line of credit or a loan is estimated to increase the productivity of a median firm in the country by 13 percent (see Chapter 3, Figure 3.49).
180. Because they are already profitable, Macedonian banks have little need to innovate or expand their lending. Their profitability is partly due to relatively high and stable returns on government bills and bonds. As of December 2017, their return on assets (RoA) was 1.4 percent—a demonstration of relatively efficient cost management—and in the past 10 years no bank has suffered a net loss. While given the fragmented market high sector profitability could be the result of a lack of competition, there is no conclusive evidence that that is the case. The five largest banks control about 82 percent of total assets, but in a cross-country comparison of concentration and profitability FYR Macedonia was not a serious
140 Based on the regularly conducted NBRM Bank Lending Survey. http://www.nbrm.mk/ankieta_za_krieditna_aktivnost-en.nspx141 See: King and Levine (1993); Calderon and Liu (2003); Mavrotas and Son (2006).
Figure 4.45: Financial intermediation is growing, but FYR Macedonia still trails peer economies
Figure 4.46: The financial sector is far from diversified
Domestic credit to private sector, percent of GDP Structure of the financial system, % of total assets, 201580
70
60
50
40
30
20
10
0
20162000 02 04 06 08 10 12 14
86
8
40.4
0.511
▬MKD ▬Structural peers ▬Aspirational peers JBanking sector JPension funds J Insurance sector JLeasing companies JSaving houses J Investment funds JOther financial companies
Source: Authors’ calculations based on data from WDI. Source: Authors’ calculations based on data from national authorities.
FYR MACEDONIA SYSTEMATIC COUNTRY DIAGNOSTIC
106 CHAPTER 4. PATHWAY I: FOSTERING A MORE DYNAMIC AND COMPETITIVE PRIVATE SECTOR
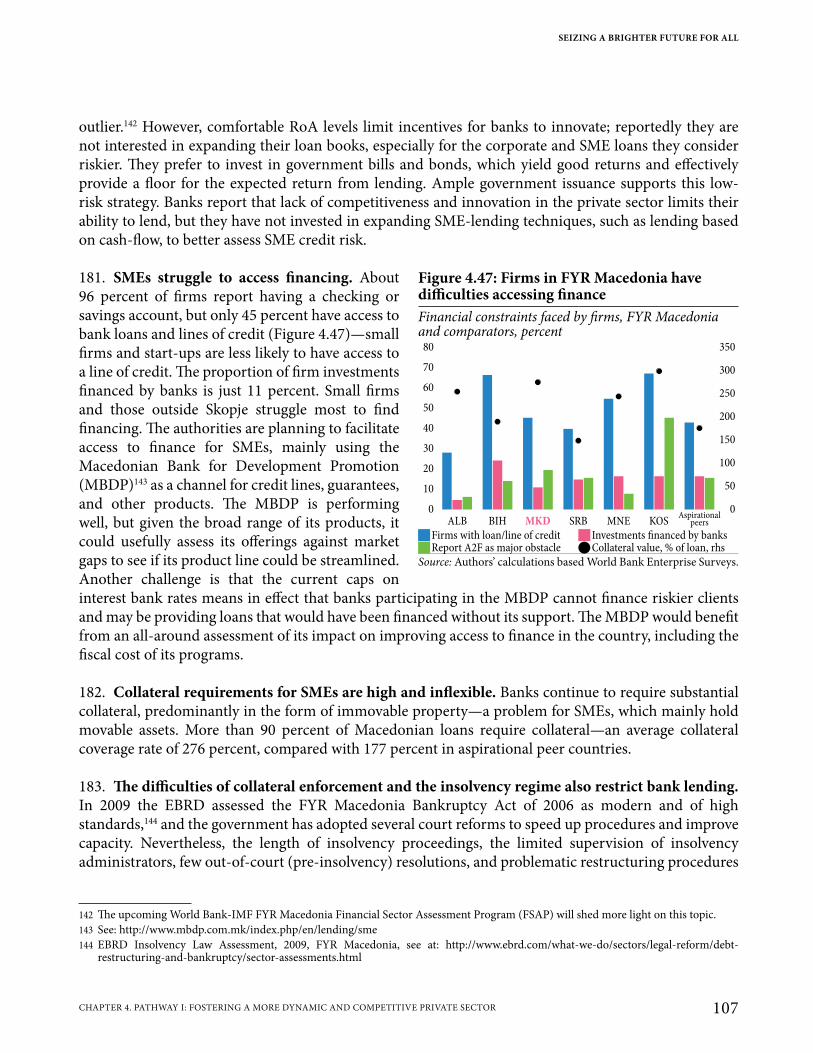
outlier.142 However, comfortable RoA levels limit incentives for banks to innovate; reportedly they are not interested in expanding their loan books, especially for the corporate and SME loans they consider riskier. They prefer to invest in government bills and bonds, which yield good returns and effectively provide a floor for the expected return from lending. Ample government issuance supports this low-risk strategy. Banks report that lack of competitiveness and innovation in the private sector limits their ability to lend, but they have not invested in expanding SME-lending techniques, such as lending based on cash-flow, to better assess SME credit risk.
181. SMEs struggle to access financing. About 96 percent of firms report having a checking or savings account, but only 45 percent have access to bank loans and lines of credit (Figure 4.47)—small firms and start-ups are less likely to have access to a line of credit. The proportion of firm investments financed by banks is just 11 percent. Small firms and those outside Skopje struggle most to find financing. The authorities are planning to facilitate access to finance for SMEs, mainly using the Macedonian Bank for Development Promotion (MBDP)143 as a channel for credit lines, guarantees, and other products. The MBDP is performing well, but given the broad range of its products, it could usefully assess its offerings against market gaps to see if its product line could be streamlined. Another challenge is that the current caps on interest bank rates means in effect that banks participating in the MBDP cannot finance riskier clients and may be providing loans that would have been financed without its support. The MBDP would benefit from an all-around assessment of its impact on improving access to finance in the country, including the fiscal cost of its programs.
182. Collateral requirements for SMEs are high and inflexible. Banks continue to require substantial collateral, predominantly in the form of immovable property—a problem for SMEs, which mainly hold movable assets. More than 90 percent of Macedonian loans require collateral—an average collateral coverage rate of 276 percent, compared with 177 percent in aspirational peer countries.
183. The difficulties of collateral enforcement and the insolvency regime also restrict bank lending. In 2009 the EBRD assessed the FYR Macedonia Bankruptcy Act of 2006 as modern and of high standards,144 and the government has adopted several court reforms to speed up procedures and improve capacity. Nevertheless, the length of insolvency proceedings, the limited supervision of insolvency administrators, few out-of-court (pre-insolvency) resolutions, and problematic restructuring procedures
142 The upcoming World Bank-IMF FYR Macedonia Financial Sector Assessment Program (FSAP) will shed more light on this topic.143 See: http://www.mbdp.com.mk/index.php/en/lending/sme144 EBRD Insolvency Law Assessment, 2009, FYR Macedonia, see at: http://www.ebrd.com/what-we-do/sectors/legal-reform/debt-
restructuring-and-bankruptcy/sector-assessments.html
Figure 4.47: Firms in FYR Macedonia have difficulties accessing financeFinancial constraints faced by firms, FYR Macedonia and comparators, percent
80 350
70
60
300
250
50
40200
15030
20100
5010
0 0ALB BIH MKD SRB MNE KOS
Aspirationalpeers
JFirms with loan/line of credit J Investments financed by banks JReport A2F as major obstacle QCollateral value, % of loan, rhs
Source: Authors’ calculations based World Bank Enterprise Surveys.
SEIZING A BRIGHTER FUTURE FOR ALL
107CHAPTER 4. PATHWAY I: FOSTERING A MORE DYNAMIC AND COMPETITIVE PRIVATE SECTOR
all make it harder for firms to exit.145 On average it takes 1.5 years for creditors to be repaid, and they recover on average 47.7 cents on the dollar, compared to the OECD average of over 70 cents.146
184. To manage their finances successfully and make sound business decisions, SMEs need solid financial information, analysis, and advice. For advice, they usually call on small accounting firms.147 A 2014 review of a sample of published Macedonian firm financial statements conducted as part of the Accounting and Auditing Report on Observance of Standards and Codes found the quality of SME financial reporting to be inadequate and the skills of their accountancy firms in urgent need of upgrading.148 Complicating matters is the low demand within the business community for quality financial information and hardly any awareness of the benefits of financial analysis beyond traditional compliance.149
185. Diversifying the financial sector would help mobilize long-term financing to support private investment and make available to SMEs and startups alternative financing sources, such as venture capital and private equity. Venture capital and private equity are just emerging in FYR Macedonia—which according to the 2015 Venture Capital Attractiveness Index150 is not considered an attractive investment destination, due to its shallow capital market, limited entrepreneurial opportunities, moderate GDP output potential, and high unemployment. Capital market activity is limited; market capitalization is about 25 percent of GDP and the secondary market is thin. The nonbank financial sector is shallow and institutional investors (e.g., pension funds and insurance companies) prefer to invest in low-risk government and bank securities. While pension funds can invest up to 5 percent in local investment funds, they are not currently doing so. A draft law to allow lifecycle funds that match the risk profile of invested pension assets with the age of the asset holder has reportedly been awaiting government approval since 2012. However, as the institutional investor base grows, interest in alternative investment opportunities may increase. Building up the venture capital and private equity markets could help open up access to financing for innovative startups and SMEs.151
4.6 Developing a Digital Economy
186. High prices for telecommunications slow adoption of productivity-enhancing high-speed broadband connections. FYR Macedonia has the highest price for a 30 Mbps broadband connection and the second highest for a >10 Mbps connection in the Western Balkans (Figure 4.48). As a result, it had one of the lowest take-up rates for high-speed broadband in the sub-region, and its average connection speed is slow even for the Western Balkans (Figure 4.49). In the first quarter of 2017, connections
145 EU Progress Report on FYR Macedonia, 2015, p. 30.146 http://www.doingbusiness.org/data/exploreeconomies/macedonia-fyr#resolving-insolvency147 The Role of SMPs in Providing Business Support to SMEs: New Evidence, IFAC; https://www.ifac.org/publications-resources/role-
smps-providing-business-support-smes-new-evidence148 The establishment of the Institute of Accountants and Certified Accountants has provided a sustainable foundation for skills
development in the accountancy profession.149 European Commission (2016a), “Small Business Assessment Fact Sheet”.150 This index is published by the IESE, a Spanish business school, and combines assessments of business development, regulations, and
entrepreneurial and investment activity into a single ranking. See Groh et al. (2015).151 Cusolito et al. (2016) identify challenges to developing venture capital financing in FYR Macedonia, among them the small number
of investable startups, due in part to “brain drain” as educated Macedonians emigrate; tax and compensation structures that generate disincentives for angel investment; and questions about the degree of investment-readiness among entrepreneurs.
FYR MACEDONIA SYSTEMATIC COUNTRY DIAGNOSTIC
108 CHAPTER 4. PATHWAY I: FOSTERING A MORE DYNAMIC AND COMPETITIVE PRIVATE SECTOR

Figure 4.48: ICT services are not very affordable Figure 4.49: Despite relatively high broadband penetration, FYR Macedonia’s does not have much fiber optic connectivity
Monthly subscription of the most affordable >30 Mbps broadband connection, USD PPP % of monthly household expenses, 2015
Broadband household penetration and adoption of slow and fast connections, percent
Price of most affordable 30Mbps connection (USD PPP)120
100
80
60
40
20
0
0 2 4 6 8 10 12 14 16
ROU
EU27BGR
GRC
SRBMNE
BIHALB
HRV MKD
ITU threshold
100
90
80
70
60
50
40
30
20
10
0HRVROU BIH SRB BGR MKD CZE GRC SVN
Percentage of HH expense of most affordable 30Mbps connection JBroadband HH penetration, 2016 ▬Adoption of 25 Mbps, Q1 2017 ▬Adoption of 10 Mbps, Q1 2017 ▬Adoption of 4 Mbps, Q1 2017 ▬Percentage of FTTH connections out of all broadband
Source: Deloitte for the World Bank based on data from the World Bank, 2013; commercial offers from the operators, 2015; ASK results of household budget survey, 2013.Note: HH = household; ITU threshold corresponds to the international affordability standard set up by the UN Broadband Commission.
Source: Akamai (2017), The State of the Internet Report.
Figure 4.50: FYR Macedonia’s wholesale broadband market structure is not competitive
Figure 4.51: The energy sector could support development of the wholesale broadband market through infrastructure sharing arrangements
Wholesale broadband internet services concentration, market shares and Herfindahl-Hirschman Index
Fiber optic infrastructure of the electricity transmission operator MEPSO
100
90
80
70
60
50
40
30
20
10
0SRB MKD ALB KOS BIH MNE
0.49 0.49
0.39 0.400.38
0.36
30 km
SS Delcevo
SS Berovo
SS Strumica
SS Radovic
SS Stip 1,2
SS Bucim
SS KocaniSS Probistip
SS Kratovo
Kriva PalankaSS Kumanovo
Tetovo
SS Gostivar
HPP Spilje
SS StrugaSS Ohrid 1,2 SS Resen
SS Bitola 1,4
SS Prilep
Kicevo
SS KavadarciSS Dubrovo
SS Veles 1,2
Gevgelija
SS Valandovo
Sveti Nikole
SS Oslomej
Bogovinje
SS Ma. Kamenitsa
HPP TikvesHPP Globocica
HPP Vrutok
Greece
TPP BitolaSS Bitola 3
SS Basino Selo
Bulgaria
Serbia
Kosovo
HPP KozjakHPP St. Petka
SS Skopje 3
SS Skopje 1/5SS JugohromSS Gj. Petrov
SS BunardjikSS Skopje 2,4
JLeader J2nd J3rd JOther JHHISource: Wholesale BB providers/competitors, NRAs, Clients of wholesale BB providers, Networld Consulting estimations.Note: Calculation based on relative share (length of the provider of optical cable leased divided by total length of the optical cable leased in each country) of the leased backbone optical cable of the wholesale BB providers/competitors. Number at top of bars represents Herfindahl-Hirschman Index by country.
Source: Balkans Digital Highway Project, World Bank, 2017.
SEIZING A BRIGHTER FUTURE FOR ALL
109CHAPTER 4. PATHWAY I: FOSTERING A MORE DYNAMIC AND COMPETITIVE PRIVATE SECTOR
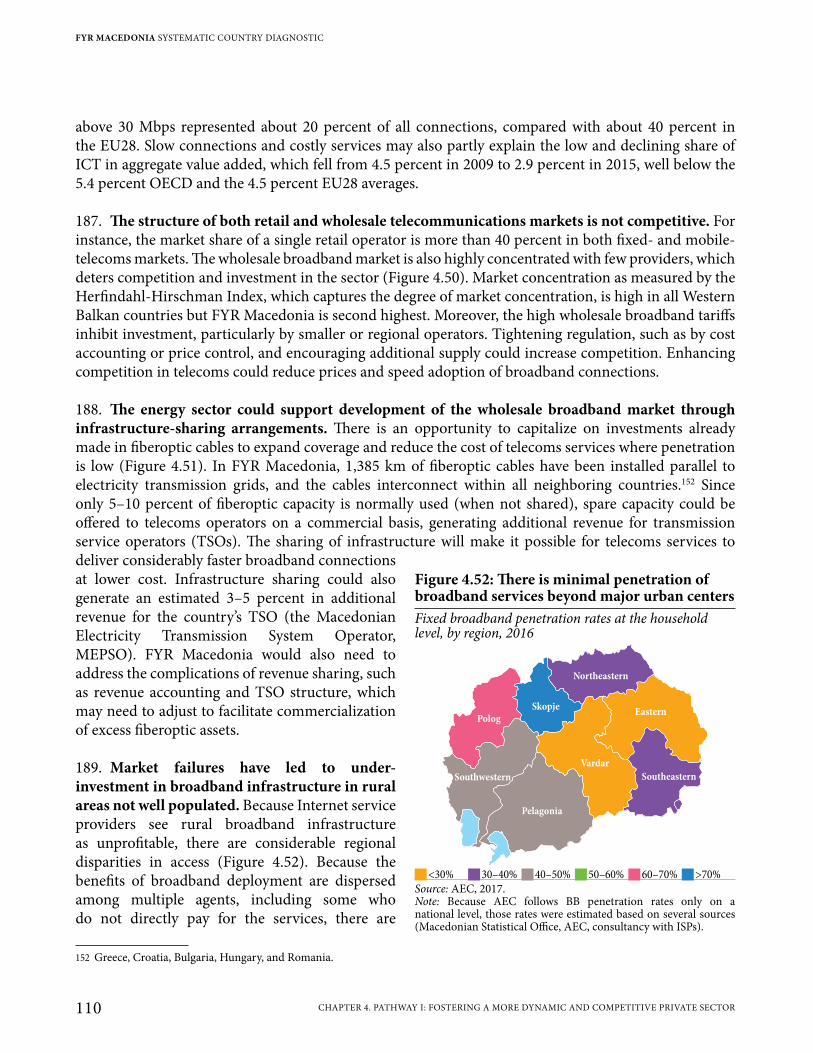
above 30 Mbps represented about 20 percent of all connections, compared with about 40 percent in the EU28. Slow connections and costly services may also partly explain the low and declining share of ICT in aggregate value added, which fell from 4.5 percent in 2009 to 2.9 percent in 2015, well below the 5.4 percent OECD and the 4.5 percent EU28 averages.
187. The structure of both retail and wholesale telecommunications markets is not competitive. For instance, the market share of a single retail operator is more than 40 percent in both fixed- and mobile-telecoms markets. The wholesale broadband market is also highly concentrated with few providers, which deters competition and investment in the sector (Figure 4.50). Market concentration as measured by the Herfindahl-Hirschman Index, which captures the degree of market concentration, is high in all Western Balkan countries but FYR Macedonia is second highest. Moreover, the high wholesale broadband tariffs inhibit investment, particularly by smaller or regional operators. Tightening regulation, such as by cost accounting or price control, and encouraging additional supply could increase competition. Enhancing competition in telecoms could reduce prices and speed adoption of broadband connections.
188. The energy sector could support development of the wholesale broadband market through infrastructure-sharing arrangements. There is an opportunity to capitalize on investments already made in fiberoptic cables to expand coverage and reduce the cost of telecoms services where penetration is low (Figure 4.51). In FYR Macedonia, 1,385 km of fiberoptic cables have been installed parallel to electricity transmission grids, and the cables interconnect within all neighboring countries.152 Since only 5–10 percent of fiberoptic capacity is normally used (when not shared), spare capacity could be offered to telecoms operators on a commercial basis, generating additional revenue for transmission service operators (TSOs). The sharing of infrastructure will make it possible for telecoms services to deliver considerably faster broadband connections at lower cost. Infrastructure sharing could also generate an estimated 3–5 percent in additional revenue for the country’s TSO (the Macedonian Electricity Transmission System Operator, MEPSO). FYR Macedonia would also need to address the complications of revenue sharing, such as revenue accounting and TSO structure, which may need to adjust to facilitate commercialization of excess fiberoptic assets.
189. Market failures have led to under-investment in broadband infrastructure in rural areas not well populated. Because Internet service providers see rural broadband infrastructure as unprofitable, there are considerable regional disparities in access (Figure 4.52). Because the benefits of broadband deployment are dispersed among multiple agents, including some who do not directly pay for the services, there are
152 Greece, Croatia, Bulgaria, Hungary, and Romania.
Figure 4.52: There is minimal penetration of broadband services beyond major urban centersFixed broadband penetration rates at the household level, by region, 2016
PologSkopje
Northeastern
Eastern
Southeastern
Vardar
Pelagonia
Southwestern
J<30% J30–40% J40–50% J50–60% J60–70% J>70%Source: AEC, 2017.Note: Because AEC follows BB penetration rates only on a national level, those rates were estimated based on several sources (Macedonian Statistical Office, AEC, consultancy with ISPs).
FYR MACEDONIA SYSTEMATIC COUNTRY DIAGNOSTIC
110 CHAPTER 4. PATHWAY I: FOSTERING A MORE DYNAMIC AND COMPETITIVE PRIVATE SECTOR
broadband market failures on the supply side. Public intervention is thus essential to help Macedonia realize benefits of broadband that cannot be achieved through the market mechanism alone. At different levels of intensity, all countries in the region face a similar situation. The government’s broadband strategy, currently being drafted, should specify approaches to addressing failures in rural markets, such as using public co-financing to crowd-in private investments.
190. Making more available the skills the economy demands is a prerequisite for developing a Macedonian digital economy. Having the right skills on site makes it possible for firms to smooth the flow and scale of their operations and expand their businesses, which is essential if the industry is to grow. However, FYR Macedonia’s small talent pool is fragmented, consisting of numerous small firms. Moreover, most university graduates are not considered employable because they lack international exposure, technical and soft skills, and managerial competencies—mainly because industry requirements and university curriculums are not aligned, which places a heavy burden on small companies to provide the necessary training. If FYR Macedonia is to grow its IT industry it must not only bring university programs into the 21st century but also provide incentives for companies to undertake their own training. Given the small size of its market, the country should also be participating in regional programs that provide industry-recognized certificates and qualifications. Finally, the government can use the digital skills agenda to upskill the underemployed, especially youth, minority groups, and women.
191. To attract international businesses and sustain the growth of ICT, the country needs to continue streamlining business regulations and might consider creating an IT park. Authorities need to reinforce intellectual property (IP) and cyber protection legislation and build IP and digital capabilities—essential for an industry rooted in innovation and R&D. For a successful IT park, authorities need to pass industry-friendly laws on investing, taxation, trading, quotas, customs, and labor regulations. The park will also depend for its existence on a concentration of human resources and supporting firms. Such a facility should lower the costs of setup and operations and ease procedures for starting and running a business. A business park ensures indirect employment of about three workers for every worker directly employed in IT to fill ancillary needs, such as utilities, roads, cafeterias, and training.
192. FYR Macedonia can expand the market for IT services, but only after sustained brand development and use of market intelligence to reach the target audience. To build a strong brand consistent and targeted marketing, participation in international events, and organizing roadshows are all essential. However, initiatives to improve the country’s brand are sporadic and uncoordinated. Government agencies lack the international exposure and know-how necessary to promote the ICT industry. IT firms, which are quite small, lack the resources and staffing to promote their firms internationally. The government can promote the IT services business in the short and medium term by creating a coordinated branding and marketing strategy tailored to the target market, perhaps by expanding the country’s on-line presence, extending market outreach by participating in international trade events, and organizing regional digital summits.
4.7 Fostering Agricultural Modernization and Competitiveness
193. The agriculture and agri-business sector is a mainstay of FYR Macedonia’s economy, but its growth is declining. In 2015, primary agriculture accounted for 11 percent of GDP and manufacturing
SEIZING A BRIGHTER FUTURE FOR ALL
111CHAPTER 4. PATHWAY I: FOSTERING A MORE DYNAMIC AND COMPETITIVE PRIVATE SECTOR
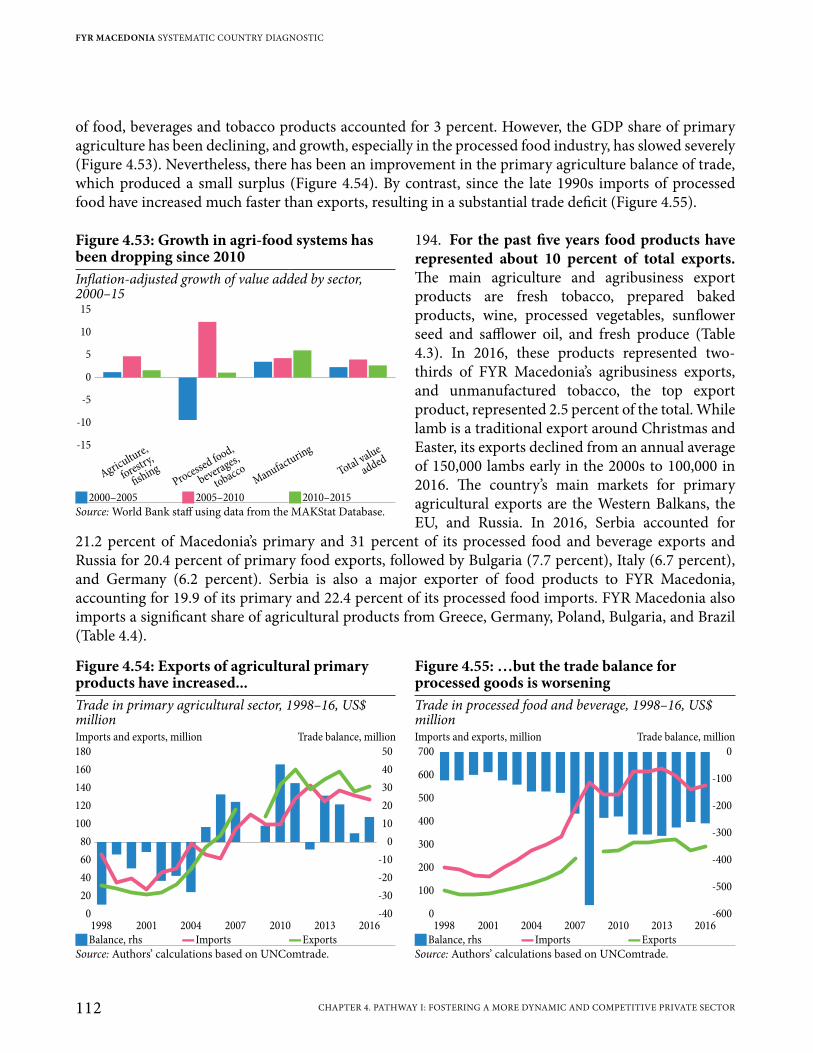
of food, beverages and tobacco products accounted for 3 percent. However, the GDP share of primary agriculture has been declining, and growth, especially in the processed food industry, has slowed severely (Figure 4.53). Nevertheless, there has been an improvement in the primary agriculture balance of trade, which produced a small surplus (Figure 4.54). By contrast, since the late 1990s imports of processed food have increased much faster than exports, resulting in a substantial trade deficit (Figure 4.55).
194. For the past five years food products have represented about 10 percent of total exports. The main agriculture and agribusiness export products are fresh tobacco, prepared baked products, wine, processed vegetables, sunflower seed and safflower oil, and fresh produce (Table 4.3). In 2016, these products represented two-thirds of FYR Macedonia’s agribusiness exports, and unmanufactured tobacco, the top export product, represented 2.5 percent of the total. While lamb is a traditional export around Christmas and Easter, its exports declined from an annual average of 150,000 lambs early in the 2000s to 100,000 in 2016. The country’s main markets for primary agricultural exports are the Western Balkans, the EU, and Russia. In 2016, Serbia accounted for
21.2 percent of Macedonia’s primary and 31 percent of its processed food and beverage exports and Russia for 20.4 percent of primary food exports, followed by Bulgaria (7.7 percent), Italy (6.7 percent), and Germany (6.2 percent). Serbia is also a major exporter of food products to FYR Macedonia, accounting for 19.9 of its primary and 22.4 percent of its processed food imports. FYR Macedonia also imports a significant share of agricultural products from Greece, Germany, Poland, Bulgaria, and Brazil (Table 4.4).
Figure 4.53: Growth in agri-food systems has been dropping since 2010Inflation-adjusted growth of value added by sector, 2000–15
15
10
5
0
-5
-10
-15
Agricultu
re,
forestry,
fishingProcessed food,
beverages,
tobaccoManufacturin
g
Total value
added
J2000–2005 J2005–2010 J2010–2015Source: World Bank staff using data from the MAKStat Database.
Figure 4.54: Exports of agricultural primary products have increased...
Figure 4.55: …but the trade balance for processed goods is worsening
Trade in primary agricultural sector, 1998–16, US$ million
Trade in processed food and beverage, 1998–16, US$ million
Imports and exports, million Trade balance, million Imports and exports, million Trade balance, million180 50
160 40
140 30
120 20
100 10
80 0
60 -10
40 -20
20 -30
0 -40
1998 2001 2004 2007 2010 2013 2016 1998 2001 2004 2007 2010 2013 2016
700 0
600 -100
500-200
400
-300
300
-400200
-500100
0 -600
JBalance, rhs ▬ Imports ▬Exports JBalance, rhs ▬ Imports ▬ExportsSource: Authors’ calculations based on UNComtrade. Source: Authors’ calculations based on UNComtrade.
FYR MACEDONIA SYSTEMATIC COUNTRY DIAGNOSTIC
112 CHAPTER 4. PATHWAY I: FOSTERING A MORE DYNAMIC AND COMPETITIVE PRIVATE SECTOR
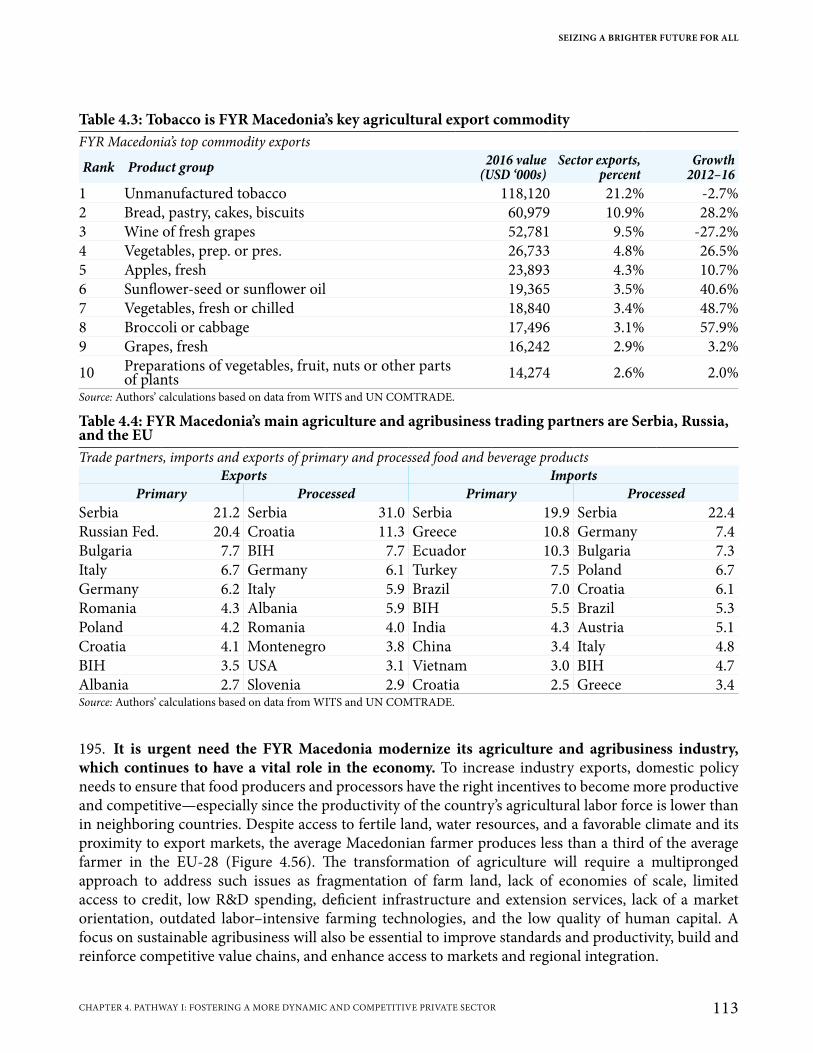
195. It is urgent need the FYR Macedonia modernize its agriculture and agribusiness industry, which continues to have a vital role in the economy. To increase industry exports, domestic policy needs to ensure that food producers and processors have the right incentives to become more productive and competitive—especially since the productivity of the country’s agricultural labor force is lower than in neighboring countries. Despite access to fertile land, water resources, and a favorable climate and its proximity to export markets, the average Macedonian farmer produces less than a third of the average farmer in the EU-28 (Figure 4.56). The transformation of agriculture will require a multipronged approach to address such issues as fragmentation of farm land, lack of economies of scale, limited access to credit, low R&D spending, deficient infrastructure and extension services, lack of a market orientation, outdated labor–intensive farming technologies, and the low quality of human capital. A focus on sustainable agribusiness will also be essential to improve standards and productivity, build and reinforce competitive value chains, and enhance access to markets and regional integration.
Table 4.3: Tobacco is FYR Macedonia’s key agricultural export commodityFYR Macedonia’s top commodity exports
Rank Product group 2016 value (USD ‘000s)
Sector exports, percent
Growth 2012–16
1 Unmanufactured tobacco 118,120 21.2% -2.7%2 Bread, pastry, cakes, biscuits 60,979 10.9% 28.2%3 Wine of fresh grapes 52,781 9.5% -27.2%4 Vegetables, prep. or pres. 26,733 4.8% 26.5%5 Apples, fresh 23,893 4.3% 10.7%6 Sunflower-seed or sunflower oil 19,365 3.5% 40.6%7 Vegetables, fresh or chilled 18,840 3.4% 48.7%8 Broccoli or cabbage 17,496 3.1% 57.9%9 Grapes, fresh 16,242 2.9% 3.2%
10 Preparations of vegetables, fruit, nuts or other parts of plants 14,274 2.6% 2.0%
Source: Authors’ calculations based on data from WITS and UN COMTRADE.
Table 4.4: FYR Macedonia’s main agriculture and agribusiness trading partners are Serbia, Russia, and the EUTrade partners, imports and exports of primary and processed food and beverage products
Exports ImportsPrimary Processed Primary Processed
Serbia 21.2 Serbia 31.0 Serbia 19.9 Serbia 22.4Russian Fed. 20.4 Croatia 11.3 Greece 10.8 Germany 7.4Bulgaria 7.7 BIH 7.7 Ecuador 10.3 Bulgaria 7.3Italy 6.7 Germany 6.1 Turkey 7.5 Poland 6.7Germany 6.2 Italy 5.9 Brazil 7.0 Croatia 6.1Romania 4.3 Albania 5.9 BIH 5.5 Brazil 5.3Poland 4.2 Romania 4.0 India 4.3 Austria 5.1Croatia 4.1 Montenegro 3.8 China 3.4 Italy 4.8BIH 3.5 USA 3.1 Vietnam 3.0 BIH 4.7Albania 2.7 Slovenia 2.9 Croatia 2.5 Greece 3.4Source: Authors’ calculations based on data from WITS and UN COMTRADE.
SEIZING A BRIGHTER FUTURE FOR ALL
113CHAPTER 4. PATHWAY I: FOSTERING A MORE DYNAMIC AND COMPETITIVE PRIVATE SECTOR
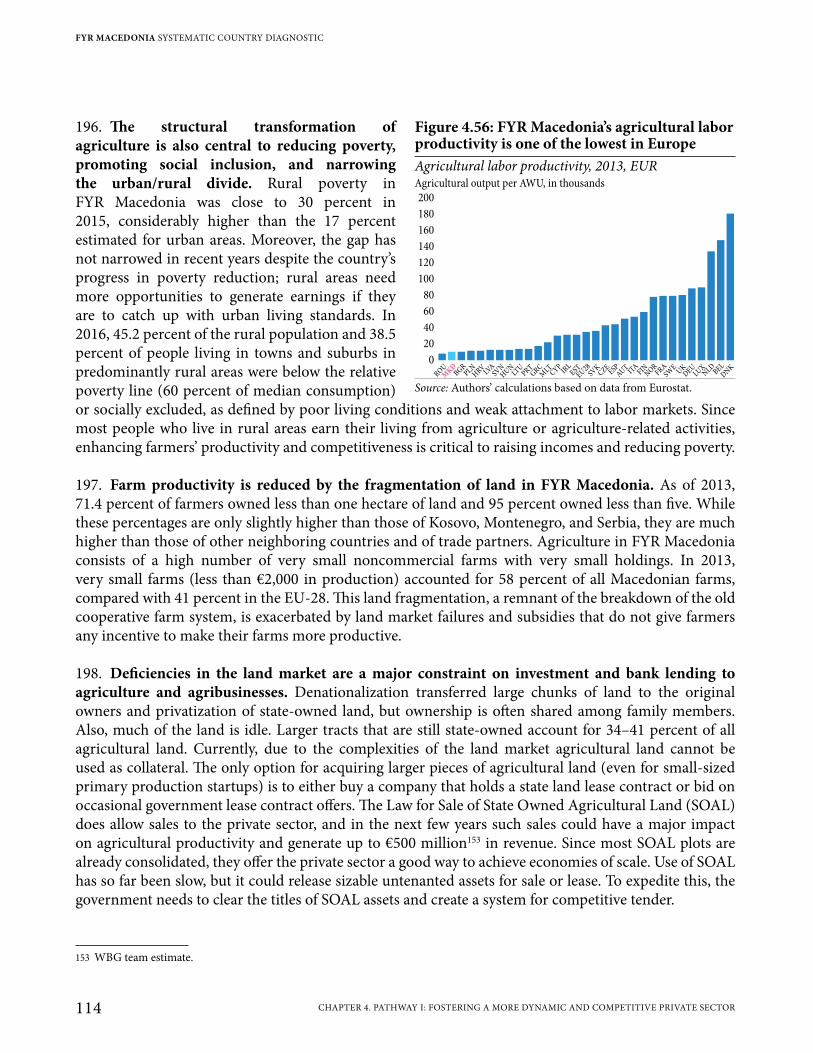
196. The structural transformation of agriculture is also central to reducing poverty, promoting social inclusion, and narrowing the urban/rural divide. Rural poverty in FYR Macedonia was close to 30 percent in 2015, considerably higher than the 17 percent estimated for urban areas. Moreover, the gap has not narrowed in recent years despite the country’s progress in poverty reduction; rural areas need more opportunities to generate earnings if they are to catch up with urban living standards. In 2016, 45.2 percent of the rural population and 38.5 percent of people living in towns and suburbs in predominantly rural areas were below the relative poverty line (60 percent of median consumption) or socially excluded, as defined by poor living conditions and weak attachment to labor markets. Since most people who live in rural areas earn their living from agriculture or agriculture-related activities, enhancing farmers’ productivity and competitiveness is critical to raising incomes and reducing poverty.
197. Farm productivity is reduced by the fragmentation of land in FYR Macedonia. As of 2013, 71.4 percent of farmers owned less than one hectare of land and 95 percent owned less than five. While these percentages are only slightly higher than those of Kosovo, Montenegro, and Serbia, they are much higher than those of other neighboring countries and of trade partners. Agriculture in FYR Macedonia consists of a high number of very small noncommercial farms with very small holdings. In 2013, very small farms (less than €2,000 in production) accounted for 58 percent of all Macedonian farms, compared with 41 percent in the EU-28. This land fragmentation, a remnant of the breakdown of the old cooperative farm system, is exacerbated by land market failures and subsidies that do not give farmers any incentive to make their farms more productive.
198. Deficiencies in the land market are a major constraint on investment and bank lending to agriculture and agribusinesses. Denationalization transferred large chunks of land to the original owners and privatization of state-owned land, but ownership is often shared among family members. Also, much of the land is idle. Larger tracts that are still state-owned account for 34–41 percent of all agricultural land. Currently, due to the complexities of the land market agricultural land cannot be used as collateral. The only option for acquiring larger pieces of agricultural land (even for small-sized primary production startups) is to either buy a company that holds a state land lease contract or bid on occasional government lease contract offers. The Law for Sale of State Owned Agricultural Land (SOAL) does allow sales to the private sector, and in the next few years such sales could have a major impact on agricultural productivity and generate up to €500 million153 in revenue. Since most SOAL plots are already consolidated, they offer the private sector a good way to achieve economies of scale. Use of SOAL has so far been slow, but it could release sizable untenanted assets for sale or lease. To expedite this, the government needs to clear the titles of SOAL assets and create a system for competitive tender.
153 WBG team estimate.
Figure 4.56: FYR Macedonia’s agricultural labor productivity is one of the lowest in EuropeAgricultural labor productivity, 2013, EURAgricultural output per AWU, in thousands200
180
160
140
120
100
80
60
40
20
0ROU
MK
DBGR
PLNHRV
LVA
SVNHUN
LTU
PRTGRC
MLTCYP
IRL
ESTEU28
SVKCZE
ESPAUT IT
AFIN
NORFRA
SWE
UKDEU
LUXNLD
BELDNK
Source: Authors’ calculations based on data from Eurostat.
FYR MACEDONIA SYSTEMATIC COUNTRY DIAGNOSTIC
114 CHAPTER 4. PATHWAY I: FOSTERING A MORE DYNAMIC AND COMPETITIVE PRIVATE SECTOR
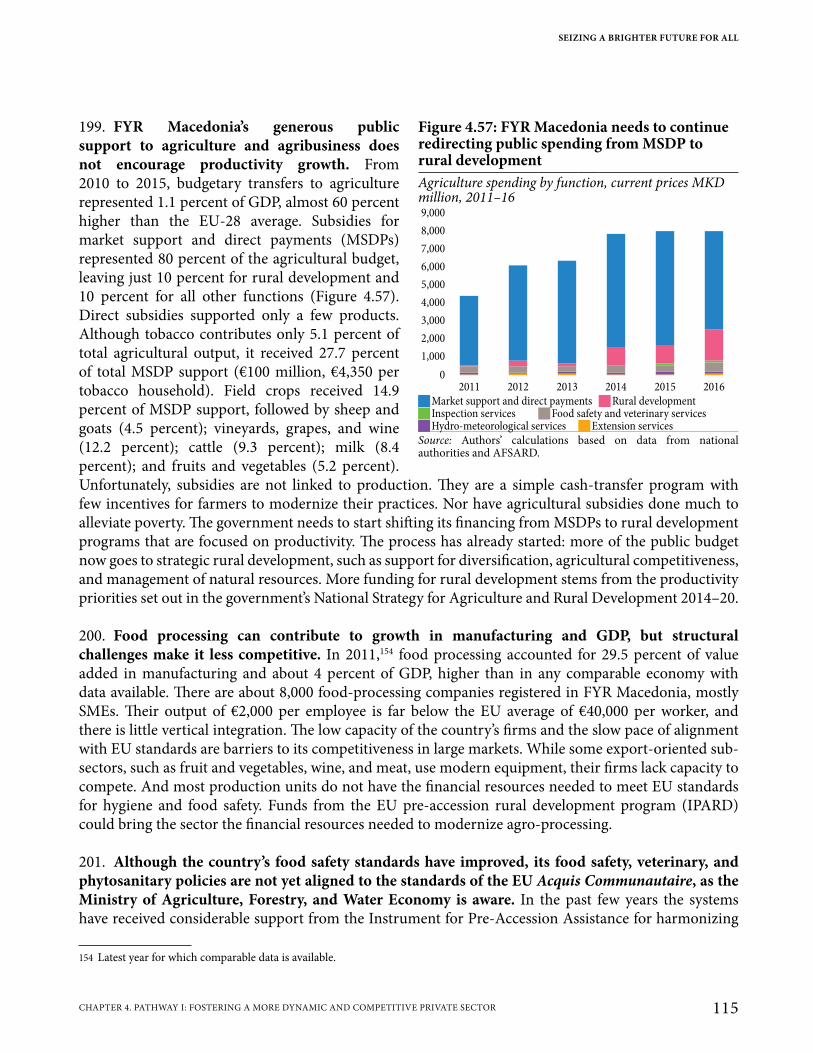
199. FYR Macedonia’s generous public support to agriculture and agribusiness does not encourage productivity growth. From 2010 to 2015, budgetary transfers to agriculture represented 1.1 percent of GDP, almost 60 percent higher than the EU-28 average. Subsidies for market support and direct payments (MSDPs) represented 80 percent of the agricultural budget, leaving just 10 percent for rural development and 10 percent for all other functions (Figure 4.57). Direct subsidies supported only a few products. Although tobacco contributes only 5.1 percent of total agricultural output, it received 27.7 percent of total MSDP support (€100 million, €4,350 per tobacco household). Field crops received 14.9 percent of MSDP support, followed by sheep and goats (4.5 percent); vineyards, grapes, and wine (12.2 percent); cattle (9.3 percent); milk (8.4 percent); and fruits and vegetables (5.2 percent). Unfortunately, subsidies are not linked to production. They are a simple cash-transfer program with few incentives for farmers to modernize their practices. Nor have agricultural subsidies done much to alleviate poverty. The government needs to start shifting its financing from MSDPs to rural development programs that are focused on productivity. The process has already started: more of the public budget now goes to strategic rural development, such as support for diversification, agricultural competitiveness, and management of natural resources. More funding for rural development stems from the productivity priorities set out in the government’s National Strategy for Agriculture and Rural Development 2014–20.
200. Food processing can contribute to growth in manufacturing and GDP, but structural challenges make it less competitive. In 2011,154 food processing accounted for 29.5 percent of value added in manufacturing and about 4 percent of GDP, higher than in any comparable economy with data available. There are about 8,000 food-processing companies registered in FYR Macedonia, mostly SMEs. Their output of €2,000 per employee is far below the EU average of €40,000 per worker, and there is little vertical integration. The low capacity of the country’s firms and the slow pace of alignment with EU standards are barriers to its competitiveness in large markets. While some export-oriented sub-sectors, such as fruit and vegetables, wine, and meat, use modern equipment, their firms lack capacity to compete. And most production units do not have the financial resources needed to meet EU standards for hygiene and food safety. Funds from the EU pre-accession rural development program (IPARD) could bring the sector the financial resources needed to modernize agro-processing.
201. Although the country’s food safety standards have improved, its food safety, veterinary, and phytosanitary policies are not yet aligned to the standards of the EU Acquis Communautaire, as the Ministry of Agriculture, Forestry, and Water Economy is aware. In the past few years the systems have received considerable support from the Instrument for Pre-Accession Assistance for harmonizing
154 Latest year for which comparable data is available.
Figure 4.57: FYR Macedonia needs to continue redirecting public spending from MSDP to rural developmentAgriculture spending by function, current prices MKD million, 2011–169,000
8,000
7,000
6,000
5,000
4,000
3,000
2,000
1,000
0
2011 2012 2013 2014 2015 2016
JMarket support and direct payments JRural development J Inspection services JFood safety and veterinary services JHydro-meteorological services JExtension services
Source: Authors’ calculations based on data from national authorities and AFSARD.
SEIZING A BRIGHTER FUTURE FOR ALL
115CHAPTER 4. PATHWAY I: FOSTERING A MORE DYNAMIC AND COMPETITIVE PRIVATE SECTOR
Macedonian national legislation with the EU Acquis Communautaire—rights and obligations binding on all EU member states.155 Since 2014 separate institutions have conducted agricultural inspections. While local governments do not have an explicit agricultural mandate, most municipalities employ agricultural and environmental service staff, mainly to advise local farmers. Aligning food safety standards with EU requirements is essential to successful growth of the food-processing industry and free movement of agricultural produce in the market.
202. Trade liberalization has created significant opportunities for the Macedonian economy, although domestic market challenges remain. FYR Macedonia’s membership in the WTO and CEFTA, initiation of accession talks with the EU, and bilateral free trade agreements have led to phased reduction in both tariff and nontariff trade barriers. As a result, agribusinesses have benefited from access to foreign markets and reduced input costs. Still, they are negatively affected by destination market levies determined during the harvesting season and some import tariff quotas on important agricultural products. A predictable tariff regime would enable agribusinesses to plan long before the processing season begins, which is critical for both input sourcing and delivery commitments. However, Macedonian agribusiness value chains have been insulated from competition and producers are hard-pressed to retain their shares in domestic markets, particularly as new retail supermarket chains appear. For agribusiness processing to prosper, firms will need to make efficiency-enhancing investments, adopt higher-quality processes and products, and find ways to harness economies of scale and scope. The government can assist by opening up access to finance for agribusinesses and building up the national quality infrastructure to align with EU regulations. Box 4.5 gives examples of problems and opportunities for growth in the wine industry.
155 European Commission (2015).
Box 4.5: Transforming FYR Macedonia’s Wine Industry
FYR Macedonia wine has traditionally been exported as a cheap bulk product, but the industry is being transformed by new boutique wineries that have better quality and branding. In addition to the seven large producers that dominate bulk wine exports, an increasing number of small- and medium-sized wineries are producing bottled wine. FDI in the wine industry has so far been negligible; its prospects will depend on the ability of wineries to act together to shift production toward bottled wine and establish visible branding. Wineries also need to take full advantage of EU market quotas for bottled wines and penetrate high-growth markets, although again this will require coordinated effort by producers. Local wineries face intense global competition and a growing surplus of wine in the EU that drives down prices. For the last decade the average capacity utilization of FYR Macedonian wineries has been 45 percent, and the industry has growing liquidity problems.a Concerted action is needed to brand FYR Macedonian wines in target markets, which can only be successful if there are broad cost-sharing agreements among wineries and quality parameters are incorporated into farmer contracts. Finally, improving grape quality will require uprooting vineyards or establishing new plantations, which is costly and time-consuming.a Manevska-Tasevska, Gordana (2006). An economic analysis of the Macedonian viticulture: a competitiveness view of the grape and wine sectorsSource: Authors.
FYR MACEDONIA SYSTEMATIC COUNTRY DIAGNOSTIC
116 CHAPTER 4. PATHWAY I: FOSTERING A MORE DYNAMIC AND COMPETITIVE PRIVATE SECTOR
203. There are opportunities available for linking agriculture with tourism and ICT. Tourism is of growing importance and the main tourism market segments are seeking unique Macedonian culinary destinations. Because purchase of locally-produced food items can generate more economic benefits this is a major opportunity for destination stakeholders to multiply the impact of tourism. Actions and investment are needed to stimulate the development of food products and improve skills for, e.g., design, packaging, branding, and pricing. The ICT industry can also help to build up agricultural value chains, though as yet, many farmers in still do not have access to or the capacity to use ICT in productive ways to link up with hospitality and tourism entities. Through ICT, agricultural producers can more easily access information on market players and prices, quality seeds, credit and insurance, water supply for irrigation, livestock care, and new technologies. The experience of Hawaii illustrates how strong links between agriculture and tourism are beneficial for both sectors.156
4.8 Selected Industries and their Growth Challenges
204. Analyses of selected industries confirm that the analyzed issues are constrains to investment in different sectors. Taking advantage of recent analyses conducted in (1) agriculture and agribusiness; (2) motor vehicles; (3) textiles and apparel; (4) tourism; and (5) information and communications technologies (ICT) industries is possible to identify patterns across the economy that confirm the emerging results from this chapter. An analysis on the main factors encouraging or dissuading FDI yields some common messages across the five industries. First, the lack of integration into foreign markets (and the small size of the domestic market) mean that foreign investors might find it difficult to achieve economies of scale. Second, the limited skills of the labor force and weak capacity to attract and retain talent discourage foreign investment. Third, the limited ability of domestic firms to innovate and adopt technologies is a major barrier, especially for investors interested in higher-value-added sectors. Fourth, trade and transport connectivity shortfalls increase the time and cost of doing business in all industries. In the motor vehicles, textile and apparel, and tourism industries, the lack of market competition is a substantial problem, especially for higher-value-added activities. The inefficiency and lack of independence of the country’s judicial system raises questions for foreign investors that want to deepen their engagements in the motor vehicles and textile and apparel industries (Table 4.5, see Annex 4 for a more detailed discussion).
205. Beyond the shared challenges, each of the five industries faces additional industry-specific factors that hinder investment. For example, agriculture and agribusiness investment is constrained by fragmented land ownership and weak institutional capacity at the ministerial and local levels. Motor vehicles investment suffers due to limited ease, access and affordability of financial services and low public investment in research and development. Foreign investment in information and communication technologies is hampered by inadequate rural infrastructure for broadband services and underdeveloped cooperation between ICT firms and universities and vocational schools. Textiles and apparel foreign investment suffers due to a lack of own product line development and electrical outages, and textiles is the only one of the five industries that noted barriers related to electrical outages. Last, tourism investment is constrained by bureaucratic red tape and bribery and informal payments (Table 4.5).
156 Cox et al. (1995), Does Tourism Destroy Agriculture? Annals of Tourism Research, 22 (1), 210-213.
SEIZING A BRIGHTER FUTURE FOR ALL
117CHAPTER 4. PATHWAY I: FOSTERING A MORE DYNAMIC AND COMPETITIVE PRIVATE SECTOR
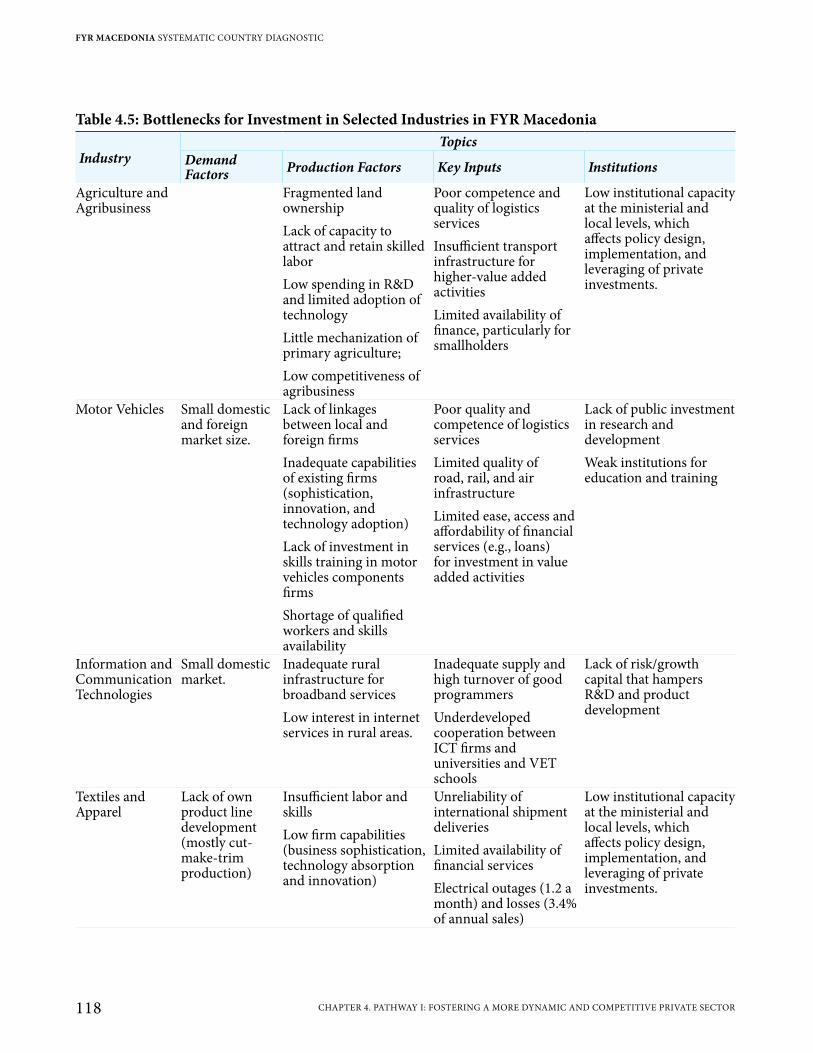
Table 4.5: Bottlenecks for Investment in Selected Industries in FYR Macedonia
IndustryTopics
Demand Factors Production Factors Key Inputs Institutions
Agriculture and Agribusiness
Fragmented land ownershipLack of capacity to attract and retain skilled laborLow spending in R&D and limited adoption of technologyLittle mechanization of primary agriculture;Low competitiveness of agribusiness
Poor competence and quality of logistics services Insufficient transport infrastructure for higher-value added activitiesLimited availability of finance, particularly for smallholders
Low institutional capacity at the ministerial and local levels, which affects policy design, implementation, and leveraging of private investments.
Motor Vehicles Small domestic and foreign market size.
Lack of linkages between local and foreign firmsInadequate capabilities of existing firms (sophistication, innovation, and technology adoption) Lack of investment in skills training in motor vehicles components firmsShortage of qualified workers and skills availability
Poor quality and competence of logistics servicesLimited quality of road, rail, and air infrastructureLimited ease, access and affordability of financial services (e.g., loans) for investment in value added activities
Lack of public investment in research and developmentWeak institutions for education and training
Information and Communication Technologies
Small domestic market.
Inadequate rural infrastructure for broadband servicesLow interest in internet services in rural areas.
Inadequate supply and high turnover of good programmersUnderdeveloped cooperation between ICT firms and universities and VET schools
Lack of risk/growth capital that hampers R&D and product development
Textiles and Apparel
Lack of own product line development (mostly cut-make-trim production)
Insufficient labor and skillsLow firm capabilities (business sophistication, technology absorption and innovation)
Unreliability of international shipment deliveriesLimited availability of financial servicesElectrical outages (1.2 a month) and losses (3.4% of annual sales)
Low institutional capacity at the ministerial and local levels, which affects policy design, implementation, and leveraging of private investments.
FYR MACEDONIA SYSTEMATIC COUNTRY DIAGNOSTIC
118 CHAPTER 4. PATHWAY I: FOSTERING A MORE DYNAMIC AND COMPETITIVE PRIVATE SECTOR

Table 4.5: Bottlenecks for Investment in Selected Industries in FYR Macedonia
IndustryTopics
Demand Factors Production Factors Key Inputs Institutions
Tourism Insufficient labor and skills availability for higher-value added activitiesLimited firm capabilities (business sophistication, innovation, technology absorption)
Limited financial servicesWeaknesses in transport connectivity (including infrastructure gaps and logistics)Limited availability of high quality transport services.
Bureaucratic red tapeBribery and informal payment related to utilities access, permits, licenses, and taxes.Inefficient the legal and judicial system that lacks independence
Source: Authors.
SEIZING A BRIGHTER FUTURE FOR ALL
119CHAPTER 4. PATHWAY I: FOSTERING A MORE DYNAMIC AND COMPETITIVE PRIVATE SECTOR

FYR Macedonia Systematic Country Diagnostic | Seizing a Brighter Future for All
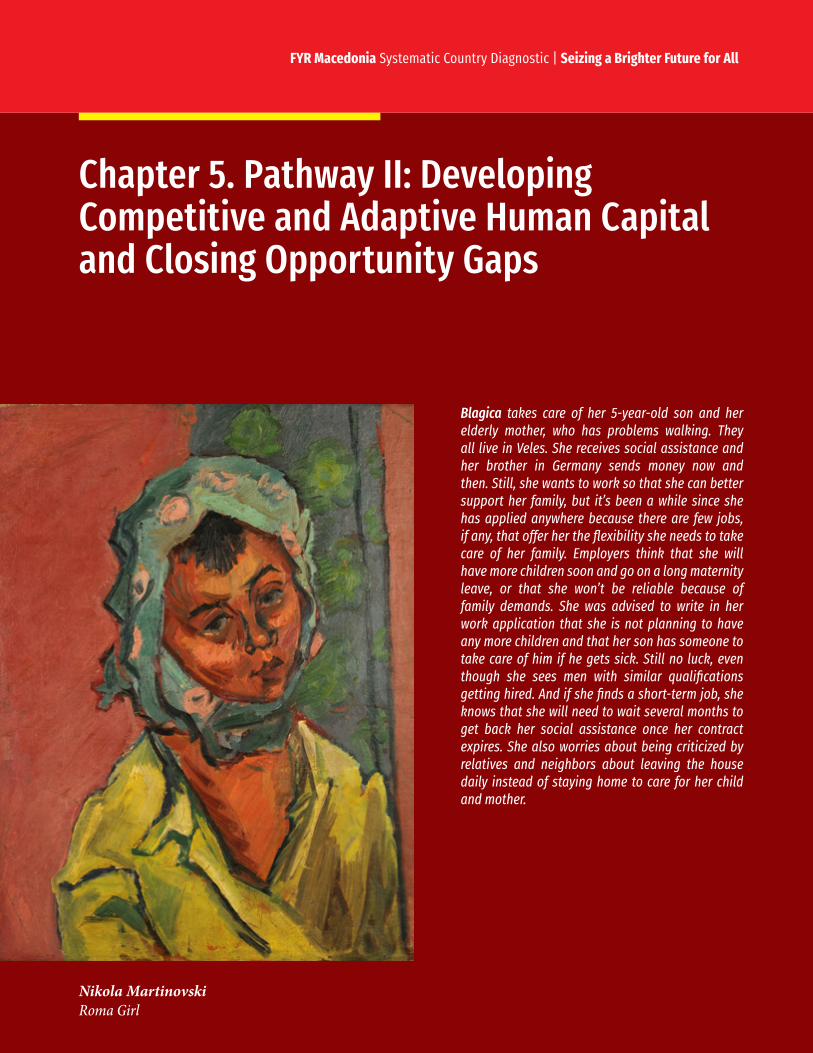
FYR Macedonia Systematic Country Diagnostic | Seizing a Brighter Future for All
Nikola MartinovskiRoma Girl
Blagica takes care of her 5-year-old son and her elderly mother, who has problems walking. They all live in Veles. She receives social assistance and her brother in Germany sends money now and then. Still, she wants to work so that she can better support her family, but it’s been a while since she has applied anywhere because there are few jobs, if any, that offer her the flexibility she needs to take care of her family. Employers think that she will have more children soon and go on a long maternity leave, or that she won’t be reliable because of family demands. She was advised to write in her work application that she is not planning to have any more children and that her son has someone to take care of him if he gets sick. Still no luck, even though she sees men with similar qualifications getting hired. And if she finds a short-term job, she knows that she will need to wait several months to get back her social assistance once her contract expires. She also worries about being criticized by relatives and neighbors about leaving the house daily instead of staying home to care for her child and mother.
Chapter 5. Pathway II: Developing Competitive and Adaptive Human Capital and Closing Opportunity Gaps
Chapter 5. Pathway II: Developing Competitive and Adaptive Human Capital and Closing Opportunity Gaps
With its workforce shrinking and productivity growth low, FYR Macedonia must deal directly with high structural unemployment and high inactivity, especially among certain groups. The country must now take full advantage of its population to heighten production and incomes and to reduce poverty. To encourage people to seek employment, it will be necessary to reduce barriers, recognize the need for quality skills, improve school-to-work transition, enhance access to information, provide more affordable child and elder care options, and craft flexible work arrangements so that more people can join the labor force. It will also be necessary to reduce disincentives to working in the private sector, such as early retirement options, public employment opportunities, and the high costs of benefit losses or high social security contributions. Finally, the country needs to tackle social norms and discriminatory practices that discourage people from working. Too many people are still poor, and among them ethnic minorities are over-represented. A more efficient social protection system could better address the root causes of poverty, especially low employability. Better managed primary health care is also urgently needed to tackle such prevalent health risks as child mortality and noncommunicable diseases.
5.1 Joblessness Is a Barrier to Social Inclusion
206. More and better jobs are critical for FYR Macedonia to accelerate poverty reduction and social inclusion. More people working and higher labor incomes (see Chapter 2) explain almost all the 2009–15 changes in the household income of the bottom 40 percent; lack of labor income is the strongest predictor of poverty. Moreover, taking estimated poverty-employment elasticity in 2009–16 as an indicator—each percentage point of employment growth decreases poverty by 1.3 percentage points (pp)—a 10-point increase in employment would cut poverty by half, and a 15-point increase would almost eliminate it.
207. To become a middle-class society, as FYR Macedonia intends, it needs more job opportunities to generate higher incomes. Macedonians cannot enter the middle class, as it is generally understood
Figure 5.1: Themes for Pathway II
Quality of education and skills gaps
Skills mismatches and workforcedevelopment
Disincentives and barriers to labor marketparticipation
Gaps in economic opportunity
Effectiveness of social protection
Health outcomes
122 CHAPTER 5. PATHWAY II: DEVELOPING COMPETITIVE AND ADAPTIVE HUMAN CAPITAL AND CLOSING OPPORTUNITY GAPS
FYR MACEDONIA SYSTEMATIC COUNTRY DIAGNOSTIC
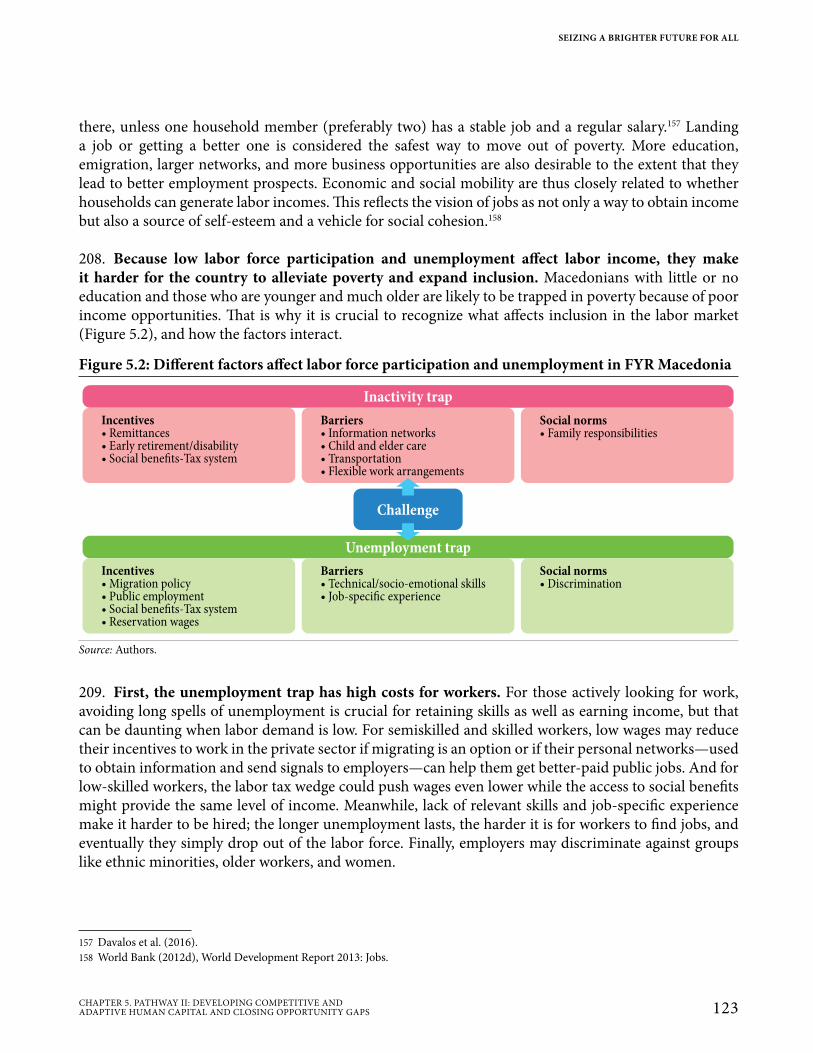
there, unless one household member (preferably two) has a stable job and a regular salary.157 Landing a job or getting a better one is considered the safest way to move out of poverty. More education, emigration, larger networks, and more business opportunities are also desirable to the extent that they lead to better employment prospects. Economic and social mobility are thus closely related to whether households can generate labor incomes. This reflects the vision of jobs as not only a way to obtain income but also a source of self-esteem and a vehicle for social cohesion.158
208. Because low labor force participation and unemployment affect labor income, they make it harder for the country to alleviate poverty and expand inclusion. Macedonians with little or no education and those who are younger and much older are likely to be trapped in poverty because of poor income opportunities. That is why it is crucial to recognize what affects inclusion in the labor market (Figure 5.2), and how the factors interact.
209. First, the unemployment trap has high costs for workers. For those actively looking for work, avoiding long spells of unemployment is crucial for retaining skills as well as earning income, but that can be daunting when labor demand is low. For semiskilled and skilled workers, low wages may reduce their incentives to work in the private sector if migrating is an option or if their personal networks—used to obtain information and send signals to employers—can help them get better-paid public jobs. And for low-skilled workers, the labor tax wedge could push wages even lower while the access to social benefits might provide the same level of income. Meanwhile, lack of relevant skills and job-specific experience make it harder to be hired; the longer unemployment lasts, the harder it is for workers to find jobs, and eventually they simply drop out of the labor force. Finally, employers may discriminate against groups like ethnic minorities, older workers, and women.
157 Davalos et al. (2016).158 World Bank (2012d), World Development Report 2013: Jobs.
Figure 5.2: Different factors affect labor force participation and unemployment in FYR Macedonia
Incentives• Remittances
Early retirement/disabilitySocial benefits-Tax system
••
Incentives• Migration policy
Public employmentSocial benefits-Tax systemReservation wages
•••
Barriers• Information networks
Child and elder careTransportationFlexible work arrangements
•••
Barriers• Technical/socio-emotional skills
Job-specific experience•
Social norms• Family responsibilities
Social norms• Discrimination
Inactivity trap
Unemployment trap
Challenge
Source: Authors.
SEIZING A BRIGHTER FUTURE FOR ALL
123CHAPTER 5. PATHWAY II: DEVELOPING COMPETITIVE AND ADAPTIVE HUMAN CAPITAL AND CLOSING OPPORTUNITY GAPS

210. Second, there is an inactivity trap, especially for women and older and low-skilled job seekers. Remittances, disability or retirement pensions, and other transfers that provide a cushion allowing households to manage without the earnings of one or more members become disincentives to work. For low-skilled workers, labor-related taxes may be too high for them to accept low-wage jobs. Even people willing to enter the labor market may be discouraged by lack of affordable options for care of children or the elderly, lack of adequate transport, inflexible work arrangements, or lack of a network. Finally, powerful social norms, especially those related to household roles and care responsibilities, pose a significant hurdle for women. These factors, especially if combined, can trap people in inactivity both at specific moments or throughout their adult years.
5.2 Causes of Low Employment Are Rooted in Demand and Supply
211. Although trending downward, unemployment is still high. The reduction in unemployment that started in 2011 is important for at least two reasons: (1) More jobs led to higher incomes that enabled many poor families to rise out of poverty, and an additional earner allowed many vulnerable families to become part of the middle class. (2) The additional demand for labor that resulted from higher investment was met with a supply of workers willing to take those jobs. However, the continued high structural unemployment is worrisome because it implies that the skills of many workers may be depreciating, and the longer they are inactive, the less attractive they are to employers. Workers unemployed long-term are also more likely to drop out of the labor force or to retire early.
212. FYR Macedonia does not have enough employment opportunities for those of working age. For prime-age workers, especially men, the main problem is clearly jobs, not willingness to work. In 2016, 92 percent of men at their prime, ages 25–54, were actively looking, but only 73 percent were employed (Figure 5.3). These numbers, which have varied little since 2010, are characteristic of a sluggish labor market that offers few opportunities to job-seekers. For women, at 65 percent participation is much lower, and employment is an even lower 52 percent. The male-female gap has also changed little since 2010. Education does not guarantee employment: in 2016, just 69 percent of workers with tertiary education were employed and 19 percent were unemployed. While more of them have jobs than those in other groups, their unemployment rate, close to that of less educated groups, confirms the scarcity of demand.159
159 Koettl et al. (2017a).
Figure 5.3: FYR Macedonia has a large deficit in employmentLabor Force Participation Rate (LFPR) and employment rate, 25–54-year-olds, 2010–17Percentage of population100
90
80
70
60
50
40
2010 201711 12 13 14 15 16
▬LFPR: all ▬Employment rate: allLFPR: males Employment rate: malesLFPR: females Employment rate: females
Source: Authors’ calculations based on data from the SEE Jobs Gateway (wiiw and World Bank).
124 CHAPTER 5. PATHWAY II: DEVELOPING COMPETITIVE AND ADAPTIVE HUMAN CAPITAL AND CLOSING OPPORTUNITY GAPS
FYR MACEDONIA SYSTEMATIC COUNTRY DIAGNOSTIC
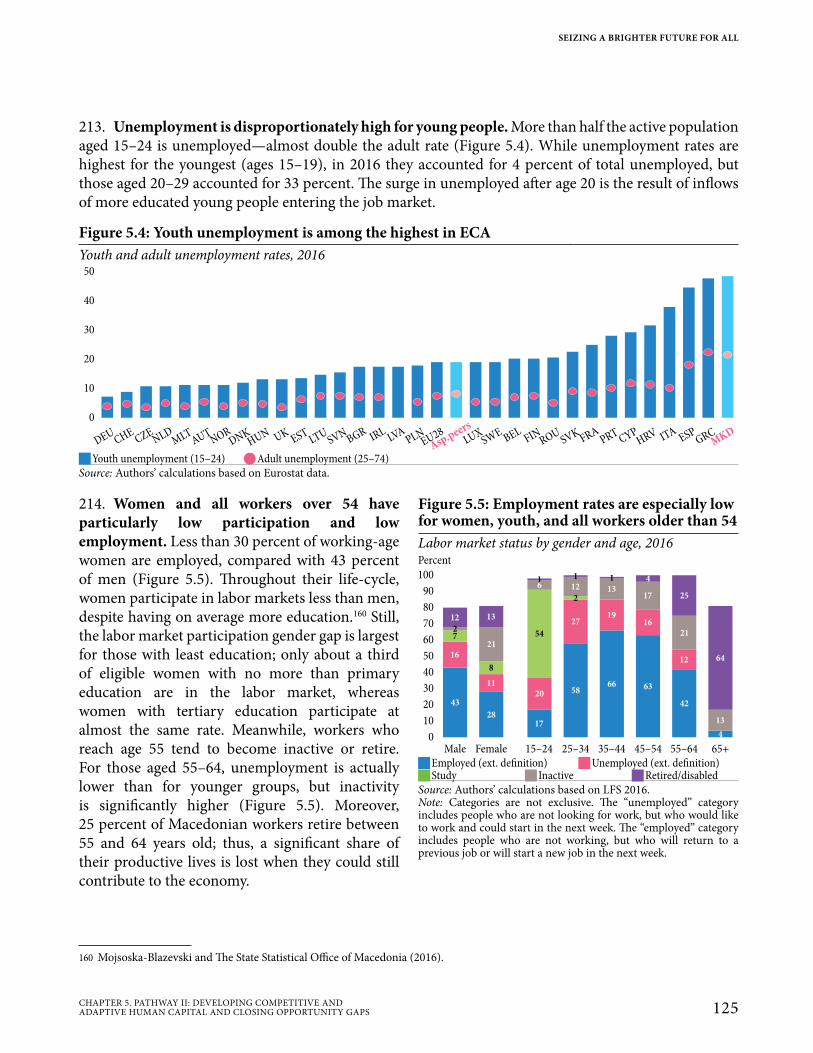
213. Unemployment is disproportionately high for young people. More than half the active population aged 15–24 is unemployed—almost double the adult rate (Figure 5.4). While unemployment rates are highest for the youngest (ages 15–19), in 2016 they accounted for 4 percent of total unemployed, but those aged 20–29 accounted for 33 percent. The surge in unemployed after age 20 is the result of inflows of more educated young people entering the job market.
214. Women and all workers over 54 have particularly low participation and low employment. Less than 30 percent of working-age women are employed, compared with 43 percent of men (Figure 5.5). Throughout their life-cycle, women participate in labor markets less than men, despite having on average more education.160 Still, the labor market participation gender gap is largest for those with least education; only about a third of eligible women with no more than primary education are in the labor market, whereas women with tertiary education participate at almost the same rate. Meanwhile, workers who reach age 55 tend to become inactive or retire. For those aged 55–64, unemployment is actually lower than for younger groups, but inactivity is significantly higher (Figure 5.5). Moreover, 25 percent of Macedonian workers retire between 55 and 64 years old; thus, a significant share of their productive lives is lost when they could still contribute to the economy.
160 Mojsoska-Blazevski and The State Statistical Office of Macedonia (2016).
Figure 5.4: Youth unemployment is among the highest in ECAYouth and adult unemployment rates, 2016
50
40
30
20
10
0
DEUCHE
CZENLD
MLTAUT
NORDNK
HUN UK ESTLTU
SVN BGR IRLLVA
PLNEU28
LUXSWE BEL
FINROUSVK FRA
PRT CYPHRV ITA
ESPGRC
MKDAsp.peers
JYouth unemployment (15–24) QAdult unemployment (25–74)Source: Authors’ calculations based on Eurostat data.
Figure 5.5: Employment rates are especially low for women, youth, and all workers older than 54Labor market status by gender and age, 2016Percent100
90
80
70
60
50
40
30
20
10
0Male Female 15–24 45–5425–34 35–44 55–64 65+
16
43
11
28
20
17
27
58
19
66
16
63
12
42
4
7
8
54
2
12 13
1 1 1 4
25
64
2
21
6 12 1317
21
13
JEmployed (ext. definition) JUnemployed (ext. definition) JStudy J Inactive JRetired/disabled
Source: Authors’ calculations based on LFS 2016.Note: Categories are not exclusive. The “unemployed” category includes people who are not looking for work, but who would like to work and could start in the next week. The “employed” category includes people who are not working, but who will return to a previous job or will start a new job in the next week.
SEIZING A BRIGHTER FUTURE FOR ALL
125CHAPTER 5. PATHWAY II: DEVELOPING COMPETITIVE AND ADAPTIVE HUMAN CAPITAL AND CLOSING OPPORTUNITY GAPS

215. Too few working-age Macedonians are employed. Workers lose on average half of their productive lifetime to lack of labor force participation and unemployment. In 2016, low employment rates resulted in an estimated 25 years lost—about half of the productive life of an average worker (see Chapter 2).
216. Low employment demonstrates labor demand and supply problems. Chapter 3 highlights the relatively low allocative efficiency of Macedonian firms: according to the employer STEP survey, only 25 percent of firms had recently looked for (demand) workers (the automotive industry, where the majority of firms were hiring, was an outlier),161 but about 33 percent of hiring firms had difficulties (Figure 5.6), mostly skills-related, in finding qualified workers. Labor force participation (supply) is also below expectations, especially for women (particularly those less educated) and for those younger than 25 and older than 55. But even for those actively seeking jobs, low demand carries the threat of unemployment. Firms that report problems in filling better-quality jobs, as in ICT and automotive components, emphasize lack of experience and technical skills.
217. In 2015, close to half of Macedonian firms surveyed reported a skills gap among their current employees.162 Although all these firms were manufacturers, this suggests a general shortage of the skills a modern economy demands. In fact, the gap is most obvious in automotive components, one of the fastest-growing industries in the country (Figure 5.7). Firms that had recently found it difficult to find qualified employees (because of availability, cost, and quality), singled out skills, based on the training and other experience workers have accumulated, as the most significant obstacle—outranking wage expectations, the cost of social security, and labor regulations.
218. Firms are looking for all types of skills. In 2015, most in demand by far were plant and machine operators,163 but there was a consensus
161 Koettl-Brodmann et al. (2017b).162 Koettl-Brodmann et al. (2017b).163 Koettl-Brodmann et al. (2017b).
Figure 5.6: Experience and technical skills are the most severe problems for firmsPercent of Macedonian firms declaring a topic as an issue for hiring workers, 2015Percentage of firms, 2015
45
40
35
30
25
20
15
10
5
0F
ind
ing
wor
kers
wit
hpr
evio
us
exp
erie
nce
Tech
nic
al a
nd
voc
atio
nal
edu
./tr
ain
ing
of w
orke
rs
Lab
or a
vail
abil
ity
Hig
h jo
b tu
rnov
er
Em
ploy
men
t pr
otec
tion
legi
slat
ion
/lab
or c
ode
law
s
Gen
eral
ed
uca
tion
of w
orke
rs
Ove
rall
wag
e le
vel
Min
imu
m w
age
(if e
xist
s in
cou
ntr
y)
Pay
roll
tax
es a
nd
soc
ial
secu
rity
con
trib
uti
ons
�Food products JTextile industry SAutomotive components JLogictics services � ICT QOther manufacturing
Source: Koettl-Brodmann et al. (2017b), based on STEP survey.
Figure 5.7: Many firms report that workers lack the right skills for their positionsPercent of firms reporting a major skills gap, 2015
80
70
60
50
40
30
20
10
0
41 4253 54 58
76
49
Logistics
services ICTTextile
industry Food
products Other
manufacturing
Automotive
components Total
Source: Koettl-Brodmann et al. (2017b), based on STEP survey.
126 CHAPTER 5. PATHWAY II: DEVELOPING COMPETITIVE AND ADAPTIVE HUMAN CAPITAL AND CLOSING OPPORTUNITY GAPS
FYR MACEDONIA SYSTEMATIC COUNTRY DIAGNOSTIC
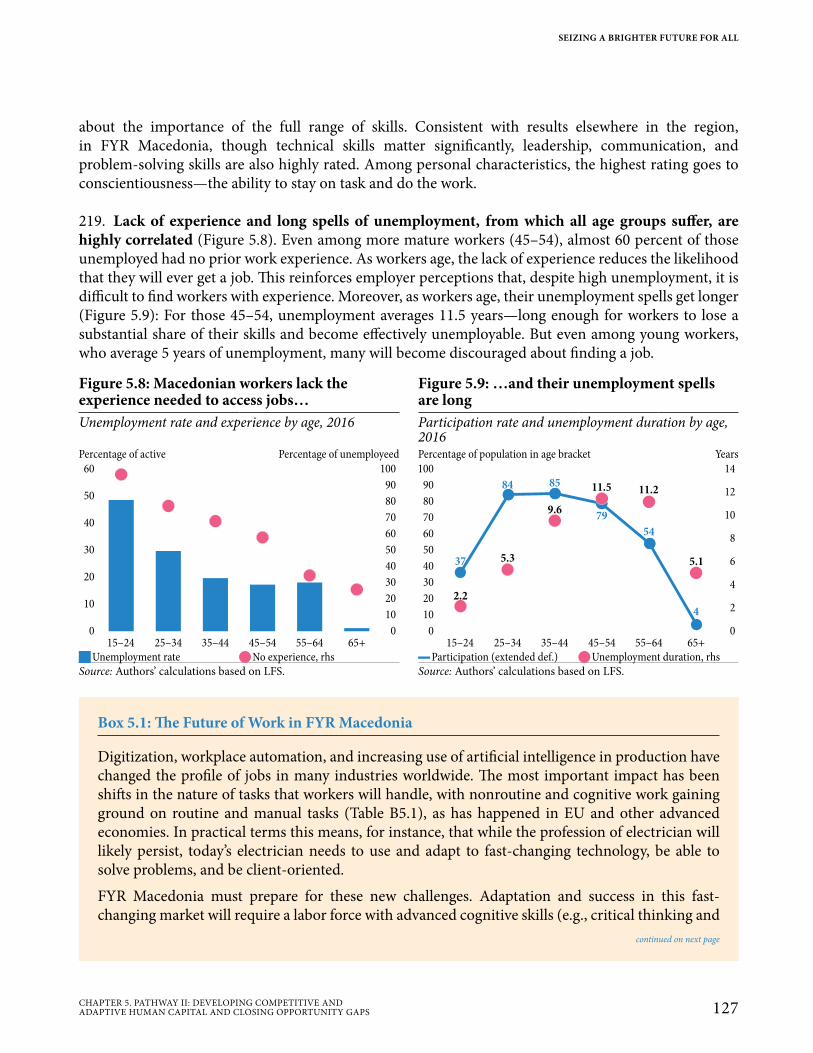
about the importance of the full range of skills. Consistent with results elsewhere in the region, in FYR Macedonia, though technical skills matter significantly, leadership, communication, and problem-solving skills are also highly rated. Among personal characteristics, the highest rating goes to conscientiousness—the ability to stay on task and do the work.
219. Lack of experience and long spells of unemployment, from which all age groups suffer, are highly correlated (Figure 5.8). Even among more mature workers (45–54), almost 60 percent of those unemployed had no prior work experience. As workers age, the lack of experience reduces the likelihood that they will ever get a job. This reinforces employer perceptions that, despite high unemployment, it is difficult to find workers with experience. Moreover, as workers age, their unemployment spells get longer (Figure 5.9): For those 45–54, unemployment averages 11.5 years—long enough for workers to lose a substantial share of their skills and become effectively unemployable. But even among young workers, who average 5 years of unemployment, many will become discouraged about finding a job.
Figure 5.8: Macedonian workers lack the experience needed to access jobs…
Figure 5.9: …and their unemployment spells are long
Unemployment rate and experience by age, 2016 Participation rate and unemployment duration by age, 2016
Percentage of active Percentage of unemployeed Percentage of population in age bracket Years60 100
90
80
70
60
50
50
40
40
30
3020
2010
10
0 0
15–24 45–5425–34 35–44 55–64 65+
14100
1290
10
80
8
70
6
60
50
4
40
30
220
10
00
15–24 45–5425–34 35–44 55–64 65+
37
84 85
79
54
4
2.2
5.3
9.6
11.5 11.2
5.1
JUnemployment rate QNo experience, rhs ▬Participation (extended def.) QUnemployment duration, rhsSource: Authors’ calculations based on LFS. Source: Authors’ calculations based on LFS.
Box 5.1: The Future of Work in FYR Macedonia
Digitization, workplace automation, and increasing use of artificial intelligence in production have changed the profile of jobs in many industries worldwide. The most important impact has been shifts in the nature of tasks that workers will handle, with nonroutine and cognitive work gaining ground on routine and manual tasks (Table B5.1), as has happened in EU and other advanced economies. In practical terms this means, for instance, that while the profession of electrician will likely persist, today’s electrician needs to use and adapt to fast-changing technology, be able to solve problems, and be client-oriented.
FYR Macedonia must prepare for these new challenges. Adaptation and success in this fast-changing market will require a labor force with advanced cognitive skills (e.g., critical thinking and
continued on next page
SEIZING A BRIGHTER FUTURE FOR ALL
127CHAPTER 5. PATHWAY II: DEVELOPING COMPETITIVE AND ADAPTIVE HUMAN CAPITAL AND CLOSING OPPORTUNITY GAPS
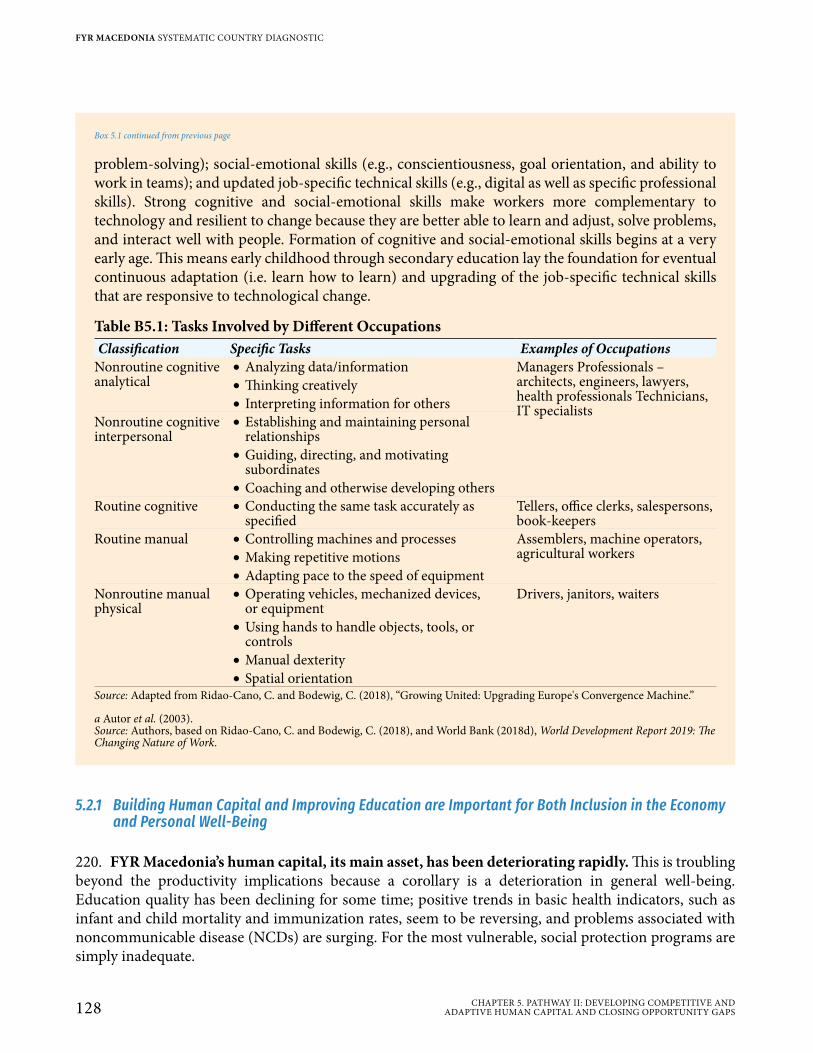
5.2.1 Building Human Capital and Improving Education are Important for Both Inclusion in the Economy and Personal Well-Being
220. FYR Macedonia’s human capital, its main asset, has been deteriorating rapidly. This is troubling beyond the productivity implications because a corollary is a deterioration in general well-being. Education quality has been declining for some time; positive trends in basic health indicators, such as infant and child mortality and immunization rates, seem to be reversing, and problems associated with noncommunicable disease (NCDs) are surging. For the most vulnerable, social protection programs are simply inadequate.
problem-solving); social-emotional skills (e.g., conscientiousness, goal orientation, and ability to work in teams); and updated job-specific technical skills (e.g., digital as well as specific professional skills). Strong cognitive and social-emotional skills make workers more complementary to technology and resilient to change because they are better able to learn and adjust, solve problems, and interact well with people. Formation of cognitive and social-emotional skills begins at a very early age. This means early childhood through secondary education lay the foundation for eventual continuous adaptation (i.e. learn how to learn) and upgrading of the job-specific technical skills that are responsive to technological change.
Table B5.1: Tasks Involved by Different OccupationsClassification Specific Tasks Examples of Occupations
Nonroutine cognitive analytical
• Analyzing data/information • Thinking creatively • Interpreting information for others
Managers Professionals – architects, engineers, lawyers, health professionals Technicians, IT specialists
Nonroutine cognitive interpersonal
• Establishing and maintaining personal relationships
• Guiding, directing, and motivating subordinates
• Coaching and otherwise developing othersRoutine cognitive • Conducting the same task accurately as
specifiedTellers, office clerks, salespersons, book-keepers
Routine manual • Controlling machines and processes • Making repetitive motions • Adapting pace to the speed of equipment
Assemblers, machine operators, agricultural workers
Nonroutine manual physical
• Operating vehicles, mechanized devices, or equipment
• Using hands to handle objects, tools, or controls
• Manual dexterity • Spatial orientation
Drivers, janitors, waiters
Source: Adapted from Ridao-Cano, C. and Bodewig, C. (2018), “Growing United: Upgrading Europe's Convergence Machine.”
a Autor et al. (2003).Source: Authors, based on Ridao-Cano, C. and Bodewig, C. (2018), and World Bank (2018d), World Development Report 2019: The Changing Nature of Work.
Box 5.1 continued from previous page
128 CHAPTER 5. PATHWAY II: DEVELOPING COMPETITIVE AND ADAPTIVE HUMAN CAPITAL AND CLOSING OPPORTUNITY GAPS
FYR MACEDONIA SYSTEMATIC COUNTRY DIAGNOSTIC
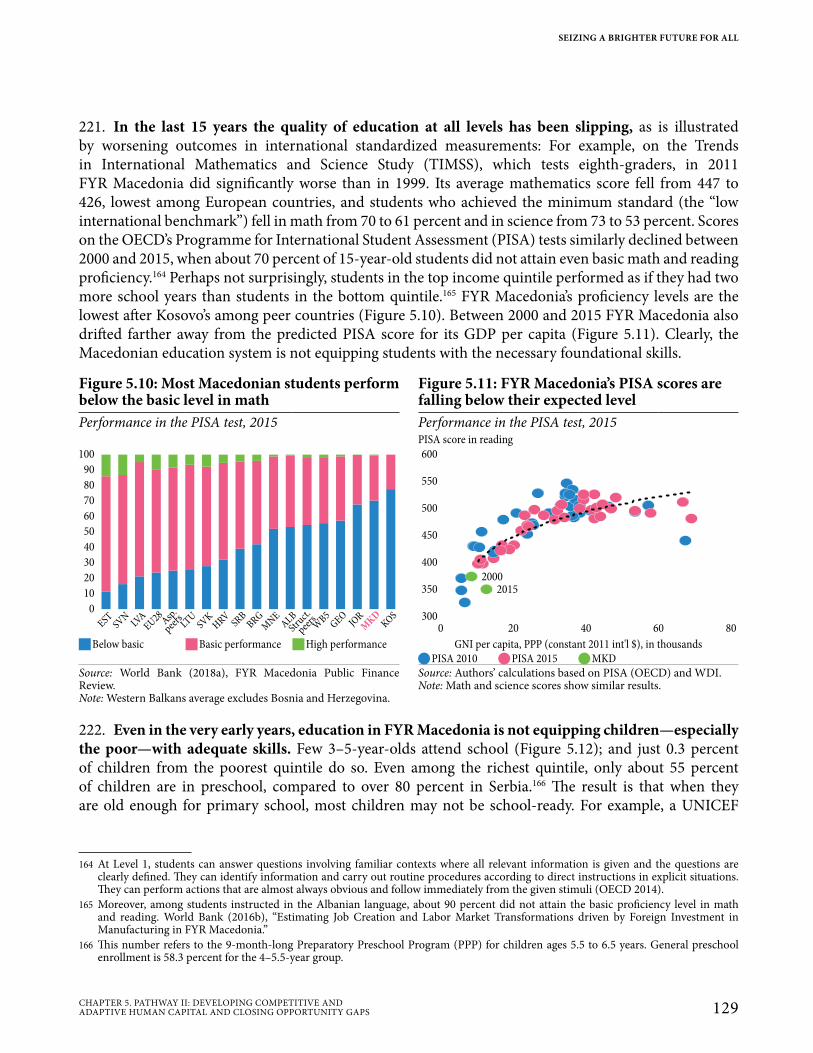
221. In the last 15 years the quality of education at all levels has been slipping, as is illustrated by worsening outcomes in international standardized measurements: For example, on the Trends in International Mathematics and Science Study (TIMSS), which tests eighth-graders, in 2011 FYR Macedonia did significantly worse than in 1999. Its average mathematics score fell from 447 to 426, lowest among European countries, and students who achieved the minimum standard (the “low international benchmark”) fell in math from 70 to 61 percent and in science from 73 to 53 percent. Scores on the OECD’s Programme for International Student Assessment (PISA) tests similarly declined between 2000 and 2015, when about 70 percent of 15-year-old students did not attain even basic math and reading proficiency.164 Perhaps not surprisingly, students in the top income quintile performed as if they had two more school years than students in the bottom quintile.165 FYR Macedonia’s proficiency levels are the lowest after Kosovo’s among peer countries (Figure 5.10). Between 2000 and 2015 FYR Macedonia also drifted farther away from the predicted PISA score for its GDP per capita (Figure 5.11). Clearly, the Macedonian education system is not equipping students with the necessary foundational skills.
222. Even in the very early years, education in FYR Macedonia is not equipping children—especially the poor—with adequate skills. Few 3–5-year-olds attend school (Figure 5.12); and just 0.3 percent of children from the poorest quintile do so. Even among the richest quintile, only about 55 percent of children are in preschool, compared to over 80 percent in Serbia.166 The result is that when they are old enough for primary school, most children may not be school-ready. For example, a UNICEF
164 At Level 1, students can answer questions involving familiar contexts where all relevant information is given and the questions are clearly defined. They can identify information and carry out routine procedures according to direct instructions in explicit situations. They can perform actions that are almost always obvious and follow immediately from the given stimuli (OECD 2014).
165 Moreover, among students instructed in the Albanian language, about 90 percent did not attain the basic proficiency level in math and reading. World Bank (2016b), “Estimating Job Creation and Labor Market Transformations driven by Foreign Investment in Manufacturing in FYR Macedonia.”
166 This number refers to the 9-month-long Preparatory Preschool Program (PPP) for children ages 5.5 to 6.5 years. General preschool enrollment is 58.3 percent for the 4–5.5-year group.
Figure 5.10: Most Macedonian students perform below the basic level in math
Figure 5.11: FYR Macedonia’s PISA scores are falling below their expected level
Performance in the PISA test, 2015 Performance in the PISA test, 2015PISA score in reading
100
90
80
70
60
50
40
30
20
10
0
EST
SVN
LVA
EU
28A
sp.
pee
rsLT
USV
KH
RV
SRB
BRG
MN
EA
LB
Stru
ct.
pee
rsW
B5
GEO
JOR
MK
DKO
S
600
550
500
450
400
350
300
0 20 40 60 80
2000
2015
JBelow basic JBasic performance JHigh performance GNI per capita, PPP (constant 2011 int'l $), in thousands QPISA 2010 QPISA 2015 QMKD
Source: World Bank (2018a), FYR Macedonia Public Finance Review.Note: Western Balkans average excludes Bosnia and Herzegovina.
Source: Authors’ calculations based on PISA (OECD) and WDI.Note: Math and science scores show similar results.
SEIZING A BRIGHTER FUTURE FOR ALL
129CHAPTER 5. PATHWAY II: DEVELOPING COMPETITIVE AND ADAPTIVE HUMAN CAPITAL AND CLOSING OPPORTUNITY GAPS
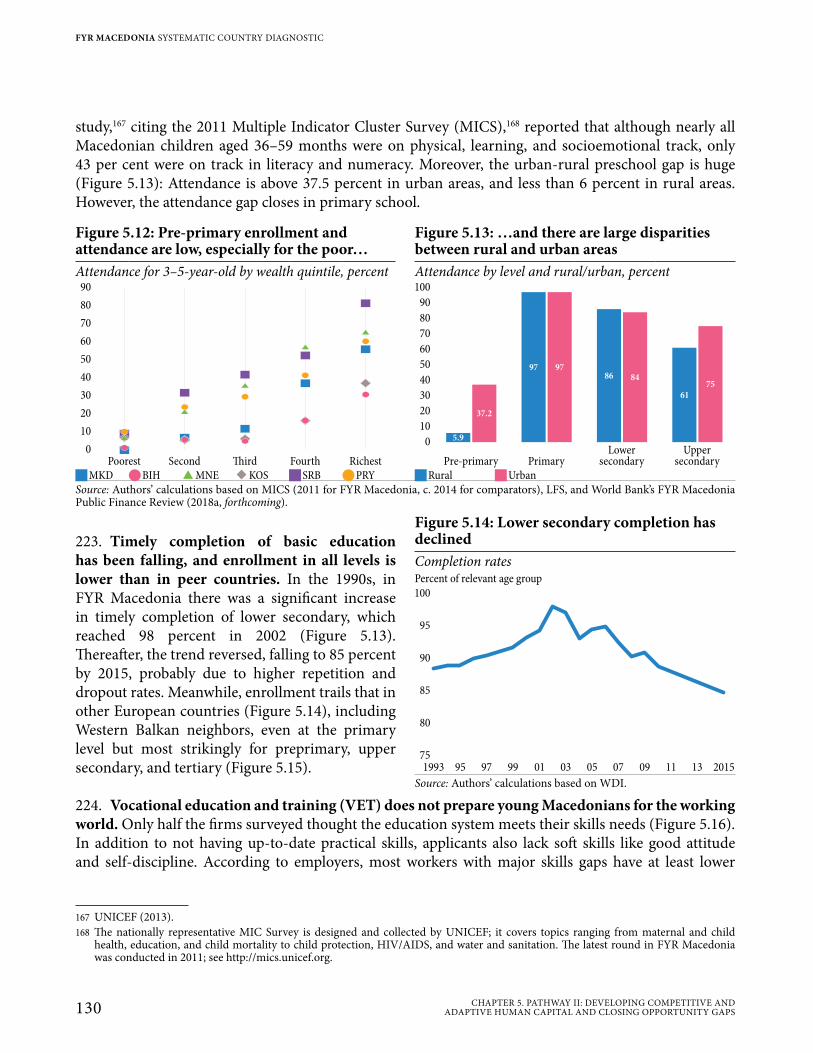
study,167 citing the 2011 Multiple Indicator Cluster Survey (MICS),168 reported that although nearly all Macedonian children aged 36–59 months were on physical, learning, and socioemotional track, only 43 per cent were on track in literacy and numeracy. Moreover, the urban-rural preschool gap is huge (Figure 5.13): Attendance is above 37.5 percent in urban areas, and less than 6 percent in rural areas. However, the attendance gap closes in primary school.
223. Timely completion of basic education has been falling, and enrollment in all levels is lower than in peer countries. In the 1990s, in FYR Macedonia there was a significant increase in timely completion of lower secondary, which reached 98 percent in 2002 (Figure 5.13). Thereafter, the trend reversed, falling to 85 percent by 2015, probably due to higher repetition and dropout rates. Meanwhile, enrollment trails that in other European countries (Figure 5.14), including Western Balkan neighbors, even at the primary level but most strikingly for preprimary, upper secondary, and tertiary (Figure 5.15).
224. Vocational education and training (VET) does not prepare young Macedonians for the working world. Only half the firms surveyed thought the education system meets their skills needs (Figure 5.16). In addition to not having up-to-date practical skills, applicants also lack soft skills like good attitude and self-discipline. According to employers, most workers with major skills gaps have at least lower
167 UNICEF (2013).168 The nationally representative MIC Survey is designed and collected by UNICEF; it covers topics ranging from maternal and child
health, education, and child mortality to child protection, HIV/AIDS, and water and sanitation. The latest round in FYR Macedonia was conducted in 2011; see http://mics.unicef.org.
Figure 5.12: Pre-primary enrollment and attendance are low, especially for the poor…
Figure 5.13: …and there are large disparities between rural and urban areas
Attendance for 3–5-year-old by wealth quintile, percent Attendance by level and rural/urban, percent90
80
70
60
50
40
30
20
10
0
Poorest Second �ird Fourth Richest
100
90
80
70
60
50
40
30
20
10
0
Pre-primary Primary
Lower
secondary
Upper
secondary
5.9
37.2
97 9786 84
61
75
JMKD QBIH SMNE �KOS JSRB QPRY JRural JUrbanSource: Authors’ calculations based on MICS (2011 for FYR Macedonia, c. 2014 for comparators), LFS, and World Bank’s FYR Macedonia Public Finance Review (2018a, forthcoming).
Figure 5.14: Lower secondary completion has declinedCompletion ratesPercent of relevant age group100
95
90
85
80
75
1993 95 201597 99 01 03 05 07 09 11 13
Source: Authors’ calculations based on WDI.
130 CHAPTER 5. PATHWAY II: DEVELOPING COMPETITIVE AND ADAPTIVE HUMAN CAPITAL AND CLOSING OPPORTUNITY GAPS
FYR MACEDONIA SYSTEMATIC COUNTRY DIAGNOSTIC
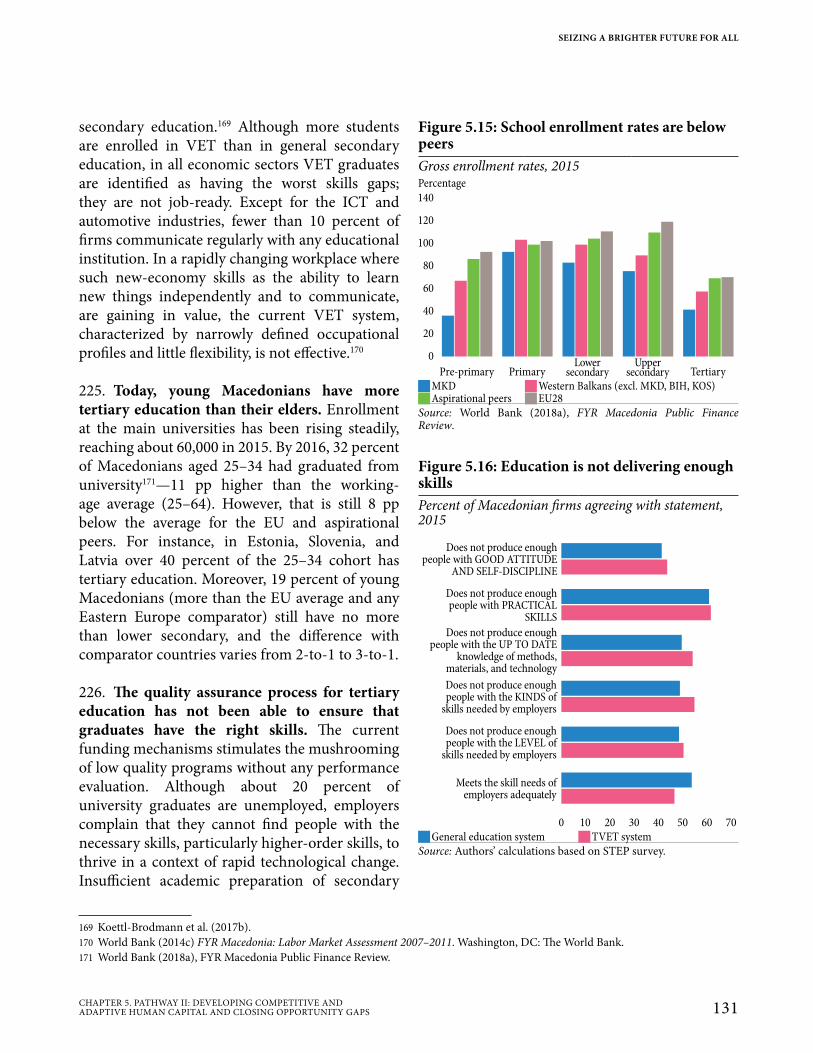
secondary education.169 Although more students are enrolled in VET than in general secondary education, in all economic sectors VET graduates are identified as having the worst skills gaps; they are not job-ready. Except for the ICT and automotive industries, fewer than 10 percent of firms communicate regularly with any educational institution. In a rapidly changing workplace where such new-economy skills as the ability to learn new things independently and to communicate, are gaining in value, the current VET system, characterized by narrowly defined occupational profiles and little flexibility, is not effective.170
225. Today, young Macedonians have more tertiary education than their elders. Enrollment at the main universities has been rising steadily, reaching about 60,000 in 2015. By 2016, 32 percent of Macedonians aged 25–34 had graduated from university171—11 pp higher than the working-age average (25–64). However, that is still 8 pp below the average for the EU and aspirational peers. For instance, in Estonia, Slovenia, and Latvia over 40 percent of the 25–34 cohort has tertiary education. Moreover, 19 percent of young Macedonians (more than the EU average and any Eastern Europe comparator) still have no more than lower secondary, and the difference with comparator countries varies from 2-to-1 to 3-to-1.
226. The quality assurance process for tertiary education has not been able to ensure that graduates have the right skills. The current funding mechanisms stimulates the mushrooming of low quality programs without any performance evaluation. Although about 20 percent of university graduates are unemployed, employers complain that they cannot find people with the necessary skills, particularly higher-order skills, to thrive in a context of rapid technological change. Insufficient academic preparation of secondary
169 Koettl-Brodmann et al. (2017b).170 World Bank (2014c) FYR Macedonia: Labor Market Assessment 2007–2011. Washington, DC: The World Bank.171 World Bank (2018a), FYR Macedonia Public Finance Review.
Figure 5.16: Education is not delivering enough skillsPercent of Macedonian firms agreeing with statement, 2015
0 10 20 30 40 50 60 70
Meets the skill needs ofemployers adequately
Does not produce enoughpeople with GOOD ATTITUDE
AND SELF-DISCIPLINE
Does not produce enoughpeople with PRACTICAL
SKILLS
Does not produce enoughpeople with the UP TO DATE
knowledge of methods,materials, and technology
Does not produce enoughpeople with the KINDS of
skills needed by employers
Does not produce enoughpeople with the LEVEL of
skills needed by employers
JGeneral education system JTVET systemSource: Authors’ calculations based on STEP survey.
Figure 5.15: School enrollment rates are below peersGross enrollment rates, 2015Percentage140
120
100
80
60
40
20
0
Pre-primary PrimaryLower
secondaryUpper
secondary Tertiary
JMKD JWestern Balkans (excl. MKD, BIH, KOS) JAspirational peers JEU28
Source: World Bank (2018a), FYR Macedonia Public Finance Review.
SEIZING A BRIGHTER FUTURE FOR ALL
131CHAPTER 5. PATHWAY II: DEVELOPING COMPETITIVE AND ADAPTIVE HUMAN CAPITAL AND CLOSING OPPORTUNITY GAPS

school graduates and often irrelevant university programs exacerbate the skills mismatch, which springs from at least four factors: (1) Many current programs are too theoretical to have practical relevance to the world of work, and very few programs have adopted modern pedagogical practices to enhance student competence. (2) Asymmetry of information means that too many students enroll in courses that they do not realize have little labor market value. (3) Few tertiary institutions have adapted their curriculum to the changing economy, as by incorporating foreign languages. (4) The for-profit orientation of many private tertiary institutions may undermine their ability to focus on improving quality (Box 5.2). Students complain of grade inflation and lax educational standards. Finally, many of the best-trained tertiary graduates leave to seek gainful employment abroad.
227. Education in FYR Macedonia is more concerned with teaching content than building critical thinking skills. Even though Macedonian students perform very well in “explaining different concepts scientifically,” only about 30 percent are truly competent in this area.172 They are far behind international peers in “interpretation of data and facts by applying a scientific approach,” and they also have little understanding of the thinking process and the evidence needed to formulate and test theories. In FYR Macedonia, lectures and memorization are favored over inquiry-based activities supplemented by teacher-directed instruction, which elsewhere have proved highly effective in driving student motivation to learn.
228. Education resources in FYR Macedonia are not efficiently allocated. A case in point is the falling student-teacher ratio: Because the number of children eligible for pre-university education (ages 3–18) has fallen by 24 percent since 2000,173 the number of students enrolled has also dropped. However, there has been no change in the number of schools, classes, and teachers in primary and lower secondary (Figure 5.17, panel A)—the number of teachers actually went up. Only 9 of 84 municipalities have reduced the number of primary school teachers in response to lower enrollment, and even in these, for
172 Ibid.173 Ibid.
Box 5.2: Ensuring Quality Standards in Tertiary Education in FYR Macedonia
In the last 15 years there has been a tertiary education boom in FYR Macedonia. Unfortunately, the system for assuring its quality has not kept pace. The 2010 Conference of European Ministers flagged an underdeveloped quality assurance system as a major challenge for FYR Macedonia. The national accreditation board has limited technical capacity and too few full-time staff and it appears to apply input-oriented evaluation processes; moreover, it is generally perceived that it is not yet sufficiently independent of political forces to operate effectively. Furthermore, since the foundation for a sound quality assurance system is well-functioning quality assurance mechanisms in each university, significant capacity-building and enhanced resources are needed to promote an internal quality culture in all tertiary education institutions, public and private. It is also essential to closely monitor private institutions to identify any fraudulent practices and ensure that tertiary institutions are not simply degree mills.Source: Authors.
132 CHAPTER 5. PATHWAY II: DEVELOPING COMPETITIVE AND ADAPTIVE HUMAN CAPITAL AND CLOSING OPPORTUNITY GAPS
FYR MACEDONIA SYSTEMATIC COUNTRY DIAGNOSTIC
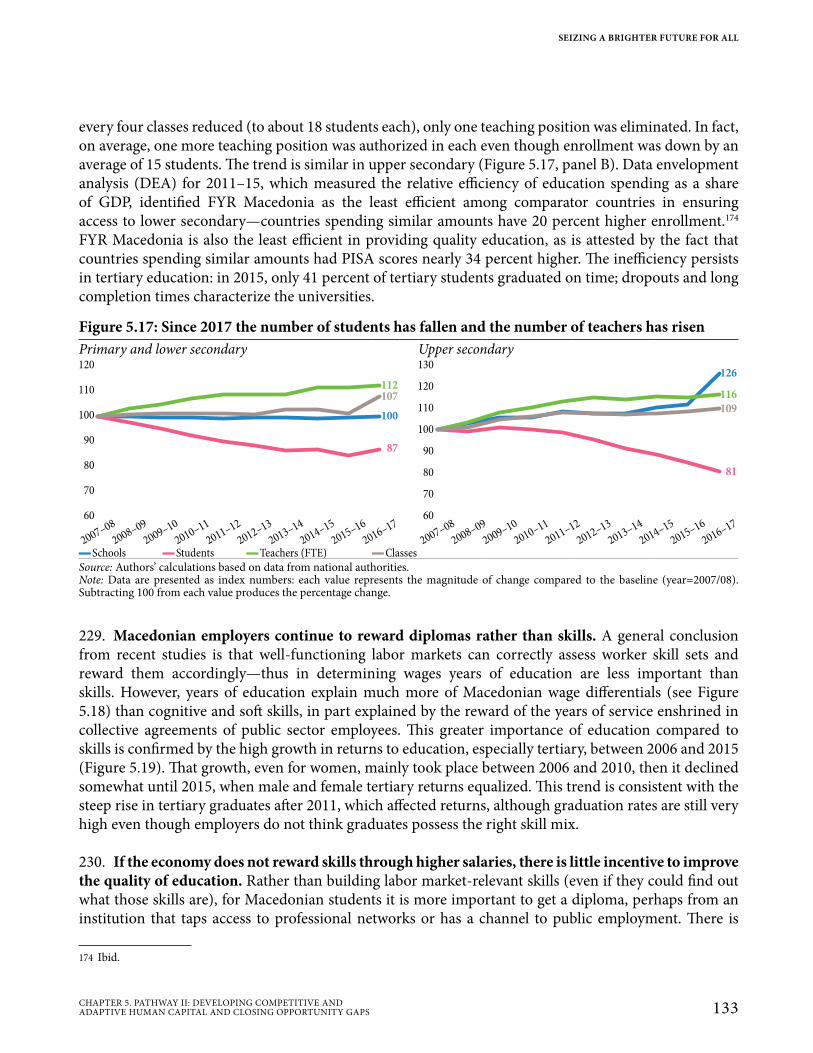
every four classes reduced (to about 18 students each), only one teaching position was eliminated. In fact, on average, one more teaching position was authorized in each even though enrollment was down by an average of 15 students. The trend is similar in upper secondary (Figure 5.17, panel B). Data envelopment analysis (DEA) for 2011–15, which measured the relative efficiency of education spending as a share of GDP, identified FYR Macedonia as the least efficient among comparator countries in ensuring access to lower secondary—countries spending similar amounts have 20 percent higher enrollment.174 FYR Macedonia is also the least efficient in providing quality education, as is attested by the fact that countries spending similar amounts had PISA scores nearly 34 percent higher. The inefficiency persists in tertiary education: in 2015, only 41 percent of tertiary students graduated on time; dropouts and long completion times characterize the universities.
229. Macedonian employers continue to reward diplomas rather than skills. A general conclusion from recent studies is that well-functioning labor markets can correctly assess worker skill sets and reward them accordingly—thus in determining wages years of education are less important than skills. However, years of education explain much more of Macedonian wage differentials (see Figure 5.18) than cognitive and soft skills, in part explained by the reward of the years of service enshrined in collective agreements of public sector employees. This greater importance of education compared to skills is confirmed by the high growth in returns to education, especially tertiary, between 2006 and 2015 (Figure 5.19). That growth, even for women, mainly took place between 2006 and 2010, then it declined somewhat until 2015, when male and female tertiary returns equalized. This trend is consistent with the steep rise in tertiary graduates after 2011, which affected returns, although graduation rates are still very high even though employers do not think graduates possess the right skill mix.
230. If the economy does not reward skills through higher salaries, there is little incentive to improve the quality of education. Rather than building labor market-relevant skills (even if they could find out what those skills are), for Macedonian students it is more important to get a diploma, perhaps from an institution that taps access to professional networks or has a channel to public employment. There is
174 Ibid.
Figure 5.17: Since 2017 the number of students has fallen and the number of teachers has risenPrimary and lower secondary Upper secondary120
100
107110
112
90
100
80
87
60
70
2007–08
2008–09
2009–10
2010–11
2011–12
2012–13
2013–14
2014–15
2015–16
2016–17
116
126
109
81
2007–08
2008–09
2009–10
2010–11
2011–12
2012–13
2013–14
2014–15
2015–16
2016–17
130
100
110
90
80
60
70
120
▬Schools ▬Students ▬Teachers (FTE) ▬ClassesSource: Authors’ calculations based on data from national authorities.Note: Data are presented as index numbers: each value represents the magnitude of change compared to the baseline (year=2007/08). Subtracting 100 from each value produces the percentage change.
SEIZING A BRIGHTER FUTURE FOR ALL
133CHAPTER 5. PATHWAY II: DEVELOPING COMPETITIVE AND ADAPTIVE HUMAN CAPITAL AND CLOSING OPPORTUNITY GAPS
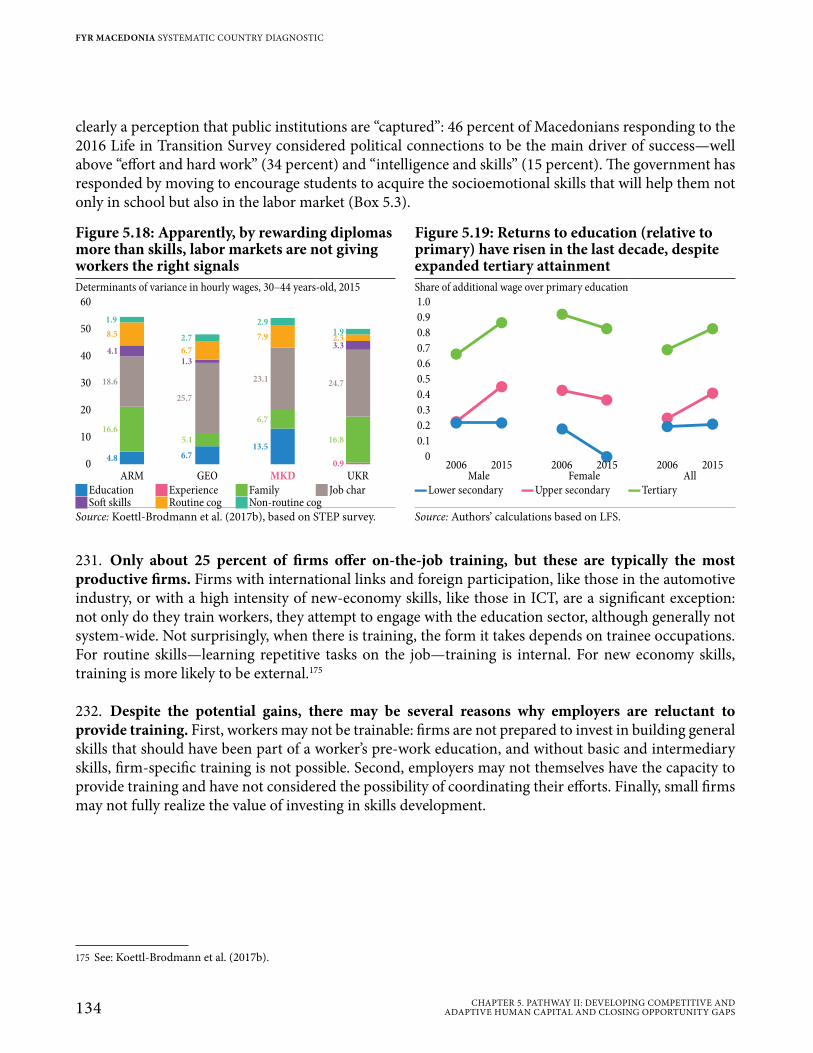
clearly a perception that public institutions are “captured”: 46 percent of Macedonians responding to the 2016 Life in Transition Survey considered political connections to be the main driver of success—well above “effort and hard work” (34 percent) and “intelligence and skills” (15 percent). The government has responded by moving to encourage students to acquire the socioemotional skills that will help them not only in school but also in the labor market (Box 5.3).
231. Only about 25 percent of firms offer on-the-job training, but these are typically the most productive firms. Firms with international links and foreign participation, like those in the automotive industry, or with a high intensity of new-economy skills, like those in ICT, are a significant exception: not only do they train workers, they attempt to engage with the education sector, although generally not system-wide. Not surprisingly, when there is training, the form it takes depends on trainee occupations. For routine skills—learning repetitive tasks on the job—training is internal. For new economy skills, training is more likely to be external.175
232. Despite the potential gains, there may be several reasons why employers are reluctant to provide training. First, workers may not be trainable: firms are not prepared to invest in building general skills that should have been part of a worker’s pre-work education, and without basic and intermediary skills, firm-specific training is not possible. Second, employers may not themselves have the capacity to provide training and have not considered the possibility of coordinating their efforts. Finally, small firms may not fully realize the value of investing in skills development.
175 See: Koettl-Brodmann et al. (2017b).
Figure 5.18: Apparently, by rewarding diplomas more than skills, labor markets are not giving workers the right signals
Figure 5.19: Returns to education (relative to primary) have risen in the last decade, despite expanded tertiary attainment
Determinants of variance in hourly wages, 30–44 years-old, 2015 Share of additional wage over primary education
ARM GEO MKD UKR
60
40
50
30
20
0
10
1.9
8.5
4.1
18.6
16.6
4.8
2.7
6.7
1.3
25.7
5.1
6.7
2.9
7.9
23.1
6.7
13.5
1.92.33.3
24.7
16.8
0.9
1.0
0.9
0.8
0.7
0.6
0.5
0.4
0.3
0.2
0.1
0
Male Female All2006 2006 20062015 20152015
JEducation JExperience JFamily J Job char ▬Lower secondary ▬Upper secondary ▬Tertiary JSoft skills JRoutine cog JNon-routine cog
Source: Koettl-Brodmann et al. (2017b), based on STEP survey. Source: Authors’ calculations based on LFS.
134 CHAPTER 5. PATHWAY II: DEVELOPING COMPETITIVE AND ADAPTIVE HUMAN CAPITAL AND CLOSING OPPORTUNITY GAPS
FYR MACEDONIA SYSTEMATIC COUNTRY DIAGNOSTIC
5.2.1.1 Improving Health Outcomes Is Crucial for Building Human Capital and Preventing People From Losing Productive Years
233. Health care provision notwithstanding, children in FYR Macedonia have a higher mortality risk than those in other Western Balkan or European countries. The established well-distributed public health care infrastructure in FYR Macedonia that delivers preventive care to the entire population has contributed to excellent results in access to and utilization of maternal and child health services. Virtually all pregnant women receive prenatal care and most births are attended by skilled health personnel. Maternal mortality is low, having fallen in 2015 to 8 per 100,000 live births, close to the EU average of 7. However, infant and under-5 mortality is higher than the Western Balkan and EU averages (Figure 5.20). Although both rates have been cut by half since 1995 (infant mortality from 22.1 to 10.7 per 1,000 live births; under-5 mortality from 24.7 to 12.2), they are still about triple the EU averages, and unlike the rest of the region, since 2010 the positive downward trends have reversed in FYR Macedonia. Macedonia is the only country in the region (and one of the 6 worldwide) where infant and under-5
Box 5.3: “Yes, You Can!”: Building the Socioemotional Skills of Lower-Secondary Students
A growing body of studies has found that socioemotional skills are crucial predictors of educational success. Of these, grit—passion and perseverance in the pursuit of long-term goalsa—has been shown to predict educational success beyond innate ability. During the 2016–17 school year the World Bank and the Government of FYR Macedonia conducted the first large-scale test of a socioemotional skills curriculum in a non-OECD country, delivering 5 lessons to 23,421 6th and 7th graders in public schools. Schools were allocated to one of two grit-building treatments or a no-treatment control. For the former the 5-lesson curriculum was delivered two ways, self-paced or teacher-delivered. The curriculum encouraged students to identify their learning weaknesses, persevere despite difficulty, seek critical feedback, and approach work with full concentration. A secondary goal was to change negative beliefs—stereotypes—that prevent students from investing full effort in their studies.
In both modes the curriculum succeeded in increasing student self-reported levels of socioemotional skills by up to 13 percent of the "typical" deviation from the average. Gritty students worked harder, for a longer time, to achieve their goals. While in the short run there was no change in the academic achievement of treated students versus the entire population, the curriculum meaningfully increased the academic achievement of disadvantaged Roma students, with more impact for girls than boys. These students not only raised their socioemotional skills above those of ethnic-Macedonian and ethnic-Albanian students, they raised their grades by the equivalent of an additional two weeks—the duration of remedial education for low-performing students in FYR Macedonia. The results were driven by the teacher-delivered treatment arm: teachers were trained not only on how to deliver curriculum content but also on how to avoid stereotyping students and on recognizing effort. The Roma student results are similar to those of programs documented elsewhere in the world in terms of providing information to either students or parents about the benefits of schooling.a Duckworth et al. (2007).Source: Authors based on Munoz-Boudet and Naceva (2018, forthcoming).
SEIZING A BRIGHTER FUTURE FOR ALL
135CHAPTER 5. PATHWAY II: DEVELOPING COMPETITIVE AND ADAPTIVE HUMAN CAPITAL AND CLOSING OPPORTUNITY GAPS
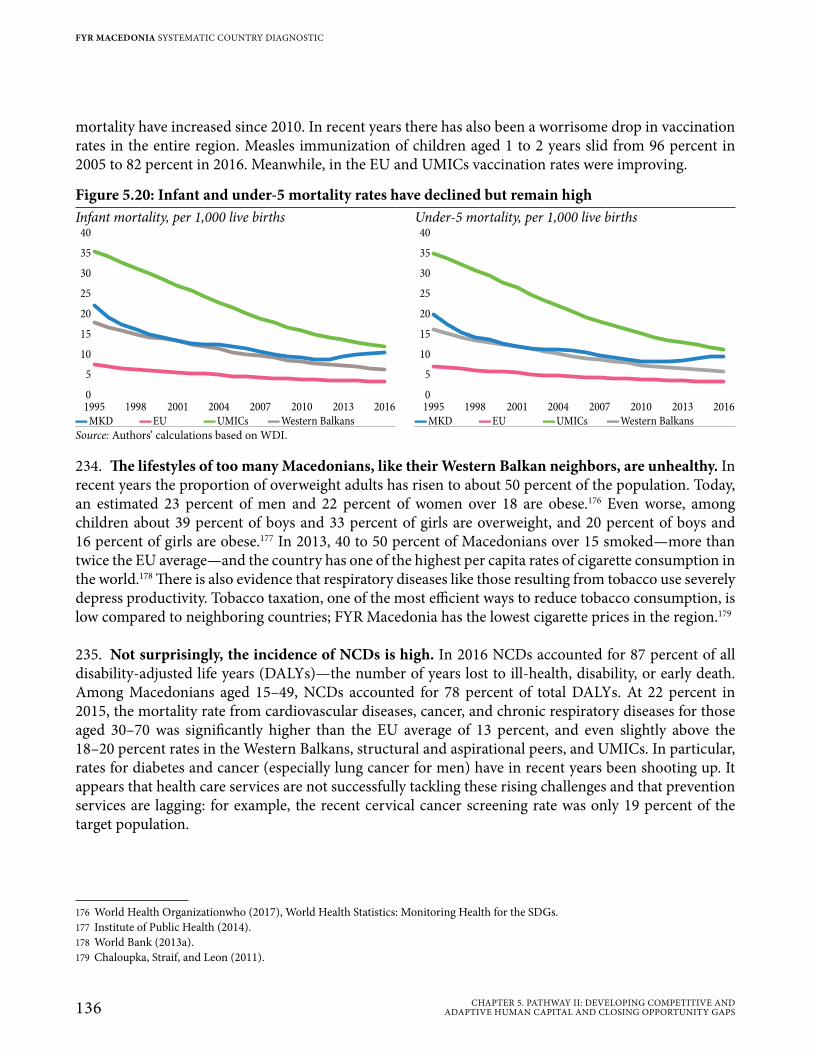
mortality have increased since 2010. In recent years there has also been a worrisome drop in vaccination rates in the entire region. Measles immunization of children aged 1 to 2 years slid from 96 percent in 2005 to 82 percent in 2016. Meanwhile, in the EU and UMICs vaccination rates were improving.
234. The lifestyles of too many Macedonians, like their Western Balkan neighbors, are unhealthy. In recent years the proportion of overweight adults has risen to about 50 percent of the population. Today, an estimated 23 percent of men and 22 percent of women over 18 are obese.176 Even worse, among children about 39 percent of boys and 33 percent of girls are overweight, and 20 percent of boys and 16 percent of girls are obese.177 In 2013, 40 to 50 percent of Macedonians over 15 smoked—more than twice the EU average—and the country has one of the highest per capita rates of cigarette consumption in the world.178 There is also evidence that respiratory diseases like those resulting from tobacco use severely depress productivity. Tobacco taxation, one of the most efficient ways to reduce tobacco consumption, is low compared to neighboring countries; FYR Macedonia has the lowest cigarette prices in the region.179
235. Not surprisingly, the incidence of NCDs is high. In 2016 NCDs accounted for 87 percent of all disability-adjusted life years (DALYs)—the number of years lost to ill-health, disability, or early death. Among Macedonians aged 15–49, NCDs accounted for 78 percent of total DALYs. At 22 percent in 2015, the mortality rate from cardiovascular diseases, cancer, and chronic respiratory diseases for those aged 30–70 was significantly higher than the EU average of 13 percent, and even slightly above the 18–20 percent rates in the Western Balkans, structural and aspirational peers, and UMICs. In particular, rates for diabetes and cancer (especially lung cancer for men) have in recent years been shooting up. It appears that health care services are not successfully tackling these rising challenges and that prevention services are lagging: for example, the recent cervical cancer screening rate was only 19 percent of the target population.
176 World Health Organizationwho (2017), World Health Statistics: Monitoring Health for the SDGs.177 Institute of Public Health (2014).178 World Bank (2013a).179 Chaloupka, Straif, and Leon (2011).
Figure 5.20: Infant and under-5 mortality rates have declined but remain highInfant mortality, per 1,000 live births Under-5 mortality, per 1,000 live births
40
35
30
25
20
15
10
5
0
1995 1998 2001 2004 2007 2010 2013 2016
40
35
30
25
20
15
10
5
0
1995 1998 2001 2004 2007 2010 2013 2016
▬MKD ▬EU ▬UMICs ▬Western Balkans ▬MKD ▬EU ▬UMICs ▬Western BalkansSource: Authors’ calculations based on WDI.
136 CHAPTER 5. PATHWAY II: DEVELOPING COMPETITIVE AND ADAPTIVE HUMAN CAPITAL AND CLOSING OPPORTUNITY GAPS
FYR MACEDONIA SYSTEMATIC COUNTRY DIAGNOSTIC
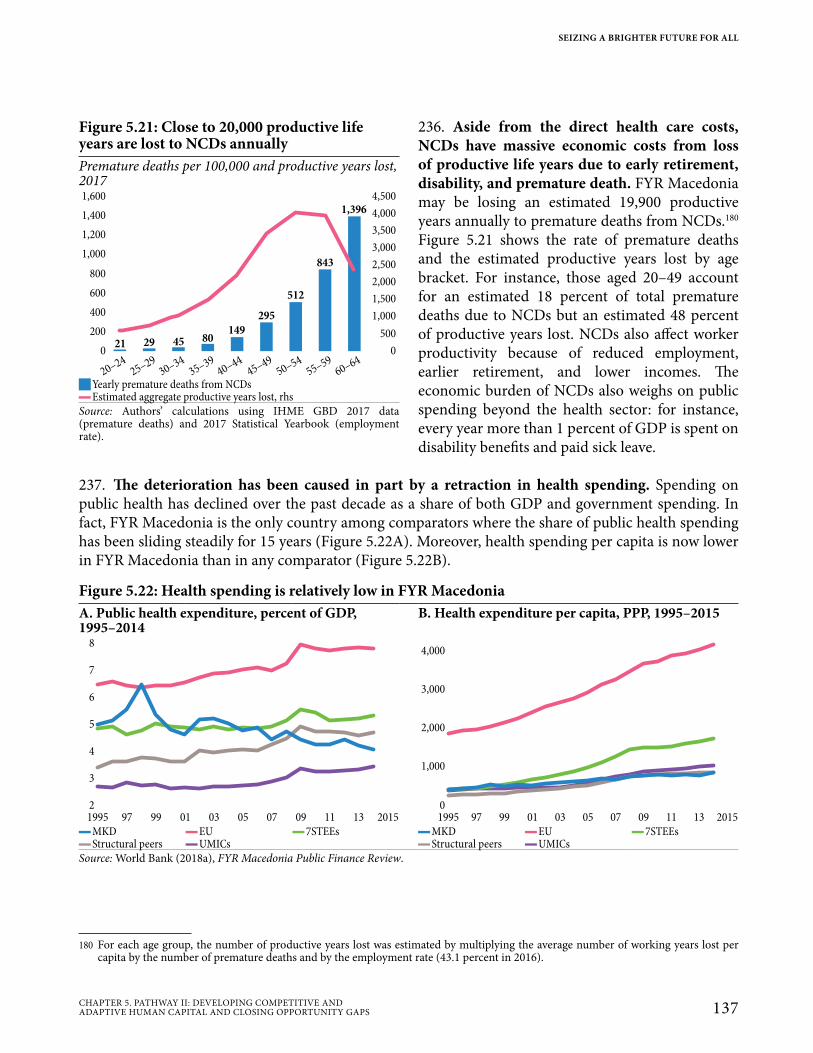
236. Aside from the direct health care costs, NCDs have massive economic costs from loss of productive life years due to early retirement, disability, and premature death. FYR Macedonia may be losing an estimated 19,900 productive years annually to premature deaths from NCDs.180 Figure 5.21 shows the rate of premature deaths and the estimated productive years lost by age bracket. For instance, those aged 20–49 account for an estimated 18 percent of total premature deaths due to NCDs but an estimated 48 percent of productive years lost. NCDs also affect worker productivity because of reduced employment, earlier retirement, and lower incomes. The economic burden of NCDs also weighs on public spending beyond the health sector: for instance, every year more than 1 percent of GDP is spent on disability benefits and paid sick leave.
237. The deterioration has been caused in part by a retraction in health spending. Spending on public health has declined over the past decade as a share of both GDP and government spending. In fact, FYR Macedonia is the only country among comparators where the share of public health spending has been sliding steadily for 15 years (Figure 5.22A). Moreover, health spending per capita is now lower in FYR Macedonia than in any comparator (Figure 5.22B).
180 For each age group, the number of productive years lost was estimated by multiplying the average number of working years lost per capita by the number of premature deaths and by the employment rate (43.1 percent in 2016).
Figure 5.21: Close to 20,000 productive life years are lost to NCDs annuallyPremature deaths per 100,000 and productive years lost, 20171,600 4,500
1,400 4,000
1,2003,500
1,0003,000
8002,500
600
2,000
400
1,500
200 500
1,000
0 021 29 45 80
149
295
512
843
1,396
20–24
25–29
30–34
35–39
40–44
45–49
50–54
55–59
60–64
JYearly premature deaths from NCDs ▬Estimated aggregate productive years lost, rhs
Source: Authors’ calculations using IHME GBD 2017 data (premature deaths) and 2017 Statistical Yearbook (employment rate).
Figure 5.22: Health spending is relatively low in FYR MacedoniaA. Public health expenditure, percent of GDP, 1995–2014
B. Health expenditure per capita, PPP, 1995–2015
8
7
6
5
4
3
2
1995 97 99 01 03 05 07 09 11 13 2015
4,000
3,000
2,000
1,000
0
1995 97 99 01 03 05 07 09 11 13 2015
▬MKD ▬EU ▬7STEEs ▬MKD ▬EU ▬7STEEs ▬Structural peers ▬UMICs ▬Structural peers ▬UMICs
Source: World Bank (2018a), FYR Macedonia Public Finance Review.
SEIZING A BRIGHTER FUTURE FOR ALL
137CHAPTER 5. PATHWAY II: DEVELOPING COMPETITIVE AND ADAPTIVE HUMAN CAPITAL AND CLOSING OPPORTUNITY GAPS
238. Inefficiencies in the health system need to be addressed: (1) The share in public spending of primary health care, the most efficient way to prevent and treat NCDs, has been edging down for five years, from 30.1 percent of Health Insurance Fund spending in 2012 to 29.3 percent in 2016, despite the rise in NCDs and the associated risks. Meanwhile, the share of specialist consultative services went up from 28.6 percent in 2012 to 31.3 percent in 2016, while the share of hospital care dropped from 38.1 to 35.1 percent. To improve the allocative efficiency of health resources, it will be necessary to scrutinize the supply side, right-size service levels, and restructure currently underused hospital services. (2) Promotion of preventive services should be incentivized. (3) There is also a need for pharmaceutical sector reforms to decrease unit prices and heighten access to innovative and cost-effective therapies.
5.2.1.2 Gaps in Human Development for Ethnic Minorities Must Be Closed to Guarantee Social Inclusion, Particularly for Roma People
239. Ethnic Roma children have significantly less access to education at every stage of the lifecycle, and the health services available to them are of poor quality. Almost no children in the lowest welfare quintile, and not even 6 percent of rural children, are in preschool, and while most such gaps close at the start of compulsory education, that is not true for vulnerable Roma children. For them, while preschool attendance today is somewhat higher at 14 percent, that is still 10 pp lower than in 2011, and the gap between vulnerable Roma and non-Roma children has since almost doubled, from 8 to 15 pp (Box 5.4). It is also much harder for them to even reach a school: Roma and ethnic-Albanian areas are severely underserved. Rates of vulnerable Roma completion of compulsory education (up to upper secondary) are dismal: only about 33 percent complete upper secondary by the age of 25, compared to 87 percent of non-Roma youth. It is thus not surprising that close to 75 percent of Roma youth are NEETs (not in employment, education, or training). Roma women also have worse health indicators—fewer if any prenatal visits and lower quality of care—and their children suffer more from stunting.
Box 5.4: Less Access to Economic Opportunities for Vulnerable Roma Communities
Though there has been slight progress in Roma access to economic opportunities, it is far from enough to close the substantial gaps between them and the general population. In 2017 the World Bank, the UNDP, and the EU conducted a follow-up to a 2011 survey of vulnerable neighboring Roma and non-Roma communities (UNDP-WB-EC Regional Roma Survey). The survey collected data on education, employment, and other living-standard indicators, such as health, housing, and access to documentation. It found that the 2011 education and employment gaps were still evident (Figure B5.3.1).
In fact, Roma preprimary enrollment, which is critical to building both cognitive and social abilities, had actually dropped since 2011. Although enrollment for neighboring non-Roma communities is just 29 percent, Roma enrollment was less than 15 percent. There were also major gaps between Roma and non-Roma enrollment in general mandatory education, though they had narrowed very slightly. For instance, in 2017, despite a slight narrowing, enrollment in primary and lower secondary was still more than 20 percentage points less among the Roma. Worryingly,
continued on next page
138 CHAPTER 5. PATHWAY II: DEVELOPING COMPETITIVE AND ADAPTIVE HUMAN CAPITAL AND CLOSING OPPORTUNITY GAPS
FYR MACEDONIA SYSTEMATIC COUNTRY DIAGNOSTIC
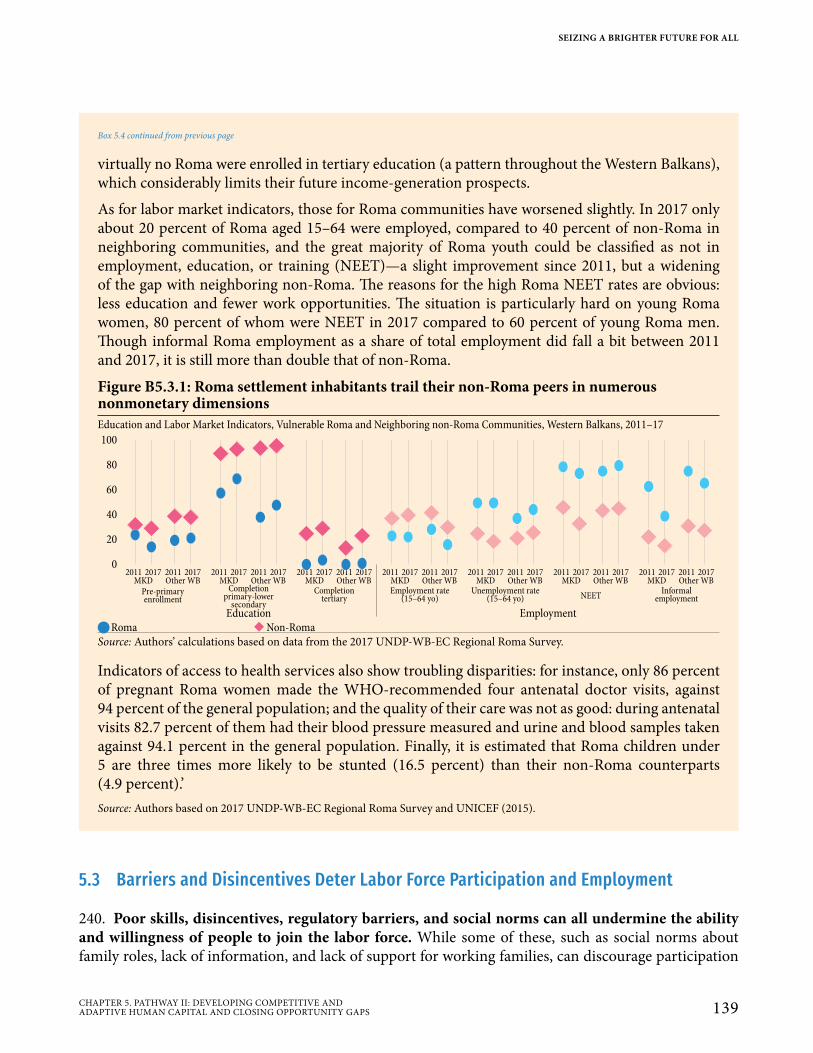
5.3 Barriers and Disincentives Deter Labor Force Participation and Employment
240. Poor skills, disincentives, regulatory barriers, and social norms can all undermine the ability and willingness of people to join the labor force. While some of these, such as social norms about family roles, lack of information, and lack of support for working families, can discourage participation
virtually no Roma were enrolled in tertiary education (a pattern throughout the Western Balkans), which considerably limits their future income-generation prospects.
As for labor market indicators, those for Roma communities have worsened slightly. In 2017 only about 20 percent of Roma aged 15–64 were employed, compared to 40 percent of non-Roma in neighboring communities, and the great majority of Roma youth could be classified as not in employment, education, or training (NEET)—a slight improvement since 2011, but a widening of the gap with neighboring non-Roma. The reasons for the high Roma NEET rates are obvious: less education and fewer work opportunities. The situation is particularly hard on young Roma women, 80 percent of whom were NEET in 2017 compared to 60 percent of young Roma men. Though informal Roma employment as a share of total employment did fall a bit between 2011 and 2017, it is still more than double that of non-Roma.
Figure B5.3.1: Roma settlement inhabitants trail their non-Roma peers in numerous nonmonetary dimensionsEducation and Labor Market Indicators, Vulnerable Roma and Neighboring non-Roma Communities, Western Balkans, 2011–17100
80
60
40
20
02011 20112017 2017
Education
Pre-primaryenrollment
MKD Other WBCompletion
primary-lowersecondary
Completiontertiary
Employment rate(15–64 yo)
Unemployment rate(15–64 yo) NEET
Informalemployment
2011 2011 2011 2011 2011 20112011 2011 2011 2011 2011 20112017 2017 2017 2017 2017 20172017 2017 2017 2017 2017 2017MKD MKD MKD MKD MKD MKDOther WB Other WB Other WB Other WB Other WB Other WB
Employment
QRoma �Non-RomaSource: Authors’ calculations based on data from the 2017 UNDP-WB-EC Regional Roma Survey.
Indicators of access to health services also show troubling disparities: for instance, only 86 percent of pregnant Roma women made the WHO-recommended four antenatal doctor visits, against 94 percent of the general population; and the quality of their care was not as good: during antenatal visits 82.7 percent of them had their blood pressure measured and urine and blood samples taken against 94.1 percent in the general population. Finally, it is estimated that Roma children under 5 are three times more likely to be stunted (16.5 percent) than their non-Roma counterparts (4.9 percent).’Source: Authors based on 2017 UNDP-WB-EC Regional Roma Survey and UNICEF (2015).
Box 5.4 continued from previous page
SEIZING A BRIGHTER FUTURE FOR ALL
139CHAPTER 5. PATHWAY II: DEVELOPING COMPETITIVE AND ADAPTIVE HUMAN CAPITAL AND CLOSING OPPORTUNITY GAPS
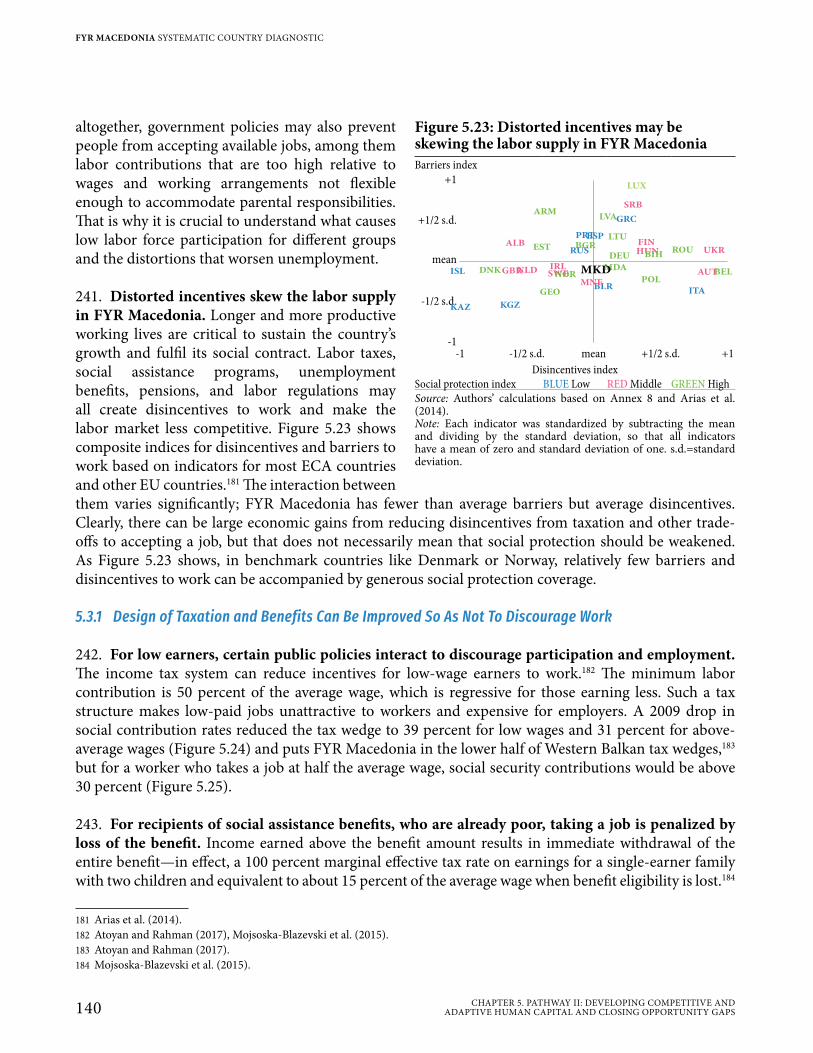
altogether, government policies may also prevent people from accepting available jobs, among them labor contributions that are too high relative to wages and working arrangements not flexible enough to accommodate parental responsibilities. That is why it is crucial to understand what causes low labor force participation for different groups and the distortions that worsen unemployment.
241. Distorted incentives skew the labor supply in FYR Macedonia. Longer and more productive working lives are critical to sustain the country’s growth and fulfil its social contract. Labor taxes, social assistance programs, unemployment benefits, pensions, and labor regulations may all create disincentives to work and make the labor market less competitive. Figure 5.23 shows composite indices for disincentives and barriers to work based on indicators for most ECA countries and other EU countries.181 The interaction between them varies significantly; FYR Macedonia has fewer than average barriers but average disincentives. Clearly, there can be large economic gains from reducing disincentives from taxation and other trade-offs to accepting a job, but that does not necessarily mean that social protection should be weakened. As Figure 5.23 shows, in benchmark countries like Denmark or Norway, relatively few barriers and disincentives to work can be accompanied by generous social protection coverage.
5.3.1 Design of Taxation and Benefits Can Be Improved So As Not To Discourage Work
242. For low earners, certain public policies interact to discourage participation and employment. The income tax system can reduce incentives for low-wage earners to work.182 The minimum labor contribution is 50 percent of the average wage, which is regressive for those earning less. Such a tax structure makes low-paid jobs unattractive to workers and expensive for employers. A 2009 drop in social contribution rates reduced the tax wedge to 39 percent for low wages and 31 percent for above-average wages (Figure 5.24) and puts FYR Macedonia in the lower half of Western Balkan tax wedges,183 but for a worker who takes a job at half the average wage, social security contributions would be above 30 percent (Figure 5.25).
243. For recipients of social assistance benefits, who are already poor, taking a job is penalized by loss of the benefit. Income earned above the benefit amount results in immediate withdrawal of the entire benefit—in effect, a 100 percent marginal effective tax rate on earnings for a single-earner family with two children and equivalent to about 15 percent of the average wage when benefit eligibility is lost.184
181 Arias et al. (2014).182 Atoyan and Rahman (2017), Mojsoska-Blazevski et al. (2015).183 Atoyan and Rahman (2017).184 Mojsoska-Blazevski et al. (2015).
Figure 5.23: Distorted incentives may be skewing the labor supply in FYR MacedoniaBarriers index
+1
+1/2 s.d.
mean
-1/2 s.d.
-1
-1 -1/2 s.d. mean +1/2 s.d. +1
LUX
ARMLVA
LTUEST BGR
DEUROU
DNK MDABEL
POL
GEO
PRTESP
ISL
BLRITA
KAZ KGZ
SRB
ALB FINHUN UKR
GBRNLD IRLSWE
MNEAUT
RUS BIH
NOR
GRC
MKD
Disincentives indexSocial protection index BLUE Low RED Middle GREEN HighSource: Authors’ calculations based on Annex 8 and Arias et al. (2014).Note: Each indicator was standardized by subtracting the mean and dividing by the standard deviation, so that all indicators have a mean of zero and standard deviation of one. s.d.=standard deviation.
140 CHAPTER 5. PATHWAY II: DEVELOPING COMPETITIVE AND ADAPTIVE HUMAN CAPITAL AND CLOSING OPPORTUNITY GAPS
FYR MACEDONIA SYSTEMATIC COUNTRY DIAGNOSTIC

Moreover, beneficiaries of the Social Financial Assistance (SFA) program also receive such additional benefits as subsidized telephone and television and reductions in energy bills. Because these could make SFA more attractive for a household than a member working at a minimum-wage job, they considerably amplify the opportunity cost of a formal job. The SFA is also likely to interact with and deepen other labor market barriers to its beneficiaries, extending their dependency, exclusion, and poverty. While SFA does have some incentives for transitioning to work, such as a cut in the benefit to 50 percent of the full amount after three years and continued support to beneficiaries employed in a public works program or seasonal or other type of temporary work, it also creates disincentives to accepting jobs.
244. Benefits related to support for children are also correlated with low participation in the labor market. Social benefits in FYR Macedonia require beneficiaries to register as unemployed and eventually to accept job offers. Thus, there is a very high and significant correlation between job market status and receiving social assistance, especially child-related benefits. Annex 7 shows the results of regressions that relate the employment status of adults (equal to 1 if employed), distinguishing between urban and rural, household heads and non-heads, and males and females. Controlling for standard worker characteristics (age, experience, and education), adults in households with children aged 0–3 and 6–18 (both groups that get special parental benefits) are less likely to be employed, particularly in rural areas and if they do not head the household. However, households that receive other social assistance benefits, including those of public sector workers, or that contain pensioners are not significantly correlated with employment.
5.3.1.1 Alternative Sources of Income May Increase Reservation Wages
245. Emigration and remittances also seem to affect participation in the labor market. Especially in rural areas, adults in households that receive remittances are less likely to be employed (Annex 7). While these results do not suggest causal links, they do suggest that households where earnings from employment are scarce use other ways to increase their income, such as family networks with migrant workers. However, even within a household, the effects of remittances vary. A household that receives remittances is 37–42 percent less likely than a nonrecipient household to have a member who is self-
Figure 5.24: The lowered tax wedge is still high for very low wage earners
Figure 5.25: At very low wages, the marginal tax rate is high
Labor tax wedge, percent of total labor cost, 2016 Marginal tax rate, percent of total labor cost, 201650
45
40
35
30
25
20
15
10
5
0
28 26
38 39
10
39
31
4339
4238
ALB BIH KOS MKD MNE SRB
40
30
20
0
10
0 1 2 3 4 5 6 7 8 9 10
J2006 J2016 ▬PIT ▬SSC + PITSource: IMF (2017). Both simulations are for a single earner.Note: Simulation for a single earner at 67% of the average wage.
Source: IMF (2017). Both simulations are for a single earner.Note: Simulation for a single earner at 67% of the average wage.
SEIZING A BRIGHTER FUTURE FOR ALL
141CHAPTER 5. PATHWAY II: DEVELOPING COMPETITIVE AND ADAPTIVE HUMAN CAPITAL AND CLOSING OPPORTUNITY GAPS
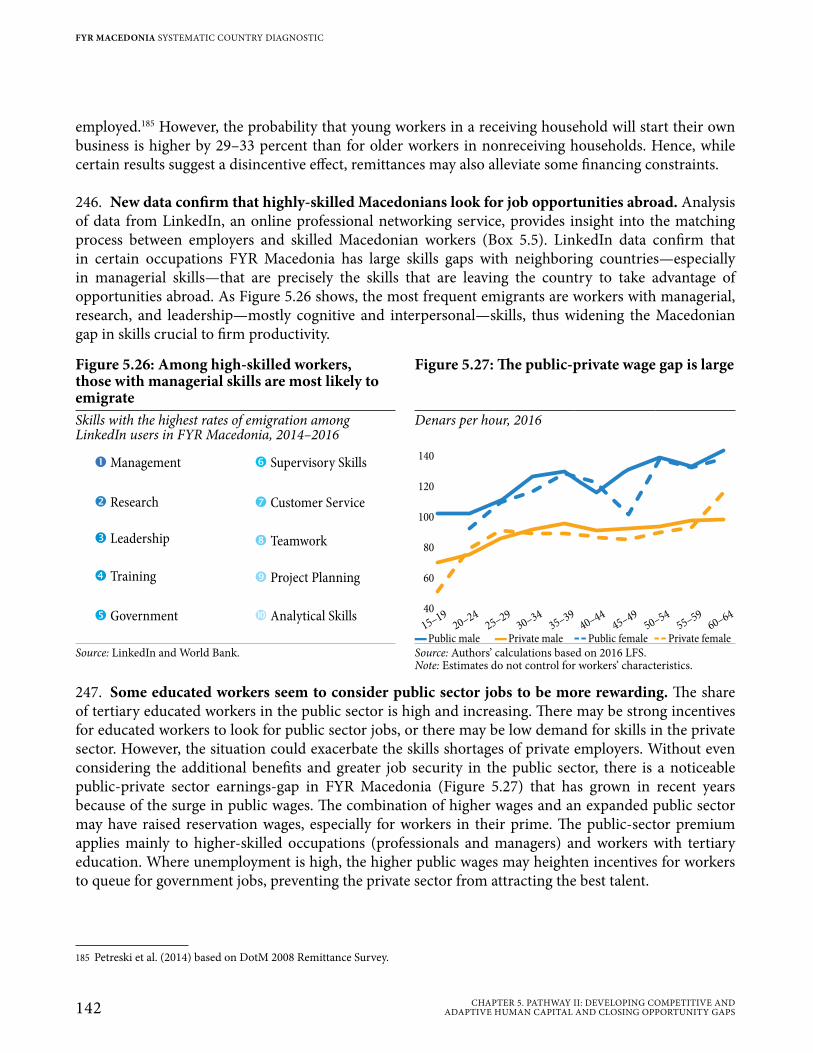
employed.185 However, the probability that young workers in a receiving household will start their own business is higher by 29–33 percent than for older workers in nonreceiving households. Hence, while certain results suggest a disincentive effect, remittances may also alleviate some financing constraints.
246. New data confirm that highly-skilled Macedonians look for job opportunities abroad. Analysis of data from LinkedIn, an online professional networking service, provides insight into the matching process between employers and skilled Macedonian workers (Box 5.5). LinkedIn data confirm that in certain occupations FYR Macedonia has large skills gaps with neighboring countries—especially in managerial skills—that are precisely the skills that are leaving the country to take advantage of opportunities abroad. As Figure 5.26 shows, the most frequent emigrants are workers with managerial, research, and leadership—mostly cognitive and interpersonal—skills, thus widening the Macedonian gap in skills crucial to firm productivity.
247. Some educated workers seem to consider public sector jobs to be more rewarding. The share of tertiary educated workers in the public sector is high and increasing. There may be strong incentives for educated workers to look for public sector jobs, or there may be low demand for skills in the private sector. However, the situation could exacerbate the skills shortages of private employers. Without even considering the additional benefits and greater job security in the public sector, there is a noticeable public-private sector earnings-gap in FYR Macedonia (Figure 5.27) that has grown in recent years because of the surge in public wages. The combination of higher wages and an expanded public sector may have raised reservation wages, especially for workers in their prime. The public-sector premium applies mainly to higher-skilled occupations (professionals and managers) and workers with tertiary education. Where unemployment is high, the higher public wages may heighten incentives for workers to queue for government jobs, preventing the private sector from attracting the best talent.
185 Petreski et al. (2014) based on DotM 2008 Remittance Survey.
Figure 5.26: Among high-skilled workers, those with managerial skills are most likely to emigrate
Figure 5.27: The public-private wage gap is large
Skills with the highest rates of emigration among LinkedIn users in FYR Macedonia, 2014–2016
Denars per hour, 2016
�Management
� Research
� Leadership
� Training
� Government
� Supervisory Skills
� Customer Service
� Teamwork
� Project Planning
� Analytical Skills
140
120
100
80
60
40
20–24
15–19
25–29
30–34
35–39
40–44
45–49
50–54
55–59
60–64
▬Public male ▬Private male Public female Private femaleSource: LinkedIn and World Bank. Source: Authors’ calculations based on 2016 LFS.
Note: Estimates do not control for workers’ characteristics.
142 CHAPTER 5. PATHWAY II: DEVELOPING COMPETITIVE AND ADAPTIVE HUMAN CAPITAL AND CLOSING OPPORTUNITY GAPS
FYR MACEDONIA SYSTEMATIC COUNTRY DIAGNOSTIC
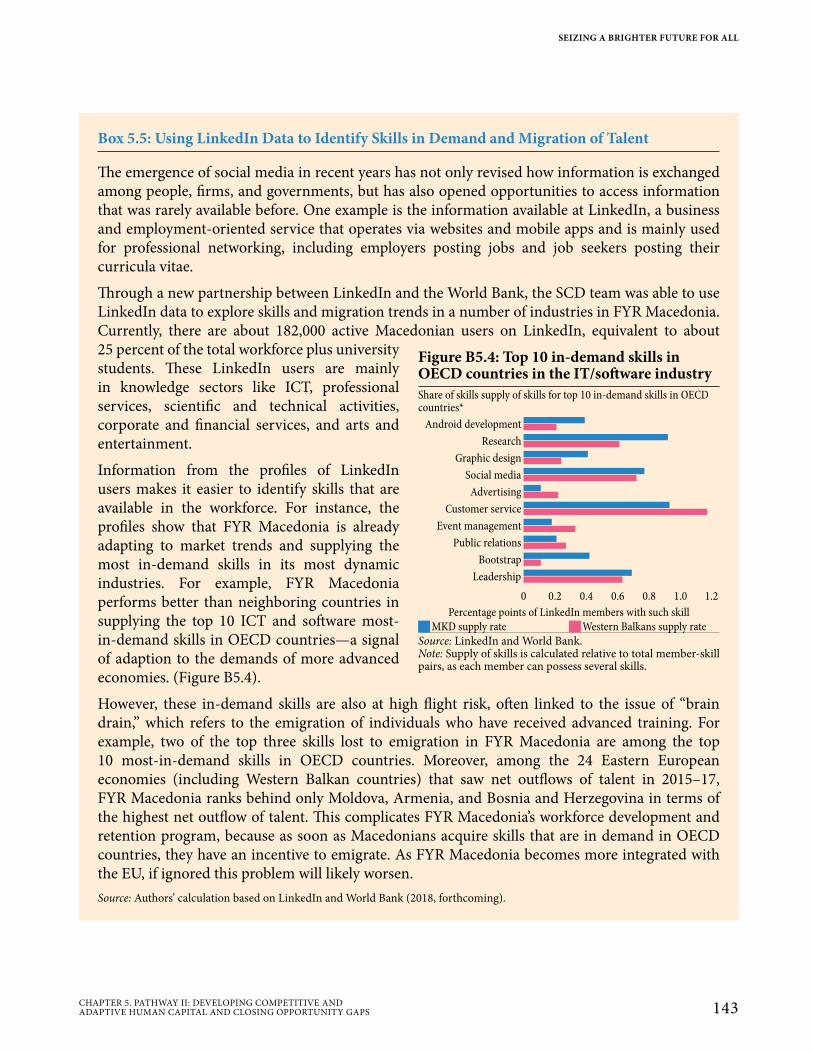
Box 5.5: Using LinkedIn Data to Identify Skills in Demand and Migration of Talent
The emergence of social media in recent years has not only revised how information is exchanged among people, firms, and governments, but has also opened opportunities to access information that was rarely available before. One example is the information available at LinkedIn, a business and employment-oriented service that operates via websites and mobile apps and is mainly used for professional networking, including employers posting jobs and job seekers posting their curricula vitae.
Through a new partnership between LinkedIn and the World Bank, the SCD team was able to use LinkedIn data to explore skills and migration trends in a number of industries in FYR Macedonia. Currently, there are about 182,000 active Macedonian users on LinkedIn, equivalent to about 25 percent of the total workforce plus university students. These LinkedIn users are mainly in knowledge sectors like ICT, professional services, scientific and technical activities, corporate and financial services, and arts and entertainment.
Information from the profiles of LinkedIn users makes it easier to identify skills that are available in the workforce. For instance, the profiles show that FYR Macedonia is already adapting to market trends and supplying the most in-demand skills in its most dynamic industries. For example, FYR Macedonia performs better than neighboring countries in supplying the top 10 ICT and software most-in-demand skills in OECD countries—a signal of adaption to the demands of more advanced economies. (Figure B5.4).
However, these in-demand skills are also at high flight risk, often linked to the issue of “brain drain,” which refers to the emigration of individuals who have received advanced training. For example, two of the top three skills lost to emigration in FYR Macedonia are among the top 10 most-in-demand skills in OECD countries. Moreover, among the 24 Eastern European economies (including Western Balkan countries) that saw net outflows of talent in 2015–17, FYR Macedonia ranks behind only Moldova, Armenia, and Bosnia and Herzegovina in terms of the highest net outflow of talent. This complicates FYR Macedonia’s workforce development and retention program, because as soon as Macedonians acquire skills that are in demand in OECD countries, they have an incentive to emigrate. As FYR Macedonia becomes more integrated with the EU, if ignored this problem will likely worsen.Source: Authors’ calculation based on LinkedIn and World Bank (2018, forthcoming).
Figure B5.4: Top 10 in-demand skills inOECD countries in the IT/software industryShare of skills supply of skills for top 10 in-demand skills in OECD countries*
Android development
Research
Graphic design
Social media
Advertising
Customer service
Event management
Public relations
Bootstrap
Leadership
0 0.2 0.4 0.6 0.8 1.0 1.2
Percentage points of LinkedIn members with such skill JMKD supply rate JWestern Balkans supply rate
Source: LinkedIn and World Bank.Note: Supply of skills is calculated relative to total member-skill pairs, as each member can possess several skills.
SEIZING A BRIGHTER FUTURE FOR ALL
143CHAPTER 5. PATHWAY II: DEVELOPING COMPETITIVE AND ADAPTIVE HUMAN CAPITAL AND CLOSING OPPORTUNITY GAPS

248. Unemployed workers rely mostly on the incomes of other family members. Consistent with the evidence presented earlier, because inactive and unemployed people are less likely to be household heads, they depend on the household head’s income. For inactive adults, the wages of other household members account for almost 60 percent of their resources, followed by pension income (Figure 5.28). Working household members may thus carry a heavy burden of family support, and the earnings expectations of at least some workers may have less to do with market dynamics than with the necessity to subsidize other family members. The fact that most inactive adults have family member support also clarifies why at least some of them may be willing to wait a very long time for a “suitable” job opportunity.
249. Expectations of higher-than-market wages may also be preventing some unemployed workers from acquiring much-needed experience. As Figure 5.29 shows, the earnings expectations of youth who are NEETs are in line with their educational attainment (on average the more educated expect more). However, more than half of young NEETs (short-term unemployed) expect earnings above the minimum wage (MKD 14,739 per month, about €240), and the percentage rises for long-term unemployed NEETs. While this expectation might not be unreasonable for youth with tertiary education, less educated youth may be expecting higher wages than the market offers.186 For the unemployed workforce as a whole, regressions comparing the reservation wages of the unemployed with the wages of those employed in 2016 suggest that the expectations of the unemployed were about 7 percent higher than wages of employed workers with similar characteristics.
250. Meanwhile, wages in FYR Macedonia seem to be similar to the Western Balkan averages. Given the size of the Macedonian labor market and the relative integration of its economy with its neighbors and the EU, if wages in FYR Macedonia were significantly lower than in comparable markets, workers
186 This is consistent with previous studies: more educated youth have lower expectations about their first salary relative to market wages and less educated youth have higher expectations (Mojsoska-Blazevski 2016; World Bank 2013a).
Figure 5.28: Household member wages and pensions are the main source of income for inactive adultsSources of income for inactive, 2016
58
25
6
1 511 3
JHousehold member income JPension JSocial assistance JOther relatives JRemittances JRent, dividend JOther transfers JOther (<1% each)
Source: Authors’ calculations based on LFS.Note: Reservation wages capture the salary range that inactive youths declare that they would expect to earn if they received a job offer.
Figure 5.29: Over half of young unemployed NEET (15–29) expect to earn above the minimum wageReservation wage distribution, 2016100
90
80
70
60
50
40
30
20
10
0
Short-term unemployed Long-term unemployedPrimary PrimarySecondary SecondaryTersiary Tersiary
31.517.5
5.9
39.4
27.9
45
28
8.2
22.4
33.3
35.1
5.9
21.6
41
25.7
19
39.8
31.2
28
34.3
40.9
3.68.1 9.3
J<8,000 J8,001–12,000 J12,001–16,000 J16,001–20,000 J20,001–30,000 J30,001–40,000 J>40,001
Source: Authors’ calculations based on LFS.Note: Reservation wages capture the salary range that inactive youths declare that they would expect to earn if they received a job offer.
144 CHAPTER 5. PATHWAY II: DEVELOPING COMPETITIVE AND ADAPTIVE HUMAN CAPITAL AND CLOSING OPPORTUNITY GAPS
FYR MACEDONIA SYSTEMATIC COUNTRY DIAGNOSTIC
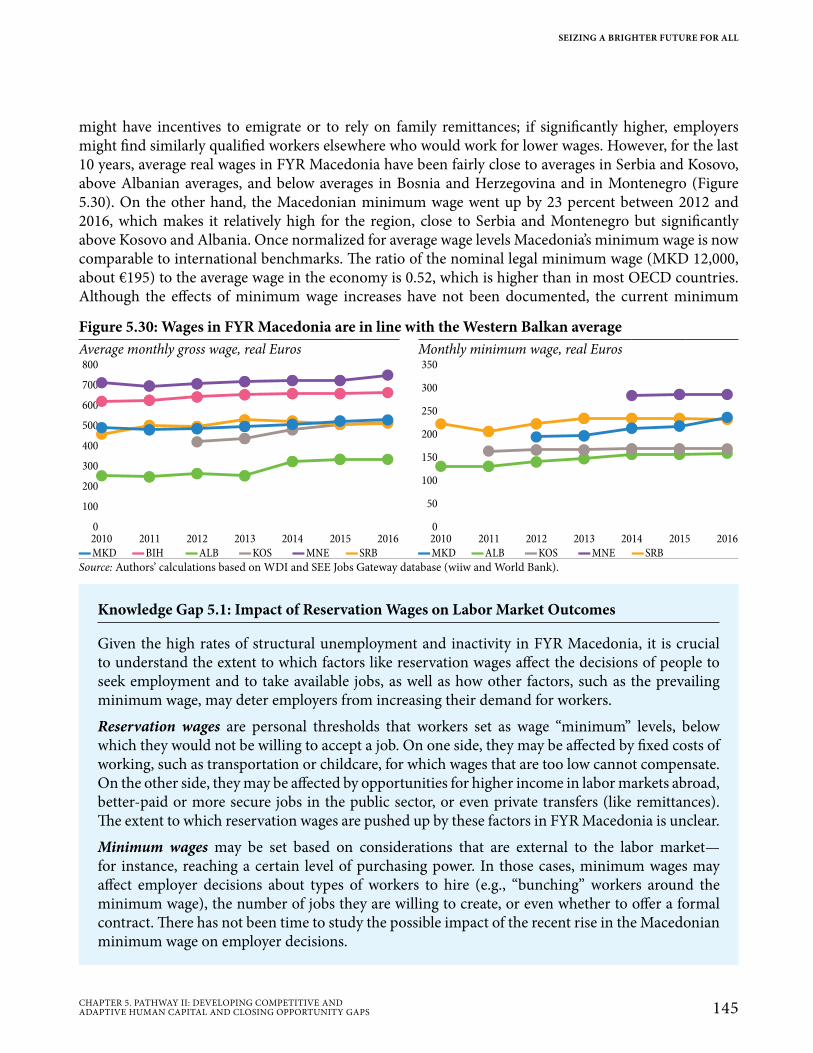
might have incentives to emigrate or to rely on family remittances; if significantly higher, employers might find similarly qualified workers elsewhere who would work for lower wages. However, for the last 10 years, average real wages in FYR Macedonia have been fairly close to averages in Serbia and Kosovo, above Albanian averages, and below averages in Bosnia and Herzegovina and in Montenegro (Figure 5.30). On the other hand, the Macedonian minimum wage went up by 23 percent between 2012 and 2016, which makes it relatively high for the region, close to Serbia and Montenegro but significantly above Kosovo and Albania. Once normalized for average wage levels Macedonia’s minimum wage is now comparable to international benchmarks. The ratio of the nominal legal minimum wage (MKD 12,000, about €195) to the average wage in the economy is 0.52, which is higher than in most OECD countries. Although the effects of minimum wage increases have not been documented, the current minimum
Knowledge Gap 5.1: Impact of Reservation Wages on Labor Market Outcomes
Given the high rates of structural unemployment and inactivity in FYR Macedonia, it is crucial to understand the extent to which factors like reservation wages affect the decisions of people to seek employment and to take available jobs, as well as how other factors, such as the prevailing minimum wage, may deter employers from increasing their demand for workers.
Reservation wages are personal thresholds that workers set as wage “minimum” levels, below which they would not be willing to accept a job. On one side, they may be affected by fixed costs of working, such as transportation or childcare, for which wages that are too low cannot compensate. On the other side, they may be affected by opportunities for higher income in labor markets abroad, better-paid or more secure jobs in the public sector, or even private transfers (like remittances). The extent to which reservation wages are pushed up by these factors in FYR Macedonia is unclear.
Minimum wages may be set based on considerations that are external to the labor market—for instance, reaching a certain level of purchasing power. In those cases, minimum wages may affect employer decisions about types of workers to hire (e.g., “bunching” workers around the minimum wage), the number of jobs they are willing to create, or even whether to offer a formal contract. There has not been time to study the possible impact of the recent rise in the Macedonian minimum wage on employer decisions.
Figure 5.30: Wages in FYR Macedonia are in line with the Western Balkan averageAverage monthly gross wage, real Euros Monthly minimum wage, real Euros800
700
600
500
400
300
200
100
0
2012 2013 2014 2015 201620112010
350
300
250
200
150
100
50
0
2012 2013 2014 2015 201620112010
▬MKD ▬BIH ▬ALB ▬KOS ▬MNE ▬SRB ▬MKD ▬ALB ▬KOS ▬MNE ▬SRBSource: Authors’ calculations based on WDI and SEE Jobs Gateway database (wiiw and World Bank).
SEIZING A BRIGHTER FUTURE FOR ALL
145CHAPTER 5. PATHWAY II: DEVELOPING COMPETITIVE AND ADAPTIVE HUMAN CAPITAL AND CLOSING OPPORTUNITY GAPS
wage is higher than what would be a market-based wage for low-skilled jobs, which could be preventing creation of such jobs, especially considering the associated labor taxes. The fact that the government introduced a support program for employers to compensate for the minimum wage increase, confirms this concern.
5.3.1.2 Better Social Services Are Crucial to Enhance Inclusion While Supporting Working Women
251. Lack of access to affordable child and elder care prevents many women from taking jobs. The conflicting demands on women’s time generates a vicious circle of low attachment to the labor market and pre-eminence of the care provider role, which heightens vulnerability and gender-based inequalities. Low preschool enrollment means less time for parents, usually women, to work. About 41 percent of the women but just 1.3 percent of the men who are not in the labor force cite “personal and family obligations” as their primary reason for not looking for a job.187 There is unfilled demand for formal, affordable childcare services (although newer studies have qualified previous evidence, see Box 5.6). Eldercare is notable for a lack of day-based services and by residential care centers that are few and expensive. Social norms are another powerful deterrent of residential eldercare; most families would prefer daycare centers and home-based formats. As for quality, while childcare provision is perceived favorably, parents often decline to send their children because they consider them to be too young.188 For eldercare there are also infrastructure and safety issues.
187 World Bank (2013a), FYR Macedonia Gender Diagnostic: Gaps in Endowments, Access to Economic Opportunities and Agency.188 World Bank (2018a), FYR Macedonia Public Expenditure Review.
Box 5.6: Social Norms Affect Women’s Labor Market Participation in FYR Macedonia
Social norms have been found to deter women’s participation in the FYR Macedonia labor market. Mojsoska-Blazevski et al. (2017) collected information from a large representative sample of households to analyze the main reasons that women are inactive in the labor market. The authors used statistical methods to identify which variables best explain the decision to be active or inactive.
The most important factor, responsible for more than a third of the dispersion in the inactivity variable for women, consists mainly of household duties and traditional gender roles within the family and society—traditional social norms thus operate to bar women from the labor market. Other factors also found relevant were care for the elderly, poor health, discouragement (either lost hope of finding a job or lack of confidence about qualifying), and childcare. The data collected also point up the prevalence of traditional social norms and beliefs that women are not prepared for the demands of work life: A third of Macedonian women reported believing that their primary role is not work but to give birth and take care of the home and family; almost 40 percent think it is more difficult for women to be managers and politicians or in charge; and 40 percent think that working mothers cannot have as close a relationship with their children as nonworking mothers—views particularly prevalent among inactive women. LiTS 2015 data cited by the authors confirm the prevalence of traditional views throughout the Western Balkans. The share of respondents who
continued on next page
146 CHAPTER 5. PATHWAY II: DEVELOPING COMPETITIVE AND ADAPTIVE HUMAN CAPITAL AND CLOSING OPPORTUNITY GAPS
FYR MACEDONIA SYSTEMATIC COUNTRY DIAGNOSTIC
252. Active labor market policies (ALMPs) to bring people into the workforce have a mixed track record in FYR Macedonia. As Figure 5.31 shows, in 2015 despite high structural unemployment, ALMPs covered less than 10 percent of the population and less than 25 percent of the poor and had little impact on long-term labor market outcomes. For instance, a recent study evaluated a selection of ALMPs implemented by the Employment Service Agency of FYR Macedonia in 2008–12 (new programs since have not been evaluated).189 Among them were a program for self-employment (2008), internship programs (2010 and 2012), training for known employers (2010 and 2012), a wage subsidy program (2010), training in advanced IT skills (2010), and training for certain occupations (2010). Both internship programs were effective in terms of employment of program participants. The known-employer training program had large long-term gains in that participants were kept on the job after the obligation to do so expired. However, the program for self-employment (2008) had positive effects on subjective measures of participant well-being but not in their actual employment. Finally, training in deficient occupations, training in advanced IT skills, and wage subsidy programs had no significant effect on the probability of participants finding jobs.
253. Meanwhile, the social assistance focus has shifted from helping poor families to supporting families with children. At about 14 percent of GDP, FYR Macedonia’s total spending on social protection is high compared to other ECA countries. However, most of it goes to pensions (old age, disability, and survivor’s pension); direct social assistance is only 1.2 percent of GDP. This explains why social assistance programs reach fewer than 25 percent of poor households (Figure 5.32). Moreover, in recent years social assistance has shifted from targeting cash benefits to poor families to providing child-related benefits irrespective of family income. For instance, in the last 10 years coverage of SFA, which primarily supports poor families, has more than halved, from 67,000 households to 26,000, and spending on SFA was cut by two-thirds, from 0.6 percent of GDP in 2005 to 0.2 percent in 2016. Coverage and spending on the child allowance program also dropped as a new program was created to support growing families. The parental allowance, started in 2009, provides benefits to mothers who give birth to a third child
189 Mojsoska-Blazevski et al. (2015).
believe “it is better for everyone involved that man earns the money and the woman takes care of the home and children” is higher in the region than in EU countries and is even higher among the self-employed and the jobless.
The study also profiles a typical inactive woman in FYR Macedonia: She is over 50, of Albanian ethnicity, and usually married or in partnership; she has only primary education, the household is poor, and she lives in a large inner town. Three types of women are likely to be inactive: (1) those who do not search for a job mainly due to discouragement and low self-esteem; (2) those prevented from entering the labor market by household duties and child and elder care; and (3) those for whom the major barriers relate to culture and family relations. Thus, government policies to activate more women need to be diverse so that each group is approached appropriately. Policies for the third group are likely to prove most difficult and the slowest to show results but are vital to provide more equitable opportunities for all Macedonians.Source: Authors based on Mojsoska-Blazevski, Petreski, and Öztas (2017).
Box 5.6 continued from previous page
SEIZING A BRIGHTER FUTURE FOR ALL
147CHAPTER 5. PATHWAY II: DEVELOPING COMPETITIVE AND ADAPTIVE HUMAN CAPITAL AND CLOSING OPPORTUNITY GAPS
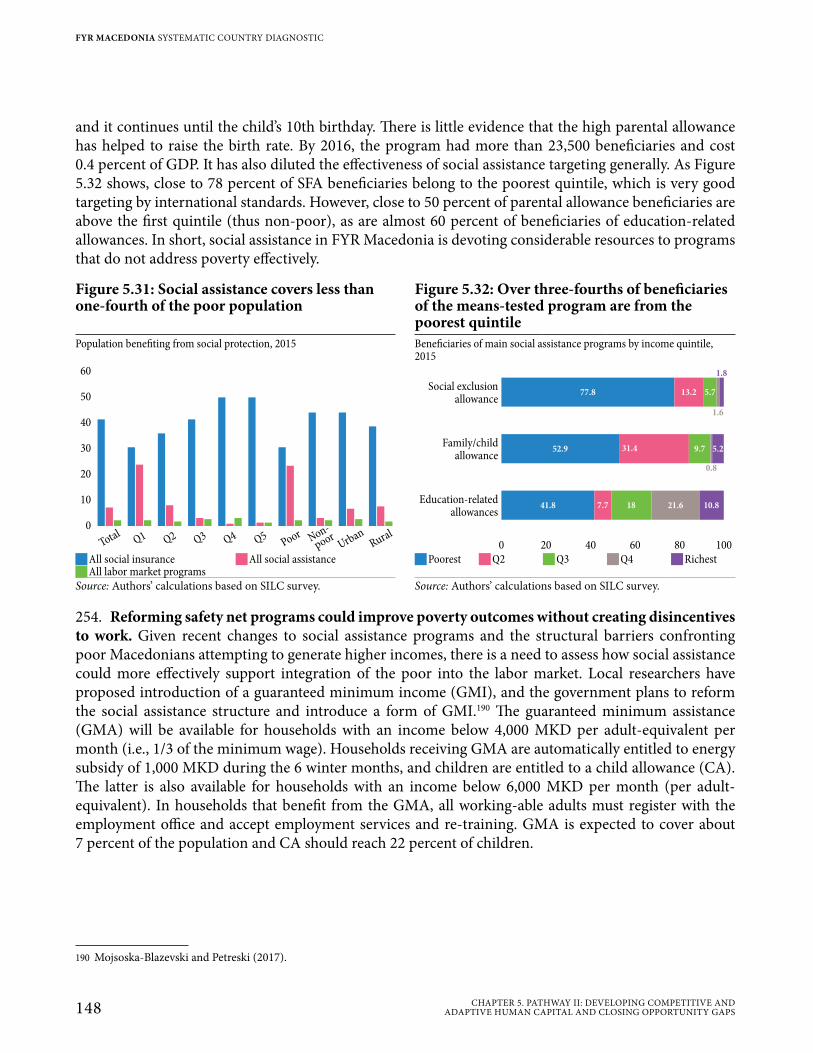
and it continues until the child’s 10th birthday. There is little evidence that the high parental allowance has helped to raise the birth rate. By 2016, the program had more than 23,500 beneficiaries and cost 0.4 percent of GDP. It has also diluted the effectiveness of social assistance targeting generally. As Figure 5.32 shows, close to 78 percent of SFA beneficiaries belong to the poorest quintile, which is very good targeting by international standards. However, close to 50 percent of parental allowance beneficiaries are above the first quintile (thus non-poor), as are almost 60 percent of beneficiaries of education-related allowances. In short, social assistance in FYR Macedonia is devoting considerable resources to programs that do not address poverty effectively.
254. Reforming safety net programs could improve poverty outcomes without creating disincentives to work. Given recent changes to social assistance programs and the structural barriers confronting poor Macedonians attempting to generate higher incomes, there is a need to assess how social assistance could more effectively support integration of the poor into the labor market. Local researchers have proposed introduction of a guaranteed minimum income (GMI), and the government plans to reform the social assistance structure and introduce a form of GMI.190 The guaranteed minimum assistance (GMA) will be available for households with an income below 4,000 MKD per adult-equivalent per month (i.e., 1/3 of the minimum wage). Households receiving GMA are automatically entitled to energy subsidy of 1,000 MKD during the 6 winter months, and children are entitled to a child allowance (CA). The latter is also available for households with an income below 6,000 MKD per month (per adult-equivalent). In households that benefit from the GMA, all working-able adults must register with the employment office and accept employment services and re-training. GMA is expected to cover about 7 percent of the population and CA should reach 22 percent of children.
190 Mojsoska-Blazevski and Petreski (2017).
Figure 5.31: Social assistance covers less than one-fourth of the poor population
Figure 5.32: Over three-fourths of beneficiaries of the means-tested program are from the poorest quintile
Population benefiting from social protection, 2015 Beneficiaries of main social assistance programs by income quintile, 2015
60
50
40
30
20
10
0
TotalQ1 Q2 Q3 Q4 Q5
Poor Non-
poorUrban
Rural
Social exclusionallowance
Family/childallowance
Education-relatedallowances
0 20 40 60 10080
77.8
52.9
41.8
13.2 5.7
1.6
1.8
31.4 9.7
0.8
5.2
7.7 18 21.6 10.8
JAll social insurance JAll social assistance JPoorest JQ2 JQ3 JQ4 JRichest JAll labor market programs
Source: Authors’ calculations based on SILC survey. Source: Authors’ calculations based on SILC survey.
148 CHAPTER 5. PATHWAY II: DEVELOPING COMPETITIVE AND ADAPTIVE HUMAN CAPITAL AND CLOSING OPPORTUNITY GAPS
FYR MACEDONIA SYSTEMATIC COUNTRY DIAGNOSTIC
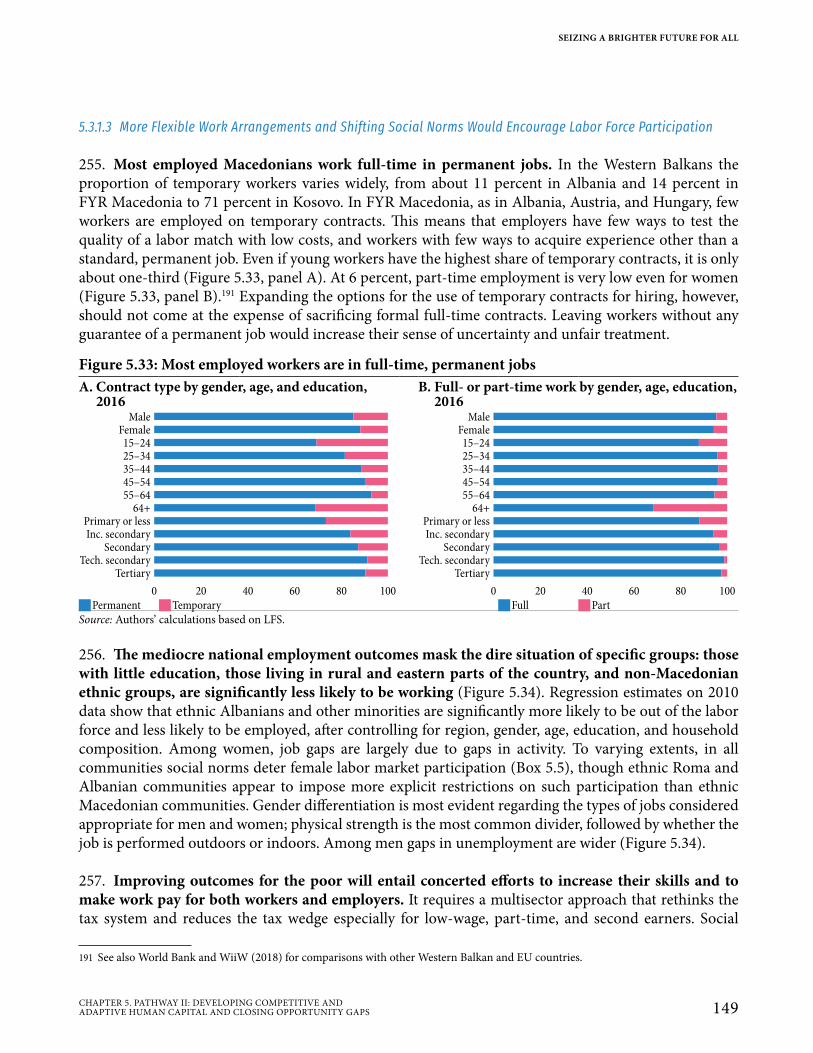
5.3.1.3 More Flexible Work Arrangements and Shifting Social Norms Would Encourage Labor Force Participation
255. Most employed Macedonians work full-time in permanent jobs. In the Western Balkans the proportion of temporary workers varies widely, from about 11 percent in Albania and 14 percent in FYR Macedonia to 71 percent in Kosovo. In FYR Macedonia, as in Albania, Austria, and Hungary, few workers are employed on temporary contracts. This means that employers have few ways to test the quality of a labor match with low costs, and workers with few ways to acquire experience other than a standard, permanent job. Even if young workers have the highest share of temporary contracts, it is only about one-third (Figure 5.33, panel A). At 6 percent, part-time employment is very low even for women (Figure 5.33, panel B).191 Expanding the options for the use of temporary contracts for hiring, however, should not come at the expense of sacrificing formal full-time contracts. Leaving workers without any guarantee of a permanent job would increase their sense of uncertainty and unfair treatment.
256. The mediocre national employment outcomes mask the dire situation of specific groups: those with little education, those living in rural and eastern parts of the country, and non-Macedonian ethnic groups, are significantly less likely to be working (Figure 5.34). Regression estimates on 2010 data show that ethnic Albanians and other minorities are significantly more likely to be out of the labor force and less likely to be employed, after controlling for region, gender, age, education, and household composition. Among women, job gaps are largely due to gaps in activity. To varying extents, in all communities social norms deter female labor market participation (Box 5.5), though ethnic Roma and Albanian communities appear to impose more explicit restrictions on such participation than ethnic Macedonian communities. Gender differentiation is most evident regarding the types of jobs considered appropriate for men and women; physical strength is the most common divider, followed by whether the job is performed outdoors or indoors. Among men gaps in unemployment are wider (Figure 5.34).
257. Improving outcomes for the poor will entail concerted efforts to increase their skills and to make work pay for both workers and employers. It requires a multisector approach that rethinks the tax system and reduces the tax wedge especially for low-wage, part-time, and second earners. Social
191 See also World Bank and WiiW (2018) for comparisons with other Western Balkan and EU countries.
Figure 5.33: Most employed workers are in full-time, permanent jobsA. Contract type by gender, age, and education,
2016B. Full- or part-time work by gender, age, education,
2016Male
Female15–2425–3435–4445–5455–64
64+Primary or lessInc. secondary
SecondaryTech. secondary
Tertiary
0 20 40 60 10080
MaleFemale15–2425–3435–4445–5455–64
64+Primary or lessInc. secondary
SecondaryTech. secondary
Tertiary
0 20 40 60 10080
JPermanent JTemporary JFull JPartSource: Authors’ calculations based on LFS.
SEIZING A BRIGHTER FUTURE FOR ALL
149CHAPTER 5. PATHWAY II: DEVELOPING COMPETITIVE AND ADAPTIVE HUMAN CAPITAL AND CLOSING OPPORTUNITY GAPS
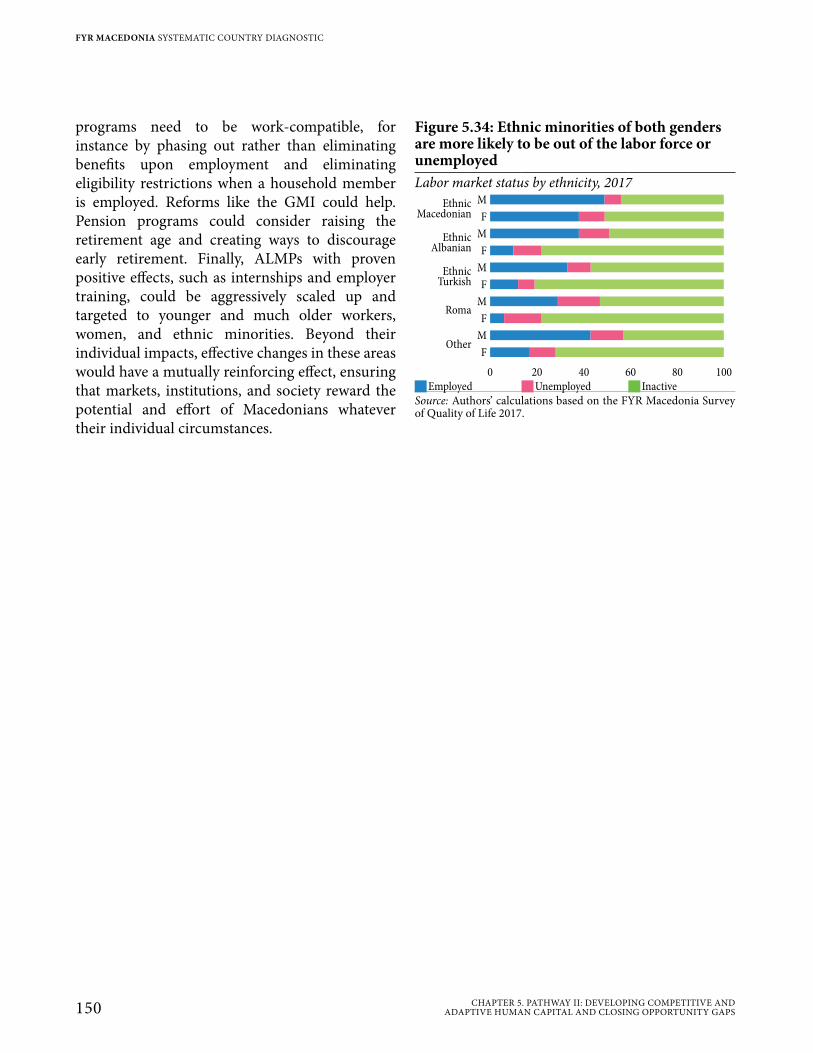
programs need to be work-compatible, for instance by phasing out rather than eliminating benefits upon employment and eliminating eligibility restrictions when a household member is employed. Reforms like the GMI could help. Pension programs could consider raising the retirement age and creating ways to discourage early retirement. Finally, ALMPs with proven positive effects, such as internships and employer training, could be aggressively scaled up and targeted to younger and much older workers, women, and ethnic minorities. Beyond their individual impacts, effective changes in these areas would have a mutually reinforcing effect, ensuring that markets, institutions, and society reward the potential and effort of Macedonians whatever their individual circumstances.
Figure 5.34: Ethnic minorities of both genders are more likely to be out of the labor force or unemployedLabor market status by ethnicity, 2017
EthnicMacedonian
EthnicAlbanian
EthnicTurkish
Roma
Other
M
0 20 40 60 10080
F
M
F
M
F
M
F
M
F
JEmployed JUnemployed J InactiveSource: Authors’ calculations based on the FYR Macedonia Survey of Quality of Life 2017.
FYR Macedonia Systematic Country Diagnostic | Seizing a Brighter Future for All
150 CHAPTER 5. PATHWAY II: DEVELOPING COMPETITIVE AND ADAPTIVE HUMAN CAPITAL AND CLOSING OPPORTUNITY GAPS
FYR MACEDONIA SYSTEMATIC COUNTRY DIAGNOSTIC

FYR Macedonia Systematic Country Diagnostic | Seizing a Brighter Future for All
Vladimir SimeonovPeacock from Stobi II
Jaklina was a girl back in 1994, but she has a vivid memory of how the quality of the air changed when the landfill opened only 2 km away from her town. During the day life went on as usual, but at night the smell became unbearable and people stayed indoors with the windows closed. In winter, the air was even more polluted from all the wood burning, the road traffic, and emissions from industry. Then the taste of the water changed, too. Jaklina has seen the news that people in Skopje and other cities are suffering more and more from respiratory diseases and even cancer. In 2013, the authorities announced that the landfill would be completely revamped to meet environmental standards, and the residents were filled with hope. But the contract to manage the landfill was awarded to a company that did not meet the basic technical criteria and had been established just days before the deadline for the tender bid. Everybody suspected corruption. Today, the landfill is managed just a little better than before, but the quality of the air and water are still poor. Jaklina finds it hard to keep hoping that by the time she has her own children, the air will be breathable, the water drinkable, and taxpayers will know how their money is being spent.
Chapter 6. Pathway III: Achieving Sustainability through Effective Governance, Fiscal Prudence, Enhanced Environmental Management and Resilience to Natural Hazards
Chapter 6. Pathway III: Achieving Sustainability through Effective Governance, Fiscal Prudence, Enhanced Environmental Management and Resilience to Natural Hazards
Reinforcing social, economic, and environmental resilience is critical to preserve development gains in FYR Macedonia. Effective state institutions that ensure that the rule of law is respected by all and that serves all equally, and a qualified bureaucracy that operates in a transparent manner, is necessary to build social trust, while improving the business environment and the delivery of public services. Sustaining inclusive growth also requires avoiding creating imbalances that might trigger a crisis and be prepared to deal with negative shocks. Due to recent countercyclical fiscal actions and structural issues related to its demographic composition, FYR Macedonia’s public debt is rising fast. To address the situation, it is necessary to tackle fiscal risks in pensions, municipal finances, and state-owned enterprises, and improve the efficiency of public spending and revenue mobilization. Management of natural resources also needs attention; currently environmental risks such as pollution are having side effects that affect the population negatively. Agricultural practices are also in need of reform to guarantee sustainable use of resources used for production. And measures to prepare the country to address the potential for earthquakes, floods, and other natural hazards to which it is prone must be accelerated.
6.1 Better-Quality Institutions for Faster, Sustainable, and More Broad-Based Growth
258. Making the state more effective and building social trust is a long, painstaking process. Three factors affect it: (1) the quality of the administration of the state (government capacity), which is best shaped by structures founded on merit, coordination, and rules-based authority; (2) credible rules to guide relationships between private individuals, businesses, and the state (rules and market institutions), to facilitate resource allocation that gives correct price signals and partnerships between the private and public sectors, complemented by fiscal and monetary policy prudence; and (3) systems to hold government agents accountable for their actions (accountability), especially to citizens (Figure 6.2).192
192 Rules may be both formal (de jure) and informal (de facto). Capacity refers to the ability of both state and nonstate actors to operate and honor the rules in, e.g., delivering services and protecting rights and entitlements. Accountability refers to the mechanisms that shape incentives and constrain the use of delegated power, including sanctions or other consequences if rules are not applied due to a lack of commitment, coordination, and cooperation—the three drivers of effectiveness in the World Bank's 2017 World Development Report Governance and the Law.
Figure 6.1: Themes for Pathway III
Quality of public institutions
Public debt sustainability
Fiscal risks (pensions, municipal finances,SOEs)
Efficiency of spending and revenuemobilization
Air pollution and energy sustainability
Resilience to disaster and climate risks,and natural resource management
152 CHAPTER 6. PATHWAY III: ACHIEVING SUSTAINABILITY THROUGH EFFECTIVE GOVERNANCE, FISCAL PRUDENCE, ENHANCED ENVIRONMENTAL MANAGEMENT AND RESILIENCE TO NATURAL HAZARDS
FYR MACEDONIA SYSTEMATIC COUNTRY DIAGNOSTIC
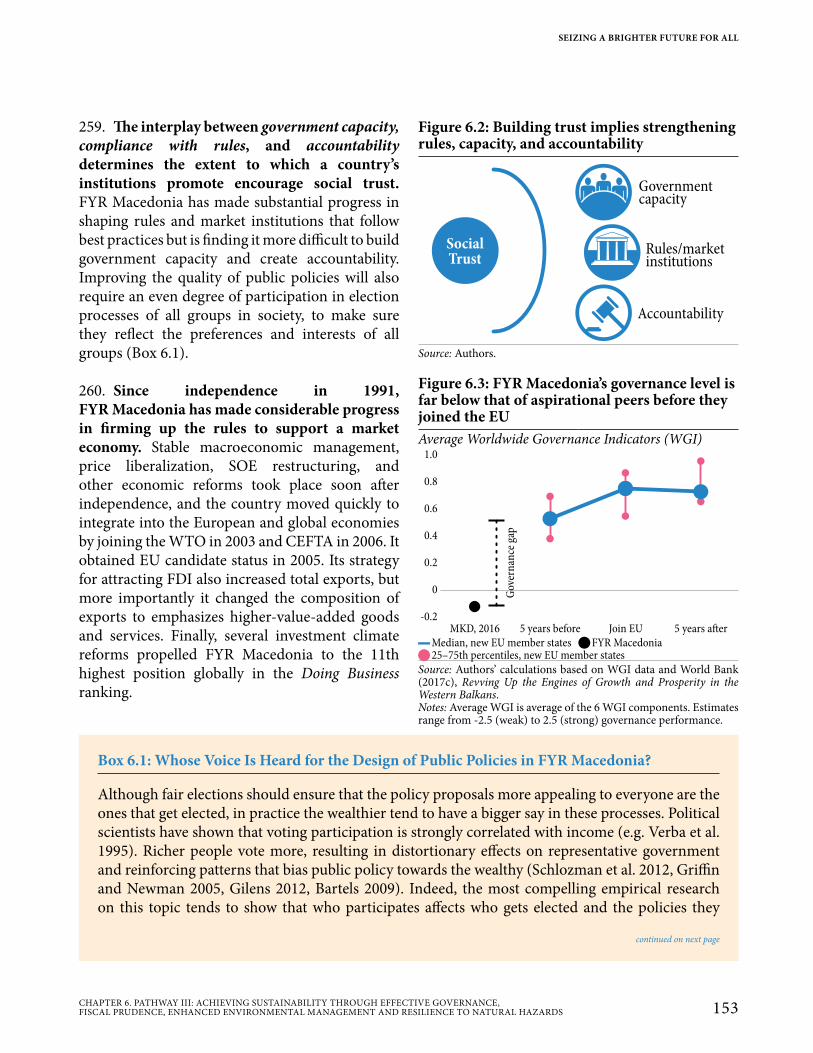
259. The interplay between government capacity, compliance with rules, and accountability determines the extent to which a country’s institutions promote encourage social trust. FYR Macedonia has made substantial progress in shaping rules and market institutions that follow best practices but is finding it more difficult to build government capacity and create accountability. Improving the quality of public policies will also require an even degree of participation in election processes of all groups in society, to make sure they reflect the preferences and interests of all groups (Box 6.1).
260. Since independence in 1991, FYR Macedonia has made considerable progress in firming up the rules to support a market economy. Stable macroeconomic management, price liberalization, SOE restructuring, and other economic reforms took place soon after independence, and the country moved quickly to integrate into the European and global economies by joining the WTO in 2003 and CEFTA in 2006. It obtained EU candidate status in 2005. Its strategy for attracting FDI also increased total exports, but more importantly it changed the composition of exports to emphasizes higher-value-added goods and services. Finally, several investment climate reforms propelled FYR Macedonia to the 11th highest position globally in the Doing Business ranking.
Figure 6.2: Building trust implies strengthening rules, capacity, and accountability
SocialTrust
Governmentcapacity
Rules/marketinstitutions
Accountability
Source: Authors.
Figure 6.3: FYR Macedonia’s governance level is far below that of aspirational peers before they joined the EUAverage Worldwide Governance Indicators (WGI)
1.0
0.8
0.6
0.4
0.2
-0.2
0
5 years beforeMKD, 2016 Join EU 5 years a�er
Go
vern
an
ce g
ap
▬Median, new EU member states QFYR Macedonia Q25–75th percentiles, new EU member states
Source: Authors’ calculations based on WGI data and World Bank (2017c), Revving Up the Engines of Growth and Prosperity in the Western Balkans.Notes: Average WGI is average of the 6 WGI components. Estimates range from -2.5 (weak) to 2.5 (strong) governance performance.
Box 6.1: Whose Voice Is Heard for the Design of Public Policies in FYR Macedonia?
Although fair elections should ensure that the policy proposals more appealing to everyone are the ones that get elected, in practice the wealthier tend to have a bigger say in these processes. Political scientists have shown that voting participation is strongly correlated with income (e.g. Verba et al. 1995). Richer people vote more, resulting in distortionary effects on representative government and reinforcing patterns that bias public policy towards the wealthy (Schlozman et al. 2012, Griffin and Newman 2005, Gilens 2012, Bartels 2009). Indeed, the most compelling empirical research on this topic tends to show that who participates affects who gets elected and the policies they
continued on next page
SEIZING A BRIGHTER FUTURE FOR ALL
153CHAPTER 6. PATHWAY III: ACHIEVING SUSTAINABILITY THROUGH EFFECTIVE GOVERNANCE, FISCAL PRUDENCE, ENHANCED ENVIRONMENTAL MANAGEMENT AND RESILIENCE TO NATURAL HAZARDS
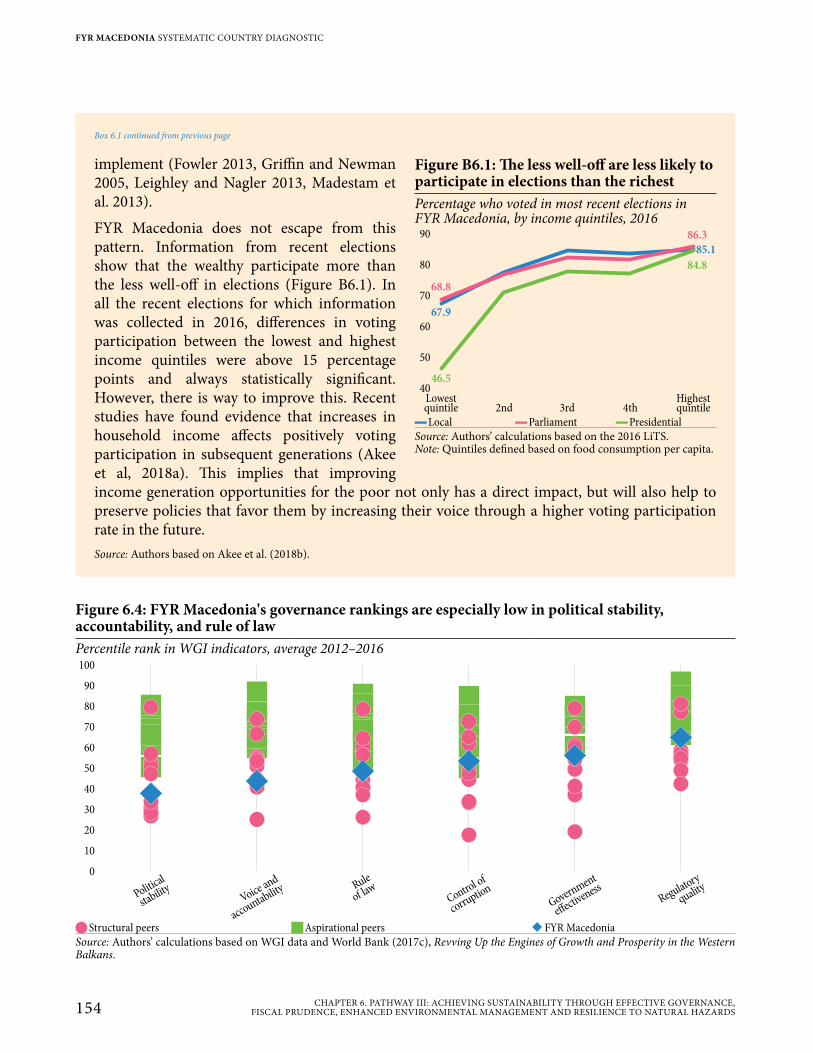
Figure 6.4: FYR Macedonia's governance rankings are especially low in political stability, accountability, and rule of lawPercentile rank in WGI indicators, average 2012–2016100
90
80
70
60
50
40
30
20
10
0
Political
stability Voice and
accountabilityRule
of law
Control of
corruption
Government
effectivenessRegulatory
quality
QStructural peers JAspirational peers �FYR MacedoniaSource: Authors’ calculations based on WGI data and World Bank (2017c), Revving Up the Engines of Growth and Prosperity in the Western Balkans.
implement (Fowler 2013, Griffin and Newman 2005, Leighley and Nagler 2013, Madestam et al. 2013).
FYR Macedonia does not escape from this pattern. Information from recent elections show that the wealthy participate more than the less well-off in elections (Figure B6.1). In all the recent elections for which information was collected in 2016, differences in voting participation between the lowest and highest income quintiles were above 15 percentage points and always statistically significant. However, there is way to improve this. Recent studies have found evidence that increases in household income affects positively voting participation in subsequent generations (Akee et al, 2018a). This implies that improving income generation opportunities for the poor not only has a direct impact, but will also help to preserve policies that favor them by increasing their voice through a higher voting participation rate in the future.Source: Authors based on Akee et al. (2018b).
Figure B6.1: The less well-off are less likely to participate in elections than the richestPercentage who voted in most recent elections in FYR Macedonia, by income quintiles, 2016
90
80
70
60
50
40Lowestquintile 2nd 3rd 4th
Highestquintile
68.8
67.9
46.5
86.3
85.1
84.8
▬Local ▬Parliament ▬PresidentialSource: Authors’ calculations based on the 2016 LiTS.Note: Quintiles defined based on food consumption per capita.
Box 6.1 continued from previous page
154 CHAPTER 6. PATHWAY III: ACHIEVING SUSTAINABILITY THROUGH EFFECTIVE GOVERNANCE, FISCAL PRUDENCE, ENHANCED ENVIRONMENTAL MANAGEMENT AND RESILIENCE TO NATURAL HAZARDS
FYR MACEDONIA SYSTEMATIC COUNTRY DIAGNOSTIC
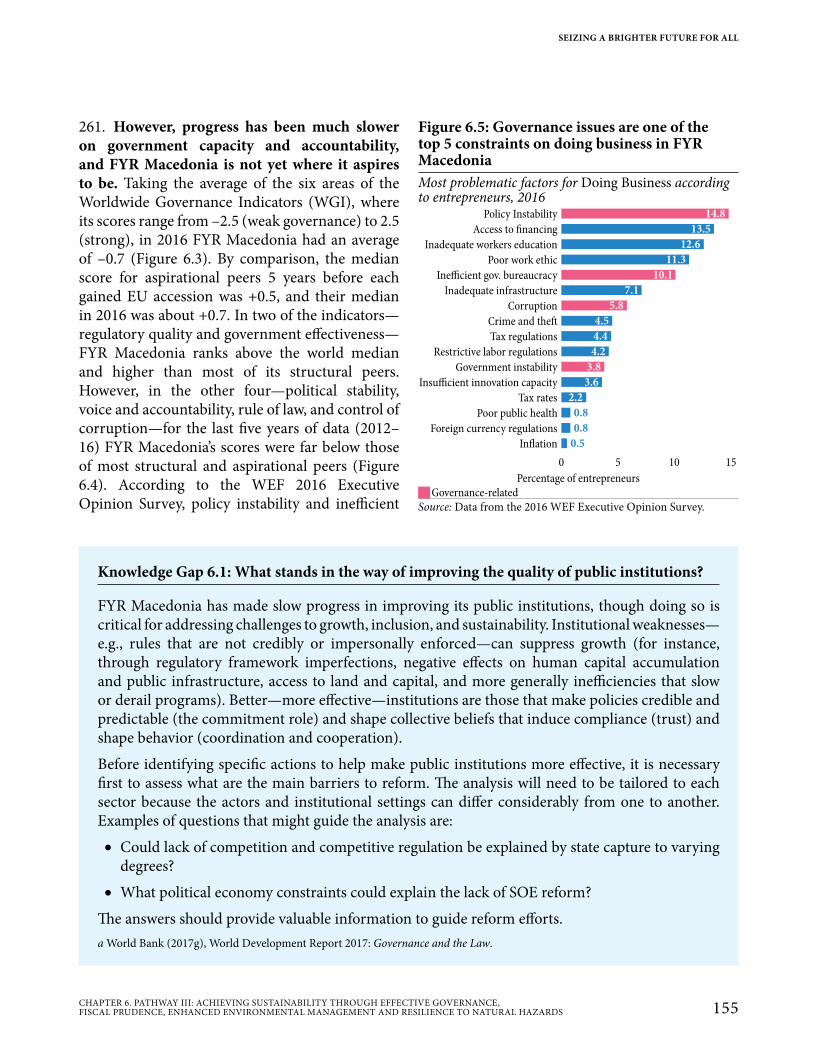
261. However, progress has been much slower on government capacity and accountability, and FYR Macedonia is not yet where it aspires to be. Taking the average of the six areas of the Worldwide Governance Indicators (WGI), where its scores range from –2.5 (weak governance) to 2.5 (strong), in 2016 FYR Macedonia had an average of –0.7 (Figure 6.3). By comparison, the median score for aspirational peers 5 years before each gained EU accession was +0.5, and their median in 2016 was about +0.7. In two of the indicators—regulatory quality and government effectiveness—FYR Macedonia ranks above the world median and higher than most of its structural peers. However, in the other four—political stability, voice and accountability, rule of law, and control of corruption—for the last five years of data (2012–16) FYR Macedonia’s scores were far below those of most structural and aspirational peers (Figure 6.4). According to the WEF 2016 Executive Opinion Survey, policy instability and inefficient
Figure 6.5: Governance issues are one of the top 5 constraints on doing business in FYR MacedoniaMost problematic factors for Doing Business according to entrepreneurs, 2016
Inflation
Foreign currency regulations
Poor public health
Tax rates
Insufficient innovation capacity
Government instability
Restrictive labor regulations
Tax regulations
Crime and the�
Corruption
Inadequate infrastructure
Inefficient gov. bureaucracy
Poor work ethic
Inadequate workers education
Access to financing
Policy Instability
0 5 10 15
14.8
13.5
12.6
11.3
10.1
7.1
5.8
4.5
4.4
4.2
3.8
3.6
2.2
0.8
0.8
0.5
Percentage of entrepreneurs JGovernance-related
Source: Data from the 2016 WEF Executive Opinion Survey.
Knowledge Gap 6.1: What stands in the way of improving the quality of public institutions?
FYR Macedonia has made slow progress in improving its public institutions, though doing so is critical for addressing challenges to growth, inclusion, and sustainability. Institutional weaknesses—e.g., rules that are not credibly or impersonally enforced—can suppress growth (for instance, through regulatory framework imperfections, negative effects on human capital accumulation and public infrastructure, access to land and capital, and more generally inefficiencies that slow or derail programs). Better—more effective—institutions are those that make policies credible and predictable (the commitment role) and shape collective beliefs that induce compliance (trust) and shape behavior (coordination and cooperation).
Before identifying specific actions to help make public institutions more effective, it is necessary first to assess what are the main barriers to reform. The analysis will need to be tailored to each sector because the actors and institutional settings can differ considerably from one to another. Examples of questions that might guide the analysis are:
• Could lack of competition and competitive regulation be explained by state capture to varying degrees?
• What political economy constraints could explain the lack of SOE reform?
The answers should provide valuable information to guide reform efforts. a World Bank (2017g), World Development Report 2017: Governance and the Law.
SEIZING A BRIGHTER FUTURE FOR ALL
155CHAPTER 6. PATHWAY III: ACHIEVING SUSTAINABILITY THROUGH EFFECTIVE GOVERNANCE, FISCAL PRUDENCE, ENHANCED ENVIRONMENTAL MANAGEMENT AND RESILIENCE TO NATURAL HAZARDS
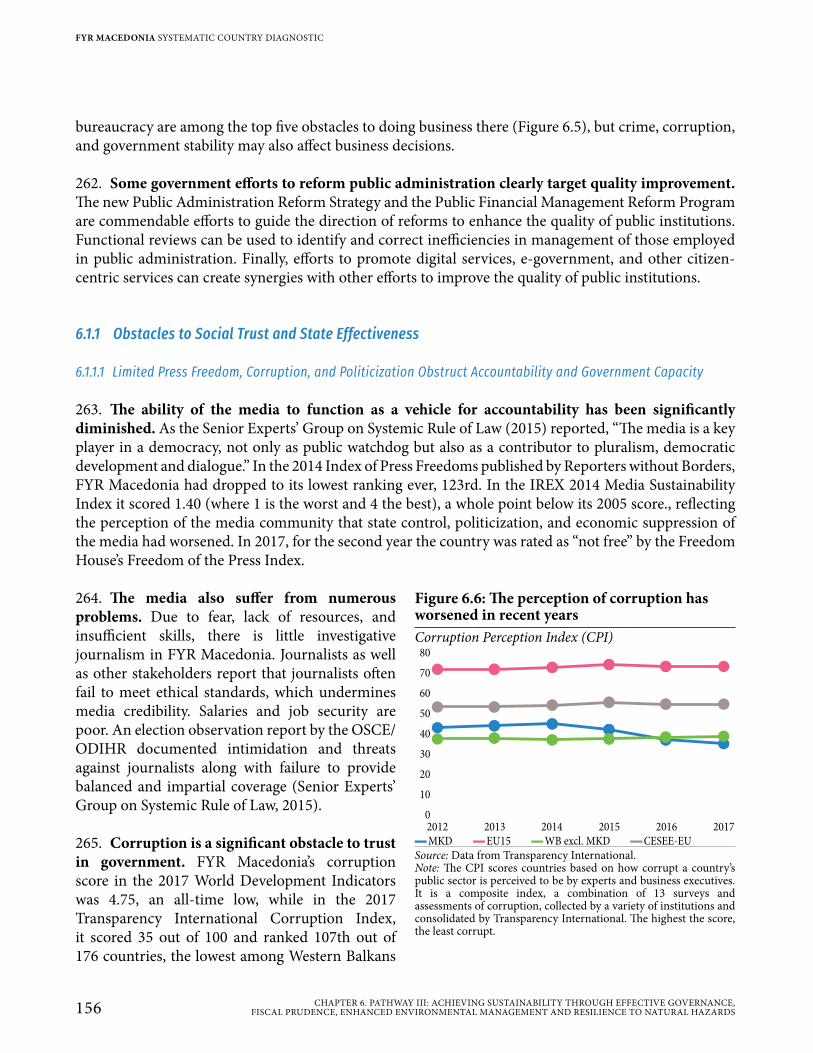
bureaucracy are among the top five obstacles to doing business there (Figure 6.5), but crime, corruption, and government stability may also affect business decisions.
262. Some government efforts to reform public administration clearly target quality improvement. The new Public Administration Reform Strategy and the Public Financial Management Reform Program are commendable efforts to guide the direction of reforms to enhance the quality of public institutions. Functional reviews can be used to identify and correct inefficiencies in management of those employed in public administration. Finally, efforts to promote digital services, e-government, and other citizen-centric services can create synergies with other efforts to improve the quality of public institutions.
6.1.1 Obstacles to Social Trust and State Effectiveness
6.1.1.1 Limited Press Freedom, Corruption, and Politicization Obstruct Accountability and Government Capacity
263. The ability of the media to function as a vehicle for accountability has been significantly diminished. As the Senior Experts’ Group on Systemic Rule of Law (2015) reported, “The media is a key player in a democracy, not only as public watchdog but also as a contributor to pluralism, democratic development and dialogue.” In the 2014 Index of Press Freedoms published by Reporters without Borders, FYR Macedonia had dropped to its lowest ranking ever, 123rd. In the IREx 2014 Media Sustainability Index it scored 1.40 (where 1 is the worst and 4 the best), a whole point below its 2005 score., reflecting the perception of the media community that state control, politicization, and economic suppression of the media had worsened. In 2017, for the second year the country was rated as “not free” by the Freedom House’s Freedom of the Press Index.
264. The media also suffer from numerous problems. Due to fear, lack of resources, and insufficient skills, there is little investigative journalism in FYR Macedonia. Journalists as well as other stakeholders report that journalists often fail to meet ethical standards, which undermines media credibility. Salaries and job security are poor. An election observation report by the OSCE/ODIHR documented intimidation and threats against journalists along with failure to provide balanced and impartial coverage (Senior Experts’ Group on Systemic Rule of Law, 2015).
265. Corruption is a significant obstacle to trust in government. FYR Macedonia’s corruption score in the 2017 World Development Indicators was 4.75, an all-time low, while in the 2017 Transparency International Corruption Index, it scored 35 out of 100 and ranked 107th out of 176 countries, the lowest among Western Balkans
Figure 6.6: The perception of corruption has worsened in recent yearsCorruption Perception Index (CPI)
80
70
60
50
40
30
20
10
0
2012 2013 2014 2015 2016 2017
▬MKD ▬EU15 ▬WB excl. MKD ▬CESEE-EUSource: Data from Transparency International.Note: The CPI scores countries based on how corrupt a country’s public sector is perceived to be by experts and business executives. It is a composite index, a combination of 13 surveys and assessments of corruption, collected by a variety of institutions and consolidated by Transparency International. The highest the score, the least corrupt.
156 CHAPTER 6. PATHWAY III: ACHIEVING SUSTAINABILITY THROUGH EFFECTIVE GOVERNANCE, FISCAL PRUDENCE, ENHANCED ENVIRONMENTAL MANAGEMENT AND RESILIENCE TO NATURAL HAZARDS
FYR MACEDONIA SYSTEMATIC COUNTRY DIAGNOSTIC
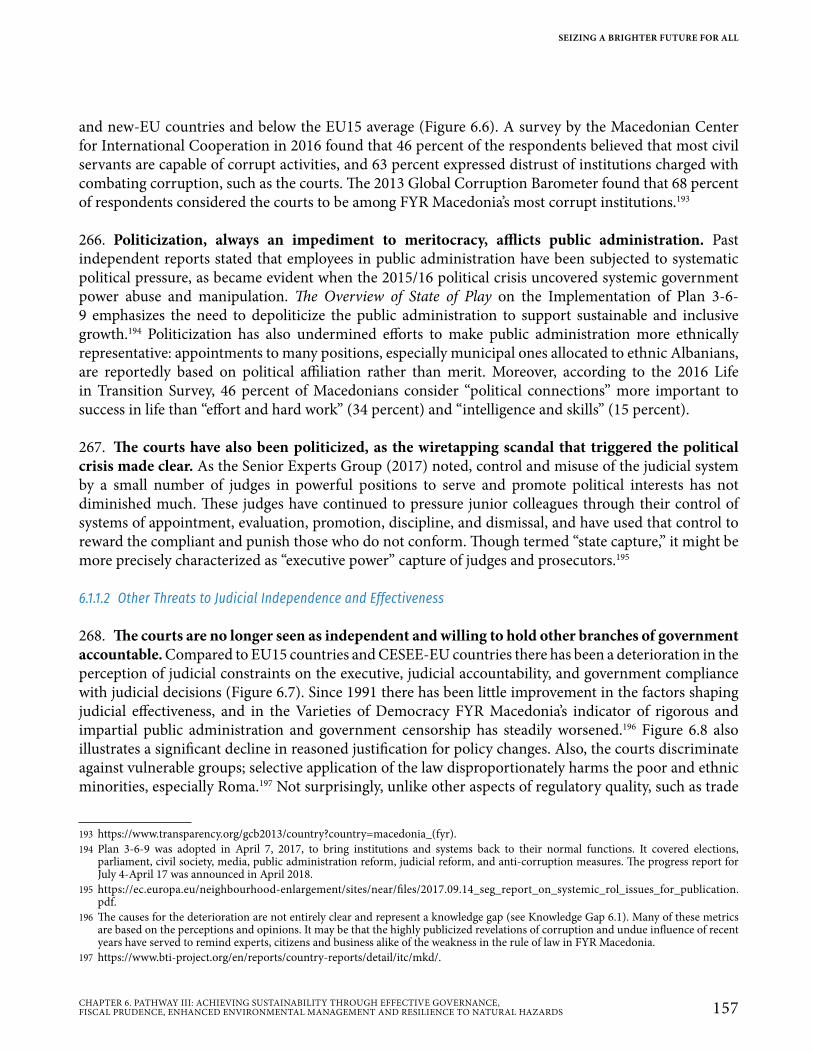
and new-EU countries and below the EU15 average (Figure 6.6). A survey by the Macedonian Center for International Cooperation in 2016 found that 46 percent of the respondents believed that most civil servants are capable of corrupt activities, and 63 percent expressed distrust of institutions charged with combating corruption, such as the courts. The 2013 Global Corruption Barometer found that 68 percent of respondents considered the courts to be among FYR Macedonia’s most corrupt institutions.193
266. Politicization, always an impediment to meritocracy, afflicts public administration. Past independent reports stated that employees in public administration have been subjected to systematic political pressure, as became evident when the 2015/16 political crisis uncovered systemic government power abuse and manipulation. The Overview of State of Play on the Implementation of Plan 3-6-9 emphasizes the need to depoliticize the public administration to support sustainable and inclusive growth.194 Politicization has also undermined efforts to make public administration more ethnically representative: appointments to many positions, especially municipal ones allocated to ethnic Albanians, are reportedly based on political affiliation rather than merit. Moreover, according to the 2016 Life in Transition Survey, 46 percent of Macedonians consider “political connections” more important to success in life than “effort and hard work” (34 percent) and “intelligence and skills” (15 percent).
267. The courts have also been politicized, as the wiretapping scandal that triggered the political crisis made clear. As the Senior Experts Group (2017) noted, control and misuse of the judicial system by a small number of judges in powerful positions to serve and promote political interests has not diminished much. These judges have continued to pressure junior colleagues through their control of systems of appointment, evaluation, promotion, discipline, and dismissal, and have used that control to reward the compliant and punish those who do not conform. Though termed “state capture,” it might be more precisely characterized as “executive power” capture of judges and prosecutors.195
6.1.1.2 Other Threats to Judicial Independence and Effectiveness
268. The courts are no longer seen as independent and willing to hold other branches of government accountable. Compared to EU15 countries and CESEE-EU countries there has been a deterioration in the perception of judicial constraints on the executive, judicial accountability, and government compliance with judicial decisions (Figure 6.7). Since 1991 there has been little improvement in the factors shaping judicial effectiveness, and in the Varieties of Democracy FYR Macedonia’s indicator of rigorous and impartial public administration and government censorship has steadily worsened.196 Figure 6.8 also illustrates a significant decline in reasoned justification for policy changes. Also, the courts discriminate against vulnerable groups; selective application of the law disproportionately harms the poor and ethnic minorities, especially Roma.197 Not surprisingly, unlike other aspects of regulatory quality, such as trade
193 https://www.transparency.org/gcb2013/country?country=macedonia_(fyr).194 Plan 3-6-9 was adopted in April 7, 2017, to bring institutions and systems back to their normal functions. It covered elections,
parliament, civil society, media, public administration reform, judicial reform, and anti-corruption measures. The progress report for July 4-April 17 was announced in April 2018.
195 https://ec.europa.eu/neighbourhood-enlargement/sites/near/files/2017.09.14_seg_report_on_systemic_rol_issues_for_publication.pdf.
196 The causes for the deterioration are not entirely clear and represent a knowledge gap (see Knowledge Gap 6.1). Many of these metrics are based on the perceptions and opinions. It may be that the highly publicized revelations of corruption and undue influence of recent years have served to remind experts, citizens and business alike of the weakness in the rule of law in FYR Macedonia.
197 https://www.bti-project.org/en/reports/country-reports/detail/itc/mkd/.
SEIZING A BRIGHTER FUTURE FOR ALL
157CHAPTER 6. PATHWAY III: ACHIEVING SUSTAINABILITY THROUGH EFFECTIVE GOVERNANCE, FISCAL PRUDENCE, ENHANCED ENVIRONMENTAL MANAGEMENT AND RESILIENCE TO NATURAL HAZARDS
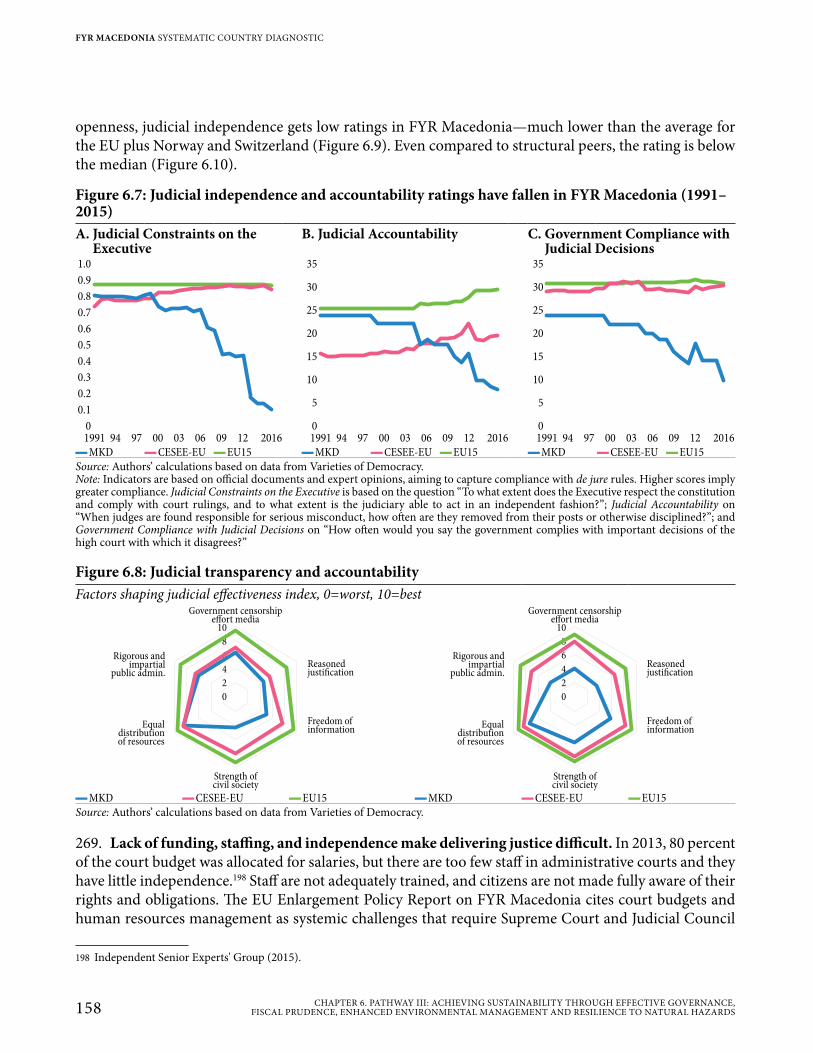
openness, judicial independence gets low ratings in FYR Macedonia—much lower than the average for the EU plus Norway and Switzerland (Figure 6.9). Even compared to structural peers, the rating is below the median (Figure 6.10).
269. Lack of funding, staffing, and independence make delivering justice difficult. In 2013, 80 percent of the court budget was allocated for salaries, but there are too few staff in administrative courts and they have little independence.198 Staff are not adequately trained, and citizens are not made fully aware of their rights and obligations. The EU Enlargement Policy Report on FYR Macedonia cites court budgets and human resources management as systemic challenges that require Supreme Court and Judicial Council
198 Independent Senior Experts' Group (2015).
Figure 6.7: Judicial independence and accountability ratings have fallen in FYR Macedonia (1991–2015)A. Judicial Constraints on the
ExecutiveB. Judicial Accountability C. Government Compliance with
Judicial Decisions
1991 201694 97 00 03 06 09 12
1.0
0.9
0.8
0.7
0.6
0.5
0.4
0.3
0.2
0.1
0
1991 201694 97 00 03 06 09 12
35
30
25
20
15
10
5
0
1991 201694 97 00 03 06 09 12
35
30
25
20
15
10
5
0
▬MKD ▬CESEE-EU ▬EU15 ▬MKD ▬CESEE-EU ▬EU15 ▬MKD ▬CESEE-EU ▬EU15Source: Authors’ calculations based on data from Varieties of Democracy.Note: Indicators are based on official documents and expert opinions, aiming to capture compliance with de jure rules. Higher scores imply greater compliance. Judicial Constraints on the Executive is based on the question “To what extent does the Executive respect the constitution and comply with court rulings, and to what extent is the judiciary able to act in an independent fashion?”; Judicial Accountability on “When judges are found responsible for serious misconduct, how often are they removed from their posts or otherwise disciplined?”; and Government Compliance with Judicial Decisions on “How often would you say the government complies with important decisions of the high court with which it disagrees?”
Figure 6.8: Judicial transparency and accountabilityFactors shaping judicial effectiveness index, 0=worst, 10=best
10
8
6
4
2
0
Government censorshipeffort media
Strength ofcivil society
Reasonedjustification
Freedom ofinformation
Equaldistributionof resources
Rigorous andimpartial
public admin.
Government censorshipeffort media
Reasonedjustification
Freedom ofinformation
Strength ofcivil society
Equaldistributionof resources
Rigorous andimpartial
public admin.
8
6
4
2
0
10
▬MKD ▬CESEE-EU ▬EU15 ▬MKD ▬CESEE-EU ▬EU15Source: Authors’ calculations based on data from Varieties of Democracy.
158 CHAPTER 6. PATHWAY III: ACHIEVING SUSTAINABILITY THROUGH EFFECTIVE GOVERNANCE, FISCAL PRUDENCE, ENHANCED ENVIRONMENTAL MANAGEMENT AND RESILIENCE TO NATURAL HAZARDS
FYR MACEDONIA SYSTEMATIC COUNTRY DIAGNOSTIC
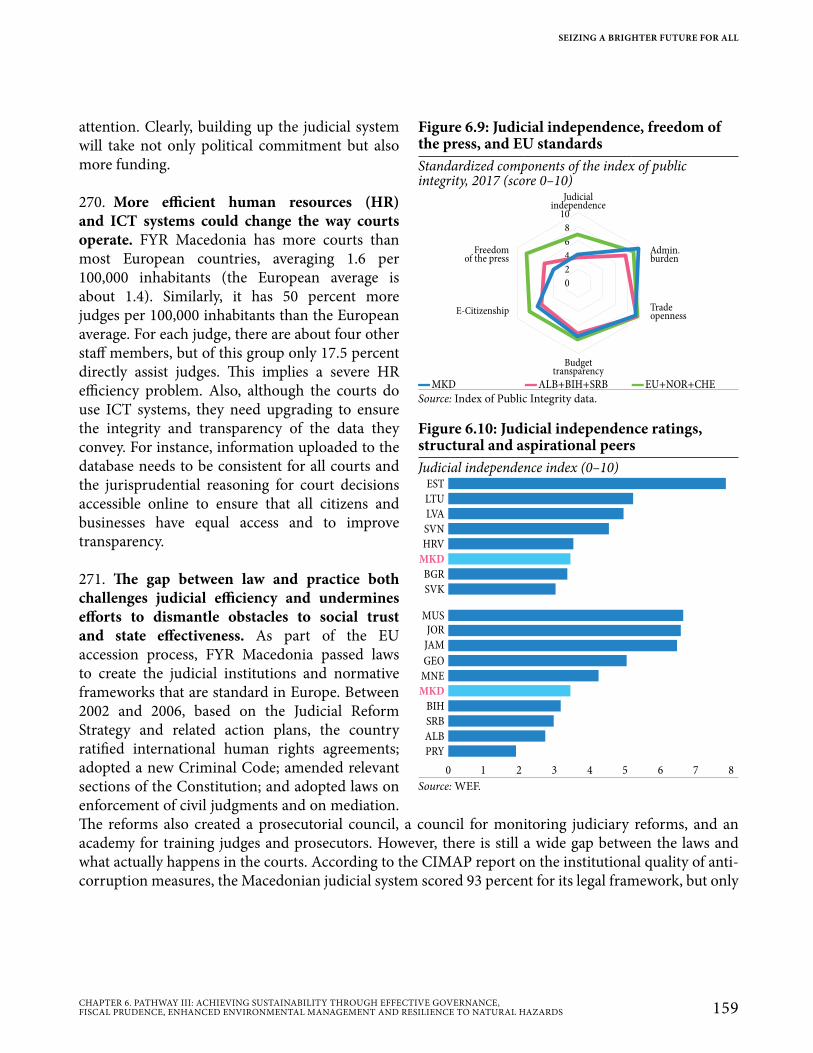
attention. Clearly, building up the judicial system will take not only political commitment but also more funding.
270. More efficient human resources (HR) and ICT systems could change the way courts operate. FYR Macedonia has more courts than most European countries, averaging 1.6 per 100,000 inhabitants (the European average is about 1.4). Similarly, it has 50 percent more judges per 100,000 inhabitants than the European average. For each judge, there are about four other staff members, but of this group only 17.5 percent directly assist judges. This implies a severe HR efficiency problem. Also, although the courts do use ICT systems, they need upgrading to ensure the integrity and transparency of the data they convey. For instance, information uploaded to the database needs to be consistent for all courts and the jurisprudential reasoning for court decisions accessible online to ensure that all citizens and businesses have equal access and to improve transparency.
271. The gap between law and practice both challenges judicial efficiency and undermines efforts to dismantle obstacles to social trust and state effectiveness. As part of the EU accession process, FYR Macedonia passed laws to create the judicial institutions and normative frameworks that are standard in Europe. Between 2002 and 2006, based on the Judicial Reform Strategy and related action plans, the country ratified international human rights agreements; adopted a new Criminal Code; amended relevant sections of the Constitution; and adopted laws on enforcement of civil judgments and on mediation. The reforms also created a prosecutorial council, a council for monitoring judiciary reforms, and an academy for training judges and prosecutors. However, there is still a wide gap between the laws and what actually happens in the courts. According to the CIMAP report on the institutional quality of anti-corruption measures, the Macedonian judicial system scored 93 percent for its legal framework, but only
Figure 6.9: Judicial independence, freedom of the press, and EU standardsStandardized components of the index of public integrity, 2017 (score 0–10)
8
6
4
2
0
Judicialindependence
Admin.burden
Tradeopenness
Budgettransparency
E-Citizenship
Freedomof the press
10
▬MKD ▬ALB+BIH+SRB ▬EU+NOR+CHESource: Index of Public Integrity data.
Figure 6.10: Judicial independence ratings, structural and aspirational peersJudicial independence index (0–10)
EST
LTU
LVA
SVN
HRV
MKD
BGR
SVK
MUSJOR
JAM
GEO
MNE
MKD
BIH
SRB
ALB
PRY
0 1 2 3 4 5 6 87
Source: WEF.
SEIZING A BRIGHTER FUTURE FOR ALL
159CHAPTER 6. PATHWAY III: ACHIEVING SUSTAINABILITY THROUGH EFFECTIVE GOVERNANCE, FISCAL PRUDENCE, ENHANCED ENVIRONMENTAL MANAGEMENT AND RESILIENCE TO NATURAL HAZARDS

60 percent for actual application (Figure 6.11).199 The report found similar large gaps for the legislature and public administration. Although in FYR Macedonia this gap is smaller than in other Western Balkan countries, it is significantly wider than in, e.g., Germany, Ireland, and the United States.
272. This gap explains the de jure/de facto mismatch between the progress on rules and market institutions and the lack of progress on government capacity and accountability. Although FYR Macedonia has made tremendous advances in simplifying regulation and reducing the costs of running a business, there is still a general perception that the quality and efficiency of the bureaucracy and the effectiveness of institutions are much lower than the modernity of the law would suggest—certainly, the country’s position in the Doing Business indicator is well above the value implied in the negative perception of government efficiency (Figure 6.12). Simply passing laws is not enough: practices must also change if government capacity and accountability are to improve.
199 Transparency International (2011), “EU Anti-Corruption Requirements: Measuring Progress in Albania, Kosovo, FYR Macedonia and Turkey”. The CIMAP initiative assesses the performance of the judicial system, the legislature, and public administration. The indicators relate to capacity, governance, overall effectiveness/efficiency, and public procurement. Scores assess both laws and policies and actual practice. Data for the report were gathered, analyzed, and reviewed between November 2010 and April 2011.
Figure 6.11: The gap between law and practice, percentScores on TI anti-corruption requirements (score 0–100)
Capacity
Governance
Effectiveness
100
90
80
70
60
50
40
30
20
10
0
Judiciary Legislature Public administration
Capacity
Capacity
Governance
Governance
EffectivenessPublic
procure.
JLaw JPracticeSource: Data from Transparency International (2011).Note: Solid line shows average for the law aspects of capacity, governance, and efficiency in public procurement. Dotted line is average of the practice components.
Figure 6.12: Government effectiveness in FYR Macedonia, 2016Doing Business score [0–2] and Government Effectiveness score [0–1]Government effectiveness (EIU)
2.5
2.0
1.5
1.0
0.5
0
-0.5
-1.0
-1.5
0 0.5 1.0 1.5 2.0
MKD
Doing BusinessSource: Data from Doing Business and Economist Intelligence Unit.
160 CHAPTER 6. PATHWAY III: ACHIEVING SUSTAINABILITY THROUGH EFFECTIVE GOVERNANCE, FISCAL PRUDENCE, ENHANCED ENVIRONMENTAL MANAGEMENT AND RESILIENCE TO NATURAL HAZARDS
FYR MACEDONIA SYSTEMATIC COUNTRY DIAGNOSTIC
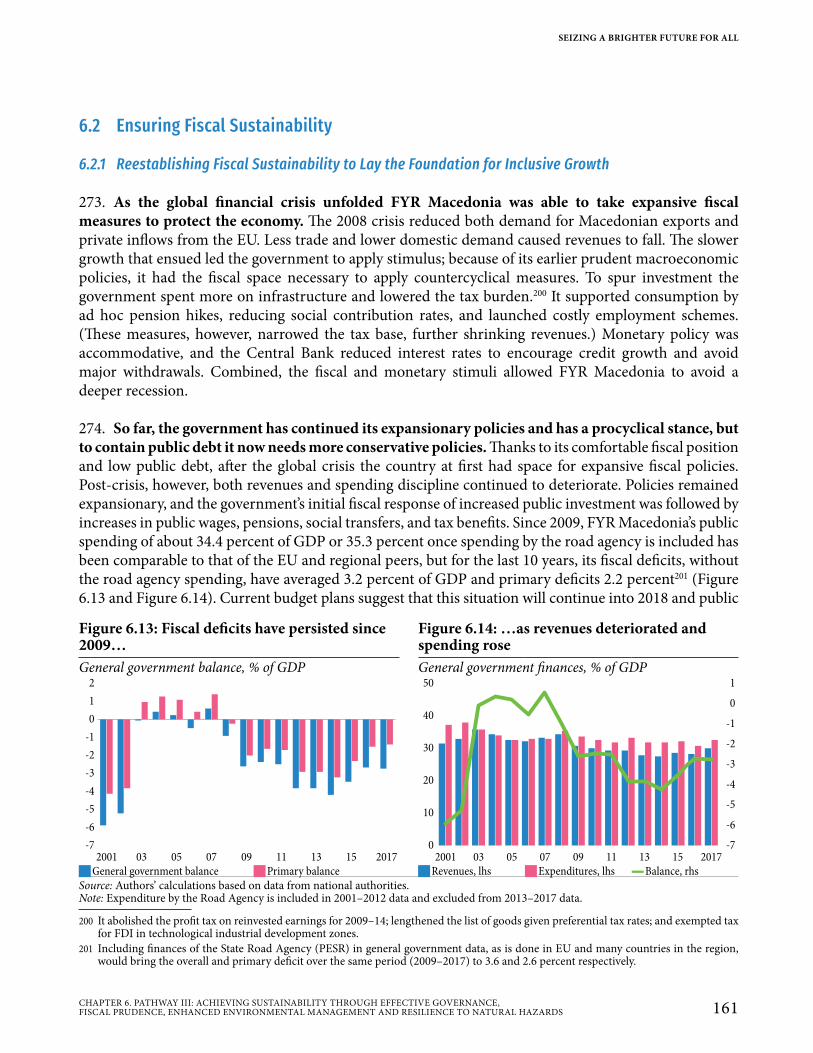
6.2 Ensuring Fiscal Sustainability
6.2.1 Reestablishing Fiscal Sustainability to Lay the Foundation for Inclusive Growth
273. As the global financial crisis unfolded FYR Macedonia was able to take expansive fiscal measures to protect the economy. The 2008 crisis reduced both demand for Macedonian exports and private inflows from the EU. Less trade and lower domestic demand caused revenues to fall. The slower growth that ensued led the government to apply stimulus; because of its earlier prudent macroeconomic policies, it had the fiscal space necessary to apply countercyclical measures. To spur investment the government spent more on infrastructure and lowered the tax burden.200 It supported consumption by ad hoc pension hikes, reducing social contribution rates, and launched costly employment schemes. (These measures, however, narrowed the tax base, further shrinking revenues.) Monetary policy was accommodative, and the Central Bank reduced interest rates to encourage credit growth and avoid major withdrawals. Combined, the fiscal and monetary stimuli allowed FYR Macedonia to avoid a deeper recession.
274. So far, the government has continued its expansionary policies and has a procyclical stance, but to contain public debt it now needs more conservative policies. Thanks to its comfortable fiscal position and low public debt, after the global crisis the country at first had space for expansive fiscal policies. Post-crisis, however, both revenues and spending discipline continued to deteriorate. Policies remained expansionary, and the government’s initial fiscal response of increased public investment was followed by increases in public wages, pensions, social transfers, and tax benefits. Since 2009, FYR Macedonia’s public spending of about 34.4 percent of GDP or 35.3 percent once spending by the road agency is included has been comparable to that of the EU and regional peers, but for the last 10 years, its fiscal deficits, without the road agency spending, have averaged 3.2 percent of GDP and primary deficits 2.2 percent201 (Figure 6.13 and Figure 6.14). Current budget plans suggest that this situation will continue into 2018 and public
200 It abolished the profit tax on reinvested earnings for 2009–14; lengthened the list of goods given preferential tax rates; and exempted tax for FDI in technological industrial development zones.
201 Including finances of the State Road Agency (PESR) in general government data, as is done in EU and many countries in the region, would bring the overall and primary deficit over the same period (2009–2017) to 3.6 and 2.6 percent respectively.
Figure 6.13: Fiscal deficits have persisted since 2009…
Figure 6.14: …as revenues deteriorated and spending rose
General government balance, % of GDP General government finances, % of GDP2
1
0
-1
-2
-3
-4
-5
-6
-7
2001 201709 11 13 15070503
50 1
0
40-1
-230
-3
-420
-510
-6
0 -7
2001 201711 13 1509070503
JGeneral government balance JPrimary balance JRevenues, lhs JExpenditures, lhs ▬Balance, rhsSource: Authors’ calculations based on data from national authorities.Note: Expenditure by the Road Agency is included in 2001–2012 data and excluded from 2013–2017 data.
SEIZING A BRIGHTER FUTURE FOR ALL
161CHAPTER 6. PATHWAY III: ACHIEVING SUSTAINABILITY THROUGH EFFECTIVE GOVERNANCE, FISCAL PRUDENCE, ENHANCED ENVIRONMENTAL MANAGEMENT AND RESILIENCE TO NATURAL HAZARDS
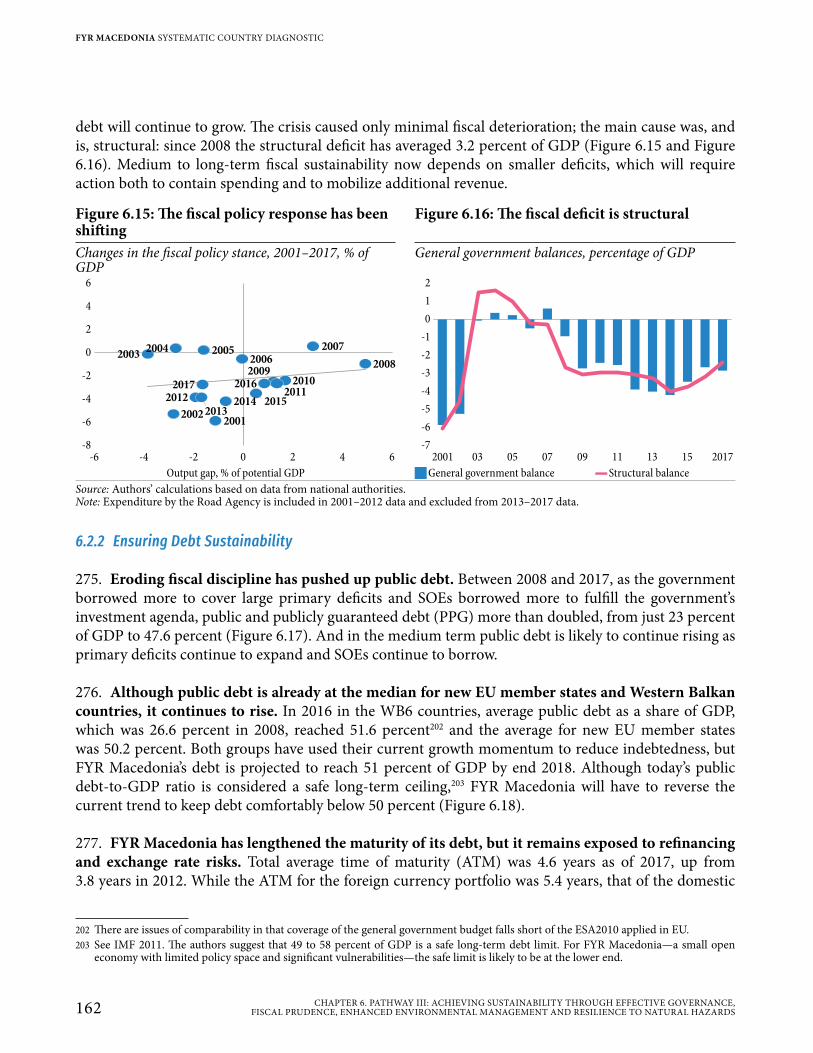
debt will continue to grow. The crisis caused only minimal fiscal deterioration; the main cause was, and is, structural: since 2008 the structural deficit has averaged 3.2 percent of GDP (Figure 6.15 and Figure 6.16). Medium to long-term fiscal sustainability now depends on smaller deficits, which will require action both to contain spending and to mobilize additional revenue.
6.2.2 Ensuring Debt Sustainability
275. Eroding fiscal discipline has pushed up public debt. Between 2008 and 2017, as the government borrowed more to cover large primary deficits and SOEs borrowed more to fulfill the government’s investment agenda, public and publicly guaranteed debt (PPG) more than doubled, from just 23 percent of GDP to 47.6 percent (Figure 6.17). And in the medium term public debt is likely to continue rising as primary deficits continue to expand and SOEs continue to borrow.
276. Although public debt is already at the median for new EU member states and Western Balkan countries, it continues to rise. In 2016 in the WB6 countries, average public debt as a share of GDP, which was 26.6 percent in 2008, reached 51.6 percent202 and the average for new EU member states was 50.2 percent. Both groups have used their current growth momentum to reduce indebtedness, but FYR Macedonia’s debt is projected to reach 51 percent of GDP by end 2018. Although today’s public debt-to-GDP ratio is considered a safe long-term ceiling,203 FYR Macedonia will have to reverse the current trend to keep debt comfortably below 50 percent (Figure 6.18).
277. FYR Macedonia has lengthened the maturity of its debt, but it remains exposed to refinancing and exchange rate risks. Total average time of maturity (ATM) was 4.6 years as of 2017, up from 3.8 years in 2012. While the ATM for the foreign currency portfolio was 5.4 years, that of the domestic
202 There are issues of comparability in that coverage of the general government budget falls short of the ESA2010 applied in EU.203 See IMF 2011. The authors suggest that 49 to 58 percent of GDP is a safe long-term debt limit. For FYR Macedonia—a small open
economy with limited policy space and significant vulnerabilities—the safe limit is likely to be at the lower end.
Figure 6.15: The fiscal policy response has been shifting
Figure 6.16: The fiscal deficit is structural
Changes in the fiscal policy stance, 2001–2017, % of GDP
General government balances, percentage of GDP
6
4
2
0
-2
-4
-6
-8
-6 -4 -2 0 2 4 6
20012002
20032004 2005
20062007
20082009
20102011
2012
20132014 2015
20162017
2
1
0
-1
-2
-3
-4
-5
-6
-7
2001 201709 11 13 15070503
Output gap, % of potential GDP JGeneral government balance ▬Structural balanceSource: Authors’ calculations based on data from national authorities.Note: Expenditure by the Road Agency is included in 2001–2012 data and excluded from 2013–2017 data.
162 CHAPTER 6. PATHWAY III: ACHIEVING SUSTAINABILITY THROUGH EFFECTIVE GOVERNANCE, FISCAL PRUDENCE, ENHANCED ENVIRONMENTAL MANAGEMENT AND RESILIENCE TO NATURAL HAZARDS
FYR MACEDONIA SYSTEMATIC COUNTRY DIAGNOSTIC
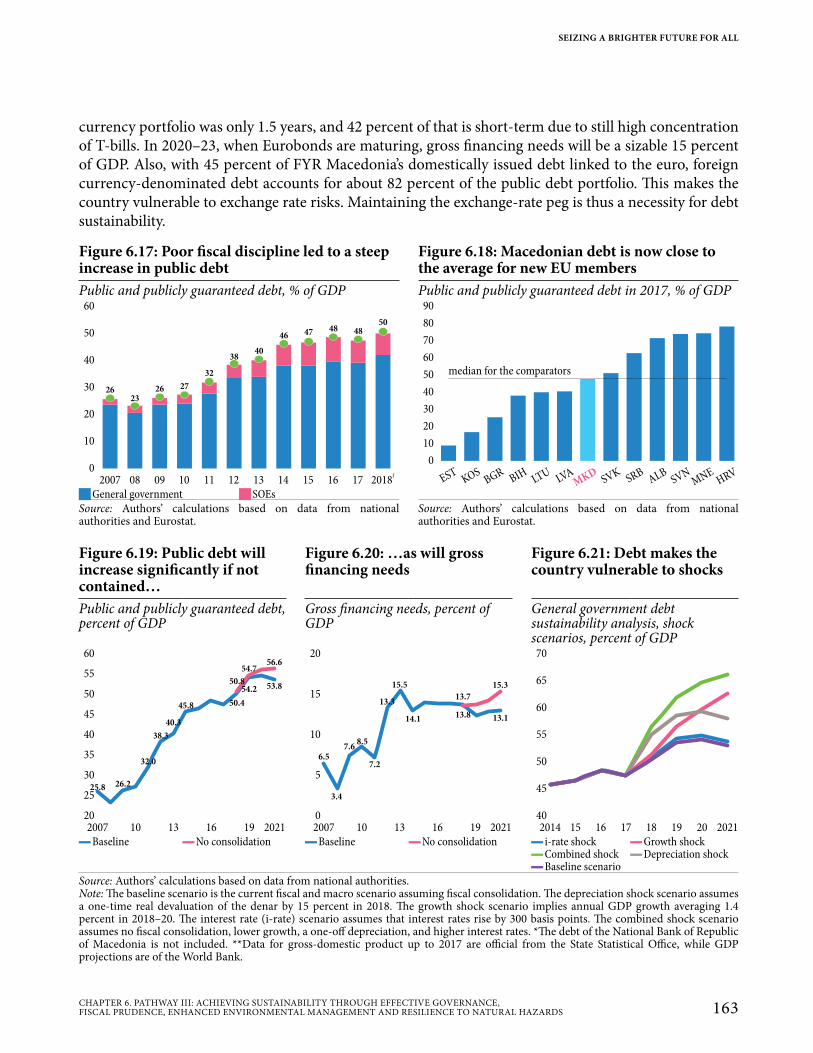
currency portfolio was only 1.5 years, and 42 percent of that is short-term due to still high concentration of T-bills. In 2020–23, when Eurobonds are maturing, gross financing needs will be a sizable 15 percent of GDP. Also, with 45 percent of FYR Macedonia’s domestically issued debt linked to the euro, foreign currency-denominated debt accounts for about 82 percent of the public debt portfolio. This makes the country vulnerable to exchange rate risks. Maintaining the exchange-rate peg is thus a necessity for debt sustainability.
Figure 6.17: Poor fiscal discipline led to a steep increase in public debt
Figure 6.18: Macedonian debt is now close to the average for new EU members
Public and publicly guaranteed debt, % of GDP Public and publicly guaranteed debt in 2017, % of GDP60
50
40
30
20
10
0
2007 2018f
11 12 13 14 15 16 17100908
2623
26 27
32
3840
46 47 48 4850
90
80
70
60
50
40
30
20
10
0
KOSALB
MKDLTUBGR
LVASVKEST
MNESRB
SVNBIH HRV
median for the comparators
JGeneral government JSOEsSource: Authors’ calculations based on data from national authorities and Eurostat.
Source: Authors’ calculations based on data from national authorities and Eurostat.
Figure 6.19: Public debt will increase significantly if not contained…
Figure 6.20: …as will gross financing needs
Figure 6.21: Debt makes the country vulnerable to shocks
Public and publicly guaranteed debt, percent of GDP
Gross financing needs, percent of GDP
General government debt sustainability analysis, shock scenarios, percent of GDP
60
55
50
45
40
35
30
25
20
2007 202110 13 16 19
25.8 26.2
32.0
38.3
40.3
45.8 50.4
54.2 53.850.8
54.756.6
2007 202110 13 16 19
20
15
10
5
0
6.5
3.4
7.6
7.2
15.5
13.7
13.1
8.5
13.3
14.113.8
15.3
70
65
60
55
50
45
40
20212014 1615 17 18 19 20
▬Baseline ▬No consolidation ▬Baseline ▬No consolidation ▬ i-rate shock ▬Growth shock ▬Combined shock ▬Depreciation shock ▬Baseline scenario
Source: Authors’ calculations based on data from national authorities.Note: The baseline scenario is the current fiscal and macro scenario assuming fiscal consolidation. The depreciation shock scenario assumes a one-time real devaluation of the denar by 15 percent in 2018. The growth shock scenario implies annual GDP growth averaging 1.4 percent in 2018–20. The interest rate (i-rate) scenario assumes that interest rates rise by 300 basis points. The combined shock scenario assumes no fiscal consolidation, lower growth, a one-off depreciation, and higher interest rates. *The debt of the National Bank of Republic of Macedonia is not included. **Data for gross-domestic product up to 2017 are official from the State Statistical Office, while GDP projections are of the World Bank.
SEIZING A BRIGHTER FUTURE FOR ALL
163CHAPTER 6. PATHWAY III: ACHIEVING SUSTAINABILITY THROUGH EFFECTIVE GOVERNANCE, FISCAL PRUDENCE, ENHANCED ENVIRONMENTAL MANAGEMENT AND RESILIENCE TO NATURAL HAZARDS
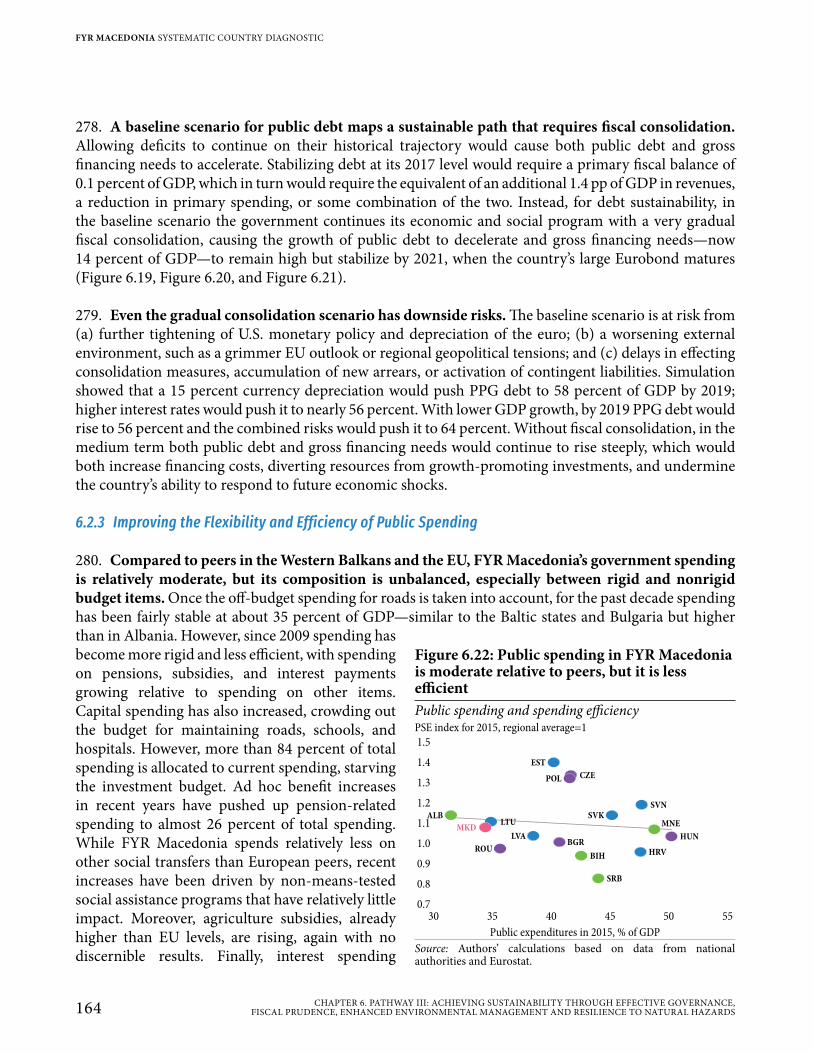
278. A baseline scenario for public debt maps a sustainable path that requires fiscal consolidation. Allowing deficits to continue on their historical trajectory would cause both public debt and gross financing needs to accelerate. Stabilizing debt at its 2017 level would require a primary fiscal balance of 0.1 percent of GDP, which in turn would require the equivalent of an additional 1.4 pp of GDP in revenues, a reduction in primary spending, or some combination of the two. Instead, for debt sustainability, in the baseline scenario the government continues its economic and social program with a very gradual fiscal consolidation, causing the growth of public debt to decelerate and gross financing needs—now 14 percent of GDP—to remain high but stabilize by 2021, when the country’s large Eurobond matures (Figure 6.19, Figure 6.20, and Figure 6.21).
279. Even the gradual consolidation scenario has downside risks. The baseline scenario is at risk from (a) further tightening of U.S. monetary policy and depreciation of the euro; (b) a worsening external environment, such as a grimmer EU outlook or regional geopolitical tensions; and (c) delays in effecting consolidation measures, accumulation of new arrears, or activation of contingent liabilities. Simulation showed that a 15 percent currency depreciation would push PPG debt to 58 percent of GDP by 2019; higher interest rates would push it to nearly 56 percent. With lower GDP growth, by 2019 PPG debt would rise to 56 percent and the combined risks would push it to 64 percent. Without fiscal consolidation, in the medium term both public debt and gross financing needs would continue to rise steeply, which would both increase financing costs, diverting resources from growth-promoting investments, and undermine the country’s ability to respond to future economic shocks.
6.2.3 Improving the Flexibility and Efficiency of Public Spending
280. Compared to peers in the Western Balkans and the EU, FYR Macedonia’s government spending is relatively moderate, but its composition is unbalanced, especially between rigid and nonrigid budget items. Once the off-budget spending for roads is taken into account, for the past decade spending has been fairly stable at about 35 percent of GDP—similar to the Baltic states and Bulgaria but higher than in Albania. However, since 2009 spending has become more rigid and less efficient, with spending on pensions, subsidies, and interest payments growing relative to spending on other items. Capital spending has also increased, crowding out the budget for maintaining roads, schools, and hospitals. However, more than 84 percent of total spending is allocated to current spending, starving the investment budget. Ad hoc benefit increases in recent years have pushed up pension-related spending to almost 26 percent of total spending. While FYR Macedonia spends relatively less on other social transfers than European peers, recent increases have been driven by non-means-tested social assistance programs that have relatively little impact. Moreover, agriculture subsidies, already higher than EU levels, are rising, again with no discernible results. Finally, interest spending
Figure 6.22: Public spending in FYR Macedonia is moderate relative to peers, but it is less efficientPublic spending and spending efficiencyPSE index for 2015, regional average=11.5
1.4
1.3
1.2
1.1
1.0
0.9
0.8
0.7
30 35 40 45 50 55
EST
CZEPOL
SVNSVK
MNE
HUN
HRV
SRB
BIH
BGRLVA
ROU
MKDLTU
ALB
Public expenditures in 2015, % of GDPSource: Authors’ calculations based on data from national authorities and Eurostat.
164 CHAPTER 6. PATHWAY III: ACHIEVING SUSTAINABILITY THROUGH EFFECTIVE GOVERNANCE, FISCAL PRUDENCE, ENHANCED ENVIRONMENTAL MANAGEMENT AND RESILIENCE TO NATURAL HAZARDS
FYR MACEDONIA SYSTEMATIC COUNTRY DIAGNOSTIC

more than doubled, from 0.6 percent in 2008 to 1.3 percent in 2017, as concessional borrowing declined and the maturity and magnitude of public debt increased (World Bank 2018a; Figure 6.22 and Figure 6.23).
281. Because over time rigid204 budget items have comprised a large share of government spending, it is now important that budgets be flexible to respond to new spending demands. Between 2011 and 2017, the high-rigidity share of government spending declined only from 71 to 70 percent. For example, in that period interest payments on the national debt, a very rigid category, doubled from 2 to 4 percent of total government spending, and the share of transfers in general government spending rose from 49 to 51 percent, largely because pensions grew from 25 to 27 percent of total government spending. Transfers to local governments grew from 1 to 2 percent. The share of capital spending, which is relatively more flexible, rose from 14 to 16 percent of general government spending. Given the substantial share of pensions and transfers, and their disproportionate variability, in future budget exercises they should be closely examined. Fiscal space needs to be created for spending related to the country’s EU aspirations in areas like competition policy and environmental and regulatory quality, and for responses to the emerging pension and health needs of an aging society.
282. Public spending on education, health, infrastructure, and agricultural subsidies is not efficient. A comparison of actual expenditures with the minimum expenditures necessary to achieve the same results suggests that efficiency reforms could yield savings of more than 13 percent of total public spending. Education has the most room for improvement. FYR Macedonia’s spending on education of 4.1 percent is among the highest in the region but its outcomes are below the regional average and worsening. In the past decade, health spending declined as a percentage of GDP but the hospital network has been inefficient even longer. As for infrastructure, other countries in the region invest less to get similar results. Relatively low spending on goods and services has contributed to the deterioration of FYR Macedonia’s public assets, notably roads, schools, and hospitals (World Bank 2017b). The agricultural subsidies program discourages investment, favors large farms, and distorts input markets.205 With fiscal consolidation a necessity to contain the growth of public debt, it is especially important that spending be as efficient as possible (Box 6.2).
204 Rigid spending categories are usually difficult to reduce as they represent either government’s obligations, such as interest payments, or entitlements.
205 The generous subsidies program accounts for 90 percent of the agricultural budget, yet the agricultural sector is fragmented and its technology obsolete.
Figure 6.23: Social and capital spending have grown relative to other itemsChange in total spending as a share of GDP, 2009 and 2017
40
30
20
10
0
2009 2017
JWages and allowances JGoods and services JPensions JUnemployment benefits JSocial benefits JHealth care JTransfers to local governments JSubsidies J Interest JCapital expenditures
Source: Authors’ calculations based on data from national authorities and Eurostat.
SEIZING A BRIGHTER FUTURE FOR ALL
165CHAPTER 6. PATHWAY III: ACHIEVING SUSTAINABILITY THROUGH EFFECTIVE GOVERNANCE, FISCAL PRUDENCE, ENHANCED ENVIRONMENTAL MANAGEMENT AND RESILIENCE TO NATURAL HAZARDS
Box 6.2: Making Public Spending in FYR Macedonia More Efficient
Education spending amounted to 4.1 percent of GDP in 2016, but its outcomes are below the regional average and have been deteriorating. Training teachers and raising the hours primary teachers work to global standards could help build up the quality of primary and secondary education. Tertiary education could be improved by coordinating the curriculum with the private sector and introducing capitation financing. Drafting a strategy for monitoring student learning outcomes, particularly if combined with detailed information on labor market conditions, could be useful to support policy decisions. Over the medium term, what should be addressed are optimizing the primary school network and secondary vocational schools; improving the quality and relevance of secondary technical education; and opening up and promoting access to preschool education.
Health spending was 4.9 percent of GDP in 2016, but payment arrears are a constant, and the hospital network is inefficient. Health spending could be used more effectively by shifting funding from inefficient to higher-performing hospitals. Primary care should be a priority and given adequate financing to facilitate preventive programs. Potential savings from better pharmaceutical procurement could be used most efficiently by emphasizing primary care and prevention. And right-sizing the hospital network and giving hospitals more autonomy, with more accountability, could reduce service inefficiencies.
At 3.8 percent of GDP FYR Macedonia’s relatively low spending on operations and maintenance has allowed public assets like roads, schools, and hospitals to deteriorate (World Bank 2017b). Although the country has improved public procurement by introducing e-procurement and harmonizing its legal framework with the EU Acquis, a recent USAID-sponsored survey of the public procurement process found that in 25 percent of requests for bids, there was only one bidder. It also surveyed companies to find out their biggest concerns about public procurement. Two stand out: (a) the primacy of “lowest price” in public bids is a problem for 52 percent of companies, which suggests that unrealistically low bids are accepted and later revised upward; and (b) delayed payment: on average it took public institutions eight months to pay, up from six in 2013.
Other Western Balkan countries invest less in infrastructure yet achieve similar results. Ideally, the government should issue guidelines on managing public investments and require that all public investment projects first undergo a cost-benefit analysis and readiness assessment, with the analysis used to prioritize projects in terms of how they align with sector strategies and budget processes. Budgets for new projects should incorporate all costs expected during the entire project lifecycle, especially regular maintenance.
At 2.6 percent of GDP in 2017, subsidies are relatively high by regional and EU standards and are in addition to state aid provided through tax relief and other tax expenditures. Although most subsidies support farmers and rural development programs, the share of agriculture in GDP has been shrinking for the past decade. Compared to regional standards and to structural peers, FYR Macedonia’s support for agriculture seems too high, and too much supports uncompetitive products like tobacco, sustaining inefficiencies and delaying economic transition—and growth.
continued on next page
166 CHAPTER 6. PATHWAY III: ACHIEVING SUSTAINABILITY THROUGH EFFECTIVE GOVERNANCE, FISCAL PRUDENCE, ENHANCED ENVIRONMENTAL MANAGEMENT AND RESILIENCE TO NATURAL HAZARDS
FYR MACEDONIA SYSTEMATIC COUNTRY DIAGNOSTIC
6.2.4 Addressing Fiscal Risks
283. Because the pension system is arguably the largest source of fiscal risk in FYR Macedonia, pension spending must be reined in. Although in the region FYR Macedonia was an early pension reformer, deficits are still prevalent. Demographic change will worsen them, adding to concerns about the general sustainability of public finances. The pension scheme, a pay-as-you-go plan with two private contribution pillars, is fiscally and socially unsustainable, and despite recent reforms206 the system still has major problems. At 9.2 percent, the country’s spending on pensions is not far off the 9 percent average of Central and South East European countries, but the populations of most of those countries are older (World Bank 2017b). The current pension deficit is more than 4 percent of GDP, and pension spending is bound to keep rising as the population ages. Implicit pension debt, reflecting future pension liabilities based on current policies, is estimated at 203 percent of GDP—quadruple the value of explicit public debt. Although as a share of GDP implicit pension debt is among the lowest in the Western Balkans, it will still be a substantial burden on future generations. Moreover, the current retirement age of 64 for men and 62 for women, among the lowest in the Western Balkans, is not consistent with life expectancies. Although the country’s effective life expectancy at retirement age (15.9 years) is lower for men than the European average, that is not true for women (20 years). The upward trend of life expectancy certainly needs to be factored in when retirement ages and accrual rates are set in the near future. To contain spending, retirement ages need to rise, and pensions indexed only to the consumer price index. Without reforms, the deficit will continue to deplete public funds that could otherwise be devoted to more productive public purposes, returned to taxpayers through lower contribution rates, or diverted to long-term pension savings.
206 For example, elimination of early retirement provisions, age-limiting general disability conditions, and increasing retirement age.
The 2018 FYR Macedonia Public Finance Review found that given the available production technology, an average farm could produce the same amount with 55 percent fewer inputs.
Spending on social protection is relatively moderate, although the aging of the population, early retirement options, ad hoc policy decisions, and the move to untargeted programs have created considerable pressure. Closing early retirement options and raising the retirement age in line with rising life expectancy are among ways to narrow the current spending gap. Legislative changes could also make spending on social assistance much more efficient by, e.g., review of program coverage, targeting, eligibility, and registration systems. Benefit overlaps especially should be reduced, and the accumulation of rights that may create disincentives to labor market participation. Finally, the relationship between categorical and income-based benefits needs to be clarified and costly untargeted benefits eliminated.
Spending on the environment at 0.3 percent of GDP will have to be markedly increased as the country launches harmonization with EU standards.Source: Authors based on World Bank (2018a), FYR Macedonia Public Finance Review.
Box 6.2 continued from previous page
SEIZING A BRIGHTER FUTURE FOR ALL
167CHAPTER 6. PATHWAY III: ACHIEVING SUSTAINABILITY THROUGH EFFECTIVE GOVERNANCE, FISCAL PRUDENCE, ENHANCED ENVIRONMENTAL MANAGEMENT AND RESILIENCE TO NATURAL HAZARDS
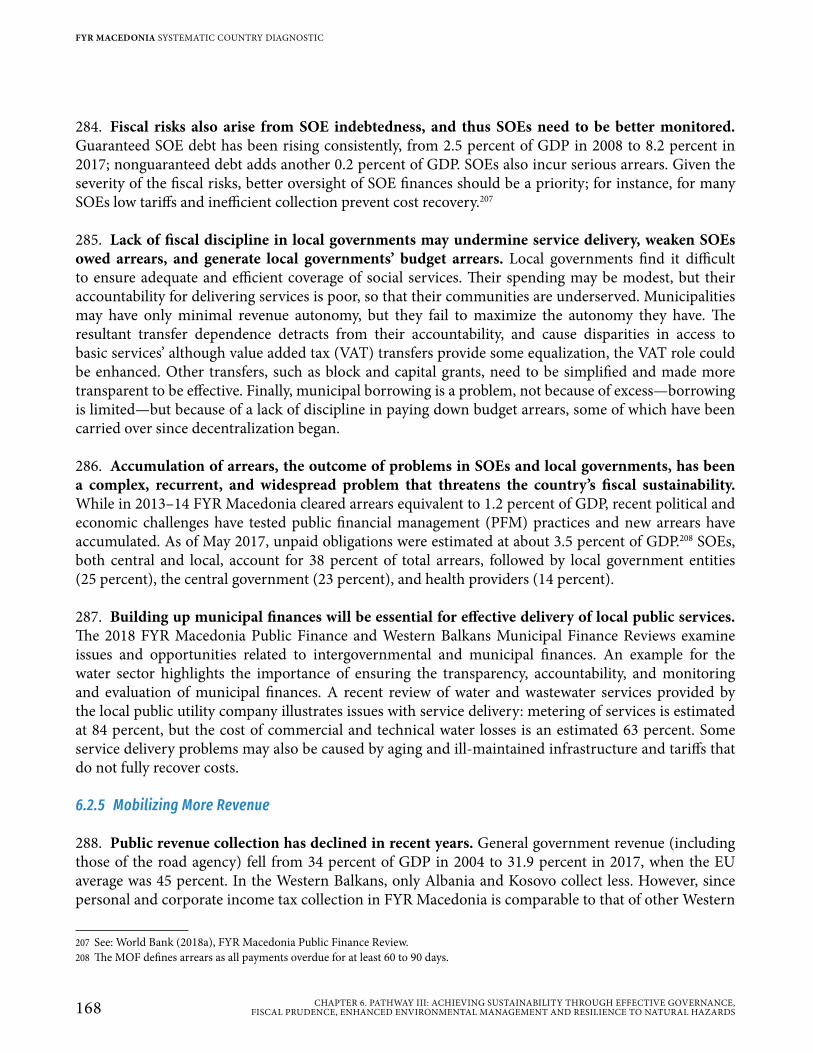
284. Fiscal risks also arise from SOE indebtedness, and thus SOEs need to be better monitored. Guaranteed SOE debt has been rising consistently, from 2.5 percent of GDP in 2008 to 8.2 percent in 2017; nonguaranteed debt adds another 0.2 percent of GDP. SOEs also incur serious arrears. Given the severity of the fiscal risks, better oversight of SOE finances should be a priority; for instance, for many SOEs low tariffs and inefficient collection prevent cost recovery.207
285. Lack of fiscal discipline in local governments may undermine service delivery, weaken SOEs owed arrears, and generate local governments’ budget arrears. Local governments find it difficult to ensure adequate and efficient coverage of social services. Their spending may be modest, but their accountability for delivering services is poor, so that their communities are underserved. Municipalities may have only minimal revenue autonomy, but they fail to maximize the autonomy they have. The resultant transfer dependence detracts from their accountability, and cause disparities in access to basic services’ although value added tax (VAT) transfers provide some equalization, the VAT role could be enhanced. Other transfers, such as block and capital grants, need to be simplified and made more transparent to be effective. Finally, municipal borrowing is a problem, not because of excess—borrowing is limited—but because of a lack of discipline in paying down budget arrears, some of which have been carried over since decentralization began.
286. Accumulation of arrears, the outcome of problems in SOEs and local governments, has been a complex, recurrent, and widespread problem that threatens the country’s fiscal sustainability. While in 2013–14 FYR Macedonia cleared arrears equivalent to 1.2 percent of GDP, recent political and economic challenges have tested public financial management (PFM) practices and new arrears have accumulated. As of May 2017, unpaid obligations were estimated at about 3.5 percent of GDP.208 SOEs, both central and local, account for 38 percent of total arrears, followed by local government entities (25 percent), the central government (23 percent), and health providers (14 percent).
287. Building up municipal finances will be essential for effective delivery of local public services. The 2018 FYR Macedonia Public Finance and Western Balkans Municipal Finance Reviews examine issues and opportunities related to intergovernmental and municipal finances. An example for the water sector highlights the importance of ensuring the transparency, accountability, and monitoring and evaluation of municipal finances. A recent review of water and wastewater services provided by the local public utility company illustrates issues with service delivery: metering of services is estimated at 84 percent, but the cost of commercial and technical water losses is an estimated 63 percent. Some service delivery problems may also be caused by aging and ill-maintained infrastructure and tariffs that do not fully recover costs.
6.2.5 Mobilizing More Revenue
288. Public revenue collection has declined in recent years. General government revenue (including those of the road agency) fell from 34 percent of GDP in 2004 to 31.9 percent in 2017, when the EU average was 45 percent. In the Western Balkans, only Albania and Kosovo collect less. However, since personal and corporate income tax collection in FYR Macedonia is comparable to that of other Western
207 See: World Bank (2018a), FYR Macedonia Public Finance Review.208 The MOF defines arrears as all payments overdue for at least 60 to 90 days.
168 CHAPTER 6. PATHWAY III: ACHIEVING SUSTAINABILITY THROUGH EFFECTIVE GOVERNANCE, FISCAL PRUDENCE, ENHANCED ENVIRONMENTAL MANAGEMENT AND RESILIENCE TO NATURAL HAZARDS
FYR MACEDONIA SYSTEMATIC COUNTRY DIAGNOSTIC
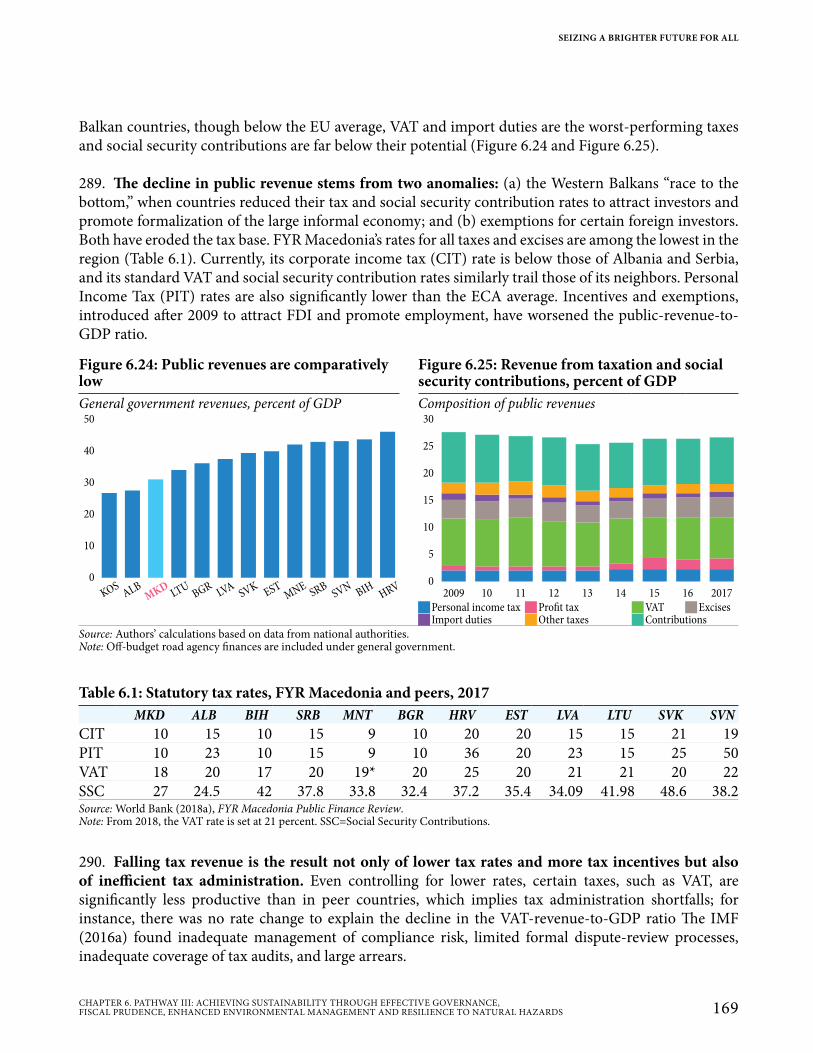
Balkan countries, though below the EU average, VAT and import duties are the worst-performing taxes and social security contributions are far below their potential (Figure 6.24 and Figure 6.25).
289. The decline in public revenue stems from two anomalies: (a) the Western Balkans “race to the bottom,” when countries reduced their tax and social security contribution rates to attract investors and promote formalization of the large informal economy; and (b) exemptions for certain foreign investors. Both have eroded the tax base. FYR Macedonia’s rates for all taxes and excises are among the lowest in the region (Table 6.1). Currently, its corporate income tax (CIT) rate is below those of Albania and Serbia, and its standard VAT and social security contribution rates similarly trail those of its neighbors. Personal Income Tax (PIT) rates are also significantly lower than the ECA average. Incentives and exemptions, introduced after 2009 to attract FDI and promote employment, have worsened the public-revenue-to-GDP ratio.
Table 6.1: Statutory tax rates, FYR Macedonia and peers, 2017MKD ALB BIH SRB MNT BGR HRV EST LVA LTU SVK SVN
CIT 10 15 10 15 9 10 20 20 15 15 21 19PIT 10 23 10 15 9 10 36 20 23 15 25 50VAT 18 20 17 20 19* 20 25 20 21 21 20 22SSC 27 24.5 42 37.8 33.8 32.4 37.2 35.4 34.09 41.98 48.6 38.2Source: World Bank (2018a), FYR Macedonia Public Finance Review.Note: From 2018, the VAT rate is set at 21 percent. SSC=Social Security Contributions.
290. Falling tax revenue is the result not only of lower tax rates and more tax incentives but also of inefficient tax administration. Even controlling for lower rates, certain taxes, such as VAT, are significantly less productive than in peer countries, which implies tax administration shortfalls; for instance, there was no rate change to explain the decline in the VAT-revenue-to-GDP ratio The IMF (2016a) found inadequate management of compliance risk, limited formal dispute-review processes, inadequate coverage of tax audits, and large arrears.
Figure 6.24: Public revenues are comparatively low
Figure 6.25: Revenue from taxation and social security contributions, percent of GDP
General government revenues, percent of GDP Composition of public revenues50
40
30
20
10
0
KOSALB
MKD LTUBGR
LVASVK EST
MNESRB
SVN BIH HRV
30
25
20
15
10
5
0
2009 201710 11 12 13 14 15 16
JPersonal income tax JProfit tax JVAT JExcises J Import duties JOther taxes JContributions
Source: Authors’ calculations based on data from national authorities.Note: Off-budget road agency finances are included under general government.
SEIZING A BRIGHTER FUTURE FOR ALL
169CHAPTER 6. PATHWAY III: ACHIEVING SUSTAINABILITY THROUGH EFFECTIVE GOVERNANCE, FISCAL PRUDENCE, ENHANCED ENVIRONMENTAL MANAGEMENT AND RESILIENCE TO NATURAL HAZARDS
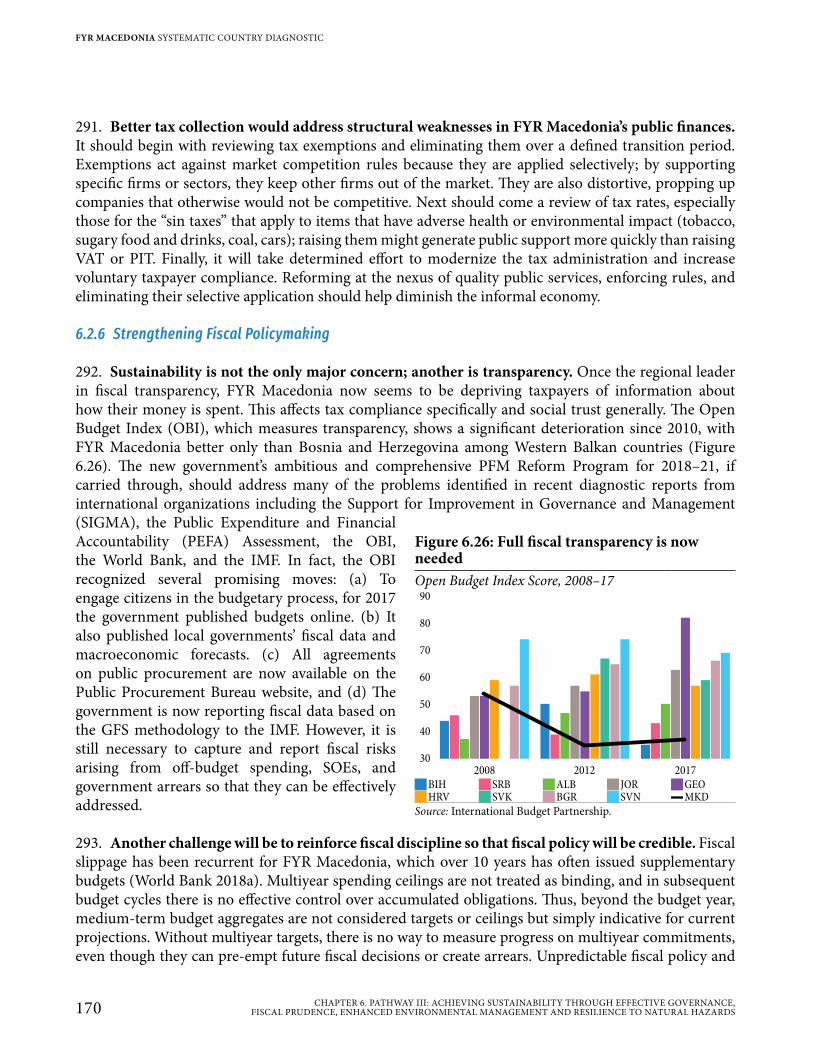
291. Better tax collection would address structural weaknesses in FYR Macedonia’s public finances. It should begin with reviewing tax exemptions and eliminating them over a defined transition period. Exemptions act against market competition rules because they are applied selectively; by supporting specific firms or sectors, they keep other firms out of the market. They are also distortive, propping up companies that otherwise would not be competitive. Next should come a review of tax rates, especially those for the “sin taxes” that apply to items that have adverse health or environmental impact (tobacco, sugary food and drinks, coal, cars); raising them might generate public support more quickly than raising VAT or PIT. Finally, it will take determined effort to modernize the tax administration and increase voluntary taxpayer compliance. Reforming at the nexus of quality public services, enforcing rules, and eliminating their selective application should help diminish the informal economy.
6.2.6 Strengthening Fiscal Policymaking
292. Sustainability is not the only major concern; another is transparency. Once the regional leader in fiscal transparency, FYR Macedonia now seems to be depriving taxpayers of information about how their money is spent. This affects tax compliance specifically and social trust generally. The Open Budget Index (OBI), which measures transparency, shows a significant deterioration since 2010, with FYR Macedonia better only than Bosnia and Herzegovina among Western Balkan countries (Figure 6.26). The new government’s ambitious and comprehensive PFM Reform Program for 2018–21, if carried through, should address many of the problems identified in recent diagnostic reports from international organizations including the Support for Improvement in Governance and Management (SIGMA), the Public Expenditure and Financial Accountability (PEFA) Assessment, the OBI, the World Bank, and the IMF. In fact, the OBI recognized several promising moves: (a) To engage citizens in the budgetary process, for 2017 the government published budgets online. (b) It also published local governments’ fiscal data and macroeconomic forecasts. (c) All agreements on public procurement are now available on the Public Procurement Bureau website, and (d) The government is now reporting fiscal data based on the GFS methodology to the IMF. However, it is still necessary to capture and report fiscal risks arising from off-budget spending, SOEs, and government arrears so that they can be effectively addressed.
293. Another challenge will be to reinforce fiscal discipline so that fiscal policy will be credible. Fiscal slippage has been recurrent for FYR Macedonia, which over 10 years has often issued supplementary budgets (World Bank 2018a). Multiyear spending ceilings are not treated as binding, and in subsequent budget cycles there is no effective control over accumulated obligations. Thus, beyond the budget year, medium-term budget aggregates are not considered targets or ceilings but simply indicative for current projections. Without multiyear targets, there is no way to measure progress on multiyear commitments, even though they can pre-empt future fiscal decisions or create arrears. Unpredictable fiscal policy and
Figure 6.26: Full fiscal transparency is now neededOpen Budget Index Score, 2008–17
90
80
70
60
50
40
30
2008 2012 2017
JBIH JSRB JALB J JOR JGEO JHRV JSVK JBGR JSVN ▬MKD
Source: International Budget Partnership.
170 CHAPTER 6. PATHWAY III: ACHIEVING SUSTAINABILITY THROUGH EFFECTIVE GOVERNANCE, FISCAL PRUDENCE, ENHANCED ENVIRONMENTAL MANAGEMENT AND RESILIENCE TO NATURAL HAZARDS
FYR MACEDONIA SYSTEMATIC COUNTRY DIAGNOSTIC

the lack of fiscal discipline could dilute investors’ interest and raise the risk premium on sovereign debt despite the recent excellent market reaction that led to decline in yields due to stabilization of the political situation in the country and the high liquidity on the international capital market. Expenditure volatility can be reduced by building up long-term fiscal sustainability and moving away from procyclical policies. Many small states have built fiscal buffers and designed fiscal rules to protect the economy from sudden shocks. Because they are more exposed to external shocks, to anticipate shocks small states need to build up adequate reserves or budget extra spending.
294. While the country has in the past acted to improve PFM, there is still much to be done. Budget planning, which is still oriented to the short term, has become less reliable; arrears constantly re-emerge; more spending is off-budget; and spending has become more opaque. Thus for the Treasury the reform priorities are to (a) address arrears accumulation through better medium-term macro-fiscal forecasting and planning, public sector accounting rules, and enforcing oversight and the internal controls of budget users; (b) monitor and report on off-budget operations and enforce fiscal discipline and debt management to carefully manage risks; (c) build up public investment management and ensure that bidding on public procurement contracts is competitive; and (d) give the State Audit Office more authority to ensure transparency and the value for money that taxpayers expect from government.
6.3 Strengthening Environmental Management and Resilience to Natural Hazards and Climate Change
6.3.1 The Threat of Air Pollution
295. Air pollution in FYR Macedonia is among the worst in Europe, and the causes can be identified. In 2005 the country’s ambient particulate matter (PM) pollution—fine dust or soot, which is linked to premature death and such diseases as lung cancer, stroke, ischemic heart disease, chronic obstructive pulmonary disease, and acute lower respiratory disease in children—was Europe’s worst. Although economic activity was depressed, by 2011 PM pollution had not improved, and ambient air pollution in Macedonian cities is at dangerous levels (Figure 6.27). PM concentrations regularly violate not only WHO standards for ambient air quality but also more lenient EU standards. The main contributors are residential and commercial heating, road traffic, industry, and energy production; also contributing are agriculture, waste-burning, and construction. In urban areas like Skopje, the contributions of road traffic and road dust to PM concentrations become more significant (Figure 6.29). Air pollution is worst in Tetovo, Skopje (the largest city), and several local production zones. In winter insufficient air circulation in Skopje exacerbates the problem, primarily because of residential burning of wood and other polluting materials. Outside Skopje, site-specific industrial production is the major contributor to local air quality problems: energy production in Bitola and in Oslomej, metallurgical works in Kavadarci and Tetovo, and oil refining in Miladinovci. Also, depending on location and season, transboundary air pollution can have an impact (Figure 6.28).
296. The health impact of air pollution and its estimated costs are substantial. Based on recent air quality data, PM pollution was responsible for an estimated 1,600 deaths annually, at a total economic cost of US$750 million (6.9 percent of GDP in 2016). Lowering PMs to EU limits would avoid over 240 deaths annually, at a savings in health costs of US$111 million. Of FYR Macedonia’s 80 municipalities,
SEIZING A BRIGHTER FUTURE FOR ALL
171CHAPTER 6. PATHWAY III: ACHIEVING SUSTAINABILITY THROUGH EFFECTIVE GOVERNANCE, FISCAL PRUDENCE, ENHANCED ENVIRONMENTAL MANAGEMENT AND RESILIENCE TO NATURAL HAZARDS
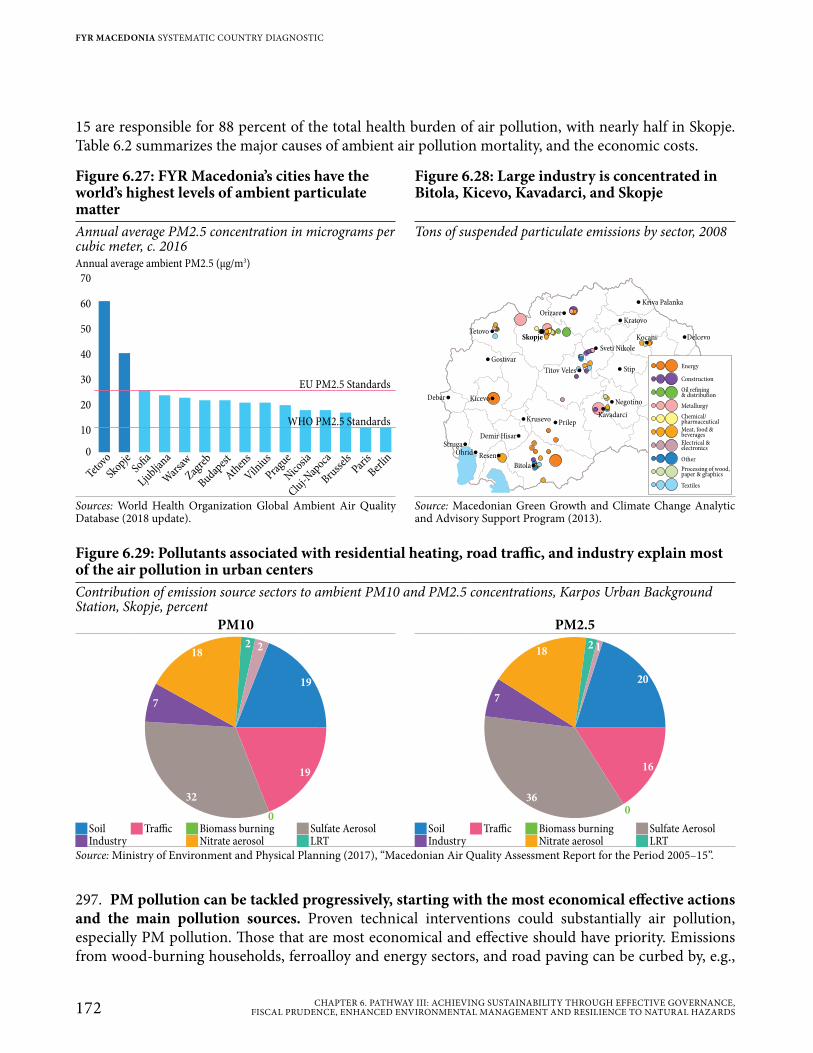
15 are responsible for 88 percent of the total health burden of air pollution, with nearly half in Skopje. Table 6.2 summarizes the major causes of ambient air pollution mortality, and the economic costs.
297. PM pollution can be tackled progressively, starting with the most economical effective actions and the main pollution sources. Proven technical interventions could substantially air pollution, especially PM pollution. Those that are most economical and effective should have priority. Emissions from wood-burning households, ferroalloy and energy sectors, and road paving can be curbed by, e.g.,
Figure 6.27: FYR Macedonia’s cities have the world’s highest levels of ambient particulate matter
Figure 6.28: Large industry is concentrated in Bitola, Kicevo, Kavadarci, and Skopje
Annual average PM2.5 concentration in micrograms per cubic meter, c. 2016
Tons of suspended particulate emissions by sector, 2008
Annual average ambient PM2.5 (μg/m3)
Tetovo
Skopje
Sofia
Ljublja
na
War
saw
Zagre
b
Budapes
t
Athen
s
Vilniu
s
Pragu
e
Nicosia
Cluj-N
apoca
Bruss
elsPar
is
Berlin
70
60
50
40
30
20
10
0
EU PM2.5 Standards
WHO PM2.5 Standards
Energy
Construction
Oil refining& distribution
Metallurgy
Chemical/pharmaceuticalMeat, food &beverages
Electrical &electronics
Other
Processing of wood,paper & graphics
Textiles
Delcevo
Stip
Kocani
Kratovo
Kriva Palanka
Orizare
SkopjeTetovo
Gostivar
Debar
StrugaOhrid Resen
Bitola
Demir Hisar
Krusevo Prilep
Kicevo
Kavadarci
Negotino
Titov Veles
Sveti Nikole
Sources: World Health Organization Global Ambient Air Quality Database (2018 update).
Source: Macedonian Green Growth and Climate Change Analytic and Advisory Support Program (2013).
Figure 6.29: Pollutants associated with residential heating, road traffic, and industry explain most of the air pollution in urban centersContribution of emission source sectors to ambient PM10 and PM2.5 concentrations, Karpos Urban Background Station, Skopje, percent
PM10 PM2.52
18
7
32
19
19
2
0
218
7
36
16
20
1
0
JSoil JTraffic JBiomass burning JSulfate Aerosol JSoil JTraffic JBiomass burning JSulfate Aerosol J Industry JNitrate aerosol JLRT J Industry JNitrate aerosol JLRT
Source: Ministry of Environment and Physical Planning (2017), “Macedonian Air Quality Assessment Report for the Period 2005–15”.
172 CHAPTER 6. PATHWAY III: ACHIEVING SUSTAINABILITY THROUGH EFFECTIVE GOVERNANCE, FISCAL PRUDENCE, ENHANCED ENVIRONMENTAL MANAGEMENT AND RESILIENCE TO NATURAL HAZARDS
FYR MACEDONIA SYSTEMATIC COUNTRY DIAGNOSTIC
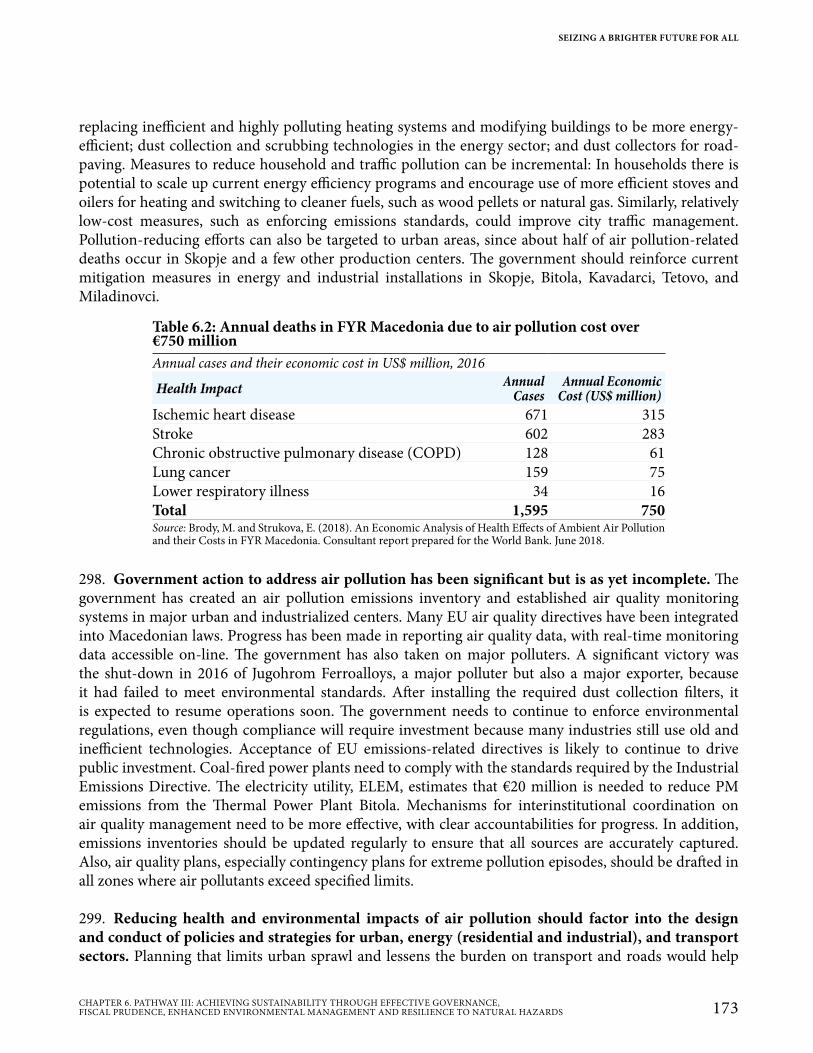
replacing inefficient and highly polluting heating systems and modifying buildings to be more energy-efficient; dust collection and scrubbing technologies in the energy sector; and dust collectors for road-paving. Measures to reduce household and traffic pollution can be incremental: In households there is potential to scale up current energy efficiency programs and encourage use of more efficient stoves and oilers for heating and switching to cleaner fuels, such as wood pellets or natural gas. Similarly, relatively low-cost measures, such as enforcing emissions standards, could improve city traffic management. Pollution-reducing efforts can also be targeted to urban areas, since about half of air pollution-related deaths occur in Skopje and a few other production centers. The government should reinforce current mitigation measures in energy and industrial installations in Skopje, Bitola, Kavadarci, Tetovo, and Miladinovci.
298. Government action to address air pollution has been significant but is as yet incomplete. The government has created an air pollution emissions inventory and established air quality monitoring systems in major urban and industrialized centers. Many EU air quality directives have been integrated into Macedonian laws. Progress has been made in reporting air quality data, with real-time monitoring data accessible on-line. The government has also taken on major polluters. A significant victory was the shut-down in 2016 of Jugohrom Ferroalloys, a major polluter but also a major exporter, because it had failed to meet environmental standards. After installing the required dust collection filters, it is expected to resume operations soon. The government needs to continue to enforce environmental regulations, even though compliance will require investment because many industries still use old and inefficient technologies. Acceptance of EU emissions-related directives is likely to continue to drive public investment. Coal-fired power plants need to comply with the standards required by the Industrial Emissions Directive. The electricity utility, ELEM, estimates that €20 million is needed to reduce PM emissions from the Thermal Power Plant Bitola. Mechanisms for interinstitutional coordination on air quality management need to be more effective, with clear accountabilities for progress. In addition, emissions inventories should be updated regularly to ensure that all sources are accurately captured. Also, air quality plans, especially contingency plans for extreme pollution episodes, should be drafted in all zones where air pollutants exceed specified limits.
299. Reducing health and environmental impacts of air pollution should factor into the design and conduct of policies and strategies for urban, energy (residential and industrial), and transport sectors. Planning that limits urban sprawl and lessens the burden on transport and roads would help
Table 6.2: Annual deaths in FYR Macedonia due to air pollution cost over €750 millionAnnual cases and their economic cost in US$ million, 2016
Health Impact Annual Cases
Annual Economic Cost (US$ million)
Ischemic heart disease 671 315Stroke 602 283Chronic obstructive pulmonary disease (COPD) 128 61Lung cancer 159 75Lower respiratory illness 34 16Total 1,595 750Source: Brody, M. and Strukova, E. (2018). An Economic Analysis of Health Effects of Ambient Air Pollution and their Costs in FYR Macedonia. Consultant report prepared for the World Bank. June 2018.
SEIZING A BRIGHTER FUTURE FOR ALL
173CHAPTER 6. PATHWAY III: ACHIEVING SUSTAINABILITY THROUGH EFFECTIVE GOVERNANCE, FISCAL PRUDENCE, ENHANCED ENVIRONMENTAL MANAGEMENT AND RESILIENCE TO NATURAL HAZARDS
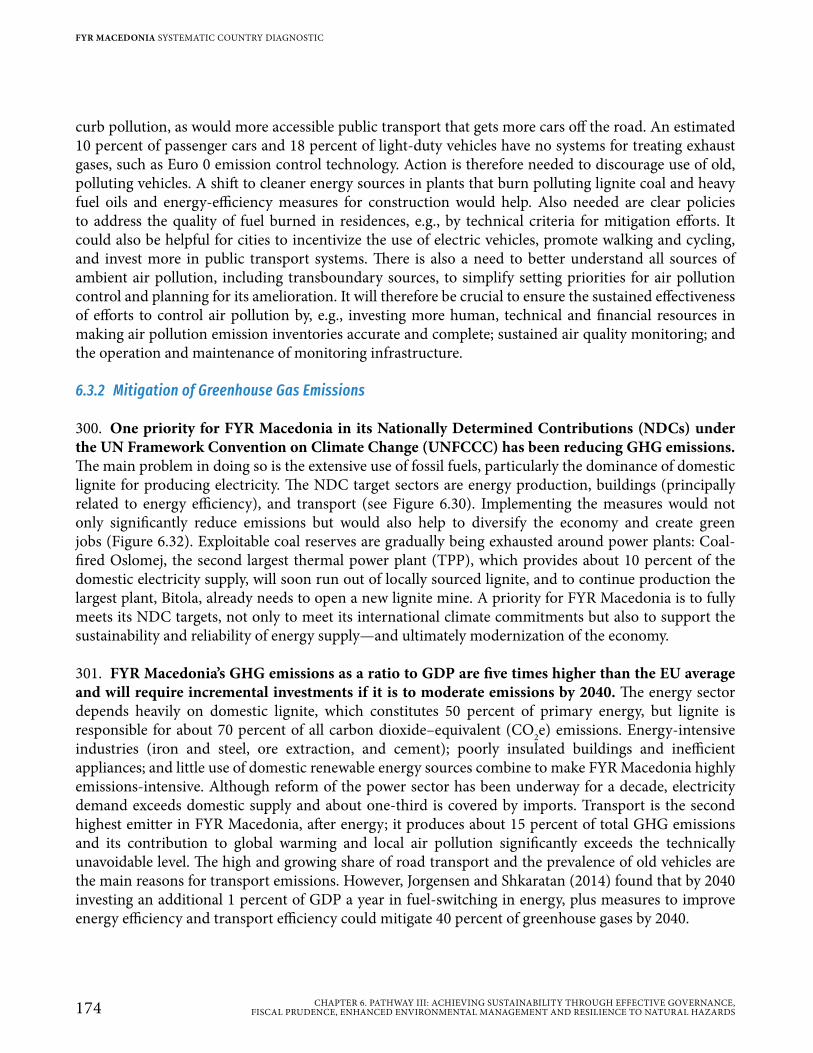
curb pollution, as would more accessible public transport that gets more cars off the road. An estimated 10 percent of passenger cars and 18 percent of light-duty vehicles have no systems for treating exhaust gases, such as Euro 0 emission control technology. Action is therefore needed to discourage use of old, polluting vehicles. A shift to cleaner energy sources in plants that burn polluting lignite coal and heavy fuel oils and energy-efficiency measures for construction would help. Also needed are clear policies to address the quality of fuel burned in residences, e.g., by technical criteria for mitigation efforts. It could also be helpful for cities to incentivize the use of electric vehicles, promote walking and cycling, and invest more in public transport systems. There is also a need to better understand all sources of ambient air pollution, including transboundary sources, to simplify setting priorities for air pollution control and planning for its amelioration. It will therefore be crucial to ensure the sustained effectiveness of efforts to control air pollution by, e.g., investing more human, technical and financial resources in making air pollution emission inventories accurate and complete; sustained air quality monitoring; and the operation and maintenance of monitoring infrastructure.
6.3.2 Mitigation of Greenhouse Gas Emissions
300. One priority for FYR Macedonia in its Nationally Determined Contributions (NDCs) under the UN Framework Convention on Climate Change (UNFCCC) has been reducing GHG emissions. The main problem in doing so is the extensive use of fossil fuels, particularly the dominance of domestic lignite for producing electricity. The NDC target sectors are energy production, buildings (principally related to energy efficiency), and transport (see Figure 6.30). Implementing the measures would not only significantly reduce emissions but would also help to diversify the economy and create green jobs (Figure 6.32). Exploitable coal reserves are gradually being exhausted around power plants: Coal-fired Oslomej, the second largest thermal power plant (TPP), which provides about 10 percent of the domestic electricity supply, will soon run out of locally sourced lignite, and to continue production the largest plant, Bitola, already needs to open a new lignite mine. A priority for FYR Macedonia is to fully meets its NDC targets, not only to meet its international climate commitments but also to support the sustainability and reliability of energy supply—and ultimately modernization of the economy.
301. FYR Macedonia’s GHG emissions as a ratio to GDP are five times higher than the EU average and will require incremental investments if it is to moderate emissions by 2040. The energy sector depends heavily on domestic lignite, which constitutes 50 percent of primary energy, but lignite is responsible for about 70 percent of all carbon dioxide–equivalent (CO2e) emissions. Energy-intensive industries (iron and steel, ore extraction, and cement); poorly insulated buildings and inefficient appliances; and little use of domestic renewable energy sources combine to make FYR Macedonia highly emissions-intensive. Although reform of the power sector has been underway for a decade, electricity demand exceeds domestic supply and about one-third is covered by imports. Transport is the second highest emitter in FYR Macedonia, after energy; it produces about 15 percent of total GHG emissions and its contribution to global warming and local air pollution significantly exceeds the technically unavoidable level. The high and growing share of road transport and the prevalence of old vehicles are the main reasons for transport emissions. However, Jorgensen and Shkaratan (2014) found that by 2040 investing an additional 1 percent of GDP a year in fuel-switching in energy, plus measures to improve energy efficiency and transport efficiency could mitigate 40 percent of greenhouse gases by 2040.
174 CHAPTER 6. PATHWAY III: ACHIEVING SUSTAINABILITY THROUGH EFFECTIVE GOVERNANCE, FISCAL PRUDENCE, ENHANCED ENVIRONMENTAL MANAGEMENT AND RESILIENCE TO NATURAL HAZARDS
FYR MACEDONIA SYSTEMATIC COUNTRY DIAGNOSTIC
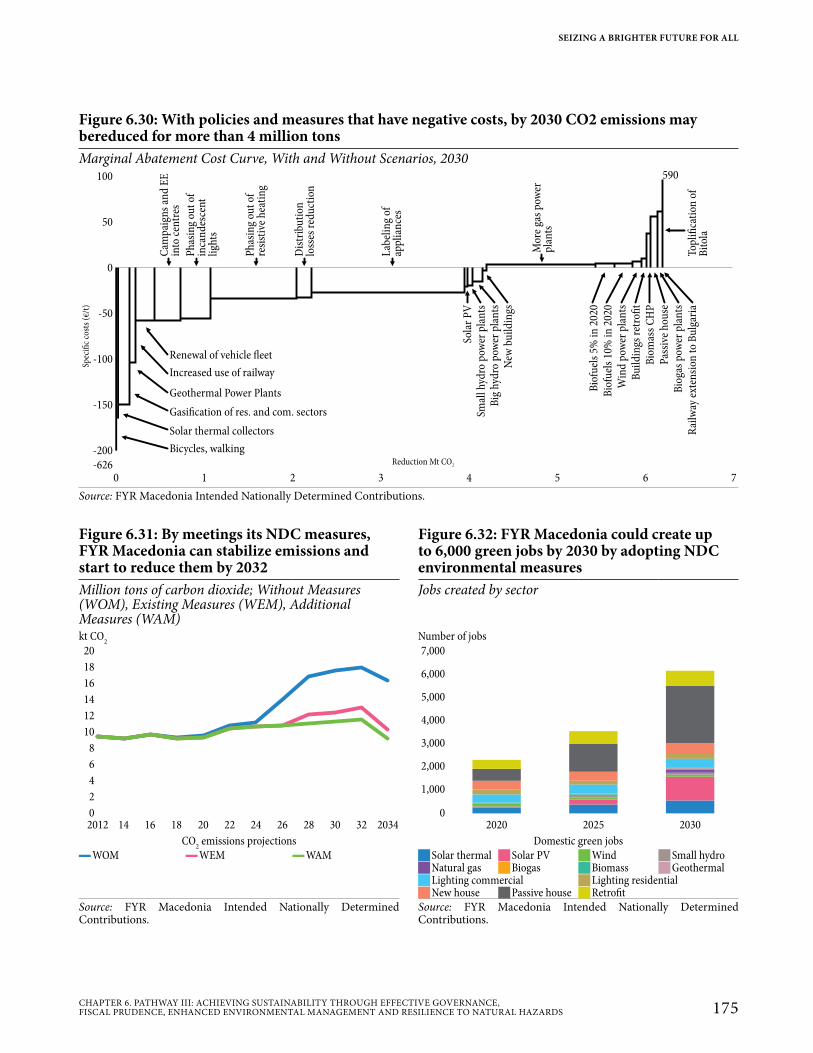
Figure 6.31: By meetings its NDC measures, FYR Macedonia can stabilize emissions and start to reduce them by 2032
Figure 6.32: FYR Macedonia could create up to 6,000 green jobs by 2030 by adopting NDC environmental measures
Million tons of carbon dioxide; Without Measures (WOM), Existing Measures (WEM), Additional Measures (WAM)
Jobs created by sector
kt CO2 Number of jobs20
18
16
14
12
10
8
6
4
2
0
2012 14 16 18 20 22 24 26 28 30 32 2034
7,000
6,000
5,000
4,000
3,000
2,000
1,000
0
2020 2025 2030
CO2 emissions projections Domestic green jobs ▬WOM ▬WEM ▬WAM JSolar thermal JSolar PV JWind JSmall hydro
JNatural gas JBiogas JBiomass JGeothermal JLighting commercial JLighting residential JNew house JPassive house JRetrofit
Source: FYR Macedonia Intended Nationally Determined Contributions.
Source: FYR Macedonia Intended Nationally Determined Contributions.
Figure 6.30: With policies and measures that have negative costs, by 2030 CO2 emissions may bereduced for more than 4 million tonsMarginal Abatement Cost Curve, With and Without Scenarios, 2030
100
50
0
-50
-100
-150
-200
-6260 1 2 3 4 5 6 7
Renewal of vehicle fleet
Increased use of railway
Geothermal Power Plants
Gasification of res. and com. sectors
Solar thermal collectors
Bicycles, walkingReduction Mt CO2
Cam
pai
gns
and
EE
into
cen
tres
Ph
asin
g ou
t of
inca
nd
esce
ntli
ghts
Ph
asin
g ou
t of
resi
stiv
e h
eati
ng
Dis
trib
uti
onlo
sses
red
uct
ion
Lab
elin
g of
app
lian
ces
Smal
l hyd
ro p
ower
pla
nts
Mor
e ga
s p
ower
plan
ts
Bio
fuel
s 5%
in 2
020
Win
d p
ower
pla
nts
Bio
gas
pow
er p
lan
tsTo
pli
fica
tion
of
Bit
ola
Sola
r P
V
Big
hyd
ro p
ower
pla
nts
New
bu
ild
ings
Bio
fuel
s 10
% in
202
0
Bu
ild
ings
ret
rofi
tB
iom
ass
CH
PP
assi
ve h
ouse
Rai
lway
ext
ens i
on t
o B
ulg
aria
590
Spec
ific
cost
s (�
/t)
Source: FYR Macedonia Intended Nationally Determined Contributions.
SEIZING A BRIGHTER FUTURE FOR ALL
175CHAPTER 6. PATHWAY III: ACHIEVING SUSTAINABILITY THROUGH EFFECTIVE GOVERNANCE, FISCAL PRUDENCE, ENHANCED ENVIRONMENTAL MANAGEMENT AND RESILIENCE TO NATURAL HAZARDS
Figure 6.33: The energy sector is the main generator of CO2e emissionsSource of CO2 emissions, FYR Macedonia and the EU, percent, 2009
FYR Macedonia EU
71
9
0.2
15
32
0.4
43
13
25
1
12
5
0.3
JElectricity and heat JManufacturing JConstruction JTransport JAgriculture JResidential JOthersSource: Jorgensen and Shkaratan (2014).
302. FYR Macedonia has an opportunity to move the energy sector to a low-carbon path, away from dependence on coal, and in the process, make the energy supply more secure and efficient.209 Building on recent significant institutional, legal, regulatory, and investment actions, the country can transition to a more affordable and less carbon-intensive development path by scaling-up energy efficiency interventions, investing in renewable energy sources, and further deepening its integration into the regional energy market. Currently, the Macedonian power sector depends on inefficient and outdated coal-fired generation and electricity imports. About 60 percent of the electricity supply comes from coal, mostly from a 40-year-old lignite-fired power plant in Bitola, operated by state-owned ELEM (Elektrani na Makedonija). Conventional hydropower meets up to 20 percent of electricity demand but hydrological conditions are quite volatile. By 2016 renewable energy generation had grown to over 7 percent of the power supply, driven by government feed-in tariffs for small hydropower, wind, solar photovoltaic, and power plants using biogas and biomass (Figure 6.34), Also, over the last 15 years, as electricity demand outpaced domestic supply, significant amounts have had to be imported; imports typically account for about one-third of the supply (Figure 6.35).
303. International environmental commitments are already pushing FYR Macedonia into action by establishing efficient energy targets. In the lead-up to the Paris Agreement, the country submitted its Interim Nationally Determined Contribution to UNFCCC in 2015, committing to a 30 percent reduction in carbon dioxide emissions from fossil fuel combustion by 2030. Like all parties to the Paris Agreement, the country committed to report on progress made and to update and resubmit its NDC by 2020. More immediately, it has committed to energy efficiency and renewable energy targets as a party to the Energy Community Treaty. However, compared to its neighbors, FYR Macedonia has been dilatory in transposing the Energy Community acquis and the Third Energy Package (Figure 6.36), though recent passage of the Energy Law is expected to significantly heighten compliance with the latter. As part
209 How basic services, such as electricity and water supply, are provided in FYR Macedonia does not seem to significantly undermine competitiveness. Prices are low by European standards and companies do not generally identify supply of these services as a constraint on doing business. However, the supply infrastructure is often outdated and there is a need for sustainable financial and operational policies to allow for maintenance and eventual replacement and maintenance. In the energy sector, outdated coal-fired plants need to be replaced by cleaner renewable energy and energy-efficiency programs that will lead the economy to a lower carbon future.
176 CHAPTER 6. PATHWAY III: ACHIEVING SUSTAINABILITY THROUGH EFFECTIVE GOVERNANCE, FISCAL PRUDENCE, ENHANCED ENVIRONMENTAL MANAGEMENT AND RESILIENCE TO NATURAL HAZARDS
FYR MACEDONIA SYSTEMATIC COUNTRY DIAGNOSTIC
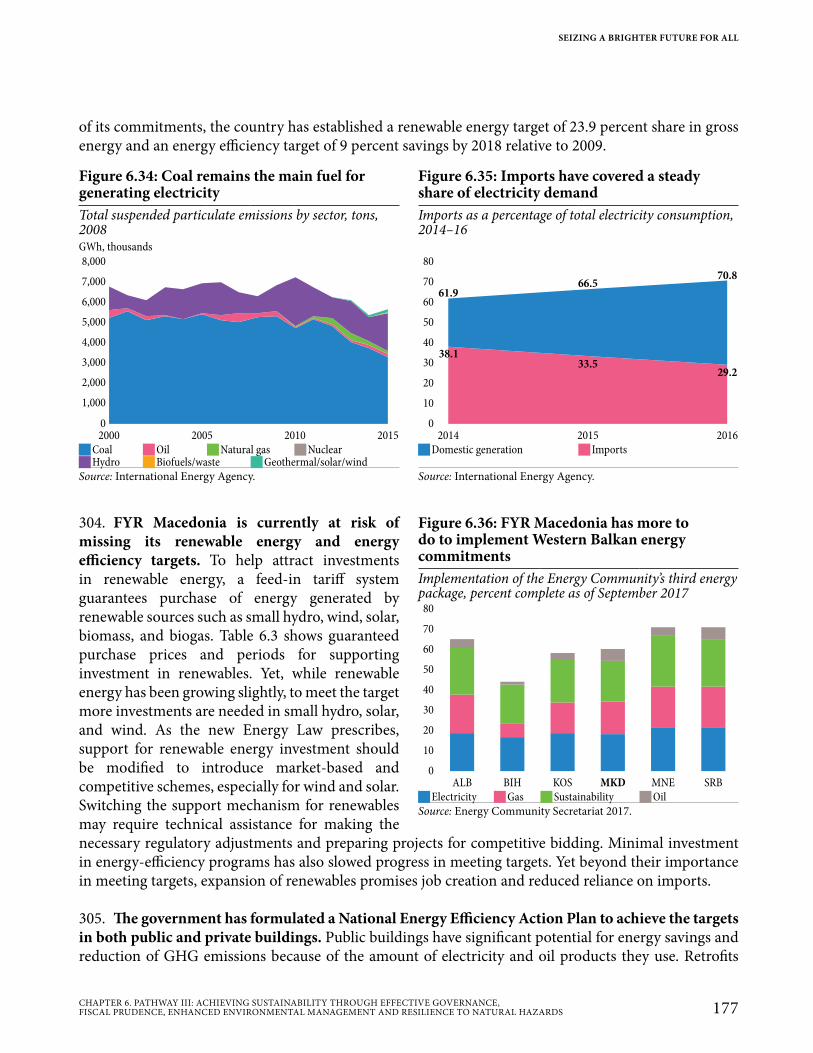
of its commitments, the country has established a renewable energy target of 23.9 percent share in gross energy and an energy efficiency target of 9 percent savings by 2018 relative to 2009.
304. FYR Macedonia is currently at risk of missing its renewable energy and energy efficiency targets. To help attract investments in renewable energy, a feed-in tariff system guarantees purchase of energy generated by renewable sources such as small hydro, wind, solar, biomass, and biogas. Table 6.3 shows guaranteed purchase prices and periods for supporting investment in renewables. Yet, while renewable energy has been growing slightly, to meet the target more investments are needed in small hydro, solar, and wind. As the new Energy Law prescribes, support for renewable energy investment should be modified to introduce market-based and competitive schemes, especially for wind and solar. Switching the support mechanism for renewables may require technical assistance for making the necessary regulatory adjustments and preparing projects for competitive bidding. Minimal investment in energy-efficiency programs has also slowed progress in meeting targets. Yet beyond their importance in meeting targets, expansion of renewables promises job creation and reduced reliance on imports.
305. The government has formulated a National Energy Efficiency Action Plan to achieve the targets in both public and private buildings. Public buildings have significant potential for energy savings and reduction of GHG emissions because of the amount of electricity and oil products they use. Retrofits
Figure 6.34: Coal remains the main fuel for generating electricity
Figure 6.35: Imports have covered a steady share of electricity demand
Total suspended particulate emissions by sector, tons, 2008
Imports as a percentage of total electricity consumption, 2014–16
GWh, thousands8,000
7,000
6,000
5,000
4,000
3,000
2,000
1,000
0
2000 2005 2010 2015
80
70
60
50
40
30
20
10
0
2014 2015 2016
61.966.5
70.8
38.133.5
29.2
JCoal JOil JNatural gas JNuclear JDomestic generation J Imports JHydro JBiofuels/waste JGeothermal/solar/wind
Source: International Energy Agency. Source: International Energy Agency.
Figure 6.36: FYR Macedonia has more to do to implement Western Balkan energy commitmentsImplementation of the Energy Community’s third energy package, percent complete as of September 2017
80
70
60
50
40
30
20
10
0ALB BIH KOS MKD MNE SRB
JElectricity JGas JSustainability JOilSource: Energy Community Secretariat 2017.
SEIZING A BRIGHTER FUTURE FOR ALL
177CHAPTER 6. PATHWAY III: ACHIEVING SUSTAINABILITY THROUGH EFFECTIVE GOVERNANCE, FISCAL PRUDENCE, ENHANCED ENVIRONMENTAL MANAGEMENT AND RESILIENCE TO NATURAL HAZARDS

to better insulate walls and windows and measures to improve heating systems can provide significant savings. Replacing electric or fuel oil heating with cleaner and more affordable options like modern biomass, district heating, and natural gas also has savings potential. Energy efficiency investments are already planned for schools and hospitals. The Ministry of Education plans to refurbish about 450 elementary and high schools at a cost of €20 million, with cumulative energy savings estimated at 13.6 ktoe by 2018.
306. The region has options for promoting green mobility and shifting transport systems to a low-carbon path. As part of the global effort to combat climate change, Western Balkan countries have identified policies and programs under the NDC to achieve their targets for reducing GHG emissions, of which transport contributes a significant share. For instance, GHG emissions in Serbia went up by 9 percent in 2000–14, largely because of higher transport emissions. Modernizing transport systems will therefore be important for climate-change mitigation. More sustainable urban transport systems can be brought about by promoting walking, cycling, and public transport as replacements for motor vehicles. Inefficient vehicles can be replaced by the latest engine technology and by electro-mobility. Finally, a shift from road to rail will reduce emissions from long-distance movement of freight.
6.3.3 Resilience to Natural Disasters and Climate Change
307. FYR Macedonia has relatively little resilience to natural hazards and climate change, even though it is regularly threatened by floods, earthquakes, forest fires, droughts, landslides, and extreme temperatures.210 Since 1990, the country has suffered 23 severe disasters that caused more than US$409 million in direct damage.211 With climate change, the annual damage to critical infrastructure
210 Global Facility for Disaster Reduction and Recovery Think Hazard platform: www.thinkhazard.org.211 Among these were flood, drought, wildfire, extreme temperature, and earthquake. To be classified as such, a disaster must meet at
least one of the following criteria: 10 or more dead, 100 or more affected, declaration of state of emergency or a call for international assistance (EM-DAT).
Table 6.3: Feed-in tariffs provide support for renewable energyTechnology, plant size, tariff, and period
Renewable technology
Maximum plant size Applicable to: Feed-in tariff
(€c/kWh) Fixed tariff period
Small hydropower 10 MW
Production of:
20 years
1–85,000 kWh/mo 12.0085,000–170,000 kWh/mo 8.00
170,000–350,000 kWh/mo 6.00350,000–700,000 kWh/mo 5.00Above 700,000 kWh/mo 4.50
Wind-power 50 MW All plant sizes 8.9 20 years
Solar 1 MWPlant size:
15 yearsLess than 0.05 MW 16More than 0.05 MW 12
Biomass 3 MW All plants 15 15 yearsBiogas / All plants 18 15 years
Source: Energy Community Secretariat.
178 CHAPTER 6. PATHWAY III: ACHIEVING SUSTAINABILITY THROUGH EFFECTIVE GOVERNANCE, FISCAL PRUDENCE, ENHANCED ENVIRONMENTAL MANAGEMENT AND RESILIENCE TO NATURAL HAZARDS
FYR MACEDONIA SYSTEMATIC COUNTRY DIAGNOSTIC

from related hazards is expected to double by 2020212 and by 2080 it could be more than five times higher.213 A major flood or earthquake could derail economic growth, damage or destroy critical infrastructure, slash agricultural incomes, and disrupt rural livelihoods (Figure 6.37). Compared to neighboring countries, FYR Macedonia has relatively little resilience to possible asset losses in terms of, e.g., early warnings or protection from the financial shock associated with disasters.214
308. Macedonian infrastructure is becoming considerably more vulnerable to weather and climate impacts because of climate change and its relatively low adaptive capacity. For the next four decades, the average annual increase in temperature is expected to be about 1.8°C—after increasing on average by less than 0.2°C per year for the last 50 years.215 Risks are rising for power plants, transmission lines, telephone lines, roads, railways, airports, ports, water and sewer infrastructure (including storm water drainage), health facilities, schools, and municipal buildings. FYR Macedonia’s resilience to disaster and climate risks is also compromised by a general lack of compliance with measures like building codes and disaster- and climate-informed land use plans. Nor are its aging buildings and infrastructure well-maintained. The lack of institutional and financial capacity to deal with disasters exacerbates the impacts, particularly for the poor. Along with risks and vulnerability, climate change also leads to higher infrastructure costs. For instance, in transport, the projected increase in severe weather events is expected to heighten the costs of both capital projects and operations and maintenance unless there is climate-resilient planning and investment.
309. FYR Macedonia is projected to have a 20 percent chance of another severe drought in the next 10 years.216 Agriculture is the most vulnerable sector. As climate change causes more frequent droughts, the number of people affected would increase by an estimated 700 percent and crop yields could drop by 20 percent.217 As temperatures rise and precipitation becomes more variable, droughts will particularly affect southern and eastern FYR Macedonia, which will jeopardize not only agriculture but also water quality. Irrigation will not be able to keep up with rising need. In river basins where major shortages of irrigation water are expected, by 2050 yields for nearly all crops are projected to be lower by 20–60 percent; however, where water shortages are not expected, production of cereals in particular could benefit from the warmer climate. A detailed assessment of climate risks to agriculture in 2013 made it clear that the rural poor will be disproportionately affected by climate change. Where there is drought, areas affected by wildfire could double.218
310. The flood risk in FYR Macedonia is higher than in any other country in the ECA region, and by 2080 the impact of floods on its GDP is expected to quadruple.219 In January and February 2015 major floods affected 170,000 people in 43 of the country’s 80 municipalities and caused damage of €35.7 million. Flood risk is particularly high in Skopje. There, the frequency of flash floods has been rising because of human activity as well as climate change. In December 2010, the Vardar river overflowed,
212 Forzieri et al. (2018), “Escalating impacts of climate extremes on critical infrastructures in Europe”.213 World Bank (2016a), Country Risk Profiles for Floods and Earthquakes, Europe and Central Asia.214 Hallegatte et al. (2016).215 http://documents.worldbank.org/curated/en/356081468300722859/pdf/815900PUB0Redu00Box379836B00PUBLIC0.pdf.216 See: www.thinkhazard.org.217 Joint EU Research Center (2014).218 World Bank (2013b).219 In terms of relative GDP potentially affected by flooding. See: World Bank (2016a).
SEIZING A BRIGHTER FUTURE FOR ALL
179CHAPTER 6. PATHWAY III: ACHIEVING SUSTAINABILITY THROUGH EFFECTIVE GOVERNANCE, FISCAL PRUDENCE, ENHANCED ENVIRONMENTAL MANAGEMENT AND RESILIENCE TO NATURAL HAZARDS
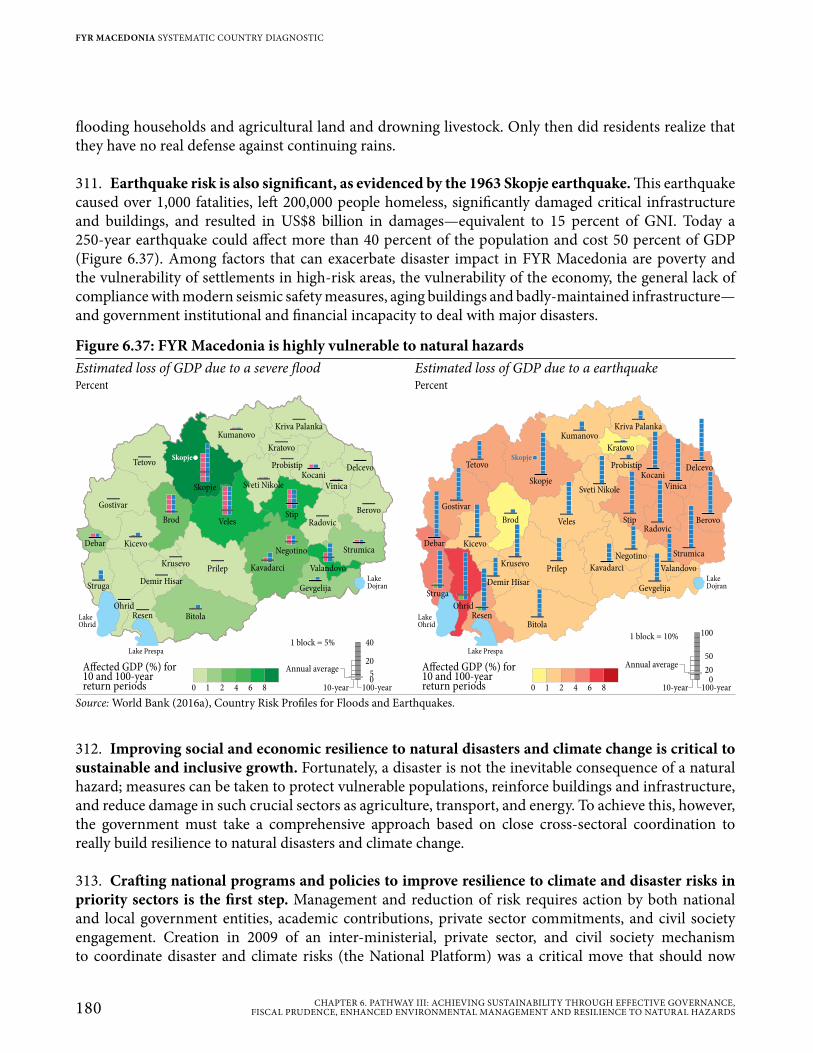
flooding households and agricultural land and drowning livestock. Only then did residents realize that they have no real defense against continuing rains.
311. Earthquake risk is also significant, as evidenced by the 1963 Skopje earthquake. This earthquake caused over 1,000 fatalities, left 200,000 people homeless, significantly damaged critical infrastructure and buildings, and resulted in US$8 billion in damages—equivalent to 15 percent of GNI. Today a 250-year earthquake could affect more than 40 percent of the population and cost 50 percent of GDP (Figure 6.37). Among factors that can exacerbate disaster impact in FYR Macedonia are poverty and the vulnerability of settlements in high-risk areas, the vulnerability of the economy, the general lack of compliance with modern seismic safety measures, aging buildings and badly-maintained infrastructure—and government institutional and financial incapacity to deal with major disasters.
312. Improving social and economic resilience to natural disasters and climate change is critical to sustainable and inclusive growth. Fortunately, a disaster is not the inevitable consequence of a natural hazard; measures can be taken to protect vulnerable populations, reinforce buildings and infrastructure, and reduce damage in such crucial sectors as agriculture, transport, and energy. To achieve this, however, the government must take a comprehensive approach based on close cross-sectoral coordination to really build resilience to natural disasters and climate change.
313. Crafting national programs and policies to improve resilience to climate and disaster risks in priority sectors is the first step. Management and reduction of risk requires action by both national and local government entities, academic contributions, private sector commitments, and civil society engagement. Creation in 2009 of an inter-ministerial, private sector, and civil society mechanism to coordinate disaster and climate risks (the National Platform) was a critical move that should now
Figure 6.37: FYR Macedonia is highly vulnerable to natural hazardsEstimated loss of GDP due to a severe flood Estimated loss of GDP due to a earthquakePercent Percent
LakeDojran
LakeOhrid
Lake Prespa
Delcevo
Berovo
Strumica
RadovicStip
KocaniProbistip
Kratovo
Kriva PalankaKumanovo
Skopje
Tetovo
Gostivar
Debar
Struga
OhridResen Bitola
Demir Hisar
KrusevoPrilep
Brod
Kicevo
Kavadarci
Negotino
Veles
Gevgelija
Valandovo
Skopje
Sveti Nikole Vinica
40
20
05
10-year 100-year
Annual average
0 1 2 4 6 8
Affected GDP (%) for10 and 100-yearreturn periods
1 block = 5%
LakeDojran
LakeOhrid
Lake Prespa
Delcevo
Berovo
Strumica
RadovicStip
KocaniProbistip
Kratovo
Kriva PalankaKumanovo
Skopje
Tetovo
Gostivar
Debar
Struga
OhridResen
Bitola
Demir Hisar
KrusevoPrilep
Brod
Kicevo
Kavadarci
Negotino
Veles
Gevgelija
Valandovo
Skopje
Sveti Nikole Vinica
100
50
020
10-year 100-year
Annual average
0 1 2 4 6 8
Affected GDP (%) for10 and 100-yearreturn periods
1 block = 10%
Source: World Bank (2016a), Country Risk Profiles for Floods and Earthquakes.
180 CHAPTER 6. PATHWAY III: ACHIEVING SUSTAINABILITY THROUGH EFFECTIVE GOVERNANCE, FISCAL PRUDENCE, ENHANCED ENVIRONMENTAL MANAGEMENT AND RESILIENCE TO NATURAL HAZARDS
FYR MACEDONIA SYSTEMATIC COUNTRY DIAGNOSTIC
be carried forward. It is also essential that FYR Macedonia make progress on its commitments in the international 2015 Sendai Framework for Disaster Risk Reduction220 and begin to comply with such relevant legislation as the EU flood directive,221 the EU Inspire Directive222 to create spatial data, the Eurocode223 on building standards, and the EU Civil Protection Mechanism,224 which coordinates member state action in the field of civil protection.
314. Financial resilience after a disaster can be improved by sovereign access to rapid and flexible financing and by insuring private and public assets. Government access to fast, predictable, and flexible financing for disaster response, recovery, and reconstruction has proved to reduce the social, physical, and fiscal impacts. In FYR Macedonia, laws make it possible to mobilize funds for disaster response by amending the budget to allow diversion of planned funds. Though municipalities should have resources set aside for disaster response and prevention, in practice this is rare. As an EU candidate, FYR Macedonia will have access to the EU Solidarity Fund, which provides recovery and reconstruction funding in national and regional disasters for specified expenses and covers about 5 percent of direct damage costs. Insurance is one way to reduce contingent liabilities, but to ensure deep insurance penetration requires a combination of access to insurance, compulsion measures, culture change, and fiscal and political discipline. Currently, catastrophic insurance can be accessed via the Europa Reinsurance Facility (Europa Re) and national and local insurance companies;225 however, depending on the peril covered, in 2015 insurance penetration in FYR Macedonia was only 1 to 2 percent. Among the reasons for the low demand were lack of compulsion measures and previous provision of post-disaster subsidies and payouts to homeowners and farmers that raised expectations that the government would cover future losses.
315. Given the country’s recent experience with severe disasters, improving the emergency response system should be a national priority. This requires enhancing early warning systems, modernizing search and rescue equipment, integrating preparedness and response procedures into all sectors. and creating information campaigns to raise the awareness of local communities about exposure levels and protective measures. Modernizing the national hydro-meteorological agencies will bring significant benefits in terms of more accurate and timely warnings of extreme weather events. It would also make it possible to optimize river management for flood and drought protection, enhance agricultural management—all critical for long-term climate adaptation—and enable the government to fulfill the country’s international treaty obligations. Ensuring universal access to warnings of extreme events and options for reducing risks could also enhance mitigation: technological innovations are making it easier and cheaper to use cell phones and both social and traditional media to disseminate warnings. Similarly, access to information on earthquake risk and what can be done to protect homes and family can substantially reduce injuries and the need for aid immediately after a disaster. Finally, more work is needed on the common platform for reporting emergencies, the E-112 emergency call system.226
220 https://www.preventionweb.net/files/globalplatform/macedonia.pdf.221 http://ec.europa.eu/environment/water/flood_risk/implem.htm.222 http://inspire.ec.europa.eu/223 http://eurocodes.jrc.ec.europa.eu/224 http://ec.europa.eu/echo/what/civil-protection/mechanism_en225 Developed as part of the SEEC CRIF World Bank Project (P110910).226 An EU Directive: Regulation 236/2014.
SEIZING A BRIGHTER FUTURE FOR ALL
181CHAPTER 6. PATHWAY III: ACHIEVING SUSTAINABILITY THROUGH EFFECTIVE GOVERNANCE, FISCAL PRUDENCE, ENHANCED ENVIRONMENTAL MANAGEMENT AND RESILIENCE TO NATURAL HAZARDS
6.3.4 Natural Resource Management
316. FYR Macedonia needs to manage its natural resource assets more efficiently, both to support future economic growth and to open up a greener and more resilient path. A healthy natural environment is also necessary to give its citizens a good quality of life—an end in itself but also a useful deterrent to the migration of younger generations. One area where closer connections are needed between natural resources and economic management is tourism. FYR Macedonia has a rich endowment of natural resources and a choice of Mediterranean, mountain, and continental climates that make it suitable for both winter and summer tourism. Its 2009–13 National Tourism Development Strategy (NTDS) cited the country’s vision of becoming a global natural- and cultural-heritage-based tourism destination.
317. Inefficiencies in water and wastewater management jeopardize resource sustainability. Water prices are set below costs, driving up financial losses and delaying overdue investment. Although metering is estimated at a high 84 percent, commercial and technical losses of water are estimated at 63 percent, 100.6 m3/km/day—also quite high by international standards.227 Sewerage blockages average 5.5 per km; the standard benchmark is less than 0.5 per km. One reason for this problem is aging and badly-maintained infrastructure. The cumulative cost of catch-up maintenance and rehabilitation is estimated at close to 4 percent of GDP. Moreover, although the billing collection rate is good at 92 percent, collection can take more than 420 days. Arrears to utilities may well be a threat to their financial and operational sustainability. With average staffing of 8.2 per 1,000 connections (not far from the regional average), the Macedonian water sector is much less productive, considering that international best practices are 1 to 2. The lack of productivity is largely a consequence of atomization of the sector and of direct local government control of utility staffing and management.
318. Greater agricultural resilience and productivity would also promote sustainable growth. Because it provides almost 20 percent of much-needed jobs and has tremendous potential for exports, agriculture is a strategic sector for FYR Macedonia. But it has a large productivity gap with other ECA countries, and it is also the sector most directly harmed by a changing climate. Both water scarcity and demand for irrigation are expected to rise; irrigation is already insufficient and poorly designed for today’s small farms. Many farms depend on local wells and unsustainable extracted groundwater, which is neither regulated nor priced.228 Current income support programs still promote production of rain-dependent crops like rice, sunflowers, and tobacco. FYR Macedonia is also confronted by significant land degradation caused by, e.g., salinization, desertification, and erosion, which in turn exacerbates the negative effects on agriculture of natural hazards. Productivity is low because farms are small and fragmented, land markets underdeveloped, and government subsidy programs poorly designed.229
227 World Bank (2015c).228 World Bank (2014b).229 World Bank (2016a, 2017e).
FYR Macedonia Systematic Country Diagnostic | Seizing a Brighter Future for All
182 CHAPTER 6. PATHWAY III: ACHIEVING SUSTAINABILITY THROUGH EFFECTIVE GOVERNANCE, FISCAL PRUDENCE, ENHANCED ENVIRONMENTAL MANAGEMENT AND RESILIENCE TO NATURAL HAZARDS
FYR MACEDONIA SYSTEMATIC COUNTRY DIAGNOSTIC

FYR Macedonia Systematic Country Diagnostic | Seizing a Brighter Future for All
Simonida Filipova KitanovskaHome Coming
Chapter 7. Priorities for Achieving Faster, More Inclusive, and Sustainable Growth
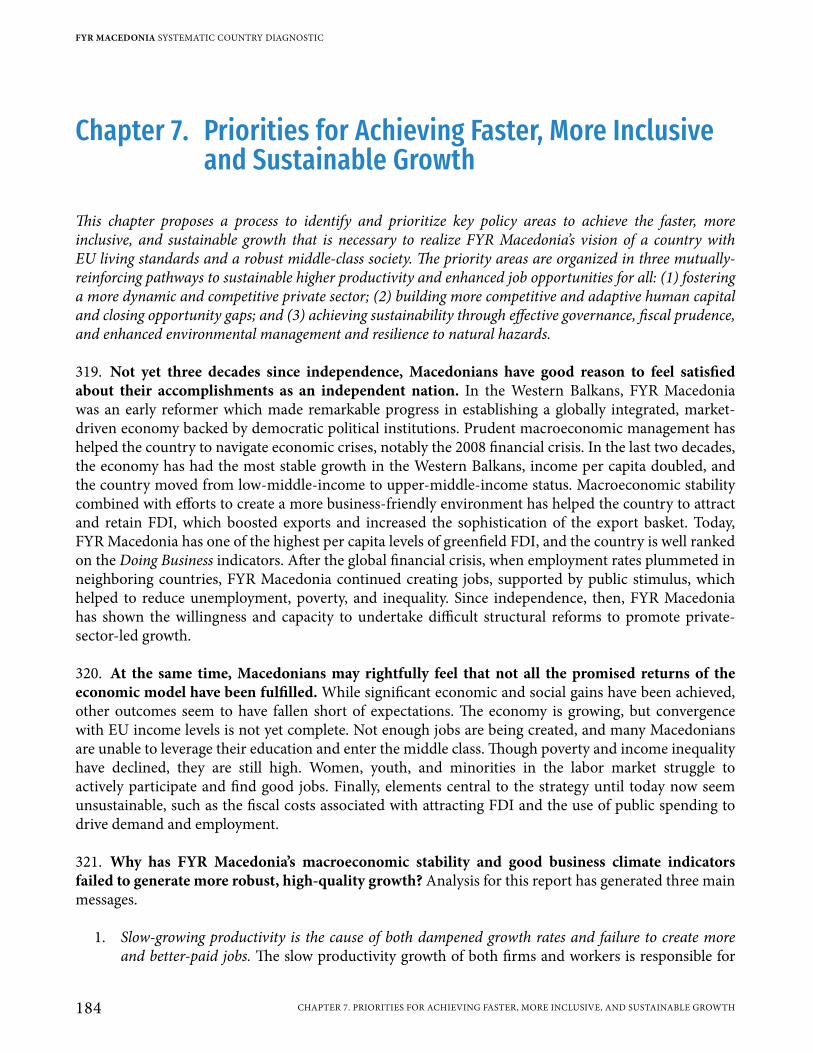
Chapter 7. Priorities for Achieving Faster, More Inclusive and Sustainable Growth
This chapter proposes a process to identify and prioritize key policy areas to achieve the faster, more inclusive, and sustainable growth that is necessary to realize FYR Macedonia’s vision of a country with EU living standards and a robust middle-class society. The priority areas are organized in three mutually-reinforcing pathways to sustainable higher productivity and enhanced job opportunities for all: (1) fostering a more dynamic and competitive private sector; (2) building more competitive and adaptive human capital and closing opportunity gaps; and (3) achieving sustainability through effective governance, fiscal prudence, and enhanced environmental management and resilience to natural hazards.
319. Not yet three decades since independence, Macedonians have good reason to feel satisfied about their accomplishments as an independent nation. In the Western Balkans, FYR Macedonia was an early reformer which made remarkable progress in establishing a globally integrated, market-driven economy backed by democratic political institutions. Prudent macroeconomic management has helped the country to navigate economic crises, notably the 2008 financial crisis. In the last two decades, the economy has had the most stable growth in the Western Balkans, income per capita doubled, and the country moved from low-middle-income to upper-middle-income status. Macroeconomic stability combined with efforts to create a more business-friendly environment has helped the country to attract and retain FDI, which boosted exports and increased the sophistication of the export basket. Today, FYR Macedonia has one of the highest per capita levels of greenfield FDI, and the country is well ranked on the Doing Business indicators. After the global financial crisis, when employment rates plummeted in neighboring countries, FYR Macedonia continued creating jobs, supported by public stimulus, which helped to reduce unemployment, poverty, and inequality. Since independence, then, FYR Macedonia has shown the willingness and capacity to undertake difficult structural reforms to promote private-sector-led growth.
320. At the same time, Macedonians may rightfully feel that not all the promised returns of the economic model have been fulfilled. While significant economic and social gains have been achieved, other outcomes seem to have fallen short of expectations. The economy is growing, but convergence with EU income levels is not yet complete. Not enough jobs are being created, and many Macedonians are unable to leverage their education and enter the middle class. Though poverty and income inequality have declined, they are still high. Women, youth, and minorities in the labor market struggle to actively participate and find good jobs. Finally, elements central to the strategy until today now seem unsustainable, such as the fiscal costs associated with attracting FDI and the use of public spending to drive demand and employment.
321. Why has FYR Macedonia’s macroeconomic stability and good business climate indicators failed to generate more robust, high-quality growth? Analysis for this report has generated three main messages.
1. Slow-growing productivity is the cause of both dampened growth rates and failure to create more and better-paid jobs. The slow productivity growth of both firms and workers is responsible for
FYR MACEDONIA SYSTEMATIC COUNTRY DIAGNOSTIC
184 CHAPTER 7. PRIORITIES FOR ACHIEVING FASTER, MORE INCLUSIVE, AND SUSTAINABLE GROWTH
the slow pace of income convergence with European standards and the modest job creation to date. Slow labor productivity growth precludes wage growth, and low labor force participation impedes social inclusion. It appears that the Macedonian economy tends to misallocate labor and capital, shifting them to less-productive activities and keeping the economy from operating near its production possibility frontier. Most jobs are in industries with low productivity and low wages. Yet, the country has highly productive firms (“gazelles”) that have been creating high-quality jobs. It is thus important to establish the conditions necessary to allow other firms to grow and create jobs.
2. Promoting social inclusion is not only an end in itself, it is also vital to spur needed productivity improvements. Obstacles to inclusion in FYR Macedonia prevent people from accumulating assets (primarily human capital but also capital and land) and getting an adequate return on these assets. The labor force suffers, for example, because only 50 percent of working-age Macedonians are employed, and about 40 percent are inactive (neither employed nor looking for a job). And most people actively seeking employment have been without a job for more than a year. Further, FYR Macedonia’s population is expected to decline in coming years as birth rates fall and emigration persists, which further highlights the urgency to leverage untapped human capital. The challenge ahead is significant: just to catch up with the average employment rate of upper-middle-income countries, FYR Macedonia needs to create 300,000 jobs—more than double the number created in the past decade. Job growth must be faster to prevent further erosion of the labor force driven by emigration and disengagement from the labor market.
3. Effective governance, fiscal sustainability, and enhanced environmental management and resilience are vital to protect hard-won economic and social gains. The analysis of the bottlenecks to growth, inclusion, and sustainability in FYR Macedonia exposes issues related to the quality of state institutions, such as law enforcement, institutional capacity, and the accountability of government toward. These underlie the challenges to growth, inclusion, and sustainability and are affecting trust in government. The public sector’s active role in job creation casts doubt on the sustainability of recent progress, because there is now not enough fiscal space to continue supporting employment growth through public works. Environmental fragility, with high levels of air pollution, and vulnerability and low resilience to natural hazards and climate change jeopardize the sustainability of human, physical, and natural capital.
322. To converge with European incomes and build a robust middle-class society, FYR Macedonia must increase firm and worker productivity and enhance job opportunities for all. Although public investment successfully stabilized economic activity in the last decade, faster and sustained growth can only occur if it is led by the private sector. But for the private sector to accelerate growth, there must be a significant structural change in the economy, with capital and labor allocated to more productive firms and sectors of activity, and with firms enhancing their capabilities not just to compete in the global economy but also to innovate. Addressing barriers to private sector development would help attract private investment, increase exports and make them more sophisticated, and consolidate the integration of FYR Macedonia with regional and global trading partners and into global value chains. Further, as shown in Chapter 2, eradicating poverty and growing the middle class is only possible if Macedonian citizens can fully exploit their productive potential and increase their labor incomes. For this purpose, it is crucial to raise the quality of human capital and close gaps in access to economic opportunities, for
SEIZING A BRIGHTER FUTURE FOR ALL
185CHAPTER 7. PRIORITIES FOR ACHIEVING FASTER, MORE INCLUSIVE, AND SUSTAINABLE GROWTH
which it is necessary to remove barriers and disincentives that discourage people, especially women and minorities, from becoming actively participating in the labor market.
323. Sustaining these outcomes over the long term will require building resilience across several fronts. Because the Macedonian economy is small and vulnerable to shocks, to sustain high-quality growth it must not only be productive and inclusive, but also resilient. State institutions must be responsive to the needs of businesses and citizens. Developing capable and accountable state institutions, both national and local, is necessary to being able to design and implement policies in a coordinated and efficient manner while ensuring the rule of law. Fiscal sustainability is needed to support productivity growth, protect the economy against shocks, and improve delivery of public services to ensure greater opportunities for all. Better environmental management and resilience against disaster and climate risks would help sustain economic growth and protect the most vulnerable.
7.1 Prioritization Criteria
324. A set of priorities were identified by applying three filters: the expected impact on one or both objectives (increasing productivity and enhancing job opportunities for all), the presence of synergies, and the support to the sustainability of both objectives. The prioritization exercise first considered the extent to which a policy area would have substantial impacts on the two objectives. For example, investing in human capital would have positive effects both on productivity and jobs. Second, emphasis was given to synergies, that is, whether improvements in one area could help address challenges in other areas. And third, the exercise assessed whether a policy area supported the sustainability of both objectives. For instance, reducing fiscal risks and improving the efficiency of public spending would ensure that any additional investments in human capital and other priority areas can be sustained over time. More weight was given to areas where the evidence base is stronger.
Figure 7.1: The keys for faster, more inclusive, and sustainable growth in FYR Macedonia
Increasingproductivity
Enhancing jobopportunities
for all
Achieving sustainability
Effectivegovernance
Fiscalprudence
Enhanced environmentalmanagement and resilience
to natural hazardsSource: Authors.
FYR MACEDONIA SYSTEMATIC COUNTRY DIAGNOSTIC
186 CHAPTER 7. PRIORITIES FOR ACHIEVING FASTER, MORE INCLUSIVE, AND SUSTAINABLE GROWTH

325. The priority setting exercise was conducted in a two-stage process. In the first stage, based on the evidence and analysis in the SCD, broad priority areas were identified. The second stage derives a qualitative impact (based on experts’ opinions) of the policy priorities.
326. Ten priority areas were identified in the first stage to support the three pathways (Figure 7.2). On Pathway I, four priority areas would foster a more dynamic and competitive private sector. On Pathway II, three priority areas would develop more competitive human capital and close opportunity gaps. On Pathway III, three priority areas would ensure economic, environmental, and social sustainability. These are related to the proposed analytical framework: increasing productivity in the economy, enhancing job opportunities for all, and achieving sustainability. As an example, the diagnostic shows that one of the main obstacles to increase productivity is that firms in FYR Macedonia have weak capacity to adopt recent technologies and compete in the global economy which result in low levels of innovation, limited linkages between the export-oriented FDI firms in the country and the domestic ones, and low survival rates of exporters. Accordingly, a policy priority area identified is the strengthening of firm-level capabilities and the ecosystem for technology adoption, altogether with improved access to finance. In a similar way, a key constraint for enhancing job opportunities is the need to improve skills to compete. In consequence, a priority area identified is the need to improve access to quality and relevant education.
327. Many policy areas are closely connected. For instance, enhancing trade connectivity and fostering market competition will help increase firm productivity and widen the range of job opportunities. Modernizing agriculture would increase productivity in the sector and provide jobs for the unskilled, and also help the process of value chain integration. Similarly, building skills throughout the life cycle will heighten the ability of the labor force to perform higher-skilled jobs and adapt to new demands, which will in turn improve the productivity of firms. One policy area stands out as it affects all other policy areas: the need to enhance governance by improving the rule of law, public sector capacity, and the accountability of state institutions. The following subsections describe in detail the specific policy actions identified for each priority area and how they are related to the prioritization criteria.
Figure 7.2: Pathways to faster, more inclusive, and sustainable growth in FYR Macedonia
Pathway I:Fostering a more dynamic
and competitive private sector
Pathway II:Developing competitive and
adaptive human capitaland closing opportunity gaps
Pathway III:Achieving sustainability through
effective governance, fiscal prudence,and enhanced environmentalmanagement and resilience
to natural hazards
� Enhance trade connectivity and valuechain integration
� Promote market competition andestablish a world-class business climate
� Foster agricultural modernization
� Strengthen firm capabilities, and theecosystem for technology adoption andaccess of firms to finance
� Endow people with quality and relevantskills throughout the life cycle
� Reduce disincentives and removebarriers to labor market participation,especially for women
� Protect human capital by shielding poorand vulnerable households from shocksand investing in preventive medicineand primary care
� Invest in an integrated strategy toreduce air pollution, promote low-carbon growth, and build resilience tonatural hazards and climate change
� Ensure fiscal sustainability by reducingfiscal risks, improving the efficiency ofspending, and enhancing revenuemobilization
� Secure rule of law and build capablepublic institutions that are accountableto citizens
SEIZING A BRIGHTER FUTURE FOR ALL
187CHAPTER 7. PRIORITIES FOR ACHIEVING FASTER, MORE INCLUSIVE, AND SUSTAINABLE GROWTH

328. In the second stage, the SCD team focused on identifying the more critical priorities areas among the ones selected. To that end, the team consulted with a group of thematic experts and experts familiar with the Macedonian economy, which helped to develop a ranking of the list of priority areas. Based on this assessment, the policy priorities are grouped and ranked based on their expected impact on increasing productivity, enhancing job opportunities for all, and achieving sustainability. While all priority areas are expected to have a high impact, a subset of them emerged as having the highest possible impact. Table 7.1 presents the results of the second-stage prioritization. Furthermore, for each of the ten priority areas, the SCD team proposes selected policy actions (or What would it take?), giving more specificity to the policy agenda. These specific actions are presented in detail next. Table 7.2 summarizes key challenges for each of the priority areas.
Table 7.1: Policy Areas According to the Prioritization Criteria
Priority Policy Areas Increasing Productivity
Enhance job opportunities
for allAchieving
Sustainability
Hig
hest
Exp
ecte
d Im
pact 1. Secure rule of law and build capable public
institutions that are accountable toward citizens2. Endow people with quality and relevant skills
throughout the life cycle3. Strengthen firm capabilities and the ecosystem for
technology adoption and access of firms to finance4. Enhance trade connectivity and value chain
integration5. Promote market competition and establish a world-
class business climate
Hig
h Ex
pect
ed Im
pact
6. Reduce disincentives and remove barriers to labor market participation, especially for women
7. Ensure fiscal sustainability by reducing fiscal risks, improving the efficiency of spending, and enhancing revenue mobilization
8. Invest in an integrated strategy to reduce air pollution, promote low-carbon growth, and build resilience to natural hazards and climate change
9. Protect human capital by shielding poor and vulnerable households from shocks and investing in preventive medicine and primary care
10. Foster agricultural modernization Color by expected impact: J Highest J High J MediumSource: Authors.
Table 7.2: Summary of Key Challenges by Priority AreaFindings from the SCD Priority Area
Pathway I: Fostering a more dynamic and competitive private sectorPoor logistics performance, especially on customs clearance time and costs (it costs a firm in FYR Macedonia US$148 to complete export procedures, compared with US$54 for firms in aspirational peers) and quality of logistics services. Nontariff barriers contribute to delays in custom clearance (e.g. double inspections at borders-crossings) and prevent the expansion and agglomeration of industries for services exports in the sub-region (e.g. lack of mutual recognition of degrees).
Enhance trade connectivity and value chain integration
FYR MACEDONIA SYSTEMATIC COUNTRY DIAGNOSTIC
188 CHAPTER 7. PRIORITIES FOR ACHIEVING FASTER, MORE INCLUSIVE, AND SUSTAINABLE GROWTH
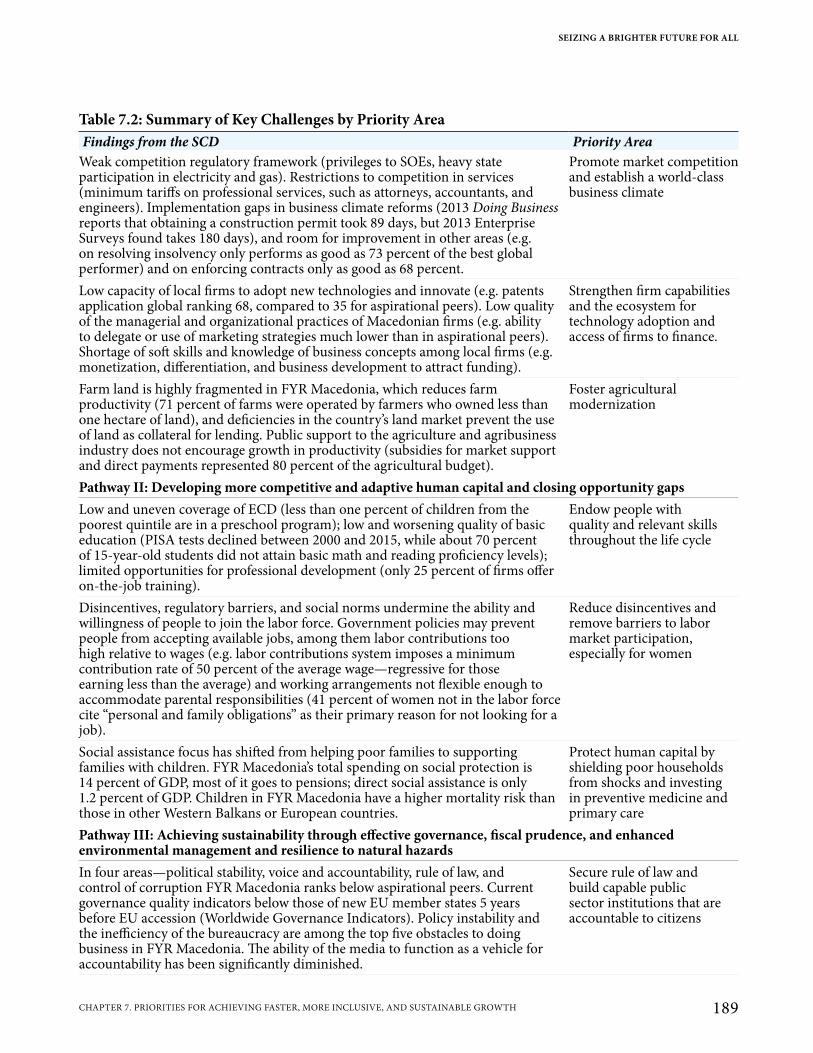
Table 7.2: Summary of Key Challenges by Priority AreaFindings from the SCD Priority Area
Weak competition regulatory framework (privileges to SOEs, heavy state participation in electricity and gas). Restrictions to competition in services (minimum tariffs on professional services, such as attorneys, accountants, and engineers). Implementation gaps in business climate reforms (2013 Doing Business reports that obtaining a construction permit took 89 days, but 2013 Enterprise Surveys found takes 180 days), and room for improvement in other areas (e.g. on resolving insolvency only performs as good as 73 percent of the best global performer) and on enforcing contracts only as good as 68 percent.
Promote market competition and establish a world-class business climate
Low capacity of local firms to adopt new technologies and innovate (e.g. patents application global ranking 68, compared to 35 for aspirational peers). Low quality of the managerial and organizational practices of Macedonian firms (e.g. ability to delegate or use of marketing strategies much lower than in aspirational peers). Shortage of soft skills and knowledge of business concepts among local firms (e.g. monetization, differentiation, and business development to attract funding).
Strengthen firm capabilities and the ecosystem for technology adoption and access of firms to finance.
Farm land is highly fragmented in FYR Macedonia, which reduces farm productivity (71 percent of farms were operated by farmers who owned less than one hectare of land), and deficiencies in the country’s land market prevent the use of land as collateral for lending. Public support to the agriculture and agribusiness industry does not encourage growth in productivity (subsidies for market support and direct payments represented 80 percent of the agricultural budget).
Foster agricultural modernization
Pathway II: Developing more competitive and adaptive human capital and closing opportunity gapsLow and uneven coverage of ECD (less than one percent of children from the poorest quintile are in a preschool program); low and worsening quality of basic education (PISA tests declined between 2000 and 2015, while about 70 percent of 15-year-old students did not attain basic math and reading proficiency levels); limited opportunities for professional development (only 25 percent of firms offer on-the-job training).
Endow people with quality and relevant skills throughout the life cycle
Disincentives, regulatory barriers, and social norms undermine the ability and willingness of people to join the labor force. Government policies may prevent people from accepting available jobs, among them labor contributions too high relative to wages (e.g. labor contributions system imposes a minimum contribution rate of 50 percent of the average wage—regressive for those earning less than the average) and working arrangements not flexible enough to accommodate parental responsibilities (41 percent of women not in the labor force cite “personal and family obligations” as their primary reason for not looking for a job).
Reduce disincentives and remove barriers to labor market participation, especially for women
Social assistance focus has shifted from helping poor families to supporting families with children. FYR Macedonia’s total spending on social protection is 14 percent of GDP, most of it goes to pensions; direct social assistance is only 1.2 percent of GDP. Children in FYR Macedonia have a higher mortality risk than those in other Western Balkans or European countries.
Protect human capital by shielding poor households from shocks and investing in preventive medicine and primary care
Pathway III: Achieving sustainability through effective governance, fiscal prudence, and enhanced environmental management and resilience to natural hazardsIn four areas—political stability, voice and accountability, rule of law, and control of corruption FYR Macedonia ranks below aspirational peers. Current governance quality indicators below those of new EU member states 5 years before EU accession (Worldwide Governance Indicators). Policy instability and the inefficiency of the bureaucracy are among the top five obstacles to doing business in FYR Macedonia. The ability of the media to function as a vehicle for accountability has been significantly diminished.
Secure rule of law and build capable public sector institutions that are accountable to citizens
SEIZING A BRIGHTER FUTURE FOR ALL
189CHAPTER 7. PRIORITIES FOR ACHIEVING FASTER, MORE INCLUSIVE, AND SUSTAINABLE GROWTH
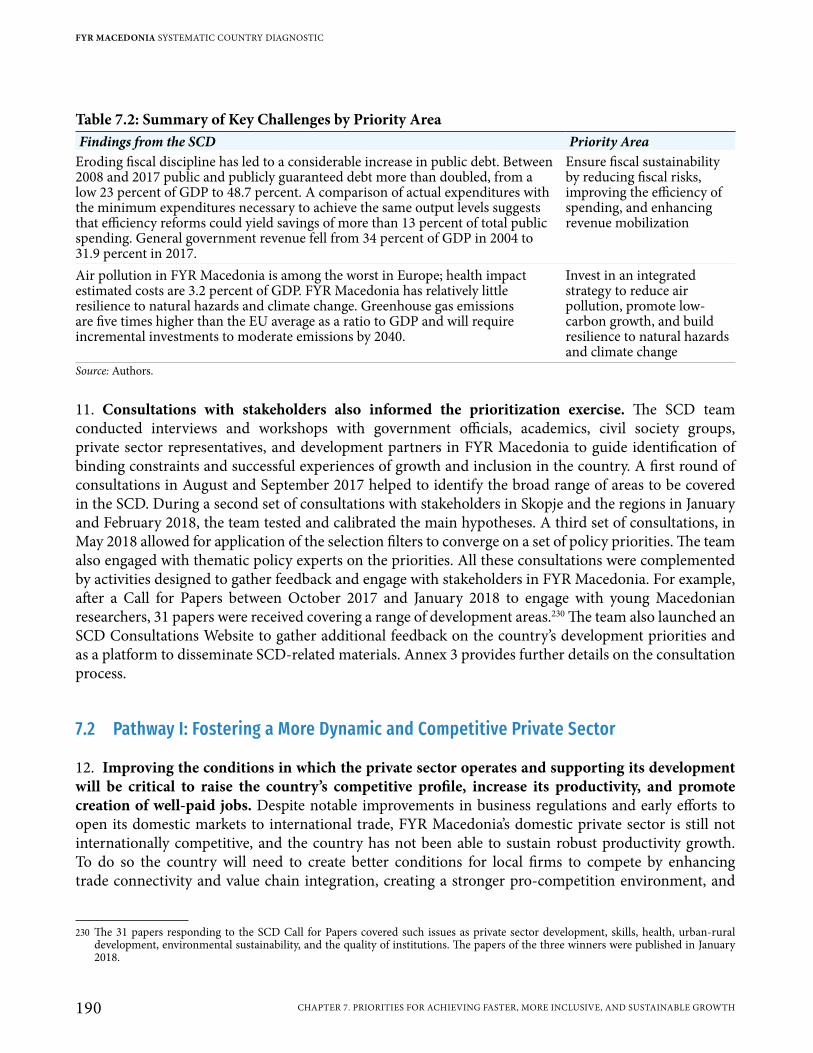
Table 7.2: Summary of Key Challenges by Priority AreaFindings from the SCD Priority Area
Eroding fiscal discipline has led to a considerable increase in public debt. Between 2008 and 2017 public and publicly guaranteed debt more than doubled, from a low 23 percent of GDP to 48.7 percent. A comparison of actual expenditures with the minimum expenditures necessary to achieve the same output levels suggests that efficiency reforms could yield savings of more than 13 percent of total public spending. General government revenue fell from 34 percent of GDP in 2004 to 31.9 percent in 2017.
Ensure fiscal sustainability by reducing fiscal risks, improving the efficiency of spending, and enhancing revenue mobilization
Air pollution in FYR Macedonia is among the worst in Europe; health impact estimated costs are 3.2 percent of GDP. FYR Macedonia has relatively little resilience to natural hazards and climate change. Greenhouse gas emissions are five times higher than the EU average as a ratio to GDP and will require incremental investments to moderate emissions by 2040.
Invest in an integrated strategy to reduce air pollution, promote low-carbon growth, and build resilience to natural hazards and climate change
Source: Authors.
11. Consultations with stakeholders also informed the prioritization exercise. The SCD team conducted interviews and workshops with government officials, academics, civil society groups, private sector representatives, and development partners in FYR Macedonia to guide identification of binding constraints and successful experiences of growth and inclusion in the country. A first round of consultations in August and September 2017 helped to identify the broad range of areas to be covered in the SCD. During a second set of consultations with stakeholders in Skopje and the regions in January and February 2018, the team tested and calibrated the main hypotheses. A third set of consultations, in May 2018 allowed for application of the selection filters to converge on a set of policy priorities. The team also engaged with thematic policy experts on the priorities. All these consultations were complemented by activities designed to gather feedback and engage with stakeholders in FYR Macedonia. For example, after a Call for Papers between October 2017 and January 2018 to engage with young Macedonian researchers, 31 papers were received covering a range of development areas.230 The team also launched an SCD Consultations Website to gather additional feedback on the country’s development priorities and as a platform to disseminate SCD-related materials. Annex 3 provides further details on the consultation process.
7.2 Pathway I: Fostering a More Dynamic and Competitive Private Sector
12. Improving the conditions in which the private sector operates and supporting its development will be critical to raise the country’s competitive profile, increase its productivity, and promote creation of well-paid jobs. Despite notable improvements in business regulations and early efforts to open its domestic markets to international trade, FYR Macedonia’s domestic private sector is still not internationally competitive, and the country has not been able to sustain robust productivity growth. To do so the country will need to create better conditions for local firms to compete by enhancing trade connectivity and value chain integration, creating a stronger pro-competition environment, and
230 The 31 papers responding to the SCD Call for Papers covered such issues as private sector development, skills, health, urban-rural development, environmental sustainability, and the quality of institutions. The papers of the three winners were published in January 2018.
FYR MACEDONIA SYSTEMATIC COUNTRY DIAGNOSTIC
190 CHAPTER 7. PRIORITIES FOR ACHIEVING FASTER, MORE INCLUSIVE, AND SUSTAINABLE GROWTH
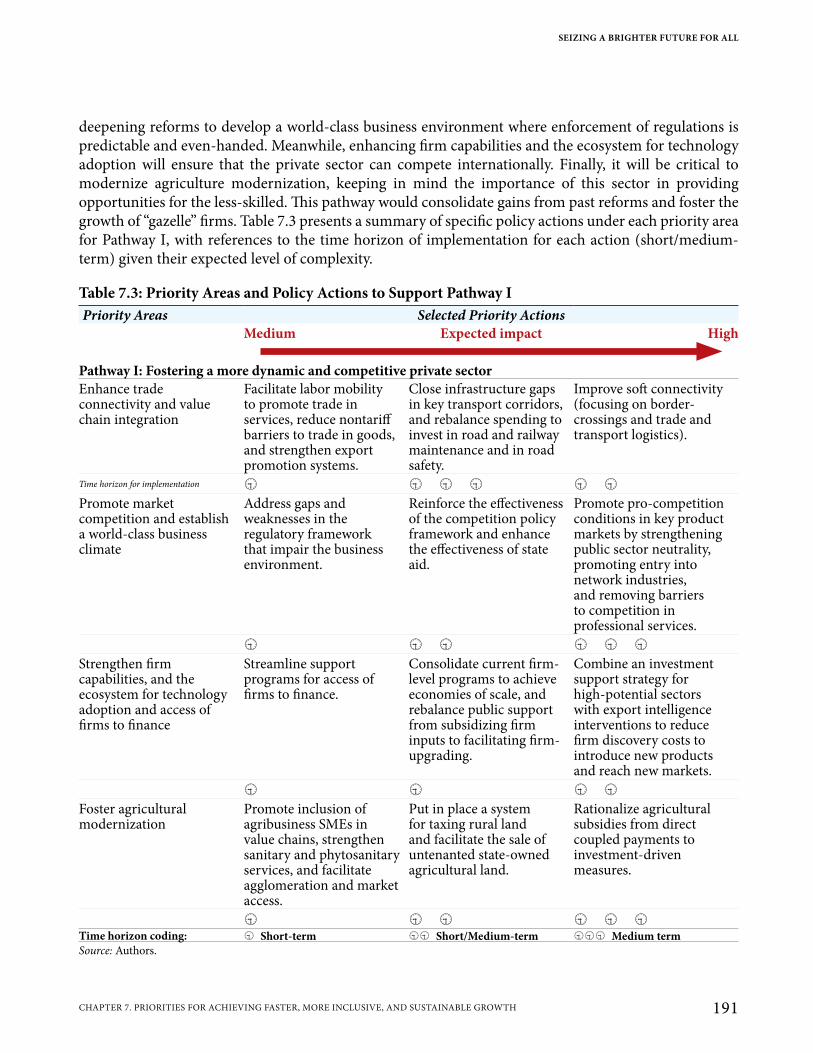
deepening reforms to develop a world-class business environment where enforcement of regulations is predictable and even-handed. Meanwhile, enhancing firm capabilities and the ecosystem for technology adoption will ensure that the private sector can compete internationally. Finally, it will be critical to modernize agriculture modernization, keeping in mind the importance of this sector in providing opportunities for the less-skilled. This pathway would consolidate gains from past reforms and foster the growth of “gazelle” firms. Table 7.3 presents a summary of specific policy actions under each priority area for Pathway I, with references to the time horizon of implementation for each action (short/medium-term) given their expected level of complexity.
Table 7.3: Priority Areas and Policy Actions to Support Pathway IPriority Areas Selected Priority Actions
Medium Expected impact High
Pathway I: Fostering a more dynamic and competitive private sectorEnhance trade connectivity and value chain integration
Facilitate labor mobility to promote trade in services, reduce nontariff barriers to trade in goods, and strengthen export promotion systems.
Close infrastructure gaps in key transport corridors, and rebalance spending to invest in road and railway maintenance and in road safety.
Improve soft connectivity (focusing on border-crossings and trade and transport logistics).
Time horizon for implementation Promote market competition and establish a world-class business climate
Address gaps and weaknesses in the regulatory framework that impair the business environment.
Reinforce the effectiveness of the competition policy framework and enhance the effectiveness of state aid.
Promote pro-competition conditions in key product markets by strengthening public sector neutrality, promoting entry into network industries, and removing barriers to competition in professional services.
Strengthen firm capabilities, and the ecosystem for technology adoption and access of firms to finance
Streamline support programs for access of firms to finance.
Consolidate current firm-level programs to achieve economies of scale, and rebalance public support from subsidizing firm inputs to facilitating firm-upgrading.
Combine an investment support strategy for high-potential sectors with export intelligence interventions to reduce firm discovery costs to introduce new products and reach new markets.
Foster agricultural modernization
Promote inclusion of agribusiness SMEs in value chains, strengthen sanitary and phytosanitary services, and facilitate agglomeration and market access.
Put in place a system for taxing rural land and facilitate the sale of untenanted state-owned agricultural land.
Rationalize agricultural subsidies from direct coupled payments to investment-driven measures.
Time horizon coding: Short-term Short/Medium-term Medium termSource: Authors.
SEIZING A BRIGHTER FUTURE FOR ALL
191CHAPTER 7. PRIORITIES FOR ACHIEVING FASTER, MORE INCLUSIVE, AND SUSTAINABLE GROWTH

7.2.1 Enhance Trade Connectivity and Value Chain Integration
7.2.1.1 Policy action 1: Improve soft connectivity (focusing on border-crossings and trade and transport logistics)
13. Modernize customs and border-control procedures to reduce the time shipments spend waiting at the border. Despite the single-window system (ExIM) for customs control and border management, shipments spend considerable time at the border, partly because processes are based on outdated paper-based technology. Introducing digital certification can speed up clearance and centralize the flow of information. This will require upgrading the infrastructure for border control officials and providing training in how to use it effectively to borders control's staff. The development of the ICT industry in the country represents an opportunity to find local suppliers for the digital systems needed.
14. Foster coordination between border control agencies to streamline customs procedures. Another reason for delays in customs clearance is the need for physical copies of certificates from the different agencies involved in certification and control of international shipments. Improved coordination between the Macedonian Customs Administration, the Agriculture Inspectorate, the State Sanitary and Health Inspectorate, and the Food and Veterinary Agency would help identify processes that can be streamlined and reduce unnecessary physical examinations or inspections. Moreover, creating a single electronic database accessible to all institutions with information on release and clearance processes will allow border officials to clear shipments without unnecessary delays.
15. Actively promote logistics services, e.g., by creating a platform that links logistics suppliers with shippers to encourage freight consolidation. Consolidating freight would not only reduce shipping costs and greenhouse gas emissions but would also help build up the private transport and logistics industry. A logistics platform would give freight forwarders, shippers, importers, wholesalers, and retailers the opportunity to easily find reliable and competitive transport and logistics service providers. It will also allow transport carriers and warehouse operators to optimize their use of resources. These efforts could have potential synergies with the promotion of the digital economy in the country.
7.2.1.2 Policy action 2: Close infrastructure gaps in key transport corridors, and rebalance spending to invest in road and railway maintenance and in road safety
16. Close transport infrastructure gaps along Corridors X and VIII and extensions to the Trans-European Transport Network. This will require expediting work on the significant investments already underway, and preparation of high-quality feasibility studies to attract investment for the remaining sections. Combined with efforts to enhance soft connectivity, these investments could help FYR Macedonia become a regional transport hub, bringing opportunities for growth in investment and trade. Public-Private Partnerships (PPP) can play an important role to support public efforts to close infrastructure gaps.
17. Rebalance spending to invest more in maintenance of the main trade corridors as well as the secondary and tertiary networks. The main road and rail corridors (Corridors x and VIII) need significant maintenance, and there is also a backlog of maintenance on the secondary and tertiary network. Also, local roads need a prioritized program of maintenance, rehabilitation, and road safety improvements. It is estimated that at least €81.5 million is required to close the current transport
FYR MACEDONIA SYSTEMATIC COUNTRY DIAGNOSTIC
192 CHAPTER 7. PRIORITIES FOR ACHIEVING FASTER, MORE INCLUSIVE, AND SUSTAINABLE GROWTH
maintenance gap. Prioritizing this investment will allow the country to make the most of its existing transport infrastructure assets, ensuring that the road network last as long as was initially planned. Completing this agenda will require reforms to improve the capacity of the Public Enterprise of State Roads and Macedonian Railways, particularly in project and asset management. The roads agency has an asset management system to prioritize interventions, but it is not being used systematically and will require better data collection and firmer political will if it is to support investment decisions based on technical criteria. The performance and safety of the transport networks can also be addressed. For example, Intelligent Transport Systems (ITS) could be implemented in Corridor x to better match loads and reduce empty runs; meanwhile, an improved multi-modal transport operating system would ensure that freight, where possible, is carried on the rail network. These interventions will help make the transport network financially sustainable.
18. Invest in road safety, especially setting up a lead road safety agency. FYR Macedonia formulated comprehensive road safety strategies for 2010–14 and 2015–20, and the Republican Council for Road Safety (RSBSP) was established to promote road safety activities. However, progress has not been as good as expected, and current fatality rates for Macedonian roads are 50 percent higher than the EU average. It is recommended that current road safety legislation be amended to give RSBSP more authority, the necessary executive powers, and adequate resources to manage road safety issues and programs. There should also be continued assistance to community road safety councils to encourage local ownership of road safety and local activity and interventions.
7.2.1.3 Policy action 3: Facilitate labor mobility to promote trade in services, reduce non-tariff barriers to trade in goods, and strengthen export promotion systems
19. Promote agreements for mutual recognition of professional qualifications to facilitate services exports. Pursuant to the 2017 Multi-Annual Action Plan for a Regional Economic Area in the Western Balkans, FYR Macedonia could help advance adoption of joint standards and procedures for automatic recognition of academic qualifications by Western Balkan countries. Regional agreements could also remove current obstacles to the mobility of students, researchers, and academics. These measures would facilitate the agglomeration of talent and development of service industries for exports, providing a platform from which the countries can then scale up their service exports to the EU market. The surge of new technologies that facilitate provision of services at a distance provides a unique opportunity for FYR Macedonia and neighboring countries to maximize their comparative advantages in provision of services.
20. Negotiate agreements with trading partners for mutual recognition of certificates for exports. This will reduce costs for exporters, whose products must be inspected for quality and safety by both Macedonian and destination country authorities. It is recommended that the government seek mutual recognition agreements first with its most important trading partners including CEFTA countries. This will require a dialogue with exporters to identify certifications that should have priority in negotiations, using as criteria the volume of exports and the potential for nascent export industries. This may also require harmonization of national inspection procedures, for which EU standards could be used as a benchmark, thus also advancing harmonization with EU policies.
SEIZING A BRIGHTER FUTURE FOR ALL
193CHAPTER 7. PRIORITIES FOR ACHIEVING FASTER, MORE INCLUSIVE, AND SUSTAINABLE GROWTH
7.2.2 Promote Market Competition and Establish a World-Class Business Climate
7.2.2.1 Policy action 1: Promote pro-competition conditions in key product markets by strengthening public sector neutrality, promoting entry into network industries, and removing barriers to competition in professional services
21. Strengthen the competition-neutrality of public enterprises to level the playing field between public and private operators. Although in theory Macedonian SOEs are subject to antitrust scrutiny, in practice they enjoy privileges that create market distortions and discourage private investment. It is important that antitrust regulations be enforced in the same way for both public and private enterprises. Public enterprises are also insulated from competitive pressure because they have better access to finance. Limiting these privileges will create a more pro-competition environment. Finally, enhancing the governance of public enterprises to restrict direct interference by government officials in SOE management will support competition-neutrality and ensure that public enterprises make cost-minimizing decisions similar to those of private firms.
22. Introduce a modern regulatory framework in basic service industries that are natural monopolies, and strengthen institutional capacity for its effective implementation. Network industries like electricity, gas, and telecommunications are critical to the growth of the economy, but in FYR Macedonia their organization is not consistent with best international practices. To guarantee that these industries attract the necessary investment to satisfy future demand, it is important to migrate to regulatory schemes that allow private firms to provide the services and recover their costs, while keeping tariffs as close as possible to recovery costs. Several reforms are needed. In gas, retail tariffs should be regulated on the basis of costs as researched and assessed by the regulator. In electricity, the Energy Regulatory Commission should be able to issue sanctions and penalties as enforcement mechanisms. In the telecommunications industry, further data protection for users of digital services would be needed. Finally, it needs to ensure that competition policy is effectively implemented in regulated sectors through effective cooperation between regulators and the Commission for Protection of Competition.
23. Remove barriers to competition in professional services. There are minimum binding prices for the services of a range of professions in FYR Macedonia, enforced through professional associations. Minimum prices may lead to an excess of services offered and promote informal transactions. A government ban on minimum or recommended prices for professional services is recommended. In addition, removing restrictions that currently discourage professionals from relocating to where their services may be in more demand can enhance competition in professional services.
7.2.2.2 Policy action 2: Reinforce the effectiveness of the competition policy framework, and enhance the effectiveness of state aid
24. Strengthen compliance with antitrust regulations. Stronger sanctions for antitrust violations will give credibility to the rules. It is recommended that the Macedonian Commission for Protection of Competition build its capacity to assess antitrust behavior, enforce antitrust regulations, and sanction violations. This will require a series of measures, starting with increasing the use of on-site inspections to gather direct evidence of violations. Meanwhile, the government needs a more effective leniency program—perhaps giving firms that provide information about a cartel in which they participated full or
FYR MACEDONIA SYSTEMATIC COUNTRY DIAGNOSTIC
194 CHAPTER 7. PRIORITIES FOR ACHIEVING FASTER, MORE INCLUSIVE, AND SUSTAINABLE GROWTH
partial immunity from fines—to improve the policing of anti-competitive behavior. Also, it is necessary to increase the use of economic analytics to build solid antitrust cases and to publish the reasons for decisions, including the analytic evidence.
25. Optimize the merger notification system. A simplified merger review process will minimize the burden on private firms that currently spend time and resources providing notification of small transactions that are unlikely to affect market competition. Optimizing the thresholds for merger notifications would ensure that regulators spend resources in proportion to the stakes involved in each merger. It is recommended that FYR Macedonia replace its current merger notification system, which calculates thresholds based on market shares, by individual thresholds based on either turnover or value of assets. Another option might be to use benchmarking to identify optimal notification thresholds based upon turnover. The government could also consider eliminating merger notification thresholds from the Competition Law itself so that they can be reviewed and revised periodically.
26. Ensure that state aid programs are carried out effectively. FYR Macedonia’s state aid laws adhere to EU principles, but their implementation has been uneven. A number of state aid programs adopted in recent years were not sufficiently vetted and may be creating market distortions. It is thus critical to strengthen the supervision and enforcement capacity of the Commission for Protection of Competition, develop a registry of state aid, and create a more effective state aid notification system. These measures would allow the Commission to more effectively supervise compliance with state aid legislation.
7.2.2.3 Policy action 3: Address gaps and weaknesses in the regulatory framework that impair the business environment
27. Close implementation gaps in business regulation and upgrade lagging areas. The notable improvements in international indicators of the business environment in recent years reflect the commitment of FYR Macedonia’s government to attract private investment. Yet there is still ample room for improving business regulation in certain areas, including contract enforcement, property registration, access to electricity, and insolvency. The enterprise insolvency law with special focus on going-concern alternatives, out-of-court resolutions, and reorganization, should be finalized and enacted.
28. Make the criteria for inspections more transparent and risk-based. By providing greater certainty for firms, a more efficient inspection process could improve the investment climate. Among actions the government could take is the harmonization of inspection agencies and their mandates, first at the center and then between central and local agencies. This should include revising the laws governing inspections and harmonizing the inspection guidelines and approaches of different agencies to reduce the discretion of individual inspectors. An alternative approach worth testing as a pilot is the use of risk-based inspections, supported by identification of appropriate methodologies, drafting of operating procedures, and building inspectorate capacities in, e.g., IT systems, risk profiles, communication manuals, and training of inspectors. Inspectors should also be allowed to issue warnings for minor infractions but should have less discretion in imposing fines; the Inspection Council should be given authority to resolve issues related to the inspections of different inspectorates. Finally, harmonizing the Law on Inspections Supervision with the Law on General Administrative Procedure should increase inspection transparency.
SEIZING A BRIGHTER FUTURE FOR ALL
195CHAPTER 7. PRIORITIES FOR ACHIEVING FASTER, MORE INCLUSIVE, AND SUSTAINABLE GROWTH
29. Increase the predictability of regulatory changes and enhance public-private dialogue. Firms cite frequent policy, legislative, and regulatory changes as a serious concern, especially with respect to taxes, in part because they do not give firms without enough time to plan for the changes in costs. To reduce investor uncertainty while retaining the freedom to make changes to respond to fiscal needs, the government could try to minimize regulatory changes, but when they are necessary, coordinate more closely with the private sector on the changes proposed, keeping open the channel of communications to receive concerns and suggestions about alternatives or the best ways to operationalize changes. Enhanced public-private dialogue on technical details, with both local and foreign companies, would help identify specific bottlenecks and build investor confidence.
7.2.3 Strengthen Firm Capabilities and the Ecosystem for Technology Adoption and Access of Firms to Finance
7.2.3.1 Policy action 1: Combine an investment support strategy for high-potential sectors with export intelligence interventions to reduce firm discovery costs to introduce new products and reach new markets
30. Develop a targeting strategy identifying specific firms in high-value added segments of select industry value chains. This will entail articulating specific value propositions to attract targeted firms based on the competitive advantages that FYR Macedonia can offer. This will require an evaluation of industrial sectors that the country should be attracting, as well as the aspects of the Macedonian economy that can be attractive for these firms to invest in the country. To this end, it will also be critical to strengthening the capacity and service delivery of the government’s lead agency for investment promotion and facilitation (InvestMacedonia) to support an effective implementation of the strategy.
31. Reform and upgrade the agencies charged with export promotion, adopting capability-development approach to raise the competitive profile of local firms. Among international examples are Chile’s Internationalization Plan, which provides small and medium enterprises (SMEs) with a full year of training modules on such issues as production capabilities, market research, logistics, marketing plans, banking, international law, searching for partners, and the export process. In Tunisia’s FAMEx program, firms prepared an export development plan identifying specific projects for which they requested grant support. Similar efforts in FYR Macedonia to promote market research and invest in export-readiness programs to upgrade sector-specific skills and infrastructure would help build the profile of local firms oriented towards export markets, especially SMEs.
7.2.3.2 Policy action 2: Consolidate current firm-level programs to achieve economies of scale, and rebalance public support from subsidizing firm inputs to facilitating firm-upgrading
32. Centralize efforts from agencies and programs in support of building firm capabilities. The Ministry of Economy has three programs that together are responsible for 14 entities. Similar efforts are managed by the Agency for Entrepreneurship, The Agency for Foreign Investment and Export Promotion (InvestMacedonia), and the Fund for Innovation and Technological Development. All these programs could be consolidated into fewer entities that with larger budgets and rigorous evaluation can identify the most effective ways to build capability. The use of electronic platforms could be also considered for the provision of services to firms.
FYR MACEDONIA SYSTEMATIC COUNTRY DIAGNOSTIC
196 CHAPTER 7. PRIORITIES FOR ACHIEVING FASTER, MORE INCLUSIVE, AND SUSTAINABLE GROWTH
33. Enhance the efficiency of public programs designed to build up firm capabilities. This will require moving from an approach that favors subsidies for inputs—such as purchase of equipment and tools, product/service logo and visual identity programs, advertising materials, and participation in fairs—to an approach that focuses on building capabilities. Not all firms will be able to benefit from these services. It is probable that firms with a good skills base and some managerial capacity will self-select into these programs. The government could support their capabilities development by creating Centers of Excellence, Technology Extension Services, and a National Office of Technology Transfer to identify research with potential commercial interest. These centers should focus on investments in managerial skills and adoption of international quality standards (ISO, HACCP). The government could also improve access to innovation financing (angel funds and venture capital) and promote mentoring services since lack of investment readiness can compromise the effectiveness of firm and industry supply-side interventions.
7.2.3.3 Policy action 3: Streamline support programs for access of firms to finance
34. Streamline support programs for firms’ access to finance and identify means through which the financial sector can better support firm growth and innovation. The strategy and products offered by MBDP should be reviewed and streamlined based on a market gap assessment and a credible framework for impact and additionality assessments. At the same time, impediments for product take-up, including interest rate caps and cumbersome procedures, should be removed in the process. To increase financial sector efficiency and financial access for firms, inefficiencies created by small, weakly governed banks with unclear business models, high NPLs and low (negative) profitability need to be addressed while also assessing current provider diversity. Private sector accounting and auditing standards application environment should be improved to facilitate access to financing by firms.
7.2.4 Foster Agricultural Modernization
7.2.4.1 Policy action 1: Rationalize agricultural subsidies from direct coupled payments towards investment-driven measures
35. Rebalance public support to improve agricultural efficiency and effectiveness by decoupling payments and focusing on cross-compliance. Public support for agriculture in FYR Macedonia, as a share of GDP, is much higher than in other countries in the region and well above the EU-28 average. Most of this support consists of subsidies. Yet farms growing specialized and high-value crops perform well despite relatively little support. Rightsizing and rebalancing the budget for agricultural support is thus a priority in order to encourage activities with the highest rates of return. It is recommended that spending on direct payments (currently 85 percent of the agriculture budget) be redirected to general rural development; technical efficiency is higher for farms that invest in fixed agricultural assets, such as those supported by rural development programs. Besides its effect on productivity, this kind of rebalancing is also likely to have more impact on poverty reduction and shared prosperity.
SEIZING A BRIGHTER FUTURE FOR ALL
197CHAPTER 7. PRIORITIES FOR ACHIEVING FASTER, MORE INCLUSIVE, AND SUSTAINABLE GROWTH
7.2.4.2 Policy action 2: Put in place a system for taxing rural land and facilitate the sale of untenanted state-owned agricultural land
36. Introduce a comprehensive system for taxing rural land to provide incentives to use land productively. Deficiencies in how the land market functions are a major barrier to accessing financing for agriculture and attracting investment to the sector. The availability of agricultural land is problematic because of land fragmentation and inactive ownership. Much private land is idle because owners have migrated to cities or abroad and do not participate in land sale and rental markets. A rural land tax system is likely to discourage small land owners from leaving productive land idle. It would also encourage consolidation of land for productive use. The potential poverty and social impacts of introducing such a rural land tax system should be thoroughly assessed first to identify any mitigation measures needed.
37. Implement fully the Law for Sale of State Owned Agricultural Land (SOAL). Bigger state-owned tracts of land in FYR Macedonia represent 34–41 percent of total agricultural land. In 2013 passage of SOAL introduced a new land sales policy. Application of this law, which has been slow, is important to agricultural competitiveness, as much state-owned land has already been consolidated. Expediting implementation of SOAL is vital but if it is to be effective detailed guidelines must be drafted governing the terms for the sale or lease of land. In the short term, a pilot sales program could be introduced to test the capacity of Macedonian institutions to implement SOAL. It is important to consider the sequencing of reforms to maximize the impact of each stage (e.g. facilitating agglomeration would ensure land reform is more effective).
7.2.4.3 Policy action 3: Promote inclusion of agribusiness SMEs in value chains, strengthen sanitary and phytosanitary services, and facilitate agglomeration and market access
38. Promote investment in agricultural processing companies. Though food processing can play an important role in both manufacturing activity and GDP, it has several structural problems that undermine competitiveness. Increased funding through the Rural Development Window can be allocated to supporting investment in agricultural processing companies. Moreover, the government could invest in branding Macedonian agricultural products to increase international awareness, enter new markets, and attract investment in agribusiness.
39. Reinforce sanitary and phytosanitary services. Aligning food safety standards with EU requirements (Codex Alimentarius standards) is a prerequisite for successful growth of the processing industry and to allow free movement of produce to market. This will require strengthened capacity at The Food Safety and Veterinary Agency, the Phytosanitary Directorate, and municipal agricultural and environmental service staff who provide advice to local farmers.
40. Support the provision of agglomeration facilities to provide scale to the processing industry. Agglomeration facilities, which would allow smallholder farmers to benefit from scale in their marketing outreach, could be financed by redirecting expenditures from direct payments to rural development. In conjunction, the government could actively support agribusiness by seeking out larger-scale supply contracts both within FYR Macedonia and in international markets.
FYR MACEDONIA SYSTEMATIC COUNTRY DIAGNOSTIC
198 CHAPTER 7. PRIORITIES FOR ACHIEVING FASTER, MORE INCLUSIVE, AND SUSTAINABLE GROWTH
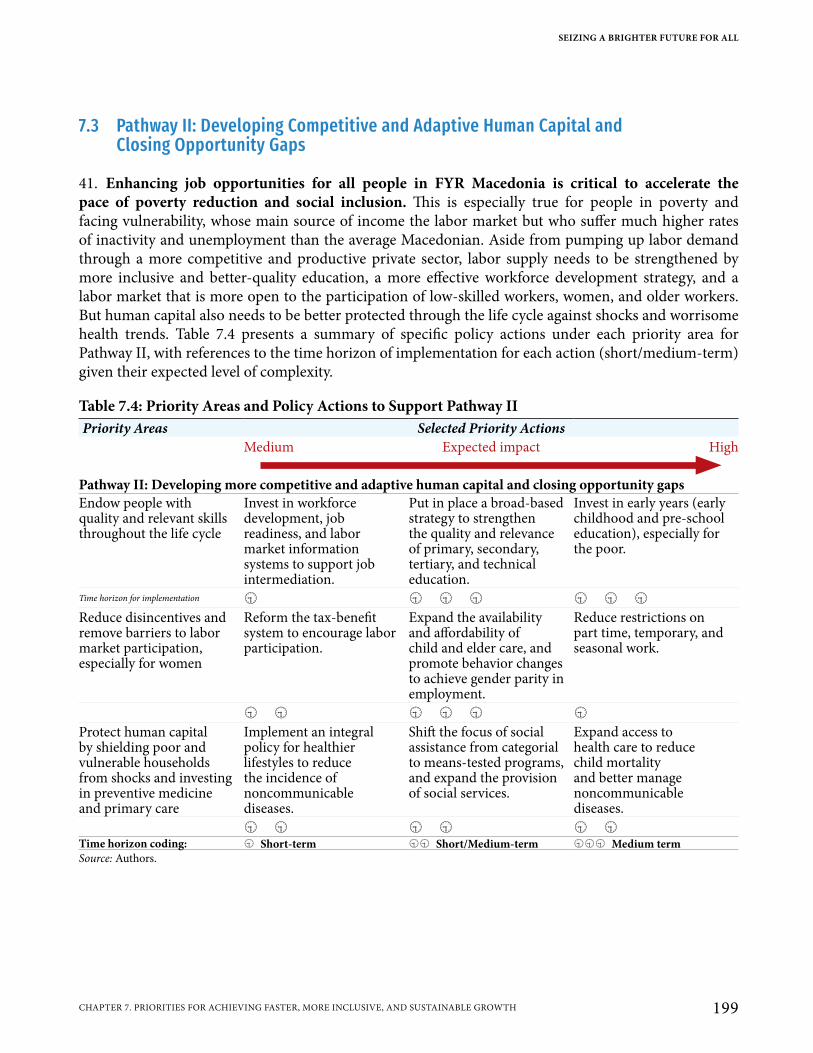
7.3 Pathway II: Developing Competitive and Adaptive Human Capital and Closing Opportunity Gaps
41. Enhancing job opportunities for all people in FYR Macedonia is critical to accelerate the pace of poverty reduction and social inclusion. This is especially true for people in poverty and facing vulnerability, whose main source of income the labor market but who suffer much higher rates of inactivity and unemployment than the average Macedonian. Aside from pumping up labor demand through a more competitive and productive private sector, labor supply needs to be strengthened by more inclusive and better-quality education, a more effective workforce development strategy, and a labor market that is more open to the participation of low-skilled workers, women, and older workers. But human capital also needs to be better protected through the life cycle against shocks and worrisome health trends. Table 7.4 presents a summary of specific policy actions under each priority area for Pathway II, with references to the time horizon of implementation for each action (short/medium-term) given their expected level of complexity.
Table 7.4: Priority Areas and Policy Actions to Support Pathway IIPriority Areas Selected Priority Actions
Medium Expected impact High
Pathway II: Developing more competitive and adaptive human capital and closing opportunity gapsEndow people with quality and relevant skills throughout the life cycle
Invest in workforce development, job readiness, and labor market information systems to support job intermediation.
Put in place a broad-based strategy to strengthen the quality and relevance of primary, secondary, tertiary, and technical education.
Invest in early years (early childhood and pre-school education), especially for the poor.
Time horizon for implementation Reduce disincentives and remove barriers to labor market participation, especially for women
Reform the tax-benefit system to encourage labor participation.
Expand the availability and affordability of child and elder care, and promote behavior changes to achieve gender parity in employment.
Reduce restrictions on part time, temporary, and seasonal work.
Protect human capital by shielding poor and vulnerable households from shocks and investing in preventive medicine and primary care
Implement an integral policy for healthier lifestyles to reduce the incidence of noncommunicable diseases.
Shift the focus of socialassistance from categorialto means-tested programs,and expand the provisionof social services.
Expand access tohealth care to reducechild mortalityand better managenoncommunicablediseases.
Time horizon coding: Short-term Short/Medium-term Medium termSource: Authors.
SEIZING A BRIGHTER FUTURE FOR ALL
199CHAPTER 7. PRIORITIES FOR ACHIEVING FASTER, MORE INCLUSIVE, AND SUSTAINABLE GROWTH
7.3.1 Endow People with Quality and Relevant Skills Throughout the Life Cycle
7.3.1.1 Policy action 1: Invest in early years (early childhood development and pre-school education), especially for the poor
42. Improve the quality of education at all levels, starting by expanding equitable access to early childhood education (ECE), which offers the highest rates of return. There are four school-level ingredients for learning: prepared learners, effective teaching, learning-focused inputs (adequate financing), and school management and governance.231 Given the low levels of preschool access in FYR Macedonia, it is imperative to invest in ECE and seriously tackle the lack of preschool facilities. It is necessary to build new structures and repurpose and upgrade other public buildings, particularly in rural municipalities that have no ECE facilities. Also, among serious demand-side constraints that to be addressed, parents and caregivers can be empowered to engage in early stimulation with their children at home. Changing the funding mechanisms is important to ensure sustainability and equity in the provision of preschool services, particularly for the most disadvantaged populations.
7.3.1.2 Policy action 2: Put in place a broad-based strategy to strengthen the quality and relevance of primary, secondary, tertiary, and technical education
43. Establish a sustainable system for teacher professional development. With almost 80 percent of students in FYR Macedonia considered functionally illiterate, it is critical to modernize outdated teaching techniques. Most Macedonian education institutions lack skilled and motivated teachers, critical for a high-quality education. Preservice training needs to be modernized by introducing modern teaching techniques in its curriculum and giving more practical experience, so that future teachers acquire standard professional competences. It is also important to establish a system for teacher career advancement that will reward high-performing teachers.
44. Strengthen accountability and quality assurance mechanisms, from preschool through tertiary education, to raise the quality and relevance of education. The first step to improve system-wide learning is to identify good metrics for monitoring how effective programs and policies are in improving learning outcomes. A national assessment, for instance, would help monitor the quality of compulsory education. At the tertiary level, internal and external quality assurance mechanisms could be improved to ensure the quality and job-readiness of graduates. Significant capacity-building measures, and resources, are needed to support a culture of quality throughout tertiary education institutions, both public and private. Moreover, it is necessary to redesign education financing to create more incentives to deliver quality education services. For instance, for more transparent allocations the government could introduce per-student funding formulas for preschool and higher education and re-evaluate current per-student funding formulas for primary and secondary education. Improvements in the quality of education would also benefit vulnerable students who rely heavily on the quality of the public system for their human capital accumulation.
231 See World Bank (2018), “World Development Report 2018: Learning to Realize Education’s Promise.”
FYR MACEDONIA SYSTEMATIC COUNTRY DIAGNOSTIC
200 CHAPTER 7. PRIORITIES FOR ACHIEVING FASTER, MORE INCLUSIVE, AND SUSTAINABLE GROWTH
7.3.1.3 Policy action 3: Invest in workforce development, job readiness, and labor market information systems to support job intermediation
45. Embed career guidance in the educational system. Currently it is generally thought in FYR Macedonia that people find work through personal and family networks, rather than through formal channels linked to school or other matching programs. In OECD countries, by contrast, career orientation begins as early as elementary school. In fact, the sooner students are exposed to the business environment, the better equipped they are to select a field of study that will lead them to a successful career. Moreover, the demand for skills has been accelerating away from routine cognitive activities toward “new economy” skills that include nonroutine cognitive (e.g., capacity to analyze information critically, problem-solving) and noncognitive skills (e.g., interpersonal skills, team work, work ethic, grit), which means that most of what students learn today is irrelevant from the employer perspective.
46. Reform the curricula for secondary, technical, and tertiary education to prepare students for a faster transition from school to work. The quality and relevance of secondary technical education would improve if the focus shifted from the current narrow occupational to a more general technical education. This will require introducing a modular and competency-based curriculum and increasing the time students spend on work-based learning. The education sector could engage more closely with employers to define learning goals and standards for vocational education and training to ensure that students have access to quality work-based learning opportunities. In addition, internship programs could be promoted by secondary and tertiary institutions for all students, so that they can acquire experience before they graduate. Work-based learning not only helps build higher-order cognitive skills like problem-solving, but even more important, it builds socio-emotional skills like communication skills, time management, and a good work ethic. Training for preparedness for the digital economy can also have considerable returns.
47. Improve education information systems to promote informed choices by students. The new Skills Observatory, designed to expand the information available to education system stakeholders to better align educational choices with labor market needs, should continue to be a Ministry of Education priority. Reinforcing information systems whose fundamentals are already in place has low additional costs (e.g., publishing information in an accessible way, outreach activities, working with education centers to collect information in comparable formats). OECD countries like Hungary, Italy, the Netherlands, and recently Romania, offer examples of how tracer studies can be used to collect and disseminate data on employment and earnings outcomes and how tertiary education is performing from a skills perspective. Other countries are establishing labor market observatories (currently Greece, Poland, and Czech Republic nearby, and Chile and Colombia elsewhere); in the United Kingdom these are integrated with institutions and employment services to inform both career choice and training investments and to facilitate job search.
48. Increase efforts to promote social inclusion in the labor market. To date, female, young, poor, older, and disabled workers, as well as ethnic minorities and returning migrants, are significantly disadvantaged. Assisting these groups requires more intense case work and extra efforts to coordinate with other sectors and with local governments (for instance, providing job training to unskilled workers, tailoring services to women in rural areas or small cities, and coordinating with care services or social assistance). Concerted action could be taken for social inclusion in training and intermediation.
SEIZING A BRIGHTER FUTURE FOR ALL
201CHAPTER 7. PRIORITIES FOR ACHIEVING FASTER, MORE INCLUSIVE, AND SUSTAINABLE GROWTH
49. Provide more career guidance for jobseekers. The Employment Service Agency (ESA) has a role to play, and can partner with the private sector to match the demand and supply of skills and enhance school-to-work transitions. The ESA’s mandate specifies mediation and advising for employment; professional orientation; insurance in case of unemployment; management of ALMPs; creating analytical, developmental, and professional materials; and communicating to the public significant information related to the labor market. However, some activities need to be strengthened, among them client segmentation, specialized case management offering employment services and programs based on the client’s job readiness, outreach to employers, introduction of a tiered service delivery system based on client profiles and labor market needs, job mediation, activation strategies, and other active labor market measures. ESA has only introduced dedicated case workers and case management in some of its larger branch offices; smaller ones do not have enough staff to provide the full range of ESA functions, especially the more intense case management needed to support vulnerable groups. A well-developed career guidance system, informed by effective labor market information systems, could make it easier to articulate demand for certain training and better respond to labor market demand individual talents and qualifications.
50. Strengthen labor market information systems (LMIS) to improve the quality of labor policies. To design effective policies for workforce development, it is crucial to have a good understanding of current trends, current gaps, and prospects in the labor market. FYR Macedonia needs a powerful and coherent LMIS that provides, e.g., information on occupations and skills that are in demand and skills for which demand is trending down. An LMIS would integrate labor force survey data, administrative data from workers and firms, and qualitative data from economic analysts to provide feedback on the quality and relevance of Macedonian education and training systems. An LMIS would also report the availability of transversal and occupation-specific skills by location, which would enable policymakers to promote more dynamic local labor markets. This information can also provide important insights to students and parents as they decide on educational and professional career paths. Continued participation in the OECD Program for International Assessment of Adult Competences (PIAAC) would be useful for monitoring the quality of the Macedonian workforce. The use of electronic platforms to disseminate the information will be critical to reach wider audiences.
51. Modernize ESA’s performance management system. The agency could access a larger amount of relevant information, including timely and accurate basic information on graduate students and job seekers, and automatic tracking the vulnerable employed through connecting with other systems (taxes, pensions, social assistance); employer demand for skills and occupations, and profile job seekers through advanced statistical techniques. This information could be used to improve counseling, career guidance, and intermediation. ESA will need to build a methodology for performance management by defining indicators and setting targets. To assess ESA performance, more monitoring data would need to be disaggregated by ESA branch, such as number of employers contacted, number of vacancies, and number of job placements made through mediation services or ALMPs. A complementary measure for improving employment intermediation is supporting the development of online labor platforms that can provide flexible work arrangements in spite of geographical location and can be attractive to women and youth. The digital environment in which those platforms work offers an opportunity to overcome the limited in-country job creation as majority of the job offers posted on such platforms are created outside Macedonia. Digital infrastructure (broadband) and digital skills allow to access and compete for those jobs.
FYR MACEDONIA SYSTEMATIC COUNTRY DIAGNOSTIC
202 CHAPTER 7. PRIORITIES FOR ACHIEVING FASTER, MORE INCLUSIVE, AND SUSTAINABLE GROWTH
7.3.2 Reduce Disincentives and Remove Barriers to Labor Market Participation, Especially for Women
7.3.2.1 Policy action 1: Reduce restrictions on part-time, temporary, and seasonal work
52. Simplify contracting instruments. Temporary contracts have made the labor market in FYR Macedonia more flexible than in other Western Balkan countries. While there are concerns about whether temporary contracts are fair (in terms of security and benefits), they do allow employers to test the quality of workers and workers to acquire experience, and they encourage hiring because employers can better adjust to changes in the business cycle. Currently, the share of temporary employees is relatively low, and more common among youth. Part-time employment is very low, even for women. This means women and other workers who might need more flexible arrangements, such as part-time, working from home, and work-sharing, have few options. As labor markets evolve and nonstandard forms of employment emerge, it will be important to ensure the right balance between fairness and flexibility. Beyond temporary and part-time contracts, other contracting arrangements could be introduced to facilitate formalization of short term and casual jobs, including jobs in the “gig economy”. It is important to avoid disincentives to such contracts, for instance in terms of social contributions or other taxes that might make them too costly for employers, substantially reduce the take-home pay for workers or push them into the informal economy. Meanwhile, flexible options for self-employed or occasional workers, e.g., to contribute to the pensions system would make these jobs more attractive as they would also offer a way to secure a pension for workers as they age. Flexible arrangements would also benefit married men, allowing them to participate more in household activities, thus enabling women to free up time for paid work.
7.3.2.2 Policy action 2: Expand the availability and affordability of child and elder care, and promote behavior changes to achieve gender parity in employment
53. Provide care services that are adapted to family needs and preferences, and reform family leave policies. Low enrollment in preschool and ECE in FYR Macedonia is in part a result of there being too few child and elder care centers and in part a result of low demand conditioned by social norms that dictate that children should not be at school before they reach elementary-school age. Similarly, care for the elderly is mostly done within the immediate family. Although families that care for the elderly do receive a social benefit, institutional or professional care is not usually available in any case, and even when they are, people are reluctant to use them. As a result, most care responsibilities, whether for children or the elderly, fall to women, who thus devote their most productive years to the care of family members. It is therefore necessary to think of ways in which care services for children and the elderly can be made more widely available (e.g. by deregulating care services to encourage private provision), and it is also important to actively promote their use, especially where home care of children is still considered best for child development. Revising policies for maternal, paternal, and parental leave would help to promote participation of fathers in the care of newborns.
54. Promote women’s entrepreneurship by, e.g., facilitating financing and technical assistance so that women can start and scale up businesses. The ability to become self-employed would help women increase their paid activities. Mentoring programs are also useful for young women to learn from more experienced female entrepreneurs. It is also important to counsel women about their legal rights to family
SEIZING A BRIGHTER FUTURE FOR ALL
203CHAPTER 7. PRIORITIES FOR ACHIEVING FASTER, MORE INCLUSIVE, AND SUSTAINABLE GROWTH
assets and to make it easier for women to own property ownership by modifying current legislation, for instance, by making joint property the default for registration of property acquired by married people.
55. Promote a shift in traditional social norms that prevent women from pursuing economic activity. Within some communities, women’s traditional caretaker role may deter some women from pursuing education, training, and work activities outside their homes, making it necessary to raise awareness about the need to change the traditional family division of labor. Awareness campaigns and gender-sensitive public education can have a positive impact on gender equality and female activation. Behavioral interventions, such as creating more role models and champions, can also change young women’s expectations about what they can achieve and increase the tolerance of men for women’s empowerment outside the home. But it is also important to support communication efforts with legislation to encourage gender parity and institutional capacity to monitor and evaluate programs. For instance, introducing gender-focused aspects in collective agreements through the Socio-Economic Council, enforcing nondiscrimination laws (“equal pay for work of equal value”), and monitoring gender equality can help change mindsets about the role of women in a productive society.
7.3.2.3 Policy action 3: Reform the tax-benefit system to encourage labor participation
56. Make labor taxes more progressive, including by making the tax wedge more affordable for low-wage earners, and change social benefits rules so that beneficiaries who work are not penalized. Better-designed tax brackets for low-income workers can increase their incentives to search for employment and to work more hours. Similarly, incentives to work can be heightened by reforming the rules for social assistance eligibility to gradually withdraw benefits when people have paid employment (“in-work benefits”) and complement benefits to ensure a minimum income.
57. Review the minimum wage policy to strike a balance between ensuring decent earnings and rewarding productivity gains. Several elements should be considered in setting the minimum wage in FYR Macedonia: (a) the needs of workers and their families, that is, the general cost of living and social security benefits and other forms of no-labor income; and (b) economic factors such as productivity and the desirability of keeping employment high. The ratio of FRY Macedonia’s nominal legal minimum wage (12,000 denars as of September 2017) to the average wage in the economy is 0.52, which is higher than in most OECD countries.
7.3.3 Protect Human Capital by Shielding Poor and Vulnerable Households from Shocks and Investing in Preventive Medicine and Primary Care
7.3.3.1 Policy action 1: Expand access to health care to reduce child mortality and better manage noncommunicable diseases
58. Improve the efficiency and effectiveness of social assistance to protect poor and vulnerable households from shocks. Means-tested social assistance benefits reach less than 25 percent of poor households. In recent years, in part as a response to falling birth rates, the social assistance policy has shifted from providing cash benefits to demonstrably poor families to providing untargeted child-related benefits. In the country’s current fiscal context, it is crucial to think again about social assistance
FYR MACEDONIA SYSTEMATIC COUNTRY DIAGNOSTIC
204 CHAPTER 7. PRIORITIES FOR ACHIEVING FASTER, MORE INCLUSIVE, AND SUSTAINABLE GROWTH
protection of the poor from shocks that can worsen their living standards, but also assuring that the eligibility criteria do not reduce incentives to work. Further, since poor households face many structural barriers to accessing jobs, it is important to provide not just cash benefits but also other services to help them become more employable. Targeting ethnic minorities and adapting services to their unique needs would help to reduce their systemic exclusion from economic opportunity.
59. Improve access to, and the quality of, social services and tailor them to family needs. Social services—a crucial instrument to help the poor overcome structural barriers—are very limited in FYR Macedonia. A few public institutions provide both residential and nonresidential services, which are centrally organized, established, and financed by the Ministry of Labor and Social Protection. Existing services are mainly for children and persons with disabilities, much less for adults and the elderly. However, the barriers that prevent poor people, especially women, from participating in the labor market justify provision of these services, to relieve the burden of care from people who can engage in productive activities. These services should take a local approach, tailoring services to identified needs of local families.
7.3.3.2 Policy action 2: Shift the focus of social assistance from categorical to means-tested programs, and expand the provision of social services
60. Enhance access to, and the quality of, preventive and primary health care services. FYR Macedonia is one of only a few countries where infant and under-5 mortality indicators have been worsening in recent years, and the indicators are now about three times higher than the EU average. The incidence of noncommunicable diseases is also high. and increasing. It is therefore urgent to reverse these negative trends. The government could consider developing incentives for primary health care (PHC) physicians to better monitor their patients, such a basing payment on the delivery of effective preventive and PHC services. The country also needs to conduct a thorough health care facility analysis as the basis for a master plan for right-sizing the health care supply side in FYR Macedonia, with a better balance between primary health care and specialist services. Pharmaceutical coverage also needs improvement. For instance, the number of drugs for which payment is reimbursed is more restricted than in neighboring countries because very few drugs have been added since 2008. Pricing for medicines could also be aligned with international best practice to reduce unit prices and ensure efficiency gains that could be used to expand the list of reimbursed medicines.
7.3.3.3 Policy action 3: Implement an integral policy for healthier lifestyles to reduce the incidence of noncommunicable diseases
61. Promote healthy lifestyles, for example by discouraging smoking through tobacco taxation, communication campaigns, and stronger enforcement of laws limiting smoking in public spaces. That would raise tax revenues while encouraging tobacco users to quit, which would lower their risk of pulmonary disease. Similar activities could discourage the consumption of sugary drinks, especially by children, to decrease the risks of overweight and obesity. Promoting healthier lifestyles would reduce the incidence of noncommunicable disease and increase the productive life span of Macedonians.
SEIZING A BRIGHTER FUTURE FOR ALL
205CHAPTER 7. PRIORITIES FOR ACHIEVING FASTER, MORE INCLUSIVE, AND SUSTAINABLE GROWTH

7.4 Pathway III: Achieving Sustainability through Effective Governance, Fiscal Prudence, and Enhanced Environmental Management and Resilience to Natural Hazards
62. Reinforcing economic, environmental, and social resilience is critical to preserve economic and social gains in FYR Macedonia. This section presents specific policy actions that would help to achieve the policy priorities to improve social, fiscal, and environmental sustainability in the short and medium term. Table 7.5 presents a summary of specific policy actions under each priority area for Pathway III, with references to the time horizon of implementation for each action (short/medium-term) given their expected level of complexity.
Table 7.5: Priority Areas and Policy Actions to Support Pathway IIIPriority Areas Selected Priority Actions
Medium Expected impact High
Pathway III: Achieving sustainability through effective governance, fiscal prudence, and enhanced environmental management and resilience to natural hazardsSecure rule of law and build capable public institutions that are accountable to citizens
Strengthen mechanisms ensuring freedom of the press and of civil society organizations.
Increase the transparency and accountability of government decision-making, and build public sector capacity.
Ensure the independence, accountability, and professionalism of judicial system.
Time horizon for implementation Ensure fiscal sustainability by reducing fiscal risks, improving the efficiency of spending, and enhancing revenue mobilization
Increase tax compliance and tax progressivity.
Reinforce the efficiency of public spending.
Address fiscal risks (pensions, municipal finances, SOEs), and strengthen the transparency and credibility of public finances.
Invest in an integrated strategy to reduce air pollution, promote low-carbon growth, and build resilience to natural hazards and climate change
Shift the energy sector to a low-carbon development path, away from the current dependence on coal, while improving security and efficiency of energy supply.
Enhance the implementation of the National Program for inter-agency co-ordination for disaster risk management and build resilience to climate change.
Adopt a comprehensive approach to reduce air pollution.
Time horizon coding: Short-term Short/Medium-term Medium termSource: Authors.
FYR MACEDONIA SYSTEMATIC COUNTRY DIAGNOSTIC
206 CHAPTER 7. PRIORITIES FOR ACHIEVING FASTER, MORE INCLUSIVE, AND SUSTAINABLE GROWTH
7.4.1 Secure Rule of Law and Develop Capable Public Institutions that are Accountable to Citizens
7.4.1.1 Policy action 1: Ensure independence, accountability, and professionalism of the judicial system
63. Ensure that appointments and promotions of judges and prosecutors are based on transparent, objective, and meritocratic criteria. The functioning of the Judicial Council needs to be improved so that it can better protect the independence of the judiciary in the performance of its functions. Among measures to this end are introducing a non-renewable mandate for the Council and enacting procedures to avoid the risks of its politicization. Ensuring correct and consistent use of the automated case management system will help minimize political interference in the court system.
64. Increase the professionalism of the judiciary and ensure the accountability and transparency of all judicial institutions. Building a culture of transparency and accountability can promote consistency in policy and action and ensure the clarity and foreseeability of law and practice. Ethical standards should be clear and strict, accompanied by training and mainstreaming of the standards into daily practice. Also necessary are sustained monitoring of compliance with codes of ethics for judges and prosecutors and firm sanctions. A harmonized performance management system, based on both qualitative and quantitative quality standards for justice services, would enhance accountability. Facilitate access to information through electronic portals could be considered.
65. Build up the management of human resources to ensure quality performance. In addition to training both operational and administrative staff, proper staffing and funding are also necessary, especially for resource-deprived administrative courts. Proper allocation of resources, human and financial, can increase efficiency and speed up key processes like contract enforcement.
66. Improve data gathering and data quality to ensure that policies and laws are evidence-based. Minimizing the use of shortened legislative procedures and ensuring that law and policy making processes are as inclusive and participatory as possible can help to improve their effectiveness. This allows citizens to be better informed of their rights and obligations and improve their interaction with officials. There should be a full independent audit of how the system is operated, with random allocation of cases, to determine when and by whom this system was not respected.
7.4.1.2 Policy action 2: Increase the transparency and accountability of government decision-making, and build public sector capacity
67. Widely disseminate information about policies adopted and increase the transparency of interactions between the government and the public. One way to increase transparency is to facilitate broad access to information about how policies are being implemented, so that the public can follow and support government decisions. This will also reduce the space for discretion in interactions between the public and the government, which prevents possible abuses of power by public servants. It is also important to ensure the full implementation of the recently adopted Public Financial Management strategy and the Public Administration Reform strategy. Institutional functional reviews would provide critical information for reforms. FYR Macedonia has considerable space for improvement in its E-government system, which trails other Western Balkan countries and the EU. While it has some foundational elements of E-government in place, others are still significantly underdeveloped, among
SEIZING A BRIGHTER FUTURE FOR ALL
207CHAPTER 7. PRIORITIES FOR ACHIEVING FASTER, MORE INCLUSIVE, AND SUSTAINABLE GROWTH
them digital government shared platforms (cloud, digital identification, etc.) and secured transaction accounts. Recent initiatives (e.g. open data portal, open government action plan, national e-services portal) constitute steps into the right direction.
68. Reinforce the capacity and efficacy of independent oversight bodies. Over the years, FYR Macedonia has put in place several independent oversight bodies, such as the Office of the Ombudsman, the Directorate for Personal Data Protection, the State Commission for the Prevention of Corruption, the Commission for Prevention of and Protection from Discrimination, the Commission for Access to Public Information, and the Council of the Media Agency.232 An independent group reports, however, that their personnel and functions have largely been co-opted by political interest groups, which undermines their credibility. It is therefore important to consolidate their independence by making their appointment and dismissal processes more transparent and accountable. At all stages appointments should be based on transparent procedures that provide space for participation of the civil society. The statutory criteria for dismissal must be clearly defined in advance and confined to actions related directly to the body’s mandate. Dismissals should then be decided strictly on the basis of published procedures. Further, these bodies should have sufficient resources to honor their mandate independently and efficiently, and their decisions should be made public, with space for public comment.
69. Give institutions in charge of combatting corruption more power. The State Commission for the Prevention of Corruption (SCPC) should be granted unrestricted access to all relevant registers for checking income and assets declaration, and effectively sanction, should public officials fail to submit required declarations or disclose conflict of interests and other relevant information. The interoperability of the SCPC and law enforcement agencies should be improved in terms of access to both content and processes. The SCPC would also have more credibility in its fight against corruption if it collected and monitored indicators of the success of the Anti-Corruption Program 2016–19.
7.4.1.3 Policy action 3: Strengthen mechanisms ensuring freedom of the press and of civil society organizations
70. Enhance the independence of public media. The Public Service Broadcaster should strive to be completely impartial and independent of political, commercial, and other influences so as to contribute to an informed population. It should have adequate resources to ensure effective operations and management. Legislation to make it fully transparent and accountable to all stakeholders is also important. A communications and engagement strategy crafted in consultation with private and public stakeholders could facilitate a change in the public perception of the broadcaster.
71. Strengthen the participation of civil society in the policy debate. Representatives of nongovernment actors are crucial partners in ensuring that public policies respond to the needs and expectations of Macedonians, and that perceptions of the government are consistent with the outcomes observed. Building up the capacity and the participation of civil society organizations (CSOs) in governance process is a priority to ensure that government is accountable to its citizens. For instance, the government can legally protect CSOs from interference and harassment by any public institution. CSOs
232 Independent Senior Experts' Group (2017). The former Yugoslav Republic of Macedonia: Assessment and Recommendations of the Senior Experts' Group on Systemic Rule of Law Issues, September 2017, Brussels.
FYR MACEDONIA SYSTEMATIC COUNTRY DIAGNOSTIC
208 CHAPTER 7. PRIORITIES FOR ACHIEVING FASTER, MORE INCLUSIVE, AND SUSTAINABLE GROWTH
should be consulted regularly, in an inclusive and nondiscriminatory way. Finally, when the government provides financing to CSOs, it must be fully transparent.
7.4.2 Ensure Fiscal Sustainability by Reducing Fiscal Risks, Improving the Efficiency of Spending, and Enhancing Revenue Mobilization
7.4.2.1 Policy action 1: Address fiscal risks (pensions, municipal finances, SOEs), and strengthen the transparency and credibility of public finances
72. Ensure the sustainability of the pension system. The pension deficit in FYR Macedonia has gone up significantly in recent years; it is now 4 percent of GDP and expected to rise further as the population ages. Among possible policy actions are indexing pensions to prices to ensure that they are adequate; increasing the total contribution rate for pension insurance split proportionally between the first and second pension pillars; gradually harmonizing accrual rates for multi-pillar and PAYG-only participants to narrow the new-old pension differentials; rationalizing early retirement schemes; and gradually increasing the retirement age of 64 for men and 62 for women, which is among the lowest in the region and also low for current life expectancy.
73. Strengthen fiscal discipline and prevent the recurrence of arrears. At an estimated 3.5 percent of GDP in May 2017, public sector arrears pose a risk discontinued service delivery and a rise in public indebtedness. The recurrence of arrears suggests a lack of fiscal discipline. Among possible policy actions are ensuring strict adherence to medium-term budget ceilings; strengthening the use of the commitment module in the Treasury and extending it to off-budget users; introducing mandatory medium-term budgeting with multi-year budget ceilings closely aligned with multi-annual commitments; strengthening the medium-term macro-fiscal forecasting and planning and public sector accounting rules and enforcing oversight and internal controls on budgetary users; reinforcing public investment management; introducing mandatory deadlines for payments through harmonization with the EU Payment Directive; and addressing the inefficiencies of sectors with structural imbalances that lead to recurring arrears (local governments, health, education, SOEs).
74. Strengthen municipal finances to improve the ability of local governments to deliver quality public services in a sustainable manner. Local government spending is modest as a share of total spending, but local government accountability for delivery of services is poor, leaving many communities underserved. It would be well to improve the monitoring of local government finances and utilities by requiring monthly reports requirements to the Ministry of Finance. In addition, to be effective, transfers such as block grants and capital grants need to be simplified and made more transparent. Renewal of aging infrastructure is a priority and includes development of regional solid waste management facilities, introduction of smart city concepts to improve public transport and urban livability, citizen service centers, and services to remote communities, such as water and transport. The decentralized functions delegated to local governments need to be redesigned, in particular education, to ensure shared responsibility and clear lines of accountability. Collection of local taxes needs to be built up and the tax base for local government taxes (primarily property) widened.
SEIZING A BRIGHTER FUTURE FOR ALL
209CHAPTER 7. PRIORITIES FOR ACHIEVING FASTER, MORE INCLUSIVE, AND SUSTAINABLE GROWTH
75. Reform SOEs to ensure their financial sustainability and improve their service provision. SOE debt in FYR Macedonia was close to 8.2 percent of GDP in 2017, and SOEs account for over one-third of total national arrears. They need to be reformed not only to reduce arrears but also to unleash their development potential. It is recommended that loss-making SOEs be taken into the general government budget and stricter rules introduced about new guarantees for SOEs (in line with state aid rules, as noted earlier). Better Ministry of Finance monitoring and oversight of the financial position of SOEs and their business and strategic plans would also help to inform decision-making about future guarantees. The recent Law on Public Communal Enterprises requires that local SOEs draft a business plan approved by the municipalities; stricter enforcement of this requirement is important, and local public enterprises and municipalities should be given training. The government could reconsider strategic ownership of SOEs and when appropriate design a privatization plan. Finally, corporate governance should be improved by the appointment of professional boards of directors, limiting the numbers of political appointees.
76. Make the state budget more transparent. The new government has adopted an ambitious and comprehensive PFM Reform Program for 2018–21 that addresses many of the weaknesses identified in recent diagnostic reports. It has also published the first Citizens’ Budget and makes monthly fiscal data for the central government electronically available. Building on this reform momentum, it is recommended to further boost transparency by regularly publishing general detailed government data online, expanding the documentation accompanying budget proposals and execution, explaining deviations from the initial targets, and reporting fiscal risks stemming from off-budget spending, SOEs, and government arrears. To further strengthen transparency and align with international statistical reporting systems, it would be advisable to consolidate the State road agency (PESR) with the general government for deficit and debt accounting purposes since it is a non-market non-profit institution which performs government functions, as per the Government Finance Statistics Manual (GFSM) 2014 and European System of National and Regional Accounts (ESA) 2010. Publication of tax expenditures (in line with state aid rules) is also recommended. Moreover, reinforcing the oversight role of the State Audit Office would ensure greater transparency and value for money.
77. Increase the predictability of fiscal policy by introducing fiscal rules and an effective and independent fiscal council. This will help strengthen effective control of accumulated obligations for subsequent budget cycles. Ever since 2008, the country has been running fiscal deficits due to a deterioration in revenues, poor spending discipline, and growing contingent liabilities, all of which affect the sustainability of public finances. Without fiscal consolidation, in the medium term both public debt and gross financing needs would continue to rise steeply. This would not only increase financing costs, diverting resources from growth-promoting investments, but undermine FRY Macedonia’s ability to respond to economic shocks.
7.4.2.2 Policy action 2: Reinforce the efficiency of public spending
78. Implement an integral reform to increase the efficiency of public spending and investment. A comparison of actual expenditures with the minimum expenditures necessary to achieve the same output levels suggests that efficiency reforms could yield savings for FYR Macedonia equal to more than 13 percent of total public spending, or that current resources could support more outputs. Public spending on education, health, social protection, infrastructure, and agricultural subsidies is particularly inefficient. Meanwhile, fiscal space needs to be created for new types of spending related to the country’s
FYR MACEDONIA SYSTEMATIC COUNTRY DIAGNOSTIC
210 CHAPTER 7. PRIORITIES FOR ACHIEVING FASTER, MORE INCLUSIVE, AND SUSTAINABLE GROWTH
aspiration to adopt EU standards in areas like the environment and regulatory quality, and also related to the pressures of an aging society in areas like pensions and health. Higher capital spending is also crowding out the necessary maintenance of roads, schools, and hospitals. Among possible policy responses are adopting management guidelines requiring all public investment projects be subject to cost-benefit analysis, readiness assessment, and alignment with sector strategies and medium-term budget plans. In addition, to avoid backlogging maintenance, all costs expected throughout the entire project life cycle need to be included in budget plans. Subsidies would need to be aligned with the EU state aid rules—particularly sectoral and SOE subsidies but also company-based and sectoral tax expenditures that are not aligned with the competition policy. In fact, the share of horizontal state aid for innovation and R&D could be increased at the expense of sectoral support for noncompetitive industries. In agriculture, product subsidies (e.g., tobacco) should be abolished to free up resources for the rural development programs and investments (e.g., in irrigation). A review of the impact of employment subsidies would also be useful to ensure program efficiency and avoid moral hazard.
7.4.2.3 Policy action 3: Increase tax compliance and tax progressivity
79. Strengthen tax administration. This will require addressing deficiencies in compliance-risk management, the limitations of formal administrative dispute-review processes, inadequate coverage of tax audits, and collection of large tax arrears. Significant efforts are needed to modernize the tax administration and increase voluntary taxpayer compliance. Working at the nexus between the quality of public services, enforcement of rules, and fairness (non-selective application of rules) would help shrink the informal economy.
80. Reform the tax system to mobilize revenues and make the system more progressive. The authorities could both broaden the tax base and increase progressivity by reviewing and rationalizing tax exemptions over the defined transition period; increasing the rates of ‘sin taxes’—excises on tobacco, oil and alcohol—and introducing taxes for sugary drinks and energy sources to reach EU levels over a defined transition period; increasing the progressivity of the personal income tax; and broadening the tax base for property taxation to boost local government revenues.
7.4.3 Invest in an Integrated Strategy to Reduce Air Pollution, Promote Low-Carbon Growth, and Build Resilience to Natural Hazards and Climate Change
7.4.3.1 Policy action 1: Adopt a comprehensive approach to air pollution
81. Adopt smart city concepts to reduce air pollution. Priority investments would be adoption of smart city concepts in the most polluted cities; promoting public transport, cycling, and walking; and better managing parking in city centers. Highly polluting Euro 1, 2 and 3 cars and buses need to be phased out. Promoting electromobility supported by a fuel tax should be considered to shift FYR Macedonia away from high emissions transport. Priority actions for domestic heating would be to provide incentives to encourage the switch from wood and electricity to biomass pellets, more efficient stoves, and in some cases natural gas. Better enforcement is required for environmental permits for polluting industry and construction sites, which will require capacity building at the State Environmental Inspectorate. A policy that adopts the principles of “polluter pays” should be put in place and an environmental fund set up
SEIZING A BRIGHTER FUTURE FOR ALL
211CHAPTER 7. PRIORITIES FOR ACHIEVING FASTER, MORE INCLUSIVE, AND SUSTAINABLE GROWTH
with the proceeds from fines and other revenues, to then be used to provide incentives for industry to switch to cleaner technologies. The Institute of Public Health need better training and resources to maintain pollution monitoring stations, undertake the necessary human bio-monitoring, and develop economic approaches to prioritize air pollution interventions.
7.4.3.2 Policy action 2: Enhance implementation of the National Program for inter-agency co-ordination of disaster risk management and build resilience to climate change
82. The National Platform needs consolidation and reinforcement. FYR Macedonia is unusually vulnerable to risks from earthquakes, floods, and droughts, the latter two intensified by climate change. Drafting national programs and policies to reduce climate and disaster impacts in threatened sectors is a vital first step to reduce disaster risks to public buildings and infrastructure. Creation in 2009 of an inter-ministerial, private, and civil society mechanism for coordinating disaster and climate risks (the National Platform) was a critical step in the right direction but it now needs consolidation and reinforcement. It is also essential that FYR Macedonia commit to action and progress on the international 2015 Sendai Framework for Disaster Risk Reduction and comply with associated EU directives. Increasing financial resilience after a disaster can be improved by sovereign access to rapid and flexible financing and through insurance of private and public assets. Insurance is one mechanism to reduce contingent liabilities, but to ensure deep insurance penetration requires a combination of access to insurance, compulsion measures, culture change, and fiscal and political discipline. Given the country’s experience with severe disaster events in recent years, improvements to its emergency response system should be a national priority in terms of enhancing early warning systems, modernizing equipment for search and rescue operations, integrating preparedness and response procedures into all sectors, and launching information campaigns for local communities to raise awareness on exposure levels and protective measures. Building up and modernizing the national hydro-meteorological agencies will provide significant benefits in the form of more accurate and timely warnings of extreme weather events.
7.4.3.3 Policy action 3: Shift the energy sector to a low-carbon development path, away from the current dependence on coal, while improving security and efficiency of energy supply
83. Start moving to a more affordable and less carbon-intensive development path. Building on significant institutional, legal, regulatory, and investment moves in the recent past, FYR Macedonia can transition to a more affordable and less carbon-intensive development path by scaling up of energy efficiency, increasing use of renewable energy sources, and integrating into the regional energy market. To increase efficiency, the government needs to carry forward the National Energy Efficiency Action Plan and invest in retrofitting public buildings. It should also finish drafting the energy efficiency law and add a scalable financing mechanism to allow energy savings to be reinvested in energy-efficiency measures. Renewable sources of energy can be promoted through the established government support mechanism for attracting investment in renewables. A feed-in tariff system already guarantees purchase of energy generated by renewable sources, such as small hydro, wind, solar, biomass, and biogas, but uptake has been slow. The government, as the energy law envisaged, should scale up preparation of private-sector-financed renewable energy projects and allocate sufficient land for the purpose. Regional integration can be expedited by applying the EC and Energy Community “soft measures” on integration, which include removal of subsidies and barriers to trading. FYR Macedonia should also seek to diversify its supply of gas and better integrate with regional markets. Since investment in domestic distribution
FYR MACEDONIA SYSTEMATIC COUNTRY DIAGNOSTIC
212 CHAPTER 7. PRIORITIES FOR ACHIEVING FASTER, MORE INCLUSIVE, AND SUSTAINABLE GROWTH
systems will also increase the demand for gas, municipalities will need financing support to effectively implement these programs.
7.5 Conclusion
84. FYR Macedonia has considerable untapped potential. However, accelerating growth and expanding the returns to further economic development will require swift action to address a range of pressing challenges, including a shrinking workforce, high levels of labor inactivity and unemployment, and barriers to economic inclusion among women, the youth, and ethnic minorities. Moreover, the country’s growing middle-income class will expect more from public institutions, and an aging population increase pressure on social services. Addressing these challenges will require a long-term commitment and a robust political consensus. The priorities identified in this Systematic Country Diagnostic are designed to inform a strategy that starts to turn FYR Macedonia’s potentials into actuals, seizing the opportunity of a brighter future for all.
SEIZING A BRIGHTER FUTURE FOR ALL
213CHAPTER 7. PRIORITIES FOR ACHIEVING FASTER, MORE INCLUSIVE, AND SUSTAINABLE GROWTH

This page is intentionally blank.
References
Acemoglu, D., Aghion, P., Lelarge, C., Van Reenen, J. and Zilibotti, F. (2007). Technology, Information, and the Decentralization of the Firm. Quarterly Journal of Economics, 12(4), 1759–1799.
Acemoglu, D., Gallego, F. and Robinson, J.A. (2014). Institutions, Human Capital, and Development. Annual Review of Economics, 6:875-912.
Aghion, P. and Griffith, R. (2008). Competition and Growth: Reconciling Theory and Evidence. The MIT Press, Cambridge, MA.
Akamai, various, https://www.akamai.com/Akee, R., Copeland, W., Costello, E.J., Holbein, J.B. and Simeonova, E. (2018a). Family Income and the
Intergenerational Transmission of Voting Behavior: Evidence from an Income Intervention. NBER Working Paper No. 24770.
Akee, R., Copeland, W., Costello, E.J., Holbein, J.B. and Simeonova, E. (2018b). This Is the Link Between Voting in Elections and Income. VoxEU, World Economic Forum. Published on 20 July 2018. www.weforum.org/agenda/2018/07/low-voter-turnout-increasing-household-income-may-help
Alderman, H. (Ed.) (2011). No Small Matter. Washington, DC: The World Bank.Amiti, M. and Khandelwal, A.K. (2013). Import Competition and Quality Upgrading. Review of
Economics and Statistics, 95(2), pp. 476-490. Andrews, D., Criscuolo, C. and Gal, P. (2016). The Global Productivity Slowdown, Technology Divergence
and Public Policy: A Firm Level Perspective. OECD, 50.Arctic Economic Council (AEC), various, https://arcticeconomiccouncil.com/Arias, O.S., Sánchez-Páramo, C., Dávalos, M. E., Santos, I., Tiongson, E.R., Gruen, C., de Andrade
Falcão, N., Saiovici, G. and Cancho, C.A. (2014). Back to Work: Growing with Jobs in Europe and Central Asia. Europe and Central Asia Reports. Washington, DC: World Bank.
Atoyan, R. and Rahman, J. (2017). Western Balkans: Increasing Women’s Role in the Economy. IMF Working Paper No. 17/194. International Monetary Fund, Washington DC.
Autor, D., Levy, F. and Murnane, R.J. (2003). The Skill Content of Recent Technological Change: An Empirical Exploration. The Quarterly Journal of Economics, 2003, vol. 118, issue 4, 1279-1333.
Bartels, L.M. (2009). Unequal Democracy: The Political Economy of the New Gilded Age. Princeton University Press.
Bartelsman, E., Haltiwanger J.C. and Scarpetta, S. (2004). Microeconomic Evidence of Creative Destruction in Industrial and Developing Countries. Policy Research Working Paper Series 3464, The World Bank.
Bertelsmann Stiftung’s Transformation Index (BTI). 2018. Country Report Macedonia. http://www.bti-project.org/fileadmin/files/BTI/Downloads/Reports/2018/pdf/BTI_2018_Macedonia.pdf
Besedes, T. and Prusa, T.J. (2006). Ins, Outs, and the Duration Trade. Canadian Journal of Economics, 39, 266–295.
Bishev, G. and Petkovski, M. (2004). Understanding Reforms in Macedonia (Vienna Institute for International Economic Studies Balkan Observatory Working Papers 42.
SEIZING A BRIGHTER FUTURE FOR ALL
215REFERENCES
Bjelic, P. (2016). Trade Facilitation and Non-Tariff Measures in Beverages and Auto-Parts Supply Chains in CEFTA. Deutsche Gesellschaft für Internationale Zusammenarbeit (GIZ) GmbH.
Blažková, I. and Dvouletý, O. (2017). Is the Price-cost Margin Affected by the Market Concentration? Evidence from the Czech Food and Beverages Industry. Business and Economic Horizons, 13(2), 256-269.
Brenton, P., and Newfarmer, R. (2009). Watching More Than the Discovery Channel to Diversify Exports. In Newfarmer, R., Shaw, W. and Walkenhorst, P. Breaking into New Markets: Emerging Lesson for Export Diversification (pp. 111‐126). Washington, DC: World Bank.
Brody, M. and Strukova, E. (2018). An Economic Analysis of Health Effects of Ambient Air Pollution and their Costs in FYR Macedonia. Consultant report prepared for the World Bank. June 2018.
Bussolo, M., Koettl, J. and Sinnott, E. (2015). Golden Aging: Prospects for Healthy, Active, and Prosperous Aging in Europe and Central Asia. Washington, DC: The World Bank.
Cabral, L.M.B. and Mata, J. (2003). On the Evolution of the Firm Size Distribution: Facts and Theory. American Economic Review, Vol. 93, No. 4, pp. 1075-1090.
Cadot, O., Carrere, C, and Strauss-Khan, V. (2011). Export Diversification: What’s behind the Hump? 2009.34. 2011. <halshs-00553597>
Calderon, C. and Liu, L. (2003). The Direction of Causality between Financial Development and Economic Growth. Journal of Development Economics, 72(1): 321–34.
Chaloupka, F., Straif, K. and Leon, M. (2011). Effectiveness of Tax and Price Policies in Tobacco Control. Tobacco Control, 20:235-238.
Cirera, x. and Maloney, W.F. (2017). The Innovation Paradox: Developing-Country Capabilities and the Unrealized Promise of Technological Catch-Up. Washington, DC: World Bank.
Commission for the Protection of Competition, various, http://www.kzk.gov.mk/eng/Commission on Growth and Development. (2008). The Growth Report: Strategies for Sustained Growth
and Inclusive Development. Washington, DC.: World Bank.Conway, A.R.A, Kane, M.J, Bunting, M.F., Hambrick, D.Z., Wilhelm O. and Engle R.W. (2005). Working
Memory Span Tasks: A Methodological Review and User’s Guide. Psychology Bulletin Review, 2005; 12:769–786.
Cox, L., Fox, M. and Bowen, R.L. (1995). Does Tourism Destroy Agriculture? Annals of Tourism Research, 22 (1), 210-213.
Cuberes, D. and Teignier, M. (2016). Aggregate Effects of Gender Gaps in the Labor Market: A Quantitative Estimate. Journal of Human Capital, 10, no. 1 (Spring 2016): 1-32.
Cusolito, A.P., Correa, P. and Pena, J. (2018, forthcoming). Identifying and Quantifying the Effects of Investment Climate on Total Factor Productivity.
Cusolito, A., Davies, E., Hernandez, M. and Pena, J. (2018, forthcoming). Firm Dynamics, Productivity and Jobs in FYR Macedonia.
Cusolito, A.P., Divakaran, S., Lerner, J., Leamon, A. and Bosiljevac, V. (2016). Macedonian Venture Capital Ecosystem Diagnostic to Support the Creation of Innovative Start-ups and SMEs: A Roadmap from Diagnostics to Operations. Washington, D.C.
Davalos, M.E., Demarchi, G., Santos, I., Kits, B. and Oral, I. (2016). Voices of Europe and Central Asia: New Insights on Shared Prosperity and Jobs. Washington, DC.: The World Bank.
FYR MACEDONIA SYSTEMATIC COUNTRY DIAGNOSTIC
216 REFERENCES
De Loecker, J. (2013). Detecting Learning by Exporting. American Economic Journal: Microeconomics, 5(3), 1–21. https://doi.org/10.1257/mic.5.3.1
DHL Global Connectedness Index 2016. Available at: http://www.dhl.com/en/about_us/logistics_insights/studies_research/global_connectedness_index/global_connectedness_index.html#.VFff5MkpxuM
Dickson, V. (2005). Price-cost Margins, Prices and Concentration in US Manufacturing: A Panel Study. Applied Economics Letters, 12(2), 79-83.
Dietz, B. (2010). Migration and Remittances in Macedonia: A Review. Arbeiten aus dem Osteuropa-Institut Regensburg Working Paper No. 281.
Doing Business, http://www.doingbusiness.org/dataDuckworth, A.L., Peterson, C., Matthews, M.D. and Kelly, D.R. (2007). Grit: Perseverance and passion
for long-term goals. Journal of Personality and Social Psychology, 92, 1087–1101.Easterly, W. and Levine, R. (2001). It's Not Factor Accumulation: Stylized Facts and Growth Models.
Washington, DC: World Bank.Embassy of the Republic of Macedonia, https://www.preventionweb.net/files/globalplatform/macedonia.
pdfEnergy Community Secretariat (2017). Secretariat's Implementation Report 2017. Esteban, J. and Ray, D. (2008). On the Salience of Ethnic Conflict. American Economic Review, 98(5), pp.
2185–2202.European Bank for Reconstruction and Development. (2009). EBRD Insolvency Law Assessment, 2009,
FYR Macedonia, http://www.ebrd.com/what-we-do/sectors/legal-reform/debt-restructuring-and-bankruptcy/sector-assessments.html
European Bank for Reconstruction and Development. Life in Transition Survey (LITS), variousEuropean Bank for Reconstruction and Development. (2017). Transition Report 2017-18.European Commission. Environment, http://ec.europa.eu/environment/water/flood_risk/implem.htm;
Inspire, http://inspire.ec.europa.eu/; Joint Research Centre, http://eurocodes.jrc.ec.europa.eu/; European Civil Protection and Humanitarian Aid Operations, http://ec.europa.eu/echo/what/civil-protection/mechanism_en
European Commission. (2014). The Former Yugoslav Republic of Macedonia 2014 Progress Report. (Report No. SWD(2014) 303).
European Commission. (2015). The Former Yugoslav Republic of Macedonia 2015 Progress Report. (Report No. SWD(2015) 212).
European Commission. (2016a). Small Business Assessment Fact Sheet.European Commission. (2016b). The Former Yugoslav Republic of Macedonia 2016 Report. (Report No.
SWD(2016) 362). European Commission. (2017a). 2017 SBA Fact Sheet: The Former Yugoslav Republic of Macedonia.European Commission. (2017b). Consolidated Multi-Annual Action Plan for a Regional Economic Area
in the Western Balkans. Brussels, 1-18.European Commission. (2018). The Former Yugoslav Republic of Macedonia 2018 Report. (Report No.
SWD(2018) 154).European Commission. Eurostat, http://ec.europa.eu/eurostat
SEIZING A BRIGHTER FUTURE FOR ALL
217REFERENCES
European Council. (2003). Thessaloniki Presidency Conclusions. 11638/03. Thessaloniki: 19 and 20 June 2003.
European Environment Agency. (2017). Air quality in Europe – 2017 report, No 13/2017. European Research Centre for Anti-Corruption and State-Building (ERCAS), Index of Public Integrity
data, https://integrity-index.org/European Stability Initiative, https://www.esiweb.org/index.php?lang=enandid=563fDi Intelligence, various, https://www.fdiintelligence.com/fDi markets.com, various, https://www.fdimarkets.com/Finance Think (2017). The Survey on Quality of Life in Macedonia 2017, http://www.financethink.mk/
models/survey-on-quality-of-life-in-macedonia-2017/ Food and Agriculture Organization (FAO) and World Bank (2014). Land and Gender: Improving Data
Availability and Use in the Western Balkans. FAO and World Bank, Rome and Washington, DC.Forzieri, G., Bianchi, A., Batista e Silva, F., Herrera, M.A.M., Leblois, A., Lavalle, C., Aerts, J.C.J.H. and
Feyen, L. (2018). Escalating Impacts of Climate Extremes on Critical Infrastructures in Europe.Foster, L., Haltiwanger, J. and Syverson, C. (2008). Reallocation, Firm Turnover, and Efficiency: Selection
on Productivity or Profitability? American Economic Review, Vol. 98, No. 1, pp. 394-425. Fowler, A. (2013). Electoral and Policy Consequences of Voter Turnout: Evidence from Compulsory
Voting in Australia. Quarterly Journal of Political Science, no. 2, 159-182.Global Facility for Disaster Reduction and Recovery Think Hazard platform, www.thinkhazard.orgGilens, M. (2012). Affluence and Influence: Economic Inequality and Political Power in America. Princeton
University Press.Goodwin, T.K. and Pierola Castro, M.D. (2015). Export Competitiveness: Why Domestic Market
Competition Matters. Public policy for the private sector; Note no. 348. Washington, DC: World Bank Group.
Government of FYR Macedonia. (2014). Republic of Macedonia: Monitoring the Situation of Children and Women—Multiple Indicator Cluster Survey 2011.
Griffin, J.D., and Newman, B. (2005). Are Voters Better Represented? The Journal of Politics, 67, no. 4: 1206-1227.
Groh, A., Liechtenstein, H. and Lieser, K. (2011). The Global Venture Capital and Private Equity Country Attractiveness Index.
Hall, R.E. and Jones, C.I. (1999). Why Do Some Countries Produce So Much More Output Per Worker Than Others? The Quarterly Journal of Economics, Vol. 114, No. 1, pp. 83-116.
Hallegatte, S., Bangalore, M., Bonzanigo, L., Fay, M., Kane, T., Narloch, U., Rozenberg, J., Treguer, D. and Vogt-Schilb, A. (2016). Shock Waves: Managing the Impacts of Climate Change on Poverty. Washington, D.C.: The World Bank.
Hallward-Driemeier, M. and Pritchett, L. (2011). How Business is Done and The 'Doing Business' Indicators: The Investment Climate When Firms Have Climate Control. World Bank Policy Research Working Paper No. 5563.
Haltiwanger, J., Jarmin, R. S., Kulick, R. and Miranda, J. (2016). High Growth Young Firms: Contribution to Job, Output and Productivity Growth. Working Papers 16-49, Center for Economic Studies, U.S. Census Bureau.
FYR MACEDONIA SYSTEMATIC COUNTRY DIAGNOSTIC
218 REFERENCES
Hopenhayn, H. A. (1992). Entry, Exit, and Firm Dynamics in Long Run Equilibrium. Econometrica, Vol. 60(5), pages 1127-1150.
Hsieh, C.T. and Klenow, P.J. (2009). Misallocation and Manufacturing TFP in China and India. The Quarterly Journal of Economics, Vol. 124, No. 4, pp. 1403-1448.
IFAC (2016). The Role of SMPs in Providing Business Support to SMEs: New Evidence, https://www.ifac.org/publications-resources/role-smps-providing-business-support-smes-new-evidence
IHME (Institute for Health Metrics and Evaluation). Global Burden of Disease (GBD) 2017 data, http://www.healthdata.org/gbd/data
Independent Senior Experts' Group. (2015). The former Yugoslav Republic of Macedonia: Recommendations of the Senior Experts' Group on systemic Rule of Law issues relating to the communications interception. Revealed in Spring 2015, 8 June 2015.
Independent Senior Experts' Group. (2017). The former Yugoslav Republic of Macedonia: Assessment and Recommendations of the Senior Experts' Group on Systemic Rule of Law Issues. September 2017, Brussels.
Institute of Public Health. (2014). Annual Report on the Health Status of the Population in the Republic of Macedonia 2013. Skopje: Institute of Public Health.
International Budget Partnership, various, https://www.internationalbudget.org/International Disaster Database, EM-DAT, https://www.emdat.be/International Energy Agency (IEA), various, https://www.iea.org/International Federation of Accountants. (2017). The Role of SMPs in Providing Business Support to
SMEs: New Evidence. International Finance Corporation (2015). Implementing Trade Logistics Reforms in Complex Multi-
Country and Regional Settings: The Case of the Western Balkans (Report 99065). Washington, D.C.: International Finance Corporation.
International Monetary Fund. (1998). Former Yugoslav Republic of Macedonia: Recent Economic Developments (Country Report No. 98/82).
International Monetary Fund. (2011). Former Yugoslav Republic of Macedonia: Selected Issues (Country Report No. 15/243).
International Monetary Fund. (2015). Former Yugoslav Republic of Macedonia: Selected Issues (Country Report No. 15/243).
International Monetary Fund. (2016a). Former Yugoslav Republic of Macedonia: 2016 Article IV Consultation-Press Release; and Staff Report (Country Report No. 16/356).
International Monetary Fund. (2016b). FYR Macedonia: Tax Administration Diagnostic Assessment Tool Performance Assessment Report.
International Monetary Fund. (2017). Former Yugoslav Republic of Macedonia: 2017 Article IV Consultation-Press Release; and Staff Report (Country Report No. 17/354).
International Monetary Fund, World Economic Outlook database, April 2018.Johnson, S., McMillan, J. and Woodruff, C. (2002). Property Rights and Finance. American Economic
Review, 92(5): 1335-56.Jorgensen, E. and Shkaratan, M. (2014). Former Yugoslav Republic of Macedonia - Green Growth Country
Assessment (Report No. ACS8179).
SEIZING A BRIGHTER FUTURE FOR ALL
219REFERENCES
Jovanovic, B. (1982). Selection and the Evolution of Industry. Econometrica, Vol. 50, No. 3 (May, 1982), pp. 649-670.
Jovanovik, B. (2017). The Real Price of the Cheap Labour Force: Policies for Attracting Foreign Investment in Macedonia 2007-2015. Skopje: Institute of Social Sciences and Humanities.
Jovanovska, M., Belogaska, E. and Sajnoski, S. (2001). Privatisation and Restructuring of the Socially- and State-owned Enterprises in the Republic of Macedonia and its Implications on Corporate Governance. Privatisation Agency of the Republic of Macedonia.
King, R.G. and Levine, R. (1993). Finance, Entrepreneurship and Growth: Theory and Evidence. Journal of Monetary Economics, 32(3):513–42.
Koettl-Brodmann, J., Johansson de Silva, S. and Kupets, O. (2017a). Firm Dynamics and Job Creation in the Former Yugoslav Republic of Macedonia. Report Number 112197-MK, World Bank Group, Washington DC.
Koettl-Brodmann, J., Johansson de Silva, S., Kupets, O. and Naceva, B. (2017b). Looking for skills in the former Yugoslav Republic Macedonia. (Working Paper Report No. 112196).
Konrad Adenauer Foundation. (2013).Lazarov, D. and Petreski, G. (2016). Human Capital as a Binding Constraint to Economic Growth: The
Case of Macedonia. Croatian Economic Survey, 2016, vol. 18, issue 1, 35-70.Leighley, J.E., and Nagler, J. (2013) Who Votes Now?: Demographics, Issues, Inequality, and Turnout in the
United States. Princeton, NJ: Princeton University Press.LinkedIn and World Bank. (2018, forthcoming). Skills in High-Value Added Sectors: Evidence from
FYR Macedonia (Mimeo).Lopez Calva, L.F. and Rodriguez, C. (2016). Pro-growth equity: A policy Framework for the Twin Goals.
(World Bank Policy Research Working Paper Series 7897). Washington, D.C.: The World Bank.Macedonian Bank for Development Promotion, http://www.mbdp.com.mk/index.php/en/lending/smeMadestam, A., Shoag, D., Veuger, S. and Yanagizawa-Drott, D. (2013). Do Political Protests Matter?
Evidence from the Tea Party Movement. The Quarterly Journal of Economics, 128, no. 4: 1633-1685.
Manevska-Tasevska, G. (2006). An Economic Analysis of the Macedonian Viticulture: A Competitiveness View of the Grape and Wine Sectors.
Mankiw, G. (2013). Macroeconomics. 8th ed. Houndmills: Palgrave Macmillan.Mavrotas, G. and Son, S. (2006). Financial Sector Development and Growth: Re-examining the Nexus.
In Bagella, M., Becchetti, L. and Hasan, I., eds. Transparency, Governance and Markets. Oxford: Elsevier Publishers.
Melitz, M.J. and Polanec, S. (2015). Dynamic Olley-Pakes Decomposition with Entry and Exit. RAND Journal of Economics, 46(2), 362–375. https://doi.org/10.1111/1756-2171.12088.
Milevska K., Neda, S.C., Ninez, A., Ewoud van Ginneken, P. and Winkelmann, J. (2017). The Former Yugoslav Republic of Macedonia: Health System Review. Health Systems in Transition. Copenhagen, Netherlands: European Observatory on Health Systems and Policies.
Ministry of Economy of the Republic of Macedonia. (2009). National Strategy for Tourism Development 2009-2013.
FYR MACEDONIA SYSTEMATIC COUNTRY DIAGNOSTIC
220 REFERENCES
Ministry of Environment and Physical Planning of FYR Macedonia. (2017). Macedonian Air Quality Assessment Report for 2005-2015.
Ministry of Finance, Republic of Macedonia, https://www.finance.gov.mk/enMojsoska-Blazevski, N. (2018). Trends in Labor Markets in FYR Macedonia: A Gender Lens (English).
Washington, D.C. : World Bank Group.Mojsoska-Blazevski, N., Petreski, M. and Öztas, A. (2017). National Research on Low Female Labour
Market Participation (Quantitative based evidence from a new survey), Skopje, UN Women.Mojsoska-Blazevski, N., Petreski, M. and Petreska, D. (2015). Increasing the Labor Market Activity of
the Poor, Females, and Informal Workers: Let’s Make Work Pay in Macedonia. Eastern European Economics, 53:6, 466-490.
Mojsoska-Blazevski, N. and The State Statistical Office of Macedonia. (2016). Labour Market Transitions of Young Women and Men in the Former Yugoslav Republic of Macedonia: Results of the 2014 School-to-work Transition Survey. Work4Youth Publication Series No. 37.
Molina, A.C. and Fugazza, M. (2009). The Determinants of Trade Survival. IHEID Working Papers 05-2009, Economics Section, The Graduate Institute of International Studies, revised Jun 2009.
Mulabdic, A. and Ruta, M. (2017). Note on the Content of the Central European Free Trade Agreement (CEFTA) (background note produced for the World Bank). Washington, D.C.
Mungiu-Pippidi, A. (2015). The Quest for Good Governance: How Societies Develop Control of Corruption. Cambridge, U.K.: Cambridge University Press.
Munoz-Boudet and Naceva (2018, forthcoming). Building the Socioemotional Skills in FYR Macedonia. National Bank of the Republic of Macedonia. (1993). Annual Report 1992. National Bank of the Republic of Macedonia, http://www.nbrm.mk/statistika-en.nspxNicoletti, G., Scarpetta, S. and Boylaud, O. (1999). Summary Indicators of Product Market Regulation
With an Extension to Employment Protection Legislation. OECD Economics Department Working Papers, No. 226.
North, D.C. (1991). Institutions. Journal of Economic Perspectives, 5(1): 97-112.North, D.C. and Thomas, R.P. (1973). The Rise of the Western World: A New Economic History. Cambridge,
UK: Cambridge University Press.Novkovska, B. and Novkovski, N. (2018). Energy Consumption and Hidden Economy in Macedonia:
Causes and Responses. Journal of Policy Modelling.Observatory of Economic Complexity, data, https://atlas.media.mit.edu/en/OECD. Indicators of Product Market Regulation Homepage, http://www.oecd.org/eco/growth/
indicatorsofproductmarketregulationhomepage.htmOECD. PISA results, http://www.oecd.org/pisa/OECD. (2010). OECD Transfer Pricing Guidelines for Multinational Enterprises and Tax Administrations.
22 July 2010. OECD. (2014). PISA 2012 Results: What Students Know and Can Do. (Volume I, Revised edition,
February 2014): Student Performance in Mathematics, Reading and Science, PISA, OECD Publishing, Paris, http://dx.doi.org/10.1787/9789264208780-en.
OECD-WBG. (2018, forthcoming). Product Market Regulation Assessment for FYR Macedonia. Washington, D.C.: OECD and the World Bank Group.
SEIZING A BRIGHTER FUTURE FOR ALL
221REFERENCES
Official Gazette, various laws.Official Journal of the European Union, various regulations.Panagariya, A. (2004). Miracles and Debacles: In Defence of Trade Openness. The World Economy, 27(8),
pp. 1149–1171.Pellizzari, M. and Pica, G. (2010). Liberalizing Professional Services: Evidence from Italian Lawyers.
Working Papers 372, IGIER (Innocenzo Gasparini Institute for Economic Research), Bocconi University.
Petreski, M. and Jovanovic, B. (2016). Do Remittances Reduce Social Disparities in Macedonia? Published In: Giordano, C., Hayoz, N. and Herlth, J. (Eds.). Diversity of Migration in South East Europe (Interdisciplinary Studies on Central and Eastern Europe Vol. 16), Bern.
Petreski, M., Mojsoska-Blazevski, N. and Bergolo, M. (2016). Labor-Market Scars When Youth Unemployment Is Extremely High: Evidence from Macedonia (IZA Discussion Paper No. 10342).
Petreski, M., Mojsoska‐Blazevski, N., Ristovska, M. and Smokvarski, E. (2014). Youth Self-Employment in Households Receiving Remittances in Macedonia. PEP Working Paper 2014‐08. Online: http://dx.doi.org/10.2139/ssrn.2526737
Regional Cooperation Council. (2016). Balkan Barometer 2016: Business Opinion Survey.Ridao-Cano, C. and Bodewig, C. (2018). Growing United: Upgrading Europe's Convergence Machine.
World Bank, Washington, DC. World Bank. https://openknowledge.worldbank.org/handle/10986/29448 License: CC BY 3.0 IGO.
Ringold, D., Orenstein, M.A. and Wilkens, E. (2005). Roma in an Expanding Europe: Breaking the Poverty Cycle. World Bank: Washington, DC. https://rownosc.info/media/uploads/roma_in_expanding_europe.pdf.
Schlozman, K.L., Verba, S. and Brady, H.E. (2012). The Unheavenly Chorus: Unequal Political Voice and the Broken Promise of American Democracy. Princeton University Press.
Schneider, F. (2015). Size and Development of the Shadow Economy of 31 European and 5 other OECD Countries from 2003 to 2015: Different Developments? Journal of Self-Governance and Management Economics 3(4): 7–29.
Schwarz, A.M., Arias, O.S., Zviniene, A., Rudolph, H.P., Eckardt, S., Koettl, J.; Immervoll, H. and Abels, M. (2014). The Inverting Pyramid: Pension Systems Facing Demographic Challenges in Europe and Central Asia. Washington, DC: World Bank.
Setiawan, M., Emvalomatis, G. and Lansink, A.O. (2012). Industrial concentration and price-cost margin of the Indonesian food and beverages sector. Applied Economics, 44(29), 3805-3814.
Shimbov, B. Alguacil and Suarez. (2018, forthcoming). Export structure upgrading and economic growth in the Western Balkan countries.
Smith, O. and Nguyen, S.N. (2013). Getting Better: Improving Health System Outcomes in Europe and Central Asia. Europe and Central Asia Reports. Washington, DC: World Bank Group.
State Statistical Office, Republic of Macedonia, MAKSTAT, http://www.stat.gov.mk/Default_en.aspxTeleGeography, varoius, https://www.telegeography.com/The Economist Intelligence Unit (EIU), https://www.eiu.com/home.aspxTransparency International. (2011). EU Anti-Corruption Requirements: Measuring Progress in Albania,
Kosovo, FYR Macedonia and Turkey. Transparency International.
FYR MACEDONIA SYSTEMATIC COUNTRY DIAGNOSTIC
222 REFERENCES
Transparency International. (2013). Global Corruption Barometer 2013. UN Comtrade, International Trade Statistics database, https://comtrade.un.org/UNDP/WB/EC. (2017). Regional Roma survey 2017.UNICEF. Multiple Indicator Cluster Survey (MICS), https://www.unicef.org/statistics/index_24302.htmlUNICEF. (2013). Leave No Child Behind, Building Equity for Children (Country Report Former Yugoslav
Republic of Macedonia).United Nations Conference on Trade and Development. (2012). World Investment Report 2012: Towards
a New Generation of Investment Policies.United Nations Conference on Trade and Development. (2016). World Investment Report 2016: Investor
Nationality: Policy Challenges. Geneva: UNCTAD.United Nations, Department of Economic and Social Affairs, Population Division (2013). Trends in
International Migrant Stock: The 2013 Revision. United Nations database, POP/DB/MIG/Stock/Rev.2013.
US State Department Office of Investment Affairs, FYR Macedonia Commercial Guide, https://www.export.gov/article?id=Macedonia-State-Owned-Enterprises
Varieties of Democracy database, V-Dem, https://www.v-dem.net/en/Verba, S., Schlozman, K.L. and Brady, H.E. (1995). Voice and Equality: Civic Voluntarism in American
Politics. Harvard University Press.Winters, L., McCulloch, N. and McKay, A. (2004). Trade Liberalization and Poverty: The Evidence so Far.
Journal of Economic Literature, 42(1), 72-115.Wölfl, A., Wanner, I., Kozluk, T. and Nicoletti, G. (2009). Ten Years of Product Market Reform in OECD
Countries - Insights from a Revised PMR Indicator. EconomicsDepartment Working Papers, No. 695.
World Bank. Enterprise Surveys, http://www.enterprisesurveys.org/World Bank. Logistics Performance Index LPI, https://lpi.worldbank.org/World Bank. World Development Indicators WDI, https://data.worldbank.org/products/wdi.World Bank. World Integrated Trade Solution, https://wits.worldbank.org/World Bank. Worldwide Governance Indicators, https://datacatalog.worldbank.org/dataset/worldwide-
governance-indicatorsWorld Bank. (1995). FYR Macedonia. Country Economic Memorandum. World Bank. (2003). FYR Macedonia. Country Economic Memorandum—Tackling Unemployment.
Report no. 26681-MK.World Bank. (2004). World Development Report 2005: A Better Investment Climate for Everyone. World
Bank.World Bank. (2009). FYR Macedonia 2009 Poverty Assessment. Poverty, Jobs and Firms: An Assessment
for 2002-2006. Report No. 48510-MK.World Bank. (2011-2015). South East Europe and Caucasus Catastrophe Risk Insurance Facility (Serbia
and Macedonia). World Bank Project (P110910).World Bank (2012a). Macedonian Green Growth and Climate Change Analytic and Advisory Support
Program. Brief, November 2012.
SEIZING A BRIGHTER FUTURE FOR ALL
223REFERENCES
World Bank. (2012b). Making Exports a Catalyst for Economic Growth: An Assessment of FYR Macedonia’s Trade Competitiveness. Policy Note No. 1 of FYR Macedonia Modular Competitiveness Assessment Series.
World Bank (2012c). Trade Assessment for FYR Macedonia. Washington, D.C.: The World Bank.World Bank (2012d). World Development Report 2013: Jobs.World Bank. (2013a). FYR Macedonia Gender Diagnostic: Gaps in Endowments, Access to Economic
Opportunities and Agency. Washington D.C.: The World Bank.World Bank. (2013b). Reducing the Vulnerability of the Former Yugoslav Republic of Macedonia’s
Agricultural Systems to Climate Change. Impact assessment and adaptation options. A World Bank study.
World Bank. (2014a). Country Partnership Strategy for the former Yugoslav Republic of Macedonia for the period of FY2015–FY2018.
World Bank. (2014b). FYR Macedonia: Economic Mobility, Jobs and Gender. Washington, D.C.World Bank. (2014c). FYR Macedonia Employment and Job Creation: Labor Market Assessment 2007-
2011. Washington, DC: The World Bank.World Bank. (2014d). FYR Macedonia Workforce Development: SABER Country Report 2014. Washington,
D.C.: The World Bank.World Bank. (2014e). The Inverting Pyramid: Pension Systems Facing Demographic Challenges in Europe
and Central Asia.World Bank. (2015a). FYR Macedonia Public Expenditure Review: Fiscal Policy for Growth. Washington,
D.C.: The World Bank.World Bank. (2015b). The Regional Balkans Infrastructure Study (REBIS) Update. Washington, D.C.: The
World Bank.World Bank. (2015c). Water and Wastewater Services in the Danube Region. Washington, D.C.: The
World Bank.World Bank. (2016a). Country Risk Profiles for Floods and Earthquakes. Europe and Central Asia.
Washington, D.C.: The World Bank.World Bank. (2016b). Estimating Job Creation and Labor Market Transformations driven by Foreign
Investment in Manufacturing in FYR Macedonia. Washington, D.C.: The World Bank.World Bank. (2016c). FYR Macedonia - Program for International Student Assessment 2015 (Education
Brief Report No. 112365). World Bank. (2016d). FYR Macedonia - Supplier Development Pilot Program Toolkit: Materials and
Lessons Learned. World Bank. (2016e). FYR Macedonia: Technical Note on Public-Private Dialogue (produced for the Local
and Regional Competitiveness Project). Washington, D.C.World Bank. (2016f). Positioning FYR Macedonia for the Global Economy: The Impact of Reforms and
Investment Promotion in FYR Macedonia’s Automotive Components Manufacturing Sector. Washington, DC: Author.
World Bank. (2017a). Poverty Reduction, Shared Prosperity and Inequality in FYR Macedonia in the Post Financial Crisis Period (2009-2013). Working Paper No. 114786.
FYR MACEDONIA SYSTEMATIC COUNTRY DIAGNOSTIC
224 REFERENCES
World Bank. (2017b). Promoting Women’s Access to Economic Opportunities in FYR Macedonia - Policy Note. World Bank, Washington, DC.
World Bank. (2017c). Revving Up the Engines of Growth and Prosperity in the Western Balkans. Western Balkans Regional Systematic Country Diagnostics Synthesis Report, No. ACS22690. Washington DC. The World Bank.
World Bank. (2017d). Trade in Transition: Europe and Central Asia Economic Update, May. Washington, DC: The World Bank.
World Bank. (2017e). Western Balkans: Agriculture for Jobs and Growth, A Regional Study (Report No. AUS19883). Washington, D.C.: The World Bank.
World Bank. (2017f). Western Balkans: Regional Economic Integration Issues Notes. Washington, D.C: The World Bank.
World Bank. (2017g). World Development Report 2017: Governance and the Law. Washington, D.C.: The World Bank.
World Bank. (2018a). FYR Macedonia Public Finance Review. Washington, D.C.: The World Bank.World Bank. (2018b). Understanding the Experiences of LGBTI People in South East Europe.World Bank Group. (2018c). World Development Report 2018: Learning to Realize Education's Promise.
Washington, DC: World Bank.World Bank Group. (2018d). World Development Report 2019: The Changing Nature of Work. Washington,
DC: World Bank.World Bank. (2018d). Leveling the Playing Field: Rethinking the Social Contract in Europe and Central
Asia. Washington, D.C.: The World Bank.World Bank and Government of FYR Macedonia (2015). Pilot Supplier Development Program.
Washington, D.C.: The World Bank.World Bank Group and Vienna Institute for International Economic Studies. (2018). Western Balkans
Labor Market Trends 2018. World Bank, Washington, D.C.World Economic Forum, WEF. The Global Competitiveness Report, various, https://www.weforum.org/World Economic Forum, WEF. (2016). Executive Opinion Survey 2016, The Global Competitiveness
Report 2016-2017 of the World Economic Forum.World Health Organization (2017). World Health Statistics: Monitoring Health for the SDGs. Geneva:
World Health Organization.
SEIZING A BRIGHTER FUTURE FOR ALL
225REFERENCES

This page is intentionally blank.

Annexes
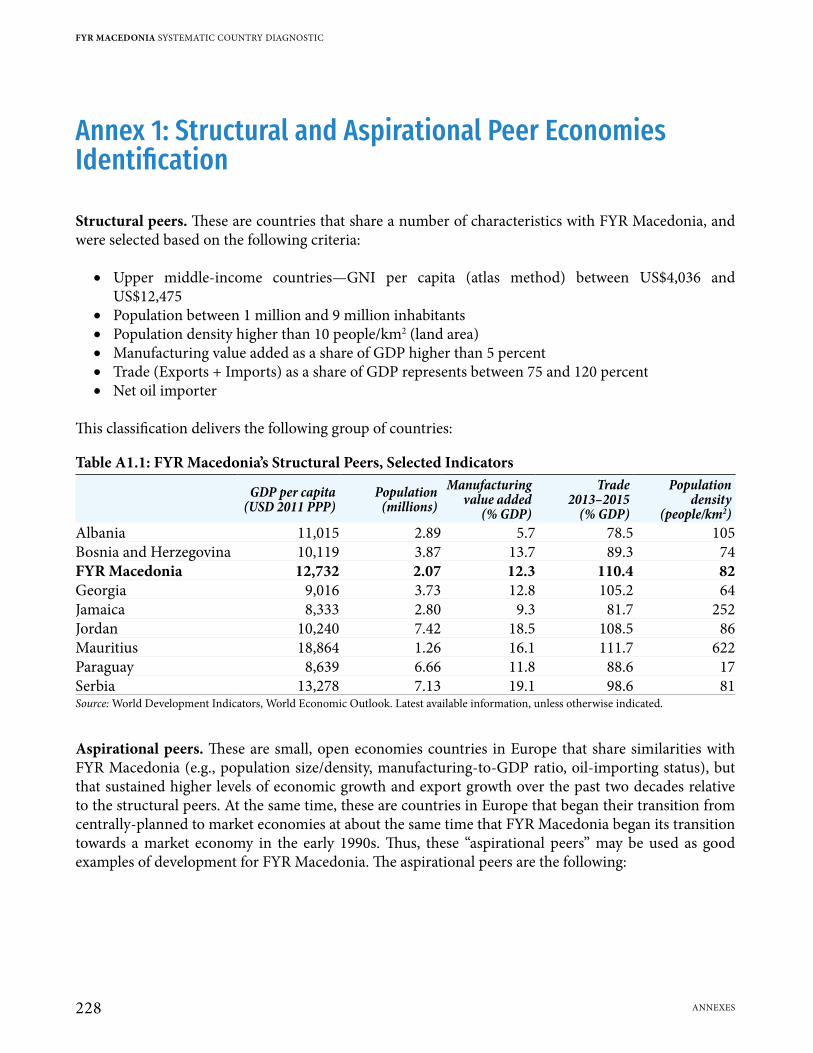
Annex 1: Structural and Aspirational Peer Economies Identification
Structural peers. These are countries that share a number of characteristics with FYR Macedonia, and were selected based on the following criteria:
• Upper middle-income countries—GNI per capita (atlas method) between US$4,036 and US$12,475
• Population between 1 million and 9 million inhabitants • Population density higher than 10 people/km2 (land area) • Manufacturing value added as a share of GDP higher than 5 percent • Trade (Exports + Imports) as a share of GDP represents between 75 and 120 percent • Net oil importer
This classification delivers the following group of countries:
Table A1.1: FYR Macedonia’s Structural Peers, Selected Indicators
GDP per capita (USD 2011 PPP)
Population (millions)
Manufacturing value added
(% GDP)
Trade 2013–2015
(% GDP)
Population density
(people/km2)Albania 11,015 2.89 5.7 78.5 105Bosnia and Herzegovina 10,119 3.87 13.7 89.3 74FYR Macedonia 12,732 2.07 12.3 110.4 82Georgia 9,016 3.73 12.8 105.2 64Jamaica 8,333 2.80 9.3 81.7 252Jordan 10,240 7.42 18.5 108.5 86Mauritius 18,864 1.26 16.1 111.7 622Paraguay 8,639 6.66 11.8 88.6 17Serbia 13,278 7.13 19.1 98.6 81Source: World Development Indicators, World Economic Outlook. Latest available information, unless otherwise indicated.
Aspirational peers. These are small, open economies countries in Europe that share similarities with FYR Macedonia (e.g., population size/density, manufacturing-to-GDP ratio, oil-importing status), but that sustained higher levels of economic growth and export growth over the past two decades relative to the structural peers. At the same time, these are countries in Europe that began their transition from centrally-planned to market economies at about the same time that FYR Macedonia began its transition towards a market economy in the early 1990s. Thus, these “aspirational peers” may be used as good examples of development for FYR Macedonia. The aspirational peers are the following:
FYR MACEDONIA SYSTEMATIC COUNTRY DIAGNOSTIC
228 ANNExES
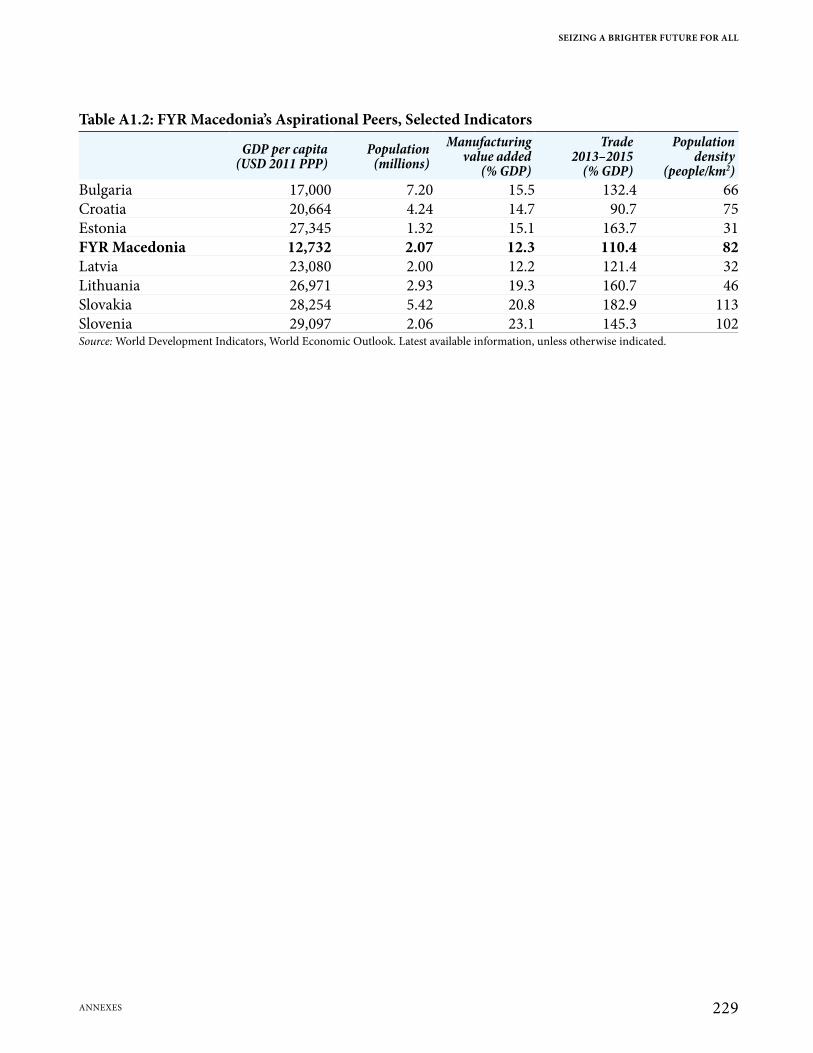
Table A1.2: FYR Macedonia’s Aspirational Peers, Selected Indicators
GDP per capita (USD 2011 PPP)
Population (millions)
Manufacturing value added
(% GDP)
Trade 2013–2015
(% GDP)
Population density
(people/km2)Bulgaria 17,000 7.20 15.5 132.4 66Croatia 20,664 4.24 14.7 90.7 75Estonia 27,345 1.32 15.1 163.7 31FYR Macedonia 12,732 2.07 12.3 110.4 82Latvia 23,080 2.00 12.2 121.4 32Lithuania 26,971 2.93 19.3 160.7 46Slovakia 28,254 5.42 20.8 182.9 113Slovenia 29,097 2.06 23.1 145.3 102Source: World Development Indicators, World Economic Outlook. Latest available information, unless otherwise indicated.
SEIZING A BRIGHTER FUTURE FOR ALL
229ANNExES
Annex 2: Benchmarking Development Indicators
An analytical benchmarking exercise was conducted for the FYR Macedonia SCD to help identify binding constraints to achieve inclusive and sustainable growth. The comparisons of FYR Macedonia vis-à-vis its structural and aspirational peers is further supported and complemented by a benchmarking exercise which includes over 136 indicators on economic development. The selected indicators cover a wide range of topics, including demographics (e.g., population growth, life expectancy), structure of the economy (e.g., agriculture/manufacturing value added), macroeconomic conditions (e.g. inflation, fiscal and external balances), income inequality (e.g., GINI coefficient), international trade (e.g., foreign direct investment, growth of exports and imports), finance (e.g., percent of firms with access to a bank loan), human development (e.g., PISA scores, mortality rates, out-of-pocket health expenditures), labor markets (e.g., share of youth not in education, employment, or training), access to public services (e.g., water and sanitation, electricity), infrastructure and connectivity (e.g., road density, logistics), environment (e.g., deforestation, pollution), disaster-risk management, investment climate (e.g., extent of market dominance, intellectual property protection), quality of institutions (e.g., rule of law, transparency and accountability, regulatory quality), among others.
The benchmarking exercise compares the performance of FYR Macedonia with that of the best achievers across three groups: the world, the European Union, and the Europe and Central Asia region. Box A2.1 presents the methodology used for benchmarking, borrowing from similar analysis in the SCDs of Colombia and Chile. The magnitude of the difference between FYR Macedonia and the best achievers in each domain is assessed using the normalized gap to the best performing country. The results are presented in Figure A2.1. The lower the value of the measure (which is bounded between 0 and 1), the better FYR Macedonia performs with respect to the comparison group.
Based on the results of the benchmarking exercise, we apply a criterion to identify emerging priority areas. A priority level is assigned to each indicator according to the criteria described in Table A2.1. Priority areas of particular importance are those where FYR Macedonia lags behind in comparison to ECA. Moreover, to determine the ranking of each, the average performance across all comparison groups has been calculated. The results of this exercise are presented in Figure A2.1 and Table A2.2.
The benchmarking exercise supports the identification of emerging constraints to productivity growth in FYR Macedonia. The economic literature identifies productivity determinants within two groups, following Syverson (2011) who identifies two groups for productivity determinants. The first group includes factors that may be used to improve productivity and which remain within the individual producer’s control. Examples of this are management skills and the quality for different types of inputs such as labor, capital, and innovation. Factors out of the producer’s control are grouped in the second
Table A2.1: Criteria for Selecting Priority LevelsNormalized Gap to Top Performer in the Group
1 (lowest priority) Less than 20 percent2 20 to 50 percent3 50 to 80 percent4 (highest priority) 80 percent of more
FYR MACEDONIA SYSTEMATIC COUNTRY DIAGNOSTIC
230 ANNExES
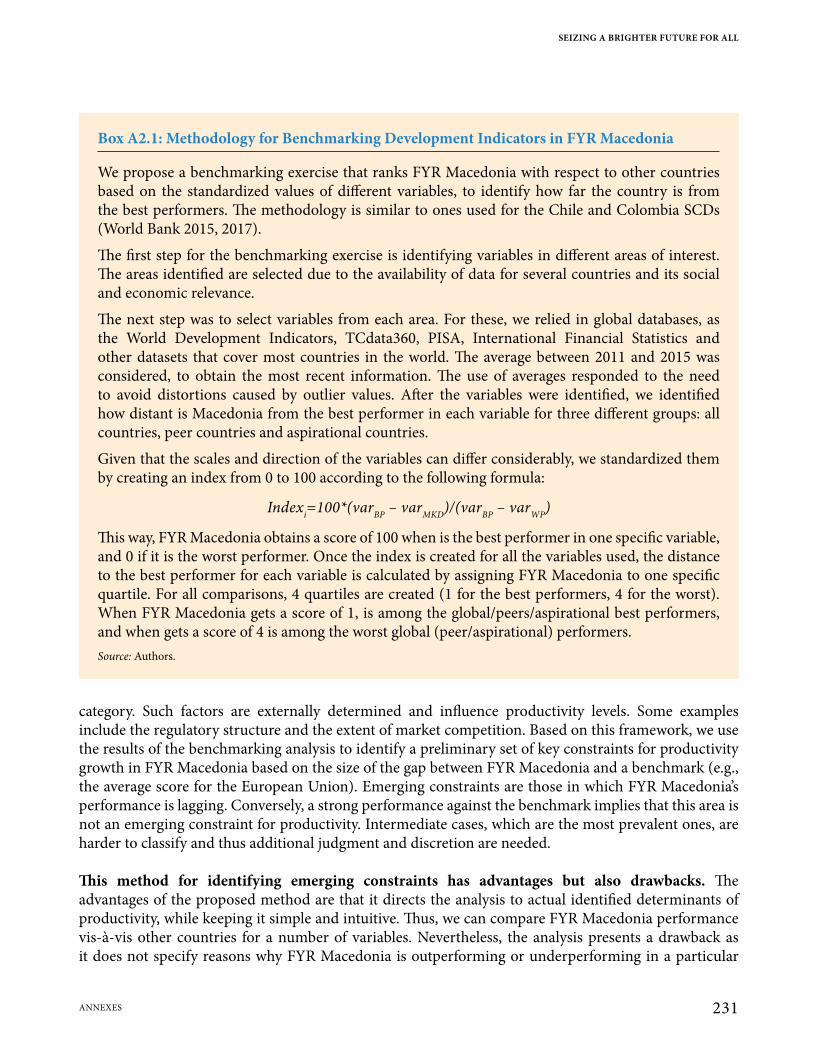
Box A2.1: Methodology for Benchmarking Development Indicators in FYR Macedonia
We propose a benchmarking exercise that ranks FYR Macedonia with respect to other countries based on the standardized values of different variables, to identify how far the country is from the best performers. The methodology is similar to ones used for the Chile and Colombia SCDs (World Bank 2015, 2017).
The first step for the benchmarking exercise is identifying variables in different areas of interest. The areas identified are selected due to the availability of data for several countries and its social and economic relevance.
The next step was to select variables from each area. For these, we relied in global databases, as the World Development Indicators, TCdata360, PISA, International Financial Statistics and other datasets that cover most countries in the world. The average between 2011 and 2015 was considered, to obtain the most recent information. The use of averages responded to the need to avoid distortions caused by outlier values. After the variables were identified, we identified how distant is Macedonia from the best performer in each variable for three different groups: all countries, peer countries and aspirational countries.
Given that the scales and direction of the variables can differ considerably, we standardized them by creating an index from 0 to 100 according to the following formula:
Indexi=100*(varBP – varMKD)/(varBP – varWP)
This way, FYR Macedonia obtains a score of 100 when is the best performer in one specific variable, and 0 if it is the worst performer. Once the index is created for all the variables used, the distance to the best performer for each variable is calculated by assigning FYR Macedonia to one specific quartile. For all comparisons, 4 quartiles are created (1 for the best performers, 4 for the worst). When FYR Macedonia gets a score of 1, is among the global/peers/aspirational best performers, and when gets a score of 4 is among the worst global (peer/aspirational) performers.Source: Authors.
category. Such factors are externally determined and influence productivity levels. Some examples include the regulatory structure and the extent of market competition. Based on this framework, we use the results of the benchmarking analysis to identify a preliminary set of key constraints for productivity growth in FYR Macedonia based on the size of the gap between FYR Macedonia and a benchmark (e.g., the average score for the European Union). Emerging constraints are those in which FYR Macedonia’s performance is lagging. Conversely, a strong performance against the benchmark implies that this area is not an emerging constraint for productivity. Intermediate cases, which are the most prevalent ones, are harder to classify and thus additional judgment and discretion are needed.
This method for identifying emerging constraints has advantages but also drawbacks. The advantages of the proposed method are that it directs the analysis to actual identified determinants of productivity, while keeping it simple and intuitive. Thus, we can compare FYR Macedonia performance vis-à-vis other countries for a number of variables. Nevertheless, the analysis presents a drawback as it does not specify reasons why FYR Macedonia is outperforming or underperforming in a particular
SEIZING A BRIGHTER FUTURE FOR ALL
231ANNExES
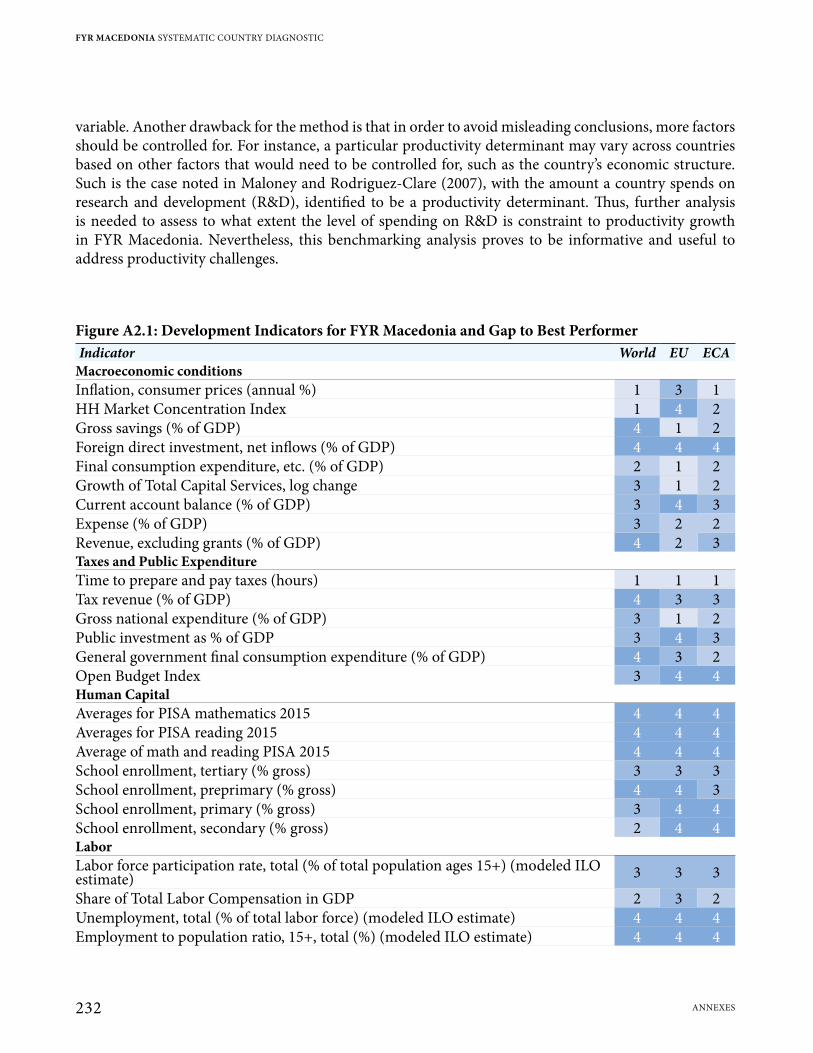
variable. Another drawback for the method is that in order to avoid misleading conclusions, more factors should be controlled for. For instance, a particular productivity determinant may vary across countries based on other factors that would need to be controlled for, such as the country’s economic structure. Such is the case noted in Maloney and Rodriguez-Clare (2007), with the amount a country spends on research and development (R&D), identified to be a productivity determinant. Thus, further analysis is needed to assess to what extent the level of spending on R&D is constraint to productivity growth in FYR Macedonia. Nevertheless, this benchmarking analysis proves to be informative and useful to address productivity challenges.
Figure A2.1: Development Indicators for FYR Macedonia and Gap to Best PerformerIndicator World EU ECA
Macroeconomic conditionsInflation, consumer prices (annual %) 1 3 1HH Market Concentration Index 1 4 2Gross savings (% of GDP) 4 1 2Foreign direct investment, net inflows (% of GDP) 4 4 4Final consumption expenditure, etc. (% of GDP) 2 1 2Growth of Total Capital Services, log change 3 1 2Current account balance (% of GDP) 3 4 3Expense (% of GDP) 3 2 2Revenue, excluding grants (% of GDP) 4 2 3Taxes and Public ExpenditureTime to prepare and pay taxes (hours) 1 1 1Tax revenue (% of GDP) 4 3 3Gross national expenditure (% of GDP) 3 1 2Public investment as % of GDP 3 4 3General government final consumption expenditure (% of GDP) 4 3 2Open Budget Index 3 4 4Human CapitalAverages for PISA mathematics 2015 4 4 4Averages for PISA reading 2015 4 4 4Average of math and reading PISA 2015 4 4 4School enrollment, tertiary (% gross) 3 3 3School enrollment, preprimary (% gross) 4 4 3School enrollment, primary (% gross) 3 4 4School enrollment, secondary (% gross) 2 4 4LaborLabor force participation rate, total (% of total population ages 15+) (modeled ILO estimate) 3 3 3
Share of Total Labor Compensation in GDP 2 3 2Unemployment, total (% of total labor force) (modeled ILO estimate) 4 4 4Employment to population ratio, 15+, total (%) (modeled ILO estimate) 4 4 4
FYR MACEDONIA SYSTEMATIC COUNTRY DIAGNOSTIC
232 ANNExES
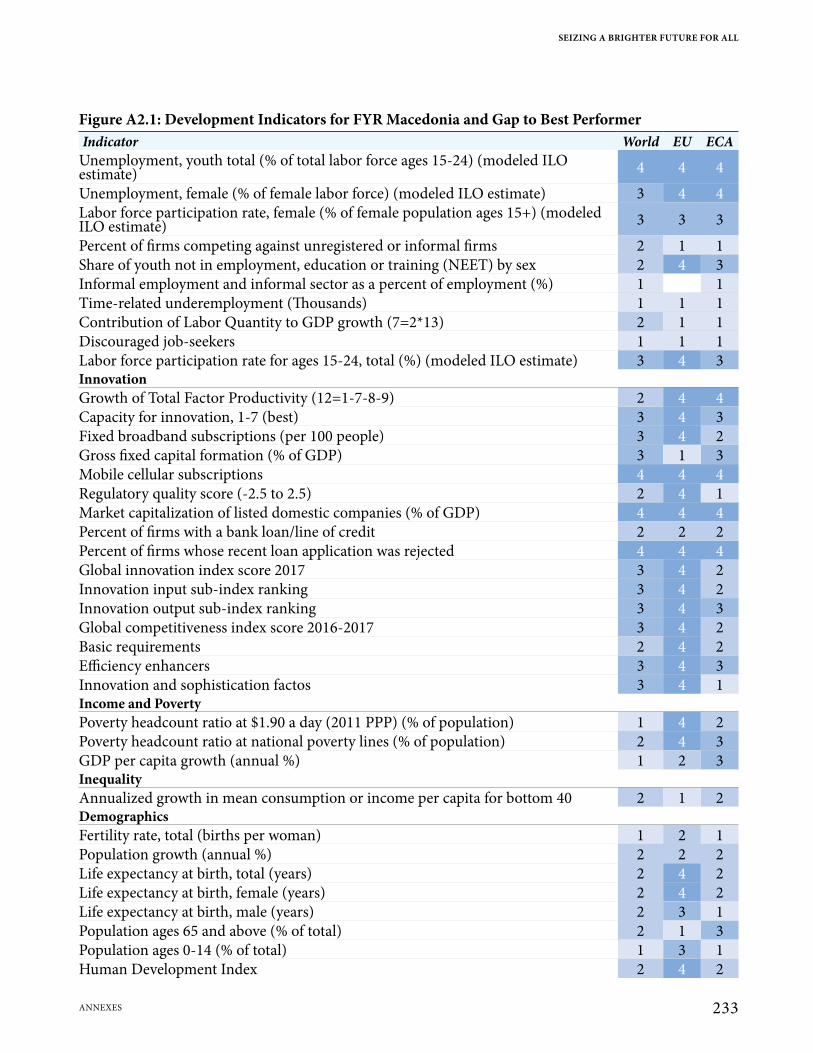
Figure A2.1: Development Indicators for FYR Macedonia and Gap to Best PerformerIndicator World EU ECA
Unemployment, youth total (% of total labor force ages 15-24) (modeled ILO estimate) 4 4 4
Unemployment, female (% of female labor force) (modeled ILO estimate) 3 4 4Labor force participation rate, female (% of female population ages 15+) (modeled ILO estimate) 3 3 3
Percent of firms competing against unregistered or informal firms 2 1 1Share of youth not in employment, education or training (NEET) by sex 2 4 3Informal employment and informal sector as a percent of employment (%) 1 1Time-related underemployment (Thousands) 1 1 1Contribution of Labor Quantity to GDP growth (7=2*13) 2 1 1Discouraged job-seekers 1 1 1Labor force participation rate for ages 15-24, total (%) (modeled ILO estimate) 3 4 3InnovationGrowth of Total Factor Productivity (12=1-7-8-9) 2 4 4Capacity for innovation, 1-7 (best) 3 4 3Fixed broadband subscriptions (per 100 people) 3 4 2Gross fixed capital formation (% of GDP) 3 1 3Mobile cellular subscriptions 4 4 4Regulatory quality score (-2.5 to 2.5) 2 4 1Market capitalization of listed domestic companies (% of GDP) 4 4 4Percent of firms with a bank loan/line of credit 2 2 2Percent of firms whose recent loan application was rejected 4 4 4Global innovation index score 2017 3 4 2Innovation input sub-index ranking 3 4 2Innovation output sub-index ranking 3 4 3Global competitiveness index score 2016-2017 3 4 2Basic requirements 2 4 2Efficiency enhancers 3 4 3Innovation and sophistication factos 3 4 1Income and PovertyPoverty headcount ratio at $1.90 a day (2011 PPP) (% of population) 1 4 2Poverty headcount ratio at national poverty lines (% of population) 2 4 3GDP per capita growth (annual %) 1 2 3InequalityAnnualized growth in mean consumption or income per capita for bottom 40 2 1 2DemographicsFertility rate, total (births per woman) 1 2 1Population growth (annual %) 2 2 2Life expectancy at birth, total (years) 2 4 2Life expectancy at birth, female (years) 2 4 2Life expectancy at birth, male (years) 2 3 1Population ages 65 and above (% of total) 2 1 3Population ages 0-14 (% of total) 1 3 1Human Development Index 2 4 2
SEIZING A BRIGHTER FUTURE FOR ALL
233ANNExES
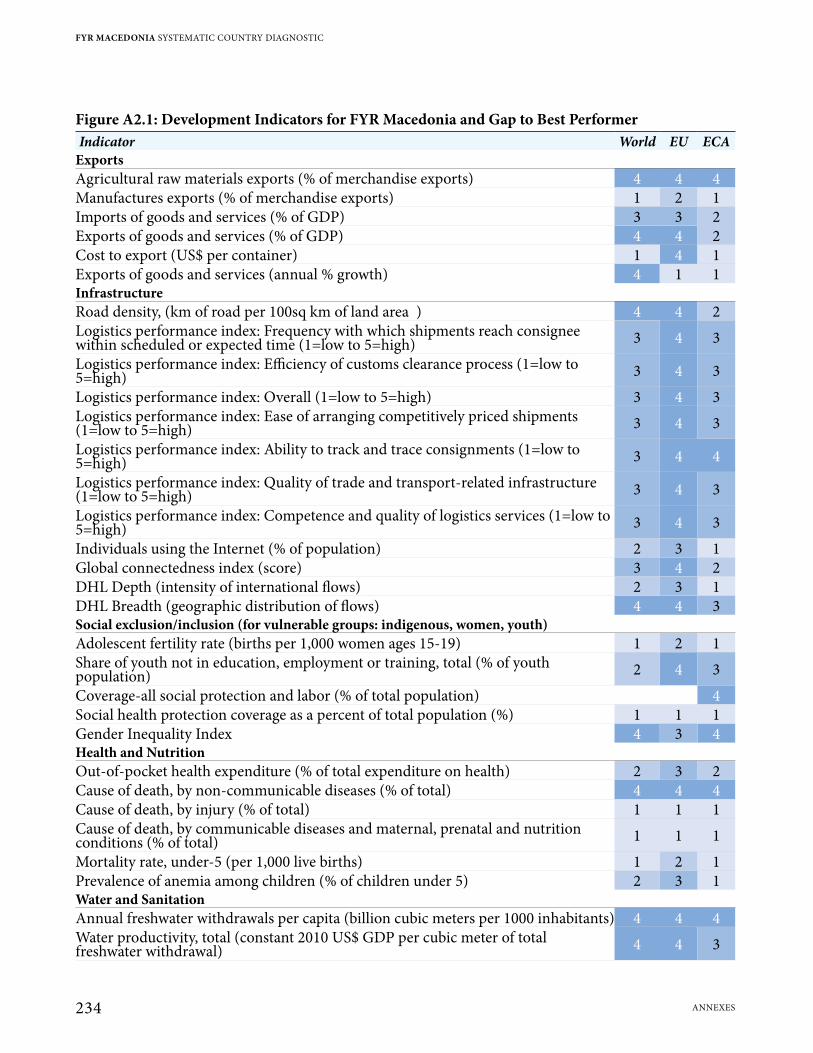
Figure A2.1: Development Indicators for FYR Macedonia and Gap to Best PerformerIndicator World EU ECA
ExportsAgricultural raw materials exports (% of merchandise exports) 4 4 4Manufactures exports (% of merchandise exports) 1 2 1Imports of goods and services (% of GDP) 3 3 2Exports of goods and services (% of GDP) 4 4 2Cost to export (US$ per container) 1 4 1Exports of goods and services (annual % growth) 4 1 1InfrastructureRoad density, (km of road per 100sq km of land area ) 4 4 2Logistics performance index: Frequency with which shipments reach consignee within scheduled or expected time (1=low to 5=high) 3 4 3
Logistics performance index: Efficiency of customs clearance process (1=low to 5=high) 3 4 3
Logistics performance index: Overall (1=low to 5=high) 3 4 3Logistics performance index: Ease of arranging competitively priced shipments (1=low to 5=high) 3 4 3
Logistics performance index: Ability to track and trace consignments (1=low to 5=high) 3 4 4
Logistics performance index: Quality of trade and transport-related infrastructure (1=low to 5=high) 3 4 3
Logistics performance index: Competence and quality of logistics services (1=low to 5=high) 3 4 3
Individuals using the Internet (% of population) 2 3 1Global connectedness index (score) 3 4 2DHL Depth (intensity of international flows) 2 3 1DHL Breadth (geographic distribution of flows) 4 4 3Social exclusion/inclusion (for vulnerable groups: indigenous, women, youth)Adolescent fertility rate (births per 1,000 women ages 15-19) 1 2 1Share of youth not in education, employment or training, total (% of youth population) 2 4 3
Coverage-all social protection and labor (% of total population) 4Social health protection coverage as a percent of total population (%) 1 1 1Gender Inequality Index 4 3 4Health and NutritionOut-of-pocket health expenditure (% of total expenditure on health) 2 3 2Cause of death, by non-communicable diseases (% of total) 4 4 4Cause of death, by injury (% of total) 1 1 1Cause of death, by communicable diseases and maternal, prenatal and nutrition conditions (% of total) 1 1 1
Mortality rate, under-5 (per 1,000 live births) 1 2 1Prevalence of anemia among children (% of children under 5) 2 3 1Water and SanitationAnnual freshwater withdrawals per capita (billion cubic meters per 1000 inhabitants) 4 4 4Water productivity, total (constant 2010 US$ GDP per cubic meter of total freshwater withdrawal) 4 4 3
FYR MACEDONIA SYSTEMATIC COUNTRY DIAGNOSTIC
234 ANNExES
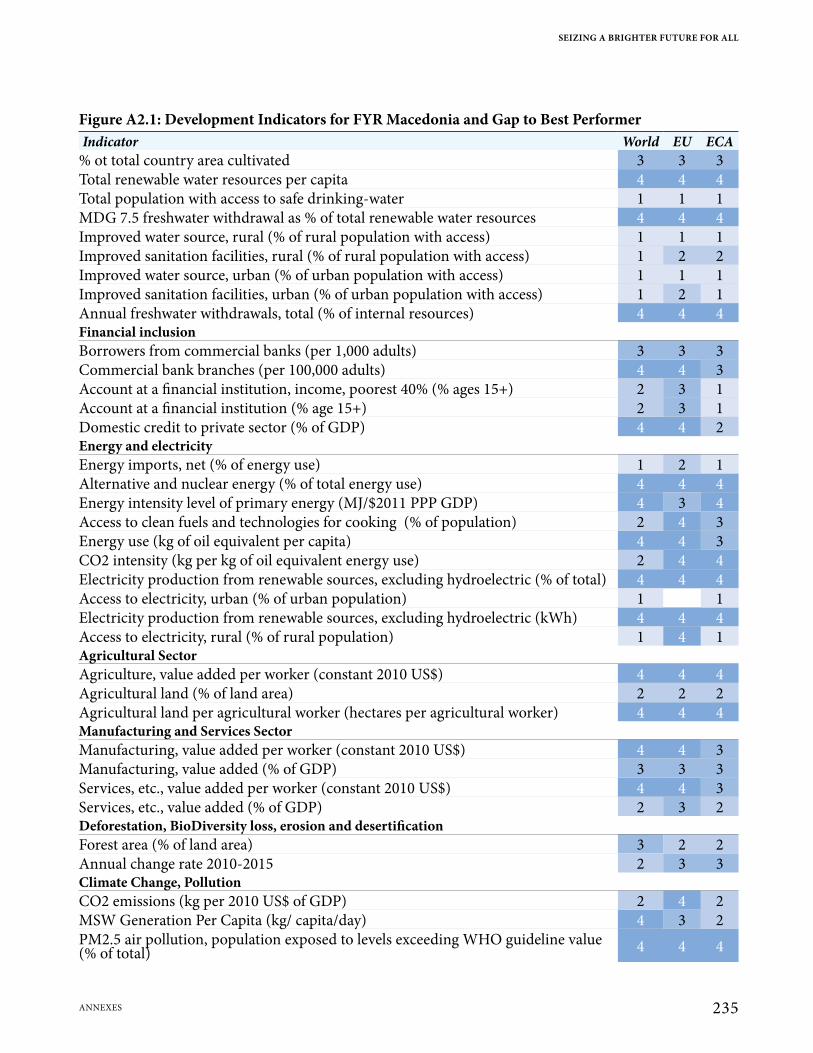
Figure A2.1: Development Indicators for FYR Macedonia and Gap to Best PerformerIndicator World EU ECA
% ot total country area cultivated 3 3 3Total renewable water resources per capita 4 4 4Total population with access to safe drinking-water 1 1 1MDG 7.5 freshwater withdrawal as % of total renewable water resources 4 4 4Improved water source, rural (% of rural population with access) 1 1 1Improved sanitation facilities, rural (% of rural population with access) 1 2 2Improved water source, urban (% of urban population with access) 1 1 1Improved sanitation facilities, urban (% of urban population with access) 1 2 1Annual freshwater withdrawals, total (% of internal resources) 4 4 4Financial inclusionBorrowers from commercial banks (per 1,000 adults) 3 3 3Commercial bank branches (per 100,000 adults) 4 4 3Account at a financial institution, income, poorest 40% (% ages 15+) 2 3 1Account at a financial institution (% age 15+) 2 3 1Domestic credit to private sector (% of GDP) 4 4 2Energy and electricityEnergy imports, net (% of energy use) 1 2 1Alternative and nuclear energy (% of total energy use) 4 4 4Energy intensity level of primary energy (MJ/$2011 PPP GDP) 4 3 4Access to clean fuels and technologies for cooking (% of population) 2 4 3Energy use (kg of oil equivalent per capita) 4 4 3CO2 intensity (kg per kg of oil equivalent energy use) 2 4 4Electricity production from renewable sources, excluding hydroelectric (% of total) 4 4 4Access to electricity, urban (% of urban population) 1 1Electricity production from renewable sources, excluding hydroelectric (kWh) 4 4 4Access to electricity, rural (% of rural population) 1 4 1Agricultural SectorAgriculture, value added per worker (constant 2010 US$) 4 4 4Agricultural land (% of land area) 2 2 2Agricultural land per agricultural worker (hectares per agricultural worker) 4 4 4Manufacturing and Services SectorManufacturing, value added per worker (constant 2010 US$) 4 4 3Manufacturing, value added (% of GDP) 3 3 3Services, etc., value added per worker (constant 2010 US$) 4 4 3Services, etc., value added (% of GDP) 2 3 2Deforestation, BioDiversity loss, erosion and desertificationForest area (% of land area) 3 2 2Annual change rate 2010-2015 2 3 3Climate Change, PollutionCO2 emissions (kg per 2010 US$ of GDP) 2 4 2MSW Generation Per Capita (kg/ capita/day) 4 3 2PM2.5 air pollution, population exposed to levels exceeding WHO guideline value (% of total) 4 4 4
SEIZING A BRIGHTER FUTURE FOR ALL
235ANNExES
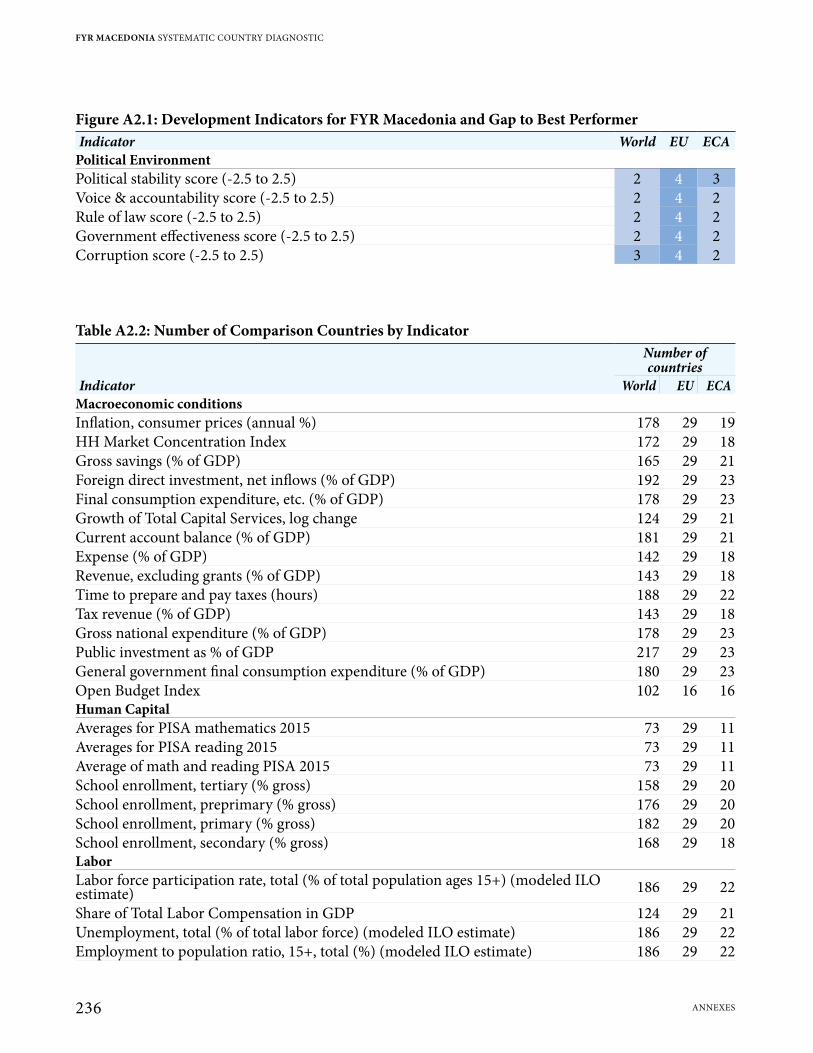
Figure A2.1: Development Indicators for FYR Macedonia and Gap to Best PerformerIndicator World EU ECA
Political EnvironmentPolitical stability score (-2.5 to 2.5) 2 4 3Voice & accountability score (-2.5 to 2.5) 2 4 2Rule of law score (-2.5 to 2.5) 2 4 2Government effectiveness score (-2.5 to 2.5) 2 4 2Corruption score (-2.5 to 2.5) 3 4 2
Table A2.2: Number of Comparison Countries by IndicatorNumber of countries
Indicator World EU ECAMacroeconomic conditionsInflation, consumer prices (annual %) 178 29 19HH Market Concentration Index 172 29 18Gross savings (% of GDP) 165 29 21Foreign direct investment, net inflows (% of GDP) 192 29 23Final consumption expenditure, etc. (% of GDP) 178 29 23Growth of Total Capital Services, log change 124 29 21Current account balance (% of GDP) 181 29 21Expense (% of GDP) 142 29 18Revenue, excluding grants (% of GDP) 143 29 18Time to prepare and pay taxes (hours) 188 29 22Tax revenue (% of GDP) 143 29 18Gross national expenditure (% of GDP) 178 29 23Public investment as % of GDP 217 29 23General government final consumption expenditure (% of GDP) 180 29 23Open Budget Index 102 16 16Human CapitalAverages for PISA mathematics 2015 73 29 11Averages for PISA reading 2015 73 29 11Average of math and reading PISA 2015 73 29 11School enrollment, tertiary (% gross) 158 29 20School enrollment, preprimary (% gross) 176 29 20School enrollment, primary (% gross) 182 29 20School enrollment, secondary (% gross) 168 29 18LaborLabor force participation rate, total (% of total population ages 15+) (modeled ILO estimate) 186 29 22
Share of Total Labor Compensation in GDP 124 29 21Unemployment, total (% of total labor force) (modeled ILO estimate) 186 29 22Employment to population ratio, 15+, total (%) (modeled ILO estimate) 186 29 22
FYR MACEDONIA SYSTEMATIC COUNTRY DIAGNOSTIC
236 ANNExES

Table A2.2: Number of Comparison Countries by IndicatorNumber of countries
Indicator World EU ECAUnemployment, youth total (% of total labor force ages 15-24) (modeled ILO estimate) 186 29 22
Unemployment, female (% of female labor force) (modeled ILO estimate) 186 29 22Labor force participation rate, female (% of female population ages 15+) (modeled ILO estimate) 186 29 22
Percent of firms competing against unregistered or informal firms 139 13 22Share of youth not in employment, education or training (NEET) by sex 133 29 18Informal employment and informal sector as a percent of employment (%) 21 1 8Time-related underemployment (Thousands) 98 29 16Contribution of Labor Quantity to GDP growth (7=2*13) 124 29 21Discouraged job-seekers 111 29 19Labor force participation rate for ages 15-24, total (%) (modeled ILO estimate) 186 29 22InnovationGrowth of Total Factor Productivity (12=1-7-8-9) 124 29 21Capacity for innovation, 1-7 (best) 150 29 19Fixed broadband subscriptions (per 100 people) 205 29 22Gross fixed capital formation (% of GDP) 176 29 23Mobile cellular subscriptions 208 29 22Regulatory quality score (-2.5 to 2.5) 202 29 23Market capitalization of listed domestic companies (% of GDP) 92 21 15Percent of firms with a bank loan/line of credit 139 13 22Percent of firms whose recent loan application was rejected 90 13 22Global innovation index score 2017 127 29 20Innovation input sub-index ranking 127 29 20Innovation output sub-index ranking 127 29 20Global competitiveness index score 2016-2017 138 29 19Basic requirements 138 29 19Efficiency enhancers 138 29 19Innovation and sophistication factos 138 29 19Income and PovertyPoverty headcount ratio at $1.90 a day (2011 PPP) (% of population) 80 12 20Poverty headcount ratio at national poverty lines (% of population) 85 12 22GDP per capita growth (annual %) 198 29 23InequalityAnnualized growth in mean consumption or income per capita for bottom 40 83 28 17DemographicsFertility rate, total (births per woman) 204 29 23Population growth (annual %) 217 29 23Life expectancy at birth, total (years) 202 29 23Life expectancy at birth, female (years) 202 29 23Life expectancy at birth, male (years) 202 29 23
SEIZING A BRIGHTER FUTURE FOR ALL
237ANNExES
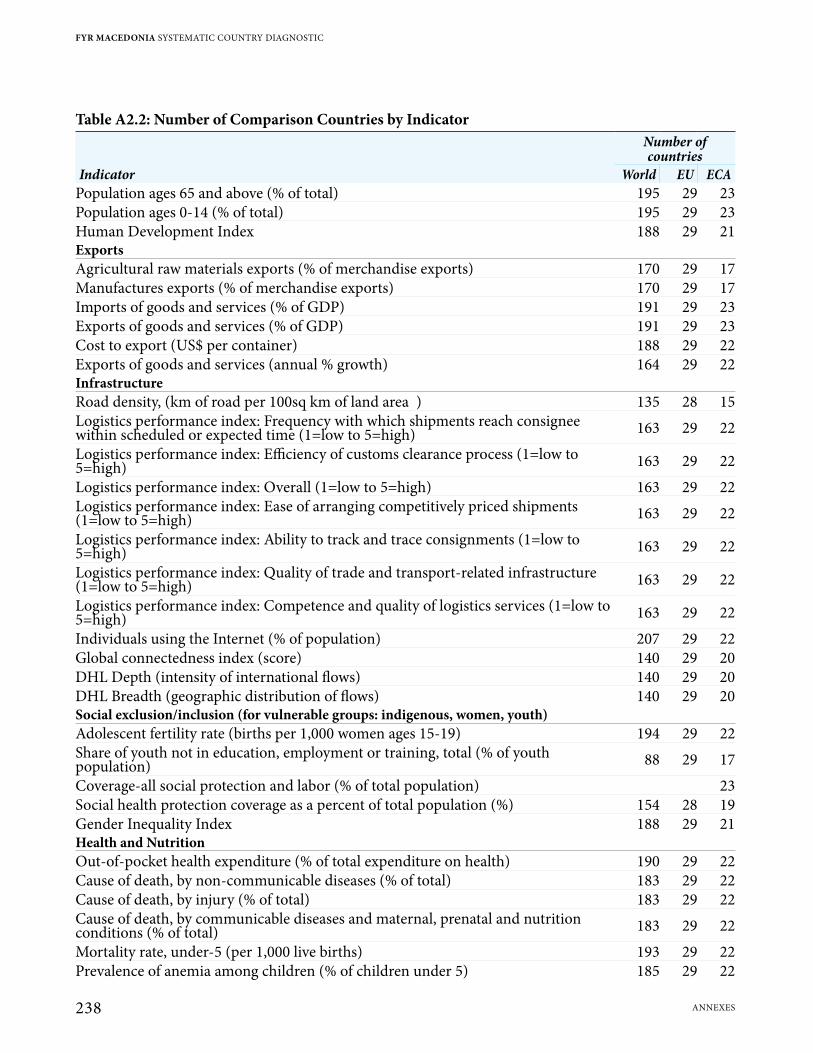
Table A2.2: Number of Comparison Countries by IndicatorNumber of countries
Indicator World EU ECAPopulation ages 65 and above (% of total) 195 29 23Population ages 0-14 (% of total) 195 29 23Human Development Index 188 29 21ExportsAgricultural raw materials exports (% of merchandise exports) 170 29 17Manufactures exports (% of merchandise exports) 170 29 17Imports of goods and services (% of GDP) 191 29 23Exports of goods and services (% of GDP) 191 29 23Cost to export (US$ per container) 188 29 22Exports of goods and services (annual % growth) 164 29 22InfrastructureRoad density, (km of road per 100sq km of land area ) 135 28 15Logistics performance index: Frequency with which shipments reach consignee within scheduled or expected time (1=low to 5=high) 163 29 22
Logistics performance index: Efficiency of customs clearance process (1=low to 5=high) 163 29 22
Logistics performance index: Overall (1=low to 5=high) 163 29 22Logistics performance index: Ease of arranging competitively priced shipments (1=low to 5=high) 163 29 22
Logistics performance index: Ability to track and trace consignments (1=low to 5=high) 163 29 22
Logistics performance index: Quality of trade and transport-related infrastructure (1=low to 5=high) 163 29 22
Logistics performance index: Competence and quality of logistics services (1=low to 5=high) 163 29 22
Individuals using the Internet (% of population) 207 29 22Global connectedness index (score) 140 29 20DHL Depth (intensity of international flows) 140 29 20DHL Breadth (geographic distribution of flows) 140 29 20Social exclusion/inclusion (for vulnerable groups: indigenous, women, youth)Adolescent fertility rate (births per 1,000 women ages 15-19) 194 29 22Share of youth not in education, employment or training, total (% of youth population) 88 29 17
Coverage-all social protection and labor (% of total population) 23Social health protection coverage as a percent of total population (%) 154 28 19Gender Inequality Index 188 29 21Health and NutritionOut-of-pocket health expenditure (% of total expenditure on health) 190 29 22Cause of death, by non-communicable diseases (% of total) 183 29 22Cause of death, by injury (% of total) 183 29 22Cause of death, by communicable diseases and maternal, prenatal and nutrition conditions (% of total) 183 29 22
Mortality rate, under-5 (per 1,000 live births) 193 29 22Prevalence of anemia among children (% of children under 5) 185 29 22
FYR MACEDONIA SYSTEMATIC COUNTRY DIAGNOSTIC
238 ANNExES
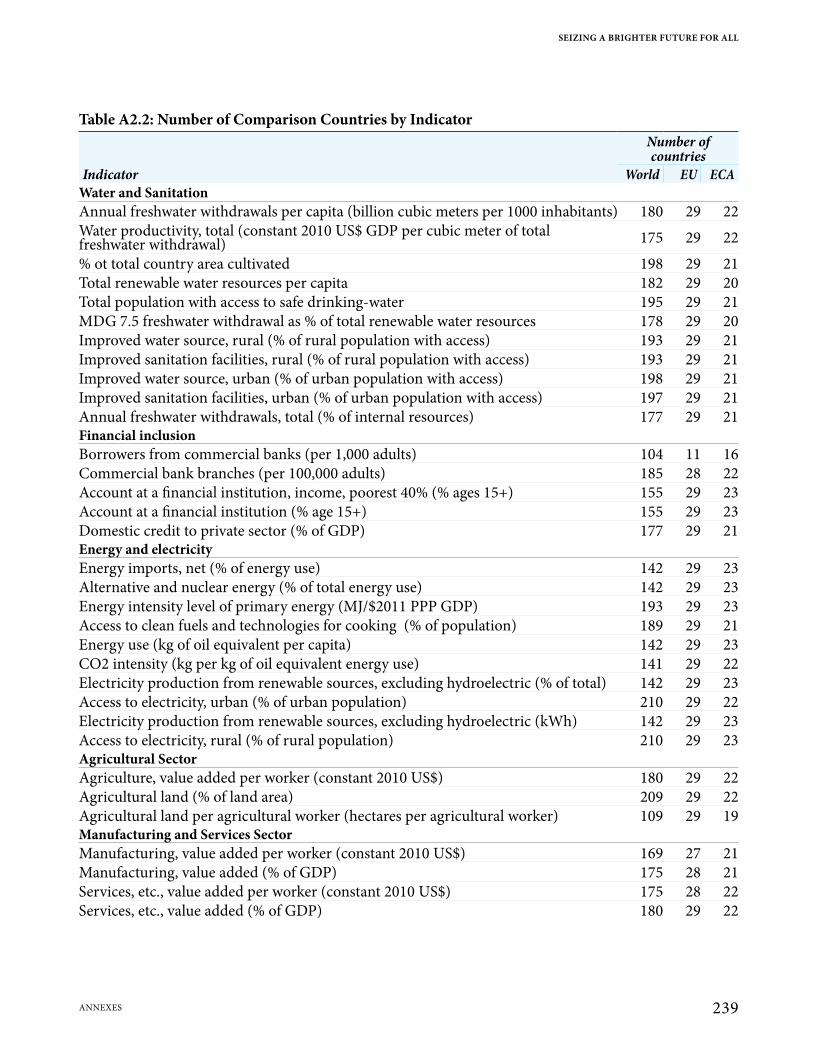
Table A2.2: Number of Comparison Countries by IndicatorNumber of countries
Indicator World EU ECAWater and SanitationAnnual freshwater withdrawals per capita (billion cubic meters per 1000 inhabitants) 180 29 22Water productivity, total (constant 2010 US$ GDP per cubic meter of total freshwater withdrawal) 175 29 22
% ot total country area cultivated 198 29 21Total renewable water resources per capita 182 29 20Total population with access to safe drinking-water 195 29 21MDG 7.5 freshwater withdrawal as % of total renewable water resources 178 29 20Improved water source, rural (% of rural population with access) 193 29 21Improved sanitation facilities, rural (% of rural population with access) 193 29 21Improved water source, urban (% of urban population with access) 198 29 21Improved sanitation facilities, urban (% of urban population with access) 197 29 21Annual freshwater withdrawals, total (% of internal resources) 177 29 21Financial inclusionBorrowers from commercial banks (per 1,000 adults) 104 11 16Commercial bank branches (per 100,000 adults) 185 28 22Account at a financial institution, income, poorest 40% (% ages 15+) 155 29 23Account at a financial institution (% age 15+) 155 29 23Domestic credit to private sector (% of GDP) 177 29 21Energy and electricityEnergy imports, net (% of energy use) 142 29 23Alternative and nuclear energy (% of total energy use) 142 29 23Energy intensity level of primary energy (MJ/$2011 PPP GDP) 193 29 23Access to clean fuels and technologies for cooking (% of population) 189 29 21Energy use (kg of oil equivalent per capita) 142 29 23CO2 intensity (kg per kg of oil equivalent energy use) 141 29 22Electricity production from renewable sources, excluding hydroelectric (% of total) 142 29 23Access to electricity, urban (% of urban population) 210 29 22Electricity production from renewable sources, excluding hydroelectric (kWh) 142 29 23Access to electricity, rural (% of rural population) 210 29 23Agricultural SectorAgriculture, value added per worker (constant 2010 US$) 180 29 22Agricultural land (% of land area) 209 29 22Agricultural land per agricultural worker (hectares per agricultural worker) 109 29 19Manufacturing and Services SectorManufacturing, value added per worker (constant 2010 US$) 169 27 21Manufacturing, value added (% of GDP) 175 28 21Services, etc., value added per worker (constant 2010 US$) 175 28 22Services, etc., value added (% of GDP) 180 29 22
SEIZING A BRIGHTER FUTURE FOR ALL
239ANNExES

Table A2.2: Number of Comparison Countries by IndicatorNumber of countries
Indicator World EU ECADeforestation, BioDiversity loss, erosion and desertificationForest area (% of land area) 210 29 22Annual change rate 2010-2015 224 29 21Climate Change, PollutionCO2 emissions (kg per 2010 US$ of GDP) 190 29 22MSW Generation Per Capita (kg/ capita/day) 161 29 14PM2.5 air pollution, population exposed to levels exceeding WHO guideline value (% of total) 194 29 22Political EnvironmentPolitical stability score (-2.5 to 2.5) 205 29 23Voice & accountability score (-2.5 to 2.5) 204 29 23Rule of law score (-2.5 to 2.5) 204 29 23Government effectiveness score (-2.5 to 2.5) 202 29 23Corruption score (-2.5 to 2.5) 202 29 23
FYR MACEDONIA SYSTEMATIC COUNTRY DIAGNOSTIC
240 ANNExES
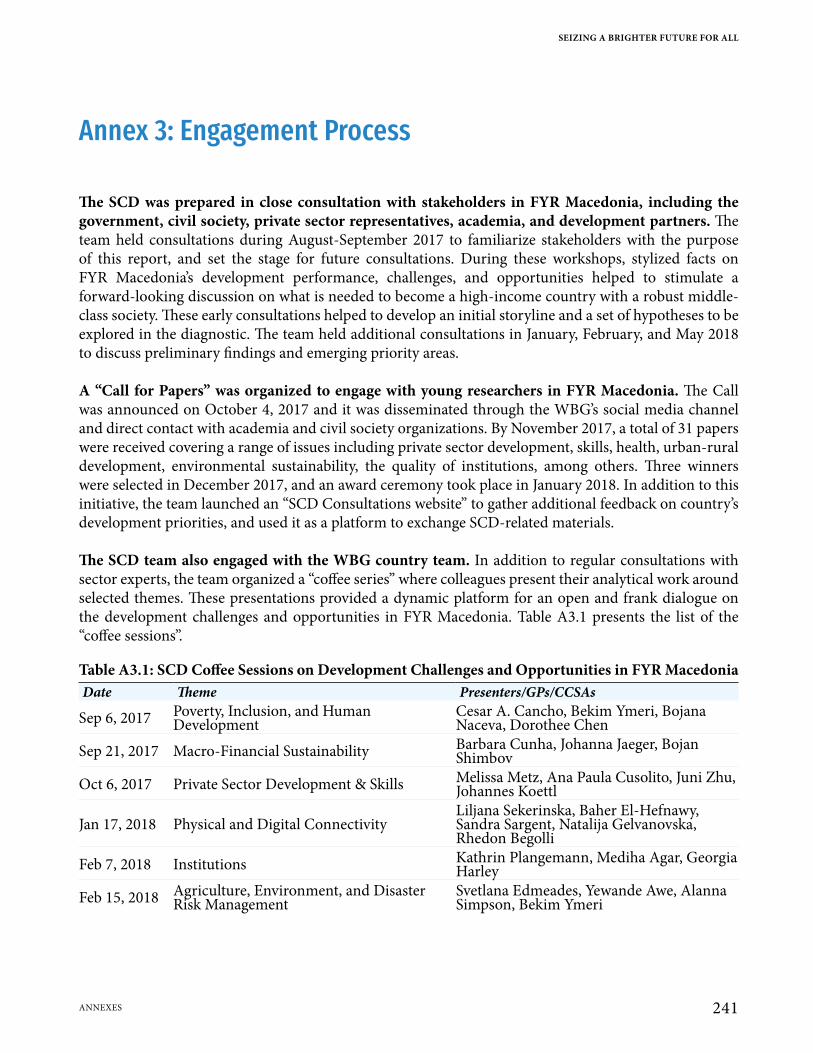
Annex 3: Engagement Process
The SCD was prepared in close consultation with stakeholders in FYR Macedonia, including the government, civil society, private sector representatives, academia, and development partners. The team held consultations during August-September 2017 to familiarize stakeholders with the purpose of this report, and set the stage for future consultations. During these workshops, stylized facts on FYR Macedonia’s development performance, challenges, and opportunities helped to stimulate a forward-looking discussion on what is needed to become a high-income country with a robust middle-class society. These early consultations helped to develop an initial storyline and a set of hypotheses to be explored in the diagnostic. The team held additional consultations in January, February, and May 2018 to discuss preliminary findings and emerging priority areas.
A “Call for Papers” was organized to engage with young researchers in FYR Macedonia. The Call was announced on October 4, 2017 and it was disseminated through the WBG’s social media channel and direct contact with academia and civil society organizations. By November 2017, a total of 31 papers were received covering a range of issues including private sector development, skills, health, urban-rural development, environmental sustainability, the quality of institutions, among others. Three winners were selected in December 2017, and an award ceremony took place in January 2018. In addition to this initiative, the team launched an “SCD Consultations website” to gather additional feedback on country’s development priorities, and used it as a platform to exchange SCD-related materials.
The SCD team also engaged with the WBG country team. In addition to regular consultations with sector experts, the team organized a “coffee series” where colleagues present their analytical work around selected themes. These presentations provided a dynamic platform for an open and frank dialogue on the development challenges and opportunities in FYR Macedonia. Table A3.1 presents the list of the “coffee sessions”.
Table A3.1: SCD Coffee Sessions on Development Challenges and Opportunities in FYR MacedoniaDate Theme Presenters/GPs/CCSAs
Sep 6, 2017 Poverty, Inclusion, and Human Development
Cesar A. Cancho, Bekim Ymeri, Bojana Naceva, Dorothee Chen
Sep 21, 2017 Macro-Financial Sustainability Barbara Cunha, Johanna Jaeger, Bojan Shimbov
Oct 6, 2017 Private Sector Development & Skills Melissa Metz, Ana Paula Cusolito, Juni Zhu, Johannes Koettl
Jan 17, 2018 Physical and Digital ConnectivityLiljana Sekerinska, Baher El-Hefnawy, Sandra Sargent, Natalija Gelvanovska, Rhedon Begolli
Feb 7, 2018 Institutions Kathrin Plangemann, Mediha Agar, Georgia Harley
Feb 15, 2018 Agriculture, Environment, and Disaster Risk Management
Svetlana Edmeades, Yewande Awe, Alanna Simpson, Bekim Ymeri
SEIZING A BRIGHTER FUTURE FOR ALL
241ANNExES
Annex 4: Growth Challenges for Selected Industries
Analyses of selected industries confirmed that the issues analyzed in Chapter 4 (Pathway I: Fostering a More Dynamic and Competitive Private Sector) are relevant constrains to investment, limiting the scope for growth in those sectors. The analysis focused on five industries for which recent analytical work has been conducted, namely (1) agriculture and agribusiness; (2) motor vehicles; (3) textiles and apparel; (4) tourism; and (5) information and communications technologies (ICT) industries. Across the industries it was possible to identify patterns that confirm the emerging results from this chapter. First, the lack of integration into foreign markets (and the small size of the domestic market) mean that foreign investors might find it difficult to achieve economies of scale. Second, the limited skills of the labor force and weak capacity to attract and retain talent discourage foreign investment. Third, the limited ability of domestic firms to innovate and adopt technologies is a major barrier, especially for investors interested in higher-value-added sectors. Fourth, trade and transport connectivity shortfalls increase the time and cost of doing business in all industries. In the motor vehicles, textile and apparel, and tourism industries, the lack of market competition is a substantial problem, especially for higher-value-added activities. The inefficiency and lack of independence of the country’s judicial system raises questions for foreign investors that want to deepen their engagements in the motor vehicles and textile and apparel industries. Additional barriers to investment were identified for specific industries.
The identification of these binding constrains was conducted through an analytical benchmarking exercise. The comparisons of FYR Macedonia vis-à-vis its structural and aspirational peers across the report is further supported and complemented by the benchmarking exercise presented in this Annex, called Investment Competitiveness Benchmarking (ICB), which includes over 130 indicators on economic development and focuses on the challenges and opportunities of each industry in attracting FDI (Box A4.1). The selected indicators cover a wide range of topics, including demographics (e.g., population growth, life expectancy), structure of the economy (e.g., agriculture/manufacturing value added), macroeconomic conditions (e.g. inflation, fiscal and external balances), income inequality (e.g., GINI coefficient), international trade (e.g., foreign direct investment, growth of exports and imports), finance (e.g., percent of firms with access to a bank loan), human development (e.g., PISA scores, mortality rates, out-of-pocket health expenditures), labor markets (e.g., share of youth not in education, employment, or training), access to public services (e.g., water and sanitation, electricity), infrastructure and connectivity (e.g., road density, logistics), environment (e.g., deforestation, pollution), disaster-risk management, investment climate (e.g., extent of market dominance, intellectual property protection), quality of institutions (e.g., rule of law, transparency and accountability, regulatory quality), among others.
Based on the analysis here presented FYR Macedonia seems well-placed to attract FDI for lower-value-added activities but will need to address the constraints to attracting FDI for higher-value added activities. Although in the past it has been the primary recipient of FDI in the region, it will be harder today, particularly in the motor vehicles industry in both lower and higher value-added sectors because of its small labor force, low labor skilled, its small domestic and foreign market size, and the lack of quality transport infrastructure.
FYR MACEDONIA SYSTEMATIC COUNTRY DIAGNOSTIC
242 ANNExES

Box A4.1: What Do FDI Firms Look For? An Investment Competitiveness Benchmarking Analysis for FYR Macedonia
An Investment Competitiveness Benchmarking (ICB) analysis identifies both potential benefits and possible challenges facing a country competing to attract FDI. To assess a country’s sector-specific investment competitiveness, the analysis assumes that certain factors are more important in attracting FDI than others. It then benchmarks a country’s performance on these factors against that of countries that have successfully attracted FDI. The purpose of the analysis is not to select sectors to prioritize but rather to assess the country’s sector-specific investment competitiveness.
The investment competitiveness benchmarking framework hypothesizes that a country needs to be competitive in terms of various characteristics, ranging from demand factors to production factors, key inputs, and the institutional context, in order to successfully attract FDI in a given sector. Country characteristics under these four pillars are measured and benchmarked through a set of 136 country level indicators from various sources, including Doing Business, World Economic Forum, World Development Indicators, International Country Risk Guide, etc. The full range of indicators is shown in Table A4.1 at the end of this Annex. The intuition is to capture as broad a range of country characteristics as possible, while the sector specific benchmarks reflect the relative importance of each characteristic for FDI in given sector.
Sector specific benchmarks are constructed with the help of detailed project level FDI data from the Financial Times’ FDI markets database (Sectors and Activity classifications can be found in Table A4.2, at the end of this Annex). The relative importance of the above-mentioned characteristics for FDI in a given sector is assessed by analyzing the characteristics of all countries in the world with successful FDI attraction for the sector in question. Those characteristics for which successful countries are clustered at high performance levels are likely to be crucial for a given sector. If such clustering exists for a given characteristic, the country under analysis compares against a high benchmark, and underperformance is likely to constitute a competitive disadvantage for FDI performance in the sector in question.
FDI markets classifies announced FDI projects by 38 sectors (e.g. consumer products, pharmaceutical, plastics, rubber) and 17 business activities (e.g. headquarters, logistics, manufacturing, R&D). The complete list and classification available in Tables A4.3 and A4.4 at the end of this Annex). While different assumptions are possible, in the baseline version of the methodology, a country is considered ‘successful’ if it has attracted at least one FDI project for a given sector—activity pair within the last 5 years. The combination of sector-activity pairs allows for comparisons of competitiveness for FDI either across different sectors for the same activity (e.g. manufacturing of textiles vs. cars) or for within sector analysis towards more sophisticated activities (e.g. textile manufacturing vs. design). For export-oriented merchandise sectors, a twin-version of the tool is available that classifies ‘successful’ countries by revealed comparative advantage in export products at the detailed ISIC 4-digit level.
The methodology calculates sector benchmarking scores from 1 to 5, defined as follows:
continued on next page
SEIZING A BRIGHTER FUTURE FOR ALL
243ANNExES
A4.1 Agriculture and Agribusiness
Agriculture is important to both FYR Macedonia economy and the government’s poverty alleviation and social inclusion efforts. In 2016, primary agriculture accounted for 7 percent of GDP and the manufacture of foods, beverages, and tobacco products accounted for 3 percent. In 2016, 16 percent of the country’s workforce was employed in primary agriculture, and 3.2 percent of all jobs—16.3 percent of manufacturing jobs were in the manufacture of foods, beverages, and tobacco products. Food products233 represented about 10 percent of FYR Macedonia’s total exports in 2013–17. The country’s main export markets for primary agricultural products are the Western Balkans, the EU, and Russia.
233 Among FYR Macedonia’s main export products are fresh tobacco, prepared biscuits/baked products, wine, processed vegetables, sunflower seed/safflower oil, and fresh produce.
• A score of 5 (dark green) for a given indicator means that the country ranks above the 30th percentile of all countries in the world that have successfully attracted FDI in a given sector. The characteristic measured by this indicator would likely be seen by investors as a strength in the country’s value proposition for investors in this sector.
• A score of 4 (light green) for a given indicator means that the country ranks above the 10th, but below the 30th percentile of all countries in the world that have successfully attracted FDI in a given sector. The characteristic measured by this indicator would likely not be seen as a strength, but does not represent a significant obstacle to investment in this sector either as other countries in the world with the same level performance have still been able to attract FDI in the sector.
• A score of 3 (yellow) for a given indicator means that the country ranks below the 10th percentile of all countries in the world that have successfully attracted FDI in this sector, but above the 90th percentile of unsuccessful countries that fall below the minimum performance of successful countries on this indicator. The characteristic measured by this indicator may be seen as a weakness by investors in this sector, but even relatively small improvements could address this shortcoming.
• A score of 2 (orange) for a given indicator means that the country ranks below the 90th percentile, but above the 70th percentile of unsuccessful countries that fall below the minimum performance of successful countries on this indicator. The characteristic measured by this indicator is likely to be seen as a weakness by investors in this sector, and significant improvements would be needed to address this shortcoming.
• A score of 1 (red) for a given indicator means that the country ranks below the 70th percentile of unsuccessful countries that fall below the minimum performance of successful countries on this indicator. The characteristic measured by this indicator is very likely to be seen as a strong weakness by investors in this sector, and very significant improvements would be needed to address this shortcoming.
Source: Authors.
Box A4.1 continued from previous page
FYR MACEDONIA SYSTEMATIC COUNTRY DIAGNOSTIC
244 ANNExES
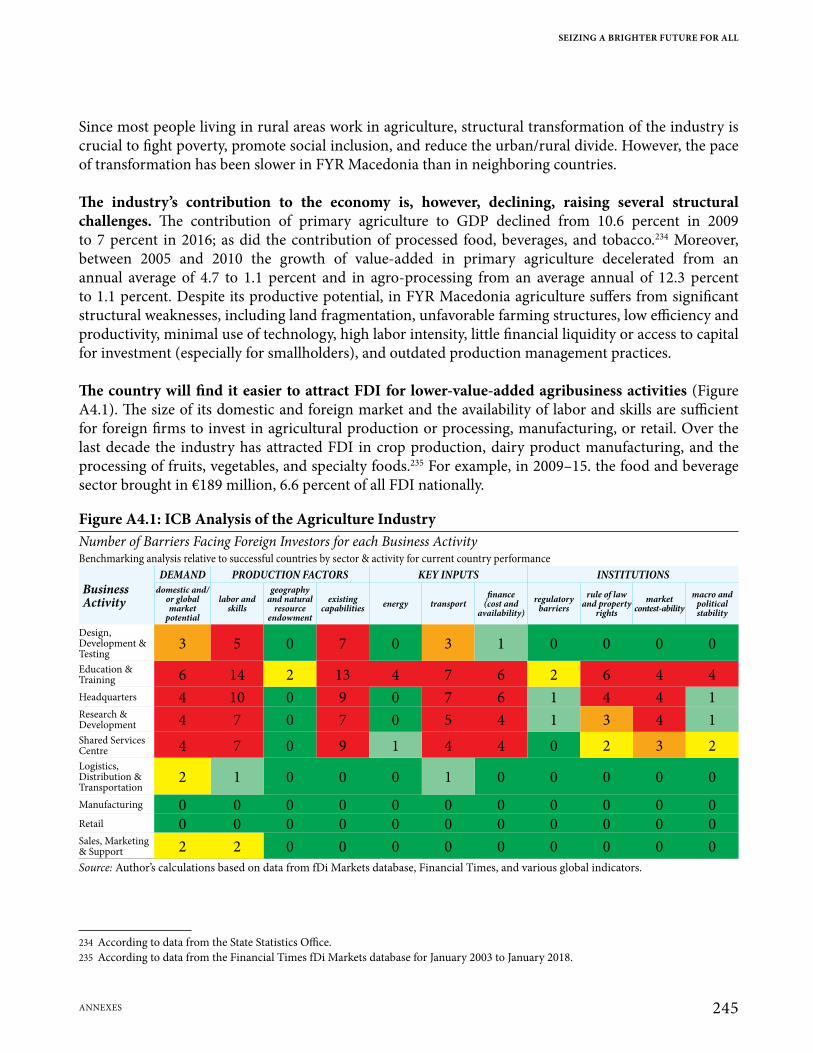
Since most people living in rural areas work in agriculture, structural transformation of the industry is crucial to fight poverty, promote social inclusion, and reduce the urban/rural divide. However, the pace of transformation has been slower in FYR Macedonia than in neighboring countries.
The industry’s contribution to the economy is, however, declining, raising several structural challenges. The contribution of primary agriculture to GDP declined from 10.6 percent in 2009 to 7 percent in 2016; as did the contribution of processed food, beverages, and tobacco.234 Moreover, between 2005 and 2010 the growth of value-added in primary agriculture decelerated from an annual average of 4.7 to 1.1 percent and in agro-processing from an average annual of 12.3 percent to 1.1 percent. Despite its productive potential, in FYR Macedonia agriculture suffers from significant structural weaknesses, including land fragmentation, unfavorable farming structures, low efficiency and productivity, minimal use of technology, high labor intensity, little financial liquidity or access to capital for investment (especially for smallholders), and outdated production management practices.
The country will find it easier to attract FDI for lower-value-added agribusiness activities (Figure A4.1). The size of its domestic and foreign market and the availability of labor and skills are sufficient for foreign firms to invest in agricultural production or processing, manufacturing, or retail. Over the last decade the industry has attracted FDI in crop production, dairy product manufacturing, and the processing of fruits, vegetables, and specialty foods.235 For example, in 2009–15. the food and beverage sector brought in €189 million, 6.6 percent of all FDI nationally.
Figure A4.1: ICB Analysis of the Agriculture IndustryNumber of Barriers Facing Foreign Investors for each Business ActivityBenchmarking analysis relative to successful countries by sector & activity for current country performance
Business Activity
DEMAND PRODUCTION FACTORS KEY INPUTS INSTITUTIONS domestic and/
or global market
potential
labor and skills
geography and natural
resource endowment
existing capabilities energy transport
finance (cost and
availability)regulatory
barriersrule of law
and property rights
market contest-ability
macro and political stability
Design, Development & Testing
3 5 0 7 0 3 1 0 0 0 0Education & Training 6 14 2 13 4 7 6 2 6 4 4Headquarters 4 10 0 9 0 7 6 1 4 4 1Research & Development 4 7 0 7 0 5 4 1 3 4 1Shared Services Centre 4 7 0 9 1 4 4 0 2 3 2Logistics, Distribution & Transportation
2 1 0 0 0 1 0 0 0 0 0Manufacturing 0 0 0 0 0 0 0 0 0 0 0Retail 0 0 0 0 0 0 0 0 0 0 0Sales, Marketing & Support 2 2 0 0 0 0 0 0 0 0 0Source: Author’s calculations based on data from fDi Markets database, Financial Times, and various global indicators.
234 According to data from the State Statistics Office.235 According to data from the Financial Times fDi Markets database for January 2003 to January 2018.
SEIZING A BRIGHTER FUTURE FOR ALL
245ANNExES

Conversely, in higher-value-added agricultural activities there are far more barriers to foreign investors. The country’s small domestic market and limited access to international markets is a major impediment; its domestic market ranks in the bottom fifth of economies on the World Economic Forum Global Competitiveness index. Other barriers to FDI in higher-value-added agricultural sectors are (1) the insufficient availability of labor and an inability to attract and retain talent, which prevent foreign companies from finding agricultural research scientists to support; (2) too little spending by domestic firms on R&D and new technology, which discourages FDI in such areas as design, development, and testing; (3) weak trade and transport logistics, which affects the timeliness of international shipments and the ability to track shipments, etc.; and (4) the limited availability of financing, which prevents the country from meeting the needs of businesses.
In the agribusiness sector, where exports more than doubled in the last five years, the challenge will be to address structural and institutional bottlenecks that weaken the incentives to invest in restructuring and upgrading. Given that primary agriculture and processing generate over 20 percent of employment and more than 10 percent of GDP, the removal of constraints to competitiveness can yield outsized results. Currently there are several bottlenecks to growth, particularly the deficiencies in the functioning of the land market, the fragmentation of the government’s agricultural support programs and their orientation toward subsidies rather than productivity enhancements, and custom duties that increase input costs in the food processing industry.
FYR Macedonia needs to launch reforms to make its agriculture more competitive and better position its agricultural producers to compete in the EU and other markets. To achieve this, government authorities should more promptly to increase farmer productivity to close the gap with productivity levels in the EU by: (1) overcoming land fragmentation by promoting cooperatives (aggregators) to improve quality standards and increase economies of scale; (2) support policies that promote the modernization of the fruit and vegetable processing industry (e.g., improving access to finance); (3) promoting initiatives to increase the competitiveness of wine producers by organizing their marketing as a group; (4) establishing a predictable tariff regime to allow firms to plan ahead; (5) rebalancing public support for agriculture away from direct subsidies toward investments to support rural development; (6) strengthen sanitary and phytosanitary services to meet food safety and animal health standards; (7) design a comprehensive rural land tax system and explore market-driven pull mechanisms to promote land consolidation; (8) draw up a comprehensive policy strategy to promote inclusion of viable SME agribusinesses in value chains by facilitating access to markets, credit, and insurance services; and (9) create a policy framework to promote digital agricultural practices that facilitate access to markets, knowledge of modern farming practices, and general advisory services.
A4.2 Motor Vehicles
Over the past decade, FYR Macedonia has become part of the European periphery motor vehicles value chain, and it is that industry that has been an important source of its economic growth and job creation. In 2016 the industry236 represented about 3.7 percent of GDP, and between 2010 and
236 FYR Macedonia’s motor vehicles industry has nine sectors: (1) leather and related products; (2) rubber and plastic products; (3) computer, electronic, and optical products; (4) machinery and equipment; (5) other transport equipment; (6) chemicals and chemical products; (7) fabricated metal products, except machinery and equipment; (8) electrical equipment; and (9) motor vehicles, trailers, and semi-trailers.
FYR MACEDONIA SYSTEMATIC COUNTRY DIAGNOSTIC
246 ANNExES

2015 its value-added grew by 181 percent.237 Over the same period motor vehicles–related exports expanded seven-fold in nominal terms, reaching €1.8 billion in 2016, roughly 10.5 percent of GDP. The firm productivity analysis showed that motor vehicles was one of the few industries that grew both in productivity and employment (the analysis also noted that this sector benefits from subsidies). Of the 36,000 jobs created in the country between 2010 and 2014, sub-sectors related to motor vehicles manufacturing gained about 15,500, outpacing general manufacturing and industry growth. About 90 percent of those jobs were the direct result of industry expansion and only about 10 percent were due to general economic growth.
The motor vehicles industry has contributed to an increase in higher-value-added exports. The share of high- and medium-technology exports rose from 38.4 percent of all goods exports in 2011 to 56.7 percent in 2016. While the country’s main comparative advantage remains the production of intermediate and consumer goods, the growth in the motor vehicles industry has led to a Revealed Comparative Advantage (RCA) in new, more capital-intensive products. Also, exports by foreign firms linked to global value chains have increased FYR Macedonia’s market share in such EU markets as Germany, Belgium, Romania, and Spain.
The performance of the motor vehicles industry in FYR Macedonia has been supported by a concerted strategy to attract FDI and improve the business environment. The streamlining of business regulations, the creation of the SEZ (and its tax and other incentives),238 and efforts in branding and promotion have helped the motor vehicles industry to grow. In 2016, 90 percent of its jobs were in firms located in the SEZ; the industry provides 82 percent of SEZ jobs and constitute than half of the firms. As a result, between 2009 and 2016 the industry received the most FDI in the country—€588 million in the vehicles and transport equipment sectors alone, equivalent to 33 percent of all net FDI flows and 74.5 percent of all manufacturing FDI during this period.
However, many domestic firms have not been able to take full advantage of the growth in FDI in the motor vehicles industry. Links between foreign investors and domestic firms, as measured by direct purchases, amounted to just €48 million in 2016, equivalent to only 1 percent of the country’s total exports. Many local companies are unable to integrate with foreign firms because they lack managerial, financial, and technical capacity. Although there is no scarcity of investment in machinery and equipment, the resources are under-utilized, and there is a need to optimize production according to the principles of lean manufacturing and continuous improvement (see Chapter 4).
FYR Macedonia is also not competitive in attracting more FDI in both high- and low-value-added sectors of the motor vehicles industry, where FDI in the industry varies in the degree of value-added. While Belgian investor Van Hool is manufacturing whole buses in the country (high value-added), other investors focus on more labor-intensive, lower-value-added activities due to the country’s low-cost structure and proximity to EU markets. However, the country’s relatively small labor force and dearth of skilled labor, its small domestic and foreign markets, and the lack of quality transport infrastructure present major barriers for foreign firms that want to invest in both higher- and lower value-added sectors
237 Based on State Statistics Office data on value added.238 According to the Government of FYR Macedonia, as of 2016 €225 million in incentives had been granted to 25 foreign investors, whose
firms employed 20,000 people. More detail on the incentives offered can be found in Chapter 4.
SEIZING A BRIGHTER FUTURE FOR ALL
247ANNExES
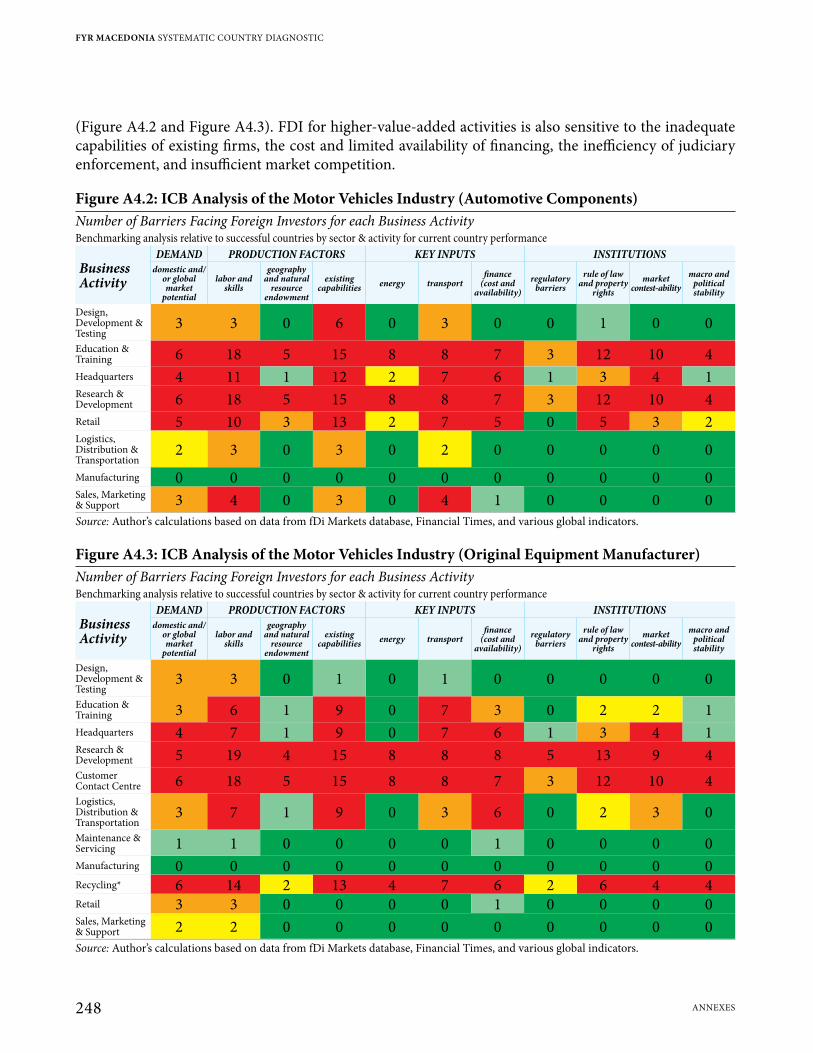
(Figure A4.2 and Figure A4.3). FDI for higher-value-added activities is also sensitive to the inadequate capabilities of existing firms, the cost and limited availability of financing, the inefficiency of judiciary enforcement, and insufficient market competition.
Figure A4.2: ICB Analysis of the Motor Vehicles Industry (Automotive Components)Number of Barriers Facing Foreign Investors for each Business ActivityBenchmarking analysis relative to successful countries by sector & activity for current country performance
Business Activity
DEMAND PRODUCTION FACTORS KEY INPUTS INSTITUTIONS domestic and/
or global market
potential
labor and skills
geography and natural
resource endowment
existing capabilities energy transport
finance (cost and
availability)regulatory
barriersrule of law
and property rights
market contest-ability
macro and political stability
Design, Development & Testing
3 3 0 6 0 3 0 0 1 0 0Education & Training 6 18 5 15 8 8 7 3 12 10 4Headquarters 4 11 1 12 2 7 6 1 3 4 1Research & Development 6 18 5 15 8 8 7 3 12 10 4Retail 5 10 3 13 2 7 5 0 5 3 2Logistics, Distribution & Transportation
2 3 0 3 0 2 0 0 0 0 0Manufacturing 0 0 0 0 0 0 0 0 0 0 0Sales, Marketing & Support 3 4 0 3 0 4 1 0 0 0 0Source: Author’s calculations based on data from fDi Markets database, Financial Times, and various global indicators.
Figure A4.3: ICB Analysis of the Motor Vehicles Industry (Original Equipment Manufacturer)Number of Barriers Facing Foreign Investors for each Business ActivityBenchmarking analysis relative to successful countries by sector & activity for current country performance
Business Activity
DEMAND PRODUCTION FACTORS KEY INPUTS INSTITUTIONS domestic and/
or global market
potential
labor and skills
geography and natural
resource endowment
existing capabilities energy transport
finance (cost and
availability)regulatory
barriersrule of law
and property rights
market contest-ability
macro and political stability
Design, Development & Testing
3 3 0 1 0 1 0 0 0 0 0Education & Training 3 6 1 9 0 7 3 0 2 2 1Headquarters 4 7 1 9 0 7 6 1 3 4 1Research & Development 5 19 4 15 8 8 8 5 13 9 4Customer Contact Centre 6 18 5 15 8 8 7 3 12 10 4Logistics, Distribution & Transportation
3 7 1 9 0 3 6 0 2 3 0Maintenance & Servicing 1 1 0 0 0 0 1 0 0 0 0Manufacturing 0 0 0 0 0 0 0 0 0 0 0Recycling* 6 14 2 13 4 7 6 2 6 4 4Retail 3 3 0 0 0 0 1 0 0 0 0Sales, Marketing & Support 2 2 0 0 0 0 0 0 0 0 0Source: Author’s calculations based on data from fDi Markets database, Financial Times, and various global indicators.
FYR MACEDONIA SYSTEMATIC COUNTRY DIAGNOSTIC
248 ANNExES
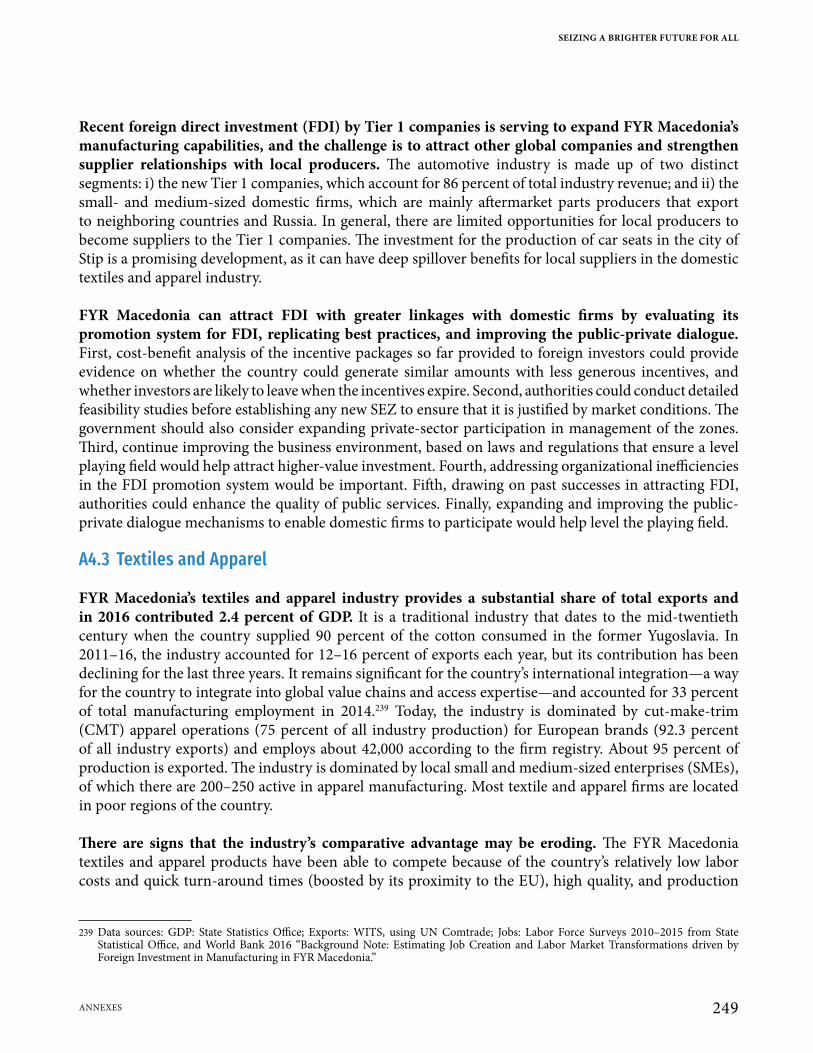
Recent foreign direct investment (FDI) by Tier 1 companies is serving to expand FYR Macedonia’s manufacturing capabilities, and the challenge is to attract other global companies and strengthen supplier relationships with local producers. The automotive industry is made up of two distinct segments: i) the new Tier 1 companies, which account for 86 percent of total industry revenue; and ii) the small- and medium-sized domestic firms, which are mainly aftermarket parts producers that export to neighboring countries and Russia. In general, there are limited opportunities for local producers to become suppliers to the Tier 1 companies. The investment for the production of car seats in the city of Stip is a promising development, as it can have deep spillover benefits for local suppliers in the domestic textiles and apparel industry.
FYR Macedonia can attract FDI with greater linkages with domestic firms by evaluating its promotion system for FDI, replicating best practices, and improving the public-private dialogue. First, cost-benefit analysis of the incentive packages so far provided to foreign investors could provide evidence on whether the country could generate similar amounts with less generous incentives, and whether investors are likely to leave when the incentives expire. Second, authorities could conduct detailed feasibility studies before establishing any new SEZ to ensure that it is justified by market conditions. The government should also consider expanding private-sector participation in management of the zones. Third, continue improving the business environment, based on laws and regulations that ensure a level playing field would help attract higher-value investment. Fourth, addressing organizational inefficiencies in the FDI promotion system would be important. Fifth, drawing on past successes in attracting FDI, authorities could enhance the quality of public services. Finally, expanding and improving the public-private dialogue mechanisms to enable domestic firms to participate would help level the playing field.
A4.3 Textiles and Apparel
FYR Macedonia’s textiles and apparel industry provides a substantial share of total exports and in 2016 contributed 2.4 percent of GDP. It is a traditional industry that dates to the mid-twentieth century when the country supplied 90 percent of the cotton consumed in the former Yugoslavia. In 2011–16, the industry accounted for 12–16 percent of exports each year, but its contribution has been declining for the last three years. It remains significant for the country’s international integration—a way for the country to integrate into global value chains and access expertise—and accounted for 33 percent of total manufacturing employment in 2014.239 Today, the industry is dominated by cut-make-trim (CMT) apparel operations (75 percent of all industry production) for European brands (92.3 percent of all industry exports) and employs about 42,000 according to the firm registry. About 95 percent of production is exported. The industry is dominated by local small and medium-sized enterprises (SMEs), of which there are 200–250 active in apparel manufacturing. Most textile and apparel firms are located in poor regions of the country.
There are signs that the industry’s comparative advantage may be eroding. The FYR Macedonia textiles and apparel products have been able to compete because of the country’s relatively low labor costs and quick turn-around times (boosted by its proximity to the EU), high quality, and production
239 Data sources: GDP: State Statistics Office; Exports: WITS, using UN Comtrade; Jobs: Labor Force Surveys 2010–2015 from State Statistical Office, and World Bank 2016 “Background Note: Estimating Job Creation and Labor Market Transformations driven by Foreign Investment in Manufacturing in FYR Macedonia.”
SEIZING A BRIGHTER FUTURE FOR ALL
249ANNExES
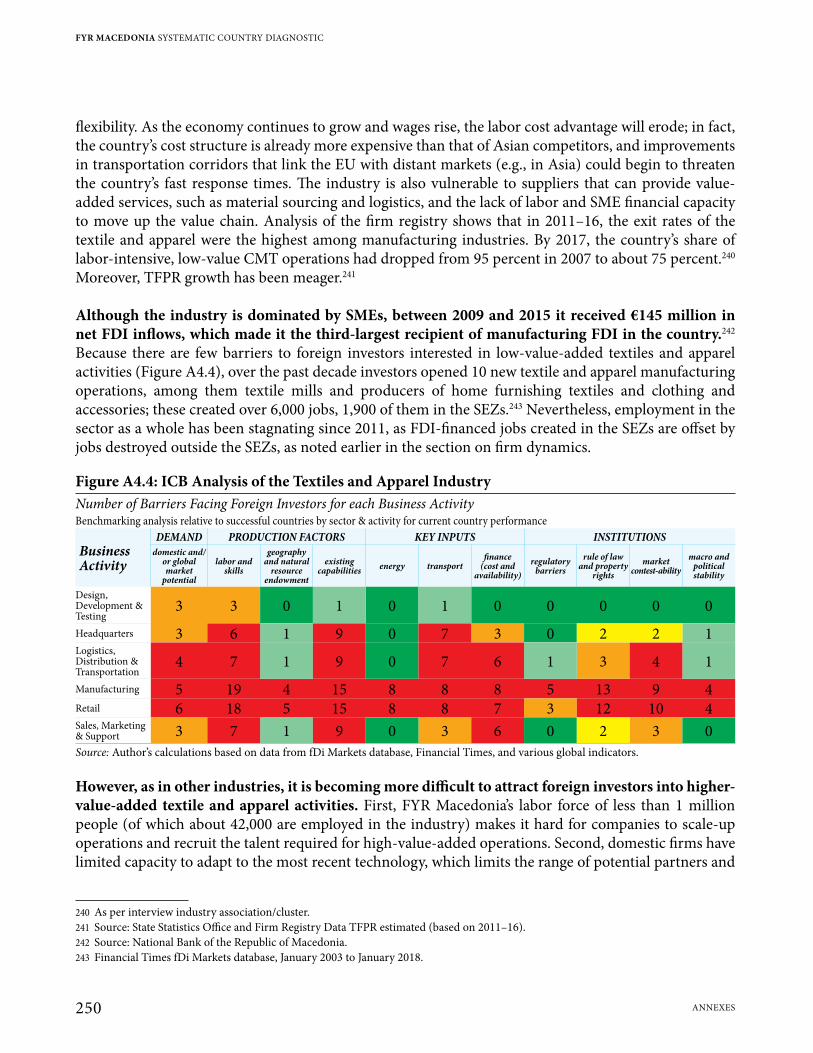
flexibility. As the economy continues to grow and wages rise, the labor cost advantage will erode; in fact, the country’s cost structure is already more expensive than that of Asian competitors, and improvements in transportation corridors that link the EU with distant markets (e.g., in Asia) could begin to threaten the country’s fast response times. The industry is also vulnerable to suppliers that can provide value-added services, such as material sourcing and logistics, and the lack of labor and SME financial capacity to move up the value chain. Analysis of the firm registry shows that in 2011–16, the exit rates of the textile and apparel were the highest among manufacturing industries. By 2017, the country’s share of labor-intensive, low-value CMT operations had dropped from 95 percent in 2007 to about 75 percent.240 Moreover, TFPR growth has been meager.241
Although the industry is dominated by SMEs, between 2009 and 2015 it received €145 million in net FDI inflows, which made it the third-largest recipient of manufacturing FDI in the country.242 Because there are few barriers to foreign investors interested in low-value-added textiles and apparel activities (Figure A4.4), over the past decade investors opened 10 new textile and apparel manufacturing operations, among them textile mills and producers of home furnishing textiles and clothing and accessories; these created over 6,000 jobs, 1,900 of them in the SEZs.243 Nevertheless, employment in the sector as a whole has been stagnating since 2011, as FDI-financed jobs created in the SEZs are offset by jobs destroyed outside the SEZs, as noted earlier in the section on firm dynamics.
Figure A4.4: ICB Analysis of the Textiles and Apparel IndustryNumber of Barriers Facing Foreign Investors for each Business ActivityBenchmarking analysis relative to successful countries by sector & activity for current country performance
Business Activity
DEMAND PRODUCTION FACTORS KEY INPUTS INSTITUTIONS domestic and/
or global market
potential
labor and skills
geography and natural
resource endowment
existing capabilities energy transport
finance (cost and
availability)regulatory
barriersrule of law
and property rights
market contest-ability
macro and political stability
Design, Development & Testing
3 3 0 1 0 1 0 0 0 0 0Headquarters 3 6 1 9 0 7 3 0 2 2 1Logistics, Distribution & Transportation
4 7 1 9 0 7 6 1 3 4 1Manufacturing 5 19 4 15 8 8 8 5 13 9 4Retail 6 18 5 15 8 8 7 3 12 10 4Sales, Marketing & Support 3 7 1 9 0 3 6 0 2 3 0Source: Author’s calculations based on data from fDi Markets database, Financial Times, and various global indicators.
However, as in other industries, it is becoming more difficult to attract foreign investors into higher-value-added textile and apparel activities. First, FYR Macedonia’s labor force of less than 1 million people (of which about 42,000 are employed in the industry) makes it hard for companies to scale-up operations and recruit the talent required for high-value-added operations. Second, domestic firms have limited capacity to adapt to the most recent technology, which limits the range of potential partners and
240 As per interview industry association/cluster.241 Source: State Statistics Office and Firm Registry Data TFPR estimated (based on 2011–16).242 Source: National Bank of the Republic of Macedonia.243 Financial Times fDi Markets database, January 2003 to January 2018.
FYR MACEDONIA SYSTEMATIC COUNTRY DIAGNOSTIC
250 ANNExES
suppliers. The country lacks the R&D infrastructure necessary to attract investors interested in producing high-value-added products. Third, the small size of the country’s domestic and foreign textile and apparel markets makes it less attractive to foreign investors. Fourth, the poor quality of FYR Macedonia’s air, port, and railroad infrastructure, the unreliability of international shipment deliveries,244 and the inadequacy of logistics services are major barriers to FDI in high-value-added sectors. Fifth, textile firms in FYR Macedonia highlight issues related to electricity outages, which affects the ability of firms to plan and meet their obligations. Sixth, it is difficult for investors to access the local equity market, and the cost of financing is considered high. Seventh, the inefficiency of the legal system, especially the courts, and its lack of independence is a major concern for risk-averse foreign investors. Finally, the barrier to entry is high in FYR Macedonia, where corporate activity is concentrated among a few firms.
FYR Macedonia’s apparel industry is coping with global competition by developing a reputation for high quality, quick turnaround times and production flexibility, and the challenge is to foster investment in high value-added segments. The textile and apparel industry continues to be a backbone of manufacturing in FYR Macedonia. Although the industry has managed to cope with global competition, it is vulnerable due to: i) expected contraction in demand from its major customers in Europe; ii) a global shift toward suppliers that can also provide value-added services, such as materials sourcing and logistics; and iii) declining wage competitiveness relative to other apparel exporters.
The government can promote high-value added FDI in the textiles and apparel industry by adopting policies that enable domestic firms to compete in the global apparel marketplace. To be competitive, firms in the industry could adopt one out of three strategies: (1) purchase all input materials from suppliers that are specifically designated by foreign clients because they already meet their specifications; (2) accept samples and designs from foreign buyers and fulfill orders by sourcing from their own network of suppliers; or (3) advance to full-service garment manufacturing. The government could support domestic firms by (i) ensuring that they have access to good market information and links with markets to overcome the current high concentration of clients per firm (e.g., by improving managerial capacity); (ii) providing firms with tools to improve their productivity and lower their costs; and (iii) increasing the access to better-skilled labor by improving human capital.
A4.4 Tourism
In 2016 FYR Macedonia’s tourism industry, which includes accommodation, restaurants, cafes, and hotels, and associated transport and construction, contributed an estimated 6.7 percent to GDP and employed about 44,000 people, 6.1 percent of total employment. In that year the value of tourism-related service exports was equivalent to 5.4 percent of total exports. The economic contribution of the industry is projected to rise by an average of 4.2 percent annually through 2027, when it is expected to reach MKD 61.7 billion, 7.8 percent of GDP.245 Tourism is one of the country’s most important services, and foreign overnights are the most important driver of its growth. In 2011, for the first time, foreign tourists exceeded domestic tourists; since then, the number of foreign tourists has nearly doubled, increasing by 95 percent. The capital city Skopje and UNESCO-protected Ohrid are the main tourist attractions, complemented by traditional Balkan villages with diverse communities, and ski resorts like Mavrovo and Popova Sapka.
244 This indicator measures whether shipments arrive within their scheduled or expected delivery time.245 Source: World Tourism Organization and State Statistical Office of FYR Macedonia.
SEIZING A BRIGHTER FUTURE FOR ALL
251ANNExES
Although the industry has grown impressively, the country is still relatively unknown: total tourists, domestic and foreign, are less than one million. Moreover, the country’s ranking fell from 82nd of 136 countries to 89th in the WEF 2017 Travel & Tourism Competitiveness Report (TTCR). Although according to the TTCR, the country ranks 49th out of 145 countries on price competitiveness, but ranks only 102nd cultural and business tourism supply and 136th on the quality of its natural assets.
All the FDI in the tourism industry between 2006 and 2016, about US$230 million, was for low- value-added construction and accommodation activities. FYR Macedonia presently faces almost no constraints in competitively attracting FDI for lower-value-added activities like building constructing hotels, and relatively few in sales and marketing business activities (Figure A4.5). None of these tourism sectors require a highly skilled workforce, an exceptionally advanced level of technology transfers among firms, or a sizable market, domestic or foreign.
Figure A4.5: ICB Analysis of the Tourism IndustryNumber of Barriers Facing Foreign Investors for each Business ActivityBenchmarking analysis relative to successful countries by sector & activity for current country performance
Business Activity
DEMAND PRODUCTION FACTORS KEY INPUTS INSTITUTIONS domestic and/
or global market
potential
labor and skills
geography and natural
resource endowment
existing capabilities energy transport
finance (cost and
availability)regulatory
barriersrule of law
and property rights
market contest-ability
macro and political stability
Headquarters 5 15 3 15 8 8 6 3 10 9 4Customer Contact Centre 3 9 1 12 2 7 4 1 5 4 1Construction 0 0 0 0 0 0 0 0 0 0 0Sales, Marketing & Support 2 2 0 0 0 0 0 0 0 0 0Source: Author’s calculations based on data from fDi Markets database, Financial Times, and various global indicators.
However, the barriers to investment in higher-value-added activities in other sectors are also present in tourism. These barriers include: (1) a lack of qualified labor and the skills in demand; (2) the poor capabilities of domestic firms; (3) the difficulty and cost of financing; (4) inefficient bureaucracies; and (5) a lack of competition in general market. Moreover, the country’s political instability, as measured by the World Bank Worldwide Governance Indicators,246 seem to be discouraging foreign companies from investing in FYR Macedonia, according to the ICB exercise. Investors in tourism find corruption particularly unattractive.247
There are ways the Government can support the transition of tourism toward higher value-added activities. First, having identified 10 destinations248 that have the most potential for growth, for each the Government should address the quality and suitability of activities, experiences, attractions, accommodation, and access. Second, it could establish private sector development initiatives for
246 FYR Macedonia’s score has been consistently negative for the last decade.247 According to World Bank Enterprise Surveys, 7.5 percent of firms in FYR Macedonia had experienced at least one request to pay a
bribe (out of six transactions, dealing with utilities access, permits, licenses, and taxes), and 3.9 percent of firms had been asked for a gift or informal payment in their interaction with public entities. In 2017 Transparency International ranked FYR Macedonia 107th out of 180 countries on its Corruption Perceptions Index.
248 Ohrid, Struga, Prespa and their surroundings; Skopje, Kumanovo and their surroundings; Pelagonija and surroundings; Tikvesh area and surroundings; Reka area, Mavrovo and surroundings; Polog area and surroundings; Maleshevo and surroundings; Gevgelija, Dojran, and surroundings; Strumica and its surroundings; and Stip, Radovis, and surroundings.
FYR MACEDONIA SYSTEMATIC COUNTRY DIAGNOSTIC
252 ANNExES
each market segment.249 Third, the authorities also need to make domestic firms more competitive by upgrading attractions, promoting the country, increasing the availability of skilled labor, and providing firms with tools to improve their delivery capacity. Finally, the government needs to improve the industry as a whole by: (1) creating a forward-looking strategy with an over-arching vision, targets, and action plans for the industry; (2) allocating enough resources to build up the industry; (3) providing better-quality data and better mechanisms for evidence-based policy-making; (4) clarifying the role of the public sector and better coordinating the activities of relevant public entities; (5) enhancing the public-private dialogue; (6) creating a more effective system for destination management; and (7) adopting business-friendly reforms, such as specifying criteria for licensing travel agencies and grading hotels and accommodation facilities.
A4.5 Information and Communication Technologies (ICT)
In 2015–16, the ICT industry employed about 14,000 workers and represented about 2 percent of GDP. Even though the industry is relatively small size, the number of ICT firms has grown ten-fold in the last decade,250 and by 2017 there were 1,680 ICT firms registered in 2017.251 ICT-related exports grew from € 95.9 million in 2010 to €150.5 million in 2016, when hardware made up the largest portion of ICT exports (€ 93 million), followed by telecommunications (€53.9 million) and software (€3.6 million).252 The telecommunications sector dominates the industry, but computer programing has grown in recent years and represented 23.2 percent of the industry in 2016, with the fastest-growing ICT segments being information technology (IT) services (16 percent) and software development (12 percent). The software development sector is currently one of the most dynamic and promising sectors in the whole economy; it surged as a result of the roll-out of e-Government and the entry of foreign firms and their software delivery centers.
The biggest challenges confronting the industry are the lack of skilled labor, relatively minimal ICT usage, and the limited availability and high cost of high-speed broadband connections, particularly in rural areas. In 2010–15 value-added in the telecommunications sector declined by 21 percent; meanwhile, computer programing and related activities doubled their value-added over the same period with a compound annual growth rate of 16.4 percent. It thus appears that the industry has an opportunity to move away from providing services lower-value-added outsourcing activities to higher-value-added full-package software products.253 However, FYR Macedonia workers lack the skills the industry needs to fully transition into higher value-added sectors, and there is a significant gap between Internet access and ICT usage in the private sector, resulting in a small domestic software development market. Moreover, the country’s high-speed broadband services for the bottom 40 percent of its citizens are the least affordable in the Western Balkans.
249 The market segments are organized active tourists, independent active tourists, hard adventure tourists, domestic short-break tourists, regional short-break tourists, and organized large-group explorers.
250 Chamber of Commerce in the ICT Industry (MASIT), 2018.251 Ibid. The number of firms was 1,524 in 2015, 1,616 in 2016 and 1,680 in 2017.252 Chamber of Commerce in the ICT Industry (MASIT), 2018, State Statistical Office.253 About 30–50 percent of the Chamber of Commerce of the ICT Industry’s member firms produce their own software products, and
some firms provide outsourcing services for foreign partners’ software development.
SEIZING A BRIGHTER FUTURE FOR ALL
253ANNExES
FYR Macedonia has almost no barriers to attracting FDI in lower-value-added ICT-related retail sales, marketing, or support (Figure A4.6 and Figure A4.7). In contrast to other industries, size of the domestic and foreign market and questionable skills do not seem to be a major barrier for foreign firms interested in selling computer programming products, communications equipment, or services. with or without a retail location in the country. As a result, the country received over $65 million in FDI between 2003 and 2017,254 for, e.g., custom computer programming services, management services for computer facilities, and software publishing.
Figure A4.6: ICB Analysis of the ICT Industry (Communications Sector)Number of Barriers Facing Foreign Investors for each Business ActivityBenchmarking analysis relative to successful countries by sector & activity for current country performance
Business Activity
DEMAND PRODUCTION FACTORS KEY INPUTS INSTITUTIONS domestic and/
or global market
potential
labor and skills
geography and natural
resource endowment
existing capabilities energy transport
finance (cost and
availability)regulatory
barriersrule of law
and property rights
market contest-ability
macro and political stability
Business Services 4 11 0 9 0 7 4 1 4 4 1Design, Development & Testing
2 1 0 3 0 2 0 0 0 0 0Education & Training 3 11 1 10 2 7 8 1 5 4 2Headquarters 3 6 0 9 0 3 3 0 2 3 0Research & Development 4 9 2 14 1 3 6 1 2 6 2ICT & Internet Infrastructure 0 0 0 0 0 0 0 0 0 0 0Shared Services Centre 6 9 2 11 3 4 3 4 3 5 3Customer Contact Centre 3 3 0 1 0 2 0 0 0 1 0Technical Support Centre 3 4 0 7 0 4 0 0 1 0 0Logistics, Distribution & Transportation
5 12 3 14 7 7 6 2 9 5 3Maintenance & Servicing 4 8 2 5 0 1 2 1 3 4 1Manufacturing 2 3 1 3 0 1 0 0 0 0 0Retail 0 0 0 0 0 0 0 0 0 0 0Sales, Marketing & Support 0 0 0 0 0 0 0 0 0 0 0Source: Author’s calculations based on data from fDi Markets database, Financial Times, and various global indicators.
There are numerous barriers to FDI, however, in most higher value-added ICT activities, especially in the communications segment. As in other industries, the small domestic and foreign markets, the limited availability of qualified labor and skills, the poor capabilities of existing firms, and the low quality of the country’s logistics infrastructure deter foreign investors from expanding to higher-value-added ICT activities. For instance, foreign firms need to be able to retain local talent to sustain computer programming initiatives, and a combination of skilled workers and the ability of domestic firms to quickly absorb technology is a prerequisite for foreign investment in R&D initiatives. While logistics competence and the timeliness of shipments are also important to attract FDI in the ICT industry,
254 Financial Times fDiMarkets database, 2017.
FYR MACEDONIA SYSTEMATIC COUNTRY DIAGNOSTIC
254 ANNExES
traditional transport infrastructure, such as road and rail, is not essential to its business activities. And there are deterrents to FDI in design, development, and testing as well as business services in the communications sector but not in software and IT services, again probably because the communications sector has higher infrastructure needs for design and testing.
Figure A4.7: ICB Analysis of the ICT Industry (Software and IT Services)Number of Barriers Facing Foreign Investors for each Business ActivityBenchmarking analysis relative to successful countries by sector & activity for current country performance
Business Activity
DEMAND PRODUCTION FACTORS KEY INPUTS INSTITUTIONS domestic and/
or global market
potential
labor and skills
geography and natural
resource endowment
existing capabilities energy transport
finance (cost and
availability)regulatory
barriersrule of law
and property rights
market contest-ability
macro and political stability
Business Services 0 0 0 0 0 0 0 0 0 0 0Design, Development & Testing
0 0 0 0 0 0 0 0 0 0 0Education & Training 4 5 1 7 0 3 1 0 0 0 0Headquarters 1 4 0 7 0 3 0 0 0 0 0Research & Development 3 10 0 12 2 7 4 1 4 3 2ICT & Internet Infrastructure 2 5 0 3 0 2 0 0 0 0 0Shared Services Centre 4 6 0 9 1 4 2 0 1 1 1Customer Contact Centre 4 10 1 11 2 4 3 1 3 1 1Technical Support Centre 2 3 0 7 0 3 0 0 0 0 0Sales, Marketing & Support 0 0 0 0 0 0 0 0 0 0 0Source: Author’s calculations based on data from fDi Markets database, Financial Times, and various global indicators.
The Government has several options for promoting growth in the ICT industry. First, it needs to evaluate its own procurement bids for quality as well as cost, as public procurement based on cost alone is not suitable in the ICT industry. Second, it needs to remove the double taxation of imports and exports, streamline value-added tax rates for initial software products and upgrades, and analyze the impact of certain gray-economy online outlets that sell hardware below market rates. Third, the appropriate authorities need to ensure that customs laws and inspection procedures are followed consistently for all industries affected. Finally, the government needs to consider amending labor laws to allow flexible work arrangements, which are important in tight labor markets and for an industry that depends on freelancing.
SEIZING A BRIGHTER FUTURE FOR ALL
255ANNExES
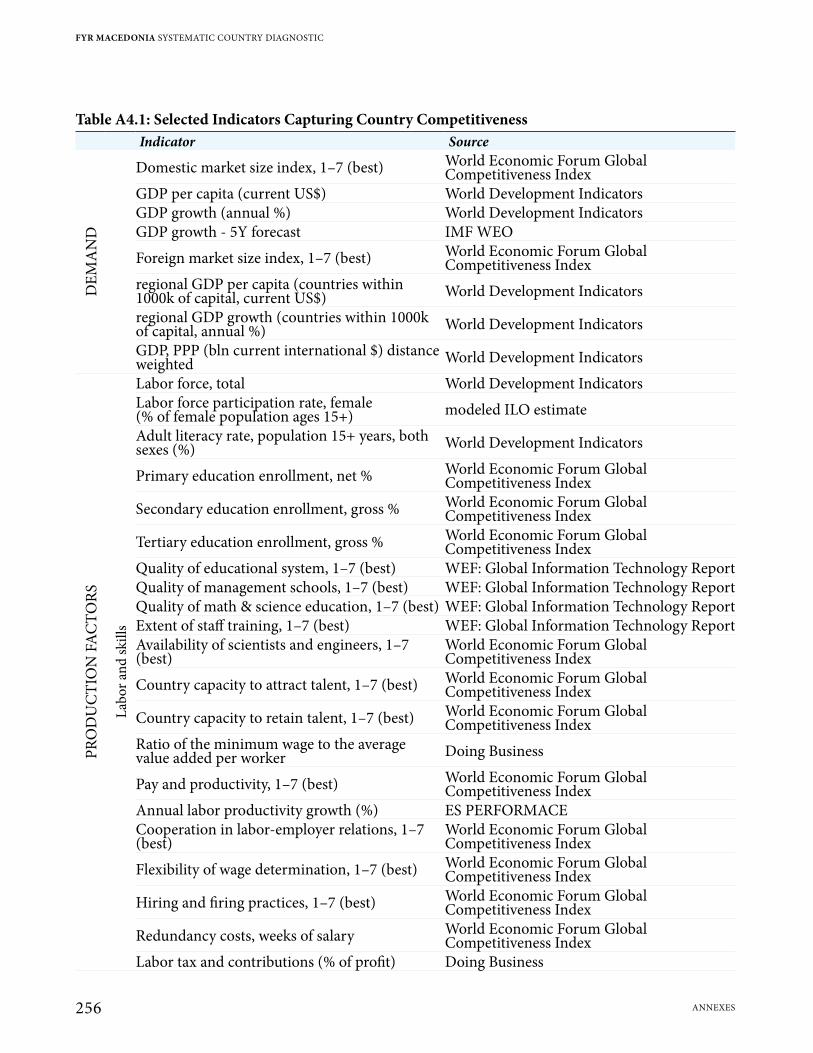
Table A4.1: Selected Indicators Capturing Country CompetitivenessIndicator Source
DEM
AN
D
Domestic market size index, 1–7 (best) World Economic Forum Global Competitiveness Index
GDP per capita (current US$) World Development IndicatorsGDP growth (annual %) World Development IndicatorsGDP growth - 5Y forecast IMF WEO
Foreign market size index, 1–7 (best) World Economic Forum Global Competitiveness Index
regional GDP per capita (countries within 1000k of capital, current US$) World Development Indicators
regional GDP growth (countries within 1000k of capital, annual %) World Development Indicators
GDP, PPP (bln current international $) distance weighted World Development Indicators
PRO
DU
CTI
ON
FA
CTO
RS
Labo
r and
skill
s
Labor force, total World Development IndicatorsLabor force participation rate, female (% of female population ages 15+) modeled ILO estimate
Adult literacy rate, population 15+ years, both sexes (%) World Development Indicators
Primary education enrollment, net % World Economic Forum Global Competitiveness Index
Secondary education enrollment, gross % World Economic Forum Global Competitiveness Index
Tertiary education enrollment, gross % World Economic Forum Global Competitiveness Index
Quality of educational system, 1–7 (best) WEF: Global Information Technology ReportQuality of management schools, 1–7 (best) WEF: Global Information Technology ReportQuality of math & science education, 1–7 (best) WEF: Global Information Technology ReportExtent of staff training, 1–7 (best) WEF: Global Information Technology ReportAvailability of scientists and engineers, 1–7 (best)
World Economic Forum Global Competitiveness Index
Country capacity to attract talent, 1–7 (best) World Economic Forum Global Competitiveness Index
Country capacity to retain talent, 1–7 (best) World Economic Forum Global Competitiveness Index
Ratio of the minimum wage to the average value added per worker Doing Business
Pay and productivity, 1–7 (best) World Economic Forum Global Competitiveness Index
Annual labor productivity growth (%) ES PERFORMACECooperation in labor-employer relations, 1–7 (best)
World Economic Forum Global Competitiveness Index
Flexibility of wage determination, 1–7 (best) World Economic Forum Global Competitiveness Index
Hiring and firing practices, 1–7 (best) World Economic Forum Global Competitiveness Index
Redundancy costs, weeks of salary World Economic Forum Global Competitiveness Index
Labor tax and contributions (% of profit) Doing Business
FYR MACEDONIA SYSTEMATIC COUNTRY DIAGNOSTIC
256 ANNExES
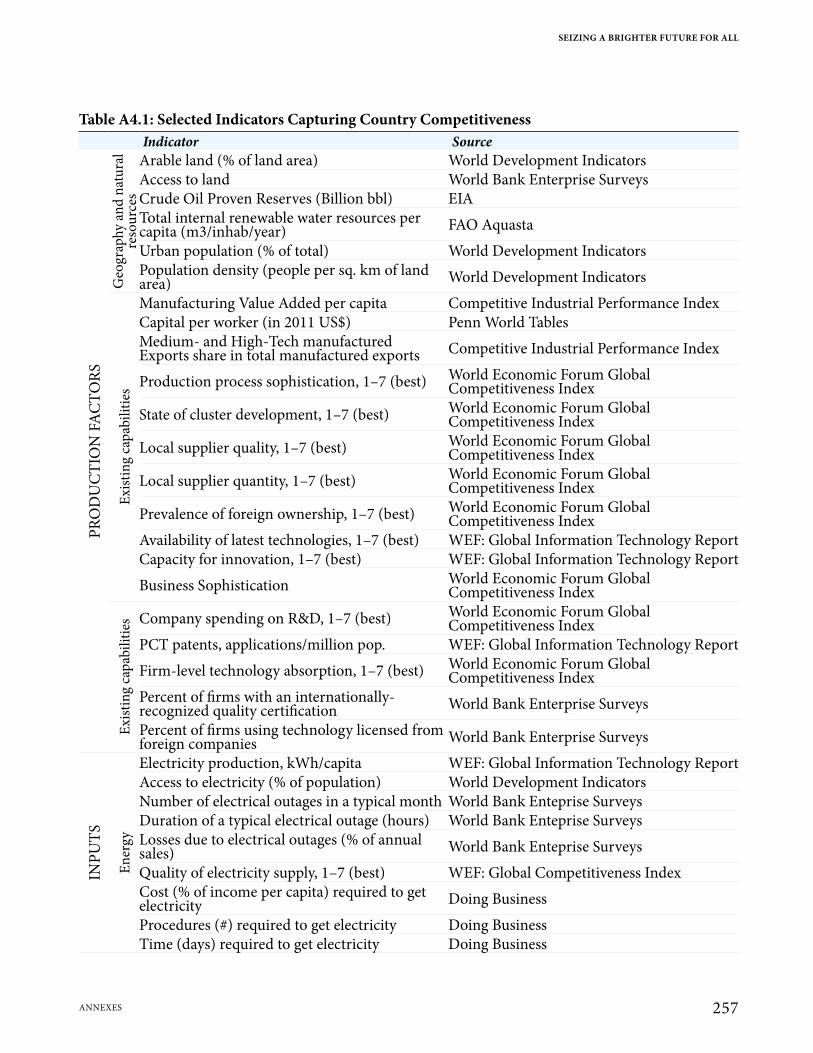
Table A4.1: Selected Indicators Capturing Country CompetitivenessIndicator Source
PRO
DU
CTI
ON
FA
CTO
RSG
eogr
aphy
and
nat
ural
re
sour
ces
Arable land (% of land area) World Development IndicatorsAccess to land World Bank Enterprise SurveysCrude Oil Proven Reserves (Billion bbl) EIATotal internal renewable water resources per capita (m3/inhab/year) FAO Aquasta
Urban population (% of total) World Development IndicatorsPopulation density (people per sq. km of land area) World Development Indicators
Exist
ing
capa
bilit
ies
Manufacturing Value Added per capita Competitive Industrial Performance IndexCapital per worker (in 2011 US$) Penn World Tables Medium- and High-Tech manufactured Exports share in total manufactured exports Competitive Industrial Performance Index
Production process sophistication, 1–7 (best) World Economic Forum Global Competitiveness Index
State of cluster development, 1–7 (best) World Economic Forum Global Competitiveness Index
Local supplier quality, 1–7 (best) World Economic Forum Global Competitiveness Index
Local supplier quantity, 1–7 (best) World Economic Forum Global Competitiveness Index
Prevalence of foreign ownership, 1–7 (best) World Economic Forum Global Competitiveness Index
Availability of latest technologies, 1–7 (best) WEF: Global Information Technology ReportCapacity for innovation, 1–7 (best) WEF: Global Information Technology Report
Business Sophistication World Economic Forum Global Competitiveness Index
Exist
ing
capa
bilit
ies Company spending on R&D, 1–7 (best) World Economic Forum Global
Competitiveness IndexPCT patents, applications/million pop. WEF: Global Information Technology Report
Firm-level technology absorption, 1–7 (best) World Economic Forum Global Competitiveness Index
Percent of firms with an internationally-recognized quality certification World Bank Enterprise Surveys
Percent of firms using technology licensed from foreign companies World Bank Enterprise Surveys
INPU
TS
Ener
gy
Electricity production, kWh/capita WEF: Global Information Technology ReportAccess to electricity (% of population) World Development IndicatorsNumber of electrical outages in a typical month World Bank Enteprise SurveysDuration of a typical electrical outage (hours) World Bank Enteprise SurveysLosses due to electrical outages (% of annual sales) World Bank Enteprise Surveys
Quality of electricity supply, 1–7 (best) WEF: Global Competitiveness IndexCost (% of income per capita) required to get electricity Doing Business
Procedures (#) required to get electricity Doing BusinessTime (days) required to get electricity Doing Business
SEIZING A BRIGHTER FUTURE FOR ALL
257ANNExES
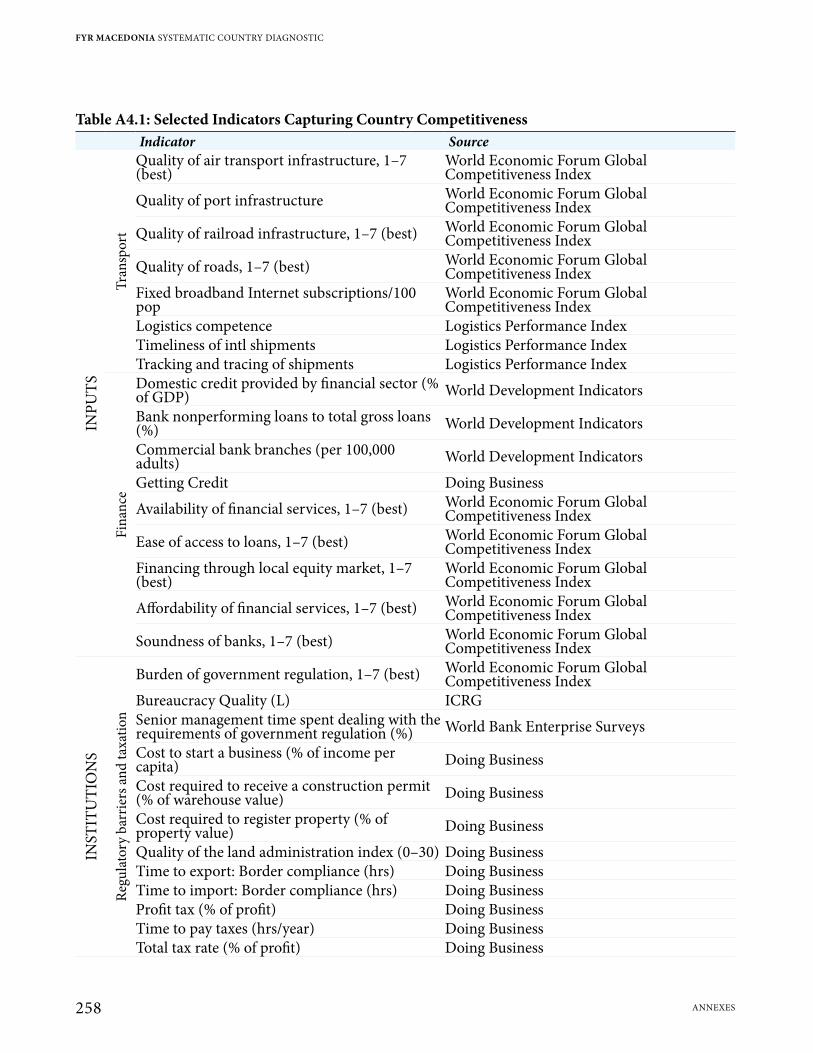
Table A4.1: Selected Indicators Capturing Country CompetitivenessIndicator Source
INPU
TS
Tran
spor
t
Quality of air transport infrastructure, 1–7 (best)
World Economic Forum Global Competitiveness Index
Quality of port infrastructure World Economic Forum Global Competitiveness Index
Quality of railroad infrastructure, 1–7 (best) World Economic Forum Global Competitiveness Index
Quality of roads, 1–7 (best) World Economic Forum Global Competitiveness Index
Fixed broadband Internet subscriptions/100 pop
World Economic Forum Global Competitiveness Index
Logistics competence Logistics Performance IndexTimeliness of intl shipments Logistics Performance IndexTracking and tracing of shipments Logistics Performance Index
Fina
nce
Domestic credit provided by financial sector (% of GDP) World Development Indicators
Bank nonperforming loans to total gross loans (%) World Development Indicators
Commercial bank branches (per 100,000 adults) World Development Indicators
Getting Credit Doing Business
Availability of financial services, 1–7 (best) World Economic Forum Global Competitiveness Index
Ease of access to loans, 1–7 (best) World Economic Forum Global Competitiveness Index
Financing through local equity market, 1–7 (best)
World Economic Forum Global Competitiveness Index
Affordability of financial services, 1–7 (best) World Economic Forum Global Competitiveness Index
Soundness of banks, 1–7 (best) World Economic Forum Global Competitiveness Index
INST
ITU
TIO
NS
Regu
lato
ry b
arrie
rs a
nd ta
xatio
n
Burden of government regulation, 1–7 (best) World Economic Forum Global Competitiveness Index
Bureaucracy Quality (L) ICRG Senior management time spent dealing with the requirements of government regulation (%) World Bank Enterprise Surveys
Cost to start a business (% of income per capita) Doing Business
Cost required to receive a construction permit (% of warehouse value) Doing Business
Cost required to register property (% of property value) Doing Business
Quality of the land administration index (0–30) Doing BusinessTime to export: Border compliance (hrs) Doing BusinessTime to import: Border compliance (hrs) Doing BusinessProfit tax (% of profit) Doing BusinessTime to pay taxes (hrs/year) Doing BusinessTotal tax rate (% of profit) Doing Business
FYR MACEDONIA SYSTEMATIC COUNTRY DIAGNOSTIC
258 ANNExES
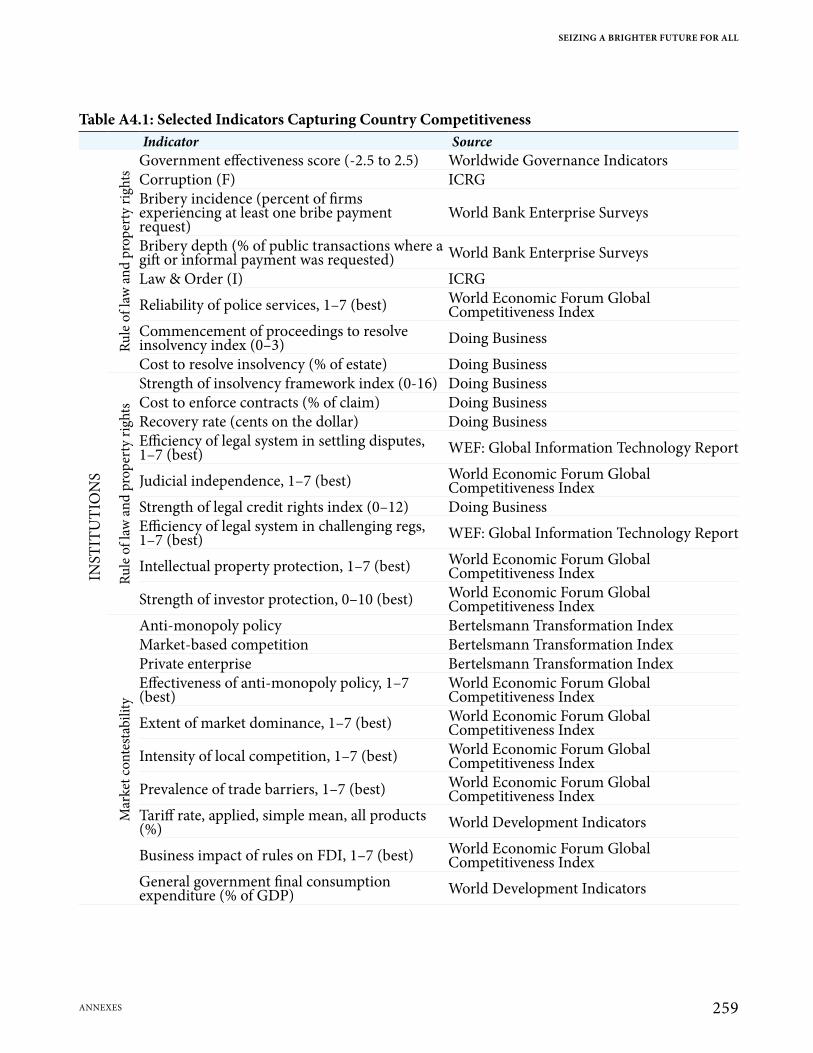
Table A4.1: Selected Indicators Capturing Country CompetitivenessIndicator Source
INST
ITU
TIO
NS
Rule
of l
aw a
nd p
rope
rty
right
s
Government effectiveness score (-2.5 to 2.5) Worldwide Governance IndicatorsCorruption (F) ICRG Bribery incidence (percent of firms experiencing at least one bribe payment request)
World Bank Enterprise Surveys
Bribery depth (% of public transactions where a gift or informal payment was requested) World Bank Enterprise Surveys
Law & Order (I) ICRG
Reliability of police services, 1–7 (best) World Economic Forum Global Competitiveness Index
Commencement of proceedings to resolve insolvency index (0–3) Doing Business
Cost to resolve insolvency (% of estate) Doing Business
Rule
of l
aw a
nd p
rope
rty
right
s
Strength of insolvency framework index (0-16) Doing BusinessCost to enforce contracts (% of claim) Doing BusinessRecovery rate (cents on the dollar) Doing BusinessEfficiency of legal system in settling disputes, 1–7 (best) WEF: Global Information Technology Report
Judicial independence, 1–7 (best) World Economic Forum Global Competitiveness Index
Strength of legal credit rights index (0–12) Doing BusinessEfficiency of legal system in challenging regs, 1–7 (best) WEF: Global Information Technology Report
Intellectual property protection, 1–7 (best) World Economic Forum Global Competitiveness Index
Strength of investor protection, 0–10 (best) World Economic Forum Global Competitiveness Index
Mar
ket c
onte
stab
ility
Anti-monopoly policy Bertelsmann Transformation IndexMarket-based competition Bertelsmann Transformation IndexPrivate enterprise Bertelsmann Transformation IndexEffectiveness of anti-monopoly policy, 1–7 (best)
World Economic Forum Global Competitiveness Index
Extent of market dominance, 1–7 (best) World Economic Forum Global Competitiveness Index
Intensity of local competition, 1–7 (best) World Economic Forum Global Competitiveness Index
Prevalence of trade barriers, 1–7 (best) World Economic Forum Global Competitiveness Index
Tariff rate, applied, simple mean, all products (%) World Development Indicators
Business impact of rules on FDI, 1–7 (best) World Economic Forum Global Competitiveness Index
General government final consumption expenditure (% of GDP) World Development Indicators
SEIZING A BRIGHTER FUTURE FOR ALL
259ANNExES

Table A4.1: Selected Indicators Capturing Country CompetitivenessIndicator Source
INST
ITU
TIO
NS
Mac
roec
onom
ic a
nd p
oliti
cal s
tabi
lity
Economic Risk Rating ICRG Financial Risk Rating ICRG External debt stocks (% of exports of goods, services and primary income) World Development Indicators
General government gross debt (% of GDP) World Economic OutlookRisk for Debt Service ICRG Current account balance (% of GDP) World Development IndicatorsTotal reserves in months of imports World Development IndicatorsInflation WEORisk for Inflation ICRG Political stability score (-2.5 to 2.5) Worldwide Governance IndicatorsVoice & accountability score (-2.5 to 2.5) Worldwide Governance IndicatorsPolitical Risk Rating ICRG Government Stability (A) ICRG
Mac
roec
onom
ic a
nd
polit
ical
stab
ility
Public trust in politicians, 1–7 (best) World Economic Forum Global Competitiveness Index
Business costs of crime and violence, 1–7 (best) World Economic Forum Global Competitiveness Index
Ethnic Tensions (J) ICRG External Conflict (E) ICRG Internal Conflict (D) ICRG Military in Politics (G) ICRG Religious Tensions (H) ICRG
FYR MACEDONIA SYSTEMATIC COUNTRY DIAGNOSTIC
260 ANNExES
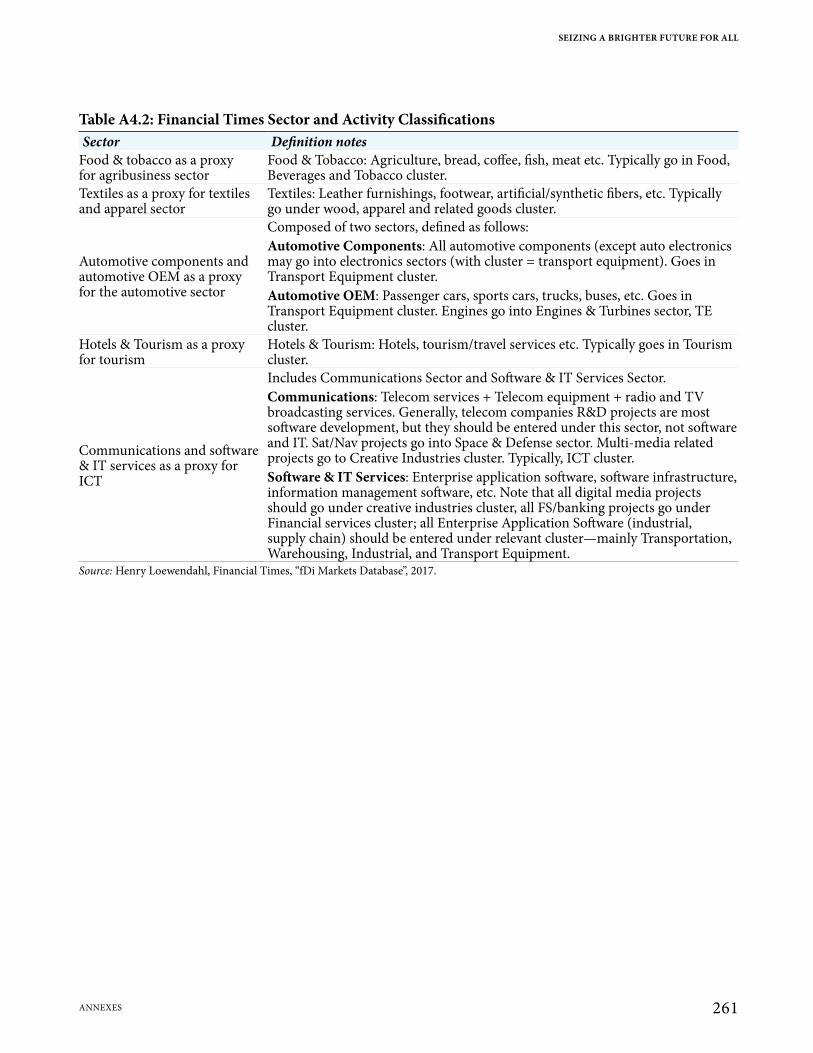
Table A4.2: Financial Times Sector and Activity ClassificationsSector Definition notes
Food & tobacco as a proxy for agribusiness sector
Food & Tobacco: Agriculture, bread, coffee, fish, meat etc. Typically go in Food, Beverages and Tobacco cluster.
Textiles as a proxy for textiles and apparel sector
Textiles: Leather furnishings, footwear, artificial/synthetic fibers, etc. Typically go under wood, apparel and related goods cluster.
Automotive components and automotive OEM as a proxy for the automotive sector
Composed of two sectors, defined as follows:Automotive Components: All automotive components (except auto electronics may go into electronics sectors (with cluster = transport equipment). Goes in Transport Equipment cluster.Automotive OEM: Passenger cars, sports cars, trucks, buses, etc. Goes in Transport Equipment cluster. Engines go into Engines & Turbines sector, TE cluster.
Hotels & Tourism as a proxy for tourism
Hotels & Tourism: Hotels, tourism/travel services etc. Typically goes in Tourism cluster.
Communications and software & IT services as a proxy for ICT
Includes Communications Sector and Software & IT Services Sector.Communications: Telecom services + Telecom equipment + radio and TV broadcasting services. Generally, telecom companies R&D projects are most software development, but they should be entered under this sector, not software and IT. Sat/Nav projects go into Space & Defense sector. Multi-media related projects go to Creative Industries cluster. Typically, ICT cluster.Software & IT Services: Enterprise application software, software infrastructure, information management software, etc. Note that all digital media projects should go under creative industries cluster, all FS/banking projects go under Financial services cluster; all Enterprise Application Software (industrial, supply chain) should be entered under relevant cluster—mainly Transportation, Warehousing, Industrial, and Transport Equipment.
Source: Henry Loewendahl, Financial Times, “fDi Markets Database”, 2017.
SEIZING A BRIGHTER FUTURE FOR ALL
261ANNExES
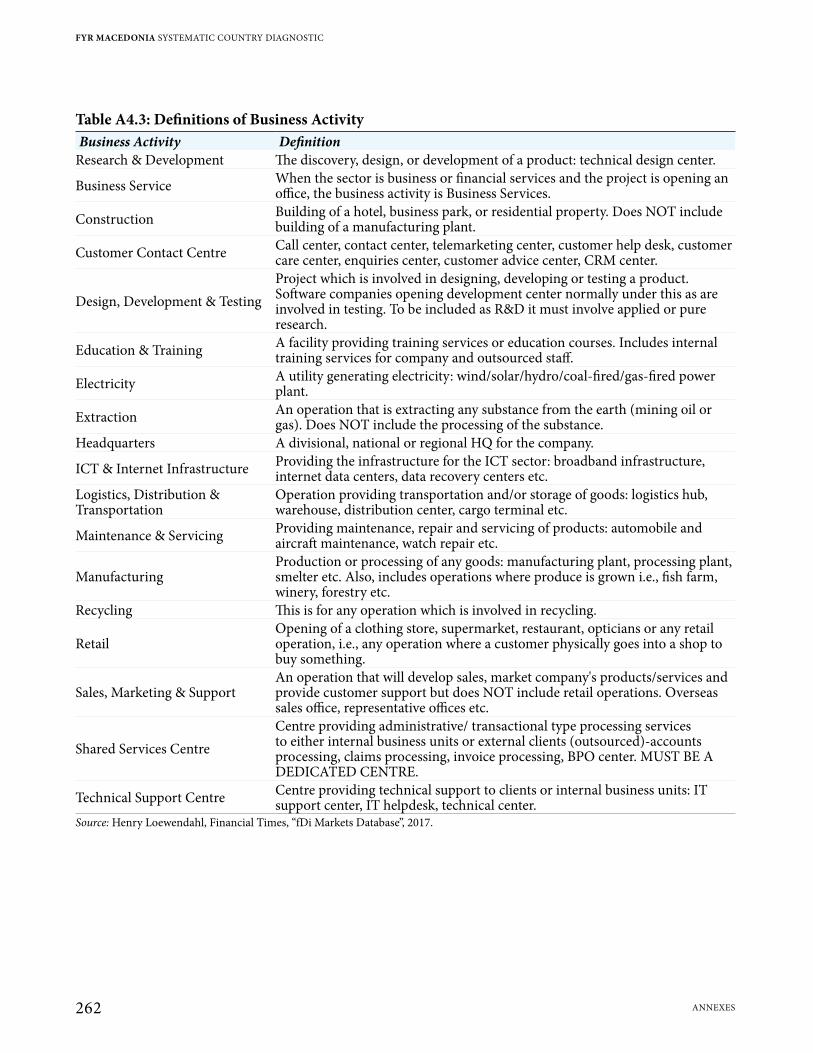
Table A4.3: Definitions of Business ActivityBusiness Activity Definition
Research & Development The discovery, design, or development of a product: technical design center.
Business Service When the sector is business or financial services and the project is opening an office, the business activity is Business Services.
Construction Building of a hotel, business park, or residential property. Does NOT include building of a manufacturing plant.
Customer Contact Centre Call center, contact center, telemarketing center, customer help desk, customer care center, enquiries center, customer advice center, CRM center.
Design, Development & Testing Project which is involved in designing, developing or testing a product. Software companies opening development center normally under this as are involved in testing. To be included as R&D it must involve applied or pure research.
Education & Training A facility providing training services or education courses. Includes internal training services for company and outsourced staff.
Electricity A utility generating electricity: wind/solar/hydro/coal-fired/gas-fired power plant.
Extraction An operation that is extracting any substance from the earth (mining oil or gas). Does NOT include the processing of the substance.
Headquarters A divisional, national or regional HQ for the company.
ICT & Internet Infrastructure Providing the infrastructure for the ICT sector: broadband infrastructure, internet data centers, data recovery centers etc.
Logistics, Distribution & Transportation
Operation providing transportation and/or storage of goods: logistics hub, warehouse, distribution center, cargo terminal etc.
Maintenance & Servicing Providing maintenance, repair and servicing of products: automobile and aircraft maintenance, watch repair etc.
ManufacturingProduction or processing of any goods: manufacturing plant, processing plant, smelter etc. Also, includes operations where produce is grown i.e., fish farm, winery, forestry etc.
Recycling This is for any operation which is involved in recycling.
RetailOpening of a clothing store, supermarket, restaurant, opticians or any retail operation, i.e., any operation where a customer physically goes into a shop to buy something.
Sales, Marketing & SupportAn operation that will develop sales, market company's products/services and provide customer support but does NOT include retail operations. Overseas sales office, representative offices etc.
Shared Services CentreCentre providing administrative/ transactional type processing services to either internal business units or external clients (outsourced)-accounts processing, claims processing, invoice processing, BPO center. MUST BE A DEDICATED CENTRE.
Technical Support Centre Centre providing technical support to clients or internal business units: IT support center, IT helpdesk, technical center.
Source: Henry Loewendahl, Financial Times, “fDi Markets Database”, 2017.
FYR MACEDONIA SYSTEMATIC COUNTRY DIAGNOSTIC
262 ANNExES
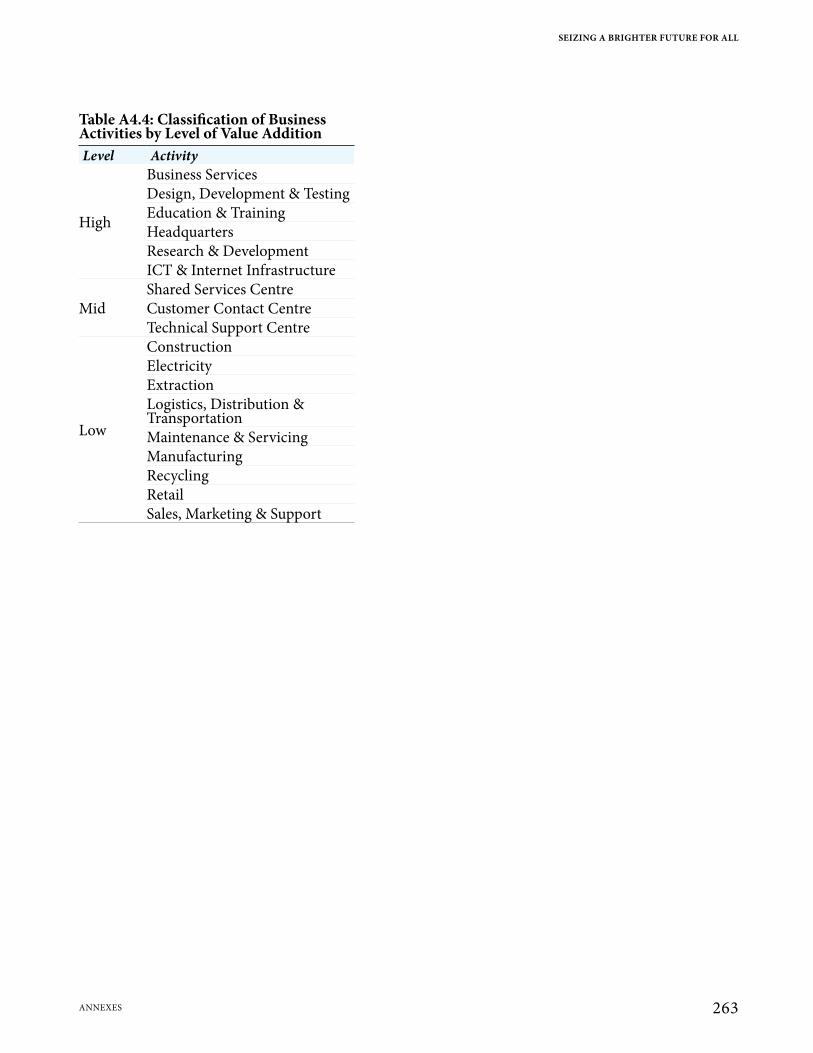
Table A4.4: Classification of Business Activities by Level of Value AdditionLevel Activity
High
Business ServicesDesign, Development & TestingEducation & TrainingHeadquartersResearch & DevelopmentICT & Internet Infrastructure
MidShared Services CentreCustomer Contact CentreTechnical Support Centre
Low
ConstructionElectricityExtractionLogistics, Distribution & TransportationMaintenance & ServicingManufacturingRecyclingRetailSales, Marketing & Support
SEIZING A BRIGHTER FUTURE FOR ALL
263ANNExES
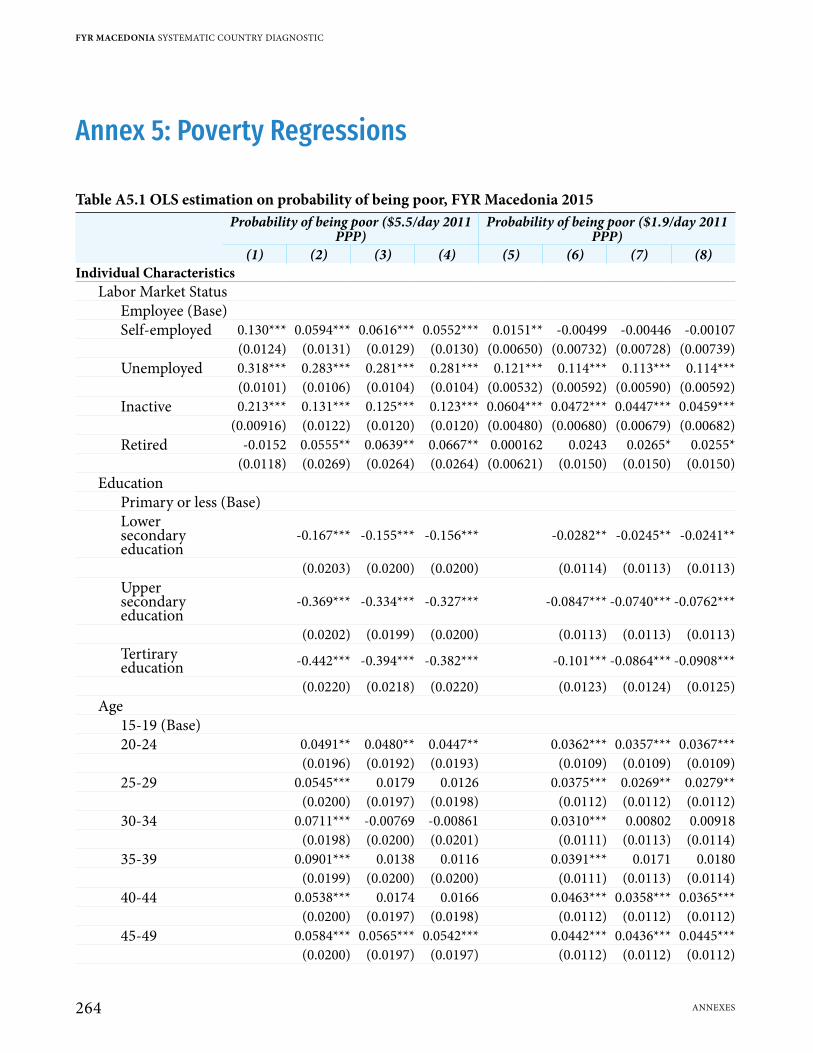
Annex 5: Poverty Regressions
Table A5.1 OLS estimation on probability of being poor, FYR Macedonia 2015Probability of being poor ($5.5/day 2011
PPP)Probability of being poor ($1.9/day 2011
PPP)(1) (2) (3) (4) (5) (6) (7) (8)
Individual CharacteristicsLabor Market Status
Employee (Base)Self-employed 0.130*** 0.0594*** 0.0616*** 0.0552*** 0.0151** -0.00499 -0.00446 -0.00107
(0.0124) (0.0131) (0.0129) (0.0130) (0.00650) (0.00732) (0.00728) (0.00739)Unemployed 0.318*** 0.283*** 0.281*** 0.281*** 0.121*** 0.114*** 0.113*** 0.114***
(0.0101) (0.0106) (0.0104) (0.0104) (0.00532) (0.00592) (0.00590) (0.00592)Inactive 0.213*** 0.131*** 0.125*** 0.123*** 0.0604*** 0.0472*** 0.0447*** 0.0459***
(0.00916) (0.0122) (0.0120) (0.0120) (0.00480) (0.00680) (0.00679) (0.00682)Retired -0.0152 0.0555** 0.0639** 0.0667** 0.000162 0.0243 0.0265* 0.0255*
(0.0118) (0.0269) (0.0264) (0.0264) (0.00621) (0.0150) (0.0150) (0.0150)Education
Primary or less (Base)Lower secondary education
-0.167*** -0.155*** -0.156*** -0.0282** -0.0245** -0.0241**
(0.0203) (0.0200) (0.0200) (0.0114) (0.0113) (0.0113)Upper secondary education
-0.369*** -0.334*** -0.327*** -0.0847*** -0.0740*** -0.0762***
(0.0202) (0.0199) (0.0200) (0.0113) (0.0113) (0.0113)Tertirary education -0.442*** -0.394*** -0.382*** -0.101*** -0.0864*** -0.0908***
(0.0220) (0.0218) (0.0220) (0.0123) (0.0124) (0.0125)Age
15-19 (Base)20-24 0.0491** 0.0480** 0.0447** 0.0362*** 0.0357*** 0.0367***
(0.0196) (0.0192) (0.0193) (0.0109) (0.0109) (0.0109)25-29 0.0545*** 0.0179 0.0126 0.0375*** 0.0269** 0.0279**
(0.0200) (0.0197) (0.0198) (0.0112) (0.0112) (0.0112)30-34 0.0711*** -0.00769 -0.00861 0.0310*** 0.00802 0.00918
(0.0198) (0.0200) (0.0201) (0.0111) (0.0113) (0.0114)35-39 0.0901*** 0.0138 0.0116 0.0391*** 0.0171 0.0180
(0.0199) (0.0200) (0.0200) (0.0111) (0.0113) (0.0114)40-44 0.0538*** 0.0174 0.0166 0.0463*** 0.0358*** 0.0365***
(0.0200) (0.0197) (0.0198) (0.0112) (0.0112) (0.0112)45-49 0.0584*** 0.0565*** 0.0542*** 0.0442*** 0.0436*** 0.0445***
(0.0200) (0.0197) (0.0197) (0.0112) (0.0112) (0.0112)
FYR MACEDONIA SYSTEMATIC COUNTRY DIAGNOSTIC
264 ANNExES
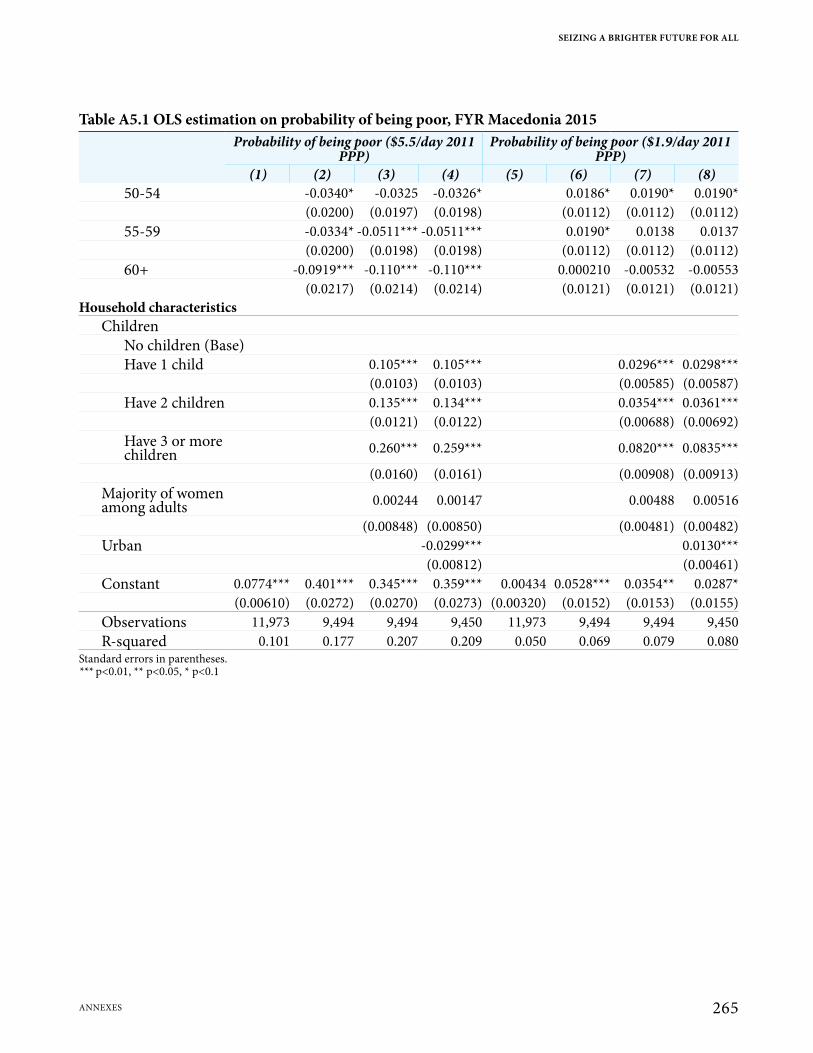
Table A5.1 OLS estimation on probability of being poor, FYR Macedonia 2015Probability of being poor ($5.5/day 2011
PPP)Probability of being poor ($1.9/day 2011
PPP)(1) (2) (3) (4) (5) (6) (7) (8)
50-54 -0.0340* -0.0325 -0.0326* 0.0186* 0.0190* 0.0190*(0.0200) (0.0197) (0.0198) (0.0112) (0.0112) (0.0112)
55-59 -0.0334* -0.0511*** -0.0511*** 0.0190* 0.0138 0.0137(0.0200) (0.0198) (0.0198) (0.0112) (0.0112) (0.0112)
60+ -0.0919*** -0.110*** -0.110*** 0.000210 -0.00532 -0.00553(0.0217) (0.0214) (0.0214) (0.0121) (0.0121) (0.0121)
Household characteristicsChildren
No children (Base)Have 1 child 0.105*** 0.105*** 0.0296*** 0.0298***
(0.0103) (0.0103) (0.00585) (0.00587)Have 2 children 0.135*** 0.134*** 0.0354*** 0.0361***
(0.0121) (0.0122) (0.00688) (0.00692)Have 3 or more children 0.260*** 0.259*** 0.0820*** 0.0835***
(0.0160) (0.0161) (0.00908) (0.00913)Majority of women among adults 0.00244 0.00147 0.00488 0.00516
(0.00848) (0.00850) (0.00481) (0.00482)Urban -0.0299*** 0.0130***
(0.00812) (0.00461)Constant 0.0774*** 0.401*** 0.345*** 0.359*** 0.00434 0.0528*** 0.0354** 0.0287*
(0.00610) (0.0272) (0.0270) (0.0273) (0.00320) (0.0152) (0.0153) (0.0155)Observations 11,973 9,494 9,494 9,450 11,973 9,494 9,494 9,450R-squared 0.101 0.177 0.207 0.209 0.050 0.069 0.079 0.080
Standard errors in parentheses.*** p<0.01, ** p<0.05, * p<0.1
SEIZING A BRIGHTER FUTURE FOR ALL
265ANNExES
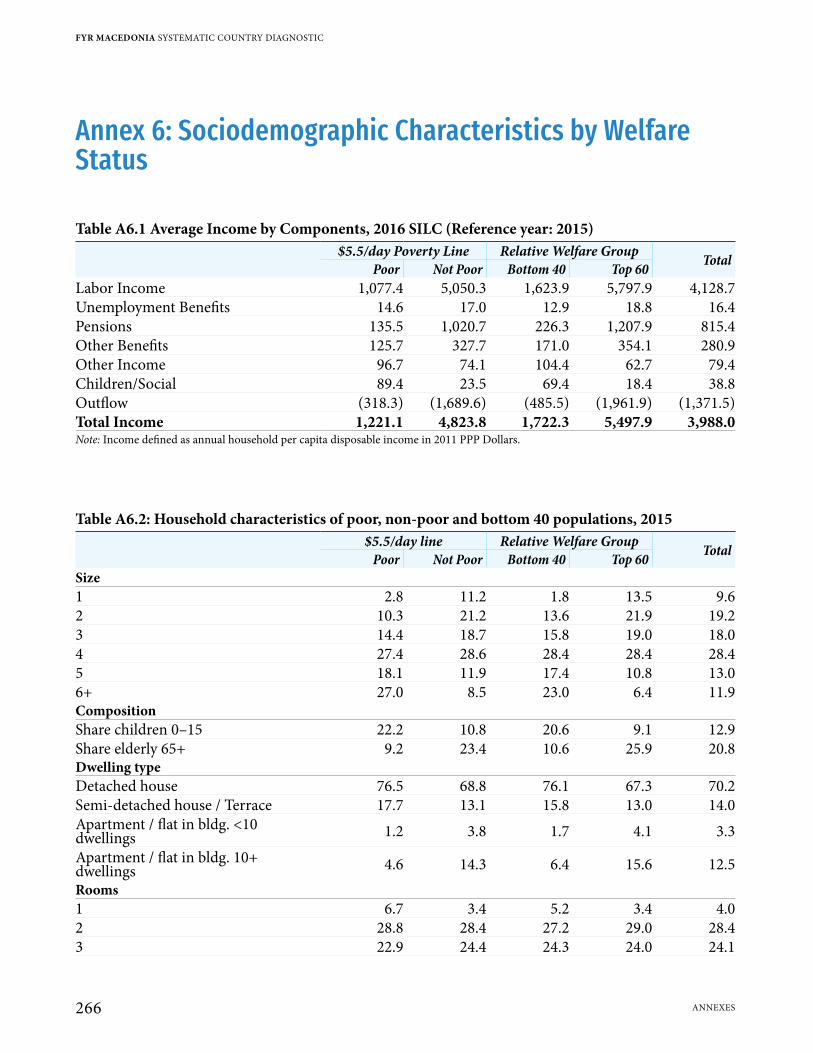
Annex 6: Sociodemographic Characteristics by Welfare Status
Table A6.1 Average Income by Components, 2016 SILC (Reference year: 2015)$5.5/day Poverty Line Relative Welfare Group TotalPoor Not Poor Bottom 40 Top 60
Labor Income 1,077.4 5,050.3 1,623.9 5,797.9 4,128.7Unemployment Benefits 14.6 17.0 12.9 18.8 16.4Pensions 135.5 1,020.7 226.3 1,207.9 815.4Other Benefits 125.7 327.7 171.0 354.1 280.9Other Income 96.7 74.1 104.4 62.7 79.4Children/Social 89.4 23.5 69.4 18.4 38.8Outflow (318.3) (1,689.6) (485.5) (1,961.9) (1,371.5)Total Income 1,221.1 4,823.8 1,722.3 5,497.9 3,988.0Note: Income defined as annual household per capita disposable income in 2011 PPP Dollars.
Table A6.2: Household characteristics of poor, non-poor and bottom 40 populations, 2015$5.5/day line Relative Welfare Group TotalPoor Not Poor Bottom 40 Top 60
Size1 2.8 11.2 1.8 13.5 9.62 10.3 21.2 13.6 21.9 19.23 14.4 18.7 15.8 19.0 18.04 27.4 28.6 28.4 28.4 28.45 18.1 11.9 17.4 10.8 13.06+ 27.0 8.5 23.0 6.4 11.9CompositionShare children 0–15 22.2 10.8 20.6 9.1 12.9Share elderly 65+ 9.2 23.4 10.6 25.9 20.8Dwelling typeDetached house 76.5 68.8 76.1 67.3 70.2Semi-detached house / Terrace 17.7 13.1 15.8 13.0 14.0Apartment / flat in bldg. <10 dwellings 1.2 3.8 1.7 4.1 3.3
Apartment / flat in bldg. 10+ dwellings 4.6 14.3 6.4 15.6 12.5Rooms1 6.7 3.4 5.2 3.4 4.02 28.8 28.4 27.2 29.0 28.43 22.9 24.4 24.3 24.0 24.1
FYR MACEDONIA SYSTEMATIC COUNTRY DIAGNOSTIC
266 ANNExES
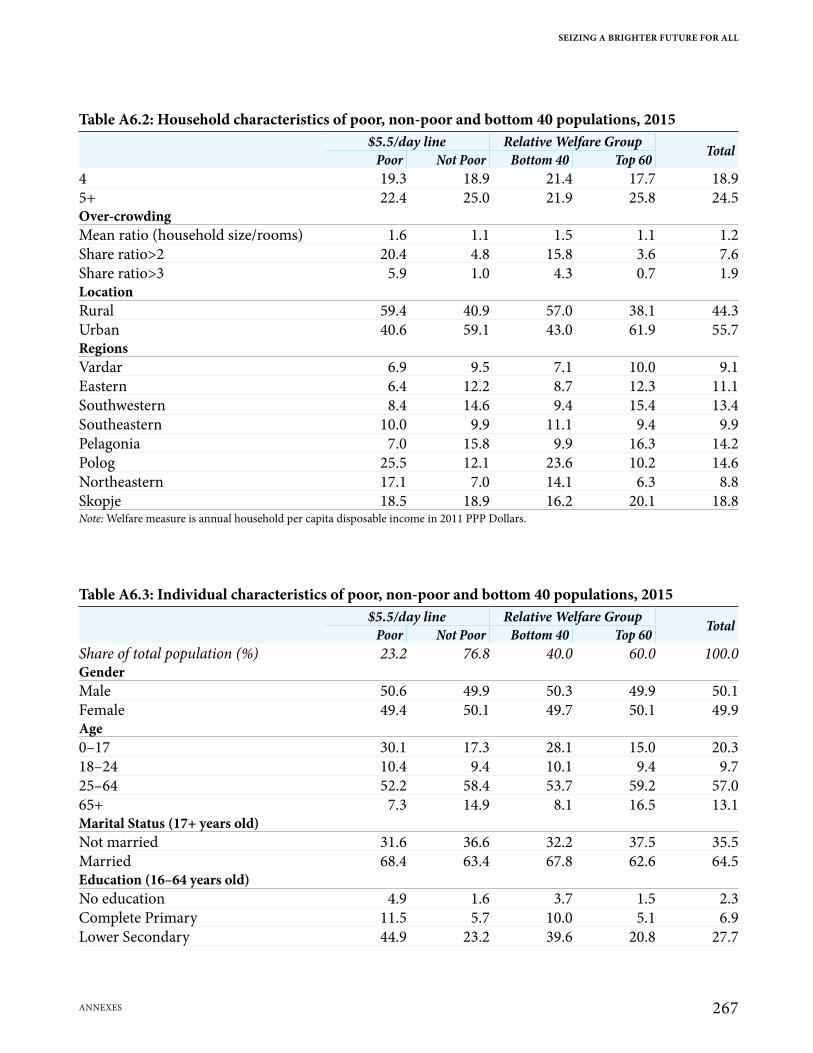
Table A6.2: Household characteristics of poor, non-poor and bottom 40 populations, 2015$5.5/day line Relative Welfare Group TotalPoor Not Poor Bottom 40 Top 60
4 19.3 18.9 21.4 17.7 18.95+ 22.4 25.0 21.9 25.8 24.5Over-crowdingMean ratio (household size/rooms) 1.6 1.1 1.5 1.1 1.2Share ratio>2 20.4 4.8 15.8 3.6 7.6Share ratio>3 5.9 1.0 4.3 0.7 1.9LocationRural 59.4 40.9 57.0 38.1 44.3Urban 40.6 59.1 43.0 61.9 55.7RegionsVardar 6.9 9.5 7.1 10.0 9.1Eastern 6.4 12.2 8.7 12.3 11.1Southwestern 8.4 14.6 9.4 15.4 13.4Southeastern 10.0 9.9 11.1 9.4 9.9Pelagonia 7.0 15.8 9.9 16.3 14.2Polog 25.5 12.1 23.6 10.2 14.6Northeastern 17.1 7.0 14.1 6.3 8.8Skopje 18.5 18.9 16.2 20.1 18.8Note: Welfare measure is annual household per capita disposable income in 2011 PPP Dollars.
Table A6.3: Individual characteristics of poor, non-poor and bottom 40 populations, 2015$5.5/day line Relative Welfare Group TotalPoor Not Poor Bottom 40 Top 60
Share of total population (%) 23.2 76.8 40.0 60.0 100.0GenderMale 50.6 49.9 50.3 49.9 50.1Female 49.4 50.1 49.7 50.1 49.9Age0–17 30.1 17.3 28.1 15.0 20.318–24 10.4 9.4 10.1 9.4 9.725–64 52.2 58.4 53.7 59.2 57.065+ 7.3 14.9 8.1 16.5 13.1Marital Status (17+ years old)Not married 31.6 36.6 32.2 37.5 35.5Married 68.4 63.4 67.8 62.6 64.5Education (16–64 years old)No education 4.9 1.6 3.7 1.5 2.3Complete Primary 11.5 5.7 10.0 5.1 6.9Lower Secondary 44.9 23.2 39.6 20.8 27.7
SEIZING A BRIGHTER FUTURE FOR ALL
267ANNExES
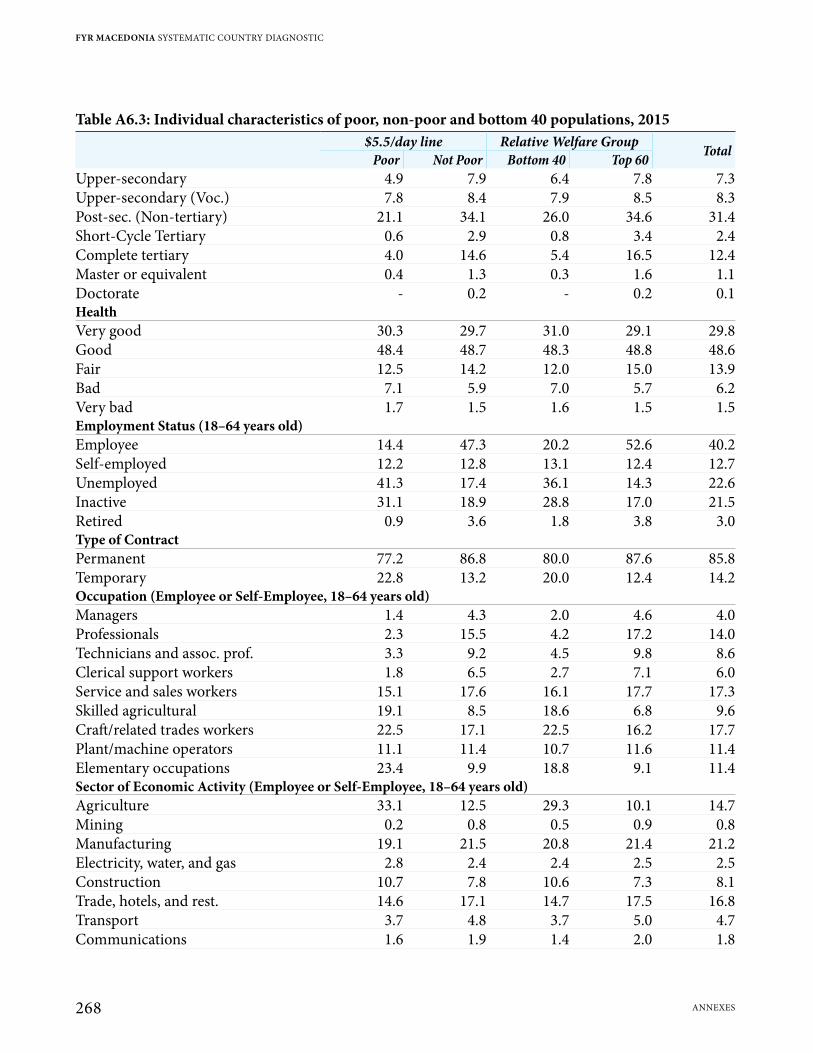
Table A6.3: Individual characteristics of poor, non-poor and bottom 40 populations, 2015$5.5/day line Relative Welfare Group TotalPoor Not Poor Bottom 40 Top 60
Upper-secondary 4.9 7.9 6.4 7.8 7.3Upper-secondary (Voc.) 7.8 8.4 7.9 8.5 8.3Post-sec. (Non-tertiary) 21.1 34.1 26.0 34.6 31.4Short-Cycle Tertiary 0.6 2.9 0.8 3.4 2.4Complete tertiary 4.0 14.6 5.4 16.5 12.4Master or equivalent 0.4 1.3 0.3 1.6 1.1Doctorate - 0.2 - 0.2 0.1HealthVery good 30.3 29.7 31.0 29.1 29.8Good 48.4 48.7 48.3 48.8 48.6Fair 12.5 14.2 12.0 15.0 13.9Bad 7.1 5.9 7.0 5.7 6.2Very bad 1.7 1.5 1.6 1.5 1.5Employment Status (18–64 years old)Employee 14.4 47.3 20.2 52.6 40.2Self-employed 12.2 12.8 13.1 12.4 12.7Unemployed 41.3 17.4 36.1 14.3 22.6Inactive 31.1 18.9 28.8 17.0 21.5Retired 0.9 3.6 1.8 3.8 3.0Type of ContractPermanent 77.2 86.8 80.0 87.6 85.8Temporary 22.8 13.2 20.0 12.4 14.2Occupation (Employee or Self-Employee, 18–64 years old)Managers 1.4 4.3 2.0 4.6 4.0Professionals 2.3 15.5 4.2 17.2 14.0Technicians and assoc. prof. 3.3 9.2 4.5 9.8 8.6Clerical support workers 1.8 6.5 2.7 7.1 6.0Service and sales workers 15.1 17.6 16.1 17.7 17.3Skilled agricultural 19.1 8.5 18.6 6.8 9.6Craft/related trades workers 22.5 17.1 22.5 16.2 17.7Plant/machine operators 11.1 11.4 10.7 11.6 11.4Elementary occupations 23.4 9.9 18.8 9.1 11.4Sector of Economic Activity (Employee or Self-Employee, 18–64 years old)Agriculture 33.1 12.5 29.3 10.1 14.7Mining 0.2 0.8 0.5 0.9 0.8Manufacturing 19.1 21.5 20.8 21.4 21.2Electricity, water, and gas 2.8 2.4 2.4 2.5 2.5Construction 10.7 7.8 10.6 7.3 8.1Trade, hotels, and rest. 14.6 17.1 14.7 17.5 16.8Transport 3.7 4.8 3.7 5.0 4.7Communications 1.6 1.9 1.4 2.0 1.8
FYR MACEDONIA SYSTEMATIC COUNTRY DIAGNOSTIC
268 ANNExES
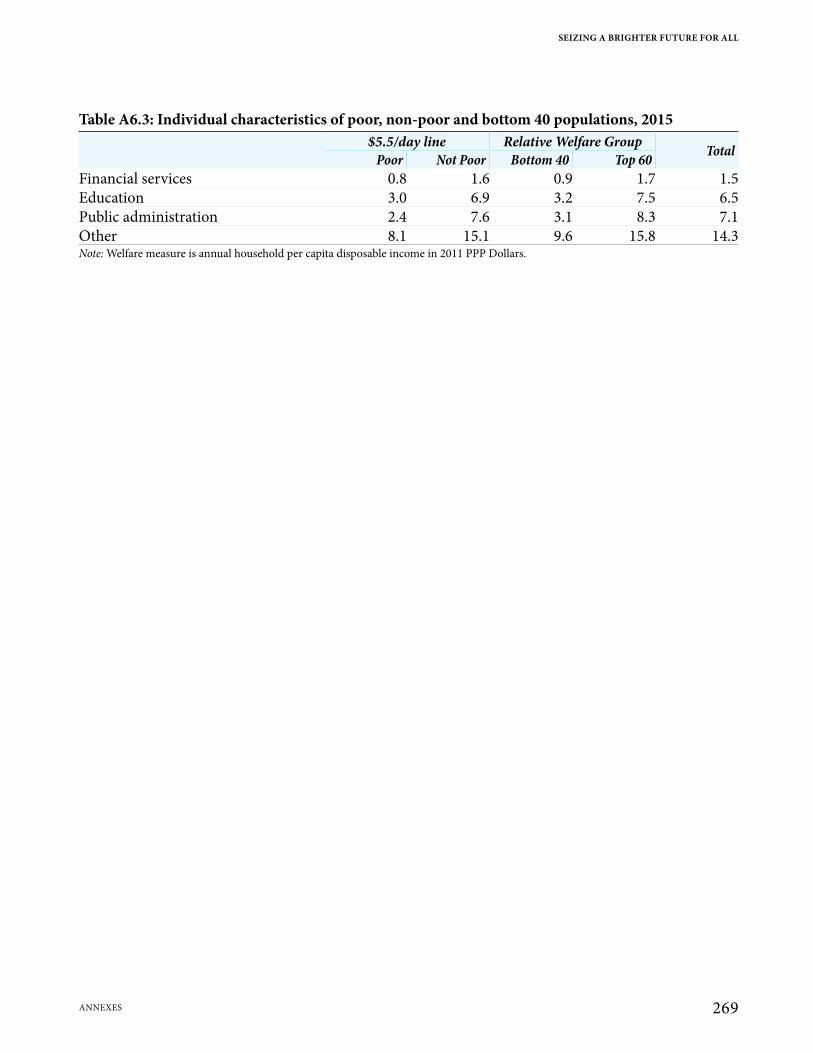
Table A6.3: Individual characteristics of poor, non-poor and bottom 40 populations, 2015$5.5/day line Relative Welfare Group TotalPoor Not Poor Bottom 40 Top 60
Financial services 0.8 1.6 0.9 1.7 1.5Education 3.0 6.9 3.2 7.5 6.5Public administration 2.4 7.6 3.1 8.3 7.1Other 8.1 15.1 9.6 15.8 14.3Note: Welfare measure is annual household per capita disposable income in 2011 PPP Dollars.
SEIZING A BRIGHTER FUTURE FOR ALL
269ANNExES
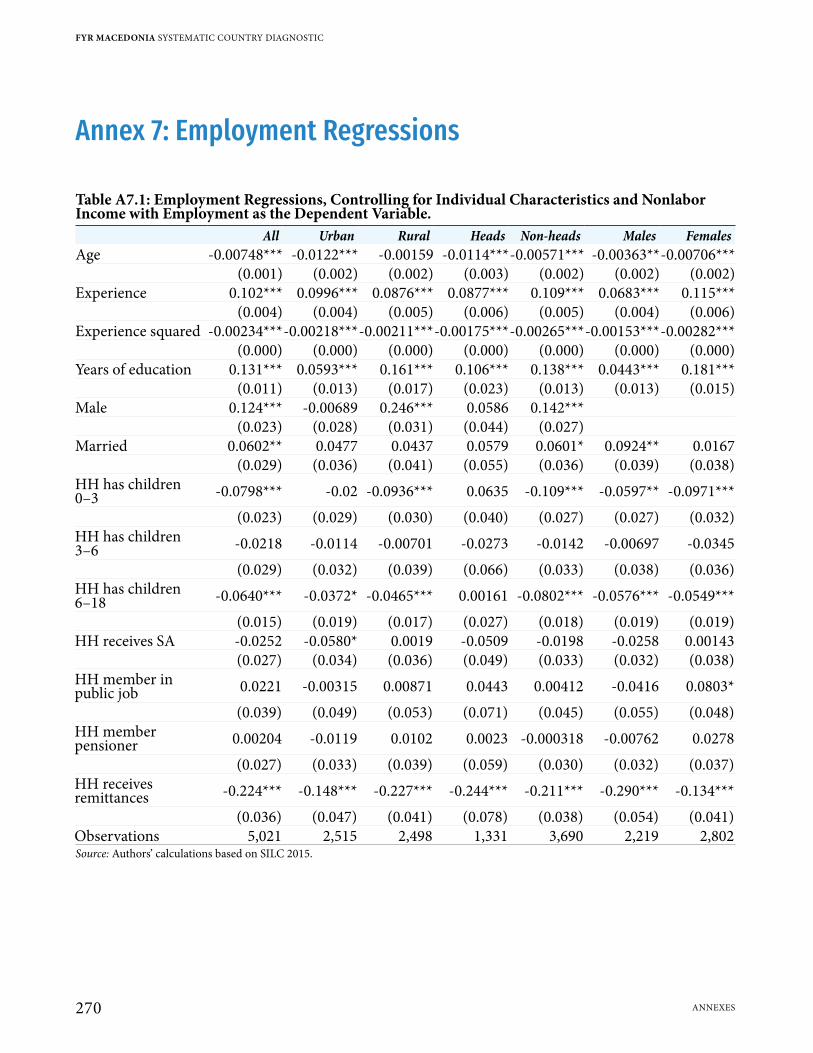
Annex 7: Employment Regressions
Table A7.1: Employment Regressions, Controlling for Individual Characteristics and Nonlabor Income with Employment as the Dependent Variable.
All Urban Rural Heads Non-heads Males FemalesAge -0.00748*** -0.0122*** -0.00159 -0.0114***-0.00571*** -0.00363**-0.00706***
(0.001) (0.002) (0.002) (0.003) (0.002) (0.002) (0.002)Experience 0.102*** 0.0996*** 0.0876*** 0.0877*** 0.109*** 0.0683*** 0.115***
(0.004) (0.004) (0.005) (0.006) (0.005) (0.004) (0.006)Experience squared -0.00234***-0.00218***-0.00211***-0.00175***-0.00265***-0.00153***-0.00282***
(0.000) (0.000) (0.000) (0.000) (0.000) (0.000) (0.000)Years of education 0.131*** 0.0593*** 0.161*** 0.106*** 0.138*** 0.0443*** 0.181***
(0.011) (0.013) (0.017) (0.023) (0.013) (0.013) (0.015)Male 0.124*** -0.00689 0.246*** 0.0586 0.142***
(0.023) (0.028) (0.031) (0.044) (0.027)Married 0.0602** 0.0477 0.0437 0.0579 0.0601* 0.0924** 0.0167
(0.029) (0.036) (0.041) (0.055) (0.036) (0.039) (0.038)HH has children 0–3 -0.0798*** -0.02 -0.0936*** 0.0635 -0.109*** -0.0597** -0.0971***
(0.023) (0.029) (0.030) (0.040) (0.027) (0.027) (0.032)HH has children 3–6 -0.0218 -0.0114 -0.00701 -0.0273 -0.0142 -0.00697 -0.0345
(0.029) (0.032) (0.039) (0.066) (0.033) (0.038) (0.036)HH has children 6–18 -0.0640*** -0.0372* -0.0465*** 0.00161 -0.0802*** -0.0576*** -0.0549***
(0.015) (0.019) (0.017) (0.027) (0.018) (0.019) (0.019)HH receives SA -0.0252 -0.0580* 0.0019 -0.0509 -0.0198 -0.0258 0.00143
(0.027) (0.034) (0.036) (0.049) (0.033) (0.032) (0.038)HH member in public job 0.0221 -0.00315 0.00871 0.0443 0.00412 -0.0416 0.0803*
(0.039) (0.049) (0.053) (0.071) (0.045) (0.055) (0.048)HH member pensioner 0.00204 -0.0119 0.0102 0.0023 -0.000318 -0.00762 0.0278
(0.027) (0.033) (0.039) (0.059) (0.030) (0.032) (0.037)HH receives remittances -0.224*** -0.148*** -0.227*** -0.244*** -0.211*** -0.290*** -0.134***
(0.036) (0.047) (0.041) (0.078) (0.038) (0.054) (0.041)Observations 5,021 2,515 2,498 1,331 3,690 2,219 2,802Source: Authors’ calculations based on SILC 2015.
FYR MACEDONIA SYSTEMATIC COUNTRY DIAGNOSTIC
270 ANNExES
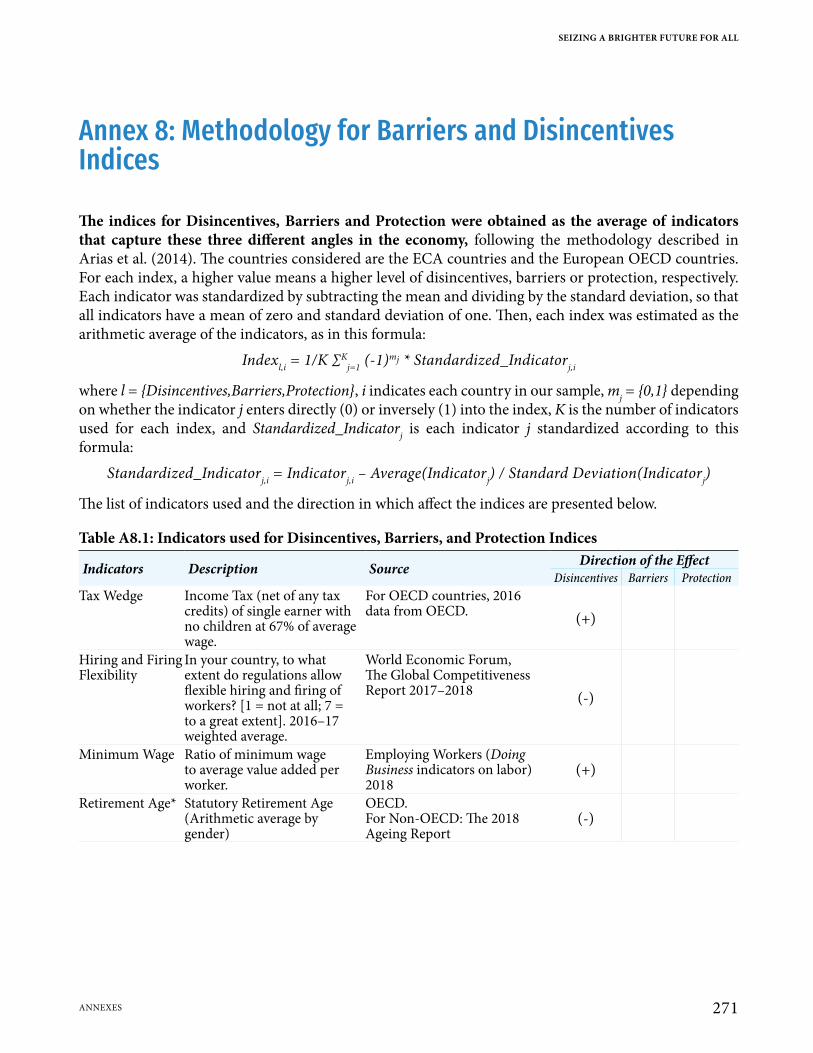
Annex 8: Methodology for Barriers and Disincentives Indices
The indices for Disincentives, Barriers and Protection were obtained as the average of indicators that capture these three different angles in the economy, following the methodology described in Arias et al. (2014). The countries considered are the ECA countries and the European OECD countries. For each index, a higher value means a higher level of disincentives, barriers or protection, respectively. Each indicator was standardized by subtracting the mean and dividing by the standard deviation, so that all indicators have a mean of zero and standard deviation of one. Then, each index was estimated as the arithmetic average of the indicators, as in this formula:
Indexl,i = 1/K ∑Kj=1 (-1)mj * Standardized_Indicatorj,i
where l = {Disincentives,Barriers,Protection}, i indicates each country in our sample, mj = {0,1} depending on whether the indicator j enters directly (0) or inversely (1) into the index, K is the number of indicators used for each index, and Standardized_Indicatorj is each indicator j standardized according to this formula:
Standardized_Indicatorj,i = Indicatorj,i – Average(Indicatorj) / Standard Deviation(Indicatorj)
The list of indicators used and the direction in which affect the indices are presented below.
Table A8.1: Indicators used for Disincentives, Barriers, and Protection Indices
Indicators Description Source Direction of the EffectDisincentives Barriers Protection
Tax Wedge Income Tax (net of any tax credits) of single earner with no children at 67% of average wage.
For OECD countries, 2016 data from OECD. (+)
Hiring and Firing Flexibility
In your country, to what extent do regulations allow flexible hiring and firing of workers? [1 = not at all; 7 = to a great extent]. 2016–17 weighted average.
World Economic Forum, The Global Competitiveness Report 2017–2018 (-)
Minimum Wage Ratio of minimum wage to average value added per worker.
Employing Workers (Doing Business indicators on labor) 2018
(+)
Retirement Age* Statutory Retirement Age (Arithmetic average by gender)
OECD.For Non-OECD: The 2018 Ageing Report
(-)
SEIZING A BRIGHTER FUTURE FOR ALL
271ANNExES
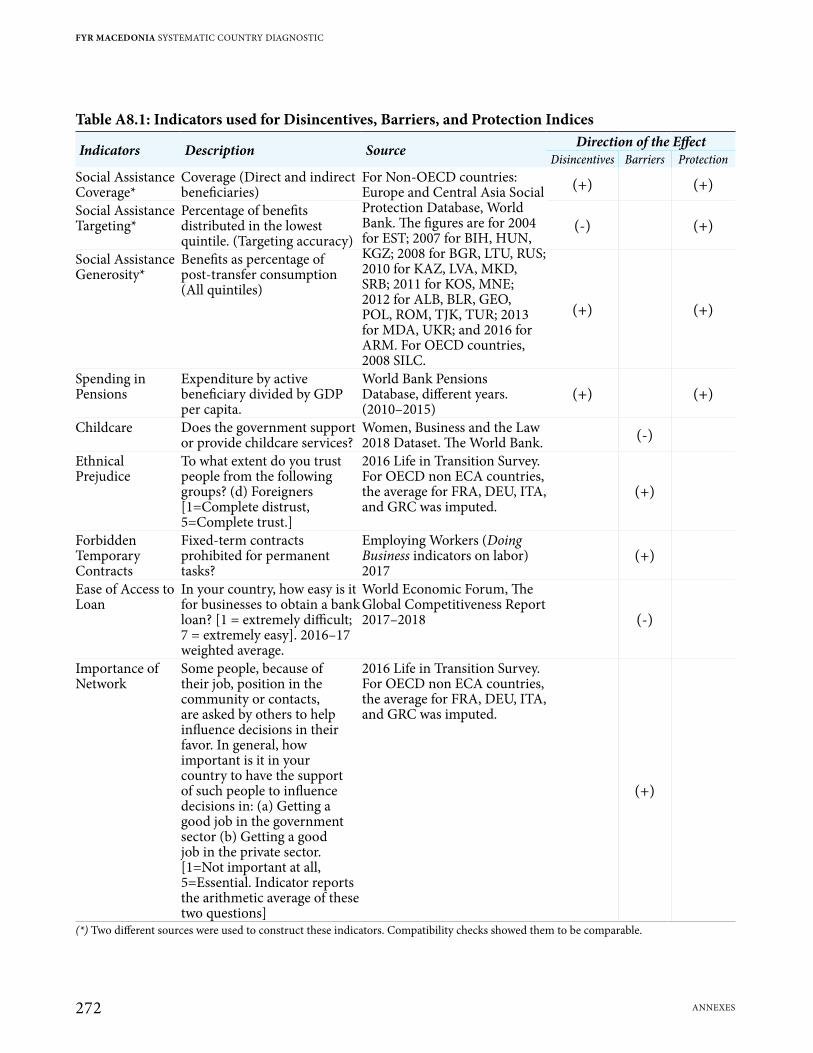
Table A8.1: Indicators used for Disincentives, Barriers, and Protection Indices
Indicators Description Source Direction of the EffectDisincentives Barriers Protection
Social Assistance Coverage*
Coverage (Direct and indirect beneficiaries)
For Non-OECD countries: Europe and Central Asia Social Protection Database, World Bank. The figures are for 2004 for EST; 2007 for BIH, HUN, KGZ; 2008 for BGR, LTU, RUS; 2010 for KAZ, LVA, MKD, SRB; 2011 for KOS, MNE; 2012 for ALB, BLR, GEO, POL, ROM, TJK, TUR; 2013 for MDA, UKR; and 2016 for ARM. For OECD countries, 2008 SILC.
(+) (+)Social Assistance Targeting*
Percentage of benefits distributed in the lowest quintile. (Targeting accuracy)
(-) (+)
Social Assistance Generosity*
Benefits as percentage of post-transfer consumption (All quintiles)
(+) (+)
Spending in Pensions
Expenditure by active beneficiary divided by GDP per capita.
World Bank Pensions Database, different years. (2010–2015)
(+) (+)
Childcare Does the government support or provide childcare services?
Women, Business and the Law 2018 Dataset. The World Bank. (-)
Ethnical Prejudice
To what extent do you trust people from the following groups? (d) Foreigners [1=Complete distrust, 5=Complete trust.]
2016 Life in Transition Survey. For OECD non ECA countries, the average for FRA, DEU, ITA, and GRC was imputed.
(+)
Forbidden Temporary Contracts
Fixed-term contracts prohibited for permanent tasks?
Employing Workers (Doing Business indicators on labor) 2017
(+)
Ease of Access to Loan
In your country, how easy is it for businesses to obtain a bank loan? [1 = extremely difficult; 7 = extremely easy]. 2016–17 weighted average.
World Economic Forum, The Global Competitiveness Report 2017–2018 (-)
Importance of Network
Some people, because of their job, position in the community or contacts, are asked by others to help influence decisions in their favor. In general, how important is it in your country to have the support of such people to influence decisions in: (a) Getting a good job in the government sector (b) Getting a good job in the private sector. [1=Not important at all, 5=Essential. Indicator reports the arithmetic average of these two questions]
2016 Life in Transition Survey. For OECD non ECA countries, the average for FRA, DEU, ITA, and GRC was imputed.
(+)
(*) Two different sources were used to construct these indicators. Compatibility checks showed them to be comparable.
FYR MACEDONIA SYSTEMATIC COUNTRY DIAGNOSTIC
272 ANNExES