Habitat use and foraging ecology of a batoid community in Shark Bay, Western Australia
Upload
khangminh22Category
view
0download
0
Edith Cowan University Edith Cowan University
Research Online Research Online
Theses: Doctorates and Masters Theses
2006
Movement patterns and habitat usage of Shark Bay dugongs Movement patterns and habitat usage of Shark Bay dugongs
David K. Holley Edith Cowan University
Follow this and additional works at: https://ro.ecu.edu.au/theses
Part of the Terrestrial and Aquatic Ecology Commons, and the Zoology Commons
Recommended Citation Recommended Citation Holley, D. K. (2006). Movement patterns and habitat usage of Shark Bay dugongs. https://ro.ecu.edu.au/theses/70
This Thesis is posted at Research Online. https://ro.ecu.edu.au/theses/70

Edith Cowan University
Copyright Warning
You may print or download ONE copy of this document for the purpose
of your own research or study.
The University does not authorize you to copy, communicate or
otherwise make available electronically to any other person any
copyright material contained on this site.
You are reminded of the following:
Copyright owners are entitled to take legal action against persons who infringe their copyright.
A reproduction of material that is protected by copyright may be a
copyright infringement. Where the reproduction of such material is
done without attribution of authorship, with false attribution of
authorship or the authorship is treated in a derogatory manner,
this may be a breach of the author’s moral rights contained in Part
IX of the Copyright Act 1968 (Cth).
Courts have the power to impose a wide range of civil and criminal
sanctions for infringement of copyright, infringement of moral
rights and other offences under the Copyright Act 1968 (Cth).
Higher penalties may apply, and higher damages may be awarded,
for offences and infringements involving the conversion of material
into digital or electronic form.

USE OF THESIS
The Use of Thesis statement is not included in this version of the thesis.

MOVEMENT PATTERNS AND HABITAT USAGE OF SHARK BAY DUGONGS
David K. Holley
Bachelor of Applied Science
This thesis is presented in fulfilment of the requirements for the degree of Master of Science (Environmental Management)
Faculty of Computing, Health and Science Edith Cowan University
June 2006
EDITH COWAN UNIVERSITY

3
ABSTRACT
In order to define small and large scale spatial and temporal individual
movement patterns of dugongs (Dugong dugon) within the Shark Bay World Heritage
Property (SBWHP) a total of 19 dugongs were fitted with remote location recording and
transmitting devices. Combined locations from all units totalled over 10,000 locations.
This spatial and temporal data was used to define movement patterns of dugongs within
Shark Bay as well as areas of high use deemed to be indicative of foraging activity.
Platform Transmitting Terminals (PTT’s) using the ARGOS location collection system
tracked animals over large temporal scales with 4 animals tracked up to periods of 11
months. Using these instruments it was possible accurately define a previously
identified large-scale seasonal movement pattern within the confines of Shark Bay.
These four animals showed distinct seasonal home ranges defined by changes in Sea
Surface Temperature.
Additionally another eleven animals were captured and new remote tracking
technology in the form of Geographical Positioning System (GPS) devices were
attached to define finer scale spatial resolution distribution with a degree of accuracy of
each recorded position of approximately 10m. Using positions gained from the
deployment of GPS units, seagrass habitat at high use locations were sampled as
representative of seasonal dugong distribution. High use sites were compared with
habitat at locations where dugongs were only recorded to be moving through. High use
winter- spring- autumn locations were comprised predominately of habitat consisting of
the seagrass species Amphibolis antarctica with a percentage cover of 30-80% and
above ground biomass of 110-360gm-2 in waters <5m.

4
In addition to defining movement patterns and habitat preferences of individual
dugongs an aerial survey was undertaken during the summer of 2002 to define
population distribution and abundance estimates and to compare with previous winter
surveys. This survey returned a population estimate of 11021+/-1357(s.e.) a result
similar to the first two winter surveys of dugongs in Shark Bay in 1989 and 1994 but
considerably lower than the 1999 survey. Distribution was markedly different in this
survey compared with all previous surveys, which were conducted during winter,
confirming that dugongs within Shark Bay undertake a seasonal migration driven by
changes in sea surface temperature. In addition to this distribution pattern it was
identified that 24% of the population during summer occurred within an area known as
Henri Freycinet Harbour. That is, while dugongs have been reported in this
southwestern region of the bay previously in summer, this is the first time that the
substantial size (2629 +/-780 s.e.) of the summer dugong population has been
quantified.
The abundance estimates and distribution of animals as observed from the aerial
survey have consequences for the continued management of this large and important
dugong population. As shown from the aerial survey differences in the population
estimate between the 1999 survey and this survey may be explained through large scale
movement patterns of dugongs between Shark Bay and Ningaloo Reef and Exmouth
Gulf to the north, patterns that should be considered in the management of dugongs for
the entire region. The seasonal distribution pattern as recorded from instrumented
dugongs as well as the described habitat types also provides the critical spatial and
temporal information on how the dugongs utilise Shark Bay throughout the year. This
information should be considered in future management programs of the dugong and the
Shark Bay marine environment.

5
DECLARATION
I certify that this thesis does not, to the best of my knowledge and belief:
(i) incorporate without acknowledgment any material previously submitted for a
degree or diploma in any institution of higher education.
(ii) contain any material previously published or written by another person except
where due reference is made in the text; or
(iii) contain any defamatory material.
I also grant permission for the Library at Edith Cowan University to make duplicate
copies of my thesis as required.
Signature: …………………………………….
Date: ……………………………..

6
ACKNOWLEDGEMENTS
This thesis is the result of a large amount of assistance from a lot of people both in the
field and elsewhere. First and foremost my supervisors, Dr Nick Gales for the
instigation and development of the project and introduction to a unique animal and Dr
Paul Lavery for the induction into the realms of the seagrass and ongoing support over
the years.
A large component of the study was the involvement of members from the Shark Bay
Yadgalah Aboriginal Corporation. For the elders of this community, in particular Benny
Bellottie, Jim Poland and the organisations board a large thankyou for having faith that
something could be provided for the community out of this project. Thank you to
Dianne Bellottie and Darren Capewell as Yadgalah coordinators for helping with
direction and assistance throughout. And a big thanks to all the big fellas who put their
bodies on the line during the capture process, Brendan Bellottie, Daniel Cock, Kim
Poland, Boy Bellottie and Darren Capewell. A large amount of assistance and
enthusiasm was also given by Craig and Jessie Shankland. Through the use of their
vessels the James Scheerer I and II, much was achieved that couldn’t have been
dreamed of.
Special thanks also to all those who assisted from the West Australian Department of
Conservation and Land Management, too many to mention individually but all the staff
from the Shark Bay District, in particular District Manager Dave Rose for seeing the
benefit to the Department in the District from the project. Also many thanks to Chris
Simpson and all the staff from the Marine Conservation Branch for the assistance and
direction of the project in meeting the Departments’ requirements.
For the use of the PTT tags and for providing the ability to undertake the aerial survey
and data dissemination from this survey, Ivan Lawler from James Cook University was
instrumental in these aspects of the program, for which I’m indebted. Ivan also
contributed to the publication of this chapter in the Journal of Wildlife Research.
Much assistance was also provided by others in all aspects of the field program in
particular Richard Campbell, James Sheppard, Mark Westerberg, NickWood, Bec
Donaldson and Lars Bjeider and his research assistants from Monkey Mia. Lastly a big
thankyou to my wife Sietske .

7
TABLE OF CONTENTS
USE OF THESIS ii ABSTRACT iii ACKNOWLEDGEMENTS vi TABLE OF CONTENTS vii LIST OF FIGURES ix LIST OF TABLES xi CHAPTER 1 THE DUGONG (Dugong dugon) 1
1.1 General Introduction.......................................................................................... 1 1.2 Background ....................................................................................................... 7
1.2.1 Taxonomy and Life History .................................................................... 7 1.2.2 Distribution and Status ............................................................................ 8 1.2.3 Threats ................................................................................................... 10 1.2.4 Dugongs in Shark Bay........................................................................... 11
1.3 Scope ............................................................................................................... 13 CHAPTER 2 DEVELOPMENT AND APPLICATION OF UNIQUE APPROACHES IN DETERMINING INDIVIDUAL DUGONG MOVEMENTS IN SHARK BAY 15
2.1 Remote Recording and Transmitting Devices to Determine Movement Patterns of Dugongs................................................................................................................. 15
2.1.1 Historical Use of Biotelemetry as a Tool for Determining Sirenian Habitat Use and Movement Patterns........................................................................... 15 2.1.2 Aims ...................................................................................................... 18
2. 2 Methods .......................................................................................................... 18 2.2.1 Capture and Handling of Dugongs........................................................ 18 2.2.2 Instrument, Harness and Release Mechanism Descriptions for Units Deployed on Shark Bay Dugongs. ................................................................. 23
2.3 Results and Discussion.................................................................................... 33 2.3.1 Chase, Capture, Handling and Descriptions of Tagged Dugongs. ........ 33 2.3.2 Efficacy of PTT Tags to Describe Dugong Locations and Movement Patterns.. ......................................................................................................... 36 2.3.3 Efficacy of GPS Tags to Describe Dugong Locations and Movement Patterns.. ......................................................................................................... 38 2.3.4 Suitability of Harness Attachment and Release Mechanisms. .............. 40 2.3.5. Suitability of VHF Tracking for locating units and behavioural observations.................................................................................................... 41
2.4 Discussion on Suitability of Remote Recording Devices to Measure Dugong Spatial Usage and Impact of Catch Procedure. ..................................................... 42
2.4.1 Remote Recording Devices. .................................................................. 42 2.4.2 Capture and Handling............................................................................ 43
2.5 Conclusions ..................................................................................................... 44

8
CHAPTER 3 INDIVIDUAL DUGONG MOVEMENT PATTERNS AND HABITAT DESCRIPTIONS WITHIN SHARK BAY 46
3.1 Introduction ..................................................................................................... 46 3.1.1 Known Dugong Movement Patterns and Habitat Usage. ..................... 46 3.1.2 Aims ...................................................................................................... 47
3.2 Determination of Individual Dugong Movements and Habitat Classification.47 3.2.1 Tag Descriptions ................................................................................... 47 3.2.2 Data Representation and Analysis......................................................... 48 3.2.3 Home Range Determination.................................................................. 50 3.2.4 Habitat Determination and Survey Techniques..................................... 51 3.2.5 Statistical Analyses ............................................................................... 52
3.3 Results showing Home Range, Movements and Habitat of Dugongs in Shark Bay......................................................................................................................... 53
3.3.1 Geographical Positioning System (GPS) Tag Deployments................. 53 3.3.2 Platform Transmitting Terminal (PTT) Tag Deployments. .................. 59 3.3.3 Habitat Structure and Composition. ...................................................... 68
3.4 Discussion of Distribution and Habitat Usage. ............................................... 73 CHAPTER 4 POPULATION DISTRIBUTION AND ABUNDANCE OF DUGONGS DURING SUMMER IN SHARK BAY 80
4.1 Historical Dugong Population Estimates and Winter Distribution Patterns. .. 80 4.2 Methods ........................................................................................................... 82
4.2.1 Aerial Surveys ....................................................................................... 82 4.2.2 Sea Surface Temperature Estimates. ..................................................... 84
4.3 Results ............................................................................................................. 85 4.3.1 Distribution and Abundance of Dugongs.............................................. 85
4.4 Discussion. ...................................................................................................... 90 4.4.1 Summer distribution. ............................................................................. 90 4.4.2. Changing Abundance of Dugongs in Shark Bay. ................................ 93
4.5 Conclusions and Management Implications.................................................... 96 CHAPTER 5 CONCLUSIONS AND RECOMMENDATIONS 97
5.1 Scope ............................................................................................................... 98 5.2 Discussion and Recommendations................................................................ 104
5.2.1 Seasonal Movements........................................................................... 104 5.2.2 Defined Critical Habitat Areas ............................................................ 106 5.2.3 Winter Habitat Resources.................................................................... 108 5.2.4 Dugong Distribution Outside of the Shark Bay Marine Park ............. 108 5.2.5 Future Intensive Dugong Research Programs..................................... 109 5.2.6 Indigenous Collaboration and Global Implications ............................ 110
REFERENCES 112 APPENDIX 124
1.1 Metadata statement for combined PTT and GPS acquired positions. ........... 124 1.2 Metadata statement for dugong sightings acquired during aerial survey. ..... 129

9
LIST OF FIGURES
Figure 1.1. Location map of Shark Bay, Western Australia with place names mentioned in the text...........................................................................................................................4 Figure 1.2. Global historic and current distribution of the dugong (Dugong dugon), after Marsh et al. (2002). ...........................................................................................................8 Figure 2.1. Illustration of tag attached to a manatee. (Adapted from Lotek 1999.)........24 Figure 2.2. Location of dugong captures and tag deployments during the study period 2000 – 2002 in the Shark Bay World Heritage Property. ...............................................25 Figure 2.3. PTT tags used in deployments in this study. The tag is 50 cm long, excluding the aerial. ........................................................................................................27 Figure 2.4. Lotek GPS data loggers used in study. The tag is 63 cm long excluding aerials. .............................................................................................................................29 Figure 2.5. Example of harness attachment, with strap inside latex tubing secured around dugong tailstock. .................................................................................................32 Figure 2.6. Respiration rates of a dugong immediately following capture and 6 weeks post capture. ....................................................................................................................36 Figure 2.7. Frequency distribution of location classes from PTT tags deployed on dugongs in Shark Bay during the period 2000 - 2002. ...................................................37 Figure 2.8. Number of retrieved locations from PTT fixes at each of five depth categories, for tags deployed over the period 2000-2001 in Shark Bay. ........................37 Figure 2.9. Number of retrieved locations from GPS fixes at each of five depth categories, for tags deployed over the period 2000-2001 in Shark Bay. ........................39 Figure 2.10. Plot of GPS fixes from a Lotek unit left in static location for 28 hours prior to deployment on dugongs. .............................................................................................39 Figure 3.1. Distribution of all GPS units deployed on dugongs 2000-2002 in Shark Bay overlaid on a bathymetric profile. ...................................................................................54 Figure 3.2. Mean temperature and depth distribution (±s.d) for all GPS tag deployments on dugongs in Shark Bay between 2000-2002................................................................55 Figure 3.3. Fifty Percentile Home Ranges by season and year on all GPS tagged dugongs in Shark Bay during the period 2000 -2002. ....................................................58 Figure 3.4. Distribution of locations as transmitted by all deployed PTT units on dugongs in Shark Bay during the period 2000 – 2002....................................................60

10
Figure 3.5. Distribution of 4 PTT units deployed on dugongs in Shark Bay During 2000-2002 relative to shifts in Sea Surface Temperature. ..............................................61 Figure 3.7. Seasonal Home Ranges of PTT Units 5535 and 5534 Deployed on Dugongs in Shark Bay during 2000. ..............................................................................................63 Figure 3.8. Seasonal Home Ranges of PTT Units 5519 and 5537 Deployed on Dugongs in Shark Bay during 2000. ..............................................................................................64 Figure 3.9. Movement Paths of All Dugongs Tagged with GPS and PTT Tags in Shark Bay during the period 2000-2002. ..................................................................................67 Figure 3.10. Distribution of Seagrass Habitat in Shark Bay as Described from Habitat Mapping. .........................................................................................................................70 Figure 3.11. Distribution of a Sample of Recorded Dugong Locations in 2000, Seagrass Habitat and Aquaculture Leases......................................................................................78 Figure 4.1. Distribution of Observed Dugongs in groups of less than 10 individuals, which are used in the final estimate calculation in the 2002 Summer Survey, overlaid on estimated Sea Surface Temperature. ...............................................................................86 Figure 4.2. Dugong Group Size Distributions in Shark Bay observed in the 2002 summer aerial survey overlaid on Bathymetry. ..............................................................87 Figure 4.4. Comparison of SST at locations of dugongs as observed during a winter (1999) survey and summer (this study) survey. ..............................................................89

11
LIST OF TABLES
Table 2.1. Estimated Accuracy for Calculated Positions Using the Argos System........26 Table 2.2. Details of Tag Deployments in Shark Bay 2000-2002: Biological Descriptions of Tagged Dugongs, Duration of Deployments and Number of Locations Recorded. ........................................................................................................................34 Table 3.1. Distance Travelled and Average Speed and Daily Distance for All GPS Deployed on Dugongs in Shark Bay from 2000 – 2002. ................................................56 Table 3.2. Distance Travelled, Average Speed and Daily Distance for Dugongs in Shark Bay with All PTT Units during the Period 2000 - 2002. ................................................66 Table 3.3. Habitat Composition and Descriptions for all Survey Locations. .................69 Table 3.4. Number of Recorded Fixes for All PTT Units within Seagrass Habitats as Defined by Type and Percentage Cover..........................................................................71 Table 3.5. Number of Recorded Fixes for all PTT Units Within Described Habitat Type..........................................................................................................................................72 Table 4.1. Perception and Availability Correction Factors for all Standardised Surveys Within Shark Bay............................................................................................................84 Table 4.2. Block and Total Estimated Dugong Population for Shark Bay 1989 – 2002.88 Table 4.3. Comparison of Temperatures and Depths at Which Dugongs Were Found Between Winter (1999) and Summer (2002) Surveys. ...................................................90

1
CHAPTER 1
THE DUGONG (Dugong dugon)
1.1 General Introduction
This thesis presents the results of research conducted on the movement patterns
and habitat usage of the dugong (Dugong dugon, Muller 1776) within the Shark Bay
World Heritage Property (SBWHP) on the mid-West Coast of Western Australia
(Figure 1.1). The research was conducted as a collaborative project with the Department
of Conservation and Land Management, the Shark Bay Yadgalah Aboriginal
Corporation and James Cook University, Townsville, Queensland. This thesis combines
a number of projects conducted with these organisations into the one document within a
management framework for the provision of information directly relevant to the
continued conservation of this internationally significant dugong population. New and
established techniques were applied to obtain the data presented in the thesis, which fills
gaps in the existing knowledge base. The research outcomes are presented in a manner
that will provides management agencies with information important for the continued
conservation and management of the Shark Bay dugong population.
The distribution pattern of the dugong (Dugong dugon), a large benthic herbivore
foraging almost exclusively on seagrasses (Heinsohn et al. 1977; Marsh, et al. 1982), is
broadly coincident with the occurrence of its preferred seagrass forage within the
families Potamogetonaceae and Hydrocharitaceae (Husar 1978). The dugong is
distributed within the tropical and sub-tropical latitudes of the Indo-West Pacific, and is
usually confined to those areas within large sheltered embayments and in the lee of
offshore coastal islands (Heinsohn et al. 1979). In Shark Bay (Figure 1.1) exists one of
the largest and healthiest populations of dugongs. The significance of this population is
reflected in its size and status being one of the criteria for the listing of Shark Bay on the
World Heritage Register (CALM 1996).

2
The dugong, along with three species manatee, is a member of the order Sirenia,
an order that evolved concurrently with its favoured species of seagrass in the warmer
waters of the Eocene, 54-38 million years ago (Domning 1982). The present day
distribution of Sirenians in the warmer tropical and subtropical waters around the
equator, reflect not only the distribution of preferred seagrass species, but also
intolerance towards cooler temperate waters. Within those tropical regions seasonal
shifts in water temperature are insignificant. However, in some subtropical locations at
the higher latitudes of the Sirenians global range, water temperature fluctuates on a
seasonal basis, falling below suspected critical thresholds.
Studies of manatees have revealed high thermal conductivities, low metabolic
rates, and limited thermoregulatory abilities (Anderson 1986). Researchers have
reported critical temperatures of between 200C and 230C for manatee species (Galvin
et.al. 1983; Bengston 1981 and Hartman 1979: in Anderson 1986). In Shark Bay it is
suggested that a sea surface temperature of 180C is the lower thermal tolerance level
below which this dugong population will seek out exposure to warmer waters
(Anderson 1986).
The occurrence of dugongs within the higher latitudinal limits of their range, such
as Shark Bay in Western Australia and Moreton Bay in Queensland, results in
substantial movements of these populations in response to seasonal change in water
temperature (Preen 1992; Anderson 1986). A large and distinct seasonal movement
pattern of dugongs each year may place stress upon the population viability of these
animals when combined with the impacts from anthropocentric activities. These stresses
may result from direct changes in ambient water temperature and indirect changes in
habitat type and structure. A seasonal movement pattern may also result in the
distribution of animals to areas where they may be at greater risk of predation or
disturbance from natural or anthropocentric events.
In these higher latitudinal areas an understanding of seasonal movement patterns
and subsequent use of habitat frequented by dugongs is an important requirement at
both an individual and population level. By determining the full extent and timing of

3
seasonal movement patterns and subsequent habitat usage those who have the
responsibility for the conservation of this species and its habitat will be able to make
more informed and justified decisions in relation to dugong conservation and proposed
and existing human activities.
To achieve therefore, an adequate understanding of dugong seasonal movement
patterns and habitat usage requires the use of existing tools and methods as well as
unique and novel approaches for specifically measuring the spatial and temporal
distribution of animals. Dugongs spend their entire life in the marine environment often
in extensive, remote and turbid waters, and this makes it impracticable to use simple
visual observational techniques (Marsh and Rathbun 1990). Whilst observation of
individual animals has been used in Shark Bay (Anderson 1982a, 1982b, 1995), the
application of recording and transmitting devices attached directly to the animal to
remotely measure dugong behaviour has not been used at this location.
The use of remote measuring instruments allows for unimpeded and continuous
gathering of the movements of the individual animal providing greater insight into an
animal’s behaviour and requirements (Fancy et al. 1988). At the population scale, the
use of aerial surveys is regarded as an effective mechanism for obtaining estimates of
population abundance as well as determining centres of population activity (Marsh
1995). Conducted on a regular basis and following standardised procedures, aerial
surveys are also a useful although limiting tool (Marsh and Sinclair 1989) for the
monitoring and management of dugong populations.

4
Figure 1.1. Location map of Shark Bay, Western Australia with place names mentioned in the text.

5
Within Shark Bay, the identification of seasonal movement patterns has to date
been via the use of spatially and temporally limited aerial surveys, observational and
correlative studies (Anderson 1982a, 1986, 1998; Marsh, 1994; Prince, 1981) as well as
anecdotal information from Indigenous community members and from long term
residents. Results from previous workers are used in the current management document
for the area, the Shark Bay Marine Reserves Management Plan 1996-2006 (CALM
1996). However, there are gaps in the knowledge base and further work is required to
gain an appropriate understanding of dugong habitat usage and requirements within
Shark Bay, particularly the extent of seasonal movement and associated habitat usage.
Within the current management plan, a number of research requirements are
outlined as strategies for the continued effective conservation of this dugong population
within Shark Bay.
The strategies, in order of priority, as listed in the current plan (CALM 1996) are
to:
1. Control activities that may adversely impact on dugongs;
2. Encourage further research on dugong distribution, abundance, biology
and behaviour in the reserves;
3. Implement a long term monitoring program for dugongs;
4. Investigate and report on any observed cases of dugong breeding or
calving in the reserves; and
5. Encourage the wise management of important dugong habitats outside
the reserves.

6
In addition, a recent document, ‘A Dugong Status Report and Action Plan for
Countries and Territories’, produced for the United Nations Environment Program
(UNEP) (Marsh et al. 2002) details research initiatives for local regions that can
facilitate global dugong conservation. Within this document those research initiatives
for Shark Bay within a Western Australian context include:
1. Conducting summer surveys of Shark Bay to determine the seasonal
distribution of dugongs.
2. Conducting detailed studies on the extent and range of dugong
movements and habitat use to determine the appropriateness of management measures
in specific locations with priority being given to Shark Bay and locations in the
Kimberley such as Beagle Bay, Roebuck Bay and One Arm Point because of the
likelihood of resident dugong populations.
Combined, a number of the above research priorities, which are aimed at
increasing our understanding of the Shark Bay dugong population and therefore
contributing to maintaining its viability, formed the basis of this study. Inter-seasonal
movement patterns have not been directly recorded for Shark Bay because of the limited
ability to follow individual dugongs. This program utilised remote recording and
transmitting devices to measure the inter-seasonal movement patterns of individual
dugongs. Using a combination of existing satellite technology, commonly used for the
tracking of a wide variety of animal species, and new Geographical Positioning Systems
(GPS) technology, this study provides individual dugong movement patterns at both the
large and fine scale resolution necessary with which to measure dugong seasonal
movements, and assess habitat structure at high density dugong visitation sites. In
addition at the population scale, this study determined the distribution and abundance of
dugongs within Shark Bay during the summer, by undertaking a fully standardised
aerial survey that allowed comparison with existing winter aerial surveys.

7
1.2 Background
1.2.1 Taxonomy and Life History
The dugong, (Dugong dugon, Muller, 1776) family Dugonidae, is the only truly
marine herbivorous mammal (Marsh et al. 1984). The dugong, along with the three
species of manatee (Trichechus manatus, T. senegalensis and T. inugius) which occur in
riverine and eurahyline environments, constitute the order Sirenia, or sea cows (Marsh
and Lefebvre 1994). The order Sirenia also contained one other recent member, the
Steller’s sea cow (Hydrodamalis gigas), which was hunted to extinction within 27 years
of its discovery in the eighteenth century (Stejneger 1887).
Dugongs, and the other members of the order Sirenia, are large marine mammals
with a long life span, low reproductive rate, long maternal investment and distribution
ranges within warm inshore coastal and island waters and estuarine systems (Marsh et
al. 1984, 1995). Because of this life history and distribution pattern the dugong is
predisposed to direct impacts and disturbance from humans and human activity (Marsh
et al. 2002). Mature adult dugongs are between 2.4m and 3m long and weigh between
250- 420kg. The shape of the dugongs’ skull, ventral position of the mouth and the
broad flat muzzle are adapted for seagrass grazing (Bryden et al. 1998). Females bear
their first calf between 10 and 17 years and may live up to 70 years of age. Gestation is
approximately 13 months with calves suckled for at least 18 months (Marsh 1995).
Estimated population simulations indicate that any population of dugongs, given no
human induced mortality and low natural mortality, is unlikely to increase at more than
5% per year (Marsh et al. 1999).
8
1.2.2 Distribution and Status
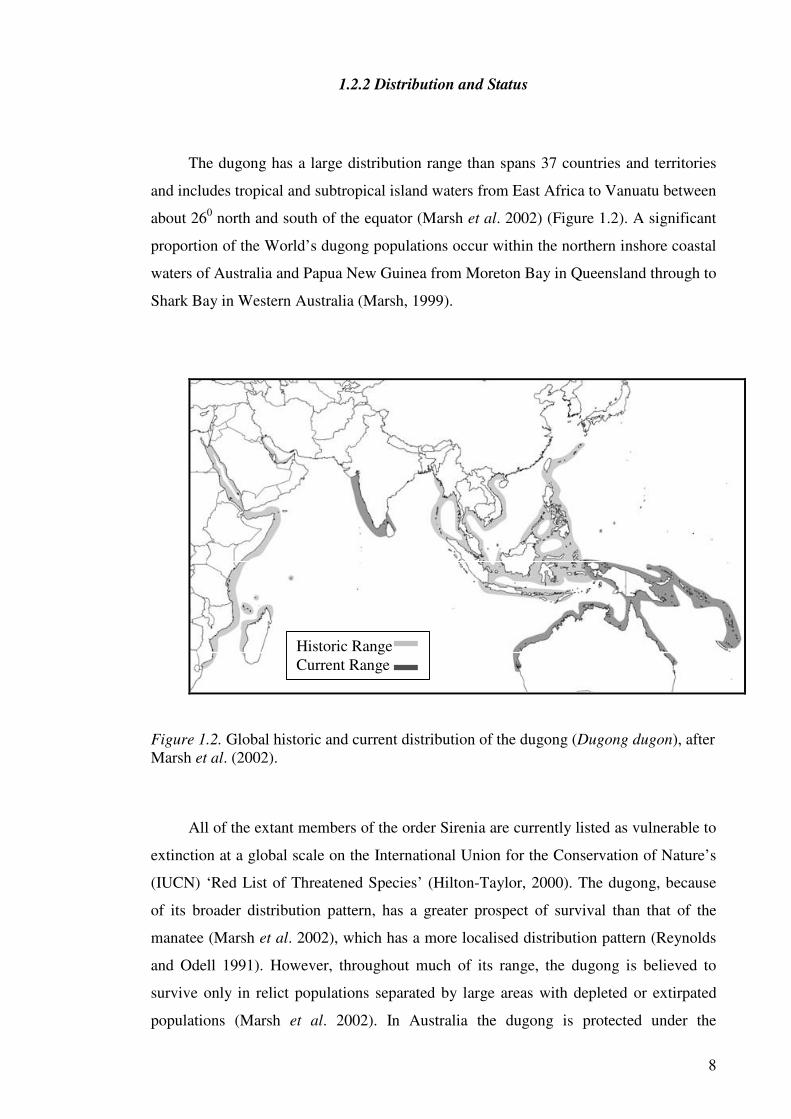
The dugong has a large distribution range than spans 37 countries and territories
and includes tropical and subtropical island waters from East Africa to Vanuatu between
about 260 north and south of the equator (Marsh et al. 2002) (Figure 1.2). A significant
proportion of the World’s dugong populations occur within the northern inshore coastal
waters of Australia and Papua New Guinea from Moreton Bay in Queensland through to
Shark Bay in Western Australia (Marsh, 1999).
Historic Range Current Range
Figure 1.2. Global historic and current distribution of the dugong (Dugong dugon), after Marsh et al. (2002).
All of the extant members of the order Sirenia are currently listed as vulnerable to
extinction at a global scale on the International Union for the Conservation of Nature’s
(IUCN) ‘Red List of Threatened Species’ (Hilton-Taylor, 2000). The dugong, because
of its broader distribution pattern, has a greater prospect of survival than that of the
manatee (Marsh et al. 2002), which has a more localised distribution pattern (Reynolds
and Odell 1991). However, throughout much of its range, the dugong is believed to
survive only in relict populations separated by large areas with depleted or extirpated
populations (Marsh et al. 2002). In Australia the dugong is protected under the

9
Commonwealth Environment Protection and Biodiversity Conservation Act 1999 as a
marine and migratory species. Whilst Australian waters contain possibly the largest
remaining dugong populations in the world, there is strong evidence of significant
population decline in some parts of the dugong’s Australian range (Marsh 2000).
Effective conservation of these populations is a major requirement for the survival of
the species globally.
Throughout its range the dugong selectively forages upon lower seral or ‘pioneer’
species of seagrass such as Halodule uninervis and Halophila ovalis, (Preen 1995).
These species have higher levels of total nitrogen than many perennial species occurring
in these regions and have a greater proportion of nitrogen available for assimilation by
the dugong (Lanyon 1991). Dugongs may also forage upon marine algae (Marsh et al.
1982; Whiting 2001) as well as macro-invertebrates (Anderson 1989; Preen 1995). In
Moreton Bay, which forms the southern distribution limit for dugongs on the east coast
of Australia, the preferred seagrasses for forage, in decreasing order, are: Halophila
ovalis > Halodule uninervis > Halophila spinulosa > Syringodium isoetifolium >
Cymodocea serrulata (Preen 1995).
Dugongs are generally located in wide shallow protected bays, in mangrove
channels and in the lee of large inshore islands (Heinshohn et al. 1979), areas broadly
coincident with sizeable seagrass beds. Dugongs may also be located in deeper offshore
waters where the continental shelf is wide, shallow and protected (Marsh 1999).
Dugong movement patterns are generally restricted to the vicinity of seagrass beds
(Marsh 1999), though they are capable of large movements within both tropical (De
Iongh et al. 1998; Preen 1995a) and sub-tropical locations (Marsh and Rathbun 1990;
Preen 1992). The impact of catastrophic events such as cyclones may result in dugongs
undertaking large movements on a population level (Preen and Marsh 1995; Gales et al.
2004) in order to find suitable forage resources. Seasonal movement patterns of
dugongs in Moreton Bay results in many dugongs undertaking regular movements of
between 15 km and 40 km (Preen 1992).

10
1.2.3 Threats
Because of the proximity of dugongs and manatees to anthropocentric centres of
activity, they are particularly sensitive to disturbance (Marsh et al. 1999).
Anthropogenic threats to dugongs and manatees can be divided into direct and indirect
impacts. Direct impacts include; traditional and non-traditional hunting, boat strikes and
entanglement as a result of commercial fishing practices. Indirect impacts include
agricultural practices such as land clearing and the application of fertilisers with
subsequent run-off impacting upon seagrass beds (Marsh et al. 1999). Other indirect
impacts include disturbance and alteration of habitat from mining, dredging and
trawling activities and displacement of animals from activities such as aquaculture,
tourism and the generation of chemical and acoustic pollution (Marsh et al. 2002).
Although Australia is regarded as the last stronghold for the dugong within its
global range (Marsh et al. 1999), there have been significant declines in dugong
population because of threatening activities. Within the Southern Great Barrier Reef
region, results from dedicated aerial surveys conducted over a number of years suggest
that there has been a 50% decline in dugong numbers between 1987 and 1994 (Marsh
1996). The decline in this population is widely accepted as being substantially the result
of the capture and drowning of dugongs in mesh-nets (Great Barrier Reef Ministerial
Council 1996).
Taking of dugong by indigenous peoples can lead, in some regions, to over
harvesting, and this is thought to have resulted in some localised population declines.
The hunting of dugong is culturally significant to many Aboriginal and Torres Strait
Islander communities in Northern Australia (Marsh et al. 2002). Given that population
simulations using the most optimistic combinations of life history parameters (e.g. low
natural mortality and no human induced mortality) suggest a dugong population is
unlikely to increase at more than 5% per year (Marsh 1984), a sustainable harvest is
likely to be in the order of 2% of the female population per year (Marsh et al. 1999).

11
1.2.4 Dugongs in Shark Bay
Shark Bay contains the western most point of the Australian coast (Figure 1.1)
and lies between latitudes 240 35’S and 270 00’S. It is a large (13,000km2) shallow
(mainly <15 m) basin with restricted oceanic exchange and high rates of evaporation
(Logan et al. 1970). The Bay is located near the northern limit of a latitudinal transition
region between temperate and tropical marine flora and fauna (CALM 1996). Seagrass
meadows cover more than 4,000km2 of the bay and are reported to be the largest in the
world (Walker 1989). Of the 12 species of seagrass found in the bay, several are of
essentially southern distribution, at the northern limit of their range, and several are of
tropical affinity (Walker et al. 1988). The tidal regime within the Bay varies within the
different embayments, on average though the spring range is 1.70m while the neap
range at Carnarvon is 0.61m (CALM 1996).
Dugongs within the bay are at the southern limit of their range on the Western
Australian coastline and approximate the southward limit of large dugong
concentrations on the eastern Australian coast, at Moreton Bay (Anderson 1982a).
Aerial surveys conducted since 1977 (Prince et al. 1981; Anderson 1982a, 1986; Marsh
et al. 1994; Preen et al. 1997; Gales et al. 2004) have shown that Shark Bay is a
location with a significant dugong population. It has been suggested that Shark Bay has
supported a stable population of approximately 10 000 individuals over the last decade
(Preen et al. 1997). Indications are that this population continues to remain stable with
the latest estimates between 11 -14 000 individuals (Gales et al. 2004). It is the most
important known dugong area in the Indian Ocean (Preen 1998).
Movements of individual dugongs within Shark Bay have previously been
determined from boat and shore based observations. Photographs and sketches taken of
distinguishing scars and features of individual animals resulted in the resighting of 15
dugongs at least twice. Distances between sightings were up to 19 km. This method is
of limited value for understanding individual dugong movements, as the behaviour of
the animals restricts the effectiveness of both behavioural observation and attempts to
record scars and other distinguishing marks (Anderson 1982a).

12
Population movement patterns of dugongs in Shark Bay have been determined
from aerial surveys. Early surveys covered areas thought to be of significance to
dugongs at different times of the year (Prince et al. 1981; Anderson 1982a, 1986, 1994).
Later surveys conducted during winter periods were standardised to account for missed
observations and dugongs unrecorded due to water clarity and depth (Marsh et al. 1994;
Preen et al. 1997; Gales et al. 2003). These aerial observations showed that dugongs
concentrate near the eastern shore of Shark Bay in summer and near the western shore
in winter. Analysis of satellite imagery shows a close correspondence between this
movement pattern and sea surface temperature (Anderson 1986). Movements of
dugongs within Moreton Bay, Queensland, at similar latitude to Shark Bay, are also
linked to changes in water temperature (Preen 1992).
Detailed knowledge of dugong habitat usage within Shark Bay is limited.
Anderson (1986) suggested that within Shark Bay dugongs abandon preferred feeding
areas due to the seasonal movement pattern identified, with habitat differing markedly
between seasons. During summer, dugongs prefer to forage on tropical species of
seagrass such as Halodule spp. Within a small cove in the eastern gulf of Shark Bay the
loss of Halodule biomass due to dugong activity during January to April was estimated
to exceed 50% of production (Masini et al. 2001). Halodule has also been identified,
albeit in inadequate amounts, as the only seagrass present in another cove where the
only recorded observations of dugong Lek mating activity has been observed (Anderson
1997, 2002).
During winter periods, it appears that Shark Bay dugongs are restricted to areas
dominated by the temperate seagrass species, Amphibolis antarctica and possibly
Halophila spinulosa for foraging (Anderson 1986, 1994). Nowhere else in the dugong’s
range does the overlap with A. antarctica occur. Unlike most other seagrass, species of
Amphibolis have perennial, woody stems. As a consequence, dugongs forage on A.
antarctica by stripping leaf clusters from the canopy of the plant (Anderson 1986), as
opposed to sifting through sediment and consuming both rhizomes and above ground
plant material of their, presumed, favoured species.

13
Anderson (1986) concluded that the nutritional quality of A. antarctica was
markedly lower to that of preferred tropical species and that sea surface temperatures
during the winter periods were at the lower end of the dugong’s physiological limits.
Boat based observations of dugong behaviour at deeper water locations within the
winter distribution indicated that animals were undertaking long, deep dives that were
potentially energetically costly for the dugongs. Benthic surveys indicated the presence
of Halophila spinulosa, a species with a higher carbohydrate content of the rhizomes,
sufficient for dugongs to undertake this diving behaviour and, therefore, of greater
nutritional value than A. antarctica (Anderson 1994). As a result of the occurrence of
the nutritionally limited A. antarctica and scattered presence in deeper waters of
Halophila spinulosa, Anderson (1986) suggested that dugongs within their winter
distribution pattern in Shark Bay may be energetically stressed, and that by moving
back into the summer feeding grounds they optimise both diet and temperature.
1.3 Scope
This thesis will attempt to define the extent and scope of the seasonal distribution
pattern of Shark Bay dugongs by measuring movements both the individual and
population scale. In addition variables such as depth, temperature and seagrass
distribution and composition will be analysed in relation to any identified movement
pattern and at high density visitation locations frequented by dugongs. In determining
the seasonal movement patterns and habitat usage of dugongs within the Shark Bay
World Heritage Property this thesis will be set out as follows;
1. Develop methods and techniques associated with the attachment,
application and release of remote transmitting platforms to allow finer scale resolution
of dugong distribution (Chapter2).
2. Apply these methods in the field as well as develop and refine techniques
for the appropriate ethical approach to the chase, capture and handling of dugongs
within the waters of Shark Bay (Chapter 2).

14
3. By use of developed remote recording techniques, define large scale
seasonal movement pathways and fine scale critical habitat areas for individual dugongs
within the Shark Bay World Heritage Property (Chapter 3).
4. Through the use of ground truthing techniques characterise the benthic
habitat at those locations deemed to be of significance as established through remote
recording devices (Chapter 3).
5. Using established aerial survey techniques determine the summer
distribution pattern and abundance estimates for the entire Shark Bay population and
compare this with previous winter survey distribution patterns (Chapter 4).
6. Undertake this research within a framework for management purposes,
and establish relationships and foster ownership of results with traditional Indigenous
owners of Shark Bay (Chapter 5).

15
CHAPTER 2
DEVELOPMENT AND APPLICATION OF UNIQUE APPROACHES
IN DETERMINING INDIVIDUAL DUGONG MOVEMENTS IN
SHARK BAY
2.1 Remote Recording and Transmitting Devices to Determine Movement Patterns
of Dugongs.
In order to appropriately measure dugong movement patterns and to have greater
confidence in categorising their habitat requirements, suitable techniques are needed to
adequately measure these variables over significant temporal and spatial scales without
any major disturbance to the animals’ natural behaviour. A key aim of this study was to
therefore develop and test appropriate technologies as well as utilising the most
appropriate and ethical animal handling procedures to achieve these overarching
objectives. Previous methods to define dugong behaviour involved simple observational
techniques (Anderson 1982b, 1995) to define dugong movements and coarse scale
habitat surveys to categorise habitat (Anderson 1986, 1989). These techniques are
however inappropriate over the scale required to confidently manage this population
and its habitat requirements. This project therefore sets out to track dugongs and
measure the various environmental variables which define choices they make on as fine
a scale as possible using the latest in biotelemetry technologies.
2.1.1 Historical Use of Biotelemetry as a Tool for Determining Sirenian Habitat Use
and Movement Patterns.
Biological telemetry or ‘biotelemetry’ is a powerful technique that allows the
continuous and simultaneous monitoring of animals in their natural environment in both
space and time (Cote et al. 1998). The use of biotelemetry to understand animal
behaviour and ecology has been used in a wide range of wildlife studies (Fancy et al.
1988). The most effective and popular means for the remote tracking of marine species

16
has been through the use of radio transmitters and Platform Transmitting Terminals
(PTT’s) attached directly to the animal (Fedak et al. 1983). These platforms (also
referred to as units or ‘tags’) transmit radio signals that are received by a series of CLS
Argos polar orbiting satellites. Using the principle of doppler shift, processing centres
on the ground calculate the position of the received transmitter signal which is then
made available to the user often with a delay of less than one hour. Whilst the calculated
positions can often be several kilometres in error, a strong and constant signal will allow
for a reasonably accurate location of within a few hundred metres (Service Argos, Inc.
1996) guaranteeing they are sufficiently reliable and regular to define medium to large-
scale movement patterns.
The application of biotelemetry and specifically PTTs as a tool for the
understanding the behaviour and ecology of Sirenians was first employed in 1985 on the
West Indian manatee (Trichechus manatus). As part of the United States Geological
Service (USGS) Sirenia Project, a ten year radio tracking project was embarked upon
(Deutsch et al. 1998) to characterise the movements, migratory behaviour, site fidelity
and habitat use of manatees in order to provide information for the development of
effective management strategies (Reid et al. 2001). The application of PTT’s on
Sirenians required a different approach to that used on other marine mammals such as
Pinnipeds (Seals, and Sea lions), which have fur allowing instruments to be glued
directly to the animal. As Sirenians don’t have this coat of fur, researchers developed a
system incorporating a floating tag attached by a flexible tether to a padded belt around
the base of the tail of the animal (Deutsch et al. 1998). This system is more practical
than direct attachment, as it means the tag can be at the surface for long periods except
when the animal is moving at speed or diving to depths greater than that of the tether
(Marsh and Rathbun 1990).
The use of biotelemetry to further understand movement patterns and habitat
usage of dugongs was first undertaken when six dugongs were caught and satellite and
VHF radio transmitters attached for between 1 and 16 months off the North Queensland
coast (Marsh and Rathbun 1990). Based upon the design employed for the tracking of
manatees (Figure 2.1), the same floating tag and harness system was used on the

17
dugongs, with the results from that project demonstrating that a floating transmitter was
ideally suited for this species (Marsh and Rathbun 1990).
Even with the associated error inherent in PTT tracking studies they have been
used on a number of occasions to determine movement patterns and habitat usage of
both manatees and dugongs (Reid et al. 2001, Deutsch et al. 1998, Marsh and Rathbun
1990, De Iongh et al. 1998). With the advent of Geographical Positioning System
(GPS) technology, in which a receiver calculates an estimated position from
transmissions from multiple satellites in predictable orbit patterns and the removal of
‘selective availability’ that was applied by the US Government for defence purposes,
calculated positions now have sub-10 m accuracy.
In order for a GPS unit to successfully record a location the tags need longer
periods at the water surface than PTT’s to be successful in position acquisition. Access
to these calculated positions usually requires the retrieval of the archival tag, although
developments to enable the transmission of these data via the Argos and other systems
have been achieved. The trade-off for the improved precision of the calculated position
are the greater uninterrupted, at-surface time required to acquire a location estimate,
greater power consumption, and the need to retrieve the tag to access the data. These
limitations have so far restricted the use of GPS technology with marine mammals.
The first application of GPS for Sirenian tracking was with the application of a
GPS unit incorporated into a housing unit similar to that used for PTT studies, on a
number of West Indian Manatees in Florida, USA. The results from this study were the
recording of frequent locations allowing detailed insight into the movements of these
animals (Reid et al. 1999). The use of GPS offers the possibility of higher resolution
spatial data, allowing analyses of habitat use and better determination of travel paths by
tagged animals (Reid et al. 2001).

18
2.1.2 Aims
The purpose of this chapter is to outline methods and results for four specific
developmental aims, these being;
1) The refinement of appropriate dugong capture and handling techniques,
developed and used in Queensland (Lanyon et al. 2002), for conditions in Shark Bay.
2) The development of a suitable tag attachment and retrieval mechanism for GPS
data loggers.
3) Determine the effectiveness of GPS archival data loggers in measuring and
describing dugong behaviour and habitat requirements and
4) the use of PTT units to define large scale long term movement patterns
2. 2 Methods
In order to achieve the aims as set out above a series of development field trials
were conducted in the Shark Bay World Heritage Area. Initial trials in September 1999
focussed on developing a reliable capture technique that had minimal stress on the
target animals and on trialling attachment and release mechanisms. Following on from
field trials, the study began with deployments of PTT units in March 2000 with GPS
units deployed to acquire data from August 2000.
2.2.1 Capture and Handling of Dugongs
Dugongs were captured in Shark Bay for the purpose of tag application using a
‘chase and grab technique’, modified from a ‘rodeo’ system (Limpus and Walter 1980)
developed for the capture of marine turtles. This technique has been developed as an
alternative to the use of a hoop-net captures (Preen 1992), and has been successfully
applied to dugong captures in shallow water in Queensland over the past few years

19
(Lanyon 2002). The risk of dugong mortality from capture is regarded as low, with less
than 1% mortality from more than two hundred captures (Marsh et al. 2002). Of the
recorded mortalities both occurred during the use of hoop net captures in Moreton Bay
in the spring, a period when dugongs in that location have poor body condition.
Additionally both dugongs suffocated due to the capture attempt being made before the
animals surface to breathe (Marsh et al. 2002). With the low occurrence of mortality
events the potential is always present and, therefore, the information gained from each
capture should be maximised.
The capture team within Shark Bay was comprised of members from the local
Shark Bay Yadgalah Aboriginal Corporation, CALM employees and volunteers from
Edith Cowan and James Cook University. Dugong capture sites (Figure 2.2) were
selected from areas of known seasonal dugong aggregation determined by aerial surveys
(Marsh et al. 1994; Preen et al. 1997; Gales et al. 2004) as well as from detailed local
knowledge. The capture technique required candidate dugongs to be in water depths of
less than about 1.8m at the point of restraint. As dugongs move up onto shallow
seagrass beds to feed, the edges of these banks were visually surveyed from two small
boats travelling approximately 100m apart.
When dugongs move into shallow waters, they commonly do so in groups and
cow-calf pairs are often included in such feeding herds. The capture technique requires
an intense period of pursuit and herding during which an acute level of disturbance is
caused to the target animal and any dugongs in the immediate vicinity. In areas of high
dugong density, boat-dugong collisions are a real risk. As a result, the following capture
selection protocol was developed:

20
Candidate Selection
• Dugongs in or close to, water of 1-1.8 m were selected. In order to enable the
catchers to maintain an adequate hold on an animal they must be able to stand. The
catch sequence was not initiated until the animal had moved at least 50m from water
>1.8m.
• Only dugongs estimated to be longer than 2.2 m were selected. These animals
were assumed to be of sufficient age to be nutritionally and socially independent (Marsh
1984).
• Where possible dugongs more than 100 m from other dugongs were selected.
• When capturing dugongs from a herd only those animals on the edge were
selected. The pursuit and herding procedure attempted to direct the dugong away from
the group.
A maximum of two capture attempts from any one herd (group within about 100m
of each other) was made to avoid creating too much disturbance to the herd.
• Captures were not made from groups containing cow-calf pairs.
Chase
Once a suitable dugong was located the dugong was approached at less than wake
speed (approximately 5 km/hr) from between it and the nearest deep water. The
approach was maintained until the dugong was startled and swam rapidly away from the
capture boat. Three dugong catchers were positioned on the bow of the catch boat and
maintained visual contact with the dugong, pointing towards it to direct the boat driver
who would attempt to position the boat into the capture position, immediately behind
and just to one side of dugong. If the dugong headed for deep water, as was often the
case, the catch boat would attempt to move to the side and just ahead of the dugong and
herd it back towards shallow water. If necessary, the second small boat would assist
with the herding operation and might temporarily take over the primary chase position

21
(just behind the dugong) if the dugong turned suddenly and temporarily evaded the
chase boat.
The initial chase speed was likely to be the maximum swimming speed of the
dugong in shallow waters (approximately 20-30 km/hr). Great care was needed to co-
ordinate the close manoeuvres of the two boats around the dugong. High speed chases
were aborted if a capture had not been effected within 3 minutes, or the dugong had
taken more than 3 breaths. Chases in excess of either of these limiting parameters only
occurred if the dugong slowed down to rest, taking several breaths, at a time when the
capture boat had not been able to maintain the catch position. Dugongs are not capable
of sustained high-speed swimming and rapidly become exhausted during this type of
pursuit. The potential for chase induced myopathy (mortality as a result of high stress
brought on by capture) is unknown.
Capture
During a chase the pursued dugong would slow and come to the surface to
breathe. The breath cycle takes at least 2 seconds, during which the animal first presents
it head at the surface, inhales and then raises its back and tail peduncle to the surface
prior to diving. If the catch boat is in position during a surfacing, the dugong is allowed
to take a full breath, and, when the back and tail peduncle are presented, the nominated
catcher leaps from the boat onto the dugong and wraps his arms rapidly and firmly
around the peduncle. It is essential to establish this firm grip prior to the animal being
able to establish a powerful tail beat, as this is likely to dislodge and potentially injure
the catcher.
Once the grip is established, the catcher then stands up with the dugong’s fluke
held down against his body. Two other catchers immediately follow the primary catcher
into the water and attempt to grip one each of the dugong’s pectoral fins. While
establishing the restraint, the capture boat manoeuvres alongside and an addition person
enters the water from the second boat with a 120 cm long x 12 cm diameter foam

22
flotation device (‘noodle’) with 1.2m of rope attached to each end. This is placed under
the dugong, immediately behind the pectoral fins with the ropes being secured to an
inflatable pontoon of the capture boat. The noodle acts as a cradle preventing the animal
from rolling and ensures that the animal is able to lift its head out of the water to
breathe. The primary catcher continues to hold the dugong by the tail fluke. If during
any stage of the restraint and stabilisation procedure the dugong was not able to acquire
a breath for a period in excess of 30 s, the animal was released immediately.
Once secured alongside the boat the following procedures are undertaken:
• Measurements of standard length (straight lie from tip of face to mid-fluke) and
of axillary girth
• Dorsal skin biopsy taken with a 5mm biopsy punch*
• Application of temporary paint mark
• Determination of sex from inspection of anal-genital openings
• Collection of a facial vibrissae for stable isotope analysis*
• Application of the remote recording /transmitting tag (see below).
*Samples were taken for use in independent studies of DNA and diet analysis.
To assess the suitability of the catch process, tag functionality, harness attachment
and release mechanism as well as to familiarise the catch team with the restraint and
handling of the dugong, a pilot study was conducted in September 1999. During a five
day period a total of eight dugongs were caught from 18 attempts. This study was useful
in highlighting the importance of allowing animals to move into shallow waters before
capture as restricting capture attempts to when the sea state was below Beaufort 3.
In addition to this capture method there were periods when water depth restricted
the ability of the dugong catchers to maintain an adequate hold of the animal. In these

23
situations the main catcher would attach a padded Velcro� belt, which was secured
back to the boat, around the tailstock of the animal as they entered the water and
grabbed the animal. As deep water usually prohibits the catchers maintaining an
adequate hold of the animal while the noodle is put in place and secured to the boat, this
line served as suitable restraint while the animal was further secured. Once the animal
was completely secured alongside the boat this line was removed.
2.2.2 Instrument, Harness and Release Mechanism Descriptions for Units Deployed
on Shark Bay Dugongs.
For this project, spatial data were obtained from 18 remote tracking tags deployed
on dugongs over a two-year period at a number of locations within the Shark Bay World
Heritage Property (Figure 2.2). Of these 18 tags, eight were PTT satellite tags, eight
were GPS data logger tags, and two were combination PTT/GPS tags capable of both
transmitting and logging. All units incorporated a VHF radio transmitter on its own
frequency to enable each unit to be tracked at sea. In order to optimise unit recovery a
novel remote release was incorporated into the harness design for the GPS and
PTT/GPS tags. Full descriptions of each type of tag and harness designs are outlined
below.
Due to the nature of the attachment method - a floating tag connected to a 3m
tether attached around the tail stock of the dugong - there is an anticipated bias in the
depth distribution of recorded fixes. It is envisaged that if the animal is in water of more
than 3m depths and regularly diving to feed, the number of recorded positions from the
tags will be fewer as the tag is dragged below the water surface and unable to transmit
or record a signal. This reduction in numbers of fixes is likely to be greater for GPS
tags due to the longer time required fixing a position.

24
Figure 2.1. Illustration of tag attached to a manatee. (Adapted from Lotek 1999.)

25
Figure 2.2. Location of dugong captures and tag deployments during the study period 2000 – 2002 in the Shark Bay World Heritage Property.

26
PTT Tags
Each PTT tag consisted of transmitter terminals, Lithium batteries, and a magnetic
switch manufactured by Telonics Corporation, Mesa, Arizona, housed inside a PVC
pipe with a PVC nose cone and whip aerial. Each unit weighed approximately 2.4 kg
with a length of 50 cm, excluding the aerial and was scheduled to transmit to the Argos
system of satellites on a programmed duty cycle 16 hours every second day. It was
estimated that on this duty cycle battery life would be approximately 8 months. These
tags (Figure 2.3) were refurbished units that had been deployed previously on dugongs
in Queensland over a number of years (Marsh and Rathbun 1990; Preen 1992). For a
full description of the PTT tags see Marsh and Rathbun (1990).
Location data from the PTT tags were transmitted to a base station and included
universal date and time, latitude and longitude, number of satellites used for the
calculation of each position, and a number of sensor readings including temperature.
Each transmission also gave a location class for each position (Table 2.1).
Table 2.1 Estimated Accuracy for Calculated Positions Using the Argos System.
Service
Class
Estimated Accuracy in Latitude and
Longitude
Standard Location: calculated from at least four messages received during the satellite pass
3 2 1 0
< 150 m 150 m - 350 m 350 m - 1000 m > 1000 m

27
Figure 2.3. PTT tags used in deployments in this study. The tag is 50 cm long, excluding the aerial.
GPS Tags
The GPS data loggers used in this study were MGS-3 GPS tags manufactured by
Lotek Engineering Inc., Ontario, Canada (Lotek 1999). Each unit consisted of a GPS
engine and VHF transmitter sealed in aluminium housing, sleeved in a polycarbonate
tube with a delrin antenna cap and nosecone (Figure 2.4). The diameter of each unit was
9 cm with a length excluding aerials of 63 cm. The top 23 cm of the unit, from the
aluminium housing to the antenna cap, contained only cabling and airspace, thus
providing for increased buoyancy. Each unit weighed 2.7 kg with most of that weight
distributed towards the nosecone, which contained a 15 V lithium battery pack to power
the unit and a 9 V battery to provide the charge for the remote release. This distribution
in weight promoted the antenna cap, with diametrically opposed beacon and release
antennas, to sit higher in the water, increasing the chances of satellite uplinks. A piece

28
of compressed foam was secured around the top of the unit at the base of the aerials and
this further aided in keeping the antennas above water.
For position acquisition each unit used an 8-channel receiver, which could lock on
up to eight satellites simultaneously. Using Lotek’s GPS 2000 Host software the
MGS_3 GPS tag was pre-programmed to fix a position at intervals ranging from 5 min
to 6 hours and scheduled to occur at a predetermined time and date. Up to 10 different
GPS fix intervals could be entered in a given day. Interval rate selection affected the
time frame within which a unit could obtain a fix. It is estimated that a unit with a
current almanac and with a fix rate lower than once per hour will take approximately 40
seconds to get its first fix (Lotek 1999). When that interval is less frequent, then the unit
loses its reference satellites and the time to obtain its next fix is increased by about 15
seconds as the unit searches for new satellites. Higher fix rates result in higher power
consumption and, therefore, reduced deployment time; lower fix rates result in longer
times for the unit to acquire its first fix but extended deployment time.
Each MGS_3 GPS unit transmitted a unique VHF frequency with a customized
beacon schedule created using GPS 2000 Host (Lotek). As the VHF transmitter used the
same aerial as the GPS receiver, VHF transmission ceased during the GPS location
acquisition. The VHF beacon also provided feedback during initialization of the unit.
Once a unit was programmed with the user specified GPS receiver and beacon
transmitter schedule, it needed a current almanac to indicate which satellites would be in
orbit at any particular time, an accurate time of day and an approximation of its
position.
At each successful GPS fix attempt, the MGS_3 GPS recorded latitude and
longitude in milliseconds in the World Geodetic System 1984 (WGS 84) datum. The
units also record time, date, temperature, receiver status, activity sensor values and
satellite information including satellite identification and signal strength. Dilution of
Precision (DOP) was also recorded; this refers to the contribution of satellite geometry
to the uncertainty in a position fix. Once a unit was retrieved, data were downloaded
into a portable personal computer via Lotek’s Download Link Unit - DL1. This unit

29
connected to the MGS_3 GPS via a specialised serial cable and to the computer through
a port interface. Running the GPS 2000 Host software, data were formatted into a
comma-delimited file (.csv), and then converted into a text-delimited file (.txt) and
imported into the GIS software package Arcview 3.2.
Figure 2.4. Lotek GPS data loggers used in study. The tag is 63 cm long excluding aerials.

30
PTT/GPS Tags
Manufactured by Telonics Corporation, Mesa, Arizona, these tags were
essentially the same weight and design as the GPS tags with the exception that the foam
collar was constructed of syntactic foam and pre-attached to each unit. Each tag could
be programmed in the same manner as the GPS tags through specifically designed
software provided by the manufacturer. The PTT component could also be programmed
to switch on when necessary through dedicated Telonics software, such as when
searching for tags remotely. Additionally GPS locations could be downloaded through
the ARGOS system, however for this project the tags were utilised in the same manner
as the MGS_3 GPS tags built by Lotek.
Due to problems associated with software programming and issues with a new
harness system, only data obtained from two of these tags was of sufficient quantity to
be used in this study.
VHF Tracking
To listen to each frequency of all tag types while initializing each unit and for the
purposes of tracking the units at sea, a Lotek SRX_400 Telemetry Receiver and a
standard yagi aerial were used. For tracking animals from the air, two yagi aerials were
attached to the struts of a Cessna 172 aircraft with cables attached to the receiver inside
the cockpit. The SRX 400 is a 4 MHz bandwidth receiver. It was capable of scanning all
frequencies of deployed units at a user-defined period, allowing for the tracking of all
units simultaneously. From the water the units could be heard up to 6 km away through
the receiver; from the air this distance was far greater.

31
Harness Attachment and Release
Each PTT tag was deployed using the harness system of previous researchers and
described and illustrated in Marsh and Rathbun (1990). This consisted of a three-metre
nylon tether attached to the transmitter at one end, in such a way that allowed the
transmitter to move in 900 vertical planes. At the other end, the tether was secured to the
harness with a corrodible brass link. Each link had an expected life span of 3-6 months,
and incorporated a weak link that would break if the tether became entangled. The
harness consisted of nylon webbing encased in latex tubing
For the GPS units, the harness was designed to incorporate a remote release
mechanism. The unit at one end was attached to a nylon tether, as in the PTT system,
the peduncle attachment incorporated the remote release. One end of the strapping was
adjustable and locked down when attached to the animal (Figure 2.5). The other end
was attached to a section of plastic coated multi-strand stainless steel fishing trace (230
kg breaking strain). This in turn was attached to a wire within the harness that attached
to the positive terminal of a 9 volt battery housed in the MGS_3 tag. The final 1 mm of
the fishing trace at the harness end was exposed to seawater by removing the plastic
coating; this acted as the anode in a circuit. The negative terminal, via the remote
switch, was wired down the harness to a stainless steel washer (the cathode) situated
within 15 mm of the exposed stainless steel wire.

32
Figure 2.5. Example of harness attachment, with strap inside latex tubing secured around dugong tailstock.
In order to effect the retrieval of the instrument the dugong was first located via
telemetry. Once the tag was sighted, or estimated from the strength of the radio signal to
be within about 1 km, a separate VHF frequency to the tracking signal was transmitted
to activate the release. When the MGS_3 GPS received the specific VHF signal from
the RRT-1 transmitter (Lotek Engineering Inc., Ontario, Canada) and transmitting
aerial, the switch was activated, opening the 9 volt circuit. A rapid electrolytic reaction
occurred which dissolved the stainless steel wire in an estimated 5-10 min period, thus
releasing the harness from the dugong. For the deployment of the PTT/GPS units this
system was redesigned and modified to allow for repeat usage of components.

33
2.3 Results and Discussion.
2.3.1 Chase, Capture, Handling and Descriptions of Tagged Dugongs.
With any process involving the capture and handling of large wild animals there is
an associated level of risk to the animal; the animal may be injured or killed during
capture and handling or after the completion of the procedure and following release.
There is also the possibility of injury to catchers due to the size and strength of the
animal. The ‘chase and grab’ technique described here for the capture and handling of
dugongs was ideally suited for the population within Shark Bay. The shallow and
relatively clear waters of the Bay and the presence of large numbers of animals resulted
in relatively easy captures as well as short chase and restraint times. The use of this
method is clearly the most effective for capture and restraint of dugongs through the
brief chase and handling procedures, limited restraint and the capacity for immediate
release of the animal if complications arise.
During the course of the research program, from March 2000 to 2002, a total of 58
attempts were made for the successful capture of 31 dugongs. Of these 31 animals, 19
tags remained attached for extended periods (Table 2.2). Of the successful captures, the
mean chase to release time was 12 m 05 s ± 3 m 18 s (range: 7 m 20 s to 23 m 00 s).
The mean chase capture and restraint time was 15 m 05 s ± 4 m 30 s (range: 8 m 03 s to
22 m 00 s). Of the 27 unsuccessful attempts, 15 were terminated without an attempt to
jump on the animal. In these cases, either the chase exceeded the protocol time (3 min:
n=5) or number of breaths (3: n=6), or the dugong escaped into water that was too deep
for the capture method (n=6).

34
Table 2.2. Details of Tag Deployments in Shark Bay 2000-2002: Biological Descriptions of Tagged Dugongs, Duration of Deployments and Number of Locations Recorded.
Unit
Tag Type
Sex Length (cms)
Girth (cms)
Deployment Date
Retrieval Date
Days Deployed
Number of Locations
Locations Per day
5534
5519
5536(1)
5536(2)
5065
5535
5537
1311
8001
8002
8003
8004
8005
7301
7001
803
702
606
602
PTT
PTT
PTT
PTT
PTT
PTT
PTT
PTT
GPS
GPS
GPS
GPS
GPS
GPS
GPS
PTT/GPS
PTT/GPS
PTT/GPS
PTT/GPS
M
M
M
M
M
F
M
M
M
M
F
F
M
F
M
M
F
M
M
238
247
253
252
284
233
284
-
-
275
260
271
260
250
282
242
260
280
270
155
160
160
-
166
158
165
-
-
165
155
169
162
160
169
162
180
190
-
23/03/2000
22/03/2000
23/03/2000
06/04/2000
22/03/2000
23/03/2000
22/03/2000
16/05/2001
15/08/2000
16/08/2000
16/08/2000
17/08/2000
17/08/2000
18/09/2001
20/09/2001
21/03/2002
17/06/2002
18/06/2002
19/06/2002
25/10/2000
11/12/2000
04/04/2000
28/05/2000
05/04/2000
23/10/2000
16/08/2000
01/07/2001
05/10/2000
04/10/2000
03/10/2000
21/09/2000
01/10/2000
28/09/2001
28/09/2001
11/05/2002
25/07/2002
09/08/2002
04/07/2002
217
265
13
53
15
215
148
40
49
47
46
39
43
8
9
52
39
52
13
261
551
37
228
53
302
241
56
893
161
465
902
2084
89
77
627
1735
1481
130
1.2
2.1
2.8
4.3
3.5
1.4
1.6
1.4
18.2
3.4
10.1
23.1
48.5
11.1
8.6
12.1
44.5
28.5
10

35
Of the 31 animals caught, 23 were male and eight female. Total lengths ranged
from 2.10 - 2.86 m with a mean of 2.57 ± 0.2 m, while the girth measurements ranged
from 1.4 - 2.26 m with a mean of 1.66 ± 0.17 m. There was no difference in mean
lengths of males and females (T test: P = 0.316). Twelve of the 19 tagged animals in
which length and girth measurements were taken exceeded 2.5 m in length and were
therefore considered sexually mature (Marsh 1984). Another four animals that were
between 2.2m and 2.5m (Table 2.2) may either be classed as immature or mature
(Marsh 1984).
The short term impact on the dugongs from the chase, catch and restraint process
was observed to be acute and was highlighted through distress vocalisations while
restrained as well as increased respiration rates, exhaustion and avoidance of boats after
the procedure. Where possible, animals were closely observed after the procedure to
observe the impact of the process and to ensure that they recovered. Figure 2.6
highlights the increase in respiration rate of an animal immediately post capture (shorter
intervals between each breath) compared with that of another tagged animal that was
observed six weeks post-capture. Both animals were observed in similar water depths of
2-5 m to account for differences in diving behaviour due to depth, and at approximately
the same location from a distance from non-motorised platforms (sailboat and kayak).
The combined impact of the chase and restraint procedure also had implications
when relocating animals and attempting tag retrieval. Often when a tagged animal was
approached during radio tracking, even months after tagging, upon hearing the boat the
dugong would disappear into deeper water and surface infrequently making tracking
and observation difficult. This was also experienced by Marsh and Rathbun (1990)
while attempting tag retrieval during that study.

36
Figure 2.6. Respiration rates of a dugong immediately following capture and 6 weeks post capture.
2.3.2 Efficacy of PTT Tags to Describe Dugong Locations and Movement Patterns.
The eight PTT tags deployed on dugongs during the course of the study remained
attached between 40 and 265 days (Table 2.2). The number of guaranteed locations per
day (Location Class 1-3) ranged from 1.2 – 4.3 with an overall mean of 2.3 locations
per day. The location class for each received fix (Figure 2.7) was skewed towards
location classes one and two, with 69% of fixes obtained from the PTT’s in the error
range of 350 –1000m (Table 2.1). Given that the most accurate reading from these units
is to 350 m, this is too limited (Weimerskirch et al 2002) to confidently determine
habitat at core dugong usage areas, as many of the areas in which dugongs forage may
consist of a variety of seagrass species and differing benthic compositions within a
350m radius. However, the results from the PTT deployments in this study should be
considered sufficiently reliable for describing the large scale dugong movement
patterns, particularly movements ranging over the entire Bay.
Respiration Rates of Captured Dugongs
0.00
50.00
100.00
150.00
200.00
250.00
1 5 9 13 17 21 25 29 33 37 41 45 49
Number of Breaths
Bre
ath
Inte
rval
(S
ecs)
CapturePost Capture

37
Depth at recorded locations from the PTT tags (Figure 2.8) shows that while there
was a bias towards water depths of less than 3 m, there were still a considerable
proportion of fixes within deeper water. This is due to the tags remaining attached as the
animals moved into their winter distribution pattern resulting in an increase in water
depth for foraging (Anderson 1986). This distribution pattern is discussed further in the
following chapters.
Frequency Distribution of PTT Location Classes
0
100
200
300
400
500
600
700
Class 0 Class 1 Class 2 Class 3
Location Class
Num
ber
of L
ocat
ions
Figure 2.7. Frequency distribution of location classes from PTT tags deployed on dugongs in Shark Bay during the period 2000 - 2002.
Depth Distribution PTT Units
0
100
200
300
400
500
600
700
0-3 3-5 5-10 10-15 15-20
Depth (m)
Num
ber
Of
Loca
tion
s
Figure 2.8. Number of retrieved locations from PTT fixes at each of five depth categories, for tags deployed over the period 2000-2001 in Shark Bay.

38
2.3.3 Efficacy of GPS Tags to Describe Dugong Locations and Movement Patterns.
The high number of recorded locations (8644) obtained from the GPS tags over a
shorter duration (397 days) than that of the PTT tags (Table 2.2) results from the
program scheduling of these tags to attempt to record a location throughout a 24 hour
period every 10 or 20 min, compared with a duty cycling of 16 h on every second day
for the PTT’s. It was considered that with the GPS units taking longer to obtain a fix
than PTT tags to transmit a position, it was necessary to maximise the opportunity for
the tags to obtain a position. The downside to a high scheduling rate was increased
power consumption, and therefore the tags could only record positions for periods of up
to six weeks. From the deployments at these intervals the mean number of locations
obtained per day for all the GPS units combined were 19.8.
Behaviour and location of the dugong influenced the ability of the attached unit to
acquire a fix more than that of the PTT units. Water depth was a major determinant for
fix acquisition: with an average time of 47 sec to fix a position the distribution of fixes
heavily skewed to those areas where the depth of water was less than 3 m (Figure 2.9).
Time of day was also a determinant for recording of fixes with the majority of fixes
(31.7%) occurring within the evening hours (1800-0000). The fewest fixes (18.2%)
occurred within the morning hours (0600-1200).
The GPS units record no category with which to assign the accuracy of each
location. In a test to determine the locational accuracy of the MGS_3 GPS tags, a unit
was placed for 28 h at a stationary location with a 360° view of the sky and was
scheduled to fix its position every five minutes. Plotting the positions of the recorded
fixes from this test relative to 50% and 95% probability radii (Figure 2.10), 50% were
within 4.7 m and 95% were within 17.8 m. This is compared with Reid et al (2000)
who, in a similar test with the same tags, recorded 50% of locations within 22 m and
95% of locations within 52 m. The discrepancy between the two tests may relate to
timing: Reid et al.’s (2000) test was conducted during a period when the United States
Government applied Selective Availability (SA) to all GPS systems. SA meant that
every GPS position obtained prior to May 1st 2000 had an associated error.

39
Depth Distribution GPS Units
0
1000
2000
3000
4000
5000
6000
0-3 3-5 5-10 10-15
Depth (m)
Num
ber
of L
ocat
ions
Figure 2.9. Number of retrieved locations from GPS fixes at each of five depth categories, for tags deployed over the period 2000-2001 in Shark Bay.
Figure 2.10. Plot of GPS fixes from a Lotek unit left in static location for 28 hours prior to deployment on dugongs.

40
2.3.4 Suitability of Harness Attachment and Release Mechanisms.
The harness attachment system used for the PTT tags with the incorporated
corrodible brass link did not function during this study as it had in previous deployment
on dugongs in Queensland. In this study, some tags remained attached for up to 11
months as opposed to the anticipated period of 3-6 months, thus giving the large range
in length of deployments for these tags. A possible reason for this failure for the harness
to detach may be due to the high saline environment in which dugongs were tagged.
Salinity values for the areas where these animals were tagged and moved through were
greater than 420/00 (CALM, 1996). It is feasible that the higher salt content of the water
in Shark Bay had initially speeded up the corrosion process. Upon inspection of
retrieved units, it was found that a salt crust had formed over the link from the initial
corrosion, and this may have prevented or significantly slowed further corrosion.
The failure of the release link meant that an extended movement pattern of
dugongs was obtained from the tags. However, the energetic cost to the dugongs from
carrying these tags for an extended duration is unknown. From those animals that were
recaptured and the tags removed assessment of the tailstock was undertaken to
determine if there were adverse reactions to the extended attachment period. Of the
three animals that were recaptured it appeared that the harness attachment had caused
some minor irritation with minor scarring present. The behavioural implications from
the presence of the harness is unknown, but given the presence of only limited signs of
irritation it is suspected that the animal would have become accustomed to the presence
of the tag and subsequently not modified its behaviour to any great extent.
For retrieval of these tags, three animals were located in areas suitable for
recapture. These animals were caught and the tag removed before the animal was
immediately released. The use of the catch method for tag retrieval would have again
placed the animals under considerable and acute stress. Of the remaining tags, three
were recovered after they had eventually detached, one was never recovered and a
further tag was found floating free with what appeared to be teeth marks, suggesting a

41
shark had attacked either the harness or dugong. Teeth marks from sharks were common
on tethers deployed on dugongs in Queensland (P.Bousi, pers.comm.)
The use of the remote release mechanism for the retrieval of the GPS and
PTT/GPS tags was successful on a six occasions during 2000 and 2001. However
problems associated with a new harness design undertaken to minimise wastage, (the
previous harness once released could not be reused) meant that there were a number of
tethers which experienced problems with the remote release mechanism. These
problems have since been overcome and the release mechanism is functioning in
deployments in Queensland (Ivan Lawler, pers.comm.). Of the 11 GPS deployments in
which sufficient locations were obtained to describe dugong movement patterns, six
were retrieved through the remote release, three became detached (including one which
looked as though it had been hit by a propeller), one was lost, and one retrieved through
recapture.
Of the successful remote releases, the harnesses detached from the dugong within
the range of 30-45 minutes of the VHF trigger being fired. Once it was deemed that
there had been sufficient time for the wire trace to corrode, it was found necessary to
startle the dugong, through approaching by boat, to enable any remaining wire
attachments to break from the force of its tailstroke. There were a number of other
successful deployments, however, due to the breaking strain of the wire used in the
release being too low, all the harnesses detached prematurely. No spatial data from
those deployments is used here although data obtained on measurements of dugongs
was used in section 2.2.1 of this chapter.
2.3.5. Suitability of VHF Tracking for locating units and behavioural observations.
The VHF transmitters incorporated into each tag were essential for the location of
all units, in particular the MGS_3 GPS units that don’t have any satellite transmitter
capability as found in the PTT’s. For locating these units an aerial search was required
before tracking from a boat. For all units, tracking in shallow water allowed for rapid

42
location of target animals. When animals were in deeper water the signal could only be
heard when the animal surfaced, thus increasing the time taken to visually locate the
animal. Adverse wind and wave conditions also reduced the ability to rapidly track the
animal. The use of the VHF transmitter on all units was also critical for the observation
of respiration rates, with the radio signal providing an indication of surfacing if visual
contact was lost.
2.4 Discussion on Suitability of Remote Recording Devices to Measure Dugong
Spatial Usage and Impact of Catch Procedure.
2.4.1 Remote Recording Devices.
The application of the remote recording devices in this study was successful in the
recording of the movements and site fidelity of 19 dugongs throughout the Shark Bay
World Heritage Area. From the combined deployment of all tags over 10,000 recorded
locations were obtained, something not possible through direct observation alone. The
use of these recorded locations for determining individual movement patterns and use of
habitat by dugongs will be discussed in chapter 3.
From the eight PTT deployments in this study over a total of 966 days, a total
1678 guaranteed locations were obtained with mean locations per day of 1.2 – 4.3
(Table 2.2), this is within the ranges of other studies utilising PTT tags. In their study in
North Queensland, Marsh and Rathbun (1990) recorded a range of 2.5 – 3.9 locations
per day, while in Indonesia De Iongh et al. (1998) recorded a range of 2.8 - 4.1. In the
Townsville-Cardwell region of Queensland, Preen (2001) tagged 13 dugongs with a
range of 1.1 – 6.1 guaranteed locations per day. In both the Queensland studies, despite
the limitations in spatial accuracy, the information gained on dugong movement paths
and habitat usage was used to support and develop management actions for effective
dugong conservation in these locations (Marsh and Rathbun 1990; Preen 2001). This
study is therefore comparable with previous studies within the dugongs range and even
without the added benefit of using GPS units to define movement pathways and habitat

43
usage it would contribute significantly to meeting management objectives for this
population.
The vast majority of locations were however obtained from the GPS loggers
giving finer spatial resolution. The implications from these data are greater confidence
in site fidelity and the movement paths of dugongs within Shark Bay. These benefits of
GPS-derived data came at the cost of a clear bias towards shallow water, with the units’
ability to fix a position within deeper water appearing to be inhibited by the processing
time of ~47 seconds. Strong wind and wave conditions are also likely to inhibit a unit in
fixing a position in deeper water by swamping the aerials. Due to the problems
associated with harnesses releasing early from a number of dugongs, a complete
temporal and spatial resolution of dugong movements and therefore complete seasonal
habitat usage could not be wholly determined from the GPS tags. This was achieved
through the PTT units though, with their ability to record distribution over a greater
temporal and spatial scale evidenced through the longer deployment period and a
described seasonal movement pattern from those individuals, which will be further
discussed in chapter 3.
2.4.2 Capture and Handling
The chase and catch procedure used in this study is the safest and most
appropriate method for the capture of dugongs in Shark Bay. The clear water and
shallow banks of Shark Bay together with large herds of dugongs allowed for careful
assessment of approaches and selection of target animals for capture. The adherence to a
clearly defined capture protocol is essential in minimising any disturbance and risk of
injury to either the dugong or the catchers. As with all programs of this nature weather
conditions and team experience all contribute to the success of a capture.
Although this procedure has been shown to be successful here and previously in
Queensland (Lanyon et al. 2002), with no dugong mortality events known to have

44
occurred (mortalities have occurred with the use of a hoop net procedure (Marsh,
unpublished data), it can however be reasoned that the immediate disturbance to the
dugong created by this activity is acute. Aside from the direct impact upon dugongs that
were tagged, there were usually many other animals in the vicinity of the tagging
operation, and whilst the capture was focused upon the candidate animal it was
observed that on occasion this activity did disturb adjacent animals. The combined
disturbances created from the catch process on non-target as well as target animals,
particularly at identified catch locations over an extended period, will make further
capture and observation of animals difficult and may increase the population’s
susceptibility to mortality. The ability to therefore maximize the collection of data
through the capture and deployment of instruments on dugongs is essential and that the
information gained is the most appropriate for management activities aimed at the
continued conservation of the species within the targeted study area. In addition
considered opinion amongst some other researchers involved in this project, as well as
similar projects elsewhere within the dugongs range, is that the number of dugongs
captured within discrete populations should be minimised to reflect the size of that
population.
2.5 Conclusions
The results of this study have shown the effectiveness of these methods in
measuring the behaviour and habitat requirements of dugongs within the SBWHA. The
chase, capture and handling methods are clearly suitable for obtaining animals for the
purposes of deploying remote recording devices. The use of a novel harness system with
a remote retrieval device proved to be appropriate for not only the retrieval of units and
recorded data, but was also successful in reducing stress on target animals due to there
being no requirement for recapture.
The operational capabilities of both the GPS tags and the PTT’s for the intended
use of measuring distribution over both fine and coarse scales also represents a unique
ability to define dugong behaviour within Shark Bay. Although there is some associated
cost to the data acquisition capability of both tag types, their application represents a

45
first for this dugong population and represents a major achievement in the ability to
understand more about this illusive animals’ behaviours and requirements. Chapter 3
will follow with the full spatial and temporal results from these deployments as well as
habitat analysis of those areas deemed to be of significance as recorded by the GPS
units.

46
CHAPTER 3
INDIVIDUAL DUGONG MOVEMENT PATTERNS AND HABITAT
DESCRIPTIONS WITHIN SHARK BAY
3.1 Introduction
3.1.1 Known Dugong Movement Patterns and Habitat Usage.
Remote recording devices (satellite and VHF transmitters) have been used for
measuring dugong movement behaviour and identifying habitat in locations throughout
Australia and Indonesia. To date a total of 60 animals throughout the dugongs range
have been tagged. Of the tracking studies to occur within tropical and sub-tropical
Australia, all have occurred along the Queensland coast. Results from these studies have
shown that dugongs are capable of undertaking large distance movements with one
tagged animal travelling 600km between locations over a period of five days (Preen
1995). Other tagged animals exhibited large movements as well as showing consistent
return movements (Preen 1992, 1995, 2001; Marsh and Rathbun 1990). In addition to
the Queensland studies three females and a juvenile male were tracked between 41 and
285 days in a tropical environment in Indonesia, moving distances of between 17 and
65km (DeIongh et al. 1998).
The determination of movement patterns and habitat use by dugongs has not
previously been determined from remote instrumentation within Shark Bay or elsewhere
along the Western Australian coastline. Within Shark Bay previous determination of
individual dugong movements was by observations from a catamaran using photographs
of unique scars on individual animals for identification. Using this method five
individual animals were resighted 14 times over a period of 2 - 35 days (Anderson,
1995). The ability to determine individual movement patterns from this technique is
however difficult and unreliable. Dugongs spend a lot of time feeding in often turbid
water and combined with adverse weather conditions the probability of following an
individual over an extended period of time is low.

47
Anderson’s (1982b, 1986, 1994) descriptions of habitat in Shark Bay are based
upon behavioural observations of large groups of animals at a number of locations from
these boat as well as aerial and shore based platforms. Habitat is described as consisting
of dense beds of the seagrass Amphibolis antarctica in depths of 0.5 – 3m with water
temperature varying between 17.9 and 230C during winter (Anderson 1982b, 1986).
While summer water temperatures were between 25-270C and the seagrass was
predominately Halodule sp.
3.1.2 Aims
To fill in the gaps in the knowledge base of dugong behaviour and foraging
ecology within Shark Bay this study employed the use of the two different types of
remote recording instrumentation as fully described in the previous chapter to define
large scale seasonal movement pathways and fine scale critical habitat areas for
individual dugongs within the Shark Bay World Heritage Property. This chapter will
present and discuss the results as well as the management implications from these
deployments.
3.2 Determination of Individual Dugong Movements and Habitat Classification.
3.2.1 Tag Descriptions
As described fully in Chapter 2, two types of remote recording instrumentation
devices were used in this study, Platform Transmitting Terminals (PTT) and Global
Positioning System (GPS) tags. Due to the issues associated with the tag attachment
mechanisms on both the PTT and GPS harnesses for this study, many deployments did
not proceed as originally planned in order to account for the complete spatial and
temporal coverage of dugongs within Shark Bay. During the deployment period in
which the PTT tags inadvertently remained attached to the dugongs, they did continue
to transmit and provided an extended movement pattern.

48
The first five GPS deployments occurred during August 2000 for periods between
39 and 49 days on three males and two females (Table 2.2) with all tags deployed
around Guischenault Point in the Eastern Gulf (Figure 2.1). Further GPS deployments
were staggered over two years following on from 2000. A deployment was carried out
during September 2001 in which two tags were deployed at Guichenault Point. During
June 2002 three tags were deployed, one at Guichenault Point (Male) and the remaining
two were deployed along the eastern shoreline of Dirk Hartog Island (1male and 1
female).
A total of eight PTT tags were deployed during the period March 2000 – July
2001 (Table 2.2, Figure 3.5). Seven of these tag deployments occurred during one field
program in March and April 2000 at locations surrounding Pelican Island. With the
remaining tag deployed during July 2001 within the lower reaches of Henri Freycinet
Harbour, the only deployment to occur within that region (Figure 2.1). Of the tags
deployed during March 2000, tag 5536(1) was found detached from an animal on the
Wooramel Seagrass Bank. The harness of this tag was sliced by what appeared to be a
shark bite. The harness was retrieved and repaired and subsequently deployed on
another dugong as tag 5536(2).
3.2.2 Data Representation and Analysis.
Dugong behaviour, as recorded from tags deployed on dugongs throughout Shark
Bay as well as analysing movement patterns, home range size and habitat usage were
determined with use of a Geographical Information System (GIS) using ArcView 3.2
(ESRI). In addition an extension to this software package, Animal Movement Analysis
(AMAE) (Hooge and Eichenlaub, 1987), allowed for additional movement, and home
range analysis. All geographic data were plotted in the datum World Geodetic System
(WGS) 1984 and then converted to the Australian Geodetic Datum (AGD) 1994.
Other GIS datasets specific to Shark Bay used within the study include
bathymetry and seagrass percentage cover and composition (Bruce, 1997) along with
Sea Surface Temperatures.

49
Seagrass composition and percentage cover used in broad scale habitat
descriptions was obtained from remotely sensed data and verified with ground survey
techniques (Bruce, 1997). In addition marine charts of the Shark Bay region, for
additional bathymetric analysis and for nomenclature (Commonwealth of Australia,
1999), and thematic landsat images were imported as backdrops to recorded dugong
distribution and movement. Representation of location data against these thematic
datasets required the data be projected from the datum AGD 1994 onto the Australian
Map Grid (AMG) zone 49. Analysis of variables as functions of dugong distribution as
provided by these additional datasets involved the use of identity functions within
ArcView to extract these descriptors relative to each recorded dugong location.
Sea Surface Temperature relative to the deployment period of four of the PTT
units was obtained from NOAA SST imagery. The PTT units do have temperature
sensors, however with the use of broad scale NOAA imagery a clearer picture can be
obtained of the whole bay rather than just the dugongs’ location, which was more
appropriate for showing distribution over greater spatial and temporal scales. Images
were imported in ArcView GIS with individual dugong positions plotted over the grided
images and corresponding values then exported into spreadsheets for analysis. For the
GPS units, the onboard temp sensors were used due to the greater resolution and higher
frequency of readings. Readings were taken at the same time as a position was recorded
within the MGS_3 GPS.

50
3.2.3 Home Range Determination
The calculated home range or utilisation distribution analysis used on individual
as well as combined dugong distributions is defined as a probabilistic model describing
the relative amount of time an animal spends in any place (Jenrich and Turner 1969).
Home range determination for tagged animals during the study period involved the use
of the fixed kernel density estimator, a non-parametric statistical method for estimating
probability densities. This density information forms the basis for investigations into
habitat use and preference (Seaman and Powell 1996). Calculation of combined home
ranges, pooled GPS units and PTT units, involved sub-sampling the datasets to avoid
bias towards those individuals with more recorded locations. With the exception of unit
803 a subset of 75 locations were randomly selected and then categorized from within a
ten day period for each of the GPS units, kernel densities were then calculated upon
these locations. The calculation of home ranges for the PTT tags was undertaken using
all reliable locations (i.e. location classes 0-3 from information received from service
Argos).
Within AMAE, 95% and 50% fixed kernel probability contours (or isopleths)
were calculated using an ad hoc smoothing factor that controls the amount of variation
in each component of the estimate (Worton 1989). The 95% contour can be described as
the area that the animal actually uses (as it contains 95% of recorded locations) and the
50% contour as the core area of activity (containing 50% of clustered locations) (Hooge
et al. 2000). For the purposes of describing core dugong locations only the 50% contour
is displayed in this study. Where contours overlapped unavailable habitat, such as land,
they were clipped to more accurately reflect probable home range. In addition some
travel paths for individual animals have been adjusted where features such as land were
intersected to give a more accurate representation of the true movement path, however
true distances travelled may not be accurately reflected for all animals.
For all of the GIS datasets used throughout this study a metadata statement using
the ANZLIC 2002 Guidelines for Core Metadata Elements was created detailing a

51
description of each dataset, dataset currency, status access and quality. All statements
are located within Appendix 1.
3.2.4 Habitat Determination and Survey Techniques.
To assess fine scale habitat structure and identify the composition, density and
biomass of seagrass forage species that occurred in areas preferred by dugongs (the 50%
kernel contours calculated from positions obtained from the GPS tags), a total of 14
sites were sampled. Sites were chosen based upon a subset of the spatial and temporal
distribution recorded from two of the GPS tags deployed on female dugongs during
their autumn-winter-spring distribution pattern. Insufficient locations were obtained
from GPS deployments on dugongs during the summer periods to allow for comparative
seasonal habitat assessment.
Using ArcView, sites indicative of preferred dugong habitat (foraging sites) were
selected from areas where the fix density was high and concentrated over more than 24
hours. This information indicated that the animal was moving slowly between recorded
fixes, suggesting a period of foraging. Within these groupings, a single point was
selected where the distance from the previous fix was less than 50m and the distance to
the next fix was of a similar distance. In order to determine if there was a difference in
habitat between high and low density areas, a number of ‘travelling’ sites were also
sampled. Travelling sites were indicative of habitat where dugongs were deemed to
have travelled through, and were classified as areas where the distances between fixes
were greater than 1km.
Habitat surveys were conducted during August 2002, the month when recorded
animal locations had been obtained over the previous two years. At each site, four 50m
transects were laid out on the benthos in a north, south, east and west direction
respectively from a randomly located point. A video of the benthos was then taken
along each individual transect at a constant speed and height of 50cm above the bottom.
Seagrass percentage cover and composition were later determined from the video

52
through consensus of three observers. In addition, eight replicate 0.5m2 quadrats were
sampled by SCUBA divers at locations selected randomly over the four transects at
each site. Seagrass percentage cover was estimated within each quadrat. Shoot density
was determined within a 0.1 m2 sectioned corner of the quadrat after which the seagrass
within that corner was harvested for above ground biomass determination. Biomass was
measured for dry weight by drying samples at 600C for a 48hour period. These seagrass
measurement methods are commonly utilised for the acquisition of baseline data for
understanding the health of seagrass meadows (Kirkman 1996).
In order to determine habitat structure and composition for large scale movements
from PTT tags with inherent spatial error, locations were plotted against existing GIS
data sets of seagrass distribution and abundance (Bruce, 1997) as well as other classified
habitat types. Whilst this method does not provide the resolution achieved through on
ground survey it is useful for comparative analysis.
3.2.5 Statistical Analyses
In addition to the routines used to estimate probable home ranges other specific
statistical tests were conducted. A Mann-Whitney rank sum test was applied to test for
any difference between tagged males and females in total distance travelled. A Students
T Test was also used to test for difference in the calculated average speed travelled
between males and females. These tests were performed due to the inability to actively
select either sex of dugong during the capture process, and to therefore determine if sex
difference results in difference in speed travelled or total distance travelled.

53
3.3 Results showing Home Range, Movements and Habitat of Dugongs in Shark
Bay.
3.3.1 Geographical Positioning System (GPS) Tag Deployments.
A total of 8644 positions were recorded from the ten GPS tags (eight Lotek and
two Telonics) deployed on dugongs throughout Shark Bay from 2000 – 2002. The total
deployment period of the GPS tags was 397 days and the numbers of recorded locations
for each of the units, deployment start and end dates, locations per day as well as
biological details of these animals are shown in Table 2.2. Distribution of all animals
tagged with GPS tags over Shark Bay bathymetry is shown in figure 3.1.
The distribution of GPS positions, were skewed towards the shallow water regions
of the Bay, with majority of fixes (62%) occurring within 0-3m of water (21% in 3-5m,
15% in 5-10m and 2% of fixes in water deeper than 10m) (Figures 2.8, 3.1).
Temperature readings ranged from 150C through to 310C, with mean temperatures for
each unit within the 18-250C bracket (Figure 3.2). While average temperatures fit the
thermal threshold range as identified by Anderson (1986) a number of animals regularly
occurred in waters below these values. There was an even distribution of fixes
throughout the deil period (52% of readings during from 6pm-6am and 48% 6:00 AM-
6:00 PM).
Generally, fixes for each animal were grouped within a small number of locations
with some animals clearly moving large distances between these grouped locations (e.g.
units 0702 and 8004, Figure 3.1).

54
Figure 3.1. Distribution of all GPS units deployed on dugongs 2000-2002 in Shark Bay overlaid on a bathymetric profile.

55
Figure 3.2. Mean temperature and depth distribution (±s.d) for all GPS tag deployments on dugongs in Shark Bay between 2000-2002.
The maximum distance travelled by any animal between fixes was 61.6km when
unit 8003 undertook a movement from north of Faure Island (Figures 1.1, 3.1) around
Peron Peninsula to a location to the north west of the Peninsula in three days. There was
no significant difference in the calculated average speed of males and females (Table
3.1; T10 = -1.37; P=0.201) or for total distance travelled (Mann-Whitney rank sum test
T11 = 3.4: P=0.214).
GPS Units
Mea
n D
epth
& T
empe
ratu
re
0
5
10
15
20
25
30
35
Depth (m)
Temperature 0C
602 606 702 803 7001 7301 8001 8002 8003 8004 8005

56
Table 3.1. Distance Travelled and Average Speed and Daily Distance for All GPS Deployed on Dugongs in Shark Bay from 2000 – 2002.
Home Range and Movements.
The 50% isopleth data (Figure 3.3) highlight the significance of the Guischenault
Pt- Point Peron region for dugongs in the spring and summer periods of 2000 and 2001
as well as the importance of the eastern shoreline of Dirk Hartog Island in the winter of
2002.
A number of animals tagged around Guischenault Pt during spring of 2000, (units
8001 and 8004) moved out of the area for a number of days before returning, in what
may be described as exploratory movements. Other animals, units 8002, 8003 and 0602
remained within that location before moving with the tags retrieved at other locations,
while units 8005 (spring 2000), 7001 and 7301 (summer 2001) remained entirely within
the region until the tags were retrieved. Unit 0702 undertook the biggest movement,
circumnavigating almost the entire Bay from the deployment location off Dirk Hartog
Isl. in a large exploratory movement, including 3 days within the Guischenault Pt –
Peron Peninsula region (Figure 3.1).
Unit Days Deployed
Locations Per day
Total Distance (km)
Av Daily Distance(km)
Average Speed (Km/h)
8001 49 18.2 284.23 5.8 0.24
8002 47 3.4 127.75 2.72 0.11
8003 46 10.1 366.76 7.97 0.33
8004 39 23.1 374.96 9.1 0.4
8005 43 48.5 276.20 6.42 0.27
7301 8 11.1 170.70 21.34 0.89
7001 9 8.6 72.60 8.06 0.34
0803 52 12.1 188.61 3.63 0.15
0702 39 44.5 734.06 18.82 0.78
0606 52 28.5 796.78 15.32 0.64
0602 13 10 254.62 19.59 0.82

57
Figure 3.3. Fifty Percentile Home Ranges by season and year on all GPS tagged dugongs in Shark Bay during the period 2000 -2002.

58
3.3.2 Platform Transmitting Terminal (PTT) Tag Deployments.
Four of the eight PTT tagged dugongs retained tags long enough to define distinct
core areas of activity, these were associated with a shift in Sea Surface Temperature and
depth (Figures 3.6, 3.7). Tags 5519, 5534, 5535, and 5537 remained attached and
transmitted location data for 266, 217, 215 and 148 days respectively (Table 2.2). This
period of transmission extended from March 2000 towards the end of the Austral
summer through to the beginning of the following summer.
Three of these four dugongs were males (5519, 5534, and 5537) and showed
seasonally distinct 50% contours separated by the Peron Peninsula (Figures 3.8, 3.9).
For these males, summer activity was concentrated within the lower eastern gulf and
winter activity within the mid-western gulf. At the onset of the summer at the end of
2000-01 all males returned to the eastern gulf. Distances between each core area of
activity, around Peron Peninsula were approximately 120 –150 Kms. The only tagged
female was 5535. Whilst showing a distinct seasonal distribution pattern (Figure 3.9)
the entire deployment period was spent within the eastern gulf, with a small shift of
approximately 35 Kms between each centre of core seasonal activity. With the
exception of the winter home range of animal 5535, all home ranges overlapped.

59
Figure 3.4. Distribution of locations as transmitted by all deployed PTT units on dugongs in Shark Bay during the period 2000 – 2002

60
Month
Mar May Jul Sep Nov Jan
SS
T
14
16
18
20
22
24
26
28
30
32
5535 Temp 5534 Temp 5537 Temp 5519 Temp Thermal Threshold
Figure 3.5. Distribution of 4 PTT units deployed on dugongs in Shark Bay During 2000-2002 relative to shifts in Sea Surface Temperature.

61
Dep
th
0
5
10
15
20
25
WinterSummer
5519 5537 5535 5534
.
UNIT
Figure 3.6. Mean seasonal water depths (±2sd) of 4 dugongs in Shark Bay with PTT
units attached in 2000.

62
Figure 3.7. Seasonal Home Ranges of PTT Units 5535 and 5534 Deployed on Dugongs in Shark Bay during 2000.

63
Figure 3.8. Seasonal Home Ranges of PTT Units 5519 and 5537 Deployed on Dugongs in Shark Bay during 2000.

64
In addition to the summer and winter core areas of activities, two animals, 5537
and 5519, spent time at intermediary locations. Animal 5519 spent 2 periods of 5 days
duration each at the same location upon departing both his summer and winter home
ranges. Upon departing his summer home range animal 5537 spent 9 days to the North
West of the tip of the Peron Peninsula and returned along the eastern shore of the
Peninsula towards the end of July 2000, coincident with the 50% isopleth identified
from the GPS units. This male then spent another month in this region before the tag
was removed.
Tagged animals 5519, 5534 and 5537 also exhibited exploratory movements
similar to that shown by some of the GPS tagged animals. These movements lasted less
than 8 days, involved return journeys from core areas of activity, and were not
characterised by any site fidelity. For the male 5519, a return journey of 222 km was
undertaken north from his winter home range. The male 5534 travelled a return journey
of 192 km from his summer range into what would become his winter home range while
the remaining male, (5537) completed a round trip of 186 km from his winter home
range pattern travelling north. Due to the associated error range with the PTT tags these
distances don’t have the resolution as calculated from the GPS tags.
The shorter deployment period for tags on the remaining four male dugongs
resulted in the distribution of these animals being centred on the catch location and
summer aggregation area, with the exception of 1311. Two of these tags, 5536(1), and
5065, which was found detached possibly due to a shark attack, remained in the area
adjacent to the catch location. Unit 5536(2), which was attached for a longer period of 52
days, undertook a movement north after spending three weeks within the catch region,
travelling 324 km in 30 days before the tag detached and floated inshore north of
Carnarvon. Unit 1311 was attached to a large solitary male within the lower reaches of
Henri Freycinet Harbour. Once tagged he immediately left this area and moved to a
location along the south eastern shoreline of Dirk Hartog Island where the tag detached
after a period of approximately six weeks, determined through a lack of movement in
recorded positions as obtained through Service Argos. Individual home ranges were not
calculated for these animals.

65
The maximum distance travelled between fixes was 87 km: tag 5537 travelled
from a location near Gladstone to a position off the north western tip of Peron Peninsula
in 6 days. Total travel distances average speeds, and range of distances travelled
between fixes for all PTT tagged animals are shown in Table 3.2, while movement paths
for the combined GPS and PTT units are shown in Figure 3.9.
The location data from both PTT and GPS tagged animals showed that dugongs
are utilising waters outside of the existing Shark Bay Marine Park boundary. Although
the majority of locations and defined critical habitats from this study fell within the
existing reserves (Figures 3.1 & 3.4), and all deployments occurred within the
boundaries of the park (Figure 2.1), a number of recorded locations (3% of total
recorded fixes from all deployments) occurred outside. In addition, the travel paths of a
number of tagged dugongs (5% of total movements from all deployments) crossed this
boundary (Figure 3.9), with the majority of these movements occurring when dugongs
were travelling to and from identified seasonally important locations.
Table 3.2. Distance Travelled, Average Speed and Daily Distance for Dugongs in Shark Bay with All PTT Units during the Period 2000 - 2002.
Unit Days
Deployed
Locations
Per Day
Total
Distance (Km)
Average Daily
Distance (Km)
Average Speed
(Km/h)
5065 53 3.5 165.1 3.1 0.46
5536(1) 13 2.8 228.2
17.6 0.73
5536(2) 53 4.3 1224.1 23.1 0.96
5535 215 1.4 1540.6 7.2 0.30
5537 148 1.6 551.1 3.7 0.16
5519 265 2.1 2118.4 8.0 0.33
5534 217 1.2 1683.3 7.8 0.32
1311 40 1.4 216.4 5.4 0.23

66
Figure 3.9. Movement Paths of All Dugongs Tagged with GPS and PTT Tags in Shark Bay during the period 2000-2002.

67
3.3.3 Habitat Structure and Composition.
Ground truthing of the selected GPS locations indicated that the preferred habitat
for tagged dugongs during the autumn - winter – spring periods are seagrass beds where
there was 30-80% coverage of the species Amphibolis antarctica with an estimated
above ground biomass of 110-360 gm-2 in waters <5m (Table 3.3). Ninety percent of the
foraging survey sites were within 1000 m of areas of a depth gradient into deeper water
(>5m). Figure 3.10, based on existing GIS datasets of seagrass type and coverage,
shows the distribution of this habitat type and its proximity to deeper water.
Observations of dugongs prior to capture events, as well as when following tagged
animals during the spring period from non motorised platforms to record respiration
rates (as shown in Figure 2.6), showed that animals were clearly foraging on
A.antarctica in areas of 30-80% coverage within site of deeper waters.
Sites that were surveyed as low use or ‘travelling’ sites were either deeper (>10m)
and with no seagrass present, or shallow (<5m) with a sparse coverage (<10%) of
Posidonia australis (not recorded as part of dugong diet) mixed throughout sand and/or
rubble.

68
Table 3.3. Habitat Composition and Descriptions for all Survey Locations.
LOCATION SITE NAME
DUGONG BEHAVIOUR
SEAGRASS SPECIES /HABITAT
MEAN COVER (%) MEAN BIOMASS (gms/0.1m2)
MEAN SHOOT DENSITY (0.1m2)
DEPTH (m)
South Passage SP1 Travelling Sand/Rubble - - - 6
South Passage SP2 Foraging A.antarctica 40.82 18.55 30 4
Bellefin Flats BF1 Foraging A.antarctica 69.04 21.20 32 1.5
Bellefin Flats BF2 Foraging A.antarctica 36.67 36.03 31 2.4
Bellefin Flats BF3 Travelling Sand - - - 12
Dirk Hartog DH1 Foraging A.antarctica 70.48 11.34 51 2.5
Dirk Hartog DH2 Travelling P.australis 11.98 1.31 20 3
Dirk Hartog DH3 Travelling Sand - - - 12
Dirk Hartog DH4 Foraging A.antarctica 68.09 11.63 79 3.5
Dirk Hartog DH5 Foraging A.antarctica 53.71 17.30 130 1.5
Guischenault Pt. GP1 Foraging A.antarctica 40.12 26.86 59 2
Guischenault Pt. GP2 Foraging A.antarctica 36.15 14.44 59 3
Guischenault Pt. GP3 Travelling A.antarctica
P.australis
86.4 27.83 76 1.5
Guischenault Pt. GP4 Travelling A.antarctica 15.94 10.74 20 1.5

69
Figure 3.10. Distribution of Seagrass Habitat in Shark Bay as Described from Habitat Mapping.

70
Table 3.4. Number of Recorded Fixes for All PTT Units within Seagrass Habitats as Defined by Type and Percentage Cover.
Seagrass Type and Percentage Cover (%)
Amphibolis antarctica
Amphibolis antarctica,
Posidonia australis
Amphibolis antarctica,
Posidonia australis, Cymodocea spp
Unit
1-20 21-40 41-60 61-80 81-100 1-20 21-40 41-60 61-80 81-100 1-20 21-40 41-60 61-80 81-100
Sand Unknown
55065 - 2 - - 79 - - - 2 - - - - - - - 17
5536(1) - 3 16 8 35 - - - 3 - - - 3 3 - 2 27
5536(2) 1 - 2 1 26 - - - 2 4 - - - - - 2 62
5535 2 2 3 5 46 - - - 2 - 7 - 2 18 9 1 3
5537 2 3 9 7 25 - - - - 6 - 1 5 4 - 2 36
5519 2 1 8 20 36 - - - 2 - 0.2 - 0.4 14 1 3 12.4
5534 2 3 2 15 16 - - - 3 - 1 - - - 1 1 56
1311 - - - 24 4 - - - - 8 - - - - - - 64

71
Table 3.5. Number of Recorded Fixes for all PTT Units Within Described Habitat Type.
Habitat Type
Perennial Seagrass
Unit Dense Medium Sparse
Ephemeral Seagrass Sand Silt Unknown Algal Mat Macro-algae Reef
55065 81 - 2 - 2 - 15 - - -
5536(1) 49 19 30 - 2 - - - - -
5536(2) 46 15 20 - 2 - 17 - - -
5535 79 6 11 - 2 0.3 1.7 - - -
5537 42 14 6 - 20 3 8 1 3 3
5519 72 8 5 - 11 1.8 2 - - 0.2
5534 34 2 14 0.4 15 5.6 29 - - -
1311 36 - - 2 56 4 2 - - -

72
Comparisons of PTT locations, which were not categorised as either foraging or
travelling, to GIS datasets of habitat and seagrass types (Tables 3.4 and 3.5) show the
greatest proportion of fixes occurring over perennial seagrass habitat comprised
essentially of A.antarctica with 81-100% cover. Preliminary investigations of high
density sites, where PTT tagged dugongs had aggregated during the summer distribution
pattern indicated that as well as the presence of Halodule uninervis there were beds of
Amphibolis antarctica, Halophila spinulosa and Halophila ovalis.
3.4 Discussion of Distribution and Habitat Usage.
The described movement pattern and habitat descriptions from the deployment
and retrieval of location recording instrumentation within Shark Bay are a first for this
population. These results have confirmed previous research carried out by Anderson,
(1982b, 1986, 1994, and 1998), Prince et al. (1981) and Marsh (1994) in addition to
considerable anecdotal evidence and historical knowledge from members of the
Yadgalah Aboriginal Corporation. Dugongs undertake a defined seasonal distribution
pattern coincident with a decrease in Sea Surface Temperature (Figures 3.6, 3.8 and 3.9)
within the inner areas of the Bay. During the summer dugongs congregate within the
lower reaches of both the eastern and western gulfs, foraging on preferred species of
seagrass. With a decline in water temperatures within these areas at the onset of winter,
the dugongs will move out to the outer regions of Shark Bay to take advantage of
warmer oceanic waters. This distribution pattern has consequences with a change in
seagrass species available for forage as well as an increase in water depth in which
suitable forage species occur.
This seasonal distribution pattern of dugongs is similar to that exhibited by
dugongs within Moreton Bay in Queensland (Preen 1993; Lanyon 2003), a location
representing the southernmost distribution of dugongs on Australia’s East Coast. Here
temporal distribution of animals is also reflected through changes in water temperature
with animals seeking out warmer oceanic water when Bay temperatures fall below 180C
(Preen, 1993).

73
No other locations within the dugongs range that observational or tracking studies
have been undertaken, have reported a seasonal distribution pattern similar to that
described for Shark Bay and Moreton Bay, due to consistency of water temperature
throughout the year. However there is indication that seasonal climatic conditions such
as monsoons may influence the distribution of dugongs within the Philippines
(Aragones 2000). Of those tracking studies within the lower latitudes of the dugongs
range, (De Iongh et al. 1998, Preen 1995, 2001) there is evidence that tagged animals do
move consistently between core areas, and that these movements are highly
individualistic although there is considerable overlap in these movements, suggestive of
aggregating or herding animals. This individualistic pattern is also reflected in the
diving behaviour with individual variation dominating effects on diving behaviour
(Chilvers et al. 2004).
The travel paths of animals moving between the two gulfs of Shark Bay are
determined by the Peron Peninsula, with the majority of animals making direct
movements from the Eastern Gulf across the tip of the Peninsula to those preferred
locations along the eastern shoreline of Dirk Hartog Island. In addition it can be seen
that for the majority of movements’ animals tend to follow edges of large seagrass
banks or adjacent coastline. However for movements within the Eastern Gulf,
particularly from Guischenault Point to the lower sections of this Gulf, animals tended
to move more directly across the Bay, this might be due to the presence of shallow
seagrass banks within centre of the Eastern Gulf providing foraging opportunity.
Anderson (1986) also suggested that in summer dugongs also aggregate in the
lower western gulf of Shark Bay within Henri Freycinet Harbour (Figure 1.1). Only one
dugong, unit 1311, was tagged during this study at this location. No other animals were
sighted around this region and upon tagging this animal, a male, he immediately
departed the region for Dirk Hartog Isl. Results from the aerial survey chapter of this
study (see Chapter 4) indicate that 25% of the overall Shark Bay dugong population
estimate occurred within Henri Freycinet Harbour during summer.

74
The paucity of positions and movement paths along the western shoreline of the
Peninsula, as opposed to the high density of locations along the eastern shore may be a
consequence of wind and fetch conditions along this section of coastline. Direct
exposure, particularly in the summer months, to the predominant south-westerly wind
stream results in strong onshore conditions here. Aside from affecting the performance
of tags ability to record locations in these conditions, these conditions may also
influence a dugong’s travel preference as well as restricting foraging activity. Protection
from weather, in addition to seagrass distribution, may also partially explain the
distribution of defined core areas of activity within sheltered shallow waters in the lee of
the prominent coastal features within the Bay.
The habitat surveys demonstrate that during the winter distribution pattern the
only reliable forage available for dugongs is the seagrass species Amphibolis antarctica
(Table 3.3). It has been suggested that dugongs may also forage upon another species of
seagrass, Halophila spinulosa, during the winter in Shark Bay (Anderson, 1994).
However, no presence of H. spinulosa was recorded at sites investigated in this study,
highlighting the significance of A. antarctica for dugong forage requirements in Shark
Bay. The presence of H. spinulosa may be sporadic both spatially and temporally within
the Bay. In Exmouth Gulf surveys for Panaeid prawns (Loneragan et al. 2003)
subsequent to a category 5 cyclone discovered large meadows of this species as well as
groups of dugongs foraging in these areas. Previous surveys in this area (McCook et al.
1995) before the cyclone recorded no presence of H. spinulosa suggesting this is a
pioneer species.
The habitat surveys for this study also determined that dugongs not only foraged
in areas vegetated solely by A. antarctica, but that there were a number of similar
habitat characteristics defining the high use sites. The description of forage habitat of
beds of the seagrass A. antarctica with a mean cover between 30% and 70% and in
waters less than five metres deep (Figure 3.10) implies that here dugongs aggregate and
selectively forage in these areas.

75
No comparative summer habitat survey was undertaken during this study, though
Anderson (1982b, 1986) and Masini et al. (2001), describe a number of locations within
the lower eastern gulf that coincide with the relatively dense summer aggregations
recorded within this study. They describe the seagrass habitat at these locations being
comprised of the species Halodule uninervis and Halophila ovalis, with mean above
and belowground biomass of 69.8gm-2. Both of these species of seagrass have
previously been identified as among the preferred forage species for dugongs
throughout their global range (Marsh et al. 1999).
The change in habitat accessed by dugongs as a result of seasonal movement in
response to thermal cues, results in a shift of available forage as suggested by Anderson
(1986, 1994). Anderson (1986) put forward the hypothesis that this shift may have
negative consequences for the dugongs’ energy budget, particularly during the winter
months when the primary forage is Amphibolis antarctica, a perennial species with
lower nutritional value than the ephemeral species (Anderson 1986) available during the
summer. No nutrient composite analysis of seagrass was undertaken during this study.
Consequently, no conclusions can be drawn regarding differences in the calorific
content among species and throughout the year. If dugongs are already nutritionally
stressed during the winter, human activity on the waters of the Bay that is greatest at
this time of year (Summner and Malseed 2000) may exacerbate the disturbance levels.
There is, however, no evidence of higher mortality levels during the winter periods than
summer.
The application of information gained from this study on individual dugong
movements and described habitat types can provide the means for the continued
effective conservation of this population through a greater understanding of individual
dugong requirements throughout the year across the entire Bay. The spatial information
presented here, such as the recording of movements outside of the Marine Park
boundary, reinforces observations by Preen (1997) that during previous winter aerial
surveys approximately 50% of sightings of dugongs were found to occur outside of the
reserve structure. This type of information should provide impetus to the extension of
zoning structures of the Shark Bay Marine Park Boundary to match that of the World

76
Heritage Property in order to ensure access by dugongs through unobstructed pathways
to identified core areas throughout the year.
This information is also applicable for use in the assessment of proposed
aquaculture leases, as many of the biological and physical requirements for a
commercial lease are the same as required by dugongs. This is highlighted in Figure
3.11, where proposed and existing leases along the southern and eastern shores of Dirk
Hartog Island are surrounded by recorded dugong locations as well as preferred dugong
seagrass foraging habitat.
In addition the information described here highlights the applicability of carrying
out similar research projects throughout the rest of the dugongs range within Western
Australia, particularly in those areas to the north such as the Kimberley and Exmouth
Gulf where information on dugong distribution and habitat usage and association is
limited or non existent. The ability to remotely record high use locations at a fine scale
is particularly relevant in those marine environments to the north of Shark Bay as they
experience greater levels of turbidity, thus ruling out efforts to undertake any form of
visual observation and tracking.

77
Figure 3.11. Distribution of a Sample of Recorded Dugong Locations in 2000, Seagrass Habitat and Aquaculture Leases.

78
In addition there are likely to be numerous additional areas critical to a large
segment of the population particularly within the Henry Freycinet Harbour region,
which are unaccounted for through these series of deployments. Development of
detailed GIS seagrass habitat datasets, which is currently underway, will aid in the
identification of similar habitat to the descriptors provided here and should be used in
conjunction with findings from this study, in the decision making process for
development activities within the Bay.
The capture of dugongs for programs such as this one within Shark Bay should
also be a consideration in the continued conservation of this population. As discussed in
chapter 2 it can be reasoned that the disturbance created by this activity is probably
acute based on the observations of animals immediately post capture and through
wariness by tagged animals up to many months after the tagging procedure.

79
CHAPTER 4
POPULATION DISTRIBUTION AND ABUNDANCE OF DUGONGS
DURING SUMMER IN SHARK BAY
4.1 Historical Dugong Population Estimates and Winter Distribution Patterns.
Aerial surveys of dugongs within Shark Bay throughout the 1980s identified the
significance of this population and defined areas of importance to dugongs (Prince et al.
1981; Anderson 1982, 1986). These surveys were counts of animals observed and were
flown over areas where large numbers of dugongs were thought to be present. In July
(winter in the southern hemisphere) of 1989 the first fully standardised aerial survey
was undertaken to determine the overall population abundance and distribution in Shark
Bay (Marsh et al. 1994). The standardised aerial survey technique had been used to
determine population abundance estimates and for monitoring of dugongs in
Queensland (e.g. Marsh and Saalfeld 1989, 1990, 1991), the Northern Territory (Bayliss
1986; Bayliss and Freeland 1989) and in the Arabian Gulf (Preen 1989). The 1989
Shark Bay survey was conducted to determine a baseline for future surveys that would
form part of management of this population. After the July 1989 (Marsh et al. 1994)
survey, it was determined that an interval of five years between surveys would be
appropriate to assess change in the Shark Bay dugong population (CALM 1996).
In the July 1989 survey, the minimum population estimate was 10 146 ± 1 665
(s.e.) dugongs with an overall density of 0.71 ± 0.12 (s.e.) dugongs km�2, the highest
density ever recorded on a large-scale dugong survey. This confirmed Shark Bay as
probably the second most important dugong population in the world, after Torres Strait
(Marsh et al. 2004). In June 1994 a subsequent survey was undertaken. The population
estimate for Shark Bay for this survey was 10 529 ± 1464 (s.e.), a result very similar to
the previous survey (Preen et al. 1997). The most recent survey was conducted during
July 1999 (Figure 4.1) and returned an estimate of 13,929 ± 471(s.e), a 40% increase on
the previous two surveys. The increase was interpreted as a large scale movement of

80
dugongs southwards into Shark Bay in response to loss of seagrass habitat following a
severe tropical cyclone to the north (Gales et al. 2004).
A key characteristic of all the surveys described above was that they were
conducted in winter. This is significant because all refer to the effect of low water
temperature on the distribution of dugongs. Dugongs prefer water warmer than
approximately 180C and so tend to shift westwards in the winter, away from key
summer habitat where water temperature drops below 180C, such as the Wooramel
Seagrass Banks. (Anderson 1986, this study Chapter 3) While differences in distribution
have been recorded among the winter surveys, they are largely explainable in terms of
water temperature.
It is clear that winter surveys of dugong distribution and abundance are
insufficient to characterise the habitat use by dugongs in Shark Bay across all seasons.
Some attempts have been made to conduct complementary summer surveys, but these
have been hampered by the difficult survey conditions and focused on an area on the
eastern side of Peron Peninsula known in advance to support significant numbers of
dugongs. Additionally, unfavourable conditions and observer inexperience meant that
the resultant estimates of populations were deemed underestimates (Marsh et al. 1994).
The objective of this study was to carry out the first whole bay, standardised aerial
survey of dugongs in Shark Bay during summer in order to determine if summer
distribution differs to winter, and if abundance differs between seasons. Using the
standardised format applied to the whole Bay as used in previous surveys, this survey
therefore provided the first data set to allow valid comparisons against winter
distribution and abundance estimates.

81
4.2 Methods
4.2.1 Aerial Surveys
The survey design and procedures used for this summer survey, as well as the
previous three winter surveys, are based on the protocols of Marsh and Saalfeld (1989)
and Marsh and Sinclair (1989) that were developed when standardized aerial surveys
commenced in Queensland and the Northern Territory. The number and location of
transects and blocks used for the calculation of regional density are as per Marsh et al.
(1994) and Preen et al. (1997) during their Shark Bay surveys to allow for a more direct
comparison between summer and winter.
The survey was conducted from 4th –10th February 2002 and was timed to occur
in the summer period when broad heat troughs regularly form off the WA coast. In
Shark Bay, these heat troughs may provide windows of up to several days of light
winds, creating ideal conditions for aerial surveys; surveys can only be with Beaufort
sea state less than or equal to 3 and at times when glare is minimal (early morning,
midday and late afternoon were avoided). Flying times were limited to a maximum of
approximately 3.5 hrs (based on fuel capacity and mass of aircraft load). When weather
conditions permitted two flights were conducted each day.
A Partenavia 68B aircraft was used for the survey. The aircraft was equipped
with pseudo wing-struts fitted with markers to delineate a transect 200 m wide on the
water surface either side of the aircraft when flown at 450 feet (137m) altitude. Shark
Bay was stratified into six blocks and within blocks parallel east-west transects were
spaced approximately 2.5 nautical miles apart, giving survey coverage of 7.8 - 9.1% of
the Bay. The previous (winter) surveys used lower survey intensity in the southern parts
of the Bay, due to expected low numbers of dugongs in the shallow, colder waters. As
we thought it more likely that significant numbers of dugongs would use these areas in
summer, we used the same transect spacing as in the remaining survey blocks.

82
Two observers operated on each side of the plane. The observers were visually
and aurally isolated from each other and recorded their observations into different tracks
of a two-track tape recorder. Separation of the observers allows estimation of perception
correction factors using a modified mark-recapture technique (Marsh and Sinclair 1989)
to adjust for animals that were available to be seen but were missed by the observers
(Table 4.1). Additionally, corrections were made for availability bias to adjust for
animals that were too far below the surface of the water to be seen as the aircraft passed
over (Table 4.1) (Marsh and Sinclair 1989). Due to their higher probability of being
seen, groups of dugongs larger than ten were stratified out of the population estimate.
When a large group was encountered it was circled until a reliable count was obtained
and this estimate was then added back into the population estimate for that block. Each
confirmed dugong observation was recorded against the location of the aircraft through
an onboard GPS system pre-programmed for each transect.
Final population size is estimated using the above parameters. The number of
groups of animals seen on each transect is multiplied by average group size and by the
perception and availability correction factors described above. These are then summed
within blocks and divided by survey intensity to estimate population for that block. Due
to differences in transect size, the variance is estimated using the ratio method (Jolly
1969, Caughley and Grigg 1981) to which are then added the estimated variances for
the average group size and the correction factors. Full details of variance estimation are
given in Marsh and Sinclair (1989).

83
Table 4.1. Perception and Availability Correction Factors for all Standardised Surveys Within Shark Bay. Survey Group size
(C.V)
Perception correction
factor estimate (C.V)
Availability correction
factor estimate (C.V)
Port Starboard
1989 1.39 (0.597) 1.04 (0.015) 1.13 (0.080) 2.75 (0.139)
1994 1.23 (0.467) 1.09 (0.020) 1.19 (0.039) 2.19 (0.137)
1999 1.294 (0.035) 1.015 (0.002) 1.012 (0.002) 2.4891 (0.116)
2002 1.218 (0.036) 1.068 (0.010) 1.035 (0.006) 2.394 (0.120)
4.2.2 Sea Surface Temperature Estimates.
Sea Surface Temperatures (SST) for Shark Bay were estimated from the
Advanced Very High Resolution Radiometer (AVHRR) sensors on board the NOAA
series of satellites. Estimated temperatures are considered accurate to within 0.5ºC on
64% of occasions and within 1ºC for 87% of the time (Pearce 1989). To allow
comparisons of dugong distributions relative to SST in summer and winter, AVHHR
images were obtained on a clear day for both this survey (9th February 2002) and the
1999 winter survey (9th July 1999). Images were imported into the GIS package
ArcView 3.2 with individual dugong observations matched with the corresponding
temperature at that location.

84
4.3 Results
4.3.1 Distribution and Abundance of Dugongs
During the February 2002 survey of Shark Bay a total of 687 dugongs were
observed. Of these, 386 were in small groups (<10 animals), with most sightings of
single animals (n=278) and the mean small group size was 1.22. The remaining 301
animals were seen in herds of 25, 32 and 244 (and hence were not included in the final
estimate), on the Wooramel seagrass bank on the eastern side of the bay (Figures 4.2
and 4.3).
The total dugong population for Shark Bay in February 2002 was estimated to be
11 021 +/-1357(se), with a density of 0.74 dugongs km�2. This is similar to the previous
winter surveys in 1989 and 1994, but less than the winter survey of 1999 (Table 4.2).
The frequency of calves was very low, only14 (or 3.6% of individuals) being recorded
in the groups of less than 10 individuals and none in the larger herds.

85
Figure 4.1. Distribution of Observed Dugongs in groups of less than 10 individuals, which are used in the final estimate calculation in the 2002 Summer Survey, overlaid on estimated Sea Surface Temperature.

86
Figure 4.2. Dugong Group Size Distributions in Shark Bay observed in the 2002 summer aerial survey overlaid on Bathymetry.

87
Table 4.2. Block and Total Estimated Dugong Population for Shark Bay 1989 – 2002. BLOCK AREA
(km2) ESTIMATED NUMBERS (+/- se)
1989 (Winter)
(Marsh et al. 1994)
1994 (Winter)
(Preen et al. 1997)
1999 (Winter)
(Gales et al. 2004)
2002 (Summer)
(This study)
0
1198
0
0
0
2629 (780)
1
1160
0
106 (66)
466 (193)
657 (115)
2
1631
0
0
0
505 (171)
3
2388
170 (68)
710 (288)
1837 (433)
4404 (881)
4
2726
4467 (819)
7852 (1401)
9222 (1673)
1245 (266)
5
812
4040 (1171)
599 (109)
293 (265)
278 (62)
6
2243
1293 (847)
798 (181)
411 (116)
634 (231)
7
2747
176 (90)
734 (222)
866 (328)
970 (263)
Total
14905
10146 (1665)
10529 (1464)
13929 (1652)
11021 (1275)
The distribution of dugongs in Shark Bay summer was markedly different from
that recorded during winter surveys, though the abundance was within the range of
previous estimates (Figs 4.1, 4.2, 4.3, Table 4.2). Compared to winter, the summer
distributions showed a shift from the deeper western part of the Bay (Block 4) to the
east (Block 3) and south west of the Bay (Block 0) (Fig 4.3). Significant numbers of
dugong were observed around Faure Island and the Wooramel Delta and 24% of the
total population was estimated to occur in the Henri Freycinet Harbour, southwest of
Peron Peninsula (Table 4.2).
The majority of dugongs were sighted in blocks 0 and 3, in the waters at the
southern ends of both the eastern and western gulfs of the Bay (Figure 4.3). Sea Surface
Temperatures throughout the bay were well above 180 C (Figures 4.2, 4.4), which is
believed to be the limit of dugong thermal tolerance (Anderson, 1986; Marsh et al.

88
1994; Preen et al. 1997) and a primary determinant of dugong distribution in Shark Bay
during winter. During summer, SST was consistently above 18° C. Few dugongs were
seen in southern end of Block 2 (Hamelin Pool), a hypersaline area compared with the
metahaline blocks 0 and 3 (CALM 1996). The proportion of dugongs observed outside
of the existing Shark Bay Marine Park boundary was 15.4% (Figure 4.2).
0
5
10
15
20
25
30
35
0 100 200 300 400
Dugong Sightings
Sea
Sur
face
Tem
pera
ture
0 C
Winter Observations
Summer Observations
Figure 4.4. Comparison of SST at locations of dugongs as observed during a winter (1999) survey and summer (this study) survey.

89
Table 4.3. Comparison of Temperatures and Depths at Which Dugongs Were Found Between Winter (1999) and Summer (2002) Surveys.
N Min. Max. Mean Std. Dev.
Summer – Temp (0C) 318 21.79 28.77 26.67 1.21 Winter – Temp (0C) 355 12.69 23.28 18.78 1.66 Summer Depth Range (m)
317 0-3 15-20 8.53 5.53
Winter Depth Range (m)
353 0-3 15-20 10.51 5.04
4.4 Discussion.
4.4.1 Summer distribution.
Previous studies have noted that in Shark Bay the summer distribution of dugongs
is different from the winter distribution and that there are concentrations in the south
west (Henri Freycinet Harbour) and east (Faure Sill, Wooramel Banks) of the bay in
summer (Prince et al. 1981, Anderson 1986). However, the importance of the Henri
Freycinet Harbour could not be fully assessed as previous efforts were hampered by
poor weather. This study confirms the overall pattern for summer distribution, and that
it is markedly different to that of the winter distribution.
The pattern of distribution that was observed is consistent with the interpretation
of previous studies (Prince et al. 1981; Anderson, 1986; Marsh et al. 1994; Preen et al.
1997). During the winter, the temperature profile of Shark Bay is a primary determinant
of dugong distribution, as areas such as Henri Freycinet Harbour and Faure
Island/Wooramel Banks fall well below 180C, which is perceived to be the lower
thermal limit of dugong tolerance (Anderson, 1986; Marsh et al. 1994; Preen et al.
1997). During this period dugongs concentrate in the deep, warm waters of the western
bay (Anderson 1986, Marsh et al. 1994; Preen et al. 1997; Gales et al. 2002).

90
With the removal of this constraint during the summer, distribution is probably
more reflective of other constraints, such as availability of preferred seagrass species.
The temperature profile of Shark Bay during the summer is far greater than 180C (Fig
4.1) and dugongs are more widespread. In particular, there is a distinct movement of
dugongs into shallow waters that are apparently too cold in winter (Table 4.3). Given
that these shallower waters are known to contain extensive seagrass beds (Anderson
1982, 1998; Walker 1988, 1989) of species known to be preferred dugong forage (e.g.
Halodule uninervis and Halophila ovalis), it would appear that the presence of suitable
food is the primary determinant of dugong distribution in summer.
That seagrass is the main determinant of dugong distribution is supported by the
lack of dugongs in the south east of the bay (Block 2). Although water temperature was
well above 180C within this area, few dugongs were observed. This region, known as
Hamelin Pool (Fig. 1.1), is a hypersaline environment as a result of limited oceanic
exchange due to the presence of the Faure Sill. Analysis of satellite imagery, aerial
photography and ground truthing has determined that due to this high salinity regime
throughout the pool and particularly at the lower end there is minimal seagrass (Bruce
1987; Bancroft and Davidson 2002). It is possible also that the water temperature was
too high in this shallow part of the bay. However, sea surface temperatures were similar
to those recorded in Henri Freycinet Harbour (Fig. 4.1).
While it has been shown that Henri Freycinet Harbour supported a significant
population of dugongs during the summer (Prince et al. 1981, Anderson 1986), we have
found that approximately 25% of the total Shark Bay dugong population were observed
here during this survey. To put this into an Australian perspective, this area of
approximately 30km x 40km (1200km2) houses a dugong population greater than that
estimated for the entire Southern Great Barrier Reef in 1994, an area of over 24000km2.
In terms of total numbers of dugongs within a small area it is rivalled only by Hervey
Bay (2200 dugongs in 1988 prior to the loss of seagrasses following flooding) (Preen
and Marsh 1995), the Starcke River region in far northern Queensland (approx 5300
dugongs in 2000) (Marsh and Lawler 2002) and central Torres Strait (3500 dugongs)
(Marsh et al. 2004). The density of dugongs in this area (2.2 dugongs/km2) is only
exceeded by Missionary Bay (2.6 dugongs/km2) in north Queensland (Marsh and

91
Lawler 2001) and the Starcke River region (3.35 dugongs/km2) (Marsh and Lawler
2002).
In Moreton Bay, the southern most limit of distribution on the Queensland coast
and where there exists a seasonal distributional shift, Lanyon (2003) recorded an
estimate of 503± 64 (s.e.) in July to 1019 ± 166 in January. That survey showed a
different dispersal pattern than Shark Bay with dugongs being more widespread during
the winter than in the summer (Lanyon 2003). Globally, there have been few
quantitative surveys done to determine dugong abundance to allow similar comparisons.
The only areas outside Australia known to support populations comparable to Shark
Bay are the Arabian Gulf and the Red Sea where quantitative surveys have been
conducted (Preen 1989). Preen’s 1989 survey of the Arabian Gulf (survey area 34 604
km2) returned an estimated 7307 (± s.e. 1302) animals, while his survey of the Saudi
Arabian waters of the Red Sea (survey area 22 370 km2) returned an estimated 1818 (±
s.e. 382) animals.
A key feature of the distribution recorded in this study is the clear separation into
two distinct groups of dugongs during summer. This survey confirmed the already
suspected importance of the area around Faure Island/Wooramel Banks in the Eastern
Gulf during the summer. Perhaps more importantly, however, it has also allowed us to
identify the area to the southwest of Peron Peninsula within Henri Freycinet Harbour
(Block 0) as a key area for the Shark Bay dugong population during this period. Given
that the waters in this area are deeper than those within the Eastern Gulf, there may be
somewhat different seagrass habitat composition and associated foraging behaviour
adaptations not dissimilar to what occurs during the winter months further out in the
Western Gulf. No analysis of seagrass composition of this area was undertaken during
this study, and as mentioned in chap 3 only one animal was tagged within this region,
but departed the area immediately after capture. Targeted seagrass habitat mapping
within this region is a recommended approach to address these questions, and if further
satellite tagging were to occur within Shark Bay this region should be focused on.

92
The implications of this summer distribution pattern are unknown, but may affect
population genetics for the Bay overall. Anderson (1997, 2002) observed that male
dugongs within South Cove (Figure 1.1), in the Eastern Gulf, exhibited Lek mating
activity. Whilst the exact timing of calving within Shark Bay is unknown, these males
were observed in South Cove from November through to January (Anderson 1997),
suggesting that the mating season is during the summer months. In addition to the Lek
mating activity, a large mating herd was observed in the vicinity of South Cove within
block 3 from the air during the summer previous to this survey (personal observations).
This herd comprised of more than 10 animals in a tight cluster, behaving significantly
differently from other herds of >10 dugongs within the vicinity and similar to mating
herds described by Preen (1989).
If this survey is indicative of the entire summer distribution pattern, with the
population essentially split between the gulfs and individual breeding age animals
exhibiting a degree of site fidelity, then there may be some level of reproductive
isolation. To address this issue would require either genetic analysis or extensive data
on the movements of individuals over summer. In the latter case, even if movements
between the two sub-populations were relatively common, they could easily be
overlooked because of the strong limitations on sample sizes imposed by the cost and
logistics of satellite tracking. However, movements over this scale (approx. 200 km)
have been recorded quite frequently in eastern Australia (Preen 2001) (Sheppard et al
2006) and in Shark Bay during winter as shown in Chapter 3 through satellite tracking.
4.4.2. Changing Abundance of Dugongs in Shark Bay.
Shark Bay has supported a globally significant dugong population at least since
quantitative aerial surveys commenced in 1989. It was also notable, until 1999, in
having an apparently stable population. The most significant outcome of the survey
conducted in 1999 by Gales et al. (2004) was an observed increase in the population of
approximately 40% (to 14 000 animals) while also recording declines in the sizes of
populations at Exmouth Gulf and Ningaloo Reef 350 km to the north. Their conclusion
was that the most plausible explanation for that result was that dugongs had moved

93
southwards from the Exmouth/Ningaloo area, most likely as a result of loss of seagrass
food resources following category five Cyclone Vance, which passed through Exmouth
Gulf a few months previous to that survey. A subsequent survey of the Pilbara coast
including Exmouth Gulf in April 2000 by Prince (2001) confirmed the scarcity of
dugongs with only 2 animals sighted during that survey. This 2002 survey has shown a
return to pre-1999 numbers. Based on results from previous winter surveys and the
hypotheses put forward by Gales et al. (2004), there appear to be four possible
explanations for this, including large scale die-off of dugongs, variation in survey
conditions, a northward return of animals which migrated down from Exmouth or an
annual seasonal migration of dugongs from regions to the north. These possible
explanations are discussed briefly below.
For this summer survey it was anticipated that conditions would be marginal,
given the experience of previous studies, particularly because of high winds. However
sea conditions for the most part were below Beaufort 2 or 3, consistent with the
previous winter surveys and observations of glare were consistent on both sides of the
aircraft. Additionally, estimates of group size and correction factors (which are based on
both conditions and personnel) are close to those for previous surveys (Table 4.1).
While some proportion of the estimated change in population between winter 1999 and
summer 2002 may result from differences in correction factors, they appear not to be
sufficient (Table 4.1) to explain the majority of the decrease.
Similarly, massive mortality is unlikely to explain the difference in 1999 and 2002
population estimates. If such mortality were due to a single event, then it would have
come to the attention of the numerous users of the Bay. If not, and the decline was due
to mortality at a constant rate, then it would have to be approximately 8-9% per year
and would lead to a catastrophic situation if it continued. Again, the death of 1000
dugongs per year is unlikely to go unnoticed. In the time between surveys a total of
three dugongs were reported dead of unknown causes (Holley unpublished data).
Similarly, any event or activity likely to cause such a decline should be easily identified.
Possibilities include indigenous hunting (e.g. Heinsohn et al. 2004; Marsh et al. 2004)
or seagrass die-off (e.g. Preen and Marsh 1995). However, no increase was recorded in

94
indigenous hunting over that period (Holley unpublished data) nor was there loss of
seagrass recorded at a scale that would cause such an effect.
The most likely theories explaining the reduction in dugong numbers that are
observed here is that of a northwards return of those animals that shifted south to Shark
Bay following Cyclone Vance or that these are movements indicative of a regular
exchange of animals during this time of year. Movements at these scales are
increasingly recorded when dugongs are tracked via satellite telemetry, as shown by the
movements from instrumented animals in Chapter 3 and the over 50 dugongs which
have recently been tracked on the east coast of Queensland (Sheppard et al. 2006).
Nearly one third of the Queensland animals ranged over distances greater than 100 km
and approximately 10% moved distances as great, or greater, than the distance between
Shark Bay and Ningaloo Reef (~500 km). Additionally, in other areas where repeat
aerial surveys have been conducted over large scales, similar trends are emerging with
respect to substantial increases and decreases over time scale too short to allow
reproduction to be an appropriate explanation. In the southern Great Barrier Reef,
surveys in 1986-87, 1994 and 1999 returned estimates of 3479, 1682 and 3993
respectively (Marsh and Lawler 2001). Similarly, estimates in Torres Strait ranged from
13300 in 1987 up to nearly 28000 in 1996 and down again to approximately 14000 in
2001 (Marsh et al. 2004).
Unfortunately an estimate of the corresponding dugong population of Exmouth
and Ningaloo cannot be given here as such a survey was beyond the scope of this study.
While no dedicated dugong survey has been conducted during the period of this survey,
dugongs have been sighted in increasing numbers within the Gulf over the previous two
years. Benthic surveys of Exmouth Gulf conducted for the assessment of enhancing
Panaeid prawn stocks, have noted a general increase in dugong presence since the
cyclone as well as quantifying the re-establishment of seagrass communities. Seagrass
species identified as returning include Halodule uninervis, Halophila spinulosa and H.
ovalis (Lonergan et al. 2003), all species known to be consumed by dugongs.

95
4.5 Conclusions and Management Implications.
The outcomes from this summer aerial survey have confirmed and quantified a
distinct seasonal shift in the distribution of the Shark Bay dugong population suspected
by previous authors and suggested by remote instrumentation (Chapter 3). The
abundance estimates obtained from this survey suggest that the size of this population
continues to remain at a consistent level indicating that the Shark Bay ecosystem
continues to be able to support and maintain one of the highest densities of dugongs in
the World. This population and the condition of Shark Bay may become increasingly
important, with recent studies showing that indigenous harvest of dugongs in Torres
Strait and Cape York Peninsula, the two other most important dugong populations in
Australia, are unsustainable (Heinsohn et al. 2004; Marsh et al. 2004).
The use of aerial surveys as a tool in determining the status of this dugong
population has to date been particularly relevant. The results for the winter surveys have
been informative for measuring fluctuations in this population and providing regular
population estimates. With the completion of this most recent survey, which has given a
snapshot of the population during a summer period, we are detecting general population
trends over time and gaining an understanding of how this population utilises Shark Bay
throughout the year.
The importance of these surveys is also highlighted through hypothesised and
measured large scale movements. For example, the impact of large scale catastrophic
events to the north indicates that the Shark Bay dugong population should not be
considered in isolation. Discussions have been held with managers (including the Great
Barrier Reef Marine Park Authority and the Australian Fish Management Authority)
and researchers on the east coast about how to deal with the issue of large-scale
movements of dugongs in the context of monitoring programs (Marsh and Lawler 2004;
Stokes 2004). As these refinements are developed, the local managers may wish to
consider them in the light of connections between dugong populations in Shark Bay and
the Pilbara region.

96
CHAPTER 5
CONCLUSIONS AND RECOMMENDATIONS
The results achieved from this study contribute to a greater understanding of the
ecology of the dugong within the Shark Bay World Heritage Area. This population of
dugongs, as shown from aerial surveys in this and previous work, is large and stable,
with consistently high abundance estimates. These surveys have also shown a
population density higher in Shark Bay than any other location where similar surveys
have been conducted. Maintenance of these estimates is partially attributed to the low
level of threatening activity to which dugongs and dugong habitat are exposed within
Shark Bay. The significance of this population for global dugong conservation,
therefore, cannot be underestimated, not only because of this species’ high biodiversity
value but also as a reference population for remaining populations elsewhere (Marsh et
al. 2002).
This study shows the distribution of dugongs in Shark Bay on both an individual
level and population level and throughout the year. It has also identified high use
locations and provides both fine- and large-scale habitat descriptions. The study has also
identified critical pathways and movement behaviours utilising new technologies and
techniques in a manner that minimised the impact on target and non-target animals.
Some impact was expected, however, and the degree and extent of these impacts were
measured as part of the study.

97
5.1 Scope
The major findings of the research, as detailed throughout the dissertation, are
given below in the context of the major objectives of the research, as described in
chapter 1.
1. Develop methods and techniques associated with the attachment,
application and release of remote transmitting and logging platforms to allow finer
scale resolution of dugong distribution (Chapter 2).
Prior to this study the application of remote recording and transmitting devices
had never been applied to measure dugong distribution and behaviour or to define
habitat usage within Shark Bay. Therefore, a critical first step in this process was the
development of attachment and release mechanisms for the units, as well as appropriate
capture and holding techniques for conditions in Shark Bay. In order to understand the
movements of animals over a large scale, PTT units (satellite transmitting only), which
had been successfully deployed on dugongs in Queensland (Marsh and Rathbun 1990),
were reused in this study. No changes were made to the attachment or release
mechanisms used in these units. These tags were effective in measuring individual
dugong movement patterns at low resolution but the release mechanism, which
consisted of a corrodible link within each tag, was inhibited by the salinity regime in
Shark Bay resulting in tags remaining attached for extended periods.
The use of GPS to measure fine scale movement pattern was the first application
for this type of instrument on this species. As the tags used in this study were data
loggers, compared with the PTT’s which remotely transmit location and behaviour data,
it was necessary to develop a release mechanism to allow for tag retrieval in order to
access data. This remote release mechanism, located in the harness and triggered
remotely, involved an electrolytic reaction dissolving a wire trace and resulting in the
harness detaching from the animal’s tail. As the GPS units had previously been untested

98
on dugongs in Shark Bay, a pilot study was undertaken to determine the effectiveness of
the release mechanism, as well as the units’ ability to effectively record an animal’s
position. This study showed that the units accurately recorded an animal’s position and
that tags could be retrieved remotely without creating any further disturbance to the
dugong. Both tag types were attached to dugongs using the same method that is by a
harness and three metre tether with the tag floating at the end. As the tags are only
capable of transmitting or logging a location when above the water surface, there was an
inherent bias towards shallow water distribution of recorded locations.
2. Apply these methods in the field as well as develop and refine
techniques for the appropriate ethical approach to the chase, capture and handling
of dugongs within the waters of Shark Bay (Chapter 2).
The capture method adopted for use in this study, termed the ‘chase and grab’ or
‘rodeo’ method (Lanyon et al. 2002), was appropriate for the waters of Shark Bay with
average chase to release times of 12 minutes throughout the year. Whilst it was the most
appropriate technique, there is no doubt that there was an impact upon the dugong from
this type of intensive activity. At the least, it should be anticipated that the chase and
capture procedure may alter an animal’s behaviour resulting in location shifts in the
immediate aftermath of capture, and possibly up to a few days after. It is therefore
critical that the information gathered during each chase and grab be maximised to
warrant the stresses placed upon the animal.
From a total of 18 successful deployments a combined dataset of approximately
10,000 locations from a 2 year period was generated. From the tag data the PTT
deployments were successful in determining the large scale movements of four animals
over a period of up to 11 months, whilst the GPS units functioned effectively in
recording fine scale movements over smaller temporal scales, but with greater
resolution and a higher recording rate than that of the PTT units. The number of study
animals and recorded locations from all tags are comparable from previous intensive
tracking studies performed on dugongs elsewhere within their range.

99
3. By use of developed remote recording techniques define large scale
seasonal movement pathways and fine scale critical habitat areas for individual
dugongs within the Shark Bay World Heritage Property (Chapter 3).
The effectiveness of remote recording devices being used to measure the
distribution and behaviour of species such as the dugong, which are by nature difficult
to observe, is shown in the large-scale distribution of animals over the seasonal year.
While a seasonal movement pattern had previously been determined in response to
shifts in water temperature (Prince et al. 1981; Anderson 1982a, 1986, 1998; Marsh et
al. 1994) the true extent of this pattern and the movement pathways have never been
fully understood.
From the PTT deployments four animals retained tags for periods long enough
to show a significant shift from core areas in the summer to a separate winter
distribution pattern. Whilst this distribution was within the confines of Shark Bay, three
of the four animals travelled up to 150km between each centre of seasonal activity. This
seasonal shift resulted in these animals, tagged within the eastern gulf, leaving the lower
reaches of this gulf coincident with a reduction in SST. Upon increase in SST all three
animals returned to the eastern gulf. In addition, the home ranges of these animals
overlapped. The fourth animal that retained a tag long enough to discern a seasonal
pattern was a female who remained within the confines of the eastern gulf though there
was a distinct shift to the north and into deeper waters, again coincident with a shift in
SST.
This seasonal shift in distribution for all tagged animals resulted in an average
increase in water depth in additional to the changes in SST. Although well within the
diving capability of dugongs (Chilvers et al, 2004), there is a clear change from an
average depth during summer of 3-5 m to an average depth of 5-10m during winter. It
was shown that in addition to this direct movement between seasonal centres of activity,
these animals also undertook exploratory return movements, possibly in search of
alternate forage sources.

100
Fine scale movements as determined from the GPS deployments showed that
within core centres of activity dugong movements are highly individualistic. These
movements also showed the importance of sheltered regions for dugong distribution,
with animals clearly spending the majority of time within those protected areas and
avoiding areas subject to high wind and fetch conditions. These deployments also
identified critical habitats outside of the preferred winter and summer core areas, such
as the Guischenault Point region.
Analysis of pathways showed that the Peron Peninsula is the dominant feature
governing the movement of animals between the two gulfs. Additionally, dugongs tend
to use the edges of seagrass banks when travelling within core areas, while travel
between core areas requires a direct route through the deeper areas in the centre of each
gulf. No tagged animal left the Shark Bay area as defined by the SBWHP boundary
during the course of this study. While some animals travelled considerable distances
between recorded locations, they were smaller than the maximum distances travelled by
dugongs tagged in Queensland and Indonesia, while average speeds of dugongs within
Shark Bay as determined from these deployments were comparable with speeds
travelled by other tagged dugongs at these other locations (De Iongh et al. 1998, Preen
1992, 1995a; Marsh and Rathbun 1990).
4. Through the use of ground-truthing and existing GIS datasets,
characterise the benthic habitat at those locations deemed to be of significance as
established through remote recording devices (Chapter 3).
The characterisation of habitat for dugongs within those areas determined as
high use from tag deployments could only be undertaken within the autumn-winter-
spring distribution pattern of the animals. These habitat surveys showed that the benthic
habitat at preferred locations differed markedly from that in locations animals were
moving through. The predominant species available for dugong forage at these times of
the year is the perennial species Amphibolis antarctica. It appears that the preferred
areas for forage is where this species occurs with a percentage cover of 30-80%, an
above ground biomass of 110-360 g m-2 in waters <5 m. These preferred forage sites

101
also occurred within 1000m of areas of deeper water. Coarser analysis of PTT
distribution against the GIS datasets showed that distribution was skewed towards areas
of dense perennial seagrass species.
5. Using established aerial survey techniques determine the summer
distribution pattern and abundance estimates for the entire Shark Bay population.
Compare with previous winter survey distribution patterns (Chapter 4).
The undertaking of a comprehensive aerial survey of dugongs during the
summer in Shark Bay had never previously been fully achieved. The results from this
survey, when compared with previous winter aerial surveys, confirmed that the Shark
Bay dugong population undertake a seasonal migration pattern consistent with that
exhibited by individual tagged animals. The total abundance estimate of 11 021+/-1
357(se), with a density of 0.74 dugongs km�2 represented a decrease of 30% since the
previous survey conducted in the winter of 1999 (Gales et al. 2004). That previous
survey gave an estimate 40% higher that the previous survey in 1994 (Preen et al.
1997), possibly the result of immigration of animals into Shark Bay from regions
further to the north in response to a cyclonic event. The subsequent decline from the
1999 survey to this survey may be as a direct consequence of these animals returning to
those regions further to the north.
The survey also showed a significant shift in distribution compared with the
results from the previous winter survey, again demonstrating that dugongs face changes
in sea surface temperature and depth in response to seasonal cues and consistent with
the result from tag deployments. In addition, the survey highlighted the importance of
the lower reaches of the western gulf of the Bay for animals during the summer and
suggests that during summer the entire population is split between the two gulfs.

102
6. Undertake this research within a framework for management
purposes, and establish relationships and foster ownership of results with
traditional Indigenous owners of Shark Bay (Chapter 5).
The key findings as summarised above were gathered in the context of providing
this information in a manner that may be directly utilised in a management framework
for dugong conservation within Shark Bay. The existing Shark Bay Marine Reserves
Management Plan (CALM, 1996) is due for a required 10-year review in 2006. The
review process will determine the level to which management objectives set out in the
plan have been achieved, and will assess any new information that may affect
management activities. In line with this process, results from this project should be
assessed and incorporated into the review. In addition information gained from this
study has been and should continue to be viewed in the assessment of proposed
development activities such as aquaculture applications.
The strategies, in order of priority, as listed in the current plan (CALM, 1996)
are to:
1. Control activities that may adversely impact on dugongs;
2. Encourage further research on dugong distribution, abundance, biology
and behaviour in the reserves;
3. Implement a long term monitoring program for dugongs;
4. Investigate and report on any observed cases of dugong breeding or
calving in the reserves; and
5. Encourage the wise management of important dugong habitats outside
the reserves.
The outcomes from this study have made significant progress to achieving a
number of the strategies as outlined above. By determining distribution patterns, core
areas of activity and habitat composition at areas significant to dugongs, a

103
comprehensive knowledge base now exists with which to make more informed
decisions regarding strategies 1 and 5. The undertaking of this program has been driven
by strategy 2 and the findings have, and will continue to, generate further applied
research that will provide ongoing effective conservation of the Shark Bay dugong
population.
5.2 Discussion and Recommendations
5.2.1 Seasonal Movements
The confinement of dugong movements to areas within Shark Bay over the time
frame of this study illustrates the importance of the entire SBWHP for the continued
conservation of this large and relatively stable population. However as postulated, there
may be movements on a large scale into and out of the Bay in response to large scale
disturbances such as cyclones and this has implications for dugong conservation, not
only within Shark Bay but the entire Pilbara region and given the significance of this
population, on a global scale. This seasonal pattern, as shown by remote monitoring of
individual animals and a thorough population survey during the summer months, is
triggered by fluctuation in water temperature. It could be that a reduction in the
availability of ephemeral species of seagrass is also a further trigger.
A drop in temperature below the dugong’s perceived thermal threshold of 180c,
identified by Anderson (1986), appears to be the major trigger for the majority of
animals to undertake this migration pattern, with animals migrating from the inner
regions of both gulfs to the outer areas of the Bay. However readings from a number of
GPS tag deployments and remotely sensed SST at those times and locations consistent
with PTT tag distribution would suggest that animals can remain in waters between 15-
180C for weeks at a time, and may actively search cooler waters for preferred forage.
The seasonal fluctuation in water temperature throughout Shark Bay results in
limited production, distribution and abundance of those species of ephemeral seagrasses
that form a significant component of dugong diet during the warmer summer months. In

104
a tropical environment in North Queensland it was shown that as the temperature drops
production of these species diminishes (Lanyon and Marsh 1995), so reducing the
availability of that forage type. Although, as has been shown in this study, dugongs feed
on the perennial species such as A. antarctica, particular during the winter months, they
appear to prefer the ephemeral species. If the ephemeral species are not available in
cooler waters, it appears to be more energetically beneficial for the dugongs to forage
upon the perennial species in warmer waters.
The distribution of animals during the winter months reflects the influx of
warmer waters associated with the southward flowing Leeuwin current. Associated with
this shift to the warmer oceanic waters is an increase in the average depth of water, and
the availability of only one species of seagrass, A. antarctica, for forage. It was
previously suggested that a deeper-water ephemeral species, Halophila spinulosa,
(Anderson, 1998) might be available during the winter periods. However this species
was not located in heavily foraged locations during this study. Surveys conducted for
Paneid prawns in Exmouth Gulf identified large areas of H. spinulosa where none had
been observed prior to cyclone Vance (Lonergan et al 2003). While dugongs may
selectively forage on H. spinulosa when available, it would not appear to be a
consistently reliable forage source from one winter to the next.
In a management context this seasonal pattern has implications for how human
based activity within the Bay is controlled throughout the year to avoid adverse impacts
upon the dugong population. Currently, boating activity peaks during the winter months
when lighter winds and cooler temperatures attract greater numbers of people to the
Bay, both recreationally and commercially. Among those activities that may directly
impact upon animals are boat strikes from recreational and commercial vessels, with
numerous vessels travelling at high speeds over shallow seagrass banks particularly
surrounding Dirk Hartog Island. While there are recorded incidents of boat strike as a
source of dugong mortality in Egypt, South East Asia and Australia (Marsh et al 2002)
there is no direct evidence of strikes occurring within Shark Bay. However from
interviews with local recreational fishers and assessment of 2 early-released GPS tags,
boat strikes appear to occur within the Bay, albeit infrequently. Currently there are
pamphlets and warning brochures advising boat operators to exercise caution when

105
travelling throughout the Bay (CALM 1996) and while these publications do provide
some guidance in operating vessels near dugongs they do not adequately give details on
those areas where the likelihood of encountering large numbers of animals at particular
times of the year. It is where these large herds are encountered over shallow banks that
the potential for strike is high
While this level of disturbance is currently regarded as low, establishing
education programs highlighting the seasonal movement pattern and the dugong’s
utilisation of distinct areas throughout the year would provide users of the marine park
with a more intimate knowledge on dugong movements and locations throughout the
year, highlighting areas where caution should be exercised and contribute to lower
levels of vessel and other types of disturbance, This would effectively facilitate
conservation of the population, as would the associated increase in the local community
and general public’s appreciation and awareness of dugong ecology within the Bay.
The major seasonal dugong migration pattern within Shark Bay can therefore be
used be used as a platform for education and interpretation programs focusing on
dugongs and dugong habitat within the SBWHP. An example of a seasonal movement
or migration pattern of another marine mammal in Western Australia that is highly
publicised and forms an existing education program is that focussing on the movements
along the West Australian coastline of the Humpback Whale (Megaptera
novaeangliae). Although on a significantly larger spatial scale than the movements of
dugongs within Shark Bay, the Humpback migration caters to a large tourism industry,
which in turn fosters a greater understanding and appreciation of this species’ ecology.
5.2.2 Defined Critical Habitat Areas
While the core areas of activity (Figures 3.5) were defined on the basis of
tracking data from a small proportion of the Shark Bay dugong population, there was
overlap in usage of areas amongst even this small sample. Anecdotal information from a
number of sources also indicates that these core areas of activity regularly contain large

106
numbers of dugongs. In addition there are likely to be other areas not identified within
this study that would regularly contain large numbers of animals for extended periods of
time. These core areas of activity are should be key focal points for managing human
activities, since inappropriate activity may impact on their availability to dugongs
throughout the year.
Working aquaculture leases, such as pearl and fish-farms, can reduce the
availability of these areas through direct exclusion, by placement of nets and lines
associated with lease production or through indirect exclusion by generation of noise
and vessel activity. Currently there are 15 licensed aquaculture leases within the
SBWHP with a further 5 in application (WA Dept of Fisheries 2002). The majority of
leases operate as pearl farms or grow out farms for tuna. Given the economic
importance of these activities not only to the region but to the state as a whole there is
serious consideration given to the all the likely impacts upon any of the listed criteria on
the Shark Bay World Heritage register before any lease application is declined.
However, in respect to dugong conservation, future granting of leaseholds may
contribute to the exclusion of dugongs from habitats that are just as desirable to
aquaculture activities as they are to dugongs.
A suggested management measure based on the results of this study would be
through the definition of these identified core areas as important dugong conservation
zones. By undertaking this step, greater protection can be afforded to dugongs by
ensuring that activities likely to impact directly on animals or indirectly through habitat
disturbance are minimised. In addition the measured habitat variables of these core
areas could form the basis for research into similar areas within the Bay. Through the
identification of additional sites and through the creation of further conservation zones,
based on the variables as shown to be of significance to dugongs within this study,
greater certainty in providing adequate dugong conservation could be achieved for this
population within Shark Bay.

107
5.2.3 Winter Habitat Resources
The habitat surveys demonstrate that in the winter distribution pattern the
predominant forage available for dugongs is the seagrass Amphibolis antarctica (Table
3.3). As discussed previously, Anderson (1994) suggested that dugongs may also forage
on deep-water Halophila spinulosa during the winter, but this species was not recorded
at winter usage site in this study, highlighting the significance of A. antarctica for
dugong forage requirements in Shark Bay. Effective conservation of this population of
dugongs requires ongoing access by dugongs to the forage areas identified within this
study as well as similar habitats throughout the bay. Hence, an appropriate management
measure would be the recognition and protection of A. antarctica beds within the
dugongs winter distribution range. Through the application of these protective measures
in the light of these Amphibolis antarctica meadows providing critical forage
requirements for dugongs, again further certainty would be provided for the long term
maintenance of this critical global dugong population
5.2.4 Dugong Distribution Outside of the Shark Bay Marine Park
The movement data from this study indicates that significant numbers of
dugongs move through areas outside the marine reserve boundaries. The Shark Bay
Marine Park is an effective conservation mechanism for dugongs and habitat within its
boundaries. Outside the marine park dugongs are subject to the same level of protection
both under the Wildlife Conservation Act 1950, but certain activities can occur outside
the existing marine park structure which may indirectly impact on dugongs.
The major threats to dugongs in Shark Bay outside of the marine reserves are
likely to derive from activities such as trawling, which can disturb seagrass habitat, and
seismic exploration, which can generation excessive noise levels to which dugongs may
react adversely. In addition, shipping movements and dredging activities are also likely
to impact indirectly upon dugongs outside of the reserve through the generation of noise
and habitat modification. The main application of the results of this study in terms of

108
revealing the wide ranging movement patterns of dugongs in the Bay is to illustrate that
appropriate conservation of this population requires protection measures that reflect the
dugong’s entire spatial distribution, and not just within the marine reserve boundaries.
The distribution of dugongs outside of this reserve structure was first identified
during the winter aerial surveys of 1994 and 1997. These surveys showed that during
these periods more than half of all observed dugongs occurred outside of the existing
Marine Park boundary (Preen et al. 1997). It was identified that because of the
importance of the Shark Bay dugong population consideration needed to be given to the
extension of the existing Shark Bay Marine Park boundary to match that of the Shark
Bay World Heritage Boundary, to adequately encompass all dugong distribution and
migration movements within the Bay (Preen et al. 1997). The existing reserve structures
for this population and that for dugongs to the north in Ningaloo Marine Park are
considered to be inadequate for the management of dugongs along Australia’s Indian
Ocean Coast (Preen 1998). In the light of these previous findings and those on the
distribution of individual animals (this study) and the dugong population (this study and
Gales et al., 2004), further consideration should be given to the extension of existing
reserve structure and the management of the Shark Bay and Exmouth/Ningaloo dugongs
as a single unit.
5.2.5 Future Intensive Dugong Research Programs
The capture and deployment procedure employed in tagging dugongs for this
program, as well as previous programs within Shark Bay, followed strict protocols
(Lawler et al. 2000; Gales and Holley, in prep.) to ensure the potential of injury or death
to the dugong was minimised. The chase and catch procedure employed during this
program is believed to represent the safest option for dugong capture (Lawler et al.
2000, Lanyon et al. 2002). Nevertheless it can be reasoned that the disturbance created
by this activity is probably acute. Although no dugong mortality events are known to
have occurred from the tagging procedures during this or previous programs in Shark
Bay, very little is known about the susceptibility of dugongs to mortality after capture.

109
Aside from the direct impact upon dugongs that were tagged, there were likely
to be other animals in the vicinity that may have been disturbed by this activity. The
combined disturbances created from the catch process on non-target as well as target
animals, particularly at identified catch locations over an extended period, may increase
this population’s susceptibility to mortality. Considered opinion amongst researchers
involved in this project, as well as similar projects elsewhere within the dugongs range,
is that the number of dugongs captured within discrete populations should be minimised
to reflect the size of that population. Management agencies and institutions involved in
dugong research within Shark Bay and elsewhere, should give greater consideration to
ethical issues in their permit approval for programs involving intensive chase and catch
procedures. Guidelines and protocols similar to those described in this study should be
rigorously adhered to.
5.2.6 Indigenous Collaboration and Global Implications
A critical component of the study was the collaboration with the local
Indigenous organisation, the Yadgalah Aboriginal Corporation (Inc.) (YAC). Members
of this group were actively involved throughout the study program, from initial
discussions on objectives and direction through to the studies conclusion. For Yadgalah
an important role was that played by the elder members of the community in relaying
information on where and when dugongs would occur. In many instances, the measured
dugong distribution pattern mirrored this anecdotal evidence. The presentation of the
movement data of individual animals to the community as the data were retrieved was
an important step in this collaboration.
The YAC identified the dugong project as important at both a community level
and in a broader Indigenous context. They see the project as a vehicle for increasing the
involvement of Indigenous communities in similar research programs that have broad
conservation and management objectives, particularly involving species such as
dugongs that have both high biodiversity and cultural values. The success of this

110
collaboration was most recently highlighted with the YAC winning the Indigenous
category of the National Landcare Awards (2004) for their involvement in the study.
This collaborative effort has implications for studies in other regions of Western
Australia, particularly the Kimberley region which was identified in the Status Report
for Countries and Territories (Marsh et al. 2002) as an area in which little is known
about dugong distribution and abundance and the impact of anthropogenic activities
such as traditional hunting upon these populations. The report states that detailed
studies, carried out in conjunction with local Indigenous communities, on the extent and
range of dugong movements should be undertaken as a high priority within this region.
The results achieved, and relationships established, as part of this study in Shark Bay,
would form an ideal foundation with which to develop a similar project in conjunction
with local indigenous groups within the Kimberley region of Western Australia.
Results from this study also have implications for dugong populations in regions
outside of Shark Bay and Australia. As shown, significant environmental events such as
cyclones may have consequences for dugong populations in addition to the impact from
day to day anthropogenic activities. Given the encroachment of humans into the coastal
zone in Australia and globally, as well as the unknown implications of changing
climatic regimes, species such as dugongs are facing greater threats to survival than at
any time previously. The costs of this study associated with remote tracking of dugongs
are out the realms of many governments and institutions throughout the dugongs range.
However the findings of habitat use and movement patterns based on variables such as
temperature and forage composition and distribution may be useful for identification
and delineation of dugong protection zones particularly at those locations at the
latitudinal limits of the dugong’s range.

111
REFERENCES
Anderson, P. K. (1982a). Studies of dugongs at Shark Bay, Western Australia. II.
Surface and subsurface observations. Australian Wildlife Research 9, 85-100.
Anderson, P. K. (1982b). Studies of dugongs at Shark Bay, Western Australia I.
Analysis of population size, composition, dispersion and habitat use on the basis
of aerial survey. Australian Wildlife Research 9, 69-84.
Anderson, P. K. (1986). Dugongs of Shark Bay, Australia - seasonal migration, water
temperature and forage. National Geographic Research 2, 473-90.
Anderson, P.K. (1989) Deliberate foraging on macro-invertebrates by dugongs.
National Geographic Research 5, 4-6.
Anderson, P.K. (1994). Dugong distribution, the seagrass Halophila spinulosa, and
thermal environment in winter in deeper waters of eastern Shark Bay, Western
Australia. Wildlife Research 21, 381-388.
Anderson, P.K. (1995). Scarring and photoidentification of dugongs (Dugong dugon) in
Shark Bay, Western Australia. Aquatic Mammals 21(3), 205-211.
Anderson, P. K. and R. M. R. Barclay (1995). Acoustic signals of solitary dugongs:
Physical characteristics and behavioural correlates. Journal of Mammalogy
76(4), 1226-1237.

112
Anderson, P. K. (1997).Shark Bay dugongs in summer. I: Lek mating. Behaviour
134(5-6): 433-462.
Anderson, P. K. (1998). Shark Bay dugongs (Dugong dugon) in summer. II: Foragers in
a Halodule-dominated community. Mammalia 62 (3), 409-425.
Anderson, P.K. (2002). Habitat, niche, and evolution of sirenian mating systems.
Journal of Mammalian Evolution 9, 55-98.
Aragones, L. and H. Marsh (2000). Impact of dugong grazing and turtle cropping on
tropical seagrass communities. Pacific Conservation Biology 5 (4): 277-288.
Bancroft, K. P., and. Davidson J. A. (2002). Field survey of marine ecological
communities in Shark Bay Marine Park and Hamelin Pool Marine Nature
Reserve (18-29 March 2002). Marine Conservation Branch, Department of
Conservation and Land Management. Perth, Western Australia.
Bayliss, P. (1986). Factors affecting aerial surveys of marine fauna, and their
relationship to a census of dugongs in the coastal waters of northern Australia.
Australian Wildlife Research 13, 27-37.
Bayliss, P., and Freeland, W.J. (1989). Seasonal distribution and abundance of dugongs
in the Western Gulf of Carpentaria. Australian Wildlife Research 16, 141-149.

113
Bruce, E. (1987). Application of spatial analysis to coastal and marine management in
the Shark Bay World Heritage Area, Western Australia. PhD Thesis. University
of Western Australia, Perth.
Bryden, M., Marsh, H. and Shaughnessy, P. (1998). Dugongs, Whales, Dolphins and
Seals; A guide to the sea mammals of Australasia. Sydney, Allen and Unwin.
de Iongh, H. H., Langveld, P. and Van Der Wal, M. (1998). Movement and home
ranges of dugongs around the Lease Islands, East Indonesia. Marine Ecology
19(3), 179-193.
Deutsch, C. J., Bonde, R.K., and Reid, J.P. (1998). Radio tracking Manatees from land
and space: Tag design, implementation, and lessons learned from long term
study. Marine Technology Society 32(1), 18-29.
Department of Conservation and Land Management (1996). Shark Bay Marine
Reserves Management Plan 1996-2006. Management Plan No. 34. Department
of Conservation and Land Management for the National Parks and Nature
Conservation Agency. Perth, Western Australia.
Domning, D. (1982). Evolution of Manatees; A speculative history. Journal of
Palaeontology 56(3), 599-619.

114
Fancy, S. G., Pink, L.F., Douglas, D.C., Corby, C.H., Garner, G.W., Amstrad, S.C. and
Regelling, W.L. (1988). Satellite Telemetry: A New Tool for Wildlife Research
and Management. US Dept. Interior. Fish and Wildlife Service Research.
Publication(172).
Flamm, R. O., Ward, L. I., and Weigle, B.L. (2001). Applying a variable-shape spatial
filter to map relative abundance of manatees (Trichechus manatus latirostris).
Landscape Ecology 16. (279-288).
Gales, N., McCauley, R., Lanyon, J., and Holley, D.K. (2004). Change in abundance of
dugongs in Shark Bay, Ningaloo and Exmouth Gulf, Western Australia:
evidence for large-scale migration. Australian Wildlife Research 31, 283-290.
Heinsohn, G. E., Wake, J.A., Marsh, H. and Spain, A.V. (1977). The dugong in the
seagrass ecosystem. Aquaculture 12, 235-47.
Heinsohn, G. E., Marsh, H. and Anderson, P.K. (1979). Australian dugong. Oceans
12(3), 48-52.
Heinsohn, R., Lacy, R.C., Lindenmayer, D.B., Marsh, H., Kwan, D.K., and Lawler,
I.R. (2004) Unsustainable harvest of dugongs in Torres Strait and Cape York
(Australia) waters: two case studies using population viability analysis. Animal
Conservation 7, 417-425.
Hilton-Taylor, C. (Compiler). 2000. The 2000 Red List of Threatened Species. IUCN,
Gland, Switzerland.

115
Hooge, P. N., Eichenlaub, W.M. (1997). Animal movement extension to ArcView.
Anchorage, AK, USA, Alaska Biological Science Centre, U.S. Geological
Survey.
Hooge, P. N., Eichenlaub, W.M., Solomon, E.K. (1999). Using GIS to analyse animal’s
movements in the marine environment. Gustavus, Alaska Biological Science
Centre: 17.
Husar, S. (1978). Dugong dugon. Mammalian Species 88, 1-7.
Kirkman, H. (1996). Baseline and monitoring methods for seagrass meadows. Journal
of Environmental Management 47, 191-201.
Lanyon, J. M. (1991). The nutritional ecology of the dugong (Dugong dugon) in tropical
north Queensland. Ph.D. Thesis, Monash University, Melbourne.
Lanyon, J. M. and Marsh, H. (1995). Temporal changes in the abundance of some
tropical intertidal seagrasses in North Queensland. Aquatic Botany 49, 217-237.
Lanyon, J. M., Sneath, H.L., Kirkwood, J.M., and Slade, R.W. (2002). Establishing a
mark-recapture program for dugongs in Moreton Bay, south east Queensland.
Australian Mammalogy 24, 51-56.
Lanyon, J. M. (2003). Distribution and abundance of dugongs in Moreton Bay,
Queensland, Australia. Wildlife Research 30, 397-409.

116
Logan, B.W., Read, J.F., and Davies, G.R. (1970). History of carbonate sedimentation
Quaternary Epoch, Shark Bay. In: Logan et al. Am. Assoc. Petrol. Geol. Memoir
13, 38-84.
Loneragan NR, Kenyon RA, Crocos PJ, Ward RD, Lehnert S, Haywood MDE, Arnold
S, Barnard R, Burford M, Caputi N, Kangas M, Manson F, McCulloch R, Penn
JW, Sellars M, Grewe P, Ye Y, Harch B, Bravington M, Toscas P. (2003).
Developing techniques for enhancing prawn fisheries, with a focus on brown
tiger prawns (Panaeus esculentus) in Exmouth Gulf. Final Report on FRDC
Project 1999/222. CSIRO, Cleveland. pp.287.
Lotek (1999). Marine DGPS System, User's Manual. St. John's, Lotek Marine
Technologies Inc: 44.
Marsh, H., Channells, P.W., Heinsohn, G.E., Morissey, J., (1982). Analysis of stomach
contents of dugongs of Queensland. Aust. Wildlife Research 9, 55-67.
Marsh, H., Heinsohn, G.E., and Marsh, L.M. (1984). Breeding cycle, life history and
population dynamics of the dugong, Dugong dugon (Sirenia: Dugongidae).
Australian Journal of Zoology 32, 767-788.
Marsh, H., and Saalfeld, W.K. (1989). Distribution and abundance of dugongs in the
northern Great Barrier Reef Marine Park. Australian Wildlife Research 16, 429-
440.

117
Marsh, H., and Sinclair, D.F. (1989). Correcting for visibility bias in strip transect aerial
surveys of aquatic fauna. Journal of Wildlife Management 53, 1017-1024.
Marsh, H. and Rathbun, G. B. (1990). Development and application of conventional and
satellite radio tracking techniques for studying dugong movements and habitat
use. Australian Wildlife Research 17, 83-100.
Marsh, H., and Saalfeld, W.K. (1990). The distribution and abundance of dugongs in the
Great Barrier Reef Marine Park South of Cape Bedford. Australian Wildlife
Research 17, 511-524.
Marsh, H., and Saalfeld, W.K. (1991). The status of the dugong in Torres Strait. In:
‘Sustainable Development of Traditional Inhabitants of the Torres Strait
Region’. Lawrence, D. and T. Cransfield-Smith (Eds). pp 187-194. Great Barrier
Reef Marine Park Authority Workshop Series 10.
Marsh, H. a. Lefebvre., L.W. (1994). Sirenian status and conservation efforts. Aquatic
Mammals 20, 155-70.
Marsh, H., Prince, R.I.T., Saalfeld, W.K., and Shepherd, R. (1994). The distribution and
abundance of the dugong in Shark Bay, Western Australia. Australian Wildlife
Research 21, 149-61.

118
Marsh, H. (1995). Fixed-width Aerial Transects for Determining Dugong Population
Sizes and Distribution Patterns. Population Biology of the Florida Manatee.
(Eds.) O. Shea, T. J., Ackerman. B. B., and Percival, H. F. 56-62.
Marsh, H., Eros, C., Corkeron, P., and Breen, B. (1999). A conservation strategy for
dugongs: implications of Australian research. Marine Freshwater Research 50:
979-90.
Marsh, H. (2000). Evaluating management initiatives aimed at reducing the mortality of
dugongs in gill and mesh nets in the Great Barrier Reef World Heritage Area.
Marine Mammal Science 16(3), 684-94.
Marsh, H., and Lawler, I.R. (2001). Dugong distribution and abundance in the southern
Great Barrier Reef Marine Park and Hervey Bay: Results of an aerial survey in
October-December 1999. Report to Great Barrier Reef Marine Park Authority.
Townsville, Australia.
Marsh, H., and Lawler, I.R. (2002). Dugong distribution and abundance in the northern
Great Barrier Reef Marine Park. November 2000. Report to the Great Barrier
Reef Marine Park Authority. Townsville, Australia.
Marsh, H., Penrose, H., Eros., and Hughes, J. (2002). Dugong: Status Report and Action
Plans for Countries and Territories., UNEP: 164pp.

119
Marsh, H., and Lawler, I.R. (2004). Review and refinement of the most appropriate and
cost effective method and priorities for determining dugong population numbers
and distribution in Queensland and the Torres Strait. Report to Great Barrier
Reef Marine Park Authority and the Australian Fish Management Authority.
Townsville, Australia.
Marsh, H., Lawler, I.R., Kwan, D.K., Delean, S., Pollock, K.H., and Alldredge, M.
(2004). Aerial surveys and the potential biological removal technique indicate
that the Torres Strait dugong fishery is unsustainable. Animal Conservation 7,
435-43.
Masini, R. J., Anderson, P.K. and McComb, A.J. (2001). A Halodule-dominated
community in a subtropical embayment: physical environment, productivity,
biomass, and impact of dugong grazing. Aquatic Botany 71, 179-197.
Pearce, A.F., Prata, A.J., and Manning, C.R. (1989). Comparison of NOAA/AVHRR-2
sea-surface temperatures with surface measurements in coastal waters.
International Journal of Remote Sensing 10, 37-52.
Preen, A. (1989). Observations of mating behaviour in dugongs (Dugong dugon).
Marine Mammal Science 5, 382-387.
Preen, A. (1992). Interactions between dugongs and seagrasses in a subtropical
environment. PhD thesis. James Cook University of North Queensland,
Townsville, Australia: 392pp.

120
Preen, A. (1995). Impacts of dugong foraging on seagrass habitats: Observational and
experimental evidence for cultivation grazing. Marine Ecology Progress Series
124, 201-213.
Preen, A., and Marsh, H. (1995). Response of dugongs to large-scale loss of seagrass
from Hervey Bay, Queensland, Australia. Australian Wildlife Research 22, 507-
519.
Preen, A. R., Marsh, H., Lawler, I. R., Prince, R. I. T., and Shepherd, R. (1997).
Distribution and abundance of dugongs, turtles, dolphins and other megafauna in
Shark Bay, Ningaloo Reef and Exmouth Gulf, Western Australia. Australian
Wildlife Research 24, 185-208.
Preen, A. R. (1998). Marine Protected Areas and dugong conservation along Australia's
Indian Ocean coast. Environmental Management 22(2), 173-181.
Preen, A.R., (2001). Dugongs, boats, dolphins and turtles in the Townsville-Cardwell
region and recommendations for a boat-traffic management plan for the
Hinchinbrook Dugong Protection Area. Great Barrier Reef Marine Park
Authority Research Publication No.67, Townsville, Australia.
Prince, R. I. T., Anderson, P.K., and Blackman, D. (1981). Status and distribution of
dugongs in Western Australia. In: Marsh, H. (ed.), ‘The Dugong: proceedings of
a seminar/workshop held at James Cook University 8-13 May 1979’. James
Cook University of North Queensland, Townsville, Australia. pp 67-87.

121
Prince, R.I.T., I.R. Lawler and H.D. Marsh. (2001). The distribution and abundance of
dugongs and other megavertebrates in Western Australian coastal waters
extending seaward to the 20m isobath between North West Cape and the
DeGrey river mouth, Western Australia, April 2000. Report for Environment
Australia.
Reid, J. P., Easton, D., Tucker, R., White, D. (1999). A Data-Logging GPS Tag for
Sirenians. 13th Biennial Conference on the Biology of Marine Mammals,
Hawaii.
Reid, P. J., Butler, S.M., Easton, D.E., and Deutsch, C.J. (2001). Fifteen years of
success in tracking manatees with the Argos system: an overview of programs
and techniques. Proceedings of the Argos International Users Conference, 23-25
April 2001., Annapolis, Maryland.
Reynolds, J.E. and Odel, D.K. (1991) Manatees and Dugongs. Facts on File Inc., New
York.
Seaman, D. E. and R. A. Powell (1996). An evaluation of the accuracy of kernel density
estimators for home range analysis. Ecology 77(7), 2075-2085.
Service Argos, Inc. (1996) Users Manual. Landover, MD: Service Argos, Inc. 176pp.
Sheppard J. K., Preen A. R., Marsh H., Lawler I. R., Whiting S. D. and Jones R. E.
(2006). Movement heterogeneity of dugongs, Dugong dugon (Müller) over large
spatial scales. Journal of Experimental Marine Biology & Ecology in press

122
Stokes, T. (2004). Report of a Workshop on Future Aerial Surveys for dugongs
in Queensland and the Torres Strait. In: CRC Reef, Townsville.
Stejneger, J. (1887) How the great northern seacow (Rytina) became exterminated.
American Naturalist 21, 1047-1054.
Walker, D. I., Kendrick, G. A., and McComb, A.J. (1988). The distribution of seagrass
species in Shark Bay, Western Australia, with notes on their ecology. Aquatic
Botany 30, 305-317.
Walker, D. I. (1989). Seagrass in Shark Bay - the Foundations of an Ecosystem. In:
Larkum, A. W. D., McComb, A.J., Shepherd, S.A., (Eds.), ‘Seagrasses: A
Treatise on Seagrass With Special Reference to the Australian Region’. Elsevier,
Amsterdam, pp. 182-210.
Whiting, S. D. (2001). Regular foraging by dugongs on rocky reefs in the Darwin region
of Northern Australia: Implications for conservation. Abstract submitted to the
Southern Hemisphere Marine Mammal Conference, Philip Island, Australia,
May 29-June 1, 2001.
Worton, B. J. (1989). Kernel methods for estimating the utilisation distribution in home-
range studies. Ecology 70(1), 164-168.

123
APPENDIX
1.1 Metadata statement for combined PTT and GPS acquired positions.
DATASET
Title Movements and Community Based Conservation of Shark Bay Dugongs.
Custodian Department of Conservation and Land Management (CALM)
Jurisdiction Western Australia
DESCRIPTION
Abstract This dataset consists of location points obtained from GPS data loggers and Satellite Platform Transmitter Terminals (PTT) attached to dugongs to determine large and fine scale movement patterns within the Shark Bay World Heritage Property (SBWHP). The length of deployment for each animal ranges from 10days to 11months with all locations falling within the boundaries of the SBWHP.
Search
Word(s)
Dugong (Dugong dugon), remote tracking, movement patterns, Platform Transmitter Terminals (PTT), Geographical Positioning Systems (GPS).
Geographic
Extent
Name(s)
or
Geographic
Extent
Polygon(s)
Shark Bay IMCRA region

124
DATA CURRENCY
Begin Date The earliest date at which the phenomena in the dataset actually occurred. 22/03/2000
End Date Last date for a record contained within the dataset. 09/08/2002
DATASET STATUS
Progress Status of progress of creation of dataset. Complete
Maintenance
& Update
Frequency
Frequency of changes or additions made to dataset after its initial completion. As required
ACCESS
Stored Data
Format Description of format in which data is stored by the custodian.
DIGITAL ArcView shapefile in the datum WGS 1984
Available
Format Type Description of available format types of dataset.
DIGITAL ArcView 3.2 shapefile - alldugong_wgs84.shp
NON - DIGITAL Paper base maps containing raw information.
Access
Constraint Any restrictions or legal prerequisites that may apply to the use of the dataset.
Data available for external use subject to transfer fee and license conditions. Data is not to be distributed without authorisation from CALM.
DATA QUALITY
Lineage Dataset history.
1. Determination of dugong movement patterns within the SBWHP from GPS and satellite telemetry represents a first for the use of this technology in Western Australia. Methods for data capture and tag attachment developed by CALM in conjunction with members of the Shark Bay Yadgalah Aboriginal Corporation, James Cook University and Edith Cowan University. Full description of methods in Gales and Holley (2002).
2. Accumulated data has been obtained from three different types of location units attached to the tail flukes of dugongs. Satellite-monitored platform transmitter terminals

125
(PTT) and generation II combination GPS/PTT units .(Telonics, Mesa, Arizona). Geographical Positioning System (GPS) data loggers (Lotek Engineering Inc. Ontario, Canada).
3. PTT's are transmitter platforms which transmit signals at regular intervals which are received by Service Argos receivers aboard NOAA polar-orbiting environmental satellites. At least two satellites are simultaneously in service on sun-synchronous, polar, circular orbits at 850 km altitude, providing full global coverage. Locational accuracy is dependant on signal strength and satellite coverage.
4. Attributes recorded from the PTT units include: Location class, date, time-Western Standard Time and Lat/Long in milliseconds .
5. The GPS units each with an eight channel receiver, log a units position from pulses received from the navstar series of satellites. The GPS units can be user programmed to obtain a position at a rate of between 5min-6hours
6. Attributes recorded on the Lotek GPS units include: Lat/Long-in milliseconds, Date, Time-Western Standard Time, Temperature- Degrees Celsius. Attributes on the Telonics Gen II units include; Lat/Long-in milliseconds, date, Time-Western Standard Time, Temperature- Degrees Celsius.
7. An accuracy attribute is recorded against each location.
8. Deployment and retrieval dates for each unit type are listed below: PTT UNIT : DATE DEPLOYED DATE RETREIVED 5519 22/03/2000 11/12/2000 5065 22/03/2000 05/04/2000 5534 23/03/2000 25/10/2000 5536(1) 23/03/2000 04/04/2000 5536(2) 06/04/2000 28/05/2000 5535 23/03/2000 23/10/2000 5537 22/03/2000 16/08/2000 1311 16/05/2001 01/07/2001
GPS UNIT: FIX ACQUISITION RATE
8001 15/08/2000 05/10/2000 15 MINUTES 8002 16/08/2000 04/10/2000 15 MINUTES 8003 16/08/2000 03/10/2000 15 MINUTES 8004 17/08/2000 21/09/2000 15 MINUTES 8005 17/08/2000 01/10/2000 15 MINUTES 7301 18/09/2001 28/09/2000 20 MINUTES 7001 20/09/2001 28/09/2001 20 MINUTES 0803 21/03/2002 11/05/2002 15 MINUTES 0807 17/06/2002 25/07/2002 15 MINUTES 0606 18/06/2002 09/08/2002 15 MINUTES 0602 19/06/2002 04/07/2002 15 MINUTES 0603 20/06/2002 02/07/2002 15 MINUTES
1. Data are downloaded from the GPS tags in the datum WGS 1984 via a link unit, in a comma delimited file (.csv) Data are then converted into a text delimited file (.txt) and imported in Arcview and converted into shapefiles (.shp). For the PTT units, data are retrieved from service Argos in a spreadsheet format in the datum WGS 1984, then imported into Arcview in the same manner and converted into shapefiles.
Positional Assessment of the closeness of the location of spatial objects in the dataset in relation to their true positions on the earths surface after all transformations have been carried out.

126
Accuracy 1. The two unit types used in determining dugong locations have a varying degree of spatial resolution. PTT units have a degree of error dependant upon satellite strength and location. For PTT location accuracy, service Argos has a location class attribute. The resolution associated with each class is listed below.
CLASS ESTIMATED ACCURACY IN LATITUDE AND LONGITUDE.
3 <150m 2 150m - 350m 1 350m - 1000m 0 >1000m
2. With the removal of Selective Availability the GPS units’ positional accuracy is now estimated at <10.
Attribute
Accuracy
Attributes for this dataset are consistent with CALMs Marine Information System standards and values are drawn directly from original download files (see additional
metadata).
Logical
Consistency
All points are labelled correctly with values drawn from the original download files (see additional metadata).
Completeness The data set will be upgraded as more units are deployed and retrieved.
CONTACT INFORMATION
Contact
Organisation
Department of Conservation and Land Management, Marine Conservation Branch.
Contact
Position
Marine Zoologist.
Mail Address
1
.

127
Mail Address
2
Suburb or
Place or
Locality
State or
Locality 2
WA
Country Australia
Postcode
Telephone
Facsimile
Electronic
Mail Address
METADATA DATE
Metadata Date January 2003
ADDITIONAL METADATA
Additional
Metadata
Original download files have been burnt to CD and are held in the CALM\MCB\MIS CD library, 47 Henry street Fremantle, Western Australia, 6160 Holley, D.K. (2003) Distribution and movement patterns of Shark Bay dugongs: Data report. Unpublished Report. Department of Conservation and Land Management.

128
1.2 Metadata statement for dugong sightings acquired during aerial survey.
DATASET
Title Summer Distribution and Abundance of Megafauna of the Shark Bay Region.
Custodian Department of Conservation and Land Management (CALM)
Jurisdiction Western Australia
DESCRIPTION
Abstract
This dataset consists of points representing the distribution of megafuana as observed during an aerial survey conducted within the Shark Bay World Heritage Property during February 2002. The data was generated as part of a summer distributional aerial survey conducted to supplement a series of winter surveys conducted in the SBWHP to determine population abundance and distribution of dugongs. A full description of the procedures used for the collection of sightings can be found in:
Marsh, H., and Sinclair, D.F. (1989a). An experimental evaluation of dugong and sea turtle aerial survey techniques. Australian Wildlife Research 16, 639-50.
Marsh, H., and Sinclair, D.F. (1989b). Correcting for visibility bias in strip transect aerial surveys of aquatic fauna. Journal of Wildlife Management 53, 1017-24.
This data was acquired as part of the dugong monitoring program for the management of the Shark Bay Marine Park and Hamelin Pool Marine Nature Reserve. In addition to recording of dugong sightings, sightings of cetaceans and turtles were also recorded.
Search
Word(s)
Geographic
Extent
Name(s)
or
Geographic
Extent
Polygon(s)
Shark Bay (SBY) and Zuytdorp (ZUY) IMCRA Regions

129
DATA CURRENCY
Begin Date 4/2/2002
End Date 15/2/2002
DATASET STATUS
Progress Completed
Maintenance
& Update
Frequency As required
ACCESS
Stored Data
Format DIGITAL ArcView shapefile, Geographic, Geocentric Datum of Australia 1994 (GDA94). NONDIGITAL Paper base maps showing sighting locations.
Available
Format Type DIGITAL ArcView 3.2 shapefile
Access
Constraint
Data available for external use subject to transfer fee and licence conditions. Data is not to be distributed without authorisation from CALM. Contact CALM's database administrator for further details.
DATA QUALITY
Lineage
1. Location data for all sightings of megafauna observed during the 2002 summer aerial survey of Shark Bay recorded as waypoints within aircrafts GPS system in the datum WGS84.
2. Combined location data for all megafauna over entire survey period entered into Excel, then imported into ArcView 3.2 and converted to three point shapefiles representing dugongs, cetaceans and turtles.
3. Polyline shapefiles representing transects and survey blocks were also imported into each active theme.
4. Data datum transferred from WGS84 to AGD84 then to GDA 94 using the change datum functionality of the extension 'CALM Added Functionality v 2001' in ArcView 3.2.
Positional The locations of all sightings as recorded from this survey represent the summer distribution patterns of marine megafauna within the SBWHP. All sightings were recorded from an aircraft flying at a nominal height of 137m and a ground speed of 100 knots along

130
Accuracy predetermined transects. Observations of animals were recorded if they occurred in relation to transect markers attached to the plane. The equivalent transect width on the water at the flying height is 200m either side of the aircraft. Sighting locations are therefore approximate only and represent an animals position at during the flight period.
Attribute
Accuracy
Methods used in the collection of this dataset are consistent with data collected from previous aerial surveys conducted in the Shark Bay World Heritage Property. Flight paths were flown as close as possible to marked transects, however turbulence may have resulted in slight variations along each transect .
Logical
Consistency
Attribute values have been checked and validated for consistency, and checked for logic in relation to attribute names. All attributes that require values have been assigned values.
Completeness The dataset is complete as at the date of this metadata statement.
CONTACT INFORMATION
Contact
Organisation Department of Conservation and Land Management, Marine Conservation Branch.
Contact
Position Marine Zoologist
Mail Address
1 47 Henry Street
Mail Address
2
Optional element where mailing address of contact position is longer than that which would ordinarily go on one line.
Suburb or
Place or
Locality Fremantle
State or
Locality 2 Western Australia
Country Australia
Postcode 6160
Telephone 08 9336 0121

131
Facsimile 08 9430 5408
Electronic
Mail Address [email protected]
METADATA DATE
Metadata
Date 12/08/2002
ADDITIONAL METADATA
Additional
Metadata
See report- Holley, D.K. (2002) Summer distribution and abundance of Shark Bay dugongs, February 2002.Data Report MMS/SBY/SBA-61/2002. (Marine Conservation Branch, Department of Conservation and Land Management, Fremantle, Western Australia. (Unpublished report).
Copyright © 2022 FDOKUMEN