Habitat use and foraging ecology of a batoid community in Shark Bay, Western Australia
270
Florida International University FIU Digital Commons FIU Electronic eses and Dissertations University Graduate School 3-29-2011 Habitat Use and Foraging Ecology of a Batoid Community in Shark Bay, Western Australia Jeremy Vaudo Florida International University, jeremy.vaudo@fiu.edu Follow this and additional works at: hp://digitalcommons.fiu.edu/etd is work is brought to you for free and open access by the University Graduate School at FIU Digital Commons. It has been accepted for inclusion in FIU Electronic eses and Dissertations by an authorized administrator of FIU Digital Commons. For more information, please contact dcc@fiu.edu. Recommended Citation Vaudo, Jeremy, "Habitat Use and Foraging Ecology of a Batoid Community in Shark Bay, Western Australia" (2011). FIU Electronic eses and Dissertations. Paper 367. hp://digitalcommons.fiu.edu/etd/367
-
Upload
independent -
Category
Documents
-
view
0 -
download
0
Transcript of Habitat use and foraging ecology of a batoid community in Shark Bay, Western Australia

Florida International UniversityFIU Digital Commons
FIU Electronic Theses and Dissertations University Graduate School
3-29-2011
Habitat Use and Foraging Ecology of a BatoidCommunity in Shark Bay, Western AustraliaJeremy VaudoFlorida International University, [email protected]
Follow this and additional works at: http://digitalcommons.fiu.edu/etd
This work is brought to you for free and open access by the University Graduate School at FIU Digital Commons. It has been accepted for inclusion inFIU Electronic Theses and Dissertations by an authorized administrator of FIU Digital Commons. For more information, please contact [email protected].
Recommended CitationVaudo, Jeremy, "Habitat Use and Foraging Ecology of a Batoid Community in Shark Bay, Western Australia" (2011). FIU ElectronicTheses and Dissertations. Paper 367.http://digitalcommons.fiu.edu/etd/367

iii
FLORIDA INTERNATIONAL UNIVERSITY
Miami, Florida
HABITAT USE AND FORAGING ECOLOGY OF A BATOID COMMUNITY IN
SHARK BAY, WESTERN AUSTRALIA
A dissertation submitted in partial fulfillment of the
requirements for the degree of
DOCTOR OF PHILOSOPHY
in
BIOLOGY
by
Jeremy Vaudo
2011

ii
To: Dean Kenneth Furton choose the name of dean of your college/school College of Arts and Sciences choose the name of your college/school
This dissertation, written by Jeremy Vaudo, and entitled Habitat Use and Foraging Ecology of a Batoid Community in Shark Bay, Western Australia, having been approved in respect to style and intellectual content, is referred to you for judgment.
We have read this dissertation and recommend that it be approved.
_______________________________________ John P. Berry
_______________________________________
James W. Fourqurean
_______________________________________ Philip K. Stoddard
_______________________________________
Joel C. Trexler
_______________________________________ Michael R. Heithaus, Major Professor
Date of Defense: March 29, 2011
The dissertation of Jeremy Vaudo is approved.
_______________________________________ choose the name of dean of your college/school Dean Kenneth Furton choose the name of your college/school College of Arts and Sciences
_______________________________________ Interim Dean Kevin O’Shea University Graduate School
Florida International University, 2011

iii
ACKNOWLEDGMENTS
The work presented in this dissertation would not be possible if it was not for the
help of a multitude of people.
I thank my parents for putting up with and fostering my dream of being a marine
biologist, supporting me over the years, and collecting all my publications. Maybe
someday they will actually read them.
I owe a great deal to my Master’s adviser Chris Lowe. His guidance early in my
graduate career set me up to run with the opportunities I was presented at FIU. It was
also Chris that suggested I contact Mike Heithaus about doing a PhD, which brought me
to where I am today.
I thank Philip Stoddard, Joel Trexler, Jim Fourqurean, and Michael McClain for
help in the early shaping of this project and providing a critical eye to my work. Aaron
Wirsing also provided valuable discussion and advice, while in the field. I also thank
John Berry for joining my committee after Michael McClain took a position in Europe.
Working at a remote field site on the opposite side of the world presents a variety
of challenges. I am indebted to Robert Black, Rory McAuley and Kim Gray of Fisheries
Western Australia, the staff of Western Australia’s Department of Environment and
Conservation’s Shark Bay District, the Shark Bay Fish Factory, Monkey Mia Wildsights
and everyone at the Monkey Mia Dolphin Resort for logistical support. Derek
Burkholder dealt with most of the organizational details for field assistants.
I thank everyone that helped in the collection of data, especially Dave Heithaus,
Kirk Gastrich, Meagan Dunphy-Daly, Pat Heithaus, Ray Heithaus, Jordy Thomson and
Derek Burkholder.

iv
Special thanks also go to Dave Heithaus, Capes, Scotty, Sparks, Grant, Sylvie,
Sam, Nicola, Cally, Shannon, Chris and the people of Shark Bay, who kept me sane
during the long and often windy field seasons.
Finally, I would like to thank Mike Heithaus. He believed in my project ideas and
allowed me to run with them. In my time at FIU, Mike has been not only a mentor, but
also a friend. Mike always made me feel like a colleague rather than just a student.
Funding was provided by a Florida International University Presidential
Fellowship and Dissertation Year Fellowship to J. Vaudo, a grant from the National
Geographic Expeditions Council to J. Vaudo, National Science Foundation grants
OCE0526065 and OCE0745606 to M. Heithaus, and Florida International University’s
College of Arts and Sciences. Permission to use Chapters II, III and IV were provided by
Elsevier Inc., Springer, and Inter-Research, respectively.
With kind permission from Springer Science+Business Media: Marine Biology,
Spatiotemporal variability in a sandflat elasmobranch fauna in Shark Bay, Australia,
volume 156, 2009, pages 2579–2590, Jeremy J. Vaudo and Michael R. Heithaus.

v
ABSTRACT OF THE DISSERTATION
HABITAT USE AND FORAGING ECOLOGY OF A BATOID COMMUNITY IN
SHARK BAY, WESTERN AUSTRALIA
by
Jeremy Vaudo
Florida International University, 2011
Miami, Florida
Professor Michael R. Heithaus, Major Professor
Worldwide declines in populations of large elasmobranchs and the potential
cascading effects on marine ecosystems have garnered considerable attention. Far less
appreciated are the potential ecological impacts of changes in abundances of small to
medium bodied elasmobranchs mesopredators. Crucial to elucidating the role of these
elasmobranchs is an understanding of their habitat use and foraging ecology in pristine
conditions. I investigated the trophic interactions and factors driving spatiotemporal
variation in abundances of elasmobranch mesopredators in the relatively pristine
ecosystem of Shark Bay, Australia. First, I describe the species composition and seasonal
habitat use patterns of elasmobranch mesopredator on the sandflats of Shark Bay.
Juvenile batoids dominated this diverse community and were extremely abundant in
nearshore microhabitats during the warm season. Stomach content analysis and stable
isotopic analysis revealed that there is a large degree of dietary overlap between common
batoid species. Crustaceans, which tend to be found in seagrass habitats, dominated
diets. Despite isotopic differences between many species, overlap in isotopic niche space
was high and there was some degree of individual specialization. I then, investigated the

vi
importance of abiotic (temperature and water depth) and biotic (prey and predator
abundance) factors in shaping batoid habitat use. Batoids were most abundant and tended
to rest in shallow nearshore waters when temperatures were high. This pattern coincides
with periods of large shark abundance suggesting batoids were seeking refuge from
predators rather than selecting optimal temperatures. Finally, I used acoustic telemetry to
examine batoid residency and diel use of the sandflats. Individual batoids were present
on the sandflats during both the warm and cold seasons and throughout the diel cycle,
suggesting lower sandflat densities during the cold season were a result of habitat shifts
rather than migration out of Shark Bay. Combined, habitat use and dietary results
suggest that batoids have the potential to seasonally impact sandflat dynamics through
their presence, although foraging may be limited on the sandflats. Interestingly, my
results suggest that elasmobranch mesopredators in pristine ecosystems probably are not
regulated by food supply and their habitat use patterns and perhaps ecosystem impacts
may be influenced by their predators.

vii
TABLE OF CONTENTS CHAPTER PAGE PREFACE................................................................................................................1 I. INTRODUCTION ...................................................................................................2 Literature Cited ........................................................................................................6 II. HIGH TROPHIC LEVEL CONSUMERS: ELASMOBRANCHS.........................7 Synopsis ...................................................................................................................8 Introduction..............................................................................................................8 Elasmobranchs As Prey .........................................................................................10 Elasmobranchs As Predators..................................................................................17 Competition And Resource Partitioning................................................................28 Metabolism, Digestion And Feeding Periodicity...................................................31 Elasmobranch Impacts On Prey And Community Structure .................................38 Elasmobranch Impacts On Nutrient Dynamics......................................................44 Elasmobranchs As Facilitators Of Trophic Interactions........................................46 Trophic Interactions of Elasmobranchs In Coastal Ecosystems ............................47 Conclusions............................................................................................................66 Literature Cited ......................................................................................................68 III. SPATIOTEMPORAL VARIABILITY IN A SANDFLAT
ELASMOBRANCH FAUNA IN SHARK BAY, AUSTRALIA..........................99 Abstract ................................................................................................................100 Introduction..........................................................................................................101 Materials And Methods........................................................................................102 Results..................................................................................................................107 Discussion............................................................................................................113 Acknowledgments................................................................................................120 Literature Cited ....................................................................................................135 IV. DIETARY NICHE OVERLAP IN A NEARSHORE ELASMOBRANCH
MESOPREDATOR COMMUNITY ...................................................................140 Abstract ................................................................................................................141 Introduction..........................................................................................................141 Materials And Methods........................................................................................144 Results..................................................................................................................150 Discussion............................................................................................................156 Acknowledgments................................................................................................165 Literature Cited ....................................................................................................177

viii
V. MICROHABITAT USE OF MARINE MESOCONSUMERS IN A THERMALLY HETEROGENEOUS HABITAT: EXPLOITING THERMAL VARIATION OR TRADING OFF FOOD AND PREDATION RISK?...........................................................................................182
Abstract ................................................................................................................183 Introduction..........................................................................................................184 Materials And Methods........................................................................................187 Results..................................................................................................................191 Discussion............................................................................................................195 Acknowledgments................................................................................................204 Literature Cited ....................................................................................................212 VI. DIEL AND SEASONAL VARIATION IN THE USE OF A
NEARSHORE SANDFLAT BY A RAY COMMUNITY IN A NEAR PRISTINE SYSTEM ...........................................................................................219
Abstract ................................................................................................................220 Introduction..........................................................................................................221 Materials And Methods........................................................................................222 Results..................................................................................................................225 Discussion............................................................................................................230 Acknowledgments................................................................................................235 Literature Cited ....................................................................................................243 VII. SUMMARY.........................................................................................................248 Literature Cited ....................................................................................................253 VITA................................................................................................................................255

ix
LIST OF TABLES
TABLE PAGE CHAPTER III 1 Seasons of occurrence and capture records for elasmobranch species
recorded on the nearshore sandflats of Shark Bay, Australia ..............................121 2 Logistic regression for factors influencing the presence of elasmobranch
on transects. Reference conditions for the odds ratios are the warm season and sand microhabitat ..........................................................................................124
3 Logistic regression for factors influencing the presence of the giant
shovelnose ray (Glaucostegus typus) on transects. Reference condition for the odds ratios is the sand microhabitat ...............................................................125
4 Logistic regression for factors influencing the presence of reticulate/pink
whipray (Himantura uarnak/H. fai) on transects. Reference conditions for the odds ratios are the warm season and sand microhabitat ................................126
CHAPTER IV 1 Summary of isotopic metrics and body size range for elasmobranchs
caught in the nearshore waters of Shark Bay, Western Australia. Size ranges for Glaucostegus typus, Rhynchobatus laevis, Carcharhinus cautus, and Chiloscyllium punctatum are total lengths. Size ranges for all other species are disc widths. Mean values with different letters are significantly different at p < 0.05..............................................................................................166
2 Estimated trophic positions and median (5th – 95th percentile) contributions of basal resource pools to elasmobranchs caught in the nearshore waters of Shark Bay, Western Australia. Resource pool values used for the MixSIR model are shown below. Filter feeding bivalves were used as a proxy for the phytoplankton resource pool and considered one trophic level higher than the basal level (i.e., trophic level 2) .............................................................168
3 Importance of dietary components (± SD) based on frequency of
occurrence (%FO), numerical abundance (%N), gravimetric abundance (%W), and index of relative importance (%IRI) .................................................169

x
4 Pairwise comparisons of the diets for Glaucostegus typus, Himantura fai, and H. uarnak. Values for Schoener’s index of overlap (%N / %W / %IRI) are in the lower half of the matrix. Bold values are considered biologically significant (>0.60). P-values from null model simulations are in the upper half of the matrix. Bold values indicate that corresponding overlap values in the lower matrix are higher than those predicted by chance............................172
CHAPTER V 1 Logistic regression of the factors influencing the presence of giant
shovelnose rays Glaucostegus typus on transects. Predicted probabilities per microhabitat for selected temperatures and tidal heights are presented as follows: nearshore/sand/patchy .......................................................................205
2 Logistic regression of the factors influencing the presence of whiprays
Himantura uarnak and H. fai on transects. Predicted probabilities per microhabitat for selected temperatures and tidal heights are presented as follows: nearshore/sand/patchy............................................................................206
3 Proportion (95% confidence interval) of resting giant shovelnose rays
Glaucostegus typus, reticulate whiprays Himantura uarnak, and pink whiprays H. fai for each season and microhabitat. Sample size is presented after the slash .......................................................................................................207

xi
LIST OF FIGURES
FIGURE PAGE CHAPTER III 1 The study was conducted in the Eastern Gulf of Shark Bay, Australia (a,b).
c) The shallow flats of Cape Rose were divided up into six 10-m wide belt transects representing three microhabitats (nearshore sand - black, subtidal sand – gray, and patchy seagrass - white)............................................................127
2 Clear waters and calm winds provide excellent sighting conditions on the
Cape Rose Flats. Pictured is a group of five pink whiprays (Himantura fai). A buried whipray (H. uarnak or H. fai) is located in the lower left corner .........128
3 Relative abundances of elasmobranch taxa on the shallow flats of Shark
Bay. Species richness increases during the warm season although there is little change in the relative abundance of most species .......................................129
4 Non-metric multidimensional scaling plot of community similarity of the elasmobranch fauna of a nearshore sandflat. Warm x nearshore transects tended to show greater community similarity than other season x microhabitat combinations. Open symbols are the cold season and filled symbols are the warm season. Triangles, circles, and squares are nearshore, sand, patchy microhabitats, respectively .............................................................130
5 The influence of microhabitat and season on overall elasmobranch density.
Densities are back-transformed from values used in GLZ with 95% CI. White and gray bars represent the cold and warm seasons, respectively. Bars with different letters are significantly different at P <0.05 .........................131
6 The influence of microhabitat on giant shovelnose ray (Glaucostegus
typus) density. Densities are back-transformed from values used in GLZ with 95% CI. Bars with different letters are significantly different at P <0.05.................................................................................................................132
7 The influence of season on reticulate/pink whipray
(Himantura uarnak/H. fai) density. Densities are back-transformed from values used in GLZ with 95% CI. Bars with different letters are significantly different at P <0.05 .........................................................................133

xii
8 Variation in relative abundances of elasmobranchs with increasing distance from shore. Lines represent individual species’ deviations from a homogeneous distribution across all species. Positive values indicate higher abundances of animals than expected, while negative values indicate fewer animals than expected................................................................................134
CHAPTER IV 1 δ13C – δ15N biplot of Shark Bay’s nearshore elasmobranch community
(mean ± SE) in isotopic niche space. See Table 1 for statistical contrasts among species ......................................................................................................173
2 Size of isotopic niche space (total area: mean ± SE) from bootstraps in
relation to the number of individuals sampled for the Shark Bay’s nearshore elasmobranch community. Himantura fai ≤65cm DW is shown in gray to increase its visibility ............................................................................174
3 All elasmobranch individuals plotted in isotopic niche space. Black lines
outline the convex hulls of the individual species groups illustrating a high degree of overlap in isotopic niche space ............................................................175
4 Centroid distance, nearest neighbor distance, and neighbor distance (mean
distance ± SE) for Shark Bay’s nearshore elasmobranch community. Values with different letters are significantly different at p < 0.05 .....................176
CHAPTER V 1 The study site on the Cape Rose Flats, Shark Bay, Western Australia. The
inset shows the location of the Cape Rose Flats within Shark Bay. The study site was divided into six transects representing nearshore (black), sand (gray), and patchy (white) microhabitats. Black circles represent the location of temperature data loggers....................................................................208
2 Contour graphs of predicted a) giant shovelnose ray Glaucostegus typus
and b) whipray Himantura spp. densities (animals ha-1) with tidal height, water temperature, and microhabitat....................................................................209
3 Seasonal temperatures (mean ± standard error) per microhabitat for the
time period between 23 April 2007 and 14 October 2007. Bars with different letters are significantly different at P < 0.01.........................................210

xiii
4 Conceptual model illustrating how use of sandflat habitats can result in decreased growth rates for rays. When large shark abundance is high, rays shift from productive habitats, which allow for large rations, to safe sandflat habitats with limited prey resources, resulting in smaller rations. Sandflat habitats are also warmer, resulting in increased metabolic costs and possibly lower assimilation efficiency ..........................................................211
CHAPTER VI 1 This study was conducted on the Cape Rose Flats, Shark Bay, Western
Australia. White dots represent acoustic receiver locations for Array 1 (21 May 2006 – 9 November 2006). Black dots are the locations of acoustic receivers for Array 2 (27 January 2007 – 8 February 2008). Asterisks indicate receivers with temperature loggers ........................................................236
2 Spatial and diel variation in total detection time (mean ± SE) of reticulate
whiprays, Himantura uarnak within Array 1. Bars with different letters are significantly different at P < 0.05 ..................................................................237
3 Spatial and diel variation in reticulate whiprays, Himantura uarnak, length
of stay (mean ± SE) in Array 1. Bars with different letters are significantly different at P < 0.05 .............................................................................................238
4 Effect of season and time of day on total detection time (mean ± SE) of
giant shovelnose rays, Glaucostegus typus, within Array 1. Bars with different letters are significantly different at P < 0.05.........................................239
5 Effect of time of day and microhabitat on total detection time (mean ± SE)
of giant shovelnose rays, Glaucostegus typus, within Array 1. Bars with different letters are significantly different at P < 0.05.........................................240
6 Spaial and diel variation in giant shovelnose ray, Glaucostegus typus,
length of stay (mean ± SE) in Array 1. Bars with different letters are significantly different at P < 0.05 ........................................................................241
7 Spatial, seasonal, and diel variation in water temperatures (mean ± SE) on
the Cape Rose sandflat between 12 February 2007 and 31 December 2007. Bars with different letters are significantly different at P < 0.05 ........................242

1
PREFACE
The following chapters have been published or accepted for publication and have been
formatted for those publications.
CHAPTER II
Vaudo JJ, Heithaus MR (in press) High trophic level consumers: elasmobranchs. In Wolanski E, McLusky D (Eds), Treatise on Estuarine and Coastal Science: Trophic Structure of Estuaries and Coasts. Elsevier Inc.
CHAPTER III
Vaudo JJ, Heithaus MR (2009) Spatiotemporal variability in a sandflat elasmobranch fauna in Shark Bay, Australia. Mar Biol 156:2579-2590
CHAPTER IV
Vaudo JJ, Heithaus MR (2011) Dietary niche overlap in a nearshore elasmobranch mesopredator community. Mar Ecol Prog Ser 425:247-260

2
CHAPTER I
INTRODUCTION

3
Most elasmobranchs are upper trophic level predators (Cortés 1999, Ebert and
Bizzarro 2007). As such, it is often assumed that they play an important role in
community structure through top down control (but see Heithaus et al. 2010). Although
large-bodied sharks (>2m total length), as apex predators, have been shown to induce
behavioral changes in their prey (e.g., Heithaus et al. 2007) and have been suggested to
influence population sizes of potential prey (e.g., Myers et al. 2007, Ferretti et al. 2010),
the vast majority of elasmobranchs are not apex predators and their role in marine
ecosystems is less clear than that of apex predators.
These small to medium-sized elasmobranchs are both predators and prey
(mesopredators) and, therefore, provide a link between apex predators, such as large
sharks, and lower trophic levels. Thus, they may play an important ecological role in
transmitting indirect effects of top predators (e.g., Heithaus et al. 2008, 2010).
Unfortunately, elasmobranch mesopredators have not received much attention in the
literature. One group in particular that has been largely neglected is the batoids (skates
and rays), despite the fact that there are more species of batoids than all other groups of
elasmobranchs combined (Ebert and Compagno 2007). Despite a relatively scant
literature, several studies have suggested that batoids may be important components of
soft-bottom and vegetated marine systems, not only through predation, but also
bioturbation (Orth 1975, VanBlaricom 1982, Thrush et al. 1991, 1994, Peterson et al.
2001, Myers et al. 2007).
Given the lack of information on the ecological role of batoids and their potential
to be influential in marine systems, the goal of this dissertation is to provide information
on the habitat use and foraging ecology of a batoid community in a relatively pristine

4
ecosystem. This information is necessary to provide the blueprint of future studies on the
ecological role of batoids because it identifies key interspecific interactions of the batoid
community and the spatiotemporal scale at which they might occur. I conducted this
work in Shark Bay, Western Australia, because the bay has a large population of batoids
and as a World Heritage Site, there are minimal anthropogenic impacts. In addition,
Shark Bay has served as a model system for studying the ecological role of the tiger
shark, Galeocerdo cuvier (Heithaus et al. 2007), a known batoid predator, allowing for
examination of the interactions of batoids and their predator.
I begin by reviewing the trophic ecology of elasmobranchs in coastal systems in
Chapter II. I consider their interactions as predators, prey, and competitors. A version of
this chapter is scheduled to appear in “Treatise on Estuarine and Coastal Science: Trophic
Structure of Estuaries and Coasts.”
Chapter III introduces the field system by describing the elasmobranch
community of Shark Bay’s nearshore sandflats. I explore seasonal patterns of
microhabitat use by the most common batoids on the sandflats. A version of this chapter
appears in the journal, Marine Biology.
In Chapter IV, I examine the foraging ecology of rays including the potential of
dietary niche partitioning within the batoid community. I used traditional stomach
content analysis and stable isotopic analysis to assess resource overlap. A version of this
chapter appears in the journal, Marine Ecology Progress Series.
Chapter V explores the factors that influence the microhabitat use by batoids.
Previous work on elasmobranchs has suggested that variation in water temperature may
play a critical role in foraging habitat use. In Shark Bay, the sandflats are thermally

5
dynamic, allowing for tests of behavioral thermoregulation theory as well as traditional
foraging models based on the abundance of prey and presence of predators.
In Chapter VI, I extend the studies of population-level habitat use during daytime
to individual habitat use patterns across the diel cycle. I use acoustic telemetry to
elucidate diel habitat use and residency to the study site by individual rays from several
species and compare these data to patterns observed using boat-based surveys.
Overall, this work provides valuable information on the habitat use and foraging
ecology of an understudied and potentially important guild of predators in soft-bottomed
communities. This information will guide future work on the role of batoids in marine
systems.

6
LITERATURE CITED
Cortés E (1999) Standardized diet compositions and trophic levels of sharks. ICES J Mar Sci 56:707–717
Ebert DA, Bizzarro JJ (2007) Standardized diet compositions and trophic levels of skates
(Chondrichthyes: Rajiformes: Rajoidei). Environ Biol Fish 80:221–237 Ebert DA, Compagno LJV (2007) Biodiversity and systematics of skates
(Chondrichthyes: Rajiformes: Rajoidei). Environ Biol Fish 80:111–124 Ferretti F, Worm B, Britten GL, Heithaus MR, Lotze HK (2010) Patterns and ecosystem
consequences of shark declines in the ocean. Ecol Lett 13:1055–1071 Heithaus MR, Frid A, Vaudo JJ, Worm B, Wirsing AJ (2010) Unraveling the ecological
importance of elasmobranchs. In: Carrier JC, Musick JA, Heithaus MR (eds) Sharks and Their Relatives II: Biodiversity, Adaptive Physiology, and Conservation. CRC Press, Boca Raton, FL, pp 607–633
Heithaus MR, Frid A, Wirsing AJ, Worm B (2008) Predicting ecological consequences
of marine top predators declines. Trends Ecol Evol 23:202–210 Heithaus MR, Wirsing AJ, Frid A, Dill LM (2007) Behavioral indicators in marine
conservation: lessons from a pristine seagrass ecosystem. Isr J Ecol Evol 53:355–370
Orth RJ (1975) Destruction of eelgrass, Zostera marina, by the cownose ray, Rhinoptera
bonasus, in the Chesapeake Bay. Chesapeake Sci 16:205–208 Peterson CH, Fodrie FJ, Summerson HC, Powers SP (2001) Site-specific and density-
dependent extinction of prey by schooling rays: generation of a population sink in top-quality habitat for bay scallops. Oecologia 129:349–356
Thrush SF, Pridmore RD, Hewitt JE, Cummings VJ (1991) Impact of ray feeding
disturbances on sandflat macrobenthos: do communities dominated by polychaetes or shellfish respond differently? Mar Ecol Prog Ser 69: 245–252
Thrush SF, Pridmore RD, Hewitt JE, Cummings VJ (1994) The importance of predators
on a sandflat: interplay between seasonal changes in prey densities and predator effects. Mar Ecol Prog Ser 107:211–222
VanBaricom GR (1982) Experimental analyses of structural regulation in a marine sand
community exposed to oceanic swell. Ecol Monogr 52:283–305

7
CHAPTER II
HIGH TROPHIC LEVEL CONSUMERS: ELASMOBRANCHS

8
Synopsis
Coastal elasmobranchs tend to be upper level predators, which may exert top-down
impacts on the systems they inhabit, but surprisingly little is known of their trophic
ecology. In this chapter I review the trophic interactions of coastal elasmobranchs as
prey, predators, and competitors. I also explore factors that affect these relationships, and
elasmobranch interactions within key coastal habitats.
Introduction
Elasmobranch fishes are conspicuous predators in many coastal ecosystems. They do not
exhibit the diversity of forms and feeding morphology of teleosts, but elasmobranchs
occupy a number of potentially ecologically important roles including those of benthic
predators – highlighted by the dorso-venterally flattened batoids (rays and skates) – and
large-bodied and long-lived predators – typified by the sharks. Recent reviews have
suggested that sharks, rays, and skates can play an important role in the dynamics of
coastal communities, but a critical role is not universal (Heithaus et al. 2008, 2010).
Several factors continue to hamper our ability to fully document and understand the
ecological role of elasmobranchs. First, despite the presumed importance of
elasmobranchs in marine systems, our understanding of elasmobranch trophic
relationships remains limited. For many species we have very limited knowledge of
elasmobranch diets, especially species that are not captured in commercial fisheries. For
those species for which I have dietary data, in relatively few cases have studies
investigated the variation in these diets in space and time, which is critical to
understanding the ecological importance of these fishes. Also, although we traditionally

9
think of trophic interactions being limited to situations in which a predator kills its prey,
ecologists now recognize that non-consumptive effects of predators (e.g., anti-predator
behavior, predator-induced habitat shifts) may be equally important to direct predation
(e.g., Werner and Peacor 2003, Schmitz et al. 2004, Heithaus et al. 2008, Creel and
Christensen 2008). Studies of elasmobranchs have generally overlooked the importance
of these nonconsumptive effects.
Enhancing the importance of studies of elasmobranch trophic interactions, yet
greatly complicating them, is the well documented decline of many large-bodied shark
species (e.g., Musick et al. 1993, Baum et al. 2003, Baum and Myers 2004, Shepherd and
Myers 2005, Clarke et al. 2006, Robbins et al. 2006, Myers et al. 2007, Heithaus et al.
2007a, Ferretti et al. 2008), in response to growing demand for shark fins and meat and
high levels of shark bycatch in many fisheries. In fact, it may already be too late to
document the major trophic interactions and impacts elasmobranchs might have exerted
under natural conditions in many locations. However, large-bodied sharks are not the
only elasmobranch taxa with populations in flux. Some areas that have experienced
dramatic declines in large-bodied sharks have seen increases in medium and small sized
elasmobranchs, presumably as a result of decreases in predator and competitor
populations (e.g., Myers et al. 2007, van der Elst 1979, Heithaus et al. 2010). In other
locations, medium and small-bodied coastal elasmobranchs have decreased as a result of
targeted fisheries and bycatch (Stobutzki et al. 2002).
Given the ongoing numerical changes in many elasmobranch populations
worldwide and the potential impacts on their prey and communities, developing our
understanding of the trophic relationships of sharks and other elasmobranchs is crucial to

10
our knowledge of how marine systems function. In this chapter I consider some of the
factors influencing the trophic interactions of elasmobranchs, how these interactions may
affect community processes and survey elasmobranch species most likely to play
important roles in a variety of coastal ecosystems.
Elasmobranchs As Prey
Although they are often considered apex predators, most elasmobranchs are
relatively small bodied (<1m in length) and as mid-size predators are not truly top
predators in systems. In fact these individuals and also the juveniles of large coastal
species are often at risk from larger predators, especially large sharks (Heithaus 2004).
These elasmobranch “mesopredator” species and life-history stages, however, could be
important in coastal systems both through direct effects on their prey and habitats (see
below) and in transmitting indirect top-down effects of their predators in a manner
similar to terrestrial mesopredators (Heithaus et al. 2008, Ritchie and Johnson 2009).
With a few possible exceptions, however, it is unlikely that energy flowing through
elasmobranch mesopredators supports a large biomass of large predators.
Some large sharks appear to be important and consistent predators of
elasmobranchs in coastal systems. Cortés (1999) calculated the standardized diet
composition for 149 species of sharks from 23 families. Of the species examined,
chondrichthyans (elasmobranchs and chimaerids) were found in the diets of 51 species
and 13 families. For 15 species at least 10% of the diet was chondrichthyan and at least
25% chondrichthyan in 7 species [great hammerhead shark Sphyrna mokarran (41.7%);
broadnose sevengill shark Notorynchus cepedianus (40.7%), bignose shark Carcharhinus
11
altimus (36.7%), great white shark Carcharodon carcharias (35.7%), bull shark
Carcharhinus leucas (35.4%), bramble shark Echinorhinus brucus (33.3%) sand tiger
shark Carcharias taurus (31.2%), and pigeye shark Carcharhinus amboinensis (28.0%)].
For these species the high proportion of elasmobranchs in the diet is relatively consistent
between regions. For example, elasmobranchs make up a large component of the diet of
broadnose sevengill sharks from southern Africa, California, north Patagonia (Argentina),
and southeastern Australia (Ebert 1991, Ebert 2002, Lucifora et al. 2005, Braccini 2008)
and of the diet of sand tiger sharks from the northwest Atlantic, South Africa, and north
Patagonia (Gelcleichter et al. 1999, Smale 2005, Lucifora et al. 2009). Great
hammerhead sharks appear to be extremely adept at feeding on elasmobranchs, including
more elasmobranchs in their diets than other large sharks (Cortés 1999). Elasmobranchs,
especially batoids, were common in the stomach contents of great hammerhead sharks in
northern Australia and South Africa (Stevens and Lyle 1989, Cliff 1995), with
elasmobranch frequency of occurrence in stomachs reaching 82% in the South African
sharks (Cliff 1995). Further emphasizing the importance of batoids in the diets of great
hammerhead sharks are reports of captured individuals with up to 50 stingray barbs
embedded in their mouths, throats and tongues (Compagno 1984) and observations of
great hammerhead sharks using their unusually shaped head to pin down batoids during
capture and prey handling (Strong et al. 1990, Chapman and Gruber 2002).
The importance of elasmobranchs as diet items for large sharks varies within
some species that regularly consume other elasmobranchs. Indeed, some species show a
high degree of regional variability in the importance of elasmobranchs to their diets. For
example, in South Africa, sharks and rays were a large component of the diet of dusky

12
sharks Carcharhinus obscurus greater than 100cm in PCL length (Dudley et al. 2005).
However in Western Australia they were only infrequently found in the stomachs of
dusky sharks <200cm FL (Simpfendorfer et al. 2001a) and in the northwest Atlantic from
a sample composed primarily of small dusky sharks (<125cm TL), elasmobranchs were
of intermediate importance and only rays were found in stomach contents (Gelsleichter et
al. 1999). Similar variability has been observed in sandbar sharks Carcharhinus
plumbeus. Elasmobranchs were extremely rare in the diets of sandbar sharks in northern
Australia and Hawaii (Stevens and McLoughlin 1991, McElroy et al. 2006), but were
much more commonly found in sandbar shark diets in South Africa, the northwestern
Atlantic, and of juveniles (>90cm PCL) in Chesapeake Bay, USA (Stillwell and Kohler
1993, Cliff et al. 1988, Ellis and Musick 2007). In tiger sharks Galeocerdo cuvier, the
proportion of elasmobranchs in the diet varies with location and size. In Australia and
New Caledonia, elasmobranchs are not frequently found within the stomach contents of
tiger sharks, although within Australia there is regional variation with elasmobranchs
comprising a slightly larger proportion of the diet in Western Australia (Simpendorfer
1992, Lowe et al. 1996, Heithaus 2001b, Simpefendorfer et al. 2001b). In the main
Hawaiian Islands, elasmobranchs become increasingly important prey with increasing
tiger shark length and had the highest frequency of occurrence (42%) of all prey items in
sharks >300cm total length (Lowe et al. 1996). Regional differences in the importance
of elasmobranchs as prey are likely the result of variation in the availability of
elasmobranch and other prey species since many of the large sharks that consume other
elasmobranchs are generalized piscivores and may feed opportunistically.

13
Elasmobranchs also are prey of other large predators. Notably, killer whales
Orcinus ocra off New Zealand’s North Island may specialize in feeding on
elasmobranchs, with elasmobranchs making up a larger part of the diet than previously
thought. During over 80% of research encounters with killer whales, whales successfully
captured and consumed sharks and rays and in many cases multiple elasmobranchs were
consumed (Visser 1999, 2005). Observations of feeding killer whales and extreme tooth
wear also suggest that sharks may be an important component of killer whale diets in the
northeast Pacific (Ford et al. 2011). In some systems, pinnipeds may also be a threat to
small elasmobranchs. During approximately 30h of visual surveys around Seal Island in
False Bay, South Africa, juvenile Cape fur seals captured 17 puffadder shysharks
Haploblepharus edwardsii. Although seals proceeded to play with instead of consuming
the sharks, six of the 18 sharks were killed with three ultimately consumed by black-
backed kelp gulls Larus dominicanis vetula (Martin 2004). Elasmobranchs have also
been recorded from the diets of crocodilians, pinnipeds and dolphins, but do not
constitute an important prey group for any of these predators (Gunter 1942, Condit and
Le Boeuf 1984, Rasmussen and Schmidt 1992, Tamarack 1993). In a review of the diets
of 60 skates, Ebert and Bizzarro (2007) found that, when present, elasmobranchs
generally made up less than 1% of the standardized diet composition. Chondrichthyans
(elasmobranchs plus chimeras) were found in the diets of 19 of the skates and even made
up 26.7% of the diet of the Norwegian skate Dipturus nidarosiensis.
Free-swimming elasmobranchs are not the only life stages at risk of predation.
Many elasmobranchs lay eggs, some of which may take over a year to develop and hatch.
Egg cases have been found in the stomachs of several elasmobranch species (e.g.,

14
Gelcleichter et al. 1999, Ellis and Musick 2007, Lucifora et al. 2009), but the main
elasmobranch egg-case predator appears to be gastropods, which can bore through the
leathery egg case (Cox and Koob 1993, but see Powter and Gladstone 2008). Although
egg-case predation has been observed in few studies (see Bor and Santos 2003), predation
rates have been estimated at 3-90% (Grover 1972, Cox and Koob 1993, Smith and
Griffiths 1997, Cox et al. 1999, Lucifora and Garcia 2004, Powter and Gladstone 2008,
Hoff 2009). Given that some skates can produce >140 eggs per year (Holden 1975,
Lucifora and Garcia 2004), these rates of predation may result in a large transfer of
energy.
It should come as no surprise that elasmobranchs have evolved a number of traits
to avoid being eaten. These include morphological traits such as the venomous barbs of
myliobatiforms (stingrays) and the spines of heterodontids (horn sharks) and most
squaliform (dogfishes) sharks, life history traits, and behavioral traits such as swell sharks
Cephaloscyllium spp., swallowing large volumes of water to increase their body size.
Some antipredator behaviors are also likely to influence the spatial and temporal patterns
of elasmobranch mesopredator trophic interactions.
Group formation, for example, may modify prey encounter and removal rates
(e.g., Hake and Ekman 1988, Valone 1993, Brown and Alexander 1994), and many
elasmobranch mesopredators form groups that are likely a response to predation risk.
Cowtail rays Pastinachus atrus (formerly P. sephen), for example, are more likely to
group when visibility is low and therefore their ability to detect a predator is reduced
(Semeniuk and Dill 2005). Juvenile scalloped hammerhead sharks Sphyrna lewini and
juvenile blacktip sharks Carcharhinus limbatus also form small aggregations that might

15
reduce predation risk (Holland et al. 1993, Heupel and Simpfendorfer 2005). Cownose
rays Rhinoptera bonasus groups can contain several hundred individuals and groups of
up to 5 million have been reported in Chesapeake Bay, USA (Blaylock 1989, Blaylock
1993).
Habitat selection to reduce the risk of predation can have far-reaching
consequences for the spatial and temporal patterns of trophic interactions by
mesopredators. Like a multitude of other taxa, elasmobranch mesopredators generally
show strong preferences for safe habitats, even at the cost of reduced energy intake rates.
Indeed, the use of shallow coastal habitats as nursery areas by many temperate,
subtropical, and tropical sharks – in which they often fill the role of upper trophic level
predators – is almost surely a response to the risk imposed by larger sharks further
offshore (see Heupel et al. 2007, Heithaus 2007 for reviews). For example, Morrissey
and Gruber (1993) found that juvenile lemon sharks Negaprion brevirostris in the
Bahamas select shallow habitats, likely to avoid predators. Similarly, juvenile blacktip
reef sharks Carcharhinus melanopterus at Palmyra Atoll (Papastamatiou et al. 2009),
juvenile lemon sharks at Atol das Rocas, Brazil (Wetherbee et al. 2007), and blacktip
sharks at Terra Ceia Bay, Florida (Heupel and Hueter 2002), prefer sheltered shallow
habitats where the risk of predation is low even when prey availability was not relatively
high. In Shark Bay, Australia, the preference for extremely shallow waters by giant
shovelnose rays Glaucostegus typus and whiprays Himantura spp., is seasonal, occurring
during the warm season when large shark abundance is high (Vaudo and Heithaus 2009).
The use of nursery grounds has often been assumed to be driven by a combination
of high resource availability and low predation rates, but recent work suggests that

16
although these areas provide relative safety, competition may be intense (see reviews in
Heithaus 2004, 2007, Heupel et al. 2007). For juvenile scalloped hammerhead sharks in
Kaneohe Bay, Hawaii, estimates of the maintenance ration (the amount of food needed
by an individual to maintain its body weight) measured via oxygen consumption and food
conversion (Lowe 2002, Duncan 2006) exceed estimates of daily ration determined by
gastric evacuation rates and stomach content data (Bush and Holland 2002). In fact,
weight loss in recaptured individuals and a general decrease in body condition by
individuals over time occur (Duncan and Holland 2006). Given that sharks are not
meeting their maintenance requirements, it is not surprising that prey densities within this
nursery are low (Bush 2003). However there are fewer large sharks in Kaneohe Bay than
in surrounding areas (Clarke 1971, Crow et al. 1996) supporting the hypothesis that this
nursery ground is used primarily to minimize predation risk. Movements and habitat use
of juvenile lemon and blacktip sharks also are more consistent with predator avoidance
than resource acquisition (Morrissey and Gruber 1993, Heupel and Hueter 2002). Life
history traits of sharks that use nurseries vary from those that do not. Species that use
nurseries tend to be proportionally smaller at birth and have slower growth rates relative
to species that do not use nurseries or use more open nurseries (Branstetter 1990).
Predation-risk sensitive habitat selection may also be influenced by body
condition (asset-protection principle: Clark 1994). Under condition- (or state-) dependent
foraging, which has been observed in a variety of taxa (e.g., Hays et al. 2001, Kotler et al.
2004, Aubret and Bonnet 2005, Heithaus et al. 2007b), individuals with high body
conditions will forgo high-risk foraging sites even if these sites offer higher energetic
returns. Such condition-dependent behavior is likely to occur in elasmobranchs, but had

17
been largely overlooked. Southern stingrays Dasyatis americana found at tourist
provisioning sites in Grand Cayman tended to have lower body conditions than rays at
non-tourist sites (Semeniuk and Rothley 2008). These tourist sites represent a riskier
habitat in terms of injuries incured from boat traffic and higher predation rates by sharks.
Semeniuk and Rothley (2008) attributed the poorer body condition of rays at the tourist
sites to the long-term affects of ray provisioning, however, these data are also consistent
with the rays exhibiting condition-dependent behavior. Individuals in poor condition,
whose survival may be dependent on a high-energy return, are more willing to forage at
the high-risk, but profitable, locations (i.e., provisioning sites).
Elasmobranchs As Predators
Trophic Level
All elasmobranchs are carnivores and tend to occupy higher trophic levels than
other fishes. Most information on trophic levels in elasmobranchs is based on stomach
content analysis, although in recent years stable isotopic analysis has also been used and
yielded similar estimates for species that have been studied (Estrada et al. 2003, 2006,
Kerr et al. 2006). Cortés (1999) calculated standardized diet compositions (a
proportional breakdown of prey categories based on a weighted average of data from
multiple quantitative dietary studies of a particular species and takes into account the
number of stomachs examined in each study) of 149 species of sharks (most of which
were coastal species) and concluded that sharks tend to be tertiary consumers (trophic
level > 4), occupying similar trophic levels to marine mammals and slightly, but
significantly, higher than seabirds. With the notable exception of whale sharks

18
Rhincodon typus and basking sharks Cetorhinus maximus, trophic level in sharks is
positively correlated with body size (Cortés 1999). However, high trophic levels are not
universal among sharks. Sharks in the order Orectolobiformes (carpet sharks) tended to
occupy lower trophic levels (trophic level 3.6) than species in other orders, as did the one
member of the order Heterdontiformes (horn sharks) examined (trophic level 3.2) (Cortés
1999). Both of these orders are primarily composed of benthic coastal sharks that
frequently feed on benthic invertebrates. Not surprisingly, the two zooplanktivorous
sharks (whale and basking sharks) also feed at a relatively low trophic level (trophic level
3.2-3.5).
Standardized diet compositions and trophic levels of batoids have only been
systematically examined for skates. Skates tended to occupy similar but slightly lower
trophic levels than sharks, but like sharks show a positive relationship between body size
and trophic level (Ebert and Bizzarro 2007). Skates, unlike other batoids, are usually
associated with the deeper waters of continental slopes, although in cooler areas some
species occupy the continental shelf and inshore waters. Despite habitat differences
between skates and other batoids, available data suggest similar diets and therefore
coastal batoids likely occupy similar trophic levels. Myliobatids (eagle rays) and
rhinopterids (cownose rays), however, tend to include more molluscs in their diets (e.g.,
Smith and Merriner 1985, Gray et al. 1997, Jardas et al. 2004, Yamaguchi et al. 2005,
Collins et al. 2007) and mobulids (manta rays) are filter feeders (Last and Stevens 2009)
so they should be found at lower trophic levels than other batoids.
Although published values of elasmobranch trophic levels likely provide a fair
estimate at higher taxonomic levels, some care is required when interpreting trophic

19
levels between species or for a species between locations. When using stomach contents
to determine trophic position, stomach contents are typically grouped into broad
taxonomic categories for ease of interpretation and because not all prey items can be
identified to species. As a result taxonomically similar but trophically distinct prey items
will be combined. In addition, the trophic level of each prey category is usually
represented as an average of trophic levels found in the literature for species within that
prey category. These factors will result in predators that feed predominantly within the
same taxonomic group having similar standardized trophic levels, regardless of their true
trophic levels. For example, large shark that feeds predominantly on large predatory
fishes will have a similar standardized trophic level as a small shark that has a
proportionally similar diet, but feeds on smaller and lower trophic level fishes.
Calculating trophic position using stable isotopic analysis (generally δ15N) does not
require diet information, thereby avoiding these issues, but is not without complications
(See Heithaus et al. 2010 for a brief review of stable isotope analysis considerations).
Calculating trophic levels from isotopic signatures requires the appropriate isotopic
baseline and knowledge of isotopic fractionation rates, which are likely to be system and
species specific, respectively (Post 2002, McCutchan et al. 2003, Vanderklift and
Ponsard 2003). Sensitivity analyses have demonstrated that trophic level estimates are
very sensitive to fractionation rates and moderately sensitive to methods of determining
isotopic baselines (Post 2002). In the only currently published study on isotopic fraction
rates in elasmobranchs, Hussey et al. (2010) found fractionation of 2.43‰ for muscle in
sand tiger sharks, which is lower than the 3.4‰ suggested by Post (2002) and used by
Estrada et al. (2003, 2006) and Kerr et al. (2006).

20
Feeding Guilds
Despite the similarity in trophic levels among sharks and other elasmobranch
groups, prey type and size classes can vary considerably within and among species.
Coastal sharks and batoids can be placed into five broad dietary guilds: piscivores,
teuthivores, invertevores, zooplanktivores, and a guild of larger sharks that feed on
teleosts and various other megafauna (i.e., elasmobranchs, birds, reptiles, and marine
mammals).
Many of the mid to large-sized (i.e., > 100 cm total length) coastal elasmobranchs
are primarily piscivorous. Piscivory characterizes carcharhinids (requiem sharks), which
are the most abundant coastal sharks (Cortés 1999, Wetherbee and Cortés 2004). In
many of these species, the frequency of occurrence of teleosts in stomach contents may
exceed 90%. The proportion of the diet that is composed of fish may also exceed 90% in
many torpediniform rays (electric rays) (e.g., Bray and Hixon 1978, Abdel-Aziz 1994,
Capape et al. 2007). Within this guild, prey sizes are often relatively small (<20% TL of
the predator) [e.g., copper shark Carcharhinus brachyurus (Cliff and Dudley 1992),
nurse shark Ginglymostoma cirratum, (Castro 2000), finetooth shark Carcharhinus
isodon, Atlantic sharpnose shark Rhizoprionodon terraenovae, (Bethea et al. 2004), sand
tiger sharks (<2m total length) (Smale 2005)], although some species may target
moderately-sized prey (up to 40% TL of the predator) [e.g., blacktip shark (Bethea et al.
2004), Atlantic sharpnose shark (Bethea et al. 2006)].
Within the coastal pelagic realm, many elasmobranchs are teuthitrophic, feeding
primarily on cephalopods, especially squid. This guild is primarily composed of
carcharhinids [e.g., blue sharks Prionace glauca (Tricas 1979)], but also includes

21
sphyrnids [e.g., smooth hammerhead Sphyrna zygaena (Smale 1991)] and lamnids
(mackerel sharks) [e.g., salmon shark Lamna ditropis (Kubodera et al. 2007)].
Teuthitrophic sharks, however, are not limited to pelagic waters. For example, the
Australian weasel shark Hemigaleus australiensis feeds primarily on benthic octopuses
(Taylor and Bennett 2008), as does the whiskery shark Furgaleus macki (Simpfendorfer
et al. 2001a).
Bottom associated elasmobranch species may also eat fishes, but tend to have
diets dominated by benthic invertebrates. Crustaceans are the dominant invertebrate
eaten by this guild and make up a substantial portion of the diet of many carcharhinids,
small sphyrnids (hammerhead sharks), triakids (houndsharks), many orectolobiforms, and
batoids (Cortés 1999, Wetherbee and Cortés 2004, Ebert and Bizzarro 2007). Within this
guild heterdontids (hornsharks), myliobatids, and rhinopterids are durophagous (e.g.,
Cortés 1999, Gray et al. 1997, Jardas et al. 2004, Yamaguchi et al. 2005, Collins et al.
2007), capable of feeding on hard-bodied invertebrate prey (e.g., mollusks, echinoderms)
and having evolved jaws that are more mineralized than other elasmobranchs to crush
hard prey (Summers et al. 1998, 2004, Summers 2000).
The zooplanktivores compose a relatively small guild of coastal elasmobranchs.
Whale and basking sharks, as well as some mobulid rays frequent coastal waters to
exploit areas of high zooplankton production and invertebrate and fish spawn (e.g., Sims
et al. 1997, Sims and Quayle 1998, Heyman et al. 2001, Nelson and Eckert 2007,
Sleeman et al. 2007, Taylor 2007, Dewar et al. 2008).
Some of the largest coastal elasmobranchs, notably bull sharks, tiger sharks, great
white sharks, and broadnose sevengill sharks may be primarily piscivorous but belong in

22
a separate guild because of their propensity to include large teleosts, elasmobranchs, and
even marine tetrapods (marine mammals, sea turtles, sea snakes, sea birds) in their diets
(Tricas and McCosker 1984, Cliff et al. 1989, Ebert 1991, Bruce 1992, Simpfendorfer
1992, Lowe et al. 1996, Cortés 1999, Fergusson et al. 2000, Simpfendorfer et al. 2001b).
Because some of these large-bodied prey species may themselves exert considerable top-
down influences on marine communities, the sharks in this feeding guild warrant special
consideration as potentially critical species in their communities (e.g., Heithaus et al.
2008a, 2010).
Placement of individual species within the abovementioned guilds is not always
straightforward. Like in many other fish species, ontogenetic shifts appear to be
commonplace, but not universal, in elasmobranchs [e.g., tiger shark (Simpfendorfer 1992,
Lowe et al. 1996), lobed stingaree Urolophus lobatus, sparsely-spotted stingaree
Urolophus paucimaculatus, masked stingaree Trygonoptera personata (Platell et al.
1998), broadnose sevengill shark (Ebert 2002), spiny dogfish Squalus acanthias (Koen
Alonso et al. 2002), school shark Galeorhinus galeus (Lucifora et al. 2006), common
stingaree Trygonoptera testacea (Marshall et al. 2008)]. Ontogenetic diet shifts may be
associated with habitat shifts in species using nursery areas – as do many coastal
carcharhinids, or it may simply reflect the enhanced prey available to elasmobranchs as
their gape, jaw strength, and/or swimming ability increases. Many diet shifts are
accompanied by an increase in diet breadth as new items are added to the diet [e.g., bat
ray Myliobatis californica (Gray et al. 1997), tiger shark (Lowe et al. 1996), gummy
shark Mustelus antarcticus (Simpfendorfer et al. 2001a), smooth-hound shark Mustelus
mustelus (Saidi et al. 2009)], although some species show reductions in diet breadth as

23
they become more specialized with increasing size [e.g., Australian weasel shark (Taylor
and Bennet 2008), masked stingaree (Plattel et al. 1998)]. One commonly observed shift
is from a diet based primarily on benthic invertebrates, usually crustaceans, to one
including more fishes [e.g., leopard shark Triakis semifasciata (Talent 1976, Kao 2000),
lobed stingaree (Plattel et al. 1998), Atlantic sharpnose (Bethea et al. 2004), sandbar
shark (Ellis and Musick 2007), southern fiddler ray Trygonorrhina fasciata (Marshall et
al. 2007), smooth-hound shark (Saidi et al. 2009)]. In several large coastal species, diet
shifts are more extreme. Increases in size are associated with an increased proportion of
elasmobranchs in the diet of sharks such as the tiger shark (Lowe et al. 2006), broadnose
sevengill shark (Ebert 2002, Lucifora et al. 2005), and copper shark (Lucifora et al.
2009). For great white sharks, broadnose sevengill sharks, and Pacific sleeper sharks
Somniosus pacificus, increased size also results in the inclusion of marine mammals in
the diet (Cliff et al. 1989, Ebert 2002, Lucifora et al. 2005, Sigler et al. 2006). The
aforementioned shifts are likely to at least in part be driven by smaller individuals being
gape limited and too small to capture large prey. A change in habitat is associated with
the diet shift of spiny dogfish, in coastal Patagonian waters. Juveniles tend to feed in the
water column, with adults feed on demersal and benthic prey (Koen Alonso et al. 2002).
Great white sharks show the opposite shift. Juveniles spend a large amount of their time
making dives to the bottom (Dewar et al. 2004, Weng et al. 2007b) where they feed
largely on demersal prey (Casey and Pratt 1985), while adults feed on prey in the water
column. Ontogenetic diet shifts also occur in batoids. The diet shift observed in the
common stingaree, may be the result of a greater ability of larger individuals to access
buried prey. Smaller rays feed predominantly on crustaceans, while the diet of larger

24
rays is dominated by polychaetes, which are found deeper in the substrate (Marshall et al.
2008). Some diet shifts are associated with ontogenetic structural changes. In horn
sharks Heterodontus francisci, jaw mineralization increases through ontogeny allowing
larger individuals to consume hard bodied prey (Summers et al. 2004). Great white
sharks also exhibit a morphological change allowing them to expand their diet. Juvenile
great white sharks have sharply pointed narrow teeth ideal for catching fishes. At
approximately 3m in length, large finely serrated triangular teeth suited for cutting
through the flesh of marine mammals replace the narrow teeth (Tricas and McCosker
1984); this is roughly the size at which marine mammals are added to the diet (Tricas and
McCosker 1984, Cliff et al. 1989, Bruce 1992).
Diets vary regionally in many coastal elasmobranch species, especially those with
wide distributions. Dusky sharks from the northwest Atlantic, Western Australia, and
South Africa differed greatly in the occurrence and diversity of cephalopods and
elasmobranchs in their diets (Gelsleichter et al. 1999, Simpfendorfer et al 2001a, Dudley
et al. 2005). Similar variation across large spatial scales has been observed in the sandbar
shark (Cliff et al. 1988, Medved et al. 1988, Stevens and McLoughlin 1991, Stillwell and
Kohler 1993, McElroy et al. 2006, Ellis and Musick 2007), tiger shark (Simpfendorfer
1992, Lowe et al. 1996, Simpfendorfer et al. 2001b), and thornback ray Raja clavata
(Morato et al. 2003). Regional variability is also seen on smaller scales [e.g., grey reef
shark Carcharhinus amblyrhynchos, milk shark Rhizoprionodon acutus, spottail shark
Carcharhinus sorrah (Salini et al 1992), Atlantic sharpnose shark (Bethea et al. 2006),
bonnethead shark Sphyrna tiburo (Bethea et al. 2007)]. Tiger shark diets were found to
vary along the central Western Australian coast (Simpfendorfer et al. 2001b), while

25
across southwestern Australia the diet of the southern fiddler ray, varied regionally
(Marshall et al. 2007). Regional dietary differences have also been observed for juvenile
sandbar sharks within a Virginia, USA, nursery ground (Ellis and Musick 2007). Dietary
differences can also be observed at small scales if species occur along a depth gradient, as
was found for longnose skate Raja rhina off coastal central California (Robinson et al.
2007) and sandbar sharks in Hawaii (McElroy et al. 2006). Such spatial variation in diets
likely is driven by variability in prey availability. Within a coastal system, Salini et al.
(1992) found that there was a strong correlation between the proportions of prey
consumed by five carcharhinids and prey biomass estimates, suggesting opportunistic
foraging.
Many coastal elasmobranchs shift their diets seasonally within a region [e.g.,
blacktip shark (Dudley and Cliff 1993), common stingray Dasyatis pastinaca (Ismen
2003), southern fiddler ray (Marshall et al. 2007), marbled sand skate Psammabatis bergi
(San Martin et al. 2007), smooth-hound shark (Saidi et al. 2009), giant shovelnose ray,
nervous shark Carcharhinus cautus (White et al. 2004)]. Like regional diet shifts,
temporal variation in diets may reflect variation in prey availability. Indeed, seasonal
increases in the availability of specific prey taxa are often accompanied by seasonal
increases in that prey species within an elasmobranch’s diet. For example, the diet of
Pacific sleeper sharks in coastal Alaskan waters was dominated by teleosts during August
and cephalopods during May. The walleye pollock Theragra chalcogramma and salmon
Oncorhynchus sp. that made up the bulk of the teleosts consumed had higher densities in
coastal waters during August (Sigler et al. 2006). Similarly, the importance of
euphausiids in the diet of the sandpaper skate Bathyraja kincaidii varied in concert with

26
seasonal coastal upwelling that leads to enhanced productivity and higher euphausiid
abundance (Rinewalt et al. 2007). But not all seasonal changes are related to increased
prey abundance. During the summer, adult school sharks off the Argentinean coast shift
from a generalist diet to a diet focusing on the Atlantic midshipman Porichthys
porosissimus. During this time, male Atlantic midshipmen maintain territories, hum and
bioluminesce during courtship, which may increase their vulnerability to school sharks
(Lucifora et al. 2006). Increases in the consumption of Gulf toadfish Opsanus beta by
lemon sharks and the only records of scarecrow toadfish O. phobetron from the diet of
lemon sharks also occur during the breeding season of these prey species, which have
similar breeding behaviors as Atlantic midshipmen (Wetherbee et al. 1990, Newman et
al. 2004).
Because many elasmobranchs, especially sharks, are highly mobile and can exist
with minimal food intake for relatively long periods of time, they are able to take
advantage of widely spaced pulses of resources. Therefore, spatial and temporal
variations in diet compositions often are linked. For example, tiger sharks may travel
immense distances (e.g., Lowe et al. 2006, Heithaus et al. 2007b, Meyer et al. 2009,
2010) and take advantage of resources that are only abundant for short periods of time.
In the Northwestern Hawaiian Islands, tiger sharks congregate around small islands
during the summer to take advantage of the large number of fledging albatross (Lowe et
al. 2006), while tiger shark catch rates at the Houtman Abrolhos Islands, Western
Australia, increase during the rock lobster fishing season and the sharks feed on large
amounts of discarded bait (Simpfendorfer et al. 2001b). Similarly, great white sharks
make long distance excursions (Bonfil et al. 2005, Bruce et al. 2006, Weng et al. 2007a,

27
Domeier and Nasby-Lucas 2008) and members of the northeastern Pacific populations
are known to return seasonally to pinniped rookeries (Anderson and Pyle 2003, Domeier
and Nasby-Lucas 2007). Many other coastal elasmobranchs also make seasonal
migrations including cownose rays (Smith and Merriner 1987, Schwartz 1990), juvenile
sandbar sharks (Grubs et al. 2007), thornback rays (Hunter et al. 2005, 2006), whale
sharks (Taylor 1996, Wilson et al. 2001, 2006), longheaded eagle rays Aetobatus
flagellum (Yamaguchi et al. 2005), and blacktip sharks (Castro 1996). These movements
can provide linkages between widely disparate systems that in some situations maintain
ecosystem functioning (Sheaves 2009).
Dietary shifts at a single location over long time periods may reflect changes in
prey communities. Between the 1970s and late 1990s, leopard sharks at Elkhorn Slough,
Monterey Bay, California, experienced a dramatic dietary shift and a breakdown of
ontogenetic shifts in diets. Crabs and clams, which were major components of the diets
of small and large leopard sharks, respectively, are now only minor dietary components,
while the importance of innkeeper worms Urechis caupo and fish have increased (Kao
2000). Increased coastal erosion and reestablishment of sea otters Enhydra lutris, which
prey heavily on crabs and clams appear to have led to changes in the Elkhorn Slough
invertebrate community since the 1970s (Kao 2000). Long-term changes in prey
communities have also resulted in a dietary shift of spiny dogfish in Patagonian waters.
Prior to 1995, Argentine hake Merluccius hubbsi were the most important prey item for
spiny dogfish in this region, but by 1998 Argentine shortfin squid Illex argentinus were
the most important prey; the timing of this dietary shift coincides with dramatic decreases
in hake stocks that resulted from overfishing and concurrent increases in squid abundance

28
(Koen Alonso et al. 2002). Ellis and Musick (2007) also hypothesized that temporal
differences in juvenile sandbar shark diets within a nursery ground may be related to a
large (~70%) decrease in blue crab Callinectes sapidus stocks. The abovementioned
dietary shifts underscore the plasticity of coastal elasmobranchs as predators and that the
potential impacts humans can have on coastal elasmobranch trophic relationships even in
the absence of direct and indirect fisheries.
Competition And Resource Partitioning
Few studies have examined the competitive interactions of coastal elasmobranchs.
However, the results of these studies show that sympatric coastal elasmobranchs display
varying levels of interspecific dietary overlap and therefore resource partitioning. High
levels of dietary overlap have been found in several sympatric coastal carcharhinids
suggesting limited competition (Stevens and McLoughlin 1991, Salini et al. 1992,
Simpfendorfer and Milward 1993, Heithaus 2001a). These studies, however, were
largely qualitative. Using quantitative metrics Bethea et al. (2004) found high levels of
interspecific diet overlap between juvenile carcharhinids of similar sizes, however habitat
overlap was low, which should ameliorate competitive interactions. Similar habitat
partitioning of species with high dietary overlap may also be observed in the Hawaiian
Islands. Sandbar and grey reef sharks have high values of dietary overlap, and an inverse
distributional relationship with sandbar sharks abundant in the main Hawaiian Islands
and grey reef sharks abundant in the northwestern Hawaiian Islands (Papastamatiou et al.
2006). Quantitative methods, however, can overestimate dietary overlap if broader
taxonomic levels are used to define the diet. For example, moderate levels of diet

29
overlap were found between dusky, whiskery and gummy sharks although a more
detailed qualitative examination of prey suggested each species had different feeding
habits (Simpfendorfer et al. 2001a). This result is consistent with findings that values of
dietary overlap decrease as taxonomic resolution of prey items increases (Longenecker
2007). However, high taxonomic prey resolution coupled with high values of overlap
does not necessarily infer high levels of competition. High seasonal abundances of prey
items can attract a wide variety of predators, resulting in high dietary overlap on a
nonlimiting resource. This situation may take place during the seasonal South African
sardine run. Significant dietary overlap exists between blacktip, dusky, and copper
sharks in South Africa (Heithaus 2001a) and all are abundant during the sardine run. In
addition, sardines Sardinops sagax are among the dominant prey items of these sharks
(Cliff and Dudley 1992, Dudley and Cliff 1993, Dudley et al. 2005). Even great white
sharks, which are seasonally abundant during the sardine run, make use of this abundant
resource; sardines were the most common individual prey species in the great white diet
(Cliff et al. 1989). Despite the possibility of seasonal prey pulses which may homogenize
diets, many studies have found that dietary resources are partitioned among sympatric
coastal elasmobranchs (e.g., Plattel et al. 1998, Heithaus 2001a, White et al. 2004, Farias
et al. 2006, Marshall et al. 2008) and within the Caribbean, phylogenetically similar
species occupy different food web compartments and different trophic levels (Rezende et
al. 2009).
Intraspecific interactions between elasmobranchs have garnered even less
attention. Ontogenetic diet and habitat shifts have been suggested as a means of reducing
intraspecific competition between size classes, but could also be the result of increasing

30
predatory ability with size and/or predation risk. Martin et al. (2005) suggested that
intraspecific competition might be important to great white sharks at Seal Island, South
Africa, because up to 26 individuals have been reported at the island at a time, with up to
four individuals attending a seal kill. Further, intraspecific competition was suggested as
a possible reason foraging success on seals was lower within 400m of the island, where
the highest number of attacks occur. It is possible that sharks launch subobtimal attacks
because subordinate individuals are competitively displaced, and smaller sharks have
more dispersed search patterns and lower success rates (Martin et al. 2005, 2009).
Increased experience, however, cannot be discounted as contributing to these
observations.
Possible competitive interactions between coastal elasmobranchs and non-
elasmobranch taxa have seldom been examined. Four urolophid rays (stingarees) were
included in a study of resource use of benthic carnivorous fishes and were found to have
significantly different diets than each other and all other fishes in the study (Plattell and
Potter 2001). For sharks of higher trophic levels, Heithaus (2001) examined potential
competitive interactions of sharks and dolphins off South Africa from published diet
studies and found significant diet overlap between several coastal sharks and common
dolphins. Further evidence of sharks and dolphins sharing resources comes from
observations of sharks and dolphins feeding together on the same prey species
(Leatherwood 1977, Corkeron et al. 1987, Acevedo-Gutierrez 2002). In addition, shark
abundance during these co-occurring foraging bouts may influence dolphin foraging
success. When bottlenose dolphins Tursiops truncatus and silky sharks Carcharhinus
falciformis fed on the same school of fish, dolphin intake rate was negatively related to

31
shark abundance, but was unaffected by increases in dolphin abundance. Although these
are not all coastal examples, there is little reason to suspect shark-dolphin interactions
differ in coastal waters (Acevedo-Gutierrez 2002).
Interestingly, diet data suggests that some coastal elasmobranchs may not only
compete for resources, but also may be simultaneously involved in predator-prey
relationships (intraguild predation) (e.g., Cliff and Dudley 1991, Heithaus 2001a, Dudley
et al. 2005, Braccini 2008). The possibility of such interactions may even influence the
distributions and habitat use of large elasmobranch species. For example, killer whales
and great white sharks consume pinniped prey, but killer whales also consume great
white sharks. This interaction may be responsible for the displacement of great white
sharks from the Farallon Islands. During the autumn of 1997 great white shark sightings
dropped dramatically compared to previous months and years while a group of killer
whales, which are uncommon around the Farallon Islands, frequented the area (Pyle et al.
1999).
Metabolism, Digestion And Feeding Periodicity
Metabolic rates, rates of digestion, assimilation efficiency, and temporal patterns
of foraging can all influence trophic interactions and the impacts of predators on
populations of their prey. For example, Williams et al. (2004) suggest that the impact of
direct predation can be estimated from the population size, diets, and metabolic rates of
predators and an understanding of prey demography. Unfortunately, because of the
difficulties of studying elasmobranchs, there is limited information on metabolic rates,
digestion and assimilation, and feeding periodicity of coastal elasmobranchs. Below, I

32
briefly summarize our understanding of these factors. See Carlson et al. (2004) and
Cortés et al. (2008) for more detailed reviews.
Feeding patterns can be indirectly inferred from studies of stomach contents. The
proportion of empty stomachs and state of digestion of consumed prey can give insights
into feeding periodicity (Wetherbee and Cortés 2004). A more continuous foraging
interval should result in populations that have few individuals with empty stomachs.
Therefore the low proportion of empty stomachs in many benthic foraging coastal
elasmobranch populations, notably batoid populations, (e.g., Gray et al. 1997, Kyne and
Bennett 2002, Ebert and Cowley 2003, Bethea et al. 2007, Bizzarro et al. 2007, Marshall
et al. 2007, Marshall et al. 2008) may indicate continuous foraging. That benthic foragers
have relatively short intervals between meals makes intuitive sense given that these
elasmobranchs generally prey upon species that are buried within the substrate or have
limited mobility and are therefore primarily limited by encounter rate with prey. The
high and variable proportion of empty stomachs observed in many coastal shark
populations, as well as the relatively small number prey items, most of which are in an
advanced state of digestion (Medved et al. 1985, Cortés and Gruber 1990, Simpfendorfer
1998, Gelsleichter et al. 1999, Simpfendorfer et al. 2001b, White et al. 2004, McElroy et
al. 2006, Taylor and Bennett 2008, Bethea et al. 2004, Dudley et al. 2005) suggests that
these species feed at less frequent intervals.
Attempts to ascertain feeding periodicity using stomach contents have included
examination of gut fullness and the state of digestion of stomach contents. Sharks have
long been thought to forage primarily at night, but several studies have found that prey
items within a single stomach are often in various states of digestion, as are prey items

33
sampled from individuals caught at the same time (e.g., Medved et al. 1985, Cortés and
Gruber 1990, Heupel and Bennett 1998), indicating that feeding is asynchronous in many
species. Some species do, however, appear to show diel feeding periodicity. Stomach
contents suggest juvenile scalloped hammerheads and juvenile blacktip sharks consume
more prey at night, although items are also consumed throughout the day (Bush 2003,
Barry et al. 2008).
Movement patterns have often been used to infer diel foraging behavior. Many
species of coastal elasmobranchs exhibit diel shifts in activity (e.g., Standora and Nelson
1977, Sims et al. 2001, Sundstrom et al. 2001, Cartamil et al. 2003, Hight and Lowe
2007, Campos et al. 2009, Ortega et al. 2009), and these shifts have even been observed
in species that are obligate ram ventilators and must continuously swim (e.g., McKibben
and Nelson 1986, Holland et al. 1993, Lowe 2002, Garla et al. 2006). The higher rates of
movements and often co-occurring increased area use have often been interpreted as
signs that individuals are foraging (e.g., McKibben and Nelson 1986, Sims et al. 2001,
Sundstrom et al. 2001, Cartamil et al. 2003, Garla et al. 2006). Interestingly, predictions
of feeding periodicity based on analysis of stomach contents and movement patterns do
not agree in some of the species for which both have been examined. Studies of
metabolic rates (Nixon and Gruber 1988) and movement patterns (Gruber et al. 1988) of
juvenile lemon sharks suggest these animals are more active between dusk and dawn,
although they show no feeding periodicity (Cortés and Gruber 1990). Likewise, the
epaulette shark Hemiscyllium ocellatum is more active at night and during crepuscular
periods, but has no obvious feeding pattern (Heupel and Bennett 1998).
34
Recent advances in data logger and telemetry technology have begun to elucidate
feeding periodicity by coastal elasmobranchs. Continuous records of gastric pH,
measured using pH data loggers force fed to captive sharks, indicate that pH levels
increase rapidly during feeding events, presumably because of the ingestion of basic
seawater (Papastamatiou and Lowe 2004, 2005, Papastamatiou et al. 2007b). In addition
to time of feeding, meal size can also be estimated based on the length of time it takes for
gastric pH to return to baseline levels (Papastamatiou and Lowe 2004, 2005,
Papastamatiou et al. 2007b). The success of using gastric pH as an indicator of feeding
events and meal size in captive animals has led to the development of an acoustic pH
transmitter that can be used to monitor the movements and feeding patterns of free
ranging sharks (Papastamatiou et al. 2007a). Although this technology will provide
researchers with the ability to gather in situ information on the foraging behaviors of
coastal sharks, captive studies will still be necessary to ground truth pH data because
gastric acid secretion and therefore pH values may vary dramatically between species
(Papastamatiou and Lowe 2005).
Feeding periodicity is also likely to be related to gut fullness. Sims et al. (1996)
reported that the return of appetite in the lesser spotted dogfish Scyliorhinus canicula was
inversely related to the rate of gastric evacuation. Factors influencing gastric evacuation
rates include temperature, meal size, and prey type. Not surprisingly for ectothermic
organisms (although lamnids exhibit endothermy), increased temperatures speed up
gastric evacuation rates (Cortés and Gruber 1992, Bush and Holland 2002). Increases in
meal size tend to decrease gastric evacuation rates, but the relationship between meal size
and gastric evacuation rates may vary across species. For example, doubling meal size

35
resulted in evacuation rates 2.5 times slower in lesser spotted dogfish (Sims et al. 1996),
but in juvenile scalloped hammerhead sharks reducing meal size by a factor of 8.4 only
cut evacuation time in half (Bush and Holland 2002). Prey type will also affect rates of
gastric evacuation as some prey are harder to digest than others, although this has not
received much attention in the coastal elasmobranch literature. Gastric evacuation times
for juvenile sandbar sharks differed by about 20 hours for sharks fed similar size meals of
fish and crabs (Medved 1985). These differences may be related to differences in
stomach contractions with varying prey types; meals of fish led to greater stomach
contractions than meals of squid (Papastamatiou et al. 2007b). Prey type, however, may
not have large effects on gastric evacuation rates in all situations. Negligible differences
were found between the evacuation rates of shrimp and fish in juvenile scalloped
hammerhead sharks, although meal size was small (0.5% shark’s body weight) (Bush and
Holland 2002). Additionally, there is still debate about which models best describe
gastric evacuation in elasmobranchs and depending on the conditions examined, different
models provide the best fit even within a species (Cortés 1997 and references therein).
Overall, elasmobranch gastric evacuation rates tend to be slower than those of teleosts,
and depending on conditions can range from approximately 5 hours to well over 100
hours (Wetherbee and Cortés 2004).
Not only are gastric evacuation rates slower in elasmobranchs, total gut clearance
times are prolonged in comparison to teleosts. Food may be retained within the digestive
system of elasmobranchs for period of days to weeks (up to 18 days) (Wetherbee and
Gruber 1990, Sims et al. 1996) and like gastric evacuation, gut clearance times are
reduced at higher temperatures (Di Santo and Bennett 2011). Elasmobranchs have a

36
spiral valve intestine, which increases surface area for digestive functions, but is
restricted in size within the abdominal cavity. Limitations of the spiral valve intestine
may require extended food retention times to maximize absorption efficiency.
Absorption efficiency has only been examined in juvenile lemon sharks, Atlantic
stingrays Dasyatis sabina, and whitespotted bamboo sharks Chiloscyllium plagiosum,
with efficiencies rivaling values for carnivorous teleosts (~60-90%) (Wetherbee and
Gruber 1993, Di Santo and Bennett 2011). And in Atlantic stingrays, absorption
efficiency was strongly linked to gut clearance time. At low temperatures, when gut
clearance was prolonged, absorption efficiency increased, despite lower absorption rates
(Di Santo and Bennett 2011).
Metabolic rate is an important determinant of overall consumption by predator
populations (Williams et al. 2004) and is the driving factor of an organism’s daily energy
budget (Lowe 2001). Elasmobranchs have long been thought to have relatively low
metabolic rates, but this belief is largely derived from early work that focused on species
that are now known to have some of the lowest metabolic rates of examined species
(Carlson et al. 2004). In fact, there is a great deal of interspecific variation in the
metabolic rates of coastal elasmobranchs, much of which is associated with life-style.
Benthic, less active species do indeed have relatively low metabolic rates [e.g., standard
metabolic rates of 1.0 kg lesser spotted dogfish at 15°C: 38.2 mg O2 kg-1 h-1 (Sims
1996)], but active, continuously swimming species, many of which inhabit coastal and
estuarine waters, have metabolic rates similar to those of active teleost species [e.g.,
standard metabolic rates of 1.0 kg bonnethead sharks at 28°C: 163–181 mg O2 kg-1 h-1
(Carlson and Parsons 2003)], while lamnids – including the coastal great white shark –

37
are endothermic and have associated high metabolic rates [e.g., standard metabolic rate of
a 3.9 kg mako shark Isurus oxyrhynchus at 16-20°C: 240 mg O2 kg-1 h-1 (Graham et al.
1990)]. As expected for ectothermic organisms, increases in temperature result in
increased metabolic rates, so not surprisingly elasmobranchs found in warmer waters
have higher metabolic rates than those from cooler regions. The exact relationship of
temperature with metabolic rate, however, varies from species to species. The Q10 values
calculated for elasmobranchs range from 1.34 over 21-29ºC for juvenile scalloped
hammerheads (Lowe 2001) to 3.00 over 8-26ºC for bat rays (Hopkins and Cech 1994),
although some of the variability observed may be a result of differences in length of
acclimation to the tested temperatures. The Q10 values for a given species may also vary
greatly over different temperature intervals. For example, Bat rays are extremely
sensitive to changes in temperature between 14 and 20ºC, which they regularly
experience; their Q10 over this range is 6.81 compared to 2.23 and 1.85 for temperature
ranges between 8-14ºC and 20-26ºC, respectively (Hopkins and Cech 1994). Simulations
suggest that even minor temperature changes in temperature can have large implications
over longer time periods. Over a year of slightly elevated temperatures, cownose rays
would need to increase their daily consumption rate by about 12% to maintain their body
weight (Neer et al. 2007).
Some coastal elasmobranchs may exploit the relationship between temperature,
gastric evacuation/gut retention time and metabolism in thermally heterogeneous
environments. McLaren (1963) suggested that animals that feed in warm waters and rest
in cooler waters can gain benefit energetically. For elasmobranchs, cooler waters are
associated with lower metabolic rates and longer gut clearance times. If absorption

38
efficiency is maintained or possibly increased by food remaining in the gut longer, net
energetic gains may be considerable (Di Santo and Bennett 2011); for example, models
suggest daily energy costs could be reduced over 4% in lesser spotted dogfish (Sims et al.
2006). Behavioral patterns consistent with foraging in warm water and then moving into
cooler waters to digest have been observed in bat rays and lesser spotted dogfish (Matern
et al. 2000, Sims et al. 2006). Laboratory experiments have also shown preferences for
cooler waters after feeding in Atlantic stingrays and lesser spotted dogfish (Wallman and
Bennett 2006, Sims et al. 2006). Metabolic work on juvenile sandbar sharks also
suggests that moving into cooler waters for digestion may be necessary in continuously
active sharks because individuals may be using almost all of their metabolic scope to
sustain routine activities (Dowd et al. 2006).
Elasmobranch Impacts On Prey And Community Structure
Despite the large number of studies that have examined the diets of coastal
elasmobranchs (see Cortés 1999, Wetherbee and Cortés 2004), we are only beginning to
understand the implications of elasmobranch predation – and predation risk – on their
communities and ecosystems (see Heithaus et al. 2008a, 2010 for reviews). Although
top-down effects appear to occur in some situations, they are not universal. For the most
part, our understanding of top-down effects of elasmobranch predation is limited by a
lack of studies on the population biology, and responses to elasmobranch predation or
relaxation thereof, in prey taxa. Indeed, few authors have considered that in some
situations elasmobranch predation could be primarily compensatory (i.e., elasmobranchs
consume individuals that would have starved otherwise) or prey populations could be

39
regulated by factors other than predation (see Stevens et al. 2000, Pirano et al. 2002).
Below I summarize some basic trends in the ecological role of elasmobranchs before
providing more details of elasmobranch trophic interactions and ecological role in key
coastal ecosystems.
Studies of batoid foraging provide some of the best evidence of the impacts of
coastal elasmobranchs on their prey. Batoid prey species often exhibit limited mobility
facilitating studies of predatory effects, although most studies examining these effects
have focused on community structure rather than effects on specific prey species (e.g.,
VanBlaricom 1982, Thrush et al. 1994). The use of exclosures to eliminate predations by
batoids has shown that batoids can have considerable impacts on species distributions,
recruitment, and the structure of invertebrate communities in coastal seagrass beds and
soft bottom habitats (see sections: Seagrass Beds and Mangroves and Unvegetated Soft
Bottom).
Most of the remaining data on the impact of coastal elasmobranchs on their prey
is derived from concurrent estimates of the catch rates of coastal elasmobranchs and their
prey over time. Such time-series data suggest that large coastal sharks may play an
important role in controlling the populations of small- to midsize elasmobranchs. For
example, smaller sharks and batoids are found in the diets of a number of large sharks
captured in protective gillnets off the coast of South Africa. Declines in catch rates of
these large sharks appear to have resulted in the proliferation of small and juvenile sharks
between 1966 and 1976 (van der Elst 1979). On the basis of the number of large sharks
caught and estimated consumption rates from captive animals, van der Elst (1979)
estimated that approximately 2.8 million small sharks escaped predation in the decade

40
following 1966. Predatory release has also been suggested for the increases of several
small- to midsize elasmobranchs along the eastern United States. Time-series data
collected from 1970 to 2005 from 17 independent research surveys showed concurrent
declines of large coastal sharks and increases of 12 species of batoids and small sharks
(Myers et al. 2007).
Despite correlations between increases in catch rates of small elasmobranchs that
coincide with decreases in catch rates of larger sharks, it is not entirely clear that
predatory release is the sole mechanism behind these patterns. For example, some of the
smaller elasmobranch species have never been recorded from the diets of the large
coastal sharks that have declined and the distributions of some of the increasing smaller
species do not overlap with those of the declining large-bodied sharks. For example, in
the Gulf of Mexico, large coastal sharks and smaller coastal elasmobranchs declined,
while two deep-water elasmobranch species increased (Shepard and Myers 2005).
Another curious pattern in some of the datasets for elasmobranch mesopredators is the
rate of increases in catches. For example, cownose rays have relatively slow life history
parameters (age of maturity 8-10 years, one pup produced annually; Smith and Merriner
1986, 1987) that would suggest that increases in catches cannot be explained solely by
release from predation. Alternative, but not mutually exclusive, hypotheses for increases
in small- to midsized coastal elasmobranchs include population redistribution, which has
been observed in skates (Frisk et al. 2008), population increases at higher latitudes in
response to changes in environmental conditions (e.g., Parker and Dixon 1998),
competitive release (e.g., Link 2007), and changes in the timing of movements relative to
sampling periods. Clearly, it is possible and perhaps likely that large coastal sharks exert

41
important top-down effects on elasmobranch mesopredators, but future research on the
role of large sharks in regulating their populations is required.
Future work on population regulation by sharks will need to focus not only on
consumptive effects, but also risk effects. Many elasmobranch prey species occupy
habitats with lower food availability in order to minimize predation risk (e.g., Heithaus et
al. 2007c, Frid et al. 2009, see sections: Seagrass Beds and Mangroves and Estuaries)
and in some cases these habitat use decisions are dictated by body condition. Healthy
green turtles Chelonia mydas in Shark Bay, Western Australia, because they can afford
reducing foraging opportunities, show a high level of response to the presence of tiger
sharks in the system, moving to habitats that allow for higher probabilities of escape,
while poor condition (emaciated) green turtles do not exhibit a habitat shift (Heithaus et
al. 2007d). Such trade-offs, where individuals give up foraging opportunities in order to
be safe, have been shown both theoretically and empirically to result in populations of
prey that are maintained at numbers below those that would occur in the absence of
predation risk (Anholt and Werner 1995, Sinclair and Arcese 1995, Creel et al. 2007,
Creel and Christianson 2008, Heithaus et al. 2008a, 2008b, Frid et al. 2009).
The relaxation of risk effects may be very important in the population dynamics
of some elasmobranch species that are prey for large sharks, but the pattern of these
effects may be complex. The risk of predation from large sharks, including conspecifics,
drives the use of restricted nursery areas in numerous species and may also drive patterns
of habitat use and grouping in elasmobranch mesopredators (see section: Elasmobranchs
As Prey). Because resources may be limited within the nursery grounds (or restricted
habitat ranges), competition may be the proximal cause of population regulation within

42
nurseries, but ultimately these processes are driven by higher risk of predation outside
nurseries (i.e., there would be enough food to support larger population sizes if animals
did not restrict their habitat use; “foraging area hypothesis” see Walters and Juanes
1993). Although nursery grounds may limit direct predation on young elasmobranchs,
direct predation may still play an important role in regulating population size for some
coastal sharks. Demographic analyses suggest the intrinsic rate of increase for some
shark species are strongly influenced by the mortality rates of larger juveniles outside of
nursery grounds (see Kinney and Simpfendorfer 2009); these juveniles are often prey of
large coastal sharks.
The impacts of elasmobranch predation may be limited on teleosts and some
invertebrates. For example, off part of the US east coast, the mako shark appears to be an
important predator of bluefish Pomatomus saltatrix consuming 4-14% of the population,
although these losses did not appear to substantially influence equilibrium population size
(Stillwell and Kohler 1982). Ellis and Musick (2007) also concluded that the potential
impacts of juvenile sandbar sharks by direct predation were limited because of the
generalist nature of their diet. Minimal impacts of direct predation by coastal
elasmobranchs are also apparent in some ecosystem models (Stevens et al. 2000, Carlson
2007). For example, models of French Frigate Shoals, Hawaii, suggest reef sharks
Carcharhinus spp. have little effect in structuring the community because their main
prey, reef fishes, appear to be self regulated (Stevens et al. 2000). While, in a model of
Apalachicola Bay, Florida, where individual shark species were treated as separate
functional groups, complementarity between shark species limited the effects of
individual shark species loss (Carlson 2007).

43
Impacts of some coastal elasmobranchs are not limited to their prey. The trophic
interactions of elasmobranchs with their prey can have cascading effects, influencing
community dynamics and therefore the flow of energy through systems. For example,
ecosystem models suggest that losses of tiger sharks in French Frigate Shoals, Hawaii,
Galapagos sharks Carcharhinus galapagensis and whitetip reef sharks Triaenodon
obesus in the Galapagos Islands, and of several species of small-bodied sharks in the
Northeast Venezuela Shelf could disrupt trophic cascades (Stevens et al. 2000, Okey et
al. 2004). Not surprisingly, like their direct impacts of their prey, ecosystems models
suggest the importance of elasmobranchs in structuring ecosystems varies (Stevens et al.
2000, Libralato et al. 2006). Elasmobranchs are most likely to influence community
dynamics in systems where they are important predators of large-bodied species, where
they do not overlap in habitat use with large teleost predators, and where they are not
involved in a large number of intraguild predation interactions which can buffer against
trophic cascades (Heithaus et al. 2008a, Kondoh 2008). Further studies on the
importance of sharks in intraguild predation are needed because intraguild predation can
influence the strength of trophic cascades and sharks appear to be a common participant
in these interactions (Kitchell et al. 2002, Bascompte et al. 2005, Kondoh 2008).
The greatest potential for elasmobranch influences on coastal community
structure appears to be in systems that feature high rates of batoid foraging and/or large
sharks. The effects may even be greater when elasmobranchs have direct effects on prey
species that are also capable of effecting community structure (e.g., marine mammals,
other elasmobranchs; Heithaus et al. 2008a). At this time, we are just beginning to

44
understand how these processes operate because of the many trophic interactions and
possible mechanisms involved.
Elasmobranch Impacts On Nutrient Dynamics
The influence of elasmobranchs on ecosystems is not limited to structuring
community composition through predator-prey interactions. Elasmobranchs can alter
nutrient dynamics through bioturbation, cross-ecosystem transport of nutrients during
migrations, movements associated with foraging forays away from refuge habitats, and
the death of newborns in nursery areas. In this section I briefly summarize these
interactions. A more detailed review can be found in Heithaus et al. (2010).
Benthic foraging elasmobranchs, in the process of capturing prey, often turn over
and resuspend sediment. For example, by hydraulically jetting water from the mouth or
gills (Gregory et al. 1979, Sasko et al. 2006), some batoids can create feeding pits up to
40cm deep (Smith and Merriner 1985). In areas frequented by batoids, approximately
1% (but with maximums up to about 5%) of the area can be covered by new foraging pits
per day (Reidenauer and Thistle 1981, VanBlaricom 1982, Sherman et al. 1983) and
foraging pits of various ages cover up to 30% of some areas (Grant 1983). Given that
even small-scale resuspension events, such as those caused by benthic fishes, have
profound effects on the reworking of the substrate surface (Yahel et al. 2002, Yahel et al.
2008), benthic foraging elasmobranchs may play an important role in nutrient dynamics
of at least some systems.
Unfortunately, the direct effect of batoid bioturbation on nutrient flux has not
been examined and in areas of high tidal reworking the volume of sediment reworked by

45
rays may be <1% of that of ripple migration (Grant 1983). However, in areas where
foraging pits remain for extended periods, they tend to accumulate organic matter at
higher rates than adjacent areas (VanBlaricom 1982). High levels of organic matter
settling in ray pits can result in rapid remineralization of the organic matter in the
sediments below the pits and decrease the impact of tidally driven advective porewater
flux, which is an important process in enhancing remineralization rates and carbon
cycling in sands (D’Andrea et al. 2002).
Alternatively, coastal elasmobranchs may be the vector of nutrient transport
across systems through their movements. Many coastal elasmobranchs are wide ranging
and given their extended food retention times (see section: Metabolism, Digestion And
Feeding Periodicity), it is quite possible that the areas of nutrient deposition through
waste products are not the areas were prey were consumed, effectively removing
nutrients from one system and introducing them to another. Through risk effects
elasmobranchs may also mediate similar nutrient transport of their prey. For example, in
tropical and subtropical coastal reef systems, many species seek refuge from predators
within reefs and/or mangrove prop roots. Many of these species forage in adjacent
habitats, such as seagrass, therefore transferring seagrass-derived nutrients into the safer
refuge habitats (e.g., Valentine and Heck 2005, Valentine et al. 2008).
Natural mortality of coastal elasmobranchs, especially young-of-the-year, may
also be a large source of nutrients especially in coastal and estuarine systems that
function as nurseries. Thousands of young elasmobranchs may be born in or enter
nursery habitats each year. Mortality rates of young-of-the-year elasmobranchs can
exceed 90% (Heupel and Simpfendorfer 2002, Duncan and Holland 2006). The death of

46
juvenile sharks in nursery areas will result in the addition of nutrients originally
assimilated outside of the nursery by adult females, in a manner similar, although at a
much smaller scale, to that of salmon in their natal streams. In the case of bull sharks,
which are euryhaline and known to enter rivers and estuarine systems (Martin 2005,
Simpfendorfer et al. 2005, Heupel and Simpfendorfer 2008, Heithaus et al. 2009a,
McCord and Lamberth 2009), these nutrient inputs may even enter the lower reaches of
freshwater systems.
Elasmobranchs As Facilitators Of Trophic Interactions
In addition to altering nutrient dynamics, sediment reworking can facilitate the
foraging of other species by uncovering and injuring infaunal organisms. Although little
work has been done with elasmobranch bioturbation, gray whale Eschrichtius robustus
feedings pits are often swarmed by large scavenging amphipods shortly after excavation
(Oliver and Slattery 1985) and several species of marine birds also take advantage of prey
items uncovered and suspended by gray whales (Harrison 1979, Grebmeier and Harrison
1992, Anderson and Lovvorn 2008). Anecdotal evidence suggests similar interactions
occur during elasmobranch foraging. Several fish species including remoras, jacks, and
cobia Rachycentron canadum are known to associate with benthic elasmobranchs and
consume ejected prey (Smith and Merriner 1982). Also, double-crested Cormorants
Phalacrocorax auritus have been observed following southern stingray and capturing fish
disturbed by the ray’s foraging (Kajiura et al. 2009). In the case of speckled sand dabs
Citharichthyes stigmaeus stomach contents of individuals captured feeding at ray pits

47
contained benthic prey items that are normally difficult to acquire; these prey items were
not found in the stomachs of sand dabs not associated with ray pits (VanBlaricom 1982).
Trophic Interactions Of Elasmobranchs In Coastal Ecosystems
In the following sections I summarize the interactions of elasmobranchs within
various habitat types. Ontogenetic habitat shifts and the scale of movement for many
elasmobranch species, however, tend to link coastal habitats. As a result, the trophic
relationships of elasmobranchs in a given area are likely to not only be influenced by
local conditions, but also the conditions of neighboring, and in some cases distant, areas
and habitats.
Coral Reefs
Coral reef habitats are home to a variety of elasmobranchs. Batoids are not
terribly common in coral reef habitats – especially in areas of extensive hard bottom – but
several species such as bluespotted fantail ray Taeniura lymma, bluespotted maskray
Neotrygon kuhlii, and blotched fantail ray Taeniurops meyeni are commonly found in
surrounding habitats (White and Sommerville 2010). Manta rays may also be seasonally
common around coral reefs to make use of pulses of high zooplankton production and
invertebrate and fish spawn (Sleeman et al. 2007, Dewar et al. 2008); whale sharks also
exploit these zooplanktivorous pulses (Taylor 1996, Heyman et al. 2001).
Carcharhinids tend to dominate the coral reef elasmobranch fauna, with some
species such as grey reef sharks, whitetip reef sharks, Caribbean reef sharks
Carcharhinus perezi, and blacktip reef sharks almost exclusively associated with coral

48
reef habitats (White and Sommerville 2010). Many small benthic sharks are also
common around coral reefs including some scyliorhinids (catsharks), and orectolobiform
sharks. Larger orectolobiform sharks including nurse and zebra sharks Stegostoma
fasciatum are also associated with coral reefs.
Members from all five trophic guilds can be found in coral reef habitats, although
most coral reef associated elasmobranchs are piscivores or invertivores. The
carcharhinids are generally active, medium to large sized sharks and are primarily
piscivorous, although cephalopods, and crustaceans are also consumed to various
degrees. The benthic sharks found in coral reef systems tend to be less active and feed on
a variety of benthic invertebrates, especially crustaceans, and small teleosts.
Wobbegongs, however, which are sit-and-wait ambush predators, consume higher
proportions of teleosts (Huveeneers et al. 2007), as do nurse sharks despite their
reputation as crustacean specialists (Castro 2000). Despite the physical similarity and
broad level dietary overlap between many of the species in these guilds, resource
partitioning is apparent. Network analysis of the Caribbean food web shows that the
most closely related shark species tend to occupy different compartments within the food
web (e.g., bull sharks and blacknose sharks Carcharhinus acronotus) and that prey sizes
differ between compartments (Rezende et al. 2009). Partitioning of resources may be
quite extreme among morphologically similar species. For example, the Australian
weasel shark, which is a carcarhiniform shark, preys almost exclusively on cephalopods,
especially octopus, while most sympatric carcharhiniform sharks feed primarily on
teleosts and only occasionally on cephalopods (Taylor and Bennett 2008).

49
Data from unfished reefs suggest that in undisturbed coral reef systems,
elasmobranchs make up a considerable amount of overall fish biomass. At Kingman and
Palmyra atolls in the tropical Pacific, top predators made up 85% and 56% of fish
biomass, respectively. Sharks composed 74% and 83% of the predator biomass at these
atolls, respectively (Sandin et al. 2008, Stevenson et al. 2007). In addition, within the
Caribbean food web sharks are involved in a disproportionally large fraction (48%) of
strongly interacting tri-trophic food chains, which could potentially lead to trophic
cascades (Rezende et al. 2009, Bascompte et al. 2005). Although within this system,
tiger sharks and Caribbean reef sharks are involved in a large number intraguild predation
interactions, which can buffer against trophic cascades (Kondoh 2008), over two thirds of
the strong tri-trophic interactions involving sharks were not buffered by intraguild
predation making them susceptible to trophic cascades (Bascompte et al. 2005). The
combination of high biomass and prevalence of strong trophic interactions involving
sharks suggests that sharks may play a key role in structuring coral reef systems.
Empirical studies, however, remain lacking.
Computer models of French Frigate Shoals suggest most carcharhinid sharks
actually may not have much of a structuring role in this coral reef system. When reef
sharks (carcharhinids not including tiger sharks) were removed from the model, changes
in fish biomass were small (within 10% of baseline levels), largely because the large
number of predator-prey interactions within the reef fish assemblage resulted in self-
regulation (Stevens et al. 2000). Surveys in the northwest Hawaiian Islands also suggest
reef sharks may have a relatively small overall effect on the structure of reef
communities. Although apex predator and herbivore biomass are similar in Palmyra and

50
the northwest Hawaiian Islands, shark biomass differs dramatically, with reef sharks
accounting for 83% of top predator biomass in Palmyra, while giant trevally Caranx
ignobilis composed 71% of top predator biomass in the northwestern Hawaiian Islands
(Stevenson et al. 2007). The similar community structure observed with decreased shark
abundance may indicate that in these systems large teleost predators and sharks are at
least somewhat functionally redundant, although the switch in predators with different
life history patterns suggests strong implications for community structure, energy flow,
and nutrient cycling (e.g., Gascuel et al. 2008).
On the other hand, tiger sharks do appear to have a structuring effect within the
French Frigate Shoals model. Simulated removal of tiger sharks resulted in large
biomass changes for several species groups. Reef sharks and sea turtles increased 9-fold
and seabirds and monk seals also showed noticeable increases (Stevens et al. 2000).
While these increases were the result of direct trophic interactions (predation and also
competition for reef sharks), tiger shark removal also caused cascading effects. Tuna and
jack populations crashed as a result of seabird increases, which then allowed for bottom
fish to increase because they were free from predation (Stevens et al. 2000). The large
difference in the effects of tiger shark and reef shark removals was likely the effect of
dietary differences between these sharks. Tiger sharks are larger than reef sharks and eat
larger prey (including reef sharks, seabirds, and monk seals) that often occupy higher
trophic levels than reef shark prey. By feeding on high trophic level species that may
themselves have the potential to influence the biomass of their prey, tiger sharks could
significantly alter reef community structure.

51
The trophic impacts of benthic elasmobranchs in coral reef systems are poorly
understood. Their effects on prey populations have not been examined, although small
sharks may influence nutrient cycling rates by stirring up sediment around coral heads
and in lagoons during foraging. For example, while foraging for infaunal prey, epaulette
sharks, a common benthic shark around coral reefs in northern Australia, will burrow
their head into the sand up to their first gill slit, expelling sand from their opercular
openings (Heupel and Bennett 1998). Larger sharks may even physically damage reef
structures while foraging. On Panamanian reefs, whitetip reef sharks can cause extensive
damage to pocilloporid corals while pursuing prey (Jimenez 1996). The impacts of these
behaviors on ecosystem dynamics remains unexplored.
Overall, the trophic impacts of elasmobranchs in coral reef systems appear to be
largely context dependent. In reef systems with large active teleost predators, medium-
sized reef sharks may be trophically redundant. Models from pelagic systems also
suggest redundancy between large active teleosts (i.e., tunas and billfishes) and sharks
(Kitchell et al. 2002), therefore limiting cascading effects of shark losses as a result of
compensatory responses of large teleost populations. There are no comparable predators
to larger species like tiger sharks, however, and such species may exert trophic impacts
on systems regardless of the presence of large active teleost predators. Therefore, future
work in reef systems should consider medium and large-bodied sharks as separate guilds
and functionally distinct.
52
Rocky Reefs
Carcharhiniform sharks are the most common elasmobranchs in rocky reef
systems, although the dominant families vary geographically. In warmer waters,
carcharhinids and heterodontids (in the Pacific and Indian Oceans) may be common,
while in cooler waters they are replaced by triakids, scyliorhinids and squalids
(dogfishes). Teleosts tend to be important dietary items for all these families, except
heterodontids, which favor hard-bodied invertebrates. Also, crustaceans tend to be more
important in the diets of triakids and squalids than in carcharhinids.
There has been little work on the effects of elasmobranchs in rocky reef systems,
but models of the Galapagos rocky reef system suggests they may help structure
communities. A variety of carcharhinid sharks are common in the Galapagos, including
large species such as the Galapagos shark and the whitetip reef shark. Of the 43
functional groups within the model, sharks were found to only rank 15th in terms of
interaction strength (the sum of all resulting relative changes in the system due to
removal of a functional group), but ranked 3rd in terms of keystone index (interaction
strength scaled to total biomass of a functional group) (Okey et al. 2004). As a result,
removal of sharks from the model resulted in several trophic cascades, with other large
predators, such as odontocete cetaceans (i.e., dolphins), sea lions, and predatory teleosts,
and sea turtles and marine iguanas increasing, and many commercial species and
octopods decreasing (Okey et al. 2004). Although these community changes seem
dramatic, the actual impact of sharks in this system may be more extreme because shark
biomass used in models may be well below that present historically (Okey et al. 2004).
Indeed, there have been dramatic decreases of common rocky reef elasmobranch species

53
as a result of overfishing. Leopard and school sharks off southern California (Pondella
and Allen 2008), and sand tiger sharks wordwide have all declined dramatically (Musick
et al. 1993, Otway et al. 2004, Lucifora et al. 2009).
Sharks may even play a role in the health of kelp forest communities. Great white
sharks appear to have been one of several factors that helped cause the decline of central
California sea otter populations between 1995 and 1999 (Estes et al. 2003). Sea otters are
a keystone species in kelp forests. Sea otter predation maintains urchins at relatively low
population sizes, protecting the kelp from overgrazing; loss of otters results in increased
sea urchin biomass, which leads to dramatic kelp loss through urchin grazing, and the
creation of urchin barrens (Estes et al. 1978, 1998). By extension, increased otter
mortality from great white sharks when combined with other factors could help lower
otter numbers below what is necessary to control urchin population sizes, altering kelp
densities and affecting kelp forest communities.
Within rocky reef habitats, especially in cooler waters, elasmobranchs may supply
an unlikely prey source to small-bodied species. Heterodontids and scyliorhinids are
oviparous and place their eggs in and around crevices, where they are vulnerable to
predation by teleosts, gastropods, and other elasmobranchs (Grover 1972, Powter and
Gladstone 2008). Off Santa Catalina Island in southern California, at least 70% of swell
shark Cephaloscyllium ventriosum egg cases encountered failed to survive to hatching
with 90% of these egg cases the suffering from predation (Grover 1972). On shallow
rocky reefs off New South Wales, Australia, embryonic mortality rates of Port Jackson
sharks Heterodontus portusjacksoni were even higher with 89% of egg cases suffering
mortality with 98% of the loss because of predation (Powter and Gladstone 2008). In

54
deeper rocky habitats, skates may also contribute to the number of egg cases found in
these habitats. On the basis of transect observations, Love et al. (2008) estimated
approximately 19000 egg cases from longnose skates covered a rocky reef of about
28000 m2 in the southern California Bight. Of these egg cases, only 2600 were estimated
to still contain embryos, although the proportion of non-intact egg cases that hatched
versus died via predation or natural mortality was not assessed (Love et al. 2008).
Seagrass Beds and Mangroves
Seagrass beds and mangrove habitats are used by a wide variety of elasmobranchs
and individuals of many species are likely to move between these often neighboring
habitat types. Carcharhinids tend to dominate the elasmobranch fauna of seagrass beds
and mangrove areas and many of these species use seagrass and mangroves as nursery
habitats (e.g., Feldheim et al. 2002, White and Potter 2004, DeAngelis et al. 2008, Powter
and Gladstone 2009), but adults also make use of these areas. The importance of
seagrass and mangroves as nursery grounds may be shown in the decreasing juvenile
survival rate of lemon sharks in the North Sound of Bimini, Bahamas that corresponds to
losses of mangrove and seagrass habitats as a result of coastal development (Jennings et
al. 2008).
Much like other systems, the sharks in seagrass and mangrove systems tend to be
primarily piscivorous (e.g., Brewer et al. 1995, White et al. 2004, Newman et al. 2010).
The productivity and structural complexity of the habitat, however, allows for a wide
breadth of abundant prey species and as a result other prey types, especially crustaceans
and cephalopods, are also commonly found in the stomachs of sharks within these

55
systems (e.g., Brewer et al. 1995, White et al. 2004, Taylor and Bennett 2008) and some
species even specialize on non-teleost prey, such as the bonnethead shark, which feeds
almost exclusively on crustaceans (Cortés et al. 1996, Bethea et al. 2007), and the
Australian weasel shark, which specializes on cephalopods (Taylor and Bennett 2008).
Although non-teleost species may be of relatively minor importance to the diets of most
of the shark species within seagrass and mangrove habitats, the elasmobranch community
may have a large impact on some prey types, as was observed in Groote Eylandt,
Australia, where six carcharhinids (spottail shark, milk shark, Australian sharpnose shark
Rhizoprionodon taylori, nervous shark, whitecheek shark Carcharhinus dussumieri, and
grey reef shark) combined for over one third of the combined impact of all predators on
tiger prawns Penaeus spp. (Brewer et al. 1995).
Seagrass is frequently found in the stomachs of sharks foraging in seagrass beds,
but it usually makes up a very small proportion of the mass or volume of stomach
contents and likely is consumed incidentally (Cortés and Gruber 1990, Brewer et al.
1995, White et al. 2004, Collins et al. 2007). The exception is the bonnethead shark.
Cortés et al. (1996) found that in southwestern Florida 56% of bonnethead sharks
stomachs with prey items contained seagrass and that if included as a prey item, seagrass
made up over 12% of the IRI for these sharks. A more recent study examining
bonnethead shark diets across the gulf coast of Florida found that seagrass might even be
a more important item in stomach contents. Seagrass made up >15% of the IRI in 6 of 7
life stage-area classes, >30% of the Index of Relative Importance (IRI) in 4 of the 7
classes and reached a maximum of 62% of the IRI in young-of-the-year bonnethead
sharks from northwestern Florida (Bethea et al. 2007). Undigested seagrass was rarely

56
observed in the intestine of these animals and there has been no evidence of seagrass in
feces of bonnethead sharks, suggesting the plant material is digested (Bethea et al. 2007).
Whether digested seagrass is assimilated remains unknown and is the topic of current
research efforts.
Although the diets of many elasmobranchs in seagrass and mangrove habitats
have been examined, the impacts of elasmobranchs on prey populations in these habitats
are largely unknown. Evidence from seagrass beds in the southeastern United States
suggests that for some prey species the predatory impacts of elasmobranchs may be
severe. Schools of cownose rays foraging over North Carolina shoals were able to
completely remove bay scallops Argopecten irradians concentricus from productive
habitats creating localized population sinks (Peterson et al. 2001). Because cownose rays
cause the crash of bay scallop populations prior to the scallop spawning season, predation
by cownose rays may have substantial impacts on scallop recruitment and populations
sizes (Myers et al. 2007). The impacts of foraging cownose schools, however, are not
limited to their prey. Batoid foraging and the resulting bioturbation also has the potential
to dramatically structurally change an environment on a large scale. While foraging,
batoids may disturb and uproot submerged vegetation, such as seagrasses (Orth 1975,
Valentine et al. 1994). Cownose rays, have been implicated in the fragmentation of large
seagrass beds in Chesapeake Bay (Hovel and Lipcius 2001) and in an extreme case were
responsible for the destruction of approximately 90 hectares of seagrass beds in
Chesapeake Bay and the loss of 15-30cm of sediment over the following years (Orth
1975). By altering these habitats, which provide habitat to many species (e.g., Travers
and Potter 2002, Knowles and Bell 1998), batoids can be an important indirect influence

57
on the distribution and abundance of seagrass-associated species (e.g., Hovel and Lipcius
2001). The impacts caused by these predators, however, may vary with location. In
Charlotte Harbor, on the west coast of Florida, cownose rays appear to be opportunistic
foragers, do not selectively forage in seagrass beds, and are therefore probably not
responsible for large-scale modifications of seagrass beds and shellfish decline in this
area (Collins et al. 2007). In addition, the ability of batoids to uproot seagrass varies with
species. Valentine et al. (1994) found that southern stingrays were unable to create
unvegetated patches within a turtlegrass Thalassia testudinum bed and only southern
stingrays with disc widths greater than 0.9m damaged turtlegrass rhizomes at the
turtlegrass-sand interface.
Several species of true apex predatory elasmobranchs frequent seagrass habitats
including bull sharks, great hammerheads, and tiger sharks. Because these species can
take large-bodied species that may themselves help to structure ecosystems, these species
may be particularly critical to the dynamics of seagrass communities. Strong risk effects
of tiger sharks on several of their prey species have been observed in Shark Bay, Western
Australia and these risk effects, combined with direct predation could influence
equilibrium population sizes (see Heithaus et al. 2008a,b, Wirsing et al. 2008 for
summaries). When tiger sharks are abundant in Shark Bay, dolphins Tursiops aduncus,
dugongs Dugong dugon, cormorants Phalacrocorax varius, sea snakes Hydrophis
elegans and Disteria major, and green turtles, shift their habitat use patterns; they
abandon dangerous but food rich habitats for habitats that allow for either increased
escape probabilities or lower rates of encounter with tiger sharks (Heithaus and Dill 2002,
2006, Heithaus 2005, Heithaus et al. 2007d, 2009b, Wirsing et al. 2007a,b, 2008, Kerford

58
et al. 2008, Wirsing and Heithaus 2009). Dugongs also alter their foraging behaviors
during periods of high tiger shark abundance from excavating nutrient rich seagrass
rhizomes to cropping seagrass leaves, presumably to avoid creating sediment plumes that
would inhibit vigilance (Wirsing et al. 2007c).
The anti-predator responses of large grazers to tiger sharks in this system may
impact seagrass communities (see Heithaus et al. 2008, 2010); the spatial pattern of
seagrass leave nutrient composition is consistent with shifts in the spatial pattern of
herbivory induced by tiger shark predation risk (Heithaus et al. 2007d). Experimental
evidence from multiple systems shows that dugongs have strong top-down effects of
seagrass communities (e.g., Preen 1995, Masini et al. 2001) and it is therefore likely that
tiger shark induced changes in the herbivory of large grazers affect seagrass composition
and the faunal structure of these seagrass communities (Heithaus et al. 2008a,b). A
similar cascade appears to have occurred in Bermuda (Heithaus et al. 2008b). Increased
green turtle populations and seagrass loss have occurred (Murdoch et al. 2007) following
large declines in shark abundance (Baum et al. 2003). Exclosure experiments in multiple
systems will help to elucidate the possible mechanisms of tiger shark-induced cascades.
Unvegetated Soft Bottom
Unvegetated soft bottom habitats (“soft bottom” hereafter) lack physical structure
and complexity and as a result much of the species diversity in these systems is infaunal.
Fish diversity and densities also tend to be reduced compared to other habitats with more
structure, but many elasmobranchs commonly use coastal soft bottom habitats. Notable
elasmobranchs often found in these areas include triakids, squatinids (angel sharks), and a
59
wide variety of batoids; all of which are bottom-associated and tend to have diets made
up of large proportions of benthic invertebrates, especially crustaceans. In fact,
elasmobranch densities in some soft bottom habitats, especially those of rays, can be
remarkably high (e.g., Plattel et al. 1998, Hoisington and Lowe 2005, Semeniuk and Dill
2005, Vaudo and Heithaus 2009) and because of their size can make up a substantial
proportion of total fish biomass in these systems. For example, the round stingray
Urobatis halleri dominated the 78 fish species caught in San Diego Bay, California,
composing approximately 25% of the total fish biomass (Allen et al. 2002).
While in a sandy beach system in South Africa, three species of elasmobranchs composed
almost 83% of the biomass in a fish community of 24 species (Clark 1997).
Given their density and biomass in some soft bottom communities, elasmobranchs
may play an important role as predators in these systems. On the sandflats of Manukau
Harbour, New Zealand, excluding seabirds and eagle rays Myliobatis tenuicaudatus from
plots resulted in density increases of potential prey species, including clams and sea
cucumbers. These effects were not seen when only birds were excluded (no exclosures
excluded rays while allowing bird predation) (Thrush et al. 1994), implicating ray
predation as the main cause of density changes in potential prey species. Over 31-day
period, eagle rays within this system were estimated to consume 1.6% of the Macomona
clam population. Foraging, however, was focused on areas of high clam density,
resulting in these areas suffering 4% mortality. By focusing foraging efforts in areas of
high prey density, the rays may help stabilize prey populations and homogenize prey
distribution (Hines et al. 1997).
60
There are few estimates of the numerical impact elasmobranchs in soft bottom
habitats may have on prey population. On the basis of prey densities and a maintenance
ration of 3% body weight day-1, Bush and Holland (2002) estimated that in 5 months
5000 juvenile scalloped hammerhead sharks could consume approximately 20% of the
gobies and alpheid shrimp in Kaneohe Bay accounting for about 5.5% of the productivity
for these species. However, recent estimates suggest a juvenile scalloped hammerhead
shark population closer to 8000 individuals and that individuals remain in Kaneohe Bay
for up to 1 year (Duncan and Holland 2006), suggesting their impact may be larger.
Impacts may be even larger in Langebaan Lagoon, South Africa. It has been estimated
that lesser sand sharks Rhinobatos annulatus may consume up to 77% of annual
invertebrate production (Harris et al. 1988).
The impacts of elasmobranch excavation foraging are not solely limited to prey
species. Batoid foraging reduces meiofaunal species density within foraging pits and
lower densities areawide are possibly the result of the continued disturbance by rays
(Cross and Curran 2000, Cross and Curran 2004). Recolonization of foraging pits by
benthic invertebrates can show predictable patterns, with some species, such as
amphipods, actively seeking out recently formed pits to exploit organic matter that
accumulates in foraging pits. Systems that lack small-scale disturbances, such as ray
foraging pits, often lack these early colonist species (VanBlaricom 1982). By allowing
persistence of species within soft bottom communities, such rapid colonization of ray
foraging pits may play an important role in maintaining dominance patterns (Thrush et al.
1991).

61
Although elasmobranchs are top predators in soft bottom systems, their impacts
are not limited to top-down effects. Since many of the prey in these systems are infaunal
or can bury, foraging often involves excavation. Such foraging excavations, especially in
areas of high elasmobranch density, can result in the turnover of large volumes of
sediment. Several studies have shown that in areas frequented by batoids, new foraging
pits cover can cover 1-5% of the substrate each day (Reidenauer and Thistle 1981,
VanBlaricom 1982, Sherman et al. 1983) and up to 30% of the substrate can be covered
with foraging pits of various ages (Grant 1983). Over time this can result in considerable
sediment turnover. Thrush et al. (1991) estimated eagle rays in Manukau Harbour can
completely turnover an area of 700-800 m2 in 70 days. High rates of batoid induced
sediment turnover have also been found in Bahia La Choya, Mexico. The combined
bioturbation of the three batoids found in this location can rework the midflats area of the
bay to a depth of about 20 cm in 72 days (Myrick and Flessa 1996). However, in areas
that receive large amounts of tidal reworking, the impacts of elasmobranch bioturbation
may be minimal, as sediment reworked by elasmobranchs may account for <1% of that of
ripple migration (Grant 1983).
If the contribution of sediment reworking is large, elasmobranchs may also
contribute to bottom-up processes within some soft bottom systems. Although it has not
been examined, the nutrients resuspended by elasmobranch excavations may alter
nutrient dynamics in the water layer above the substrate surface. In addition, organic
matter accumulates at a higher rate within feeding pits than outside of pits (VanBlaricom
1982). The accumulation of organic matter with feeding pits can alter remineralization

62
rates below the pits, altering water flow through the sediment, which can alter carbon
cycling in sands (D’Andrea et al. 2002).
Estuaries
Many of the habitats mentioned above occur in estuaries. However, nutrient
inputs from freshwater and terrestrial systems in many estuarine systems support higher
productivity than similar habitats where these inputs are absent, and therefore, enhance
prey availability (Cruz-Escalona et al. 2007, Acha et al. 2008). Furthermore, large
predators are often absent from shallow or low-salinity portions of these habitats, with the
possible exception of large bull sharks, which can tolerate low salinity waters and
penetrate far inland into freshwater (Martin 2005, Simpfendorfer et al. 2005, Heupel and
Simpfendorfer 2008, Heithaus et al. 2009a, McCord and Lamberth 2009).
A variety of shark and batoid species can be found in estuaries, with most of the
species being piscivores or invertevores. Carcharhiniforms (carcharhinids, sphyrnids,
and triakids) are the dominant sharks found in estuarine waters with species such as the
bull shark and river sharks Glyphis spp. able to spend extended periods in freshwater
(Martin 2005, Simpfendorfer et al. 2005, Heupel and Simpfendorfer 2008, Heithaus et al.
2009a, McCord and Lamberth 2009). Estuarine batoids include members of the families
Myliobatidae, Rhinopteridae, Dasyatidae (stingrays), Rhinobatidae (shovelnose rays),
and Pristidae (sawfishes), with some stingrays (e.g., freshwater whipray Himantura
chaophraya) and sawfish (e.g., freshwater sawfish Pristis microdon) capable of tolerating
freshwater (Martin 2005). In addition, several of these species can attain very large sizes

63
(freshwater whipray – 2m disc width; freshwater sawfish – 7m total length; bull shark –
3.4m total length).
While many elasmobranchs use estuaries throughout the year in subtropical and
tropical habitats (e.g., Carlisle and Starr 2009, Gray et al. 1997, Salini et al. 1992), others,
especially in temperate waters, use estuaries and other shallow coastal habitats seasonally
to breed (e.g., Yamaguchi et al. 2005, Hunter et al. 2006, Carlisle et al. 2007) and as
nurseries (e.g., Simpfendorfer and Milward 1993, Gray et al. 1997, McCandless et al.
2007). Although the impacts of these seasonal pulses of elasmobranch predators have
rarely been examined (see section: Unvegetated Soft Bottom), it surely increases
predation rates on some prey species (although the impacts on populations of these prey
is unknown), and the high mortality rates (up to 93%) of young-of-the-year
elasmobranchs will provide an allocthonous nutrient source in these systems (Gruber et
al. 2001, Heupel and Simpfendorfer 2002, Duncan and Holland 2006, Heithaus et al.
2010).
Open Coastal Waters
Several coastal sharks spend considerable amounts of time in the water column
and are often not associated with benthic habitats. Lamnids and some large carcharhinids
are the main groups of sharks that fall into this category. Because of their large size,
these sharks tend to be apex predators, feeding on large fishes, small sharks, and for some
species, such as the great white shark, marine mammals. In many of the more pelagic
species, cephalopods are also an important prey item [e.g., blue sharks (Tricas 1979) and
salmon shark (Kubodera et al. 2007)].

64
One of the more notable trophic interactions involving elasmobranchs in this
habitat realm is the predator-prey relationship between large sharks and marine
mammals, in particular great white sharks and pinnipeds. Seasonally, great white sharks
in the eastern Pacific and South Africa gather at pinniped rookeries to take advantage of
plentiful prey (Anderson and Pyle 2003, Martin et al. 2005, Domeier and Nasby-Lucas
2007). Although the predatory behaviors and factors affecting successful predatory
events have been examined at these locations (Tricas and McCosker 1984, Tricas 1985,
Martin et al. 2005, Hammerschlag et al. 2006, Martin et al. 2009) and pups appear to be
targeted by the sharks (Martin et al. 2005, Laroche et al. 2008), the numerical impact of
great white sharks on these pinniped populations remains unknown. However, it appears
that pinnipeds at these sites respond to the presence of great white sharks by altering their
behavior. For example, many of the diving behaviors of northern elephant seals
Mirounga angustirostris off California are consistent with hypotheses of avoiding
predation by great white sharks (Le Bouf and Crocker 1996) and at Seal Island in False
Bay, South Africa, adult Cape fur seals Arctocephalus pusillus pusillus return to the
island under the cover of darkness, while seal pup and shark numbers are highest at dawn
(Laroche et al. 2008).
Great white sharks are not the only shark species with the potential to influence
pinniped populations. Off Sable Island, Canada, predation by sharks on harbor seal
Phoca vitulina pups and mature females accounted for at least 50% of the decline in
production for that was observed between 1993 and 1997 and is responsible for much of
the decline in this seal population (Lucas and Stobo 2000, Bowen et al. 2003). And in
Prince William Sound, Alaska, empirical data and theoretical models suggest harbor seals

65
and Stellar sea lions Eumetopias jubatus underutilize resources in deep water to avoid
predation by Pacific sleeper sharks (Frid et al. 2007, 2008, 2009). Models of sleeper
shark-harbor seal interactions also suggest the potential for a trophic cascade in the
northeastern Pacific (Frid et al. 2008). Model removal of sharks from this system results
in seals shifting their foraging behavior to exploit profitable deeper water fish, releasing
shallow water fish from predation. Because of the densities of harbor seals in the
northeastern Pacific, loss of sharks from this system has the potential for causing
substantial changes in the teleost community.
The importance of trophic cascades induced by coastal elasmobranchs in open
coastal waters has also been suggested based on a combination of time-series and
experimental data. Myers et al. (2007) proposed that overfishing of large sharks in the
open coastal waters of the northwestern Atlantic started a cascade that has resulted in the
collapse of the North Carolina bay scallop population. The loss of large sharks from
coastal waters is thought to have released cownose rays from predation, resulting in a
population expansion and the larger migrating ray population caused the collapse of the
bay scallop population in seagrass habitats through consumption. The declines of large
shark population are widely acknowledged and the ability of cownose rays to cause major
habitat disturbances has previously been observed (e.g., Orth 1975 see section: Seagrass
Beds and Mangroves) and field experiments have shown that cownose rays can collapse
local scallop populations (Peterson et al. 2001, Myers et al. 2007). Whether predatory
release has caused an increase in cownose rays, however, has drawn criticism. In
addition to some of the questions raised previously, there is some degree of mismatch in
the timing of the decrease of bay scallop populations (1980s) and increases in ray catches

66
(1990s). In the late 1980s, prior to the reported increase in rays, scallop losses caused by
a red tide outbreak resulted in well below average scallop recruitment for several years
(Summerson and Peterson 1990, Peterson and Summerson 1992). As a result, the recent
impacts of cownose rays may not be the sole cause of scallop population collapse but
may exacerbate continuing declines. Despite criticism of this example, given the
worldwide declines in large coastal shark populations, the possibility of such a cascade
highlights the importance for research on the importance of shark predation and risk
effects, as well as their role in driving habitat.
Conclusions
Despite their reputation as apex predators in marine systems and the prevalence of
teleosts in the diets of most species studied, coastal elasmobranchs occupy a variety of
trophic positions ranging from zooplanktivores to apex predators. Most coastal
elasmobranchs, however, fill the role of mid to upper level predators in the systems they
occupy. Unfortunately, because of the difficulty of working with these animals, both in
the wild and in captivity, little else is known about the trophic relationships of most
coastal elasmobranchs. As a result, it is hard to generalize their impacts and expand on
the role of elasmobranchs in coastal systems, which appears to be system- and taxa-
specific. Therefore, lumping sharks into a single guild will likely result in misleading
conclusions. Indeed, studies in other taxa suggest that even considering individuals of
single populations to be trophically identical can result in misunderstandings of a species
role in their communities (e.g., Bolnick et al. 2003, Quevedo et al. 2009). The prevalence
and importance of individual specialization in trophic interactions is just beginning to be

67
explored for elasmobranchs (Matich et al. 2011) and is an important area for future
investigations.
Elasmobranch diet studies are numerous and a crucial first step in the
understanding of coastal elasmobranch trophic ecology, but in most cases the diet of a
species’ full size range has not been examined and many diet studies are limited in their
geographic scope. Future work, however, will need to extend well beyond diet studies.
Internal factors, such as digestive and metabolic rates play a crucial role in the trophic
relationships of elasmobranchs because they determine feeding periodicity and daily
ration. Unfortunately, these topics are difficult to study in elasmobranchs and therefore
have received little attention. Recent technological advances, particularly in the realm of
telemetry, however, are now making these avenues of research viable and will hopefully
expand our knowledge of elasmobranch feeding behavior. This information can then be
combined with movement data and the increasingly popular stable isotope analysis to
determine where and in which food chain elasmobranchs are feeding, allowing for a more
thorough assessment of elasmobranch trophic relationships and impact.

68
LITERATURE CITED
Abdel-Aziz, S.H., 1994. Observations on the biology of the common torpedo (Torpedo torpedo, Linnaeus, 1758) and marbled electric ray (Torpedo marmorata, Risso, 1810) from Egyptian Mediterranean waters. Australian Journal of Marine and Freshwater Research, 45: 693-704.
Acevedo-Gutierrez, A., 2002. Interactions between marine predators: dolphin food intake
is related to number of sharks. Marine Ecology Progress Series, 240: 267-271. Acha, E.M., Mianzan, H., Guerrero, R., Carreto, J., Giberto, D., Montoya, N., Carignan,
M., 2008. An overview of physical and ecological processes in the Rio de la Plata Estuary. Continental Shelf Research, 28: 1579-1588.
Allen, L.G., Findlay, A.M., Phalen, C.M., 2002. Structure and standing stock of the fish
assemblages of San Diego Bay, California from 1994 to 1999. Bulletin of Southern California Academy of Sciences, 101: 49-85.
Anderson, E.M., Lovvorn, J.R., 2008. Gray whales may increase feeding opportunities
for avian benthivores. Marine Ecology Progress Series, 360: 291-296. Anderson, S., Pyle, P., 2003. A temporal, sex-specific occurrence pattern among white
sharks at the South Farallon Islands, California. California Fish and Game, 89:96–101.
Anholt, B.R., Werner, E.E., 1995. Interaction between food availability and predation
mortality mediated by adaptive behavior. Ecology, 76: 2230-2234. Aubret, F., Bonnet, X., 2005. Influences of body reserves and eye opacity on foraging
behaviours of tiger snakes. Journal of Experimental Zoology, 303A: 1075-1084. Barry, K.P., Condrey, R.E., Driggers, W.B., Jones, C.M., 2008. Feeding ecology and
growth of neonate and juvenile blacktip sharks Carcharhinus limbatus in the Timbalier-Terrebone Bay complex, LA, USA. Journal of Fish Biology, 73: 650-662.
Bascompte, J.C., Melián, C.J., Sala, E., 2005. Interaction strength combinations and the
overfishing of a marine food web. Proceedings of the National Academy of Sciences, 102: 5443-5447.
Baum, J.K., Myers, R.A., 2004. Shifting baselines and the decline of pelagic sharks in the
Gulf of Mexico. Ecology Letters, 7: 135-145.

69
Baum, J.K., Myers, R.A., Kehler, D.G., Worm, B., Harley, S.J., Doherty, P.A., 2003. Collapse and conservation of shark populations in the Northwest Atlantic. Science, 299: 389-392.
Bethea, D.M., Buckel, J.A., Carlson, J.K., 2004. Foraging ecology of the early life stages
of four sympatric shark species. Marine Ecology Progress Series, 268: 245-264. Bethea, D.M., Carlson, J.K., Buckel, J.A., Satterwhite, M., 2006. Ontogenetic and site-
related trends in the diet of the Atlantic sharpnose shark Rhizoprionodon terraenovae from the Northeast Gulf of Mexico. Bulletin of Marine Science, 78: 287-307.
Bethea, D.M., Hale, L., Carlson, J.K., Cortés, E., Manire, C.A., Gelsleichter, J., 2007.
Geographic and ontogenetic variation in the diet and daily ration of the bonnethead shark, Sphyrna tiburo, from the eastern Gulf of Mexico. Marine Biology, 152: 1009-1020.
Bizzarro, J.J., Robinson, H.J., Rinewalt, C.S., Ebert, D.A., 2007. Comparative feeding
ecology of four sympatric skate species off central California, USA. Environmental Biology of Fishes, 80: 197-220.
Blaylock, R.A., 1989. A massive school of cownose rays, Rhinoptera bonasus
(Rhinopteridae), in lower Chesapeake Bay. Copeia, 1989: 744-748. Blaylock, R.A., 1993. Distribution and abundance of the cownose ray, Rhinoptera
bonasus, in lower Chesapeake Bay. Estuaries, 16: 255-263. Bolnick, D.I., Svanback, R., Fordyce, J.A., Yang, L.H., Davis, J.M., Hulsey, C.D.,
Forister, M.L., 2003. The ecology of individuals: incidence and implications of individual specialization. American Naturalist, 161: 1-28.
Bonfil, R., Meyer, M., Scholl, M.C., Johnson, R., O’Brien, S., Oosthuizen, H., Swanson,
S., Kotze, D., Paterson, M., 2005. Transoceanic migration, spatial dynamics, and population linkages of white sharks. Science, 310: 100-103.
Bor, P.H.F., Santos, M.B., 2003. Findings of elasmobranch eggs in the stomachs of
sperm whales and other marine organisms. Journal of the Marine Biological Association of the United Kingdom, 83: 1351-1353.
Bowen, W.D., Ellis, S.L., Iverson, S.J., Boness, D.J., 2003. Maternal and newborn life-
history traits during periods of contrasting population trends: implications for explaining the decline of harbour seals, Phoca vitulina, on Sable Island. Journal of Zoology, London, 261: 155-163.

70
Braccini, J.M., 2008. Feeding ecology of two high-order predators from south-eastern Australia: the coastal broadnose and the deepwater sharpnose sevengill sharks. Marine Ecology Progress Series, 371: 273-284.
Branstetter, S., 1990. Early life-history implications of selected carcharhinoid and
lamnoid sharks of the northwest Atlantic. In: Pratt, H.L. Jr., Gruber, S.H., Taniuchi, T. (Eds.), Elasmobranchs as Living Resources: Advances in Biology, Ecology, Systematics and the Status of the Fisheries. NOAA Tech Rep 90, National Marine Fisheries Service, Silver Spring, MD, pp. 17–28.
Bray, R.N., Hixon, M.A., 1978. Night Shocker: predatory behavior of the Pacific electric
ray (Torpedo californica). Science, 200: 334-334. Brewer, D.T., Blaber, S.J.M., Salini, J.P., Farmer, M.J. 1995. Feeding ecology of
predatory fishes from Groote Eylandt in the Gulf of Carpentaria, Australia, with special reference to predation on penaeid prawns. Estuarine Coastal and Shelf Science, 40: 577-600.
Brown, K.M., Alexander, J.E., Jr., 1994. Group foraging in a marine gastropod predator:
benefits and costs to individuals. Marine Ecology Progress Series, 112: 97-105. Bruce, B.D., 1992. Preliminary Observations on the Biology of the White Shark,
Carcharodon carcharias, in South Australian Waters. Australian Journal of Marine and Freshwater Research, 43: 1-11.
Bruce, B.D., Stevens, J.D., Malcolm, H., 2006. Movements and swimming behaviour of
white sharks (Carcharodon carcharias) in Australian waters. Marine Biology, 150: 161–172.
Bush, A., 2003. Diet and diel feeding periodicity of juvenile scalloped hammerhead
sharks, Sphyrna lewini, in Kane'ohe Bay, O'ahu, Hawai'i. Environmental Biology of Fishes, 67: 1-11.
Bush, A., Holland, K., 2002. Food limitation in a nursery area: Estimates of daily ration
in juvenile scalloped hammerheads, Sphyrna lewini (Griffith and Smith, 1834) in Kane'ohe Bay, O'ahu, Hawai'i. Journal of Experimental Marine Biology and Ecology, 278: 157-178.
Campos, B.R., Fish, M.A., Jones, G., Riley, R.W., Allen, P.J., Klimley, P.A., Cech, J.J.,
Kelly, J.T. 2009. Movements of brown smoothhounds, Mustelus henlei, in Tomales Bay, California. Environmental Biology of Fishes, 85: 3-13.

71
Capape, C., Crouzet, S., Clement, C., Vergne, Y., Guelorget, O., 2007. Diet of the marbled electric ray Torpedo marmorata (Chondrichthyes: Torpedinidae) off the Languedocian coast (southern France, northern Mediterranean). Annales Series Historia Naturalis, 17: 17-22.
Carlisle, A., King, A., Cailliet, G.M., Brennan, J.S., 2007. Long-term trends in catch
composition from elasmobranch derbies in Elkhorn Slough, California. Marine Fisheries Review, 69: 25-45.
Carlisle, A.B., Starr, R.M., 2009. Habitat use, residency, and seasonal distribution of
female leopard sharks Triakis semifasciata in Elkhorn Slough, California. Marine Ecology Progress Series, 380: 213-228.
Carlson, J.K., 2007. Modeling the role of sharks in the trophic dynamics of Apalachicola
Bay, Florida. In: McCandless, C.T., Kohler, N.E., Pratt, H.L. Jr. (Eds.), Shark Nursery Grounds of the Gulf of Mexico and the East Coast Waters of the United States. American Fisheries Society, Symposium 50, Bethesda, MD, pp. 281-300.
Carlson, J.K., Goldman, K.J., Lowe, C.G., 2004. Metabolism, energetic demand, and
endothermy. In: Carrier, J.C., Musick, J.A., Heithaus, M.R. (Eds.), The Biology of Sharks and Their Relatives. CRC Press, Boca Raton, FL, pp. 203-224.
Carlson, J.K., Parsons, G.R., 2003. Respiratory and hematological responses of the
bonnethead shark, Sphyrna tiburo, to acute changes in dissolved oxygen. Journal of Experimental Marine Biology and Ecology, 294: 15-26.
Cartamil, D.P., Vaudo, J.J., Lowe, C.G., Wetherbee, B.M., Holland, K.N., 2003. Diel
movement patterns of the Hawaiian stingray, Dasyatis lata: Implications for ecological interactions between sympatric elasmobranch species. Marine Biology, 142: 841-847.
Casey, J.G., Pratt, H.L., Jr, 1985. Distribution of the white shark, Carcharodon
carcharias, in the western North Atlantic. Memoirs of the Southern California Academy of Sciences, 9: 2–14.
Castro, J.I., 1996. Biology of the blacktip shark, Carcharhinus limbatus, off the
southeastern United States. Bulletin of Marine Science, 59: 508-522. Castro, J.I., 2000. The biology of the nurse shark, Ginglymostoma cirratum, off the
Florida east coast and the Bahama Islands. Environmental Biology of Fishes, 58: 1-22.
Chapman, D.D., Gruber, S.H., 2002. A further observation of the prey-handling behavior
of the great hammerhead shark, Sphyrna mokarran: Predation upon the spotted eagle ray, Aetobatus narinari. Bulletin of Marine Science, 70: 947-952.

72
Clark, B.M., 1997. Variation in surf-zone fish community structure across a wave-exposure gradient. Estuarine, Coastal and Shelf Science, 44: 659-674.
Clark, C.W., 1994. Antipredator behaviour and the asset-protection principle.
Behavioural Ecology, 5: 159–170. Clarke, S.C., McAllister, M.K., Milner-Gulland, E.J., Kirkwood, G.P., Michielsens,
C.G.J., Agnew, D.J., Piktich, E.K., Nakano, H., Shivji, M.S., 2006. Global estimates of shark catches using trade records from commercial markets. Ecology Letters, 9: 1115-1126.
Clarke, T.A., 1971. The ecology of the scalloped hammerhead shark, Sphyrna lewini, in
Hawaii. Pacific Science, 25: 133-144. Cliff, G., 1995. Sharks caught in the protective gill nets off KwaZulu-Natal, South
Africa. 8. the great hammerhead shark Sphyrna mokarran (Rüppell). South African Journal of Marine Science, 15: 105-114.
Cliff, G., Dudley, S.F.J., 1991. Sharks caught in the protective gill nets off Natal, South
Africa. 5. the Java shark Carcharhinus amboinensis (Muller & Henle). South African Journal of Marine Science, 11: 443-453.
Cliff, G., Dudley, S.F.J., 1992. Sharks caught in the protective gill nets off Natal, South
Africa. 6. the copper shark Carcharhinus brachyurus (Gunther). South African Journal of Marine Science, 12: 663-674.
Cliff, G., Dudley, S.F.J., Davis, B., 1988. Sharks caught in the protective gill nets off
Natal, South Africa. 1. The sandbar shark Carcharhinus plumbeus (Nardo). South African Journal of Marine Science, 7: 255–265.
Cliff, G., Dudley, S.F.J., Davis, B., 1989. Sharks caught in the protective gill nets off
Natal, South Africa. 2. the great white shark Carcharodon carcharias (Linnaeus). South African Journal of Marine Science, 8: 131–144.
Collins, A.B., Heupel, M.R., Hueter, R.E., Motta, P.J., 2007. Hard prey specialists or
opportunistic generalists? An examination of the diet of the cownose ray, Rhinoptera bonasus. Marine and Freshwater Research, 58: 135-144.
Compagno, L.J.V., 1984. FAO species catalogue. Vol. 4. Sharks of the world. An
annotated and illustrated catalogue of shark species known to date. Part 2. Carcharhiniformes. FAO Fisheries Synopsis, 125: 251-655.
Condit, R., Le Boeuf, B.J., 1984. Feeding habitats and feeding grounds of the northern
elephant seal. Journal of Mammalogy, 65: 281-290.

73
Corkeron, P.J., Morris, R.J., Bryden, M.M., 1987. Interactions between bottlenose dolphins and sharks in Moreton Bay, Queensland. Aquatic Mammals, 13: 109-113.
Cortés, E., 1997. A critical review of methods of studying fish feeding based on analysis
of stomach contents: Application to elasmobranch fishes. Canadian Journal of Fisheries and Aquatic Sciences, 54: 726-738.
Cortés, E., 1999. Standardized diet compositions and trophic levels of sharks. ICES
Journal of Marine Science, 56: 707-717. Cortés, E., Gruber, S.H., 1990. Diet, feeding habits and estimates of daily ration of young
lemon sharks, Negaprion brevirostris (Poey). Copeia, 1990: 204-218. Cortés, E., Gruber, S.H., 1992. Gastric evacuation in the young lemon shark, Negaprion
brevirostris, under field conditions. Environmental Biology of Fishes, 35: 205-212.
Cortés, E., Manire, C.A., Hueter, R.E., 1996. Diet, feeding habits, and diel feeding
chronology of the bonnethead shark, Sphyrna tiburo, in southwest Florida. Bulletin of Marine Science, 58: 353-367.
Cortés, E., Papastamatiou, Y.P., Carlson, J.K., Ferry-Graham, L., Wetherbee, B.M.,
2008. An overview of the feeding ecology and physiology of elasmobranch fishes. In: Cyrino, J.E.P., Bureau, D.P., Kapoor, B.G., (Eds) Feeding and digestive functions of fishes. Science Publishers, Enfield, NH, pp. 393-443.
Cox, D.L., Koob, T.J., 1993. Predation on elasmobranch eggs. Environmental Biology of
Fishes, 38: 117-125. Cox, D.L., Walker, P., Koob, T.J., 1999. Predation on eggs of the thorny skate.
Transactions of the American Fisheries Society, 128: 380-384. Creel, S., Christianson, D. 2008. Relationships between direct predation and risk effects.
Trends in Ecology and Evolution, 23: 194-201. Creel, S., Christianson, D., Winnie, J.A. Jr., 2007. Predation risk affects reproductive
physiology and demography of elk. Science, 315: 960. Cross, R.E., Curran, M.C., 2000. Effects of feeding pit formation by rays on an intertidal
meiobenthic community. Estuarine Coastal and Shelf Science, 51: 293-298. Cross, R.E., Curran, M.C., 2004. Recovery of meiofauna in intertidal feeding pits created
by rays. Southeastern Naturalist, 3: 219-230.

74
Crow, G.L., Lowe, C.G., Wetherbee, B.M., 1996. Shark records from longline fishing programs in Hawai’i with comments of Pacific Ocean distributions. Pacific Science, 50: 382-392.
Cruz-Escalona, V.H., Arreguin-Sanchez, F., Zetina-Rejon, M., 2007. Analysis of the
ecosystem structure of Laguna Alvarado, western Gulf of Mexico, by means of a mass balance model. Estuarine, Coastal and Shelf Science, 72: 155-167.
D'Andrea, A.F., Aller, R.C., Lopez, G.R., 2002. Organic matter flux and reactivity on a
South Carolina sandflat: the impacts of porewater advection and macrobiological structures. Limnology and Oceanography, 47: 1056-1070.
DeAngelis, B.M., McCandless, C.T., Kohler, N.E., Recksiek, C.W., Skomal, G.B., 2008.
First characterization of shark nursery habitat in the United States Virgin Islands: evidence of habitat partitioning by two shark species. Marine Ecology Progress Series, 358: 257-271.
Dewar, H., Domeier, M., Nasby-Lucas, N., 2004. Insights into young of the year white
shark, Carcharodon carcharias, behavior in the Southern California Bight. Environmental Biology of Fishes, 70: 133-143.
Dewar, H., Mous, P., Domeier, M., Muljadi, A., Pet, J., Whitty, J., 2008. Movements and
site fidelity of the giant manta ray, Manta birostris, in the Komodo Marine Park, Indonesia. Marine Biology, 155: 121-133.
Di Santo, V., Bennett, W.A., 2011. Is post-feeding thermotaxis advantageous in
elasmobranch fishes? Journal of Fish Biology, 78: 195-207. Domeier, M., Nasby-Lucas. N., 2007. Annual re-sightings of photographically identified
white sharks (Carcharodon carcharias) at an eastern Pacific aggregation site (Guadalupe Island, Mexico). Marine Biology, 150: 977–984.
Domeier, M.L., Nasby-Lucas, N., 2008. Migration patterns of white sharks Carcharodon
carcharias tagged at Guadalupe Island, Mexico, and identification of an eastern Pacific shared offshore foraging area. Marine Ecology Progress Series, 370: 221-237.
Dowd, W.W., Brill, R.W., Bushnell, P.G., Musick, J.A., 2006. Standard and routine
metabolic rates of juvenile sandbar sharks (Carcharhinus plumbeus), including the effects of body mass and acute temperature change. Fishery Bulletin, 104: 323–331.
Dudley, S.F.J., Cliff, G., 1993. Sharks caught in the protective gill nets off Natal, South
Africa. 7. the blacktip shark Carcharhinus limbatus (Valenciennes). South African Journal of Marine Science, 13: 237-254.

75
Dudley, S.F.J., Cliff, G., Zungu, M.P., Smale, M.J., 2005. Sharks caught in the protective gill nets off KwaZulu-Natal, South Africa. 10. The dusky shark Carcharhinus obscurus (Lesueur 1818). African Journal of Marine Science 27: 107-127.
Duncan, K.M., 2006. Estimation of daily energetic requirements in young scalloped
hammerhead sharks, Sphyrna lewini. Environmental Biology of Fishes, 76: 139-149.
Duncan, K.M., Holland, K.N., 2006. Habitat use, growth rates and dispersal patterns of
juvenile scalloped hammerhead sharks Sphyrna lewini in a nursery habitat. Marine Ecology Progress Series, 312: 211-221.
Ebert, D.A., 1991. Diet of the sevengill shark, Notorynchus cepedianus, in the temperate
coastal waters of southern Africa. South African Journal of Marine Science, 11: 565-572.
Ebert, D.A., 2002. Ontogenetic changes in the diet of the sevengill shark (Notorynchus
cepedianus). Marine and Freshwater Research, 53: 517-523. Ebert, D.A., Bizzarro, J.J., 2007. Standardized diet compositions and trophic levels of
skates (Chondrichthyes: Rajiformes: Rajoidei). Environmental Biology of Fishes, 80: 221-237.
Ebert, D.A., Cowley, P.D., 2003. Diet, feeding behaviour and habitat utilisation of the
blue stingray Dasyatis chrysonota (Smith, 1828) in South African waters. Marine and Freshwater Research, 54: 957-965.
Ellis, J.K., Musick, J.A., 2007. Ontogenetic changes in the diet of the sandbar shark,
Carcharhinus plumbeus, in lower Chesapeake Bay and Virginia (USA) coastal waters. Environmental Biology of Fishes, 80: 51-60.
Estes, J.A., Hatfield, B.B., Ralls, K., Ames, J., 2003. Causes of mortality in California
sea otters during periods of population growth and decline. Marine Mammal Science, 19: 198-216.
Estes, J.A., Smith, N.S., Palmisano, J.F., 1978. Sea otter predation and community
organization in the western Aleutian Islands, Alaska. Ecology, 59: 822-833. Estes, J.A., Tinker, M.T., Williams, T.M., Doak, D.F., 1998. Killer whale predation on
sea otters linking oceanic and nearshore ecosystems. Science, 282: 473-476. Estrada, J.A., Rice, A.N., Lutcavage, M.E., Skomal, G.B., 2003. Predicting trophic
position in sharks of the north-west Atlantic Ocean using stable isotope analysis. Journal of the Marine Biological Association of the United Kingdom, 83: 1347-1350.

76
Estrada, J.A., Rice, A.N., Natanson, L.J., Skomal, G.B. 2006. Use of isotopic analysis of vertebrae in reconstructing ontogenetic feeding ecology in white sharks. Ecology, 87: 829-834.
Farias, I., Figueiredo, I., Moura, T., Gordo, L.S., Neves, A., Serra-Pereira, B., 2006. Diet
comparison of four ray species (Raja clavata, Raja brachyura, Raja montagui and Leucoraja naevus) caught along the Portuguese continental shelf. Aquatic Living Resources, 19: 105-114.
Feldheim, K.A., Gruber, S.H., Ashley, M.V., 2002. The breeding biology of lemon
sharks at a tropical nursery lagoon. Proceedings of the Royal Society B, 269: 1655–1661.
Fergusson, I.K., Compagno, L.J.V., Marks, M.A., 2000. Predation by white sharks
Carcharodon carcharias (Chondrichthyes: Lamnidae) upon chelonians, with new records from the Mediterranean Sea and a first record of the ocean sunfish Mola mola (Osteichthyes: Molidae) as stomach contents. Environmental Biology of Fishes, 58: 447-453.
Ferretti, F., Myers, R.A., Serena, F., Lotze, H.K., 2008. Loss of large predatory sharks
from the Mediterranean Sea. Conservation Biology, 22: 952-964. Ford, J.K.B., Ellis, G.M., Matkin, C.O., Wetklo, M.H., Barrett-Lennard, L.G., Withler,
R.E., 2011. Shark predation and tooth wear in a population of northeastern Pacific killer whales. Aquatic Biology, 11: 213-224.
Frid, A., Baker, G.G., Dill, L.M., 2008. Do shark declines create fear-released systems.
Oikos, 117: 191-201. Frid, A., Burns, J., Baker, G.G., Thorne, R.E., 2009. Predicting synergistic effects of
resources and predators on foraging decisions by juvenile Steller sea lions. Oecologia, 158: 775-776.
Frid, A., Dill, L.M., Thorne, R.E., Blundell, G.M., 2007. Inferring prey perception of
relative danger in large-scale marine systems. Evolutionary Ecology Research, 9: 635-649.
Frisk, M.G., Miller, T.J., Martell, S.J.D., Sosebee, K., 2008. New hypothesis helps
explain elasmobranch "OutBurst" on Georges bank in the 1980s. Ecological Applications, 18: 234-245.
Garla, R.C., Chapman, D.D., Wetherbee, B.M., Shivji, M., 2006. Movement patterns of
young Caribbean reef sharks, Carcharhinus perezi, at Fernando de Noronha Archipelago, Brazil: the potential of marine protected areas for conservation of a nursery ground. Marine Biology, 149: 189-199.

77
Gascuel, D., Morissette, L., Palomares, M.L.D., Christensen, V., 2008. Trophic flow kinetics in marine ecosystems: toward a theoretical approach to ecosystem functioning. Ecological Modelling, 217: 33-47.
Gelsleichter, J., Musick, J.A., Nichols, S., 1999. Food habits of the smooth dogfish,
Mustelus canis, dusky shark, Carcharhinus obscurus, Atlantic sharpnose shark, Rhizoprionodon terraenovae, and the sand tiger, Carcharius taurus, from the northwest Atlantic Ocean. Environmental Biology of Fishes, 54: 205-217.
Graham, J.B., Dewar, H., Lai, N.C., Lowell, W.R., Arce, S.M., 1990. Aspects of shark
swimming performance determined using a large water tunnel. Journal of Experimental Biology, 151: 175-192.
Grant, J., 1983. The relative magnitude of biological and physical sediment reworking in
an intertidal community. Journal of Marine Research, 41: 673-689. Gray, A.E., Mulligan, T.J., Hannah, R.W., 1997. Food habits, occurrence, and population
structure of the bat ray, Myliobatis californica, in Humboldt Bay, California. Environmental Biology of Fishes, 49: 227-238.
Grebmeier, J.M., Harrison, N.M., 1992. Seabird feeding on benthic amphipods facilitated
by gray whale activity in the northern Bering Sea. Marine Ecology Progress Series, 80:125–133.
Gregory, M.R., Ballance, P.F., Gibson, G.W., Ayling, A.M., 1979. On how some rays
(Elasmobranchia) excavate feeding depressions by jetting water. Journal of Sedimentary Petrology, 49: 1125-1130.
Grover, C.A., 1972. Predation on egg-cases of the swell shark, Cephaloscyllium
ventriosum. Copeia, 1972: 871–872. Gruber, S.H., de Marignac, J.R.C., Hoenig, J.M., 2001. Survival of juvenile lemon sharks
at Bimini, Bahamas, estimated by mark-depletion experiments. Transactions of the American Fisheries Society, 130: 376–384.
Gruber, S.H., Nelson, D.R., Morrissey, J.F., 1988. Patterns of activity and space
utilization of lemon sharks, Negaprion brevirostris, in a shallow Bahamian lagoon. Bulletin of Marine Science, 43: 61-76.
Grubs, R.D., Musick, J.A., Conrath, C.L., Romine, J.G., 2007. Long-term movements,
migration, and temporal delineations of a summer nursery for juvenile sandbar sharks in Chesapeake Bay. In: McCandless, C.T., Kohler, N.E., Pratt, H.L. Jr. (Eds.), Shark Nursery Grounds of the Gulf of Mexico and the East Coast Waters of the United States. American Fisheries Society, Symposium 50, Bethesda, MD, pp. 87-107.

78
Gunter, G., 1942. Contributions to the natural history of the bottlenose dolphin, Tursiops truncatus (Montague), on the Texas coast, with particular reference to food habits. Journal of Mammalogy, 23: 267-276.
Hake, M., Ekman, J., 1988. Finding and sharing depletable patches: when group foraging
decreases intake rates. Ornis Scandinavica, 19: 275-279. Hammerschlag, N., Martin, R.A., Fallows, C., 2006. Effects of environmental conditions
on predator-prey interactions between white sharks (Carcharodon carcharias) and Cape fur seals (Arctocephalus pusillus pusillus) at Seal Island, South Africa. Environmental Biology of Fishes, 76: 341-350.
Harris, S.A., Bennett, B.A., Branch, G.M., 1988. An assessment of the role of the sand
shark Rhinobatos annulatus as a predator in Langebaan Lagoon. South Africa Journal of Marine Science, 7: 153-159.
Harrison, C.S., 1979. The association of marine birds and feeding gray whales. Condor,
81: 93–95. Hays, G.C., Kennedy, H., Frost, B.W., 2001. Individual variability in diel migration of a
marine copepod: why some individuals remain at depth while others migrate. Limnology and Oceanography, 46: 2050–2054.
Heithaus, M.R., 2001a. Predator-prey and competitive interactions between sharks (order
Selachii) and dolphins (suborder Odontoceti): a review. Journal of Zoology, 253: 53-68.
Heithaus, M.R., 2001b. The biology of tiger sharks, Galeocerdo cuvier, in Shark Bay,
Western Australia: sex ratio, size distribution, diet, and seasonal changes in catch rates. Environmental Biology of Fishes, 61: 25-36
Heithaus, M.R., 2004. Predator-prey interactions. In: Carrier, J.C., Musick, J.A.,
Heithaus, M.R. (Eds), The Biology of Sharks and Their Relatives. CRC Press, Boca Raton, FL, pp. 487–521.
Heithaus, M.R., 2005. Habitat use and group size of pied cormorants (Phalacrocorax
varius) in a seagrass ecosystem: possible effects of food abundance and predation risk. Marine Biology, 147: 27-35.
Heithaus, M.R., 2007. Nursery areas as essential shark habitats: a theoretical perspective.
In: McCandless, C.T., Kohler, N.E., Pratt, H.L. Jr. (Eds.), Shark Nursery Grounds of the Gulf of Mexico and the East Coast Waters of the United States. American Fisheries Society, Symposium 50, Bethesda, MD, pp. 3-13.

79
Heithaus, M.R., Burkholder, D., Hueter, R.E., Heithaus, L.I., Pratt, H.W. Jr., Carrier, J.C., 2007a. Spatial and temporal variation in shark communities of the lower Florida Keys and evidence for historical population declines. Canadian Journal of Fisheries and Aquatic Sciences 64: 1302-1313.
Heithaus, M.R., Delius, B.K., Wirsing, A.J., Dunphy-Daly, M.M., 2009. Physical factors
influencing the distribution of a top predator in a subtropical oligotrophic estuary. Limnology and Oceanography, 54: 472-482.
Heithaus, M.R., Dill, L.M., 2002. Food availability and tiger shark predation risk
influence bottlenose dolphin habitat use. Ecology, 83: 480-491. Heithaus, M.R., Dill, L.M., 2006. Does tiger shark predation risk influence foraging
habitat use by bottlenose dolphins at multiple spatial scales? Oikos, 114: 257-264. Heithaus, M.R., Frid, A., Vaudo, J.J., Worm, B., Wirsing, A.J., 2010. Unraveling the
ecological importance of elasmobranchs. In: Carrier, J.C., Musick, J.A., Heithaus, M.R. (Eds), Sharks and Their Relatives II: Biodiversity, Adaptive Physiology, and Conservation. CRC Press, Boca Raton, FL, pp. 607-633.
Heithaus, M.R., Frid, A., Wirsing, A.J., Dill, L.M., Fourqurean, J., Burkholder, D.,
Thomson, J., Bejder, L., 2007d. State-dependent risk-taking by green sea turtles mediates top-down effects of tiger shark intimidation in a marine ecosystem. Journal of Animal Ecology, 76: 837-844.
Heithaus, M.R., Frid, A., Wirsing, A.J., Worm, B., 2008a. Predicting ecological
consequences of marine top predator declines. Trends in Ecology and Evolution, 23: 202–210.
Heithaus, M.R., Wirsing, A.J., Burkholder, D., Thomson, J., Dill, L.M., 2009b.
Interaction of landscape features and antipredator behavior can amplify or reverse indirect effects of predation. Journal of Animal Ecology, 78: 552-562.
Heithaus, M.R., Wirsing, A.J., Dill, L.M., Heithaus, L.I., 2007b. Long-term movements
of tiger sharks satellite-tagged in Shark Bay, Western Australia. Marine Biology, 151: 1455–1461.
Heithaus, M.R., Wirsing, A.J., Frid, A., Dill, L.M., 2007c. Behavioral indicators in
marine conservation: lessons from a pristine seagrass ecosystem. Israel Journal of Ecology & Evolution, 53: 355–370.
Heithaus, M.R., Wirsing, A.J., Thomson, J.A., Burkholder, D.A., 2008b. A review of
lethal and non-lethal effects of predators on adult marine turtles. Journal of Experimental Marine Biology and Ecology, 356: 43-51.

80
Heupel, M.R., Bennett, M.B., 1998. Observations on the diet and feeding habits of the epaulette shark, Hemiscyllium ocellatum (Bonnaterre), on Heron Island Reef, Great Barrier Reef, Australia. Marine and Freshwater Research, 49: 753-756.
Heupel, M.R., Carlson, J.K., Simpfendorfer, C.A., 2007. Shark nursery areas: concepts,
definition, characterization and assumptions. Marine Ecology Progress Series, 337: 287–297.
Heupel, M.R., Hueter, R.E., 2002. Importance of prey density in relation to the
movement patterns of juvenile blacktip sharks (Carcharhinus limbatus) within a coastal nursery area. Marine and Freshwater Research, 53: 543-550.
Heupel, M.R., Simpfendorfer, C.A., 2002. Estimation of mortality of juvenile blacktip
sharks, Carcharhinus limbatus, within a nursery area using telemetry data. Canadian Journal of Fisheries and Aquatic Sciences, 59: 624-632.
Heupel, M.R., Simpfendorfer, C.A., 2005. Quantitative analysis of aggregation behavior
in juvenile blacktip sharks. Marine Biology, 147: 1239-1249. Heupel, M.R., Simpfendorfer, C.A., 2008. Movement and distribution of young bull
sharks Carcharhinus leucas in a variable estuarine environment. Aquatic Biology, 1: 277-289.
Heyman, W.D., Graham, R.T., Kjerfve, B., Johannes, R.E., 2001. Whale sharks
Rhincodon typus aggregate to feed on fish spawn in Belize. Marine Ecology Progress Series, 215: 275-282.
Hight, B.V., Lowe, C.G., 2007. Elevated body temperatures of adult female leopard
sharks, Triakis semifasciata, while aggregating in shallow nearshore embayments: Evidence for behavioral thermoregulation? Journal of Experimental Marine Biology and Ecology. 352: 114–128.
Hines, A.H., Whitlatch, R.B., Thrush, S.F., Hewitt, J.E., Cummings, V.J., Dayton, P.K.,
Legendre, P., 1997. Nonlinear foraging response of a large marine predator to benthic prey: eagle ray pits and bivalves in a New Zealand sandflat. Journal of Experimental Marine Biology and Ecology, 216: 191-210.
Hoff, G.R., 2009. Skate Bathyraja spp. egg predation in the eastern Bering Sea. Journal
of Fish Biology, 74: 250-269. Hoisington, G., IV, Lowe, C.G., 2005. Abundance and distribution of the round stingray,
Urobatis halleri, near a heated effluent outfall. Marine Environmental Research, 60: 437–453.

81
Holden, M.J., 1975. The fecundity of Raja clavata in British waters. Journal du Conseil, Conseil International pour l’Exploration de la Mer, 36:110–118.
Holland, K.N., Wetherbee, B.M., Peterson, J.D., Lowe, C.G., 1993. Movements and
distribution of hammerhead shark pups on their natal grounds. Copeia, 1993: 495-502.
Hopkins, T.E., Cech, J.J., Jr., 1994. Effect of temperature on oxygen consumption of the
bat ray, Myliobatis californica (Chondrichthyes, Myliobatididae). Copeia, 1994: 529-532.
Hovel, K.A., Lipcius, R.N., 2001. Habitat fragmentation in a seagrass landscape: patch
size and complexity control blue crab survival. Ecology, 82: 1814-1829. Hunter, E., Berry, F., Buckley, A.A., Stewart, C., Metcalfe, J.D., 2006. Seasonal
migration of thornback rays and implications for closure management. Journal of Applied Ecology, 43: 710-720.
Hunter, E., Buckley, A.A., Stewart, C., Metcalfe, J.D., 2005. Migratory behaviour of the
thornback ray, Raja clavata, in the southern North Sea. Journal of the Marine Biological Association of the United Kingdom, 85: 1095-1105.
Hussey, N.E., Brush, J., McCarthy, I.D., Fisk, A.T., 2010. δ15N and δ13C diet–tissue
discrimination factors for large sharks under semi-controlled conditions. Comparative Biochemistry and Physiology, Part A, 155: 445-453.
Huveneers, C., Otway, N.M., Gibbs, S.E., Harcourt, R.G., 2007. Quantitative diet
assessment of wobbegong sharks (genus Orectolobus) in new South Wales, Australia. ICES Journal of Marine Science, 64: 1272-1281.
Ismen, A., 2003. Age, growth, reproduction and food of common stingray (Dasyatis
pastinaca L., 1758) in Iskenderun Bay, the eastern Mediterranean. Fisheries Research, 60: 169-176.
Jardas, I., Santic, M., Pallaoro, A., 2004. Diet composition of the eagle ray, Myliobatis
aquila (Chondrichthyes: Myliobatidae), in the eastern Adriatic Sea. Cybium, 28: 372-374.
Jennings, D.E., Gruber, S.H., Franks, B.R., Kessel, S.T., Robertson, A.L., 2008. Effects
of large-scale anthropogenic development on juvenile lemon shark (Negaprion brevirostris) populations of Bimini, Bahamas. Environmental Biology of Fishes, 83: 369-377.
Jimenez, C. 1996. Coral colony fragmentation by white-tip reef sharks at Coiba Island
National Park, Panama. Revista de biología tropical, 45: 698-700.

82
Kajiura, S.M., Macesic, L.J., Meredith, T.L., Cocks, K.L., Dirk, L.J., 2009. Commensal foraging between double-crested cormorants and a southern stingray. Wilson Journal of Ornithology 121: 646-648.
Kao, J.S., 2000. Diet, daily ration and gastric evacuation of the leopard shark (Triakis
semifasciata). M.S. thesis. California State University, Hayward, USA, 106 pp. Kerford, M., Wirsing, A.J., Heithaus, M.R., Dill, L.M., 2008. Danger on the rise: Habitat
use by bar-bellied sea snakes in Shark Bay, Western Australia. Marine Ecology Progress Series, 358: 289-294.
Kerr, L.A., Andrews, A.H., Cailliet, G.M., Brown, T.A., Coale, K.H. 2006. Investigations
of d14C, d13C, and d15N in vertebrae of white shark (Carcharodon carcharias) from the eastern North Pacific Ocean. Environmental Biology of Fishes, 77: 337–353.
Kinney, M.J., Simpfendorfer, C.A., 2009. Reassessing the value of nursery areas to shark
conservation and management. Conservation Letters, 2: 53-60. Kitchell, J.F., Essington, T.E., Boggs, C.H., Schindler, D.E., Walters, C.J., 2002. The role
of sharks and longline fisheries in a pelagic ecosystem of the central Pacific. Ecosystems, 5: 2002-2016.
Knowles, L.L., Bell, S.S., 1998. The influence of habitat structure in faunal-habitat
associations in a Tampa Bay seagrass system, Florida. Bulletin of Marine Science, 62: 781-794.
Koen Alonso, M., Crespo, E.A., Garcia, N.A., Pedraza, S.N., Mariotti, P.A., Mora, N.J.,
2002. Fishery and ontogenetic driven changes in the diet of the spiny dogfish, Squalus acanthias, in Patagonian waters, Argentina. Environmental Biology of Fishes, 63: 193-202.
Kondoh, M., 2008. Building trophic modules into a persistent food web. Proceedings of
the National Academy of Sciences, 105: 16631-16635. Kotler, B.P., Brown, J.S., Bouskila, A., 2004. Apprehension and time allocation in
gerbils: the effects of predatory risk and energetic state. Ecology, 85: 917-922. Kubodera, T., Watanabe, H., Ichii, T., 2007. Feeding habits of the blue shark, Prionace
glauca, and salmon shark, Lamna ditropis, in the transition region of the Western North Pacific. Reviews in Fish Biology and Fisheries, 17: 111-124.
Kyne, P.M., Bennett, M.B., 2002. Diet of the eastern shovelnose ray, Aptychotrema
rostrata (Shaw & Nodder, 1794), from Moreton Bay, Queensland, Australia. Marine and Freshwater Research, 53: 679-686.

83
Laroche, R.K., Kock, A.A., Dill, L.M., Oosthuizen, W.H., 2008. Running the gauntlet: a predator-prey game between sharks and two age classes of seals. Animal Behaviour, 76: 1901-1917.
Last, P.R., Stevens, J.D., 2009. Sharks and Rays of Australia, 2nd edn. Harvard
University Press, Cambridge, 644 pp. Le Boeuf, B.J., Crocker, D.E., 1996. Diving behavior of elephant seals: implications for
predator avoidance In: Klimley, A.P., Ainley, D.G. (Eds), Great White Sharks: the Biology of Carcharodon carcharias. Academic Press, San Diego, CA, pp. 193-205.
Leatherwood, S., 1977. Some preliminary impressions of the numbers and social
behavior of free-swimming bottlenosed dolphin calves (Tursiops truncatus) in the north-eastern Gulf of Mexico. In: Ridgway, S.H. (Ed), Breeding Dolphins: Present Status, Suggestions for the Future. Report to the US Marine Mammal Commission MM6AC009, pp. 143-167.
Libralato, S., Christensen, V., Pauly, D., 2006. A method for identifying keystone species
in food web models. Ecological Modelling, 195: 153-171. Link, L.S., 2007. Underappreciated species in ecology: “ugly fish” in the northwest
Atlantic Ocean. Ecological Applications, 17: 2037-2060. Longenecker, K., 2007. Devil in the details: high-resolution dietary analysis contradicts a
basic assumption of reef-fish diversity models. Copeia, 2007: 543-555. Love, M.S., Schroeder, D.M., Snook, L., York, A., Cochrane, G., 2008. All their eggs in
one basket: a rocky reef nursery for the longnose skate (Raja rhina Jordan & Gilbert, 1880) in the southern California Bight. Fishery Bulletin, 106: 471-475.
Lowe, C.G., 2001. Metabolic rates of juvenile scalloped hammerhead sharks (Sphyrna
lewini). Marine Biology, 139: 447-453. Lowe, C.G., 2002. Bioenergetics of free-ranging juvenile scalloped hammerhead sharks
(Sphyrna lewini) in Kane'ohe Bay, O'ahu, HI. Journal of Experimental Marine Biology and Ecology, 278: 141-156.
Lowe, C.G., Wetherbee, B.M., Crow, G.L., Tester, A.L., 1996. Ontogenetic dietary shifts
and feeding behavior of the tiger shark, Galeocerdo cuvier, in Hawaiian waters. Environmental Biology of Fishes, 47: 203-211.

84
Lowe, C.G., Wetherbee, B.M., Meyer, C.G., 2006. Using acoustic telemetry monitoring techniques to quantify movement patterns and site fidelity of sharks and giant trevally around French Frigate Shoals and Midway Atoll. Atoll Research Bulletin, 543: 281–303.
Lucas, Z., Stobo, W.T., 2000. Shark-inflicted mortality on a population of harbour seals
(Phoca vitulina) at Sable Island, Nova Scotia. Journal of Zoology, London, 252: 405-414.
Lucifora, L.O., Garcia, V.B., 2004. Gastropod predation on egg cases of skates
(Chondrichthyes, Rajidae) in the southwestern Atlantic: quantification and life history implications. Marine Biology, 145: 917-922.
Lucifora, L.O., Garcia, V.B., Escalante, A.H., 2009. How can the feeding habits of the
sand tiger shark influence the success of conservation programs? Animal Conservation, 12: 291-301.
Lucifora, L.O., Garcia, V.B., Menni, R.C., Escalante, A.G., Hozbor, N.M., 2009. Effects
of body size, age and maturity stage on diet in a large shark: ecological and applied implications. Ecological Research, 24: 109-118.
Lucifora, L.O., García, V.B., Menni, R.C., Escalante, A.H., 2006. Food habits,
selectivity, and foraging modes of the school shark Galeorhinus galeus. Marine Ecology Progress Series, 315: 259–270.
Lucifora, L.O., Menni, R.C., Escalante, A.H., 2005. Reproduction, abundance and
feeding habits of the broadnose sevengill shark Notorynchus cepedianus in north Patagonia, Argentina. Marine Ecology Progress Series, 289: 237–244.
Marshall, A.D., Kyne, P.M., Bennett, M.B., 2008. Comparing the diet of two sympatric
urolophid elasmobranchs (Trygonoptera testacea Muller & Henle and Urolophus kapalensis Yearsley & Last): evidence of ontogenetic shifts and possible resource partitioning. Journal of Fish Biology, 72: 883-898.
Marshall, L.J., White, W.T., Potter, I.C., 2007. Reproductive biology and diet of the
southern fiddler ray, Trygonorrhina fasciata (Batoidea : Rhinobatidae), an important trawl bycatch species. Marine and Freshwater Research, 58: 104-115.
Martin, R.A., 2004. Natural mortality of puffadder shysharks due to Cape fur seals and
black-backed kelp gulls at Seal Island, South Africa. Journal of Fish Biology, 64: 711-716.
Martin, R.A., 2005. Conservation of freshwater and euryhaline elasmobranchs: a review.
Journal of the Marine Biological Association of the United Kingdom, 85:1049-1073.

85
Martin, R.A., Hammerschlag, N., Collier, R.S., Fallows, C., 2005. Predatory behaviour of white sharks (Carcharodon carcharias) at Seal Island, South Africa. Journal of the Marine Biological Association of the United Kingdom, 85: 1121-1135.
Martin, R.A., Rossmo, D.K., Hammerschlag, N., 2009. Hunting patterns and geographic
profiling of white shark predation. Journal of Zoology, 279: 111-118. Masini, R.J., Anderson, P.K., McComb, A.J., 2001. A Halodule-dominated community in
a subtropical embayment: physical environment, productivity, biomass, and impact of dugong grazing. Aquatic Botany, 71: 179–197.
Matern, S.A., Cech, J.J., Jr., Hopkins, T.E., 2000. Diel movements of bat rays, Myliobatis
californica, in Tomales Bay, California: Evidence for behavioral thermoregulation? Environmental Biology of Fishes, 58: 173-182.
Matich, P., Heithaus, M.R., Layman, C.A., 2011. Contrasting patterns of individual
specialization and trophic coupling in two marine apex predators. Journal of Animal Ecology, 80: 294-305.
McCandless, C.T., Kohler, N.E., Pratt, H.L. Jr., (Eds) 2007. Shark nursery grounds of the
Gulf of Mexico and the east coast waters of the United States. American Fisheries Society, Symposium 50, Bethesda, Maryland, 390 pp.
McCord, M.E., Lamberth, S.J., 2009. Catching and tracking the worlds’s largest Zambezi
(bull) shark Carcharhinus leucas in the Breed Estuary, South Africa: the first 43 hours. African Journal of Marine Science, 31: 107-111.
McCutchan, J.H., Jr., Lewis, W.M., Jr., Kendall, C., McGrath, C.C., 2003. Variation in
trophic shift for stable isotope ratios of carbon, nitrogen, and sulfur. Oikos, 102: 378-390.
McElroy, W.D., Wetherbee, B.M., Mostello, C.S., Lowe, C.G., Crow, G.L., Wass, R.C.,
2006. Food habits and ontogenetic changes in the diet of the sandbar shark, Carcharhinus plumbeus, in Hawaii. Environmental Biology of Fishes, 76: 81–92.
McKibben, J.N., Nelson, D.R., 1986. Patterns of movement and grouping of gray reef
sharks, Carcharhinus amblyrhynchos, at Enewetak, Marshall Islands. Bulletin of Marine Science, 38:89-110.
McLaren, I.A., 1963. Effects of temperature on growth of zooplankton, and the adaptive
value of vertical migration. Journal of the Fisheries Research Board of Canada, 20: 685–727.
Medved, R.J., 1985. Gastric evacuation in the sandbar shark, Carcharhinus plumbeus.
Journal of Fish Biology, 26: 239 –253.

86
Medved, R.J., Stillwell, C.E., Casey, J.G., 1985. Stomach contents of young sandbar sharks, Carcharhinus plumbeus, in Chincoteague Bay, Virginia. Fishery Bulletin US, 83: 395-402.
Medved, R.J., Stillwell, C.E., Casey, J.J., 1988. The rate of food consumption of young
sandbar sharks (Carcharhinus plumbeus) in Chincoteague Bay, Virginia. Copeia, 1988: 956–963.
Meyer, C.G., Clark, T.B., Papastamatiou, Y.P., Whitney, N.M., Holland, K.N., 2009.
Long-term movement patterns of tiger sharks Galeocerdo cuvier in Hawaii. Marine Ecology Progress Series, 381: 223-235.
Meyer, C.G., Papastamatiou, Y.P., Holland, K.N., 2010. A multiple instrument approach
to quantifying the movement patterns and habitat use of tiger (Galeocerdo cuvier) and Galapagos sharks (Carcharhinus galapagensis) at French Frigate Shoals, Hawaii. Marine Biology, 157: 1857-1868.
Morato, T., Sola, E., Gros, M.P., Menezes, G., 2003. Diets of thornback ray (Raja
clavata) and tope shark (Galeorhinus galeus) in the bottom longline fishery of the Azores, northeastern Atlantic. Fishery Bulletin, 101:590-602.
Morrissey, J.F., Gruber, S.H., 1993. Habitat selection by juvenile lemon sharks,
Negaprion brevirostris. Environmental Biology of Fishes, 38: 311-319. Murdoch, T.J.T., Glasspool, A.F., Outerbridge, M., Ward, J., Manuel, S., Gray, J., Nash,
A., Coates, K.A., Pitt, J., Fourqurean, J.W., Barnes, P.A., Vierros, M., Holzer, K., Smith, S.R., 2007. Large-scale decline of offshore seagrass meadows in Bermuda. Marine Ecology Progress Series 339: 123-130.
Musick, J.A., Branstetter, S., Colvocoresses, J.A., 1993. Trends in shark abundance
1974-1991 for the Chesapeake Bight of the U.S. Mid-Atlantic coast. In: Branstetter, S. (Ed), Conservation Biology of Elasmobranchs. NOAA Tech Rep 115, National Marine Fisheries Service, Silver Spring, MD, pp. 1-18.
Myers, R.A., Baum, J.K., Shepherd, T.D., Powers, S.P., Peterson, C.H., 2007. Cascading
effects of the loss of apex predatory sharks from a coastal ocean. Science, 315: 1846-1850.
Myrick, J.L., Flessa, K.W., 1996. Bioturbation rates in Bahia La Choya, Sonora, Mexico.
Ciencias Marinas, 22: 23-46. Neer, J.A., Rose, K.A., Cortés, E., 2007. Simulating the effects of temperature on
individual and population growth of Rhinoptera bonasus: a coupled bioenergetics and matrix modeling approach. Marine Ecology Progress Series, 329: 211–223.

87
Nelson, J.D., Eckert, S.A., 2007. Foraging ecology of whale sharks (Rhincodon typus) within Bahia de Los Angeles, Baja California Norte, Mexico. Fisheries Research, 84: 47-64.
Newman, S.P., Gruber, S.H., Handy, R.D., 2004. The scarecrow toadfish: habitat,
abundance and size at maturity at Bimini, Bahamas. Journal of Fish Biology, 64: 248–252.
Newman, S.P., Handy, R.D., Gruber, S.H., 2010. Diet and prey preference of juvenile
lemon sharks Negaprion brevirostris. Marine Ecology Progress Series, 398: 221-234.
Nixon, A.J., Gruber, S.H., 1988, Diel metabolic and activity patterns of the lemon shark
(Negaprion brevirostris). Journal of Experimental Zoology, 248: 1–6. Okey, T.A., Banks, S., Born, A.F., Bustamante, R.H., Calvopiña, M., Edgar, G.J.,
Espinoza, E., Fariña, J.M., Garske, L.E., Recke, G.K., Salazar, S., Shepherd, S., Toral-Granda, V., Wallem, P., 2004. A trophic model of a Galápagos subtidal rocky reef for evaluating fisheries and conservation strategies Ecological Modelling, 173: 383-401.
Oliver, J.S., Slattery, P.N., 1985. Destruction and opportunity on the sea floor: effects of
gray whale feeding. Ecology, 66: 1965-1975. Ortega, L.A., Heupel, M.R., Van Beynen, P., Motta, P.J., 2009. Movement patterns and
water quality preferences of juvenile bull sharks (Carcharhinus leucas) in a Florida estuary. Environmental Biology of Fishes, 84: 361-373.
Orth, R.J., 1975. Destruction of eelgrass, Zostera marina, by the cownose ray,
Rhinoptera bonasus, in the Chesapeake Bay. Chesapeake Science, 16: 205-208. Otway, N.M., Bradshaw, C.J.A., Harcourt, R.G., 2004. Estimating the rate of quasi-
extinction of the Australian grey nurse shark (Carcharias taurus) population using deterministic age- and stage-classified models. Biological Conservation, 119: 341-350.
Papastamatiou, Y.P, Lowe, C.G., Caselle, J.E., Friedlander, A.M., 2009. Scale-dependent
effects of habitat on movements and path structure of reef sharks at a predator-dominated atoll. Ecology, 90: 996-1008.
Papastamatiou, Y.P., Lowe, C.G., 2004. Postprandial response of gastric pH in leopard
sharks (Triakis semifasciata) and its use to study foraging ecology. Journal of Experimental Biology, 207: 225-232.

88
Papastamatiou, Y.P., Lowe, C.G., 2005. Variations in gastric acid secretion during periods of fasting between two species of shark. Comparative Biochemistry and Physiology – Part A: Molecular & Integrative Physiology, 141: 210-214.
Papastamatiou, Y.P., Meyer, C.G., Holland, K.N., 2007a. A new acoustic pH transmitter
for studying the feeding habits of free-ranging sharks. Aquatic Living Resources, 20: 287-290.
Papastamatiou, Y.P., Purkis, S.J., Holland, K.N., 2007b. The response of gastric pH and
motility to fasting and feeding in free swimming blacktip reef sharks, Carcharhinus melanopterus. Journal of Experimental Marine Biology and Ecology, 345: 129–140.
Papastamatiou, Y.P., Wetherbee, B.M., Lowe, C.G., Crow, G.L., 2006. Distribution and
diet of four species of carcharhinid shark in the Hawaiian Islands: evidence for resource partitioning and competitive exclusion. Marine Ecology Progress Series, 320: 239–251.
Parker, R.O., Jr., Dixon, R.L., 1998. Changes in a North Carolina reef fish community
after 15 years of intense fishing: global warming implications. Transactions of the American Fisheries Society, 127: 908-920.
Peterson, C.H., Fodrie, F.J., Summerson, H.C., Powers, S.P., 2001. Site-specific and
density-dependent extinction of prey by schooling rays: generation of a population sink in top-quality habitat for bay scallops. Oecologia, 129: 349-356.
Peterson, C.H., Summerson, H.C., 1992. Basin-scale coherence of population dynamics
of an exploited marine invertebrate, the bay scallop: implications of recruitment limitation. Marine Ecology Progress Series, 90: 257-272.
Piraino, S., Fanelli, G., Boero, F., 2002. Variability of species’ roles in marine
communities: change of paradigms for conservation priorities. Marine Biology, 140: 1067-1074.
Platell, M.E., Potter, I.C., 2001. Partitioning of food resources amongst 18 abundant
benthic carnivorous fish species in marine waters on the lower west coast of Australia. Journal of Experimental Marine Biology and Ecology, 261: 31-54.
Platell, M.E., Potter, I.C., Clarke, K.R., 1998. Resource partitioning by four species of
elasmobranchs (Batoidea: Urolophidae) in coastal waters of temperate Australia. Marine Biology, 131: 719-734.
Pondella, D.J., Allen, L.G., 2008. The decline and recovery of four predatory fishes from
the Southern California Bight. Marine Biology, 154: 307-313.

89
Post, D.M., 2002. Using stable isotopes to estimate trophic position: models, methods, and assumptions. Ecology, 83: 703-718.
Powter, D.M., Gladstone, W., 2008. Embryonic mortality and predation on egg capsules
of the Port Jackson shark Heterodontus portusjacksoni (Meyer). Journal of Fish Biology, 72: 573-584.
Powter, D.M., Gladstone, W., 2009. Habitat-Mediated Use of Space by Juvenile and
Mating Adult Port Jackson Sharks, Heterodontus portusjacksoni, in Eastern Australia. Pacific Science, 63: 1-14.
Preen, A., 1995. Impacts of dugong foraging on seagrass habitats: observational and
experimental evidence for cultivation grazing. Marine Ecology Progress Series, 124: 201-213.
Pyle, P., Schramm, M.J., Keiper, C., Anderson, S.D., 1999. Predation on a white shark
(Carcharodon carcharias) by a killer whale (Orcinus orca) and a possible case of competitive displacement. Marine Mammal Science, 15: 563-568.
Quevedo, M., Svanback, R., Eklov, P., 2009. Intrapopulation niche partitioning in a
generalist predator limits food web connectivity. Ecology, 90:2263-2274. Rasmussen, L.E.L.&M.J. Schmidt. 1992. Are sharks chemically aware of crocodiles? pp.
335–342. In: R.L. Doty & D. Muller-Schwarze (ed.) Chemical Signals in Vertebrates IV, Plenum Press, New York.
Reidenauer, J.A., Thistle, D., 1981. Response of a soft-bottom harpacticoid community to
stingray (Dasyatis sabina) disturbance. Marine Biology, 65: 261-267. Rezende, E.L., Albert, E.M., Fortuna, M.A., Bascompte, J., 2009. Compartments in a
marine food web associated with phylogeny, body mass, and habitat structure. Ecology Letters, 12: 779-788.
Rinewalt, C.S., Ebert, D.A., Cailliet, G.M., 2007. Food habits of the sandpaper skate,
Bathyraja kincaidii (Garman, 1908) off central California: seasonal variation in diet linked to oceanographic conditions. Environmental Biology of Fishes, 80: 147-163.
Ritchie, E.G., Johnson, C.N., 2009. Predator interactions, mesopredator release and
biodiversity conservation. Ecology Letters, 12: 982-998. Robbins, W.D., Hisano, M., Connolly, S.R., Choat, J.H., 2006. Ongoing collapse of
coral-reef shark populations. Current Biology, 16: 2314-2319.

90
Robinson, H.J., Cailliet, G.M., Ebert, D.A., 2007. Food habits of the longnose skate, Raja rhina (Jordan and Gilbert, 1880), in central California waters. Environmental Biology of Fishes, 80: 165-179.
Saidi, B., Enajjar, S., Bradai, M.N., Bouain, A., 2009. Diet composition of smooth-hound
shark, Mustelus mustelus (Linnaeus, 1758), in the Gulf of Gabes, southern Tunisia. Journal of Applied Ichthyology, 25: 113-118.
Salini, J.P., Blaber, S.J.M., Brewer, D.T., 1992. Diet of sharks from estuaries and
adjacent waters of the north-eastern Gulf of Carpentaria, Australia. Australian Journal of Marine and Freshwater Research, 43: 87-96.
San Martin, M.J., Braccini, J.M., Tamini, L.L., Chiaramonte, G.E., Perez, J.E., 2007.
Temporal and sexual effects in the feeding ecology of the marbled sand skate Psammobatis bergi Marini, 1932. Marine Biology, 151: 505-513.
Sandin, S.A., Smith, J.E., DeMArtini, E.E., Dinsdale, E.A., Donner, S.D., Friedlander,
A.M., Knonotchick, T., Malay, M., Maragos, J.E., Obura, D., Pantos, O., Paulay, G., Richie, M., Rohwer, F., Schroeder, R.E., Walsh, S., Jackson , J.B.C., Knowlton, N., Sala, E., 2008. Baselines and degradation of coral reefs in the northern Line Islands. PLoS ONE, 3: e1548. doi: 10.1371/journal.pone.0001548.
Sasko, D.E., Dean, M.N., Motta, P.J., Hueter, R.E., 2006. Prey capture behavior and
kinematics of the Atlantic cownose ray, Rhinoptera bonasus. Zoology, 109: 171-181.
Schmitz, O.J., Krivan, V., Ovadia, O., 2004. Trophic cascades: the primacy of trait-
mediated indirect interactions. Ecology Letters, 7: 153-163. Schwartz, F.J., 1990. Mass migratory congregations and movements of several species of
cownose rays, genus Rhinoptera: a world-wide review. The Journal of the Elisha Mitchell Scientific Society, 106: 10–13.
Semeniuk, C.A.D., Dill, L.M., 2005. Cost/benefit analysis of group and solitary resting in
the cowtail stingray, Pastinachus sephen. Behavioral Ecology, 16: 417-426. Semeniuk, C.A.D., Rothley, K.D., 2008. Costs of group-living for a normally solitary
forager: effects of provisioning tourism on southern stingrays Dasyatis americana. Marine Ecology Progress Series, 357: 271-282.
Sheaves, M., 2009. Consequences of ecological connectivity: the coastal ecosystem
mosaic. Marine Ecology Progress Series, 391: 107-115. Shepherd, T.D., Myers, R.A., 2005. Direct and indirect fishery effects on small coastal
elasmobranchs in the northern Gulf of Mexico. Ecology Letters, 8: 1095-1104.

91
Sherman, K.M., Reidenauer, J.A., Thistle, D., Meeter, D., 1983. Role of a natural disturbance in an assemblage of marine free-living nematodes. Marine Ecology Progress Series, 11: 23-30.
Sigler, M.F., Hulbert, L.B., Lunsford, C.R., Thompson, N.H., Burek, K., O'Corry-Crowe,
G., Hirons, A.C., 2006. Diet of Pacific sleeper shark, a potential Steller sea lion predator, in the north-east Pacific Ocean. Journal of Fish Biology, 69: 392-405.
Simpfendorfer, C., 1992. Biology of tiger sharks (Galeocerdo cuvier) caught by the
Queensland Shark Meshing Program off Townsville, Australia. Australian Journal of Marine and Freshwater Research, 43: 33-43.
Simpfendorfer, C.A., 1998. Diet of the Australian sharpnose shark, Rhizoprionodon
taylori, from northern Queensland. Marine and Freshwater Research, 49: 757-761.
Simpfendorfer, C.A., Freitas, G.G., Wiley, T.R., Heupel, M.R., 2005. Distribution and
habitat partitioning of immature bull sharks (Carcharhinus leucas) in a southwest Florida estuary. Estuaries, 28: 78–85.
Simpfendorfer, C.A., Goodreid, A., McAuley, R.B., 2001a. Diet of three commercially
important shark species from Western Australian waters. Marine and Freshwater Research, 52: 975-985.
Simpfendorfer, C.A., Goodreid, A.B., McAuley, R.B., 2001b. Size, sex and geographic
variation in the diet of the tiger shark, Galeocerdo cuvier, from Western Australian waters. Environmental Biology of Fishes, 61: 37-46.
Simpfendorfer, C.A., Milward, N.E., 1993. Utilization of a tropical bay as a nursery area
by sharks of the families Carcharhinidae and Sphyrnidae. Environmental Biology of Fishes, 37: 337-345.
Sims, D.W., 1996. The effect of body size on the standard metabolic rate of the lesser
spotted dogfish. Journal of Fish Biology, 48: 542-544. Sims, D.W., Davies, S.J., Bone, Q., 1996. Gastric emptying rate and return of appetite in
lesser spotted dogfish, Scyliorhinus canicula (Chondrichthyes: Elasmobranchii). Journal of the Marine Biological Association of the United Kingdom, 76: 479-491.
Sims, D.W., Fox, A.M., Merrett, D.A., 1997. Basking shark occurrence off south-west
England in relation to zooplankton abundance. Journal of Fish Biology, 51: 436–440.

92
Sims, D.W., Nash, J.P., Morritt, D., 2001. Movements and activity of male and female dogfish in a tidal sea lough: alternative behavioural strategies and apparent sexual segregation. Marine Biology, 139: 1165-1175.
Sims, D.W., Quayle, V.A., 1998. Selective foraging behaviour of basking sharks on
zooplankton in a small-scale front. Nature, 393: 460-464. Sims, D.W., Wearmouth, V.J., Southall, E.J., Hill, J.M., Moore, P., Rawlinson, K.,
Hutchinson, N., Budd, G.C., Righton, D., Metcalfe, J.D., Nash, J.P., Morritt, D., 2006. Hunt warm, rest cool: bioenergetic strategy underlying diel vertical migration of a benthic shark. Journal of Animal Ecology, 75: 176-190.
Sinclair, A.R.E., Arcese, P., 1995. Population consequences of predation-sensitive
foraging: the Serengeti wildebeest. Ecology, 76: 882-891. Sleeman, J.C., Meekan, M.G., Wilson, S.G., Jenner, C.K.S., Jenner, M.N., Boggs, G.S.,
Steinberg, C.C., Bradshaw, C.J.A., 2007. Biophysical correlates of relative abundances of marine megafauna at Ningaloo Reef, Western Australia. Marine and Freshwater Research 58: 608-623.
Smale, M.J., 1991. Occurrence and feeding of three shark species, Carcharhinus
brachyurus, C. obscurus and Sphyrna zygaena, on the eastern Cape coast of South Africa. South Africa Journal of Marine Science, 11: 31-42.
Smale, M.J., 2005. The diet of the ragged-tooth shark Carcharias taurus Rafinesque
1810 in the Eastern Cape, South Africa. African Journal of Marine Science, 27: 331-335.
Smith, C., Griffiths, C., 1997. Shark and skate eggcases cast up on two South African
beaches and their rates of hatching success, or causes of death. South African Journal of Zoology, 32: 112-117.
Smith, J.W., Merriner, J.V., 1982. Association of cobia, Rachycentron canadum, with
cownose ray, Rhinoptera bonasus. Estuaries, 5: 240-242. Smith, J.W., Merriner, J.V., 1985. Food habits and feeding behavior of the cownose ray,
Rhinoptera bonasus, in lower Chesapeake Bay. Estuaries, 8: 305-310. Smith, J.W., Merriner, J.V., 1986. Observations on the reproductive biology of the
cownose ray, Rhinoptera bonasus, in Chesapeake Bay. Fishery Bulletin US, 84: 871-877.
Smith, J.W., Merriner, J.V., 1987. Age and growth, movements and distribution of the
cownose ray, Rhinoptera bonasus, in Chesapeake Bay. Estuaries, 10: 153-164.
93
Standora, E., A., Nelson, D.R., 1977. A telemetric study of the behavior of free-swimming Pacific angel sharks, Squatina californica. Bulletin of the Southern California Academy of Sciences, 76: 193-201.
Stevens, J.D., Bonfil, R., Dulvy, N.K., Walker, P.A., 2000. The effects of fishing on
sharks, rays, and chimaeras (chondrichthyans), and the implications for marine ecosystems. ICES Journal of Marine Science, 57: 476-494.
Stevens, J.D., Lyle, J.M., 1989. Biology of three hammerhead sharks (Eusphyra blochii,
Sphyrna mokarran and S. lewini) from northern Australia. Australian Journal of Marine and Freshwater Research, 40: 129-146.
Stevens, J.D., McLoughlin, K.J., 1991. Distribution, size and sex composition,
reproductive biology and diet of sharks from northern Australia. Australian Journal of Marine and Freshwater Research, 42: 151-199.
Stevenson, C., Katz, L.S., Micheli, F., Block, B., Heiman, K.W., Perle, C., Weng, K.,
Dunbar, R., Witting, J., 2007. High apex predator biomass on remote Pacific Islands. Coral Reefs, 26: 47-51.
Stillwell, C.E., Kohler, N.E., 1982. Food, feeding habits, and estimates of daily ration in
the shortfin mako (Isurus oxyrinchus) in the Northwest Atlantic. Canadian Journal of Fisheries and Aquatic Sciences, 39: 407-414.
Stillwell, C.E., Kohler, N.E., 1993. Food habits of the sandbar shark Carcharhinus
plumbeus off the U.S. northeast coast, with estimates of daily ration. Fishery Bulletin US, 91: 138-150.
Stobutzki, I.C., Miller, M.J., Heales, D.S., Brewer, D.T., 2002. Sustainability of
elasmobranchs caught as bycatch in a tropical prawn (shrimp) trawl fishery. Fishery Bulletin, 100: 800–821.
Strong, W.R., Gruber, S.H., Snelson, F.F., 1990. Hammerhead shark predation on
stingrays: an observation of prey handling by Sphyrna mokarran. Copeia, 1990: 836-840.
Summers, A.P., 2000. Stiffening the stingray skeleton: An investigation of durophagy in
myliobatid stingrays (Chondrichthyes, Batoidea, Myliobatidae). Journal of Morphology, 243: 113-126.
Summers, A.P., Ketcham, R.A., Rowe, T., 2004. Structure and function of the horn shark
(Heterodontus francisci) cranium through ontogeny: Development of a hard prey specialist. Journal of Morphology, 260: 1-12.

94
Summers, A.P., Koob, T.J., Brainerd, E.L., 1998. Stingray jaws strut their stuff. Nature, 395: 450-451.
Summerson, H.C., Peterson, C.H., 1990. Recruitment failure of the bay scallop,
Argopecten irradians concentricus, during the first red tide, Ptychodiscus brevis, outbreak recorded in North Carolina. Estuaries, 13: 322-331.
Sundstrom, L.F., Gruber, S.H., Clermont, S.M., Correia, J.P.S., de Marignac, J.R.C.,
Morrissey, J.F., Lowrance, C.R., Thomassen, L., Oliveira, M.T., 2001. Review of elasmobranch behavioral studies using ultrasonic telemetry with special reference to the lemon shark, Negaprion brevirostris, around Bimini Islands, Bahamas. Environmental Biology of Fishes, 60: 225-250.
Talent, L.G., 1976. Food habits of the leopard shark, Triakis semifasciata, in Elkhorn
Slough Monterey Bay, California. California Fish and Game, 62: 286–298. Tamarack, J.L., 1993. Alligator mississippiensis (American alligator). Diet.
Herpetological Review, 24: 57. Taylor, J.G., 1996. Seasonal occurrence, distribution and movements of the whale shark,
Rhincodon typus, at Ningaloo Reef, Western Australia. Marine and Freshwater Research, 47: 637–642.
Taylor, J.G., 2007. Ram filter-feeding and nocturnal feeding of whale sharks (Rhincodon
typus) at Ningaloo Reef, Western Australia. Fisheries Research, 84 :65-70. Taylor, S.M., Bennett, M.B., 2008. Cephalopod dietary specialization and ontogenetic
partitioning of the Australian weasel shark Hemigaleus australiensis White, Last & Compagno. Journal of Fish Biology, 72: 917-936.
Thrush, S.F., Pridmore, R.D., Hewitt, J.E., Cummings, V.J., 1991. Impact of ray feeding
disturbances on sandflat macrobenthos: do communities dominated by polychaetes or shellfish respond differently? Marine Ecology Progress Series, 69: 245-252.
Thrush, S.F., Pridmore, R.D., Hewitt, J.E., Cummings, V.J., 1994. The importance of
predators on a sandflat: interplay between seasonal changes in prey densities and predator effects. Marine Ecology Progress Series, 107: 211-222.
Travers, M.J., Potter, I.C., 2002. Factors influencing the characteristics of fish
assemblages in a large subtropical marine embayment. Journal of Fish Biology, 61: 764-784.
Tricas, T.C., 1979. Relationship of the blue shark, Prionace glauca, and its prey species
near Santa Catalina Island, California. Fishery Bulletin, 77: 175–182.

95
Tricas, T.C., 1985. Feeding ethology of the white shark, Carcharodon carcharias. Memoirs of the Southern California Academy of Sciences, 9: 81-91.
Tricas, T.C., McCosker, J.E., 1984. Predatory behavior of the white shark (Carcharodon
carcharias), with notes on its biology. Proceedings of the California Academy of Sciences, 43: 221-238.
Valentine, J.F., Heck, K.L., Harper, P., Beck, M., 1994. Effects of bioturbation in
controlling turtlegrass (Thalassia testudinum Banks ex Konig) abundance: evidence from field enclosures and observations in the northern Gulf of Mexico. Journal of Experimental Marine Biology and Ecology, 178: 181-192.
Valentine, J.F., Heck, K.L., Jr., 2005. Interaction strength at the coral reef-seagrass
interface: has overfishing diminished the importance of seagrass habitat production for coral reef food webs? Coral Reefs, 24: 209-213.
Valentine, J.F., Heck, K.L., Jr., Blackmon, D., Goecker, M.E., Christian, J., Kroutil,
R.M., Peterson, B.J., Vanderklift, M.A., Kirsch, K.D., Beck, M., 2008. Exploited species impacts on trophic linkages along reef-seagrass interfaces in the Florida Keys. Ecological Applications, 18: 1501-1515.
Valone, T.J., 1993. Patch information and estimation: a cost of group foraging. Oikos,
68:258-266. van der Elst, R.P., 1979. A proliferation of small sharks in the shore-based Natal sports
fishery. Environmental Biology of Fishes, 4: 349-362. VanBaricom, G.R., 1982. Experimental analyses of structural regulation in a marine sand
community exposed to oceanic swell. Ecological Monographs, 52: 283-305. Vanderklift, M.A., Ponsard, S., 2003. Sources of variation in consumer-diet δ15N
enrichment: a meta-analysis. Oecologia, 136: 169-182. Vaudo, J.J., Heithaus, M.R., 2009. Spatiotemporal variability in a sandflat elasmobranch
fauna in Shark Bay, Australia. Marine Biology, 156: 2579–2590. Visser, I., 1999. Benthic foraging on stingrays by killer whales (Orcinus orca) in New
Zealand waters. Marine Mammal Science, 15: 220-227. Visser, I., 2005. First observations of feeding on thresher (Alopias vulpinus) and
hammerhead (Sphyrna zygaena) sharks by killer whales (Orcinus orca) specialising on elasmobranch prey. Aquatic Mammals, 31: 83-88.

96
Wallman, H.L., Bennett, W.A., 2006. Effects of parturition and feeding on thermal preference of Atlantic stingray, Dasyatis sabina (Lesueur). Environmental Biology of Fishes, 75: 259-267.
Walters, C., Juanes, F., 1993. Recruitment limitation as a consequence of natural
selection for use of restricted feeding habitats and predation risk taking by juvenile fishes. Canadian Journal of Fisheries and Aquatic Sciences, 50: 2058-2070.
Weng, K.C., Boustany, A.M., Pyle, P., Anderson, S.D., Brown, A., Block, B.A., 2007.
Migration and habitat of white sharks (Carcharodon carcharias) in the eastern Pacific Ocean. Marine Biology, 152: 877-894.
Weng, K.C., O'Sullivan, J.B., Lowe, C.G., Winkler, C.E., Dewar, H., Block, B.A., 2007.
Movements, behavior and habitat preferences of juvenile white sharks Carcharodon carcharias in the eastern Pacific. Marine Ecology-Progress Series, 338: 211-224.
Werner, E.E., Peacor, S.D., 2003. A review of trait-mediated indirect interactions in
ecological communities. Ecology, 84: 1083-1100. Wetherbee, B.M., Cortés, E., 2004. Food consumption and feeding habits. In: Carrier,
J.C., Musick, J.A., Heithaus, M.R. (Eds) The Biology of Sharks and Their Relatives. CRC Press, Boca Raton, FL, pp. 224-246.
Wetherbee, B.M., Gruber, S.H., 1990. The effects of ration level on food retention time
in juvenile lemon sharks, Negaprion brevirostris. Environmental Biology of Fishes, 29: 59-65.
Wetherbee, B.M., Gruber, S.H., 1993. Absorption efficiency of the lemon shark
Negaprion brevirostris at varying rates of energy intake. Copeia, 1993: 416-425. Wetherbee, B.M., Gruber, S.H., Cortés, E., 1990. Diet, feeding habits, digestion, and
consumption in sharks, with special reference to the lemon shark, Negaprion brevirostris. In: Pratt, H.L., Jr., Gruber, S.H., Taniuchi, T. (Eds) Elasmobranchs as Living Resources: Advances in Biology, Ecology, Systematics and the Status of the Fisheries. NOAA Tech Rep 90, National Marine Fisheries Service, Silver Spring, MD, pp. 29–47.
Wetherbee, B.M., Gruber, S.H., Rosa, R.S., 2007. Movement patterns of juvenile lemon
sharks, Negaprion brevirostris within Atol das Rocas, Brazil: a nursery characterized by tidal extremes. Marine Ecology Progress Series, 343: 283-293.

97
White, W.T., Platell, M.E., Potter, I.C., 2004. Comparisons between the diets of four abundant species of elasmobranchs in a subtropical embayment: implications for resource partitioning. Marine Biology, 144: 439-448.
White, W.T., Potter, I.C., 2004. Habitat partitioning among four elasmobranch species in
nearshore, shallow waters of a subtropical embayment in Western Australia. Marine Biology 145: 1023-1032.
White, W.T., Sommervile, E., 2010. Elasmobranchs of tropical marine ecosystems. In:
Carrier, J.C., Musick, J.A., Heithaus, M.R. (Eds), Sharks and Their Relatives II: Biodiversity, Adaptive Physiology, and Conservation. CRC Press, Boca Raton, FL, pp. 159-239.
Williams, T.M., Estes, J.A., Doak, D.F., Springer, A.M., 2004. Killer appetites: assessing
the role of predators in ecological communities. Ecology, 85: 3373-3384. Wilson, S.G., Polovina, J.J., Stewart, B.S., Meekan, M.G., 2006. Movements of whale
sharks (Rhincodon typus) tagged at Ningaloo Reef, Western Australia. Marine Biology, 148: 1157-1166.
Wilson, S.G., Taylor, J.G., Pearce, A.F., 2001. The seasonal aggregation of whale sharks
at Ningaloo Reef, Western Australia: currents, migrations and the El Nino/Southern Oscillation. Environmental Biology of Fishes, 61: 1-11.
Wirsing, A.J., Heithaus, M.R., 2009. Olive-headed sea snakes Disteria major shift
seagrass microhabitats to avoid shark predation. Marine Ecology Progress Series, 387: 287–293.
Wirsing, A.J., Heithaus, M.R., Dill, L.M., 2007a. Living on the edge: dugongs prefer to
forage in microhabitats that allow escape from rather than avoidance of predators. Animal Behaviour, 74: 93–101.
Wirsing, A.J., Heithaus, M.R., Dill, L.M., 2007b. Fear factor: Do dugongs (Dugong
dugon) trade food for safety from tiger sharks (Galeocerdo cuvier)? Oecologia, 153: 1031-1040.
Wirsing, A.J., Heithaus, M.R., Dill, L.M., 2007c. Can you dig it? Use of excavation, a
risky foraging tactic, by dugongs is sensitive to predation danger. Animal Behaviour, 74: 1085-1091.
Wirsing, A.J., Heithaus, M.R., Frid, A., Dill, L.M., 2008. Seascapes of fear: methods for
evaluating sublethal predator effects experienced and generated by marine mammals. Marine Mammal Science, 24: 1-15.

98
Yahel, G., Yahel, R., Katz, T., Lazar, B., Herut, B., Tunnicliffe, V., 2008. Fish activity: a major mechanism for sediment resuspension and organic matter remineralization in coastal marine sediments. Marine Ecology Progress Series, 372: 195-209.
Yahel, R., Yahel, G., Genin, A., 2002. Daily cycles of suspended sand at coral reefs: a
biological control. Limnology and Oceanography, 47: 1071–1083. Yamaguchi, A., Kawahara, I., Ito, S., 2005. Occurrence, growth and food of longheaded
eagle ray, Aetobatus flagellum, in Ariake Sound, Kyushu, Japan. Environmental Biology of Fishes, 74: 229–238.

99
CHAPTER III
SPATIOTEMPORAL VARIABILITY IN A SANDFLAT ELASMOBRANCH FAUNA
IN SHARK BAY, AUSTRALIA

100
Abstract
Dramatic declines in populations of large elasmobranchs, as well as the potential
release of elasmobranch mesopredators, have led to interest in the ecological role of this
group of fishes. The first step to elucidating their ecological importance, however, is an
understanding of elasmobranch community structure. Such studies are relatively
uncommon, especially in communities where human impacts are thought to be low. I
used visual surveys and a variety of capture methods to determine spatial and temporal
variation in the species composition of a sandflat elasmobranch community in the
relatively pristine ecosystem of Shark Bay, Australia. Overall, juvenile batoids
dominated the community. Eleven elasmobranch species (10 batoids, 1 shark) were
found to inhabit the sandflats during the cold season (June-August) and 21 species (12
batoids, 9 sharks) were recorded during the warm season. The overall density of
elasmobranchs occupying the sandflat was also higher during the warm season.
Nearshore areas, especially during the warm season, supported the highest densities of
elasmobranchs overall as well as the dominant species (giant shovelnose ray,
Glaucostegus typus, and reticulate whipray, Himantura uarnak). Such high
elasmobranch abundance may be driven by a combination of factors including prey
availability, predator avoidance, and behavioral thermoregulation. The high species
richness and density of elasmobranchs in such a restricted area suggests that
elasmobranch mesopredators could exert strong top-down impacts in nearshore
environments in the absence of human impacts, but raises questions of how resources are
partitioned among apparently similar species in this system.

101
Introduction
Declines of large sharks (>2m TL) have been well publicized and investigations
into their ecological importance have been widely recognized as being important
(Heithaus 2004; Myers et al. 2007; Heithaus et al. 2008, 2010). However, less attention
has been paid to elasmobranch mesopredators – smaller species at intermediate trophic
levels including sharks and batoids (skates and rays) –, which also may be ecologically
important (e.g., VanBlaricom 1982; Thrush et al. 1991, 1994; Peterson et al. 2001).
Mesopredators provide a crucial link between top predators and lower trophic levels and
can play important roles in the dynamics of a variety of systems. The most dramatic
examples of the role of mesopredators come from systems where top predators have been
eliminated. Under these conditions, mesopredator populations can show increases
through what has been termed “mesopredator release” (Soule et al. 1988), resulting in the
decrease of prey species of mesopredators (e.g., Rayner et al. 2007; Berger and Conner
2008). While many elasmobranch populations have declined worldwide (e.g., Musick et
al. 1993; Stobutzki et al. 2002; Baum et al. 2003), some elasmobranch mesopredators
appear to have increased in areas where populations of large sharks have declined
(Shepard and Myers 2005; Myers et al. 2007). Myers et al. (2007) suggested that the
removal of large sharks in the northwest Atlantic Ocean triggered a trophic cascade
whereby cownose rays underwent a population expansion, which played an important
role in the collapse of commercial scallop populations. Therefore, studies of
elasmobranch mesopredators – particularly in relatively pristine ecosystems – are
important for understanding the dynamics of coastal ecosystems and drafting appropriate
management plans (e.g., Heithaus et al. 2008).

102
Understanding spatial and temporal variation in community structure is a
necessary first step to understanding the ecological role of elasmobranchs. For example,
the importance of a particular elasmobranch species in a community will likely depend
on the presence and identity of competitors and/or predators in the community (e.g.,
Kitchell et al. 2002; see Heithaus et al. 2008 for a review). Unfortunately, relatively few
quantitative studies of elasmobranch community structure exist (Heithaus et al. 2007a).
These studies are of particular value in pristine ecosystems where it is possible to
elucidate the interactions and ecological roles of predators in the absence of historical and
ongoing anthropogenic effects and begin to develop general predictions about how
systems are likely to respond to management (Sinclair et al. 2007; Heithaus et al. 2008).
Shark Bay, Western Australia has been used as a model system for understanding
the ecological role of tiger sharks (Galeocerdo cuvier) in a relatively pristine ecosystem
(Heithaus et al. 2007b). Largely overlooked, however, is the diversity of elasmobranch
mesopredators (but see White et al. 2004), many of which inhabit the nearshore shallows.
To begin to assess the ecological importance of elasmobranch mesopredators in Shark
Bay, I investigated spatial and temporal variation in the abundance and species
composition of the elasmobranch community inhabiting nearshore sandflats. In addition,
I examined the size distributions and microhabitat preferences of common species.
Materials And Methods
Study Site
Shark Bay, Western Australia (25°45´S, 113°44´E), which was designated a
World Heritage Area in 1991, is a large (ca. 13,000 km2) semi-enclosed bay on the

103
central west coast of Australia (Fig. 1). Because of its remote location and World
Heritage status, fishing pressure within the bay is low and most of the bay’s large and
diverse marine vertebrate populations have probably been minimally impacted by
humans (Heithaus et al. 2007b and references therein). As a result Shark Bay may be one
of the world’s least impacted seagrass ecosystems.
Shark Bay is relatively shallow throughout with expansive shallow sandflats
adjacent to shore with fringing shallow seagrass beds (<4 m). The bay also features
numerous offshore banks (<4 m) predominantly covered by seagrasses. Deep areas (6-15
m) are primarily covered by sand or silt, but may contain sparse stands of seagrass.
The nearshore shallow sandflat habitat, where I conducted this study (~8.3 km2),
can be divided into three general microhabitats. These include sandflats adjacent to shore
that are intertidal during at least a portion of the year and are less than one meter deep.
Shallow subtidal sandflats (1-2 m) are found further offshore, but landward of areas with
patchy seagrass (1-3 m). Hereafter, these microhabitats will be referred to as “nearshore”
(~1.0 km2 of the study site), “sand” (~3.3 km2 of the study site), and “patchy” (~4.0 km2
of the study site), respectively.
Mean monthly sea-surface temperature over deep water varies seasonally between
16-27C in Shark Bay, although sandflat water temperature are often more extreme (14-
31C). Because many of the large mobile species in Shark Bay display seasonal
abundances that drop substantially at temperatures below 20C (Heithaus 2001), I
divided the year into the “warm” season (September-May; mean monthly water
temperatures are above 20C) and the “cold” season (June-August; mean monthly water
temperatures are below 20C).

104
Study Methods
The shallow and clear waters of Shark Bay’s sandflats permit visual identification
of elasmobranchs to the species level while boating (Fig. 2), so I assessed elasmobranch
microhabitat use and community composition using belt transects. I established two 1.5-
km long transects for each microhabitat type on the Cape Rose Flats (Fig. 1) and ran
them in a 4.5-m vessel at a speed of 5-6 km h-1. All elasmobranchs within 5 m or, early
in the study, 10 m of the transect were identified to species and their locations were
recorded. Transect width was permanently reduced when seasonal changes in visibility
rarely allowed for the expanded width, but regularly allowed for the reduced transect
width. Because of the sedentary nature of most of the animals I surveyed and their
tendency to not flee until the last moment, there should be little to no bias toward seeing
more animals during the wider transects. I haphazardly chose the direction and order of
transects and no transect was run more than once per day. Transects were only conducted
in Beaufort wind conditions of two or less and when glare off the water and turbidity did
not affect sighting conditions. Between March 2006 and October 2007, I conducted 190
transects (22 cold season, nearshore; 31 cold season, sand; 32 cold season, patchy; 35
warm season, nearshore; 37 warm season, sand; 33 warm season, patchy). To ensure that
rare and frequently swimming species, which were often seen in the study site but rarely
seen during transects, were accounted for I began recording the species identification and
location of all elasmobranchs observed on the Cape Rose Flats regardless of whether or
not I were on transect in October 2006.
To verify species identifications and provide a preliminary examination of the
size structure of elasmobranchs on the sandflats, I captured elasmobranchs using

105
longlines and nets. Between September 2005 and November 2006, 71 longline sets were
completed during daylight hours in all three microhabitat types (although mostly in
nearshore and sand microhabitats) on the Cape Rose Flats. Longlines ranged from 125 to
250m in length with hook numbers ranging from 21 to 51 hooks. I used a combination of
11/0 and 13/0 circle hooks baited with squid. Typically 13/0 circle hooks outnumbered
11/0 circle hooks by a ratio of 2:1. These hook sizes were chosen on the basis of the size
of animals observed in the field. Numerous small elasmobranchs with small mouths
(e.g., bamboo sharks) were captured, suggesting that hook size did not limit catches of
rays and smaller sharks. Soak times ranged from 0.5 to 3.5 h with an average soak time of
1.69 0.65 h (mean SD). In March 2006, I began opportunistically sampling animals
using nets. Once sighted, I either circled animals with a gillnet deployed from a boat or
captured them with a dipnet. Captured animals were measured (total length or disc
width), sexed, and maturity of males was determined by assessing clasper calcification
(Carrier et al. 2004).
Analyses
I analyzed differences in community composition across season and microhabitat
using a two-way analysis of similarity (ANOSIM). Prior to analysis, relative abundance
data from transects were fourth root transformed and used to construct a Bray-Curtis
similarity matrix. Ordination of the Bray-Curtis similarity matrix was achieved using
non-metric multidimensional scaling (NMDS). Upon finding significant differences
between treatments, I conducted a similarity percentages (SIMPER) analysis to identify
which species contributed most to the observed differences. Transects on which no

106
elasmobranchs were observed were removed from these analyses, as were species that
appeared on fewer than 5% of transects. As a result 122 transects were used for analyses
(13 cold season, nearshore; 19 cold season, sand; 20 cold season, patchy; 33 warm
season, nearshore; 19 warm season, sand; 18 warm season, patchy). Because individuals
of morphologically similar species could not always be identified to species before I lost
visual contact (i.e., they swam off before species identification could be confirmed or
could not always be distinguished when buried), I pooled some species categories into
groups for these analyses to ensure that all individuals of dominant species were
included. The three maskray species (Neotrygon spp.) were combined to form one group.
The reticulate whipray (Himantura uarnak) and pink whipray (H. fai) were grouped and
all small carcharhinds also comprised a mixed species group. Finally, the blackspotted
whipray (H. astra) and brown whipray (H. toshi) were grouped for all analyses because
they have often been confused in the literature and the blackspotted whipray was
described after the completion of my fieldwork (Last et al. 2008). Photographs of
captured animals confirm that both species were present during my study (W. White,
personal communication).
Using univariate analyses, I further investigated the effect of season and
microhabitat on the overall abundance of elasmobranchs and the species identified by
SIMPER as playing a large role in community structure. Because of the large number of
zeros in the dataset, these analyses were conducted using conditional models. This
technique modeled the response in two states (presence/absence and abundance
dependent upon presence). First, the presence of a species on an individual transect was

107
modeled using a logistic regression, and then zero-truncated, log transformed abundance
data were analyzed with a generalized linear model.
To further investigate the possibility of interspecific variation in distributions
across the sandflat, all elasmobranch sightings (transect and non-transect) after October
2006 were plotted on a map of the Cape Rose Flats using ArcView 3.2a and distance to
nearest shore was calculated for each sighting. Sightings were used as the unit of
measure instead of number of individuals because some of the species (particularly the
pink whipray) were observed in groups and were not necessarily independent
occurrences. Because I did not record my time spent in each habitat, microhabitat use
patterns of each species cannot be examined using these data; however, interspecies
comparisons of relative habitat use are possible because given the narrow range of depths
encountered and slow speeds used while traversing the flats, the probability of sighting
each species should not vary much with distance from shore. I binned the calculated
distances in 100-m intervals and conducted a Chi-square test of homogeneity for distance
to nearest shore. As a result of the low number of sightings during the cold season, I
performed this analysis on only the warm season data and only species that were sighted
>50 times were included.
Results
Community Structure
Twenty-one species from ten families were recorded from the nearshore sandflats
of Shark Bay’s Eastern Gulf (Table 1). Between October 2006 and October 2007, 18 of
these species (12 batoids, 6 sharks) from nine families were observed on the Cape Rose

108
Flats. Of the 1,157 elasmobranchs observed during this time period, batoids accounted
for 92.4% of these individuals. The giant shovelnose ray (Glaucostegus typus) was the
dominant elasmobranch observed on the sandflats (31.1% of individuals). Other
prominent species (>10% of individuals) on the sandflats were the pink whipray (14.2%),
whitespotted eagle ray (Aetobatus narinari, 12.1%), reticulate whipray (11.7%), and
cowtail stingray (Pastinachus atrus, formerly P. sephen, 10.1%).
Most individuals were sighted singly, although the giant shovelnose ray, reticulate
whipray, and cowtail ray were occasionally observed resting in single or multispecies
groups (animals were considered to be part of a group if they were <1 m from another
individual) or looser aggregations (animals separated by >1 m), particularly in nearshore
microhabitats. The only species that was regularly seen in groups was the pink whipray,
with groups making up 42.4% of sightings (25 of 59). Groups of pink whiprays, which
were observed resting and swimming together, ranged from two to at least 25 individuals
with 68% of groups containing fewer than six individuals.
Species composition varied between the warm and cold seasons (Fig. 3). While
all species observed during the cold season were present during the warm season, ten
species were only observed in the warm season (Table 1), including two major predators
of elasmobranch mesopredators – the tiger shark (n = 3 sightings) and great hammerhead
shark (Sphyrna mokarran, n = 2 sightings). Of the species only observed during the
warm season, the smooth nose wedgefish (Rhynchobatus laevis) was sighted most often
(n = 22 sightings). Of species present during both seasons, the blackspotted/brown
whipray group increased in proportion during the warm season (two-proportion tests, z =
2.16, all P = 0.03), while the maskray complex was the only group that made up a higher

109
proportion of individuals during the cold season (two-proportion tests, z = 2.28, P =
0.02).
During transects, 630 elasmobranchs from 15 species and seven families were
sighted (of the 21 species and 10 families present in the area) (Table 1). Batoids
accounted for 73% of the observed species (11/15) and 86.7% of individuals (546/630).
The giant shovelnose ray was the dominant elasmobranch on transects making up 48.1%
(303/630) of individuals. The only other species with more than 50 individuals sighted
on transect were the reticulate whipray, nervous shark (Carcharhinus cautus), and the
blackspotted/brown whipray group. Combined these five species made up 84% of
individuals sighted on transects. Within the reticulate/pink whipray group, 59 of the 66
identified individuals were reticulate whiprays, while 58 of 61 identified carcharhinids
were nervous sharks.
Overall community structure was influenced by season and microhabitat
(ANOSIM, R = 0.131, P = 0.003 and R = 0.138, P = 0.001, respectively) with all three
microhabitats differing from each other (ANOSIM pairwise comparisons, R: 0.064-
0.222, all P ≤ 0.022). The NMDS plot revealed that many of the warm season transects
formed a large group in the center of the ordination space, indicating a high degree of
similarity (Fig. 4). Nearshore transects made up the majority of this group. Cold season
and sand transects, on the other hand were widely dispersed throughout the ordination
space. The SIMPER analysis revealed that differences in the abundance of the giant
shovelnose ray and reticulate/pink whipray group contributed the most to the observed
patterns of community composition with these species groups each contributing >20% of

110
the observed dissimilarity and >45% of the observed dissimilarity combined for all
pairwise comparisons.
The presence of elasmobranchs on a transect was influenced by an interaction
between season and microhabitat (logistic regression, 2 = 11.15, df = 2, P = 0.004). The
highest probability of encountering an elasmobranch was on nearshore transects during
the warm season (Table 2). When elasmobranchs were present, densities were also
affected by a season x microhabitat interaction (GLZ, 2 = 9.73, df = 2, P = 0.008) with
densities highest nearshore during the warm season (Fig. 5). Maximum elasmobranch
density on these transects was 29.3 animals ha-1 and on five of the 35 warm season,
nearshore transects densities were greater than 10 animals ha-1. Giant shovelnose rays
were present throughout the year; microhabitat was the only factor influencing their
presence on transect (logistic regression, 2 = 20.31, df = 2, P < 0.001). The probability
of encountering a giant shovelnose ray was highest on nearshore transects (Table 3).
Similarly, microhabitat was the only factor that influenced density when giant shovelnose
rays were present (GLZ, 2 = 10.51, df = 2, P = 0.005). Nearshore densities (maximum
density 22.7 animals ha-1) were higher than densities in patchy microhabitats (Fig. 6).
The season x microhabitat interaction influenced the presence of the reticulate/pink
whipray group (logistic regression, 2 = 31.13, df = 2, P < 0.001). The probability of
encountering a reticulate/pink whipray decreased with distance from shore in the warm
season and increased with distance from shore in the cold season (Table 4). When
present densities of the reticulate/pink whipray group were influenced by season (GLZ,

111
2 = 6.46, df = 2, P = 0.011) with higher densities during the warm season with a
maximum density of 5.3 animals ha-1 (Fig. 7)
The distance from shore at which sightings occurred differed among giant
shovelnose rays, reticulate whiprays, whitespotted eagle rays, cowtail stingrays, and
blackspotted/brown whipray group, nervous sharks and pink whiprays (chi-square 2 =
114.44, P = 0.042, Fig. 8). Whitespotted eagle rays and pink whiprays tended to be
found less often than expected in nearshore microhabitats and more often further offshore
(subtidal sand microhabitats) than other species. Indeed, substantially fewer than
expected whitespotted eagle rays were found within 200 m of shore, and far more
between 300-500 m from shore. Pink whipray sightings were more common than
expected slightly closer to shore (200-300 m offshore). Giant shovelnose rays had higher
relative abundances than expected at distances of 100-200 m from shore. Cowtail
stingrays and nervous sharks, while matching expected frequencies close to shore, were
slightly overrepresented at distances associated with patchy seagrass and the
blackspotted/brown whipray group was sighted slightly more often than expected at
distances corresponding to the sand microhabitat. Although not enough individuals were
encountered to be included in the analysis, smooth nose wedgefish occurred most often
greater than 300m from shore (sand and patchy microhabitats) with the majority of
animals sighted between 300 and 600 m from shore, while tiger and great hammerhead
sharks tended to be sighted between 500 and 1000 m from shore.

112
Elasmobranch Captures
In 3,324.8 hook hours, I captured 62 elasmobranchs from 6 species and 4 families
on longlines. The CPUE was 1.7 3 animals 100 hook-1 h-1 and did not differ between
seasons (two-sample t-test, t = 0.13, P > 0.05). Giant shovelnose rays made up 80.6% of
the longline catch. The other species captured were the reticulate whipray (6.4%),
blackspotted whipray (4.8%), nervous shark (3.2%), brown-banded bamboo shark
(Chiloscyllium punctatum, 3.2%), and milk shark (Rhizoprionodon acutus, 1.6%).
As a result of the low capture rate and limited number of species captured on
longlines, netting became the primary method of capture in 2006. From September 2005
through January 2009, 430 elasmobranchs from 17 species and seven families were
captured in nearshore sandflats habitats (Table 1). The the basis of clasper calcification,
mature males were captured from eight species. In elasmobranchs, females tend to
mature at larger sizes than males (e.g., Cope 2006; Smith et al. 2007), so if size of the
smallest mature male is used as a conservative estimate of size at maturity for females,
most captured individuals from common species (blackspotted/brown whipray – 40.0%,
nervous shark – 42.9%, whitespotted eagle ray – 57.1%, reticulate whipray – at least
70.9%, giant shovelnose ray – 90.4%, cowtail stingray – at least 98.7%, and pink whipray
– 100%) were immature. For the giant shovelnose ray and nervous shark the proportion
of immature individuals is likely to be higher because small individuals (as young as
Age-0) that could not be captured easily were regularly observed. On the basis of
captures, only brown-banded bamboo sharks (83% mature) and the undescribed maskray
species (94%) appear to regularly use the shallow nearshore habitats as adults.

113
For most species, sex ratios did not differ from 1:1. Three species however, did
differ significantly from 1:1. The brown-banded bamboo shark showed a male bias, with
no females caught in nearshore microhabitats (one-proportion test, P < 0.001). On the
other hand, the reticulate whipray (1:2.4, M:F) and the undescribed maskray species
(1:3.2) both displayed a female bias (one-proportion test, P = 0.003, and P = 0.049,
respectively).
Discussion
The elasmobranch diversity in the nearshore shallow waters of Shark Bay is
strikingly high. I recorded 21 species from ten families in an area of only ca 8 km2 that
contains relatively little habitat variation that might allow increased diversity through
habitat specialization (Tews et al. 2004). Combining these records with the species
recorded from unvegetated, seagrass, and mangrove-lined habitats 13 km from my study
area by White and Potter (2004), a total of 28 species from 13 families have been
recorded from the western coast of Shark Bay’s eastern gulf from the shoreline to the
seagrass beds at depths of about 3 m. During the summer of 1990, systematic benthic
trawls throughout the Gulf of Carpentaria (300,000 km2) on Australia’s north coast,
recorded only 27 species from ten families (Blaber et al. 1994). Furthermore, Shark
Bay’s nearshore waters contain at least 34% of the elasmobranch species that are known
to occur in the region of Australia’s northern prawn fishery, which covers 1,000,000 km2
and a wider variety of habitats (Stobutzki et al. 2002). On the basis of other records from
the wider Shark Bay region (including the Western Gulf), at least 13 more elasmobranch
species and four families (Hutchins 1990; Connor and Heithaus 1996; Heithaus 2001;

114
Heithaus 2004; unpublished data) are present, suggesting that Shark Bay is a biodiversity
hotspot for elasmobranchs like it is for teleost fish (Black et al. 1990; Hutchins 1990).
Indeed, Shark Bay also appears to have greater elasmobranch diversity than
similar areas in other parts of the world. Everglades National Park (ENP), USA, is at
roughly the same latitude and has similar habitats to Shark Bay, but with greater habitat
diversity. Historically 27 elasmobranch species have been recorded from the waters of
ENP, however, Wiley and Simpfendorfer (2007) only recorded 13 species despite year
round sampling throughout ENP across multiple habitat types and using a variety of
capture techniques. The difference in diversity between these two areas may be a result
of Shark Bay’s location in the Indo-West Pacific region. The Indo-West Pacific is a
hotspot of diversity and at a smaller scale contains many of the most diverse
chondrichthyan faunas in the world (Compagno et al. 2005; White et al. 2006; Last and
Stevens 2009). My study suggests that for elasmobranchs this hotspot continues into the
subtropical waters of Western Australia.
The high elasmobranch species diversity in this area is coupled with high
densities. The maximum density recorded on a transect was approximately 30
individuals ha-1. While these densities may not be as high as densities found in other
nearshore environments (Platell et al 1998; Hoisington and Lowe 2005), most of the
animals over the Cape Rose Flats in Shark Bay are much larger (50-100 cm DW vs. 15-
30 cm DW). As a result elasmobranch biomass may be closer than densities would
indicate and Shark Bay elasmobranch biomass might even exceed these other areas at
times.

115
While elasmobranchs were sighted throughout the year, there was a strong
seasonal pattern to occurrence and density. Ten of the 21 species observed during this
study were only seen during the warm season (Table 1) and of the remaining species, all
but the giant shovelnose ray, were infrequently seen during the cold season. Although
differences were found between microhabitats in community structure, the most common
elasmobranchs on the nearshore sandflat were found across all three microhabitat types
and showed little evidence of microhabitat partitioning during the warm season at the
scale examined. As a result, community differences between season and microhabitat
combinations were largely a result of patterns of presence and changes in density of
common species. Giant shovelnose rays were sighted more often and in higher
abundances on nearshore transects and the presence of reticulate whiprays varied with
habitat and season, but were most common on nearshore transects during the warm
season.
Seasonal variation in abundance and habitat shifts are not uncommon in
elasmobranchs (e.g., Smith and Merriner 1987; Heithaus 2001; Wirsing et al. 2006) and
seasonal movement of elasmobranchs into shallow waters has been reported in Shark Bay
(White and Potter 2004). These types of movements are often associated with changes in
water temperature (e.g., Casey and Kohler 1992; Heithaus 2001), so the influx of new
elasmobranch species onto the sandflats during the warm season was not surprising. In
fact, Shark Bay is near the southern limit of the distribution of all of the species that were
only observed during the warm season (Last and Stevens 2009), indicating that the cooler
water temperatures during the cold season may preclude these species from using the bay.

116
It is also possible, however, that they are present in Shark Bay during the cold season but
only make use of sandflats when waters are relatively warm.
Reticulate whiprays shifted their relative use of microhabitats between warm and
cold months. During the cold season, reticulate whiprays were rarely seen in the
nearshore microhabitat and occurred more often in the patchy microhabitat, while during
the warm season they were abundant nearshore and their overall density dropped in
patchy habitats. Such a dramatic shift over such a small area indicates a seasonal shift in
the relative benefits of occupying these two microhabitats to the reticulate whipray. The
warm season increase in the occurrence and abundance of other elasmobranchs in the
nearshore microhabitat suggests that this area is strongly preferred and the benefit of
occupying it may be similar across species.
The use of the nearshore microhabitat by so many species during the warm season
could have a substantial impact on the community found there. Indeed, ray feeding pits
are numerous in the nearshore microhabitat during the warm season and can number over
500 on a transect (unpublished data). Ray feeding at this scale not only removes prey
items, but also through the turnover of sediment, can alter invertebrate communities
(Thrush et al. 1991, 1994). Although the number of feeding pits suggests ample
resources in the nearshore microhabitat, a study of the invertebrate community of Shark
Bay’s sandflats reveals an impoverished fauna (Wells et al. 1985). Given the low
biomass of potential prey, elasmobranchs may be partitioning available resources (Platell
et al. 1998; White et al. 2004; Marshall et al 2008), cropping populations of highly
productive prey, or this microhabitat may provide some other benefit. These possibilities
need to be examined further to understand the dynamics of this system.

117
During the warm season, nearshore waters tend to be warmer than those available
in other habitats (unpublished data). It has been suggested that elasmobranchs can
behaviorally exploit local thermal heterogeneity for physiological gains (Economakis and
Lobel 1998; Matern et al. 2000, Wallman and Bennett 2006; Hight and Lowe 2007).
Such behaviors may help explain microhabitat use by elasmobranchs in Shark Bay and
warrant examination.
Interestingly, for most species the nearshore waters of Shark Bay appear to be
used primarily by immature individuals. On the basis of the minimum size of mature
males captured, the vast majority of individuals observed on the flats were immature. No
mature male reticulate whipray, pink whipray, or cowtail stingrays were captured and
only one male giant shovelnose ray was mature, although larger, possibly mature animals
are occasionally seen. Maturity data for the pink whipray outside of Shark Bay (White
and Dharmadi 2007) suggest that all individuals I captured were immature. I did,
however, capture several immature individuals exceeding published size at maturity from
the reticulate whipray, giant shovelnose ray, and cowtail stingray. In Indonesia, sizes at
maturity for these species are 82-84 cm DW, 150-180 cm TL, and 96-100 cm DW,
respectively (White et al. 2006; White and Dharmadi 2007). Regional variation in life
history parameters such as size at maturity is common in elasmobranchs and size at
maturity is a parameter that tends to be larger at higher latitudes (Cope 2006; Frisk and
Miller 2009), so size at maturity in Shark Bay should be similar or larger than that at
lower latitudes (e.g., White et al 2002).
Similarly, White and Potter (2004) found that most of the sharks they captured in
the shallow waters of Shark Bay adjacent to mangrove habitats were immature, and many

118
still possessed umbilical scars. As a result they concluded that the nearshore, shallow
waters served as a nursery ground for lemon sharks (Negaprion acutidens), spinner
sharks (Carcharhinus brevipinna), blacktip sharks (Carcharhinus limbatus), and milk
sharks. My data suggest that these waters may also be important juvenile habitat and
serve a nursery function for giant shovelnose rays, reticulate whiprays, pink whiprays,
and cowtail stingrays. The observed habitat use may be a result of predator avoidance.
Tiger sharks are seasonally abundant in Shark Bay (Wirsing et al. 2006), although
sightings on the sandflats are less common than on offshore seagrass beds (M. Heithaus,
personal observation) and relatively rare in nearshore microhabitats.
The insights I gained into the elasmobranch community of Shark Bay would not
have been possible without the use of visual survey techniques, which appear to provide a
more accurate depiction of elasmobranch faunas in shallow, clear waters. Previous
studies have used both hook-and-line and gillnets to sample elasmobranchs, which are
unlikely to capture batoids. For example, White and Potter (2004) noted that despite
being abundant, giant shovelnose rays were caught in low numbers by gill netting and
attributed low catch rates to their slow-moving and benthic nature. My own longline sets
were successful at catching giant shovelnose rays, but little else. Longlines only caught
six of the 21 species observed and overrepresented the contribution of giant shovelnose
rays to the nearshore elasmobranch community by a factor of 2.6 (81% vs. 31%). In
addition, longline catch rates were low for all elasmobranchs, despite a high abundance
of animals observed in the area, including specimens that were routinely observed resting
in the vicinity of my longlines, or even swimming over them.

119
Bias is always a concern for studies of fish density and my visual sampling
method appeared to minimize these concerns compared to other, more invasive, methods.
The large size of most elasmobranchs in Shark Bay helped to eliminate sighting bias and
even species that bury could easily be spotted and identified under favorable conditions
(i.e., clear water and low wind). Using these methods, I added an additional 13
elasmobranch species (9 of them batoids) to the elasmobranchs White and Potter (2004)
captured in nearshore shallow waters of Shark Bay. Visual surveys do, of course, have
limitations; depth, water clarity, cover (e.g., dense seagrass), sea state, and cloud cover all
affect the observer’s ability to detect and identify an individual. In addition, many
elasmobranchs are more active nocturnally than diurnally (e.g., Holland et al. 1993;
Cartamil et al. 2003; Vaudo and Lowe 2006) and may use the surveyed areas only at
night. Such animals may be underrepresented or absent from visual surveys which can
only effectively be conducted during daylight hours. Despite these limitations, visual
surveys have proven to be extremely useful for investigating shallow water elasmobranch
mesoconsumer communities, especially for the batoids.
In conclusion, I found that the nearshore elasmobranch community of this pristine
environment is diverse, comprised mainly of batoids, and the nearshore sandflats may
function as a nursery ground for a variety of elasmobranch species. Interestingly, despite
high species diversity, I saw little evidence of habitat partitioning, particularly during the
warm season when several species, including the most numerically dominant, preferred
the nearshore microhabitat. On the basis of these findings, information on the diet of
these species and their prey is needed to help determine the impact if any these

120
mesopredators may have on shaping this community and further study will be required to
elucidate the factors that drive microhabitat use patterns of these species.
Acknowledgments
I would like to thank everyone who helped in the field, especially David Heithaus,
Kirk Gastrich, Meagan Dunphy-Daly, and Jimboy Poland. I also thank the Department
of Environment and Conservation, Shark Bay District; Rory McAuley of the Department
of Fisheries, Western Australia; the Monkey Mia Dolphin Resort for logistical matters;
and Joel Trexler for statistical advice. This research was possible with the support of a
Presidential Fellowship to J. Vaudo, a grant from the National Geographic Expeditions
Council to J. Vaudo, National Science Foundation grants OCE0526065 and OCE0745606
to M. Heithaus, and Florida International University’s College of Arts and Sciences. This
research was conducted under authorization by the Florida International University
Institutional Animal Care and Use Committee, Fisheries Western Australia permit 4/05
and Department of Environment and Conservation permits CE002111 and SF006493.

121
Table 1 Seasons of occurrence and capture records for elasmobranch species recorded on the nearshore sandflats of Shark
Bay, Australia
Family Species Cold Warm #
captured #
Male Male size
range (cm) Smallest mature
male (cm) #
Female Female Size Range
(cm)
Hemiscyllidae Chiloscyllium punctatum a X 12 12 52-82 62 - -
Orectolobidae Orectolobus hutchinsi b X 1 - - - 1 90
Stegostomatidae Stegostoma fasciatum a X - - - - - -
Carcharhinidae Carcharhinus cautus a X X 14 5 50.5-97 96 9 52-117
Carcharhinus limbatus X 1 - - - 1 74
Galeocerdo cuvier X - - - - - -
Negaprion acutidens X 1 94 - - - -
Rhizoprionodon acutus a X 2 2 43.5-82 82 - -
Sphyrnidae Sphyrna mokarran X - - - - - -

122
Table 1 continued
Family Species Cold Warm #
captured #
Male Male size
range (cm) Smallest mature
male (cm) #
Female Female Size Range
(cm)
Rhinobatidae Glaucostegus typus a X X 126 61 62-232 206 60 69-213
Rhynchobatidae Rhynchobatus laevis a X 3 1 224 Not assessed 2 200-217
Rhinidae Rhina ancylostoma X - - - - - -
Dasyatidae Himantura astra and H.
toshi a X X 25 14 23-72 54 11 24-80
H. fai a X X 61 26 58-100 - 35 62-100
H. uarnak a X X 55 16 65-86 - 39 34-113
Neotrygon kuhlii a X X 6 3 21-31 31 3 19-27
Neotrygon leylandi a X X 2 - - - 2 19-22
Neotrygon sp. a X X 17 4 23-26 23 13 19.5-31
Pastinachus atrus a X X 83 45 39-116 - 38 36-133

123
Table 1 continued
Family Species Cold Warm #
captured #
Male Male size
range (cm) Smallest mature
male (cm) #
Female Female Size Range
(cm)
Myliobatidae Aetobatus narinari a X X 21 6 131-155 131 15 64-139
a indicates species sighted on transects
b captured on nearshore sandflat other than Cape Rose Flats

124
Table 2 Logistic regression for factors influencing the presence of elasmobranch on transects. Reference conditions for the odds
ratios are the warm season and sand microhabitat
Predictor Coefficient SE P Odds Ratio Lower 95% Confidence
Limit
Upper 95% Confidence
Limit
Constant 0.0541 0.3289 0.869
Cold 0.4055 0.4941 0.412 1.50 0.57 3.95
Nearshore 2.7493 0.7991 0.001 15.63 3.26 74.85
Patchy 0.2513 0.4819 0.602 1.29 0.50 3.31
Cold x
Nearshore -2.8411 0.9811 0.004 0.06 0.01 0.40
Cold x Patchy -0.2000 0.7082 0.778 0.82 0.20 3.28
Cold Predicted Probability of
Occurrence Warm
Predicted Probability of
Occurrence
Nearshore 0.59 Nearshore 0.94
Sand 0.61 Sand 0.51
Patchy 0.62 Patchy 0.58

125
Table 3 Logistic regression for factors influencing the presence of the giant shovelnose ray (Glaucostegus typus) on transects.
Reference condition for the odds ratios is the sand microhabitat
Predictor Coefficient SE P Odds Ratio Lower 95% Confidence
Limit
Upper 95% Confidence
Limit
Constant -0.6712 0.2563 0.009
Nearshore 1.2102 0.3756 0.001 3.35 1.61 7.00
Patchy -0.4481 0.3855 0.245 0.64 0.30 1.36
Predicted Probability of Occurrence
Nearshore 0.63
Sand 0.34
Patchy 0.25

126
Table 4 Logistic regression for factors influencing the presence of reticulate/pink whipray (Himantura uarnak/H. fai) on transects.
Reference conditions for the odds ratios are the warm season and sand microhabitat
Predictor Coefficient SE P Odds Ratio Lower 95% Confidence
Limit
Upper 95% Confidence
Limit
Constant -1.1350 0.3832 0.003
Cold 0.0789 0.5615 0.888 1.08 0.36 3.25
Nearshore 1.6611 0.5188 0.001 5.26 1.90 14.56
Patchy -1.1676 0.7166 0.103 0.31 0.08 1.27
Cold x
Nearshore -3.650 1.219 0.003 0.03 0.00 0.28
Cold x Patchy 1.8442 0.9008 0.041 6.32 1.08 36.96
Cold Predicted Probability of
Occurrence Warm
Predicted Probability of
Occurrence
Nearshore 0.05 Nearshore 0.63
Sand 0.26 Sand 0.24
Patchy 0.41 Patchy 0.09

127
Fig. 1 The study was conducted in the Eastern Gulf of Shark Bay, Australia (a,b). c) The
shallow flats of Cape Rose were divided up into six 10-m wide belt transects representing
three microhabitats (nearshore sand - black, subtidal sand - gray, and patchy seagrass -
white)

128
Fig. 2 Clear waters and calm winds provide excellent sighting conditions on the Cape
Rose Flats. Pictured is a group of five pink whiprays (Himantura fai). A buried whipray
(H. uarnak or H. fai) is located in the lower left corner

129
Fig. 3 Relative abundances of elasmobranch taxa on the shallow flats of Shark Bay.
Species richness increases during the warm season although there is little change in the
relative abundance of most species

130
Fig. 4 Non-metric multidimensional scaling plot of community similarity of the
elasmobranch fauna of a nearshore sandflat. Warm x nearshore transects tended to show
greater community similarity than other season x microhabitat combinations. Open
symbols are the cold season and filled symbols are the warm season. Triangles, circles,
and squares are nearshore, sand, patchy microhabitats, respectively

131
0
1
2
3
4
5
6
Nearshore Sand Patchy
De
ns
ity
(a
nim
als
ha
-1)
a
b b
b bb
Fig. 5 The influence of microhabitat and season on overall elasmobranch density.
Densities are back-transformed from values used in GLZ with 95% CI. White and gray
bars represent the cold and warm seasons, respectively. Bars with different letters are
significantly different at P <0.05

132
0
0.5
1
1.5
2
2.5
3
Nearshore Sand Patchy
De
ns
ity
(a
nim
als
ha
-1)
a
a,b
b
Fig. 6 The influence of microhabitat on giant shovelnose ray (Glaucostegus typus)
density. Densities are back-transformed from values used in GLZ with 95% CI. Bars
with different letters are significantly different at P <0.05

133
0
0.2
0.4
0.6
0.8
1
1.2
Cold Warm
De
ns
ity
(a
nim
als
ha
-1)
a
b
Fig. 7 The influence of season on reticulate/pink whipray (Himantura uarnak/H. fai)
density. Densities are back-transformed from values used in GLZ with 95% CI. Bars
with different letters are significantly different at P <0.05

134
-8
-6
-4
-2
0
2
4
6
8
10
0
20
0
30
0
40
0
50
0
60
0
70
0
80
0
90
0
100
0
110
0
120
0
130
0
140
0
150
0
>15
00
Distance from Shore (m)
(Ob
se
rve
d -
Ex
pe
cte
d)2 /
Ex
pe
cte
d
Aetobatus narinari Carcharhinus cautusHimantura fai Himantura astra/H. toshiHimantura uarnak Pastinachus atrusGlaucostegus typus
Fig. 8 Variation in relative abundances of elasmobranchs with increasing distance from
shore. Lines represent individual species’ deviations from a homogeneous distribution
across all species. Positive values indicate higher abundances of animals than expected,
while negative values indicate fewer animals than expected

135
LITERATURE CITED
Baum JK, Myers RA, Kehler DG, Worm B, Harley SJ, Doherty PA (2003) Collapse and conservation of shark populations in the Northwest Atlantic. Science 299: 389-392
Berger KM, Conner MM (2008) Recolonizing wolves and mesopredator suppression of
coyotes: impacts on pronghorn population dynamics. Ecol Appl 18: 599-612 Blaber SJM, Brewer DT, Harris AN (1994) Distribution, Biomass and Community
Structure of Demersal Fishes of the Gulf of Carpentaria, Australia. Aust J Mar Freshw Res 45: 375-396
Black R, Robertson AI, Peterson CH, Peterson NM (1990) Fishes and benthos of near-
shore seagrass and sandflat habitats at Monkey Mia Shark Bay, Western Australia. In: Berry PF, Bradsaw SD, Wilson BR (eds) Research in Shark Bay: Report of the France-Australe Bicentenary Expedition Committee. Western Australia Museum, pp 245-261
Carrier JC, Pratt HL, Castro JI (2004) Reproductive biology of elasmobranchs. In:
Carrier JC, Musick JA, Heithaus MR (eds) Biology of sharks and their relatives. CRC Press, New York, pp 487–521
Cartamil DP, Vaudo JJ, Lowe CG, Wetherbee BM, Holland KN (2003) Diel movement
patterns of the Hawaiian stingray, Dasyatis lata: Implications for ecological interactions between sympatric elasmobranch species. Mar Biol 142: 841-847
Casey JG, Kohler NE (1992) Tagging studies on the shortfin mako shark (Isurus
oxyrinchus) in theWestern North Atlantic. Aust J Mar Freshw Res 43: 45–60 Compagno LJV, Last PR, Stevens JD, Alava MNR (2005) Checklist of Philippine
chondrichthyes. CSIRO Marine Laboratories, Rept 243 Connor RC, Heithaus MR (1996) Great white shark approach elicits flight response in
bottlenose dolphins. Mar Mamm Sci 12: 602-606 Cope JM (2006) Exploring intraspecific life history patterns in sharks. Fish Bull 104:
311-320 Economakis AE, Lobel PS (1998) Aggregation behavior of the grey reef shark,
Carcharhinus amblyrhynchos, at Johnston Atoll, central Pacific Ocean. Environ Biol Fish 51: 129-139

136
Frisk MG, Miller TJ (2009) Maturation of little skate and winter skate in the western Atlantic from Cape Hatteras to Georges Bank. Mar Coast Fish: Dyn Manag Ecosyst Sci 1: 1-11
Heithaus MR (2001) The biology of tiger sharks, Galeocerdo cuvier, in Shark Bay,
Western Australia: Sex ratio, size distribution, diet, and seasonal changes in catch rates. Environ Biol Fish 61: 25-36
Heithaus MR (2004) Fish communities of subtropical seagrass meadows and associated
habitats in Shark Bay, Western Australia. Bull Mar Sci 75: 79-99 Heithaus MR (2004) Predator-prey interactions. In: Carrier JC, Musick JA, Heithaus MR
(eds) Biology of sharks and their relatives. CRC Press, New York, pp 487–521 Heithaus MR (2005) Habitat use and group size of pied cormorants (Phalacrocorax
varius) in a seagrass ecosystem: possible effects of food abundance and predation risk. Mar Biol 147: 27–35
Heithaus MR, Burkholder D, Hueter RE, Heithaus LI, Pratt HL, Carrier JC (2007a)
Spatial and temporal variation in shark communities of the lower Florida Keys and evidence for historical population declines. Can J Fish Aquat Sci 64: 1302-1313
Heithaus MR, Frid A, Vaudo JJ, Worm B, Wirsing A (2010). Unraveling the ecological
importance of elasmobranchs. In: Carrier JC, Musick JA, Heithaus MR (eds) Sharks and their relatives II: biodiversity, adaptive physiology, and conservation. CRC Press, New York, pp 611–637
Heithaus MR, Frid A, Wirsing AJ, Worm B (2008) Predicting ecological consequences
of marine top predator declines. Trends Ecol Evol 23: 202-210 Heithaus MR, Wirsing AJ, Frid A, Dill LM (2007b) Behavioral indicators in marine
conservation: lessons from a pristine seagrass ecosystem. Israel Journal of Ecology & Evolution 53:355–370
Hight BV, Lowe CG (2007) Elevated body temperatures of adult female leopard sharks,
Triakis semifasciata, while aggregating in shallow nearshore embayments: Evidence for behavioral thermoregulation? J Exp Mar Biol Ecol 352: 114–128
Hoisington G, IV, Lowe CG (2005) Abundance and distribution of the round stingray,
Urobatis halleri, near a heated effluent outfall. Mar Environ Res 60: 437–453 Holland KN, Wetherbee BM, Peterson JD, Lowe CG (1993) Movements and distribution
of hammerhead shark pups on their natal grounds. Copeia 1993: 495-502

137
Hutchins JB (1990) Fish survey of South Passage, Shark Bay, Western Australia. In: Berry PF, Bradsaw SD, Wilson BR (eds) Research in Shark Bay: Report of the France-Australe Bicentenary Expedition Committee. Western Australia Museum, pp 263-278
Kitchell JF, Essington TE, Boggs CH, Schindler DE, Walters CJ (2002) The role of
sharks and longline fisheries in a pelagic ecosystem of the Central Pacific. Ecosystems 5: 202-216
Last PR, Manjaji-Matsumoto BM, Pogonoski JJ (2008) Himantura astra sp. nov., a new
whipray (Myliobatoidei: Dasyatidae) from northern Australia. In: Last PR, White WT, Pogonoski JJ (eds) Descriptions of new Australian chondrichthyans. CSIRO Marine and Atmospheric Research, Hobart, pp 303-314
Last PR, Stevens JD (2009) Sharks and Rays of Australia, 2nd edn. Harvard University
Press, Cambridge Marshall AD, Kyne PM, Bennett MB (2008) Comparing the diet of two sympatric
urolophid elasmobranchs (Trygonoptera testacea Muller & Henle and Urolophus kapalensis Yearsley & Last): evidence of ontogenetic shifts and possible resource partitioning. J Fish Biol 72: 883-898
Matern SA, Cech JJ, Jr., Hopkins TE (2000) Diel movements of bat rays, Myliobatis
californica, in Tomales Bay, California: Evidence for behavioral thermoregulation? Environ Biol Fish 58: 173-182
Musick JA, Branstetter S, Colvocoresses JA (1993) Trends in shark abundance from
1974 to 1991 for the Chesapeake Bight Region of the U.S. Mid-Atlantic coast. NOAA Tech Rept NMFS 115: 1-18
Myers RA, Baum JK, Shepherd TD, Powers SP, Peterson CH (2007) Cascading effects
of the loss of apex predatory sharks from a coastal ocean. Science 315: 1846-1850 Peterson CH, Fodrie FJ, Summerson HC, Powers SP (2001) Site-specific and density-
dependent extinction of prey by schooling rays: generation of a population sink in top-quality habitat for bay scallops. Oecologia 129: 349-356
Platell ME, Potter IC, Clarke KR (1998) Resource partitioning by four species of
elasmobranchs (Batoidea: Urolophidae) in coastal waters of temperate Australia. Mar Biol 131: 719-734
Rayner MJ, Hauber ME, Imber MJ, Stamp, RK, Clout MN (2007) Spatial heterogeneity
of mesopredator reslease within an oceanic island system. Proc Natl Acad Sci 104: 20862-20865

138
Shepherd TD, Myers RA (2005) Direct and indirect fishery effects on small coastal elasmobranchs in the northern Gulf of Mexico. Ecol Lett 8: 1095–1104
Sinclair ARE, Mdumna SAR, Hopcraft, JGC, Fryxell JM, Hilborn R, Thirgood S (2007)
Long-term ecosystem dynamics in the Serengeti: lessons for conservation. Conserv Biol 21: 580-590
Smith WD, Cailliet GM, Melendez EM (2007) Maturity and growth characteristics of a
commercially exploited stingray, Dasyatis dipterura. Mar Freshw Res 58: 54-66 Smith JW, Merriner JV (1987) Age and growth, movements and distribution of the
cownose ray, Rhinoptera bonasus, in Chesapeake Bay. Estuaries 10: 153-164 Soule ME, Bolger DT, Alberts AC, Wright J, Sorice M, Hill S (1988) Reconstructed
dynamics of rapid extinctions of chaparral-requiring birds in urban habitat islands. Conserv Biol 2:75-92
Stobutzki IC, Miller MJ, Heales DS, Brewer DT (2002) Sustainability of elasmobranchs
caught as bycatch in a tropical prawn (shrimp) trawl fishery. Fish Bull 100: 800–821
Tews J, Brose U, Grimm V, Tielborger K, Wichmann MC, Schwager M, Jeltsch F (2004)
Animal species diversity driven by habitat heterogeneity/diversity: the importance of keystone structures. J Biogeogr 31: 79-92
Thrush SF, Pridmore RD, Hewitt JE, Cummings VJ (1991) Impact of ray feeding
disturbances on sandflat macrobenthos: do communities dominated by polychaetes or shellfish respond differently? Mar Ecol Prog Ser 69: 245-252
Thrush SF, Pridmore RD, Hewitt JE, Cummings VJ (1994) The importance of predators
on a sandflat: interplay between seasonal changes in prey densities and predator effects. Mar Ecol Prog Ser 107: 211-222
VanBaricom GR (1982) Experimental analyses of structural regulation in a marine sand
community exposed to oceanic swell. Ecol Monogr 52: 283-305 Vaudo JJ, Lowe CG (2006) Movement patterns of the round stingray Urobatis halleri
(Cooper) near a thermal outfall. J Fish Biol 68: 1756-1766 Wallman HL, Bennett WA (2006) Effects of parturition and feeding on thermal
preference of Atlantic stingray, Dasyatis sabina (Lesueur). Environ Biol Fish 75: 259-267

139
Wells FE, Rose RA, Lang S (1985) An analysis of benthic marine invertebrate communities in subtidal seagrass and sand habitats in Shark Bay, Western Australia. Rec West Aust Mus 12:47-56
White WT, Dharmadi (2007) Species and size compositions and reproductive biology of
rays (Chondrichthyes, Batoidea) caught in target and non-target fisheries in eastern Indonesia. J Fish Biol 70: 1809-1837
White WT, Hall NG, Potter IC (2002) Size and age compositions and reproductive
biology of the nervous shark Carcharhinus cautus in a large subtropical embayment, including an analysis of growth during pre- and postnatal life. Mar Biol 141: 1153-1164
White WT, Last PR, Stevens JD, Yearsley GK, Fahmi, Dharmadi (2006) Economically
important sharks & rays of Indonesia. ACIAR Publishing, Canberra White WT, Platell ME, Potter IC (2004) Comparisons between the diets of four abundant
species of elasmobranchs in a subtropical embayment: implications for resource partitioning. Mar Biol 144: 439-448
White WT, Potter IC (2004) Habitat partitioning among four elasmobranch species in
nearshore, shallow waters of a subtropical embayment in Western Australia. Mar Biol 145: 1023-1032
Wiley TR, Simpfendorfer CA (2007) The ecology of elasmobranchs occurring in the
Everglades National Park, Florida: implications for conservation and management. Bull Mar Sci 80: 171-189
Wirsing AJ, Heithaus MR, Dill LM (2006) Tiger shark (Galeocerdo cuvier) abundance
and growth in a subtropical embayment: evidence from 7 years of standardized fishing effort. Mar Biol 149: 961-968

140
CHAPTER IV
DIETARY NICHE OVERLAP IN A NEARSHORE ELASMOBRANCH
MESOPREDATOR COMMUNITY

141
Abstract
Understanding mesopredator trophic interactions is crucial to understanding the
dynamics of food webs because mesopredators provide the link between apex predators
and lower trophic levels. Using stable isotopic analysis and stomach content analysis, I
examined dietary niche overlap within a diverse elasmobranch mesopredator community
in Shark Bay, Western Australia. Isotopic values (δ13C and δ15N) were consistent with
most species being highly dependent on a seagrass-based food web. Differences were
observed between the mean isotopic values of species, but there was a great deal of
overlap in the isotopic niche space used by the community when examined at the level of
individuals. Stomach contents also suggest dietary overlap among the diets of Himantura
spp. and Glaucostegus typus, which contained many of the same prey species, primarily
crustaceans typically associated with seagrass habitats, although in different proportions.
Diet data also suggest that despite having similar isotopic values to other species,
Pastinachus atrus appears to feed on sandflat-associated species. In this community,
variation within the groups examined, possibly because of to individual specialization,
appears to result in high resource overlap and may be a key component allowing for high
diversity in this system and is perhaps crucial to understanding the role of mesopredators
in community trophic dynamics.
Introduction
In recent years, the loss of apex predators has received a great deal of attention
because of the potential these predators have to influence systems through top-down
control (Pace et al. 1999, Heithaus et al. 2008). In fact, many ecosystems have

142
experienced fundamental changes in structure and function because of apex predator loss
(e.g., Terborgh et al. 2001, Ripple and Beschta 2006). These changes are typically
mediated by mesopredators, predators of intermediate trophic levels, which provide a
crucial link between upper and lower trophic levels (Ritchie and Johnson 2009).
Therefore, given the role mesopredators likely play in determining structure and function
of ecosystems, an understanding of the dynamics of mesopredator interactions is crucial
to elucidating the potential effects of predation in systems.
Despite the importance of mesopredators in other ecosystems, elasmobranch
mesopredators (i.e., small sharks and batoids) have often been neglected because focus
has been placed on elasmobranch top predators (i.e., large sharks) (Heithaus et al. 2010).
Batoids, in particular, have received relatively little attention in coastal communities,
although they may influence community structure through predation and bioturbation
(VanBlaricom 1982, Thrush et al. 1994, Peterson et al. 2001). For example, cownose ray
foraging can result in widespread loss of shellfish and has been implicated as a factor in
the collapse of a commercially important scallop fishery (Peterson et al. 2001, Myers et
al. 2007). The trophic relationships of batoids may, therefore, be important in the
systems they inhabit.
Shark Bay, Western Australia supports a diverse community of elasmobranch
mesopredators, especially batoids (White and Potter 2004, Vaudo and Heithaus 2009).
Interestingly, many of the batoid species in Shark Bay have similar patterns of seasonal
abundance and microhabitat use (Vaudo & Heithaus 2009) and large numbers of batoid
foraging pits pocket the areas of high batoid use (Vaudo unpublished data). However,
previous studies of the sandflat community of Shark Bay have revealed a depauperate

143
invertebrate fauna (Wells et al. 1985, Black et al. 1990). The scarcity of potential prey in
an area of high batoid density in which batoids are clearly foraging suggests that batoids
may be partitioning available food resources. To date, there have been few studies
examining resource partitioning in batoids (but see Platell et al. 1998, Bizzarro et al.
2007, Marshall et al. 2008). Such studies are necessary to assess the potential ecological
impacts of individual species as well as batoid communities.
Traditionally, studies of dietary resource partitioning have relied on stomach
content analysis; however, such analysis is not without its limitations. Animals often
have empty stomachs and collected stomach contents represent only a snapshot of what
an animal has eaten recently. This snapshot of the diet may also be skewed as a result of
differences in the digestibility of prey; hard to digest prey may remain in the stomach for
longer periods of time (Hyslop 1980). Stable isotopic analysis (δ13C and δ15N), although
providing lower taxonomic resolution, has several benefits over stomach content analysis,
such as reflecting the assimilated material within the diet as opposed to ingested material
and representing the long-term foraging of an individual (Peterson and Fry 1987). As a
result of these advantages and the ease of tissue collection, stable isotopic analysis has
become an increasingly popular tool in studies of animal ecology. The goal of the
present study was to examine the trophic niches of the members of the Shark Bay
nearshore elasmobranch community with an emphasis on batoids and to investigate the
possibility of dietary resource partitioning using these two complementary methods.

144
Materials And Methods
Study Site and Sample Collection
Shark Bay, Western Australia (25°45´S, 113°44´E), located approximately 800
km north of Perth, is a large (ca. 13,000 km2) semi-enclosed bay on the central west coast
of Australia and contains some of the world’s most extensive seagrass shoals (Walker
1989). Adjacent to the shore are expansive shallow sandflats with fringing shallow
seagrass beds (<4 m).
Elasmobranchs are abundant in the shallow sandflat habitats and adjacent seagrass
beds of Shark Bay during the warm season (September-May), although most species are
also observed in the cold season (June-August), indicating that populations are probably
residential (Vaudo and Heithaus 2009). Fishing effort was focused on these nearshore
habitats within 12 km of the Monkey Mia Dolphin Resort. I captured elasmobranchs
between September 2005 and February 2009 using a combination of longline fishing (for
brown-banded bamboo sharks Chilosyllium punctatum and giant shovelnose rays
Glaucostegus typus) and netting techniques as detailed in Vaudo and Heithaus (2009).
All but 14 of 234 stable isotope samples (see below) and 3 of 154 gastric lavage attempts
(see below) were from the warm season. For analyses, maskrays Neotrygon spp. (N.
leylandi, N. kuhlii, and Neotrygon cf. ningalooensis) were grouped because of the limited
number of animals captured. Blackspotted whipray Himantura astra and brown whipray
H. toshi were also grouped for all analyses because they have often been confused in the
literature (Last et al. 2008). Photographs of captured individuals confirmed that both
species were present (W. White, personal communication). All individuals were
measured (total length [TL] or disc width [DW]), sexed, and a fin clip was taken from the

145
trailing edge of the pelvic fin (trailing edge of dorsal fin of nervous sharks Carcharhinus
cautus, C. punctatum, G. typus and smoothnose wedgefish Rhynchobatus laevis) for
stable isotope analysis. As part of other stable isotopic studies a variety of primary
producers (algae, including epiphytes, and seagrasses) were collected from the study site
between March 2007 and July 2008 and used to determine the carbon source for these
elasmobranchs. Primary producer samples (algae: warm season n = 29, cold season n =
29; seagrass: warm season n = 62, cold season n = 19) were collected by hand and
scraped clean of any epiphytes prior to processing. Filter feeding bivalves (i.e., mussels,
pen shells, oysters and scallops; n = 45) were collected to represent the phytoplankton
resource pool. All samples were frozen until processing.
When possible, I collected stomach contents by gastric lavage. During gastric
lavage, an individual was inverted over a collection bin and a 2-cm diameter plastic tube
was inserted into its stomach via the mouth. The free end of the plastic tubing was
connected to a 3800 l h-1 bilge pump, which was lowered over the gunwale into the water
and activated. As the stomach filled with water, the tubing was gently moved around the
stomach to facilitate flushing. When it appeared that no further contents would be
collected, the tubing was removed from the individual’s stomach. Stomach contents were
recovered from the collection bin and frozen until processing. The large size range (<1 -
~50 cm long) of items collected via gastric lavage suggests that this technique was
adequate for sampling the diets of these individuals.

146
Stable Isotope Analysis
Prior to processing, I thawed and then washed samples in distilled water. The
samples were then dried in a dehydrator for at least 48 h and then ground into a fine
powder. The ground samples were then stored in a desiccator until analysis. Samples
were analyzed for δ13C and δ15N at the Yale Earth System Center for Stable Isotopic
Studies. Homogenized trout standards analyzed at the same time as my samples had
standard deviations ranging from 0.10-0.19‰ for δ13C and 0.02-0.08‰ for δ15N. As
elasmobranch samples had low C:N ratios (2.59 ± 0.13, mean ± SD) and previous studies
have found that elasmobranch body tissue has low lipid content (Devadoss 1984, Hussey
et al. 2010), I did not correct δ13C values for the effects of lipids.
To investigate the relationship of size and the observed isotopic values of
elasmobranchs, I used linear regression. For some species, the relationship between size
and isotopic values appeared nonlinear. I split these species into size classes based on
apparent breakpoints in the plotted data and treated size classes separately for all further
analyses.
I plotted the individuals for each elasmobranch species or size class in δ13C-δ15N
space (“isotopic niche space”) and calculated the quantitative metrics suggested by
Layman et al. (2007a). The total area (TA) occupied by each species is a proxy for the
isotopic trophic diversity within that species and was calculated as the area of the convex
hull that encompasses all individuals. The mean distance to the centroid (CD) represents
the average degree of trophic diversity within the species and was calculated by
determining the distances of each individual from the bivariate mean of all individuals.
The mean nearest neighbor distance (NND) and standard deviation of nearest neighbor

147
distances (SDNND) represent the density and evenness of individual packing within the
isotopic niche space, respectively, and were calculated using the distances between each
individual and all other individuals. I also calculated the mean distance of individuals to
all other individuals (ND) and the standard deviation of all neighbor distances (SDND) as
another measure of individual packing. These additional metrics were calculated because
if individuals are aggregated in several clusters, NND and SDNND will not represent the
clustering, resulting in inaccurate estimates of evenness (Quevedo et al. 2009). I
calculated all distances and areas for these analyses using the Animal Movement Analyst
Extension (AMAE) (Hooge and Eichenlaub 2000) for ArcView GIS 3.2a.
This approach allowed for interspecific comparisons and assessment of overlap in
isotopic niche space. To assess whether I had adequately sampled the intraspecific
variability and therefore the full isotopic niche space used by a species, I used AMAE
(Hooge and Eichenlaub 2000) to conduct bootstrap analyses (n = 200) examining the
mean TA across varying sample sizes. If the curves from the resulting sample size vs.
TA graphs reach an asymptote, the number of individuals sampled is considered
sufficient for describing the isotopic niche space used. To determine if a curve reached
an asymptote, I used the method devised by Bizzarro et al. (2007). I performed a linear
regression on the final four endpoints of the curve to determine if the slope was
significantly different from zero. If the slope did not differ from zero, I concluded that
the curve had reached an asymptote.
To provide estimates of source carbon proportions for each elasmobranch species
(i.e., the food webs being used) in this system, I used MixSIR (Semmens and Moore
2008). The model MixSIR is a Bayesian-mixing model that accounts for variation in

148
isotopic fractionation and sources values (Moore and Semmens 2008). I assumed three
resource pools: seagrass, macroalgae, and phytoplankton (estimated using planktivorous
bivalves as a proxy). The number of trophic transfers between resource pools and
elasmobranchs was estimated by calculating a standardized trophic level for each species
with diet data as described by Ebert and Bizzarro (2007). For species lacking sufficient
diet data, trophic level values were estimated from published diet information or from
similar species (Darracott 1977, Stead and Bennett 2008, Schluessel et al. 2010).
Isotopic fractionation (δ13C: 0.96 ± 1.68‰; δ15N: 2.75 ± 1.64‰; Caut et al. 2009) was
scaled to the number of trophic transfers minus one. For the last trophic transfer, I used
fractionation values calculated from an elasmobranch (δ13C: 0.86 ± 0.28‰; δ15N: 2.43 ±
0.27‰; Hussey et al. 2010). One million iterations were used for each species group.
Stomach Content Processing and Analysis
Prey items were identified to the lowest possible taxonomic level, counted, and
blotted dry, and all items of a given taxon were weighed collectively. To facilitate
analyses, prey were grouped into nine prey categories (see Table 3). The shrimp-like
crustaceans could not be identified because of their small size and state of digestion, but
appear to all be the same species.
Diets were quantified for each species using three measures: frequency of
occurrence (%FO, proportion of stomachs containing prey that contain a given prey
category), numerical abundance (%N, proportion of the total number of prey items that
belong to a given prey category) and gravimetric abundance (%W, proportion of the total
weight of all prey items that belong to a given prey category). From these three measures

149
I calculated the index of relative importance (IRI, Pinkas et al. 1971) for each prey
category as IRI = %FO × (%N + %W). For interspecific comparisons, the IRI of each
prey category was divided by the sum of all IRI values (%IRI, Cortés 1997).
Dietary overlap was calculated for %N, %W, and %IRI using Schoener’s overlap
index (Schoener 1970). Values for this index range from 0 to 1, with 0 representing no
overlap and 1 representing complete overlap. Overlap values of ≥0.6 are generally
considered biologically significant (Wallace 1981); however, because this cutoff is
arbitrary, I also used null models to determine if overlap values were higher than
predicted by chance. The null models create distributions of simulated overlap values by
reshuffling the values for each species. Observed values of overlap differ from those
predicted by chance if they are in the highest or lowest 2.5% of the simulated distribution
(i.e., P < 0.05). For each null model I ran 1000 simulations in EcoSim v. 7.72 (Gotelli
and Entsminger 2009) using the RA3 algorithm for randomization (niche breadth
retained/zero states reshuffled).
I also calculated %N and %W at the individual level so I could assess dietary
differences between species using a 1-way analysis of similarity (ANOSIM). Prior to
running the ANOSIM, these data were standardized, square-root transformed and used to
construct a Bray-Curtis similarity matrix. Upon finding significant dietary differences
between species, I conducted a similarity percentages (SIMPER) analysis to identify
which prey categories contributed most to the observed differences. The analyses
ANOSIM and SIMPER were performed using PRIMER 6.

150
Results
Stable Isotope Analysis
Relationships between size and isotopic values were found for three species. For
Glaucostegus typus, the relationship was linear across the whole size range sampled for
both δ13C (negative relationship) and δ15N (positive relationship) (regression, t = -2.99, p
= 0.005 and t = 3.81, p = 0.001, respectively). As a result, I divided G. typus into two
size classes based on the mean size of sampled individuals: ≤150 cm TL and >150 cm
TL. With the exception of three points, δ13C and δ15N values for pink whiprays
Himantura fai appeared to stabilize once individuals reached a size larger than 65 cm
DW. When the three aforementioned points were excluded, there was no relationship
between δ13C and δ15N values and size for individuals >65 cm DW (regression, t = 0.35,
p = 0.732 and t = -1.30, p = 0.204, respectively), so H. fai was split into two sizes classes:
≤65 cm DW and >65 cm DW. For cowtail rays Pastinachus atrus, there appeared to be a
natural break in the data at a size of 60 cm DW for both δ13C and δ15N. For individuals
greater than 60 cm DW there was no relationship between size and δ15N (regression, t =
1.25, p = 0.228), although there was a negative relationship with δ13C (regression, t = -
3.57, p = 0.002). Despite the relationship with size and δ13C, I split P. atrus into two
groups using 60 cm DW as the dividing point.
Species differed with regard to their average location in isotopic niche space
(MANOVA, F = 31.28, p < 0.001). The observed differences were a result of differences
in both δ13C and δ15N (ANOVA, F = 32.51, p < 0.001 and F = 24.46, p < 0.001,
respectively; Fig. 1, Table 1). Glaucostegus typus ≤150 cm TL (δ13C = -6.54 ± 0.99‰,
mean ± SD) was the most enriched in 13C, while Chiloscyllium punctatum (δ13C = -11.84

151
± 1.13‰) was the least enriched. Rhynchobatus laevis (δ15N = 8.90 ± 0.76‰) had the
highest δ15N value and Neotrygon spp. (δ15N = 5.93 ± 1.04‰) had the lowest value.
The curves generated to examine the effect of sample size on TA reached an
asymptote for the reticulate whipray Himantura uarnak and both size classes of
Pastinachus atrus and Glaucostegus typus, indicating that most of the individual
variation within isotopic signatures was captured (Fig. 2). An asymptote was also
reached for H. fai >65 cm DW with and without the three anomalous values. Therefore,
for these species, sample sizes were likely adequate to estimate δ13C range, δ15N range,
and TA for the size range examined. For the remaining species examined, δ13C range,
δ15N range, and TA are likely to be underestimated. Anomalous values, however, may
have affected the bootstrap results for the Indo-Pacific spotted eagle ray Aetobatus
ocellatus (formerly A. narinari) and Chiloscyllium punctatum. Despite a visual
inspection that would not indicate values reaching an asymptote for A. ocellatus,
variability within the four endpoints resulted in a slope not different than zero
(regression, t = 2.12, p = 0.168). Reanalysis after removal of an individual with an
unusually high δ15N value resulted in the endpoints having a slope that differed from zero
(regression, t = 7.77, p = 0.016), indicating that an asymptote had not been reached (Fig.
2). For C. punctatum, the slope of the best-fit line through the four endpoints differed
from zero (regression, t = 8.64, p = 0.013); when an individual with an unusually high
δ13C value was removed from the bootstrap analysis, the slope no longer differed from
zero. Most of the variability within C. punctatum may, therefore, have been sampled.
For the species groups with adequate sample sizes to estimate examined TA,
values ranged from 2.41 units2 (Glaucostegus typus ≤150 cm DW) to 7.67 units2

152
(Pastinachus atrus <60 cm DW) (Table 1). Despite a sample size not large enough to
adequately describe TA, Aetobatus ocellatus had the largest TA (19.96 units2) even when
the anomalous values were excluded (12.83 units2). The percentage of nonoverlapping
space (portion of isotopic niche space based on TA that is not shared with another species
group) occupied by each species group ranged from 0% (Carcharhinus cautus, P. atrus
>60 cm DW, G. typus >150 cm TL and the Himantura astra/H. toshi group) to 43.10%
(Chiloscyllium punctatum) (Table 1, Fig. 3) with the percentage of individuals of a
species occupying the nonoverlapping space ranging from 0% (C. cautus, P. atrus >60
cm DW, G. typus >150 cm TL and the H. astra/H. toshi group) to 47.62% (C. punctatum)
(Table 1, Fig 3).
Of the adequately sampled groups, δ13C ranges varied from 3.29‰ (Pastinachus
atrus >60 cm DW) to 5.82‰ if all Chiloscyllium punctatum values were included or
5.6‰ (Himantura uarnak) if the anomalous C. punctatum was excluded (Table 1).
Aetobatus ocellatus had the largest δ13C range (7.14‰) despite the fact that it may be
underestimated. Aetobatus ocellatus also had the largest range in δ15N (4.69‰), although
this is the result of an individual with an unusually large δ15N value. For groups with
adequate sample sizes, the smallest δ15N range belonged to Glaucostegus typus ≤150 cm
TL (1.27‰; Table 1) and P. atrus <60 cm DW had the largest range. With the exception
of A. ocellatus, all groups had similar CD values (ANOVA, F = 3.00, p = 0.001; Fig. 4).
I found a greater number of interspecies differences in NND (ANOVA, F = 6.64, p <
0.001; Fig. 4) and ND (ANOVA, F = 18.92, p = 0.001; Fig. 4). SDNND ranged from
0.14 units (H. fai >65 cm DW) to 0.68 units (A. ocellatus; Table 1) and SDND ranged
from 0.68 units (P. atrus >60 cm DW) to 1.52 units (A. ocellatus; Table 1).

153
On the basis of published estimates of isotopic fractionation, calculated
elasmobranch trophic levels and the assumption that elasmobranchs are limited to
phytoplankton, algal and seagrass resource pools in Shark Bay, most of the
elasmobranchs examined are highly dependent on the seagrass-based food web. The
median contribution of the seagrass resource pool to elasmobranchs ranged from 35%
(Chilosyllium punctatum) to 85% (Glaucostegus typus ≤150 cm TL) and for ten of the 13
groups, seagrass contribution exceeded 50% (Table 2). In the three species divided into
size classes, the contribution from the seagrass food web increased with size for
Pastinachus atrus and Himantura fai, while it decreased for G. typus.
Stomach content analysis
I recovered stomach contents from 114 animals (17 Glaucostegus typus ≤150 cm
TL, 34 G. typus >150 cm TL, 10 Himantura fai ≤65 cm DW, 27 H. fai >65 cm DW, 14
H. uarnak, 6 Pastinachus atrus, and 6 H. astra/H. toshi). The proportion of lavaged
individuals from which I collected stomach contents was similar across species (63% G.
typus ≤150 cm TL, 72% G. typus >150 cm TL, 100% H. fai ≤65 cm DW, 75% H. fai >65
cm DW, 69% H. uarnak, 60% P. atrus, and 75% H. astra/H. toshi).
Because of small sample sizes for Himantura astra/H. toshi and Pastinachus
atrus, quantitative analyses were only performed for H. fai ≤65 cm DW, H. fai >65 cm
DW, H. uarnak, Glaucostegus typus ≤150 cm TL and G. typus >150 cm TL. For these
species groups, crustaceans dominated the diet in all four metrics. In particular, penaeid
shrimp appear to be quite important; they were found in >60% of samples from each
species group (Table 3). In addition, for H. uarnak, H. fai (both sizes classes) and G.

154
typus ≤150 cm TL, penaeids made large contributions to %N, %W, and %IRI (Table 3).
Penaeids and brachyuran crabs made similar contributions to the diets of G. typus ≤150
cm TL, and brachyurans dominated the diet of G. typus >150 cm TL based on %IRI
(Table 3). Crabs were found in 82% of G. typus samples (both size classes) and despite
making up 10% (≤150 cm TL) and 6% (>150 cm TL) of prey items by number, they
composed 51% (≤150 cm TL) and 67% (>150 cm TL) of prey items by weight (Table 3).
Portunid crabs made up the majority of crabs consumed by all three species, but adult
blue crabs Portunus pelagicus were only found in the contents of G. typus. Additionally,
shrimp-like crustaceans (~1 cm in length) were only found in G. typus and in large
numbers, making them the most numerous prey items in the diets of G. typus (both size
classes). Prey items collected from the stomachs of H. astra/H. toshi matched those of
the other Himantura spp., while the stomach contents of P. atrus differed dramatically.
Polychaetes, including tubeworms, made up the bulk of collected P. atrus stomach
contents and holothuroideans were also collected; holothuroideans were not found in the
contents of any other species.
I found high values of dietary overlap between Himantura uarnak and both size
classes of H. fai. Overlaps between the three groups for %N and %IRI were biologically
significant (Schoener’s index >0.6; Table 4) as was the overlap in %W between both size
classes of H. fai. Overlaps in %W between both size classes of H. fai and H. uarnak
were much lower as a result of the higher mass of polychaetes found in H. uarnak. The
polychaetes found in stomachs of H. uarnak, however, all came from one individual.
Removal of this individual from the data set resulted in significant overlap in %W
between H. uarnak and both sizes classes of H. fai (H. fai ≤65 cm DW: Schoener’s index

155
= 0.89 and H. fai >65 cm DW: Schoener’s index = 0.76). Null models confirmed that
%N overlap values between H. fai size classes, overlap values between H. fai size classes
and H. uarnak for %N and overlap values for H. fai ≤65 cm DW and H. uarnak for %IRI
were higher than predicted by chance (Table 4). When the H. uarnak containing the
large mass of polychaetes was removed, the overlap value for %W between H. uarnak
and H. fai ≤65 cm DW was higher than predicted by chance (p < 0.001), but the overlap
in %W for H. uarnak and H. fai >65 cm DW was not (p = 0.118). Neither Himantura
spp. showed high overlap with either size class of Glaucostegus typus for any metric
(Table 4), nor were values higher than predicted by chance (Table 4). High values of
overlap for all indices were found between the two size classes of G. typus and were
supported by null models (Table 4).
Using ANOSIM, I found differences in the dietary compositions by numerical
abundance between Himantura fai >65 cm DW and both Glaucostegus typus size classes
(G. typus ≤150 cm TL: R = 0.479, P < 0.001 and G. typus >150 cm TL: R = 0.209, p <
0.001). The SIMPER analysis revealed that differences in the abundance of penaeid
shrimp (27.9% of dissimilarity), shrimp-like crustaceans (25.0% of dissimilarity) and
brachyuran crabs (21.5% of dissimilarity) contributed the most to the observed difference
between H. fai >65 cm DW and G. typus ≤150 cm TL. Penaeids and brachyurans (34.0%
and 25.8% of dissimilarity, respectively) contributed the most to differences between H.
fai >65 cm DW and G. typus >150 cm TL. H. fai ≤65 cm DW and H. uarnak also
differed from G. typus ≤150 cm TL (R = 0.324, p = 0.004 and R = 0.310, p = 0.002,
respectively). Glaucostegus typus ≤150cm TL differences from H. fai ≤65cm DW and H.
uarnak were primarily the result of differences in abundances of penaeids (31.9% and

156
27.8% of dissimilarity, respectively), shrimp-like crustaceans (27.1% and 26.3% of
dissimilarity, respectively) and brachyurans (26.1% and 22.7% of dissimilarity,
respectively). Analysis by weight revealed that differences existed between all
Himantura groups and both G. typus size classes (ANOSIM, R = 0.185 – 0.408, p =
0.001 – 0.032). Brachyuran crabs and penaeid shrimp contributed the most to the
observed differences making up 30.1 – 41.5% of the observed dissimilarities.
Discussion
Despite the diversity and abundance of the nearshore elasmobranch community of
Shark Bay (Vaudo and Heithaus 2009), many of the species appear to occupy similar
trophic positions based on their diets. In fact, most species occupied very little unique
isotopic niche space (TA), although mean isotopic values did differ between species. In
addition, mixing models suggest that most of the elasmobranch community is highly
dependent on a seagrass carbon source. Prey, however, may not necessarily come from
the seagrass beds. Many invertebrates from the sandflats, including shrimp, have δ13C
values similar to those of seagrass (Heithaus, unpublished data), indicating that seagrass
may provide an important carbon source for the sandflats via detrital pathways.
However, despite the number of elasmobranch, especially batoid, sightings and batoid
feeding pits on the nearshore sandflats during the warm season (September – May;
Vaudo and Heithaus 2009), seagrass beds may provide the primary foraging grounds for
this elasmobranch community on the basis of the depauperate sandflat prey base of Shark
Bay (Wells et al. 1985, Black et al. 1990) and stomach content analysis (see below). The
fact that the seagrass beds in Shark Bay may be supporting a diverse and abundant batoid

157
community further emphasizes the importance of seagrass bed production in marine
systems (Heck et al. 2008) and in this system extends it to a group of species that are not
typically associated with seagrass.
However, despite the overall similarity in mean isotopic niche position and high
degree of overlap in observed δ15N and δ13C values, subtle differences were observed
between species. Not surprisingly, the Neotrygon spp. and Aetobatus ocellatus on
average had lower δ15N, often indicative of feeding at a lower trophic level. The
Neotrygon spp. are much smaller than the other batoids in the system (maximum size =
~30 cm DW) and as such are limited to smaller prey (Darracott 1977), which are
generally low level consumers. Aetobatus ocellatus, on the other hand, tends to be one of
the larger batoids observed in the nearshore flats growing to over 3m DW (usually less
than 2 m DW within my study site), but tends to feed on low order consumers such as
gastropods and bivalves (Schluessel et al. 2010). Feeding on such low-level consumers
should result in the lower δ15N values observed. The high contribution of the seagrass
resource pool in A. ocellatus could mean that individuals in Shark Bay are not as
dependent on bivalve prey as previously thought or that the bivalves eaten are
detritivores. Several detritivorous bivalves are found in the shallow waters of Shark Bay.
Further diet studies on A. ocellatus in Shark Bay are required to investigate these
possibilities.
Albeit based on only four individuals, Rhynchobatus laevis had the highest δ15N
values and the lowest δ13C values of the batoids examined. Mixing models suggest that
these values may be the result of R. laevis being less dependent on the seagrass food web
than other batoids in the system. Rhynchobatus laevis is also a large mobile species (up

158
to 3 m TL) with a body that more closely resembles pelagic sharks than it does most
batoids, and as a result its size and motility open up the possibility of it feeding on larger
more mobile prey, which may have higher δ15N values than smaller benthic prey species;
teleost prey have frequently been found in the diet of congeners (Darracott 1977). In
addition, it is the only species examined that I have not observed in the study area during
the cold season (June – August; Vaudo and Heithaus 2009), so its isotopic signature is
reflective of prey not only from the study site, but also from areas where it spends the rest
of the year, which may exhibit different baseline carbon and nitrogen values.
The two shark species from the shallow flats tended to have higher δ15N values
and lower enrichment of 13C, although their values were not distinct from many of the
batoid species. The trend toward higher δ15N values for Carcharhinus cautus and
Chiloscyllium punctatum is likely the result of the higher proportion of fish in their diets.
Teleosts make up ~70% of the diet of C. cautus by number and volume in Shark Bay
(White et al. 2004) and ~30% of the IRI of C. punctatum in other locations (Stead and
Bennett 2008), although the mixing models also suggest that these species are less reliant
than the batoids examined on the seagrass food web, which had a lower δ15N baseline.
Interestingly, isotopic values from the most common elasmobranchs
(Glaucostegus typus, Himantura spp., and Pastinachus atrus) on the nearshore flats of
Shark Bay were similar, although there were differences between species groups with
regard to mean δ15N and δ13C values. H. fai ≤65 cm DW and P. atrus >60 cm DW had
the highest and lowest δ15N values of these groups, respectively and differed by 2.4‰.
The δ15N range of the rest of these elasmobranchs was only 1.1‰, emphasizing their

159
similarity. The δ13C range of these common elasmobranchs was 2.7‰, with G. typus
<150 cm TL the most enriched in 13C and P. atrus < 60cm DW the least enriched.
Despite the abovementioned similarities, I did find isotopic differences between
size classes for two of the three species divided by size. Pastinachus atrus size classes
differed in both δ15N and δ13C values, while Himantura fai size classes only differed in
δ15N values. For both species, the smaller size classes were more enriched in 15N and
mixing models suggested an increased reliance on seagrass carbon with increased size,
implying an ontogenetic shift in foraging behavior. Like many fish species, such shifts
have been observed in batoids using stomach content analysis (e.g., Bizzarro et al. 2007,
Marshall et al. 2008).
The high overlap in isotopic niche space and dependence on seagrass-derived
carbon observed for the most common species derived from stable isotope analysis were
supported by traditional stomach content analysis. With the exception of Pastinachus
atrus stomach contents, the breadth of species found in the stomach contents of
Glaucostegus typus and the Himantura spp. (all size classes) was similar and these prey
species are not typically found the sandflats of Shark Bay (Wells et al. 1985, Black et al.
1990, Vaudo unpublished data). Some of the species, such as juvenile penaeid shrimp,
which made up large proportions of the diets of G. typus, H. fai, and H. uarnak, are well
established seagrass-associated species (Coles et al. 1987, Kenyon et al. 1997) and
previous work in Shark Bay has shown that crustaceans are common in seagrass habitats
and rare on the sandflats (Wells et al. 1985). Even though diet breadth was similar for G.
typus and the Himantura spp., there was some evidence of resource partitioning. Diet
overlap was low between G. typus and both Himantura spp. for all size classes due to the

160
differences in the proportions of prey categories consumed, although overlap was higher
than expected by chance for G. typus ≤150 cm TL and both H. fai ≤ 65cm DW and H.
uarnak. Both size classes of G. typus consumed a larger proportion of crabs and because
of its larger size, G. typus >150 cm TL was able to make use of a resource not available
to the Himantura spp.: adult blue crabs Portunis pelagicus. Similar partitioning of food
resources has been noted in several sympatric elasmobranchs, including batoids (Platell et
al. 1998, White et al. 2004, Marshall et al. 2008).
Within a species, dietary overlap was high and greater than predicted by chance.
Despite the high overlap and indistinguishable δ15N and δ13C values between size classes,
Glaucostegus typus may experience an ontogenetic shift in diet; crabs were almost twice
as important in the diets of large individuals. This diet shift is consistent with a previous
study on the diet of G. typus (White et al. 2004). Despite a difference in the δ15N values
of Himantura fai, I was not able to detect evidence of an ontogenetic diet shift based on
stomach contents. This may be a result of the small number of H. fai <65 cm DW
stomachs examined or could possibly reflect habitat differences in the bay, such that prey
items (i.e., penaeid shrimp) are more dependent on the algal carbon pool in areas used by
small H. fai.
Although sample sizes were small, the presence of tubeworms and sea cucumbers
from the sandflats and absence of crustaceans in Pastinachus atrus >60 cm DW stomach
contents suggests that P. atrus >60 cm DW forages differently than other batoids in the
system, including P. atrus <60 cm DW, which differed isotopically from larger
individuals. It may also explain the large number of foraging pits found on the sandflats
during the warm season and the different jaw morphology of this species. However,

161
despite foraging on soft bodied invertebrates, P. atrus >60 cm DW had similar nitrogen
and carbon values to Himantura uarnak, which feeds predominantly on crustaceans. The
isotopic similarity of these species despite dietary differences underscores the importance
of using these methods together during studies of foraging ecology because several types
of diet can lead to similar and indistinguishable positions in isotopic niche space. In this
case, stable isotopic analysis suggests that P. atrus >60 cm DW and H. uarnak are both
dependent on seagrass-derived carbon and may occupy similar trophic levels, but cannot
differentiate between the diets of these two species or the habitats in which they feed.
Many studies have found that resource partitioning is a common feature within
marine fish communities (e.g., Beyst et al. 1999, Darnaude et al. 2001, Guedes and
Araujo 2008). For example, Platell and Potter (2001) examined a guild of 18 benthic
carnivores and found that in only one of 153 pairwise diet comparisons species did not
differ and those two species occupied different depth distributions. Dietary partitioning
is also well established in several elasmobranch species (e.g., White et al. 2004, Marshall
et al. 2008), including sympatric, congeneric batoids (Platell et al. 1998). Although
differences in diet and isotopic niche space were observed for some species and size
classes, given the abundance and diversity of batoids in Shark Bay, the similarity in
isotopic niche space and diet breadth within this guild of predators is surprising.
High values of dietary overlap within a guild of sympatric predators would
suggest that prey are not limiting. Several studies have found that dietary breadth is
inversely related to prey abundances, with predator diets skewed toward abundant prey
species and competition relaxed when prey are abundant, leading to dietary similarity
(Croxall et al. 1999, Tinker et al. 2008). Such occurrences happen seasonally in some

162
systems as prey species undergo dramatic seasonal pulses in abundance (e.g., Lucena et
al. 2000). Although present in Shark Bay year round, batoids are only abundant on the
nearshore flats and therefore catchable during the warm season (September-May; Vaudo
and Heithaus 2009), so I was unable to examine if the diets of batoids in Shark Bay only
converge seasonally.
Alternatively, if batoid populations are below that which could be supported by
prey resources, prey may effectively be an unlimited resource throughout the year. Shark
Bay is a relatively pristine system and is home to large populations of batoid predators
(tiger and hammerhead sharks). Risk and direct predation effects from predators can
maintain prey populations below the carrying capacity set by their prey (Creel et al. 2007,
Heithaus et al. 2008), and if this is the case in Shark Bay, batoid populations may be
released from prey limitation, allowing for dietary convergence at the population level
and maintaining high levels of batoid diversity.
Similarities at the group level, however, may mask underlying individual
variation within each group. Although often ignored, individual variation appears to be a
common feature in many systems (Bolnick et al. 2003) and isotopic values suggest that
varying levels of individual specialization are found within the batoid populations of
Shark Bay. Although inherent variability of isotope values (i.e., variability associated
with physiological differences in diet-tissue fraction between individuals rather than
dietary differences) has not been explicitly examined in elasmobranchs, the observed
variation in δ15N and δ13C for Shark Bay elasmobranchs exceeds the variation observed
in fish species such as the European sea bass Dicentrarchus labrax under controlled
conditions (e.g., Sweeting et al. 2007, Barnes et al. 2008); this suggests that the variation

163
in elasmobranch isotope values is due to dietary differences between individuals. The fin
tissue used for isotopic analysis should turn over at a slower rate compared to more
metabolically active tissues such as blood or muscle, which turn over slowly in
elasmobranchs (0.0083 and 0.0041 d-1, respectively; MacNeil et al. 2006) and therefore
represent a long-term average of assimilated materials. As a result, differences in
isotopic values should represent long-term consistent dietary differences, further
suggesting individual specialization within these populations. Bootstrap techniques
suggest that even more variation, and thus greater individual specialization, exists within
this community for many species.
The amount of trophic diversity (CD), density (NND and ND) and evenness
(SDNND and SDND) in trophic space, all measures that provide insight into individual
specialization, were similar across groups, with some exceptions. Groups with low
sample sizes and those that were not adequately sampled according to bootstrap analysis,
including Aetobatus ocellatus and multispecies groups, tended to show the most
individual specialization in isotopic values (higher values of CD, NND, ND, SDNND and
SDND). This may be a result of sample size (i.e., not enough sampling to fill in the gaps)
or the fact that groups contained multiple species, or in the case of A. ocellatus, may
reflect increased plasticity associated with jaw morphology. Aetobatus ocellatus is the
only species examined that has plate-like teeth capable of crushing bivalve and gastropod
shells, allowing for a more variable diet.
While individual specialization is generally thought to reduce competition, the
individual variability observed in isotopic values results in high degrees of overlap
between species and limited areas of unique isotopic niche space, despite differences

164
between species means. This suggests that analyses focusing on central tendency may be
misleading and miss important population aspects such as individual variation and a large
degree of overlap in species isotopic niche spaces. I advocate the use of stable isotope
metrics, such as those presented by Layman et al. (2007a), at the population or
subpopulation level because they can elucidate often ignored intrapopulation variability
(Layman et al. 2007a) and would facilitate comparisons within systems that could
provide new insights into food web dynamics and the implications of declines in top
predators or other anthropogenic changes to communities (e.g., Layman et al 2007b).
The high degree of variability also underscores a need to be mindful of sample size.
Sample size has been shown to be an important concern in isotopic studies of ontogenetic
shifts in trophic position (Galván et al. 2010) and, as seen in this study, isotopic metrics
such as δ13C range, δ15N range, and TA may also be sensitive to sample size. Some of the
species groups examined were not adequately sampled to capture the full extent of the
group’s variability. This is particularly important for large predators, for which
conclusions are often made from small sample sizes due to logistical concerns.
Overall, I found that despite its diversity, the elasmobranch community of the
nearshore sandflats of Shark Bay occupies a relatively small area of isotopic niche space
within the Shark Bay food web and is heavily dependent on seagrass-derived carbon.
Within this isotopic niche space, I found that isotopic differences and dietary differences
exist between species, although the batoid species examined consumed the same prey.
Isotope values and diet data also suggest that individual specialization, although rarely
considered in elasmobranchs (Heithaus et al. 2010, but see Matich et al. 2010), may play

165
an important role in the foraging ecology of elasmobranchs and may be crucial to
understanding the ecological role of these predators.
Acknowledgments
I thank everyone who helped with the collection and processing of isotopic
samples, especially D. Heithaus, K. Gastrich, M. Dunphy-Daly, and D. Burkholder. I
also thank the Department of Environment and Conservation, Shark Bay District, R.
McAuley of the Department of Fisheries, Western Australia, and the Monkey Mia
Dolphin Resort for logistical support, and C. Layman for comments on a previous draft of
the manuscript. This research was possible due to a Florida International University
Presidential Fellowship to J. Vaudo, a grant from the National Geographic Expeditions
Council to J. Vaudo, National Science Foundation grants OCE0526065 and OCE0745606
to M. Heithaus, and Florida International University’s College of Arts and Sciences.

166
Table 1 Summary of isotopic metrics and body size range for elasmobranchs caught in the nearshore waters of Shark Bay,
Western Australia. Size ranges for Glaucostegus typus, Rhynchobatus laevis, Carcharhinus cautus, and Chiloscyllium punctatum
are total lengths (TL). Size ranges for all other species are disc widths (DW). Mean values with different letters are significantly
different at p < 0.05. SDNND: standard deviation of nearest neighbor distances; SDND: standard deviation of neighbor distances;
TA: total area
Species n
Size
range
(cm)
Mean δ15N (±
SD) (‰)
δ15N
range
(‰)
Mean δ13C (± SD)
(‰)
δ13C
range
(‰)
SDNND SDND TA % of TA
unique
% of
individuals in
unique space
(# of
individuals)
Aetobatus
ocellatusa 16
64 –
155 6.45 ± 1.07 g, h 4.69 -9.38 ± 1.99 b, c 7.14 0.68 1.52 19.96 25.88 12.50 (2)
Glaucostegus
typus ≤150 cm 17
62 –
148 7.27 ± 0.34 e, f, g 1.26 -6.54 ± 0.99 f 3.48 0.28 0.82 2.41 20.04 35.29 (6)
Glaucostegus
typus >150 cm 21
151 –
232 7.58 ± 0.34 d, e 1.40 -7.71 ± 1.07 d, e, f 3.55 0.16 0.84 2.58 0.00 0.00 (0)
Himantura
astra / H.
toshia
10 44 –
76 7.51 ± 0.92 c, d, e, f 2.48 -8.88 ± 1.41 c, d, e 4.55 0.44 1.29 2.48 0.00 0.00 (0)
Himantura fai
≤65 cma 8
62 –
65 8.81 ± 0.86 a, b 2.95 -9.12 ± 1.26 b, c, d 3.81 0.49 1.02 3.41 9.45 12.50 (1)

167
Table 1 continued
Species n
Size
range
(cm)
Mean δ15N (±
SD) (‰)
δ15N
range
(‰)
Mean δ13C (± SD)
(‰)
δ13C
range
(‰)
SDNND SDND TA % of TA
unique
% of
individuals in
unique space
(# of
individuals)
Himantura fai
>65 cm 39
66 –
100 7.51 ± 0.83 e 3.66 -7.57 ± 1.18 d, e, f 4.70 0.14 1.39 6.10 7.60 12.82 (5)
Himantura
uarnak 37
34 –
113 6.81 ± 0.54 f, h 2.17 -6.93 ± 1.23 f 5.60 0.26 1.05 7.48 13.34 21.62 (8)
Neotrygon
spp.a 9
19 –
30 5.93 ± 1.04 h 2.70 -9.96 ± 1.58 b, c 4.27 0.57 1.17 7.50 19.23 44.44 (4)
Pastinachus
atrus <60 cm 27
38 –
58 7.94 ± 0.90 b, c, d, e 3.75 -9.28 ± 0.88 c 3.76 0.30 0.85 7.67 9.58 7.41 (2)
Pastinachus
atrus >60 cm 20
65 –
133 6.40 ± 0.48 h 1.91 -7.41 ± 0.86 e, f 3.29 0.27 0.68 3.61 0.00 0.00 (0)
Rhynchobatus
laevisa 4
200 –
224 8.90 ± 0.76 a, b, c 1.78 -11.54 ± 0.87 a, b 1.89 0.18 0.69 0.67 1.65 25.00 (1)
Carcharhinus
cautusa 5
50.5 –
91 8.72 ± 0.70 a, b, c, d 1.83 -10.10 ± 0.72 a, b, c 1.77 0.55 0.69 1.34 0.00 0.00 (0)
Chiloscyllium
punctatumb 21
52 –
82 8.79 ± 0.50 a 2.00 -11.84 ± 1.13 a 5.82 0.50 1.02 6.03 43.10 47.62 (10)
a Bootstrap sampling indicated that sample size was not adequate to fully describe TA (i.e., TA, δ13C range and δ15N range may be underestimated) b Includes an anomalous value which may have led to higher values for δ13C range, TA, and overlap with other groups

168
Table 2 Estimated trophic positions of and median (5th – 95th percentile) contributions of basal resource pools to elasmobranchs
caught in the nearshore waters of Shark Bay, Western Australia. Resource pool values used for the MixSIR model are shown
below. Filter-feeding bivalves were used as a proxy for the phytoplankton resource pool and considered one trophic level higher
than the basal level (i.e., trophic level 2)
Resource Pool
Species Estimated trophic level Phytoplankton Algae Seagrass
Aetobatus ocellatus 3.16 0.15 (0.02 – 0.27) 0.14 (0.02 – 0.32) 0.71 (0.61 – 0.80)
Glaucostegus typus (≤150 cm) 3.50 0.05 (0.00 – 0.14) 0.09 (0.01 – 0.21) 0.85 (0.75 – 0.93)
Glaucostegus typus (>150 cm) 3.51 0.08 (0.01 – 0.20) 0.17 (0.03 – 0.29) 0.74 (0.66 – 0.83)
Himantura astra / H. toshi 3.53 0.16 (0.03 – 0.31) 0.17 (0.02 – 0.37) 0.66 (0.54 – 0.78)
Himantura fai (≤65 cm) 3.52 0.14 (0.02 – 0.30) 0.27 (0.05 – 0.48) 0.59 (0.43 – 0.74)
Himantura fai (>65 cm) 3.52 0.07 (0.01 – 0.17) 0.16 (0.05-0.26) 0.77 (0.70 – 0.84)
Himantura uarnak 3.53 0.06 (0.01 – 0.14) 0.10 (0.01 – 0.19) 0.84 (0.78 – 0.91)
Neotrygon spp. 3.53 0.25 (0.07 – 0.38) 0.08 (0.01 – 0.27) 0.65 (0.55 – 0.78)
Pastinachus atrus (<60 cm) 3.53 0.20 (0.09 – 0.31) 0.19 (0.07 – 0.33) 0.63 (0.53 – 0.68)
Pastinachus atrus (>60 cm) 3.53 0.09 (0.01 – 0.19) 0.09 (0.01 – 0.21) 0.81 (0.73 – 0.90)
Rhynchobatus laevis 3.78 0.41 (0.15 – 0.62) 0.22 (0.03 – 0.52) 0.36 (0.18 – 0.54)
Carcharhinus cautus 4.10 0.31 (0.09 – 0.51) 0.18 (0.02 – 0.45) 0.49 (0.33 – 0.66)
Chiloscyllium punctatum 3.78 0.48 (0.37 – 0.58) 0.18 (0.06 – 0.29) 0.35 (0.28 – 0.42)
Resource pool values Filter-feeding bivalves Algae Seagrass
δ13C (‰) (mean ± SD) -17.49 ± 1.70 -15.47 ± 2.58 -9.41 ± 1.32
δ15N (‰) (mean ± SD) 4.39 ± 0.68 3.52 ± 0.74 0.77 ± 1.62

169
Table 3 Importance of dietary components (± SD) based on frequency of occurrence (%FO), numerical abundance (%N),
gravimetric abundance (%W), and index of relative importance (%IRI). TL: total length; DW: disc width
Glaucostegus typus ≤150 cm TL
n = 17 size range: 81 – 150 cm TL
Glaucostegus typus >150 cm TL
n = 34 size range: 156 – 232 cm TL
Himantura fai ≤65 cm DW
n = 10 size range: 62 – 65 cm DW
Prey category %FO %N %W %IRI %FO %N %W %IRI %FO %N %W %IRI
Brachyuran crab 82.4 ± 9.3
10.0 ± 2.0
51.1 ± 5.7
34.5 82.4 ± 6.5
6.4 ± 0.8
67.2 ± 2.4
61.6 30.0 ± 14.5
2.9 ± 1.6
3.1 ± 4.3
1.0
Penaeid shrimp 82.4 ± 9.3
31.6 ± 3.1
35.7 ± 5.4
38.0 64.7 ± 8.2
20.6 ± 1.4
8.1 ± 1.4
18.8 90.0 ±
9.5 96.2 ± 1.9
96.6 ± 4.6
98.9
Shrimp-like crustacean
58.8 ±
11.9
52.4 ± 3.3
2.7 ± 1.8
22.2 20.6 ± 6.9
69.2 ± 1.6
2.3 ± 0.8
15.0 0.0 0.0 0.0 0.0
Alpheid shrimp 0.0 0.0 0.0 0.0 5.9 ± 4.0
1.4 ± 0.4
3.3 ± 0.9
0.3 0.0 0.0 0.0 0.0
Amphipod 0.0 0.0 0.0 0.0 0.0 0.0 0.0 0.0 0.0 0.0 0.0 0.0
Teleost 47.1
± 12.1
6.1 ± 1.6
10.6 ± 3.5
5.8 20.6 ± 6.9
1.4 ± 0.4
18.3 ± 2.0
4.1 0.0 0.0 0.0 0.0
Polychaete 0.0 0.0 0.0 0.0 11.8 ± 5.5
0.5 ± 0.2
0.0 ± 0.1
0.1 0.0 0.0 0.0 0.0
Cephalopod 0.0 0.0 0.0 0.0 0.0 0.0 0.0 0.0 0.0 0.0 0.0 0.0
Holothuroidean 0.0 0.0 0.0 0.0 0.0 0.0 0.0 0.0 0.0 0.0 0.0 0.0
Other 0.0 0.0 0.0 0.0 14.7 ± 6.1
0.7 ± 0.3
0.7 ± 0.4
0.2 10.0 ±
9.5 1.0 ± 1.0
0.4 ± 1.5
0.1

170
Table 3 continued
Himantura fai >65cm DW
n = 27 size range: 66 – 100 cm DW
Himantura uarnak
n = 11 size range: 41 – 99 cm DW
Himantura astra / H. toshi
n = 6 size range: 54 – 80 cm DW
Prey category %FO %N %W %IRI %FO %N %W %IRI %FO
Brachyuran crab 29.6 ± 8.8
2.2 ± 0.7
2.7 ± 1.9
1.0 36.4
± 14.5
18.3 ± 3.6
20.9 ± 8.3
12.5 50.0 ± 20.4
Penaeid shrimp 88.9 ± 6.1
92.1 ± 1.3
73.0 ± 5.1
96.2 100.0 ± 0.0
59.1 ± 4.6
33.2 ± 9.7
81.4 50.0 ± 20.4
Shrimp-like crustacean
0.0 0.0 0.0 0.0 0.0 0.0 0.0 0.0 0.0
Alpheid shrimp 3.7 ± 3.6
1.1 ± 0.5
2.8 ± 1.9
0.1 0.0 0.0 0.0 0.0 16.7 ± 15.2
Amphipod 3.7 ± 3.6
0.2 ± 0.2
0.0 0.0 9.1 ± 8.7
12.2 ± 3.1
0.8 ± 1.9
1.0 0.0
Teleost 3.7 ± 3.6
1.3 ± 0.5
5.0 ± 0.0
0.2 0.0 0.0 0.0 0.0 0.0
Polychaete 0.0 0.0 0.0 0.0 9.1 ± 8.7
6.1 ± 2.2
42.6 ±
10.1 3.9 16.7 ± 15.2
Cephalopod 3.7 ± 3.6
0.4 ± 0.3
7.8 ± 3.1
0.2 0.0 0.0 0.0 0.0 16.7 ± 15.2
Holothuroidean 0.0 0.0 0.0 0.0 0.0 0.0 0.0 0.0 0.0
Other 33.3 ± 9.1
2.6 ± 0.8
8.4 ± 3.2
2.4 18.2
± 11.6
4.3 ± 1.9
2.5 ± 3.2
1.1 0.0

171
Table 3 continued
Pastinachus atrus
n = 6 size range: 73 – 95 cm DW
Prey category %FO
Brachyuran crab 0.0
Penaeid shrimp 0.0
Shrimp-like crustacean
0.0
Alpheid shrimp 0.0
Amphipod 0.0
Teleost 0.0
Polychaete 66.7 ± 19.3
Cephalopod 0.0
Holothuroidean 33.3 ± 19.3
Other 50.0 ± 20.4

172
Table 4 Pairwise comparisons of the diets for Glaucostegus typus, Himantura fai, and H. uarnak. Values for Schoener’s index of
overlap (%N / %W / %IRI) are in the lower half of the matrix. Bold values are considered biologically significant (>0.60). p-
values from null model simulations are in the upper half of the matrix. Bold values indicate that corresponding overlap values in
the lower matrix are higher than those predicted by chance. TL: total length; DW: disc width
Glaucostegus typus
≤150 cm TL
Glaucostegus typus
>150 cm TL
Himantura fai
≤65 cm DW
Himantura fai
>65 cm DW Himantura uarnak
Glaucostegus typus
≤150 cm TL <0.001 / 0.008 / <0.001 0.204 / 0.234 / 0.098 0.318 / 0.308 / 0.104 0.292 / 0.138 / 0.058
Glaucostegus typus
>150 cm TL 0.81 / 0.72 / 0.72 0.238 / 0.418 / 0.266 0.196 / 0.532 / 0.318 0.378 / 0.510 / 0.316
Himantura fai
≤65 cm DW 0.34 / 0.39 / 0.39 0.24 / 0.12 / 0.20 0.004 / 0.094 / 0.058 0.042 / 0.264 / 0.042
Himantura fai
>65 cm DW 0.35 / 0.43 / 0.39 0.26 / 0.19 / 0.20 0.95 / 0.76 / 0.97 0.030 / 0.354 / 0.076
Himantura uarnak 0.42 / 0.54 / 0.51 0.28 / 0.30 / 0.32 0.63 / 0.37 / 0.83 0.64 / 0.38 / 0.83

173
Fig. 1 δ13C – δ15N biplot of the nearshore elasmobranch community of Shark Bay (mean
± SE) in isotopic niche space. See Table 1 for statistical contrasts among species

174
Fig. 2 Size of isotopic niche space (total area: mean ± SE) from bootstraps in relation to
the number of individuals sampled for the nearshore elasmobranch community of Shark
Bay. Himantura fai ≤65 cm DW (disc width) is shown in gray to increase its visibility

175
Fig. 3 All elasmobranch individuals plotted in isotopic niche space. Black lines outline
the convex hulls of the individual species groups illustrating a high degree of overlap in
isotopic niche space

176
Fig. 4 Centroid distance (CD), nearest neighbor distance (NND), and neighbor distance (ND) (mean distance ± SE) for nearshore
elasmobranch community of Shark Bay. Values with different letters are significantly different at p < 0.05. TL: total length; DW:
disc width
0 0 0 1 1 1 2 2 3
a a a
d,e
d,e
b,c
b,c,d,e
b,c,d,e
b,c,d,e
b,c,d,e
b,c,d,e
c,d,e
c,d,e
c,d
c,d
a,b
a,b
a,b
a,b
a,b
a,b
b
b
b
b
b
b
b
e
e
a,b,c,d,e
a,b,c,d,e
a,b,c,d,e
a,b,c,d
b,c,d,e
a,c,d
b,d,e
b,e
a,c

177
LITERATURE CITED
Barnes C, Jennings S, Polunin NVC, Lancaster JE (2008) The importance of quantifying inherent variability when interpreting stable isotope field data. Oecologia 155:227-235
Beyst B, Cattrijsse A, Mees J (1999) Feeding ecology of juvenile flatfishes of the surf
zone of a sandy beach. J Fish Biol 55:1171-1186 Bizzarro JJ, Robinson HJ, Rinewalt CS, Ebert DA (2007) Comparative feeding ecology
of four sympatric skate species off central California, USA. Environ Biol Fish 80:197-220
Black R, Robertson AI, Peterson CH, Peterson NM (1990) Fish and benthos of near-
shore seagrass and sandflat habitats at Monkey Mia Shark Bay, Western Australia. In: Berry PF, Bradshaw SD, Wilson BR (eds) Research in Shark Bay: report of the France-Australe Biocentenary Expedition Committee. Western Australia Museum, Perth, p 245-261
Bolnick DI, Svanback R, Fordyce JA, Yang LH, Davis JM, Hulsey CD, Forister ML
(2003) The ecology of individuals: incidence and implications of individual specialization. Am Nat 161:1-28
Caut S, Angulo E, Courchamp F (2009) Variation in discrimination factors (Δ15N and
Δ13C): the effect of diet isotope values and applications for diet reconstruction. J Appl Ecol 46:443-453
Coles RG, Lee Long WJ, Squire BA, Squire LC, Bibby JM (1987) Distribution of
seagrasses and associated juvenile commercial penaeid prawns in north-eastern Queensland waters. Aust J Mar Freshw Res 38:103-119
Cortés E (1997) A critical review of methods of studying fish feeding based on analysis
of stomach contents: application to elasmobranch fishes. Can J Fish Aquat Sci 54:726-738
Creel S, Christianson D, Liley S, Winnie JA (2007) Predation risk affects reproductive
physiology and demography of elk. Science 315:960 Croxall JP, Reid K, Prince PA (1999) Diet, provisioning and productivity responses of
marine predators to differences in availability of Antarctic krill. Mar Ecol Prog Ser 177:115-131
Darnaude AM, Harmelin-Vivien ML, Salen-Picard C (2001) Food partitioning among
flatfish (Pisces: Pleuronectiforms) juveniles in a Mediterranean coastal shallow sandy area. J Mar Biol Assoc UK 81:119-127

178
Darracott A (1977) Availability, morphometrics, feeding and breeding activity in a multi-species, demersal fish stock of the Western Indian Ocean. J Fish Biol 10:1-16
Devadoss P (1984) Nutritive values of sharks, skates and rays from Portonovo coast.
Indian J Fish 31:156-161 Ebert DA, Bizzarro JJ (2007) Standardized diet compositions and trophic levels of skates
(Chondrichthyes: Rajiformes: Rajoidei). Environ Biol Fish 80:221-237. Galván DE, Sweeting CJ, Reid WDK (2010) Power of stable isotope techniques to detect
size-based feeding in marine fishes. Mar Ecol Prog Ser 407:271-278 Gotelli NJ, Entsminger GL (2009) EcoSim: null models software for ecology. Version 7.
Acquired Intelligence & Kesey-Bear. Jericho, Vermont. http://www.garyentsminger.com/ecosim/index.htm
Guedes APP, Araujo FG (2008) Trophic resource partitioning among five flatfish species
(Actinopterygii, Pleuronectiformes) in a tropical bay in south-eastern Brazil. J Fish Biol 72:1035-1054
Heck KL, Jr., Carruthers TJB, Duarte CM, Hughes AR, Kendrick G, Orth RJ, Williams
SW (2008) Trophic transfers from seagrass meadows subsidize diverse marine and terrestrial consumers. Ecosystems 11:1198-1210
Heithaus MR, Frid A, Vaudo JJ, Worm B, Wirsing AJ (2010) Unraveling the ecological
importance of elasmobranchs. In: Carrier JC, Musick JA, Heithaus MR (eds) Sharks and their relatives II: biodiversity, adaptive physiology, and conservation. CRC Press, Boca Raton, FL, p 607-633
Heithaus MR, Frid A, Wirsing AJ, Worm B (2008) Predicting ecological consequences
of marine top predator declines. Trends Ecol Evol 23:202–210 Hooge P, Eichenlaub W (2000) Animal movements extension to Arcview. Alaska
Biological Center, US Geological Survey, Anchorage, AK Hussey NE, Brush J, McCarthy ID, Fisk AT (2010) δ15N and δ13C diet–tissue
discrimination factors for large sharks under semi-controlled conditions. Comp Biochem Phys A 155:445-453
Hyslop EJ (1980) Stomach contents analysis – a review of methods and their application.
J Fish Biol 17:411-429 Kenyon RA, Loneragan NR, Hughes JM, Staples DJ (1997) Habitat type influences the
microhabitat preference of juvenile tiger prawns (Penaeus esculentus Haswell and Penaeus semisulcatus De Haan). Estuar Coast Shelf Sci 45:393-403

179
Last PR, Manjaji-Matsumoto BM, Pogonoski JJ (2008) Himantura astra sp. nov., a new whipray (Myliobatoidei: Dasyatidae) from northern Australia. In: Last PR, White WT, Pogonoski JJ (eds) Descriptions of new Australian chondrichthyans. CSIRO Marine and Atmospheric Research, Hobart, p 303-314
Layman CA, Arrington DA, Montana CG, Post DM (2007a) Can stable isotope ratios
provide for community-wide measures of trophic structure? Ecology 88:42-48 Layman CA, Quattrochi JO, Peyer CM, Allgeier JE (2007b) Niche width collapse in a
resilient top predator following ecosystem fragmentation. Ecol Lett 10: 937-944 Lucena FM, Vaske T, Jr., Ellis JR, O'Brien CM (2000) Seasonal variation in the diets of
bluefish, Pomatomus saltatrix (Pomatomidae) and striped weakfish, Cynoscion guatucupa (Sciaenidae) in southern Brazil: implications of food partitioning. Environ Biol Fish 57:423-434
MacNeil MA, Drouillard KG, Fisk AT (2006) Variable uptake and elimination of stable
nitrogen isotopes between tissues in fish. Can J Fish Aquat Sci 63:345-353 Marshall AD, Kyne PM, Bennett MB (2008) Comparing the diet of two sympatric
urolophid elasmobranchs (Trygonoptera testacea Muller & Henle and Urolophus kapalensis Yearsley & Last): evidence of ontogenetic shifts and possible resource partitioning. J Fish Biol 72:883-898
Matich P, Heithaus MR, Layman CA (2011) Contrasting patterns of individual
specialization and trophic coupling in two marine apex predators. J Anim Ecol 80:294-305
Moore JW, Semmens BX (2008) Incorporating uncertainty and prior information into
stable isotope mixing models. Ecol Lett 11:470-480 Myers RA, Baum JK, Shepherd TD, Powers SP, Peterson CH (2007) Cascading effects
of the loss of apex predatory sharks from a coastal ocean. Science 315:1846-1850 Pace ML, Cole JJ, Carpenter SR, Kitchell JF (1999) Trophic cascades revealed in diverse
ecosystems. Trends Ecol Evol 14:483-488 Peterson BJ, Fry B (1987) Stable isotopes in ecosystem studies. Annu Rev Ecol Syst
18:293-320 Peterson CH, Fodrie FJ, Summerson HC, Powers SP (2001) Site-specific and density-
dependent extinction of prey by schooling rays: generation of a population sink in top-quality habitat for bay scallops. Oecologia 129:349-356

180
Pinkas L, Oliphant MS, Iverson ILK (1971) Food habits of albacore, bluefin tuna and bonito in Californian waters. Calif Dept Fish Game Fish Bull 152:1-105
Platell ME, Potter IC (2001) Partitioning of food resources amongst 18 abundant benthic
carnivorous fish species in marine waters on the lower west coast of Australia. J Exp Mar Biol Ecol 261:31-54
Platell ME, Potter IC, Clarke KR (1998) Resource partitioning by four species of
elasmobranchs (Batoidea: Urolophidae) in coastal waters of temperate Australia. Mar Biol 131:719-734
Quevedo M, Svanback R, Eklov P (2009) Intrapopulation niche partitioning in a
generalist predator limits food web connectivity. Ecology 90:2263-2274 Ripple, WJ, Beschta, RL (2006) Linking a cougar decline, trophic cascade, and
catastrophic regime shift in Zion National Park. Biol Conserv 133:397-408 Ritchie EG, Johnson CN (2009) Predator interactions, mesopredator release and
biodiversity conservation. Ecol Lett 12:982-998 Schluessel V, Bennett M, Collin S (2010) Diet and reproduction in the white-spotted
eagle ray Aetobatus narinari from Queensland, Australia and the Penghu Islands, Taiwan. Mar Freshw Res 61: 1278-1289
Schoener TW (1970) Nonsynchronous spatial overlap of lizards in patchy habitats.
Ecology 51:408-418 Semmens BX, Moore JW (2008) MixSIR: A bayesian stable isotope mixing model,
Version 1.04. Available at www.ecologybox.org Stead J, Bennett M (2008) The diet and feeding ecology of sympatric orectolobiform
sharks: an example of resource partitioning. Joint Meeting of Ichthyologists and Herpetologists. Montreal, Canada 23-28 July 2008
Sweeting CJ, Barry JT, Barnes C, Polunin NVC, Jennings S (2007) Effects of body size,
age and environment on diet-tissue d15N fractionation in fishes. J Exp Mar Biol Ecol 340:1-10
Terborgh J, Lopez L, Nunez P, Rao M, Shahabuddin G, Orihuela G, Riveros M, Ascanio
R, Adler GH, Lambert TD, Balbas L (2001) Ecological meltdown in predator-free forest fragments. Science 294:1923-1926
Thrush SF, Pridmore RD, Hewitt JE, Cummings VJ (1994) The importance of predators
on a sandflat: interplay between seasonal changes in prey densities and predator effects. Mar Ecol Prog Ser 107:211-222

181
Tinker MT, Bentall G, Estes JA (2008) Food limitation leads to behavioral diversification and dietary specialization in sea otters. Proc Natl Acad Sci USA 105:560-565
VanBlaricom GR (1982) Experimental analyses of structural regulation in a marine sand
community exposed to oceanic swell. Ecol Monogr 52:283-305 Vaudo JJ, Heithaus MR (2009) Spatiotemporal variability in a sandflat elasmobranch
fauna in Shark Bay, Australia. Mar Biol 156:2579-2590 Walker DI (1989) Regional studies – seagrass in Shark Bay, the foundation of an
ecosystem. In: Larkum AWD, McComb AJ, Shepherd SA (eds) Biology of seagrasses. Elsevier, New York, p 182-210
Wallace RK Jr. (1981) An assessment of diet overlap indexes. Trans Am Fish Soc
110:72-76 Wells FE, Rose RA, Lang S (1985) An analysis of benthic marine invertebrate
communities in subtidal seagrass and sand habitats in Shark Bay, Western Australia. Rec West Aust Mus 12:47-56
White WT, Potter IC (2004) Habitat partitioning among four elasmobranch species in
nearshore, shallow waters of a subtropical embayment in Western Australia. Mar Biol 145:1023-1032
White WT, Platell ME, Potter IC (2004) Comparisons between the diets of four abundant
species of elasmobranchs in a subtropical embayment: implications for resource partitioning. Mar Biol 144:439-448

182
CHAPTER V
MICROHABITAT USE OF MARINE MESOCONSUMERS IN A THERMALLY
HETEROGENEOUS HABITAT: EXPLOITING THERMAL VARIATION OR
TRADING OFF FOOD AND PREDATION RISK?

183
Abstract
Habitat use decisions by consumers have the potential to shape ecosystems.
Understanding the factors that influence habitat use is therefore critical to understanding
ecosystem function. This understanding is especially important for mesoconsumers
because they provide the link between upper and lower tropic levels. I examined the
factors influencing microhabitat use patterns of marine mesoconsumers (juvenile giant
shovelnose rays Glaucostegus typus, reticulate whiprays Himantura uarnak, and pink
whiprays H. fai) in a coastal ecosystem with intact predator and prey populations and
marked spatial and temporal thermal heterogeneity. Using a combination of belt
transects and data on water temperature, tidal height, prey abundance, predator
abundance and ray behavior, I found that giant shovelnose rays and reticulate whiprays
were most often found resting in nearshore microhabitats, especially at low tidal heights
during the warm season. Patterns of microhabitat use did not match predictions derived
from distributions of prey. Although at a course scale, ray distributions appeared to match
predictions of behavioral thermoregulation theory, fine-scale examination revealed a
mismatch. The preference for the shallow nearshore microhabitat at low tidal heights
during periods of high predator abundance (warm season) suggests that this microhabitat
may serve as a refuge, although it may come with metabolic costs due to higher
temperatures. The results of my study highlight the importance of predators in the habitat
use decisions of mesoconsumers and that within thermal gradients other factors, such as
predation risk, must be considered in addition to behavioral thermoregulation to explain
habitat use decisions.

184
Introduction
Habitat selection is one of the myriad decisions mobile organisms must make on a
daily basis, and is critical in determining ecological dynamics at multiple scales (e.g.,
Morris 2003). Habitat use decisions are dependent on the interplay of a variety of
factors. Resource quality and abundance often vary with habitat and can influence
energy intake rates, thereby driving habitat use for consumers, which, all else being
equal, often attempt to maximize energy intake rates by selecting habitats with abundant,
high-quality resources (Stephens and Krebs 1986). Predation risk and competition, on
the other hand, may cause consumers to abandon otherwise productive habitats (e.g.,
Werner and Hall 1979; Lima and Dill 1990; Brown and Kotler 2004; Abramsky et al.
2005). Reproductive behaviors can also influence habitat choice because habitats may
vary in their benefits for spawning or the rearing of young (e.g., Andren 1990, Claramunt
et al. 2005, Schofield et al. 2009).
Physiology – and how it varies across abiotic conditions - will also play a large
role in habitat selection because physiological constraints may restrict access to some
habitats or modify relative costs and benefits of habitats such that habitat use patterns do
not match expectations derived simply on food supplies. This phenomenon may be
especially important in aquatic systems. Salinity tolerances play a large role in the
distribution and habitat use of organisms in estuarine systems (e.g., Armstrong 1997;
Barletta et al. 2005), as does the ability to tolerate hypoxic conditions (e.g., Eby and
Crowder 2002; Heithaus et al. 2009). One of the most important environmental factors
that interacts with an organism’s physiology, however, is environmental temperature

185
because it is a key determinant of physiological performance within poikilothermic
organisms (Dunham et al. 1989).
Although non-optimal temperatures can negatively impact organisms, many
poikilotherms can maintain a preferred temperature in a heterogeneous thermal
environment by altering their behaviors, such as habitat choice (e.g., Adolph 1990).
Because the optimal temperatures are likely to vary among metabolic processes,
organisms may also gain energetically by shuttling between habitats of different
temperatures (McLaren 1963; Wurtsbaugh and Neverman 1988; Sims et al. 2006). Thus,
habitat choice within a thermal gradient may be temperature- and behavior-dependent.
Understanding how various biotic and abiotic factors influence habitat use of
organisms, and their relative importance, is crucial to understanding systems because
habitat use patterns structure the spatial and temporal pattern of interspecific interactions.
Such a functional understanding of habitat selection is particularly important at this time
in order to predict the consequences of large-scale and ongoing changes in abiotic
conditions (e.g., climate change, frequency and intensity of hypoxic events; Rahmstorf et
al. 2007; Diaz and Rosenberg 2008) as well as biotic ones (e.g., overfishing and habitat
modifications; Lotze et al. 2006). Of particular interest is the dynamics of habitat use by
mesoconsumers (consumers of intermediate trophic position), which provide the link
between upper and lower trophic levels and can play a major role in ecosystem structure
and function through their habitat choice (Heithaus et al. 2008, Ritchie and Johnson
2009). For example, habitat use changes and the resulting foraging patterns of elk Cervus
elaphus since the reintroduction of wolves Canis lupus are hypothesized to be responsible
for the recovery of riparian communities, including beaver and bird populations, and

186
ecosystem function in Yellowstone National Park, USA (reviewed in Ripple and Beschta
2004) and microhabitat use changes in a grassland food web induced by elevated
temperature have been shown to transform a two predator system into an intraguild
predation system resulting in the loss of one of the predator species with indirect effects
on plant species composition (Barton and Schmitz 2009).
Marine mesoconsumers, however, have received less attention than their
terrestrial counterparts, although they may also play important roles is community
structure (Paine 1966; VanBlaricom 1982; Myers et al. 2007). And for some
mesoconsumer species, such as winter skate Leucoraja ocellata, recent local population
increases have been attributed to distributional shifts possibly in response to temperature
and changing trophic dynamics (i.e., large-scale habitat shifts; Frisk et al. 2008).
Examining the interplay of environmental factors (biotic and abiotic) on habitat use of
marine mesoconsumers is necessary to elucidate the potential impacts of these mid-
trophic level organisms, the functioning of marine ecosystems, and their management.
As a remote and minimally impacted system, Shark Bay, Western Australia,
provides an ideal setting for the examination of factors influencing the habitat use of
mesoconsumers (Heithaus et al. 2007b). Shark Bay’s sandflats include three distinct
microhabitats that are likely to differ in resource abundance, temperature, and
accessibility by an intact population of large predators. In addition, mesoconsumers
(rays) are abundant and show clear seasonal microhabitat preferences (Vaudo and
Heithaus 2009). The goal of the current study was to investigate mesoconsumer
microhabitat use in relation to environmental factors (both biotic and abiotic) to
determine the dynamics of habitat use by individual species as well as community

187
structure in this system. Specifically, I examined ray abundance relative to prey
abundance, predation risk and predictions based on behavioral thermoregulatory theory.
Materials And Methods
Study site
Shark Bay (25°45´S, 113°44´E) is a large (ca. 13,000 km2) semi-enclosed bay on
the central west coast of Australia. In addition to vast seagrass shoals, Shark Bay
contains several shallow expansive nearshore sandflats with fringing seagrass beds.
Within the sandflat habitat of the Cape Rose Flats, three microhabitats have been defined
(Fig 1). With increasing distance from shore, I have designated the microhabitats as
nearshore, sand, and patchy. Briefly, nearshore microhabitats are adjacent to the
shoreline and intertidal, sand microhabitats have depths of 1-2 m, and patchy
microhabitats are 1-3 m deep and are covered with patchy seagrass. A more detailed
description of the study site can be found in Vaudo and Heithaus (2009). Throughout the
year, juvenile rays of several species make extensive use of these sandflats, particularly
the nearshore microhabitat during Shark Bay’s warm season (September to May) when
sea surface temperatures are greater than 20°C (Vaudo and Heithaus 2009).
Ray Abundance and Behavior
To assess habitat use, I established two 1.5-km long belt transects within each
microhabitat (Fig. 1). Between March 2006 and October 2007, I conducted transect
sampling using the methods described in Vaudo and Heithaus (2009). Sampling occurred
between 800 and 1600 h when environmental conditions did not impair sighting

188
conditions. At the beginning and end of each transect I recorded the sea surface
temperature and the predicted tidal height and the means of each of these respective
values were used for analyses. All rays within 5 m (or 10 m early in the study; see Vaudo
and Heithaus 2009) of the transect line were identified and recorded. When possible, I
also recorded the behaviors of sighted rays prior to any visible disturbance by the vessel
and the number of ray feeding pits present on transect. While excavating prey from
sediments, rays leave distinctly shaped feeding pits that can be used to indicate areas of
foraging activity. These feeding pits can persist for periods of time ranging from tidal
cycles to weeks, depending on tide and weather conditions (Grant 1983; Myrick and
Flessa 1996). It is unlikely, however, that the same pits were counted on successive
passes along the transects because of 1) substantial transport of sediment within all three
habitats due to wind and currents; 2) the large variation in the number of feeding pits
from day to day along transects; and 3) the interval between resampling of transects (at
least 24 hours and usually over a week). Similarly, on the basis of movements of
acoustically tagged rays (unpublished data), it is unlikely that individual rays were
resighted on consecutive passes of a given transect. In addition to recording rays while on
transect, after October 2006 the species, positions and behaviors of all elasmobranchs
sighted on the Cape Rose Flats were recorded (i.e., those encountered while moving
between transects).
Because the transect dataset contained a large number of zeros and is therefore
highly skewed, I analyzed ray abundance using conditional models. I first modeled data
using a logistic regression for presence/absence. Ray abundance from the zero-truncated
data set was then log-transformed and analyzed with a generalized linear model to assess

189
factors influencing ray abundances when they were present on a transect. I performed
these analyses for the giant shovelnose ray Glaucostegus typus and the combined group
of reticulate Himantura uarnak and pink whiprays H. fai [it was not always possible to
distinguish between these two species, although the vast majority are reticulate whiprays
(see Vaudo and Heithaus 2009)] because they were the most common rays on the
sandflats and previous work identified them as playing a large role in elasmobranch
community structure (Vaudo and Heithaus 2009).
I analyzed behavioral data for giant shovelnose rays and whiprays using chi-
square tests of homogeneity. Homogeneity of behaviors across habitats was examined.
The limited number of observations for whiprays in the patchy microhabitat and cold
season restricted analyses of these species to nearshore and sand microhabitats in the
warm season. Larger sample sizes of giant shovelnose rays allowed for comparisons
within each behavior across seasons.
Prey Abundance
To examine the role of prey on ray habitat use, I examined the abundance of
potential prey across microhabitats. Giant shovelnose rays and whiprays in Shark Bay
have diets dominated by crustaceans and also commonly include polychaetes (Vaudo and
Heithaus in review), so I focused on these taxa. I sampled prey during July 2006 and
2007 (cold season) and September 2006 and March 2007 (warm season). I divided each
transect into five equal-area zones and then during each sampling period, selected a
random location from each zone and collected two sediment cores (0.15 m diameter x 0.2
m deep) from each location. Within the patchy microhabitat, 70% of cores were sampled

190
from sand substrate and 30% from seagrass substrate. I sieved each sample through 1-
mm mesh to collect potential prey and pooled samples from each location. Potential prey
were sorted by taxa and biomass was recorded as wet weight. Prey biomass data were
analyzed using conditional models.
Thermal Heterogeneity
To examine whether variation in water temperature was related to ray
microhabitat use, I evaluated thermal heterogeneity across the Cape Rose Flats using
three temperature loggers (HOBO Water Temp Pro v2, Onset Computer Corporation,
accuracy: 0.2°C, resolution: 0.02°C) placed across the sandflat to record bottom
temperatures (Fig. 1). Water temperatures were logged every 30 min from 23 April 2007
until the end of the study. I analyzed temperature data with a general linear model, using
season and location as factors and day as a blocking factor nested within season. Because
the temperature data span two different warm seasons, I considered each warm season
separately.
Predator Abundance
To examine whether predator abundance was related to ray microhabitat use, I
assessed tiger shark Galeocerdo cuvier catch rates throughout the study. I conducted
shark fishing using the methods described in Wirsing et al. (2006). Up to ten drumlines,
each with a single 13/0 Mustad Shark Hook baited with Australian salmon Arripis
truttaceus or local fish when Australian salmon was not available were fished at a depth
of 0.7-2.0 m. Lines were spaced 300-400 m apart and were checked approximately every

191
2 h. I calculated soak time as the time between when the hook was set and retrieved. If
bait was missing or a shark was caught, I considered bait removal to take place halfway
between the previous check and time the missing bait or shark was observed. I analyzed
tiger shark catch rates using conditional models.
Results
Ray Abundance and Behavior
Giant shovelnose ray presence across the sandflat was affected by temperature,
tidal height, microhabitat x temperature and temperature x tidal height interactions (G =
46.61, d.f. = 7, P < 0.001). Giant shovelnose ray occurrence tended to decrease with
distance from shore, and except temperatures lower than ~16°C, decreased with tidal
height (Table 1). When present, giant shovelnose ray abundance was influenced by
microhabitat, tide and habitat x temperature and habitat x temperature x tidal height
interactions (2 = 35.81, d.f. = 8, P < 0.001). Highest abundances occurred in the
nearshore microhabitat and within this microhabitat increased with temperature and
decreasing tidal height (Fig. 2a). In sand and patchy microhabitats, densities tended to
increase with decreasing tidal height and temperature (Fig. 2a).
Whipray presence was related to microhabitat, temperature, tidal height,
microhabitat x temperature and temperature x tidal height interactions (G = 41.02, d.f. =
7, P < 0.001). At temperatures below ~18°C the probability of encountering whiprays on
transects increased with tidal height and distance from shore. This pattern reversed
during warm periods (Table 2). When whiprays were present, their abundance was
influenced by temperature and microhabitat x temperature, microhabitat x tidal height,

192
temperature x tidal height and microhabitat x temperature x tidal height interactions (2 =
36.41, d.f. = 11, P < 0.001). Within the nearshore microhabitat, whipray densities
increase with increasing temperature and decreasing tidal height, while in the patchy
microhabitat densities increase with temperature and tidal height (Fig. 2b). Whipray
densities tend to increase within the sand microhabitat with increasing temperature and
decreasing tidal height, but also with increasing tidal height at low temperatures (Fig. 2b).
Visibility allowed for the quantification of feeding pits on 58 transects (18
nearshore, 22 sand and 18 patchy) during Shark Bay’s warm season. The number of
feeding pits was highest within the nearshore microhabitat and decreased with distance
from shore [nearshore: 66 (43.3, 240.5); sand: 18 (5.9, 38.0); patchy: 2 (0, 6.4); median
(95% CI)] (Kruskal-Wallis H = 23.63, d.f. = 2, P < 0.001; post hoc Mann-Whitney U-
test, all comparisons P < 0.012;).
Three behaviors (resting, swimming, and foraging) were observed for 750 giant
shovelnose rays and whiprays. Only two individuals, however, appeared to be foraging
when first encountered and were dropped from further analyses as a result of the small
sample size. Throughout the year, a large majority of giant shovelnose rays and reticulate
whiprays across all microhabitats were resting. Pink whiprays, however, were more
often observed swimming (Table 3).
For reticulate whiprays during the warm season, there was no difference in the
proportions of swimming and resting individuals across nearshore and sand microhabitats
(2 = 0.70, d.f. = 1, P = 0.40). However, during the warm season there were more resting
pink whiprays found in the nearshore microhabitat and fewer found in the sand habitat
than expected (2 = 17.15, d.f. = 1, P < 0.001). During the warm season, swimming giant

193
shovelnose rays were observed less often in nearshore microhabitats, more often in sand
microhabitats, and resting rays were observed less often in sand microhabitats than
expected based on the assumptions of homogenous behaviors across microhabitats (2 =
14.53, d.f. = 2, P = 0.001). For the cold season, however, there was no evidence of the
frequencies of resting and swimming giant shovelnose rays differing across microhabitats
(2 = 4.64, d.f. = 2, P = 0.10).
For giant shovelnose rays, the number of resting individuals exceeded
expectations based on assumptions of homogeneity of behaviors in sand and patchy
microhabitats during the cold season, while there were fewer resting individuals in the
nearshore microhabitat; this pattern was reversed in the warm season (2 = 55.21, d.f. = 2,
P < 0.001). For swimming giant shovelnose rays, there were slightly fewer than expected
individuals in cold season-nearshore microhabitats because individuals were fairly evenly
distributed during the cold season. Fewer individuals than expected were observed in the
warm season-patchy microhabitats and slightly more individuals than expected were
observed in the patchy microhabitat during the cold season (2 = 10.56, d.f. = 2, P =
0.005).
Prey Abundance
Polychaete presence was not influenced by season or microhabitat (G = 8.13, d.f.
= 5, P = 0.15). When polychaetes were present, their biomass differed with microhabitat
(F = 3.64, d.f. = 2, P = 0.03) with lower biomass found in patchy microhabitats (wet
weight: 6.52 ± 0.97/1.15 g m-2; mean ± lower standard error/upper standard error) than in
sand microhabitats (11.44 ± 1.50/1.73 g m-2) (Tukey’s test t = 2.62, P = 0.03). Although

194
biomasses estimates within nearshore microhabitats (10.06 ± 1.33/1.54 g m-2) did not
differ statistically from the other microhabitats, they were more similar to values from
sand microhabitats.
Crustacean occurrence during invertebrate surveys was influenced by season with
a higher probability of occurrence during the warm season (warm season: 57%; cold
season: 29%) (G = 15.11, d.f. = 5, P = 0.01). Crustacean biomass differed between
seasons and microhabitats (F = 6.56, d.f. = 1, P = 0.01 and F = 4.08, d.f. = 2, P = 0.02,
respectively). Biomass was higher in the cold season (cold season: 3.84 ± 1.62/2.79 g m-
2; warm season: 0.71 ± 0.22/0.31 g m-2) (Tukey’s test t = 2.56, P = 0.01) and higher in
patchy microhabitats (6.63 ± 3.12/5.88 g m-2) than in sand microhabitats (0.61 ±
0.27/0.50 g m-2) (Tukey’s test t = 2.73, P = 0.02). Nearshore microhabitat values were
intermediate (1.11 ± 0.41/0.66 g m-2), but more similar to sand microhabitat values.
Thermal Heterogeneity
Temperatures on the sandflat ranged from 12.4 °C to 29.7 °C. Because of
autocorrelation between consecutive temperature readings, further analysis of the water
temperature data was restricted to the reading taken at 12:00 each day. Temperature
differences were driven by an interaction between season and location (F = 11.39, d.f. =
4, P < 0.001). Overall, water temperatures were cooler across the sandflat during the
cold season (Tukey’s tests, all P < 0.001). During the cold season, temperatures were
highest in the interior of the sandflat. The two warm seasons had opposite patterns;
during the warm season at the beginning of the year (February – May), temperatures
tended to be coolest nearshore, while during the second warm season (September –

195
October), temperatures were highest nearshore (Fig. 3). The temperature gradients
(nearshore - offshore) across the sandflat for February – May, June – August, and
September – October ranged from -5.1 to 2.6°C, -4.3 to 4.9°C, and -4.5 to 6.2°C,
respectively.
Predator Abundance
The probability of catching at least one tiger shark per day was higher during the
warm season (91%) than during the cold season (41%) (G = 13.46, d.f. = 1, P < 0.001).
In addition, for days in which sharks were caught, catch rates of tiger sharks were higher
in the warm season (0.05 ± 0.01 sharks hour-1) than cold season (0.03 ± 0.01 sharks
hour-1; t = 2.21, d.f. = 21, P = 0.039).
Discussion
Many factors contribute to the habitat choice of organisms. Given the variety of
biotic and abiotic factors involved, it is likely that these factors will influence habitat
choice in different and perhaps even contradictory ways. Understanding how these
factors interact to affect habitat choice, however, is necessary to elucidate the role of
organisms within systems and how systems may respond to abiotic and biotic changes.
Both giant shovelnose ray and whipray presence and abundance varied with
microhabitat, water temperature, and tidal height. At moderate to higher temperatures,
typical of the warm season, frequency of occurrence of both groups decreased with
distance from shore and also decreased with increasing tidal height. The magnitude of
the decrease also increased with temperature such that in the warmest months, rays were

196
rarely found in sand and patchy microhabitats during higher tides. In addition to
increases in occurrence, both groups also increase in abundance with increases in
temperature in the nearshore microhabitat. The nearshore microhabitat, therefore,
appears to be important for these animals when temperatures are high and increases in
importance with decreasing tidal height.
Further suggesting the importance of the nearshore microhabitat to Shark Bay’s
rays is the prevalence of ray feeding pits in this microhabitat. Approximately 44% of
nearshore transects contained over 100 feeding pits (0.007 pits m-2) with a maximum of
574 feeding pits (0.04 pits m-2) on a transect pass. The nearshore microhabitat, however,
does not contain the highest prey biomass. Polychaete abundance does not differ
between nearshore and sand microhabitats, and crustaceans, which are the most important
component of the diets of giant shovelnose rays and whiprays in Shark Bay (White et al.
2004; Vaudo and Heithaus 2011), had higher biomasses during the cold season and in
patchy microhabitats. Previous studies on the invertebrate fauna of Shark Bay’s
nearshore environment also suggest that potential giant shovelnose ray and whipray prey
are more likely to be found in the seagrass beds than on the sandflat (Wells et al. 1985;
Black et al. 1990). The lack of prey in a microhabitat used by rays for foraging indicates
that some other factor besides prey abundance is driving microhabitat choice of the rays,
although the possibility that ray foraging has decreased prey abundance warrants
investigation.
In many systems, competition drives habitat use resulting in inferior competitors
foraging in less productive habitats (e.g., Werner and Hall 1979; Abramsky et al. 2005).
Crustaceans, especially penaeid shrimp, which are important to the diets of giant

197
shovelnose rays and whiprays (White et al. 2004; Vaudo and Heithaus 2011), are also
important to the diets of a wide variety of fishes (e.g., Salini et al. 1990; Brewer et al.
1995) suggesting competition for crustacean prey may occur. If rays are inferior
competitors, they may be displaced from the habitats with the highest abundance of prey,
creating the mismatch in microhabitat and prey biomass observed. However, despite
their high abundance in the nearshore microhabitat, rays were rarely observed foraging
during the day and were most often resting. Further, the prey most often encountered in
the nearshore microhabitat are rarely found in the stomach contents of giant shovelnose
rays and whiprays (Vaudo and Heithaus 2011; Vaudo unpublished data), suggesting the
nearshore microhabitat is not an important foraging habitat for these species; therefore,
selection of the nearshore microhabitat is not likely to be the result of competitive
displacement. The large number of feeding pits in the nearshore habitat may be the result
of foraging cowtail stingrays Pastinachus atrus; the polychaetes that dominate nearshore
and sand microhabitats were frequently encountered in the stomach contents of cowtail
stingrays (Vaudo and Heithaus 2011).
The nearshore microhabitat is also the shallowest of the sandflat microhabitats
and therefore experiences the greatest temperature fluctuations across the sandflat. These
temperature fluctuations may lead to the thermally heterogeneous nature of the nearshore
environment observed during this study. In addition, the sandflat is likely to differ in
temperature from the deeper areas of Shark Bay. Given that rays are poikilothermic and
that the thermoelectric properties of the gel of the ampullae of Lorenzini may allow
elasmobranchs to detect temperature differences of as little as 0.001°C (Brown 2003),

198
microhabitat choice may be a means of behavioral thermoregulation to exploit thermal
gradients.
Like in other poikilotherms, behavioral thermoregulation has been suggested to
explain the behaviors of several elasmobranch species. Because elasmobranch
development occurs more rapidly at higher temperatures (Harris 1952), it has been
suggested that aggregations of female elasmobranchs in warm waters were capitalizing
on increased embryonic development rates to decrease gestation times (Economakis and
Lobel 1998; Hight and Lowe 2007). This claim has been further bolstered by
experimental evidence that pregnant females prefer warmer temperatures (Wallman and
Bennett 2006) and proof that such aggregations are composed of pregnant females (Mull
et al. 2010). Similar behaviors have also been suggested in breeding female loggerhead
turtles Caretta caretta within a thermally heterogeneous environment (Schofield et al.
2009). The sandflat populations of giant shovelnose rays, reticulate and pink whiprays,
however, are almost entirely composed of juveniles (Vaudo and Heithaus 2009) and
cannot benefit in this manner.
Juveniles may be able to benefit by seeking out warmer waters to aid in digestion
as has been observed in a variety of teleosts (e.g., Wurtsbaugh and Neverman 1988;
Ward et al. 2010). Higher temperatures lead to increased rates of gastric evacuation in
elasmobranchs (Cortes and Gruber 1992; Bush and Holland 2002), which is associated
with the return of appetite (Sims et al. 1996). Shorter gastric evacuations times would
allow individuals to resume feeding sooner, increasing intake rates and ultimately may
lead to higher growth rates (Wurtsbaugh and Neverman 1988). While temperatures on the
sandflats are likely higher than temperatures in deeper waters during the warm season,

199
rays do not appear to seek out the warmest microhabitats on the sandflat. If the thermal
heterogeneity patterns observed in 2007 are consistent from year to year, microhabitat
choice should differ between the latter portion of the warm season preceding the cold
season and the beginning of the following warm season. No such changes are apparent in
the data. During the cold season, rays are also least often observed in the warmest
sandflat microhabitat.
Energetic gains could also be realized by shuttling between warm and cool
waters. By moving into cooler waters, rays could reduce their standard metabolic rate and
conserve valuable energetic resources. Resting and energetically expensive processes,
such as digestion, should therefore take place in cool waters. Such an energy
conservation strategy has been used to explain the movement patterns of bat rays
Myliobatis californica (Matern et al. 2000) and small-spotted catshark Scyliorhinus
canicula (Sims et al. 2006). Experimental and energetic data also support the use of this
strategy in elasmobranchs. When presented with a thermal gradient, Atlantic stingrays
Dasyatis sabina sought out cooler waters after feeding (Wallman and Bennett 2006) and
a temperature increase of 0.9°C was enough to drive small-spotted catsharks away from a
food patch between feedings (Sims et al. 2006). Further, examinations of Atlantic
stingray gut evacuation and absorption rates across a range of temperatures show that
decreases in evacuation rate (i.e., food staying in the gut longer) as a result of lower
temperatures more than offset concomitant decreases in absorption rates resulting in
higher overall absorption (Di Santo and Bennett 2011). Such a strategy might also be
necessary for some active elasmobranchs such as juvenile sandbar sharks Carcharhinus

200
plumbeus, for which routine metabolic rate may approach 100% of their metabolic scope
(Dowd et al. 2006).
Interestingly, habitat use by rays in Shark Bay does not follow this pattern. With
increasing temperatures, ray abundance increases on the sandflat and the vast majority of
giant shovelnose rays and reticulate whiprays on the sandflat are resting, despite cooler
waters being available. Even on the finer scale within the sandflats these rays fail to
conform to the proposed energy conservation strategy. Giant shovelnose rays and
whiprays were most common in the nearshore microhabitat, although it is the warmest
microhabitat for at least portions of the warm season.
Thermoregulation via behavioral mechanisms, however, is not without costs
(Huey and Slatkin 1976). And some costs, such as predation risk, may outweigh the
benefits of thermoregulation. Predation risk has been shown to alter the
thermoregulatory behaviors of reptiles (Diaz et al. 2005; Webb and Whiting 2005;
Herczeg et al. 2008) and although it is often overlooked as a potential driver of
elasmobranch habitat use, may influence microhabitat choice by giant shovelnose rays
and whiprays during portions of the year. The increase in ray abundance in the nearshore
microhabitat coincided with an observed increase in catch rates of tiger sharks during this
study, which mirrored previously observed seasonal increases of tiger and great
hammerhead sharks Sphyrna mokarran in Shark Bay (Wirsing et al. 2006; personal
observation), both of which are ray predators (Stevens and Lyle 1989; Simpfendorfer et
al. 2001). During the warm season these large sharks are abundant in Shark Bay and can
be sighted swimming over the sandflats (Vaudo and Heithaus 2009). Further suggesting
that predation risk plays a role in ray microhabitat use is the increase in ray densities

201
within the nearshore microhabitat with decreasing tidal height. The dorsoventrally
flattened rays can easily move into the very shallow nearshore waters at low tidal heights,
but tiger and great hammerhead sharks are restricted by depth, thereby creating a refuge
habitat. At higher tidal heights, however, ray predators can access nearshore
microhabitats and closely approach the shoreline, which may actually constrain escape
options for rays. Preference for shallow waters for predator avoidance has been
suggested for other elasmobranchs including juvenile lemon sharks Negaprion
brevirostris (Morrissey and Gruber 1993; Wetherbee et al. 2007) and juvenile blacktip
reef shark Carcharhinus melanopterus (Papastamatiou et al. 2009). The presence of anti-
predator grouping behaviors in Shark Bay by cowtail stingray Pastinachus atrus
(Semeniuk and Dill 2005; 2006), which are similar in size to reticulate and pink
whiprays, further suggests that use of the nearshore microhabitat may be an anti-predator
behavior.
Although such anti-predator behaviors may result in fewer individuals being
eaten, the consequences of anti-predator behaviors can lead to reductions in population
size (Nelson et al. 2004; Creel et al. 2007) and may be exacerbated by temperature
effects. By using the sandflats during the warm season, the rays may experience higher
temperatures than they would select in the absence of predators and for at least portions
of the warm season the nearshore waters are the warmest waters available. Although the
increased metabolic rate resulting from the higher temperature can result in higher growth
rates if coupled with increased energy intake (see above), rays are likely to lose foraging
opportunities by resting in the nearshore refuge. As a result, rays selecting the nearshore
microhabitat to minimize predation risk will probably realize lower growth rates because

202
of the higher metabolic costs combined with decreased foraging opportunities (Fig. 4).
Decreasing growth rates have been observed in a variety of fish species with increasing
temperatures (e.g., Hofmann and Fischer 2003; Saoud et al. 2008) and safer habitat
choices (e.g., Harter and Heck 2006). Some individuals may even experience weight loss
during the warm season, which may explain occasional sightings of gaunt rays on the
sandflats (personal observation).
Anti-predator behaviors are common in nature and, as mesoconsumers, rays are
likely to influence the behaviors of their prey as well. Therefore, the presence of tiger
and great hammerhead sharks in Shark Bay may indirectly affect lower trophic levels
through the alteration of ray microhabitat and foraging area choice. Yet, the role of tiger
sharks in the Shark Bay ecosystem is not limited to affecting rays and potentially their
prey. The presence of tiger sharks also influences the behaviors of bottlenose dolphins
Tursiops aduncus, pied cormorants Phalacrocorax varius, green turtles, dugongs Dugong
dugon, bar-bellied sea snake Hydrophis elegans and olive-headed snakes Disteria major
in Shark Bay (Heithaus and Dill 2002; Heithaus 2005; Heithaus et al. 2007a; Kerford et
al. 2008; Wirsing et al. 2008; Wirsing and Heithaus 2009; Dunphy-Daly et al. 2010).
And in the cases of green turtles and dugongs, both large seagrass grazers, have the
potential to influence the structure of seagrass beds (Heithaus et al. 2007a; Wirsing et al.
2008). The effect of large sharks on rays reinforces that in this system large sharks
appear to be keystone species and that their influence may extend beyond the seagrass
beds where they are commonly observed and into the sandflats. Further studies are
required to elucidate the potential indirect effects of tiger sharks mediated by changes in
the behavior of ray mesoconsumers.

203
The possibility that large sharks may impact structure of neighboring habitats they
do not regularly use by altering the habitat use of potential prey is of particular concern
given worldwide shark declines (Musick et al. 1993; Stobutzki et al. 2002; Baum et al.
2003) and warrants further attention. My study also highlights the potential effect of
global climate change on mesoconsumers. Climate change has the potential to alter
interaction strengths affecting trophic cascades (Barton et al. 2009). In this system, rays
may incur temperature related costs as a result of choosing safe habitats. Increasing
temperatures may reduce the benefit of nearshore waters to the point that they are no
longer a viable refuge. In addition to higher metabolic costs associated with higher
temperatures, rays would experience greater exposure to predators, both of which would
negatively affect ray populations and potentially have cascading effects. Refuge loss has
been observed in experimental work from a grassland food web that contains two
spatially segregated predatory spiders. One of the spider species shifted habitats in
response to increased temperatures and became prey of the other spider and ultimately
altered the structure of the system (Barton and Schmitz 2009).
Despite microhabitat use by giant shovelnose rays and whiprays that roughly
mimics reported cases of behavioral thermoregulation, predation risk appears to drive the
observed microhabitat choice in Shark Bay. Because of the high temperatures
experienced in the nearshore microhabitat, the benefits of predation-sensitive
microhabitat choice by rays may be diminished because of the higher metabolic costs
incurred. Because both sets of behaviors can benefit poikilothermic organisms, but
depending on the thermal environment may predict similar or different habitat choices, it
is necessary that studies of habitat use of mesoconsumers in thermally heterogeneous

204
environments consider both temperature and predation risk, especially considering
ongoing environmental change such as large predator decline and climate change.
Acknowledgments
I would like to thank everyone who helped in the field and with logistics,
especially David Heithaus, Derek Burkholder, Department of Environment and
Conservation, Shark Bay District and the Monkey Mia Dolphin Resort. This research
was possible with the support of a Presidential Fellowship and Dissertation Year
Fellowship from Florida International University to J. Vaudo, a grant from the National
Geographic Expeditions Council to J. Vaudo, National Science Foundation grants
OCE0526065 and OCE0745606 to M. Heithaus, and Florida International University’s
College of Arts and Sciences.

205
Table 1 Logistic regression of the factors influencing the presence of giant shovelnose rays Glaucostegus typus on transects.
Predicted probabilities per microhabitat for selected temperatures and tidal heights are presented as follows: nearshore/sand/patchy
Predictor Coefficient SE P Odds Ratio Lower 95%
Confidence Limit Upper 95%
Confidence Limit
Constant -13.135 6.391 0.040
Nearshore -3.851 2.512 0.125 0.02 0.00 2.92
Patchy -3.094 2.758 0.262 0.05 0.00 10.09
Temperature 0.8120 .3216 0.012 2.25 1.20 4.23
Tidal Height 9.187 4.393 0.036 9773.87 1.78 5.36*107
Nearshore * Temperature
0.2855 0.1277 0.025 1.33 1.04 1.71
Patchy * Temperature
0.1134 0.1329 0.394 1.12 0.86 1.45
Temperature * Tidal Height
-0.5874 0.2223 0.008 0.56 0.36 0.86
Predicted Probability of Occurrence
Temperature (°C)
15 20 25
1 0.463 / 0.359 / 0.122 0.917 / 0.633 / 0.430 0.993 / 0.841 / 0.803
Tidal Height (m) 1.5 0.510 / 0.403 / 0.144 0.754 / 0.324 / 0.173 0.901 / 0.253 / 0.207
2 0.557 / 0.449 / 0.169 0.461 / 0.117 / 0.055 0.367 / 0.021 / 0.016

206
Table 2 Logistic regression of the factors influencing the presence of whiprays Himantura uarnak and H. fai on transects.
Predicted probabilities per microhabitat for selected temperatures and tidal heights are presented as follows: nearshore/sand/patchy
Predictor Coefficient SE P Odds Ratio Lower 95%
Confidence Limit Upper 95%
Confidence Limit
Constant -21.717 7.441 0.004
Nearshore -10.615 3.199 0.001 0.00 0.00 0.01
Patchy 4.799 2.914 0.100 121.44 0.40 36727.18
Temperature 1.1455 0.3763 0.002 3.14 1.50 6.57
Tidal Height 15.417 5.164 0.003 4.96*106 199.38 1.23*1011
Nearshore * Temperature
0.5763 0.1589 <0.001 1.78 1.30 2.43
Patchy * Temperature -0.2425 0.1468 0.098 0.78 0.59 1.05
Temperature * Tidal Height
-0.8534 0.2649 0.001 0.43 0.25 0.72
Predicted Probability of Occurrence
Temperature (°C)
15 20 25
1 0.020 / 0.128 / 0.319 0.611 / 0.387 / 0.375 0.992 / 0.732 / 0.435
Tidal Height (m) 1.5 0.070 / 0.352 / 0.634 0.408 / 0.217 / 0.208 0.862 / 0.124 / 0.038
2 0.219 / 0.668 / 0.865 0.232 / 0.108 / 0.103 0.245 / 0.007 / 0.002
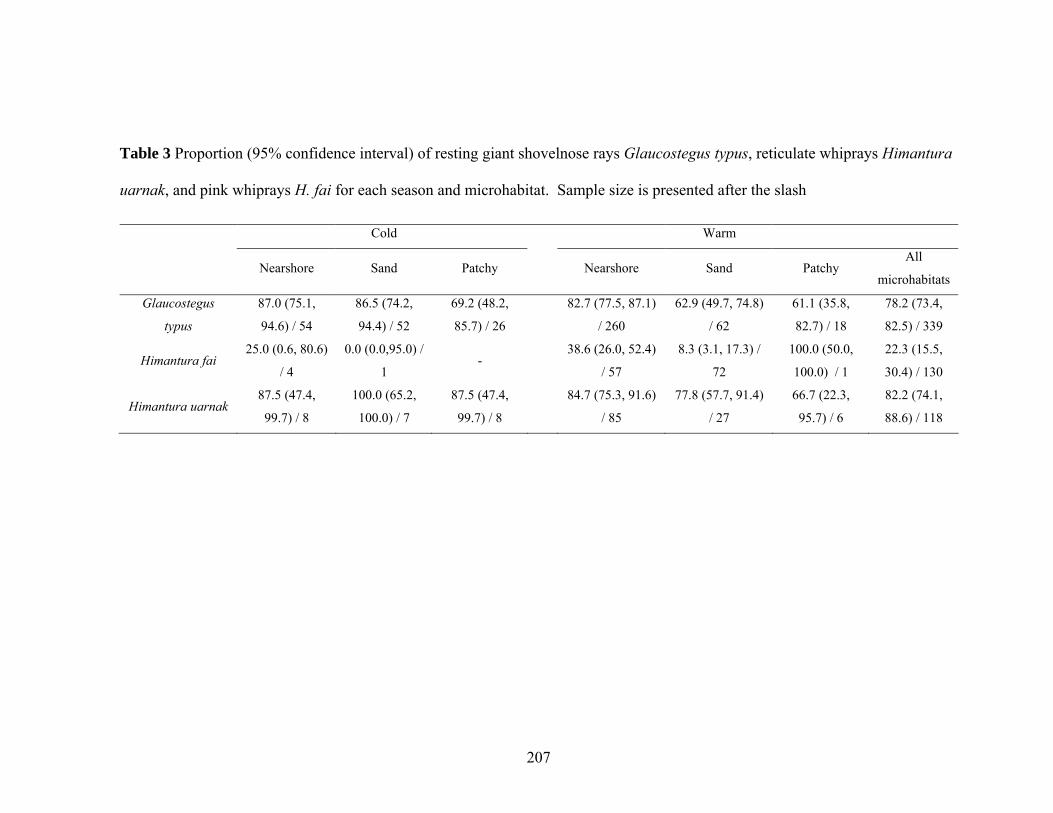
207
Table 3 Proportion (95% confidence interval) of resting giant shovelnose rays Glaucostegus typus, reticulate whiprays Himantura
uarnak, and pink whiprays H. fai for each season and microhabitat. Sample size is presented after the slash
Cold Warm
Nearshore Sand Patchy Nearshore Sand Patchy All
microhabitats
Glaucostegus
typus
87.0 (75.1,
94.6) / 54
86.5 (74.2,
94.4) / 52
69.2 (48.2,
85.7) / 26
82.7 (77.5, 87.1)
/ 260
62.9 (49.7, 74.8)
/ 62
61.1 (35.8,
82.7) / 18
78.2 (73.4,
82.5) / 339
Himantura fai 25.0 (0.6, 80.6)
/ 4
0.0 (0.0,95.0) /
1 -
38.6 (26.0, 52.4)
/ 57
8.3 (3.1, 17.3) /
72
100.0 (50.0,
100.0) / 1
22.3 (15.5,
30.4) / 130
Himantura uarnak 87.5 (47.4,
99.7) / 8
100.0 (65.2,
100.0) / 7
87.5 (47.4,
99.7) / 8
84.7 (75.3, 91.6)
/ 85
77.8 (57.7, 91.4)
/ 27
66.7 (22.3,
95.7) / 6
82.2 (74.1,
88.6) / 118

208
Fig. 1 The study site on the Cape Rose Flats, Shark Bay, Western Australia. The inset
shows the location of the Cape Rose Flats within Shark Bay. The study site was divided
into six transects representing nearshore (black), sand (gray), and patchy (white)
microhabitats. Black circles represent the location of temperature data loggers

209
Fig. 2 Contour graphs of predicted a) giant shovelnose ray Glaucostegus typus and b)
whipray Himantura spp. densities (animals ha-1) with tidal height, water temperature, and
microhabitat

210
Fig. 3 Seasonal temperatures (mean ± standard error) per microhabitat for the time period
between 23 April 2007 and 14 October 2007. Bars with different letters are significantly
different at P < 0.01

211
Fig.4 Conceptual model illustrating how use of sandflat habitats can result in decreased
growth rates for rays. When large shark abundance is high, rays shift from productive
habitats, which allow for large rations, to safe sandflat habitats with limited prey
resources, resulting in smaller rations. Sandflat habitats are also warmer, resulting in
increased metabolic costs and possibly lower assimilation efficiency
Response To Risk
Seagrass Habitat Large Ration
Sandflat Habitat Small Ration

212
LITERATURE CITED
Abramsky Z, Rosenzweig ML, Elbaz M, Ziv Y (2005) Does interspecific competition from congeners cause the scarcity of Gerbillus henleyi in productive sandy desert habitats? J Anim Ecol 74:567–578
Adolph SC (1990) Influence of behavioral thermoregulation on microhabitat use by two
Sceloporus lizards. Ecology 71:315–327 Andren H (1990) Despotic distribution, unequal reproductive success, and population
regulation in the jay Garrulus glandarius L. Ecology 71:1796–1803 Armstrong MP (1997) Seasonal and ontogenetic changes in distribution and abundance
of smooth flounder, Pleuronectes putnami, and winter flounder, Pleuronectes americanus, along estuarine depth and salinity gradients. Fish Bull 95:414–430
Barletta M, Barletta-Bergan A, Saint-Paul U, Hubold G (2005) The role of salinity in
structing the fish assemblages in a tropical estuary. J Fish Biol 66:45–72 Barton BT, Schmitz OJ (2009) Experimental warming transforms multiple predator
effects in a grassland food web. Ecol Lett 12:1317–1325 Barton BT, Beckerman AP, Schmitz OJ (2009) Climate warming strengthens indirect
interactions in an old-field food web. Ecology 90:2346–2351 Baum JK, Myers RA, Kehler DG, Worm B, Harley SJ, Doherty PA (2003) Collapse and
conservation of shark populations in the Northwest Atlantic. Science 299:389–392
Black R, Robertson AI, Peterson CH, Peterson NM (1990) Fish and benthos of near-
shore seagrass and sandflat habitats at Monkey Mia Shark Bay, Western Australia. In: Berry PF, Bradshaw SD, Wilson BR (eds) Research in Shark Bay: Report of the France-Australe Biocentenary Expedition Committee. Western Australia Museum, Perth, pp 245–261
Brewer DT, Blaber SJM, Salini JP, Farmer MJ (1995) Feeding ecology of predatory
fishes from Groote Eylandt in the Gulf of Carpentaria, Australia, with special reference to predation on penaeid prawns. Estuar Coast Shelf S 40:577–600
Brown BR (2003) Sensing temperature without ion channels. Nature 421:495 Brown JS, Kotler BP (2004) Hazardous duty pay and the foraging cost of predation. Ecol
Lett 7:999–1014

213
Bush A, Holland K (2002) Food limitation in a nursery area: Estimates of daily ration in juvenile scalloped hammerheads, Sphyrna lewini (Griffith and Smith, 1834) in Kane'ohe Bay, O'ahu, Hawai'i. J Exp Mar Biol Ecol 278:157–178
Claramunt RM, Jonas JL, Fitzsimons JD, Marsden JE (2005) Influences of spawning
habitat characteristics and interstitial predators on lake trout egg deposition and mortality. Trans Am Fish Soc 134:1048–1057
Cortes E, Gruber SH (1992) Gastric evacuation in the young lemon shark, Negaprion
brevirostris, under field conditions. Environ Biol Fish 35:205–212 Creel S, Christianson D, Liley S, Winnie JA Jr (2007) Predation risk affects reproductive
physiology and demography of elk. Science 315:960 Di Santo V, Bennett WA (2011) Is post-feeding thermotaxis advantageous in
elasmobranch fishes? J Fish Biol. 78:95-207 Diaz JA, Cabezas-Diaz S, Salvador A (2005) Seasonal changes in the thermal
environment do not affect microhabitat selection by Psammodromus algirus lizards. Herpetol J 15:295–298
Diaz RJ, Rosenberg R (2008) Spreading dead zones and consequences for marine
ecosystems. Science 321:926–929 Dowd WW, Brill RW, Bushnell PG, Musick JA (2006). Standard and routine metabolic
rates of juvenile sandbar sharks (Carcharhinus plumbeus), including the effects of body mass and acute temperature change. Fish Bull 104:323–331
Dunham AE, Grant BW, Overall KL (1989) Interfaces between biophysical and
physiological ecology and the population ecology of terrestrial vertebrate ectotherms. Physiol Zool 62:335–355.
Dunphy-Daly MM, Heithaus MR, Wirsing AJ, Mardon JSF, Burkholder DA (2010)
Predation risk influences the diving behavior of a marine mesopredator. Open Ecol J 3:8–15
Eby LA, Crowder LB (2002) Hypoxia-based habitat compression in the Neuse River
Estuary: context-dependent shifts in behavioral avoidance thresholds. Can J Fish Aquat Sci 59:952–965
Economakis AE, Lobel PS (1998) Aggregation behavior of the gray reef shark,
Carcharhinus amblyrhynchos, at Johnston Atoll, central Pacific Ocean. Environ Biol Fish 51:129–139

214
Frisk MG, Miller TJ, Martell SJD, Sosebee K (2008) New hypothesis helps explain elasmobranch “outburst” on Georges Bank in the 1980s. Ecol Appl 18:234–245
Grant J (1983) The relative magnitude of biological and physical sediment reworking in
an intertidal community. J Mar Res 41:673–689 Harris JE (1952) A note on the breeding season, sex ratio and embryonic development of
the dogfish Scyliorhinus canicula (L). J Mar Biol Assoc UK 31:269–274 Harter SL, Heck KL Jr (2006) Growth rates of juvenile pinfish (Lagodon rhomboids):
effects of habitat and predation risk. Estuar Coast 29:31–327 Heithaus MR, Dill LM (2002) Food availability and tiger shark predation risk influence
bottlenose dolphin habitat use. Ecology 83:480–491 Heithaus MR, Delius BK, Wirsing AJ, Dunphy-Daly MM (2009) Physical factors
influencing the distribution of a top predator in a subtropical oligotrophic estuary. Limnol Oceanogr 54:472–482
Heithaus MR, Frid A, Wirsing AJ, Worm B (2008) Predicting ecological consequences
of marine top predator declines. Trends Ecol Evol 23:202–210 Heithaus MR, Frid A, Wirsing AJ, Dill LM, Fourqurean JW, Burkholder D. Thomson J,
Bejder L (2007a) State-dependent risk-taking by green sea turtles mediates top-down effects of tiger shark intimidation in a marine ecosystem. JAnim Ecol 76:837–844
Heithaus MR, Wirsing AJ, Frid A, Dill LM (2007b) Behavioral indicators in marine
conservation: lessons from a pristine seagrass ecosystem. Isr J Ecol Evol 53:355–370
Herczeg G, Herrero A, Saarikivi J, Gonda A, Jantti M, Merila J (2008) Experimental
support for the cost-benefit model of lizard thermoregulation: the effects of predation risk and food supply. Oecologia 155:1-10
Hight BV, Lowe CG (2007) Elevated body temperatures of adult female leopard sharks,
Triakis semifasciata, while aggregating in shallow nearshore embayments: Evidence for behavioral thermoregulation? J Exp Mar Biol Ecol 352:114–128
Hofmann N, Fischer P (2003) Impact of temperature on food intake and growth in
juvenile burbot. J Fish Biol 63:1295–1305 Huey RB, Slatkin M (1976) Cost and benefits of lizard thermoregulation. Q Rev Biol
51:363–384

215
Kerford MR, Wirsing AJ, Heithaus MR, Dill LM (2008) Danger on the rise: diurnal tidal state mediates an exchange of food for safety by the bar-bellied sea snake Hydrophis elegans. Mar Ecol Prog Ser 358:289–294
Lima SL, Dill LM (1990) Behavioral decisions made under the risk of predation: a
review and prospectus. Can J Zoolog 68:619–640 Lotze HK, Lenian HS, Bourque BJ, Bradbury RH, Cooke RG, Kay MC, Kidwell SM,
Kirby MX, Peterson CH, Jackson JBC (2006) Depletion, degradation, and recovery potential of estuaries and coastal seas. Science 312:1806–1809
Matern SA, Cech JJ Jr, Hopkins TE (2000) Diel movements of bat rays, Myliobatis
californica, in Tomales Bay, California: Evidence for behavioral thermoregulation? Environ Biol Fish 58:173–182
McLaren IA (1963) Effects of temperature on growth of zooplankton, and the adaptive
value of vertical migration. J Fish Res Board Can 20:685–727 Morris DW (2003) Toward an ecological synthesis: a case for habitat selection.
Oecologia 136:1–13 Morrissey JF, Gruber SH (1993) Habitat selection by juvenile lemon sharks, Negaprion
brevirostris. Environ Biol Fish 38:311–319 Mull CG, Lowe CG, Young KA (2010) Seasonal reproduction of female round stingrays
(Urobatis halleri): steroid hormone profiles and assessing reproductive state. Gen Comp Endocr 166:379–387
Musick JA, Branstetter S, Colvocoresses JA (1993) Trends in shark abundance from
1974 to 1991 for the Chesapeake Bight Region of the U.S. Mid-Atlantic coast. NOAA Technical Report NMFS 115:1–18
Myers RA, Baum JK, Shepherd TD, Powers SP, Peterson CH (2007) Cascading effects
of the loss of apex predatory sharks from a coastal ocean. Science 315:1846–1850 Myrick JL, Flessa KW (1996) Bioturbation rates in Bahia La Choya, Sonora, Mexico.
Cienc Mar 22:23–46 Nelson EH, Matthews CE, Rosenheim JA (2004) Predators reduce prey population
growth by inducing changes in prey behaviour. Ecology 85:1853–1858 Paine RT (1966) Food web complexity and species diversity. Am Nat 100:65–75

216
Papastamatiou YP, Lowe CG, Caselle JE, Friedlander AM (2009) Scale-dependent effects of habitat on movements and path structure of reef sharks at a predator-dominated atoll. Ecology 90:996–1008
Rahmstorf S, Cazenave A, Church JA, Hansen JE, Keeling RF, Parker DE, Somerville
RCJ (2007) Recent climate observations compared to projections. Science 316:709
Ripple WJ, Beschta RL (2004) Wolves and the ecology of fear: can predation risk
structure ecosystems? Bioscience 54:755–766 Ritchie EG, Johnson CN (2009) Predator interactions, mesopredator release and
biodiversity conservation. Ecol Lett 12:982–998 Salini JP, Blaber SJM, Brewer DT (1990) Diets of piscivorous fishes in a tropical
Australian estuary, with special reference to predation on penaeid prawns. Mar Biol 105:363–374
Saoud IP, Mohanna C, Ghanawi J (2008) Effects of temperature on survival and growth
of juvenile spinefoot rabbitfish (Siganus rivulatus). Aquac Res 39:491–497 Schofield G, Bishop CM, Katselidis KA, Dimopoulos P, Pantis JD, Hays GC (2009)
Microhabitat selection by sea turtles in a dynamic thermal marine environment. J Anim Ecol 78:14–21
Semeniuk CAD, Dill LM (2005) Cost/benefit analysis of group and solitary resting in the
cowtail stingray, Pastinachus sephen. Behav Ecol 16:417–426 Semeniuk CAD, Dill LM (2006) Anti-predator benefits of mixed-species groups of
cowtail stingrays (Pastinachus sephen) and whiprays (Himantura uarnak) at rest. Ethology 112:33–43
Simpfendorfer CA, Goodreid AB, McAuley RB (2001) Size, sex and geographic
variation in the diet of the tiger shark, Galeocerdo cuvier, from Western Australian waters. Environ Biol Fish 61:37–46
Sims DW, Davies SJ, Bone Q (1996) Gastric emptying rate and return of appetite in
lesser spotted dogfish, Scyliorhinus canicula (Chondrichthyes: Elasmobranchii). J Mar Biol Assoc UK 76:479–491
Sims DW, Wearmouth VJ, Southall EJ, Hill JM, Moore P, Rawlinson K, Hutchinson N,
Budd GC, Righton D, Metcalfe JD, Nash JP, Morritt D (2006). Hunt warm, rest cool: bioenergetic strategy underlying diel vertical migration of a benthic shark. J Anim Ecol 75:176–190

217
Stephens DW, Krebs JR (1986) Foraging theory. Princeton University Press, Princeton Stevens JD, Lyle JM (1989) Biology of three hammerhead sharks (Eusphyra blochii,
Sphyrna mokarran and S. lewini) from Northern Australia. Aust J Mar Fresh Res 40:129–146
Stobutzki IC, Miller MJ, Heales DS, Brewer DT (2002) Sustainability of elasmobranchs
caught as bycatch in a tropical prawn (shrimp) trawl fishery. Fish Bull 100:800–821
VanBaricom GR (1982) Experimental analyses of structural regulation in a marine sand
community exposed to oceanic swell. Ecol Monogr 52:283–305 Vaudo JJ, Heithaus MR (2009) Spatiotemporal variability in a sandflat elasmobranch
fauna in Shark Bay, Australia. Mar Biol 156:2579–2590 Vaudo JJ Heithaus MR (2011) Dietary niche overlap in a nearshore elasmobranch
mesopredator community. Mar Ecol Prog Ser 425:247-260 Wallman HL, Bennett WA (2006) Effects of parturition and feeding on thermal
preference of Atlantic stingray, Dasyatis sabina (Lesueur). Environ Biol Fish 75:259–267�
Ward AJW, Hensor EMA, Webster MM, Hart PJB (2010) Behavioural thermoregulation
in two freshwater fish species. J Fish Biol 76:2287–2298 Webb JK, Whiting MJ (2005) Why don’t small snakes bask? Juvenile broad-headed
snakes trade thermal benefits for safety. Oikos 110:515–522 Wells FE, Rose RA, Lang S (1985) An analysis of benthic marine invertebrate
communities in subtidal seagrass and sand habitats in Shark Bay, Western Australia. Rec West Aust Mus 12:47–56
Werner EE, Hall DJ (1979) Foraging efficiency and habitat switching in competing
sunfishes. Ecology 60:256–264 Wetherbee BM, Gruber SH, Rosa RS (2007) Movement patterns of juvenile lemon
sharks, Negaprion brevirostris within Atol das Rocas, Brazil: a nursery characterized by tidal extremes. Mar Ecol Prog Ser 343:283–293
White WT, Platell ME, Potter IC (2004) Comparisons between the diets of four abundant
species of elasmobranchs in a subtropical embayment: implications for resource partitioning. Mar Biol 144:439–448

218
Wirsing AJ, Heithaus MR (2009) Olive-headed sea snake Disteria major shift seagrass microhabitats to avoid shark predation. Mar Ecol Prog Ser 387:287–293
Wirsing, A.J., Heithaus, M.R. & Dill, L.M. (2006) Tiger shark (Galeocerdo cuvier)
abundance and growth in a subtropical embayment: evidence from 7 years of standardized fishing effort. Marine Biology, 149, 961-968.
Wirsing AJ, Heithaus MR, Frid A, Dill LM (2008) Seascapes of fear: evaluating
sublethal predator effects experienced and generated by marine mammals. Mar Mammal Sci 24:1–15
Wurtsbaugh WA, Neverman D (1988) Post-feeding thermotaxis and daily vertical
migration in a larval fish. Nature 333:846–848

219
CHAPTER VI
DIEL AND SEASONAL VARIATION IN THE USE OF A NEARSHORE SANDFLAT
BY A RAY COMMUNITY IN A NEAR PRISTINE SYSTEM

220
Abstract
Movement patterns and habitat use are important in determining the ecological
role of species. Understanding these patterns for marine mesopredators are particularly
important because they link upper and lower trophic levels, but often are overlooked.
Using acoustic telemetry, I examined coarse-scale diel and seasonal movements within a
guild of co-occurring elasmobranch mesopredators on the shallow sandflats of Shark
Bay, Western Australia. The two most common species, giant shovelnose rays,
Glaucostegus typus, and reticulate whiprays, Himantura uarnak, were most often
detected in nearshore microhabitats and were regularly detected day and night, as well as
during both the warm and cold seasons, although reticulate whiprays tended to frequent
the monitored array over longer periods. Pink whiprays, H. fai, and cowtail stingrays,
Pastinachus atrus, which tend to be more active species, were also detected during the
day and night, but were far less frequently detected on the sandflats. Overall, there was
no apparent spatial or temporal partitioning of the sandflats, but residency to the area did
vary among species. In addition, presence throughout the year, suggests that previously
observed differences in seasonal abundance are likely a result of seasonal changes in
habitat use rather than large-scale migrations. While diurnal use of the sandflats may be
motivated by predation risk, particularly during the warm season, nocturnal use of the
flats may potentially provide energetic benefits because of slower metabolism associated
with lower temperatures. Continuous use of the sandflats by this ray community suggests
that rays have the potential to be a structuring force on this system.

221
Introduction
Understanding patterns of habitat use and movement are critical for understanding
the ecological role of species because they determine the spatiotemporal pattern of
species interactions (e.g., Morris 2003), and identify areas that may be critical for species
conservation. Such as understading is especially important for elasmobranchs, which
tend to occupy upper trophic levels (Cortés 1999, Ebert and Bizzarro 2007) and as a
result may play an important role in many ecosystems (Heithaus et al. 2010). Therefore,
studies of their habitat use and movement are potentially important for understanding
marine community dynamics. Such studies have taken on a greater importance in light of
dramatic declines in the abundance of large sharks populations (e.g., Musick et al. 1993,
Baum et al. 2003) and possible increases in population sizes of smaller-bodied
elasmobranchs (Sheperd and Myers 2005, Myers et al. 2007, Feretti et al. 2010) that may
transmit top-down effects to lower trophic levels.
Movement patterns of several elasmobranchs have been examined using a variety
of tagging and telemetry methods, but studies have tended to focus on large predators
(e.g., Andrews et al. 2010, Jorgensen et al. 2010, Meyer et al. 2010), commercially
important species (e.g., Conrath and Musick 2010, King and McFarlane 2010, Sulikowski
et al. 2010), species with conservation concerns (e.g., Skomal et al. 2009, Whitty et al.
2009, Simpfendorfer et al. 2010), or in easily accessible coastal shark nurseries (e.g.,
Heupel and Hueter 2002, Heupel et al. 2004, Carlson et al. 2008). Little attention has
focused on the movements of batoids (e.g., rays) – (but see Cartamil et al. 2003, Vaudo
and Lowe 2006, Collins et al. 2007, 2008) – even though they have the potential to be

222
ecologically and economically important (VanBlaricom 1982, Thrush et al. 1991, 1994,
Peterson et al. 2001).
Shark Bay, Western Australia, which because of its limited anthropogenic
impacts, has served as a model system for investigating the role of tiger sharks,
Galeocerdo cuvier (Heithaus et al. 2007), also provides habitat to a wide diversity of
elasmobranch mesopredators, especially rays (White et al. 2004, Vaudo and Heithaus
2009). Previous work has shown that based on visual surveys, several of the most
abundant ray species display similar daytime behaviors, patterns of seasonal abundance
and microhabitat use on Shark Bay’s sandflats (Vaudo and Heithaus 2009, Chapter V).
In addition, there is a large degree of dietary overlap among the most abundant rays
(Vaudo and Heithaus 2011). It remains unknown, however, whether these species might
partition habitats through interspecific variation in seasonal and diel patterns of the use of
sandflat habitats. Understanding these patterns of ray sandflat habitat use will help
provide insights into how and at what scales rays may influence sandflat community
dynamics under near pristine conditions. The goal of this study was to investigate
coarse-scale residency patterns of individual rays and diel patterns of habitat use of
prominent ray species found on Shark Bay’s sandflats using passive acoustic telemetry.
Materials And Methods
Study Site
Shark Bay, Western Australia (25°45´S, 113°44´E), located approximately 800
km north of Perth, is a large (ca. 13,000 km2) semi-enclosed bay containing vast seagrass
shoals and several expansive shallow nearshore sandflats with fringing seagrass beds.

223
Several ray species frequent these sandflats throughout the year and are extremely
abundant during the warm season (September-May) when water temperatures exceed
20°C (Vaudo and Heithaus 2009). Within the Cape Rose Flats (~8.3 km2), I have
previously defined three microhabitats: nearshore, sand and patchy. Nearshore
microhabitats are adjacent to the shoreline and intertidal, sand microhabitats have depths
of 1-2 m, and patchy microhabitats are 1-3 m deep and are covered with patchy seagrass
(Vaudo and Heithaus 2009).
Acoustic Monitoring
To examine diel and seasonal use of the Cape Rose Flats by individual rays, I
used acoustic monitoring. Rays were captured using longlines and netting techniques
described in Vaudo and Heithaus (2009). Once captured, rays were measured (disc width
or total length), externally tagged with a coded acoustic transmitter (V16-5H-R4k, delay:
30-90s; V16-5H-R64k, delay: 60-180s, Vemco Ltd) attached to an M-tag, and released at
the site of capture. Ray processing time did not exceed 5 min and all individuals swam
away from the release location in a manner similar to untagged rays within a few minutes
of release.
Between 16 May 2006 and 26 January 2007, I used an array of 14 omni-
directional automated acoustic receivers (VR2, Vemco Ltd) providing nearly full
coverage of the Cape Rose Flats (Array 1, Fig 1) to estimate fidelity to these flats. In an
attempt to elucidate movements at a microhabitat scale, I changed the arrangement of
receivers to create larger overlap in receiver detection areas. The resulting array (Array
2, Fig 1), consequently, provided coverage of only the western edge of the Cape Rose

224
Flats (Array 2, Fig 1). The second receiver array was in place from 27 January 2007 to
27 February 2008.
I conducted range testing of acoustic receivers on the Cape Rose Flats prior to
designing Array 1 and within both arrays. All range tests took place during the warm
season. During range tests, I towed an acoustic transmitter across the flats and using a
VR60 acoustic receiver (Vemco Ltd) and GPS recorded the time and position of my
vessel every time the transmitter emitted a signal. Transmitter position was compared to
detections recorded by the automated acoustic receivers.
Bottom water temperatures were recorded within Array 2 using three temperature
loggers (HOBO Water Temp Pro v2, Onset Computer Corporation, accuracy: 0.2°C,
resolution: 0.02°C) placed across the sandflat (Fig. 1). Water temperatures were logged
at midnight and noon from 12 February 2007 (23 April 2007 for the logger furthest from
shore) until 31 December 2007. I analyzed temperature data using season, time of day
and location as factors and day as a random blocking factor. Temperature data spanned
two separate warm seasons, so I considered each warm season separately.
Acoustic Monitoring Data Analysis
I grouped the detections of each individual ray on each receiver into half hour
bins. Because detection frequencies of acoustic transmitters are affected by a variety of
environmental factors (Heupel et al. 2006, Simpfendorfer et al. 2008) and therefore using
uncorrected detection frequencies could potentially lead to incorrect inferences about
animal behavior (Payne et al. 2010), I considered only the presence of individuals on
receivers as opposed to the total number of detections on receivers. For each ray, I

225
assigned each half hour block to a microhabitat type based on the combination of
receivers that ray was detected on during that block. To examine the effects of season
[warm (September-May) and cold (June-August)], time of day [daytime (sunrise-sunset)
and nighttime (sunset-sunrise)], and microhabitat on each species’ total number of time
blocks spent within the array, I used a standard least squares model with individual as a
random factor. Most rays were tagged on different days, so we divided the number of
time blocks by the time at liberty for each ray. Because it is not possible to differentiate
between rays that never return to the array and those that may have lost their transmitters
outside of the array, time at liberty was defined as the number of days between the day of
tagging and the last detection. Length of stay on days rays were present was also
examined in the same manner as total time within the array, using the number of time
blocks per day as the dependant variable.
Results
Range Tests
Prior to establishing Array 1, during range tests conducted at tidal heights >1.5m
and under light winds, I measured a maximum detection range of 920m. Within the
maximum detection range, 55 of 88 (62.5%) transmitter signals were detected. Within
500m of the acoustic monitor, 49 of 67 (73.1%) transmitter signals were detected. Range
tests within Arrays 1 and 2 took place during tidal heights ~1-2m and tended to take place
when visibility conditions on Cape Rose Flats did not allow for other work. Poor
visibility conditions were most often the result of winds causing Beaufort sea states of
greater than three. Within Array 1 only 47 of 476 (9.9%) of signals with 500m of a

226
receiver were detected. Individuals receivers detected 0-44.4% of signals emitted within
500m. Seventy-two of 182 (39.6%) of signals within 500m of a receiver were detected
within Array 2 and one detection was made from a distance of 708m. Individuals
receivers within Array 2 detected 0-51.9% of signals emitted within 500m.
Array 1
Between 21 May 2006 and 9 November 2006, I tagged nine reticulate whiprays,
Himantura uarnak (73-113 cm disc width), within Array 1. On the basis of body size, all
were immature, with the possible exception of the largest individual. Reticulate whiprays
were detected over periods ranging from 17-171 days (85.67 ± 50.46 days; mean ± SD)
and all four individuals tagged prior to September 2006 were detected during the cold
season (June-August). The total amount of time reticulate whiprays were present on the
flats was influenced by the interaction between time of day and microhabitat (F = 6.73, p
= 0.012; Fig 2). Regardless of time of day, rays spent more time in the nearshore
microhabitat than the other two microhabitats, but the use of nearshore areas was greatest
at night. Length of stay was longer at night than during the day (F = 123.48, p < 0.0001;
nighttime = 6.4 ± 0.2, daytime = 4.7 ± 0.2 half hr blocks; mean ± SE), during winter (F =
11.14, p = 0.013; warm = 4.1 ± 0.5, cold = 7.0 ± 0.5 half hr blocks), and in nearshore
microhabitats (F = 14.29, p = 0.0005; Fig 3). During the warm season, reticulate
whiprays were detected on 72.5-100% of days between tagging and their last detection.
Rays that were present in the cold season were detected on 54.9-100% of days prior to
their last detection.

227
We tagged eight juvenile giant shovelnose rays, Glaucostegus typus (151-205 cm
total length), between 6 June 2006 and 21 October 2006. Shovelnose rays were detected
within the receiver array for periods of 2-90 days (22.6 ± 28.6 days; mean ± SD), which
was less than that of reticulate whiprays (Mann-Whitney U-test, W = 108.0, p = 0.011).
Time x season (F = 9.07, p = 0.024) and time x microhabitat (F = 7.20, p = 0.011)
interactions influenced the total amount of time shovelnose rays spent within the array.
During the warm season, there were no diel differences in the amount of time shovelnose
rays were detected on the flats, but shovelnose rays were detected for more time at night
during the cold season (Fig 4). During the day, there was no spatial variation in the
amount of time that shovelnose rays were detected, but at night, rays used nearshore areas
more often (Fig 5). Shovelnose ray length of stay within the array was longer at night (F
= 8.46, p < 0.026; nighttime = 5.8 ± 0.7, daytime = 4.0 ± 0.7 half hr blocks; mean ± SE)
and in nearshore microhabitats (F = 4.37, p = 0.048; Fig 6). From the date of their
tagging to the date of their last detection, shovelnose rays were present on 46.7-100% of
days during the cold season and 18.0-100% of days during the warm season.
Array 2
Malfunctions of automated receivers within Array 2 limited my ability to assign
time blocks to microhabitats after 22 April 2007, so quantitative analyses involving
microhabitat were limited to the time period between 27 January 2007 and 22 April 2007
(warm season) and species with at least five tagged individuals during that time period.
We tagged two additional reticulate whiprays (108 and 94 cm disc width) on 18
and 19 February 2007. These rays were detected within Array 2 over periods of 42 and

228
295 days. Both rays were detected during both daytime and nighttime periods and the ray
detected over a period of 295 days, remained in the area throughout the cold season,
being detected on 96.7% of cold season days. Overall rays were detected 84 and 100% of
days between tagging and the date of their last detection.
On 20 February 2007, I tagged three giant shovelnose rays (182-201 cm total
length. I detected these rays for periods ranging from 15 to 185 days and were present
during daytime and nighttime periods. All the shovelnose rays had left the array by the
end of April, but one individual returned in mid-August for 5 days during a period of 10
days. The shovelnose rays present in the array for 15 and 59 days were detected on 100%
of days. The ray that returned during the cold season was present on 80.6% of the 62
days prior to its cold season return and 29.7% of days overall.
Between 20 February 2007 and 6 April 2007, I tagged five juvenile pink
whiprays, H. fai (84-100 cm disc width). These rays were detected for periods ranging
from 7 to 112 days (34.80 ± 44.06 days; mean ± SD) and all of the pink whiprays had left
the array before the start of the cold season. During the cold season one individual
returned to the array for a 3-day period after a 2-month absence and then again for 2 days
after about 3 weeks. Pink whiprays were detected on 50.0-85.7% of days prior to their
last warm season detection. On the basis of the limited data available for pink whiprays,
I found no effect of time of day (F = 0.25, p = 0.641) or microhabitat (F = 0.638, p =
0.558) on the total time spent within the array. Similarly, I found no effect of time of day
(F = 0.001, p = 0.976) or microhabitat (F = 0.98, p = 0.419) on length of stay.
Nine cowtail stingrays, Pastinachus atrus (a mix of juveniles and possible adults:
89-133cm disc width) were tagged between 17 February 2007 and 29 March 2007.

229
Cowtail stingrays were detected in the array for periods of 4-189 days (32.9 ± 58.8 days;
mean ± SD), with only one ray detected after early April. This individual was not
detected during the cold season, but was detected briefly in early September. Between
tagging and their last detection within the array prior to the cold season, cowtail stingrays
were recorded on 9.0-70.0% of days. With limited data for cowtail stingrays, I found no
effect of time of day (F = 0.83, p = 0.388) or microhabitat (F = 0.85, p = 0.447) on the
total time spent by these animals within the array. Similarly, I found no effect of time of
day (F = 1.75, p = 0.235) or microhabitat (F = 1.02, p = 0.439) on length of stay.
Temperature
Midnight temperatures ranged from 15.2-28.0 °C, 13.9-22.2 °C, and 16.6-27.3 °C
for the late warm (February-May), cold, and early warm (September-December) seasons,
respectively. Noon temperatures ranged from 16.7-29.2 °C, 14.4-22.8 °C, and 17.9-29.0
°C for the late warm, cold, and early warm seasons, respectively. The interaction
between season, time of day and location resulted in temperature differences (F = 11.27,
p <0.001). Mean cold season temperatures were >3°C lower than warm season
temperatures and daytime temperatures were warmer than nighttime temperatures except
at the location furthest from shore. Mean temperatures tended to increase with distance
from shore during the late warm season and cold season, while offshore temperatures
were cooler during the days in the early warm season (Fig 7).

230
Discussion
Working in Shark Bay’s nearshore sandflats presented some problems for
acoustic monitoring. Shallow waters coupled with tidal effects and Shark Bay’s regular
windy conditions can severely hamper signal detection (Finstad et al. 2005, Heupel et al.
2006). These conditions may be most problematic in the nearshore microhabitat, which
has the shallowest waters. As a result these environmental factors, especially wind, and
the presence of the vessel itself may have contributed to the low rates of detection
observed during range tests. The high volume of detections of several animals over
extended periods suggests an underestimation of receiver detection efficiency, although
spotty detection patterns within the arrays also suggests that at times detection efficiency
may have been compromised by environmental conditions. Although not examined, such
variation in detection efficiency may have a seasonal component, as the warm season
tends to be windier than the cold season in Shark Bay and the lowest tides take place
early in the warm season. Because of the apparent variability in detection efficiency, I
used a conservative approach to animal presence by using time blocks that had detections
as my variable as opposed to using the total number of detections in time blocks, which
has been used in other studies (e.g., Collins et al. 2007, Meyer et al. 2007, Carlson et al.
2008, Collins et al. 2008). Given that more detections were recorded in the nearshore
microhabitat than any other microhabitat despite the higher likelihood of missed signals
and the conservative approach I used, my results are robust. In addition, the variable
detection efficiency combined with the open nature of the arrays and long periods of ray
movements that were extremely limited or nonexistent (i.e., continuous periods of up to
days detected at a single receiver) prevented examination of diel movement rates.

231
Previous studies of Shark Bay’s sandflat ray community have shown that rays are
abundant during the warm season, especially in nearshore microhabitats, and that ray
densities decrease in the cold season (Vaudo and Heithaus 2009). Acoustic monitoring
showed somewhat similar spatial patterns but provide new insights into seasonal patterns
of habitat use and abundance. Shovelnose rays, Glaucostegus typus, and reticule
whiprays, Himantura uarnak, that I monitored spent the most time in nearshore
microhabitats. However, rays were often detected on the sandflats during the cold season
and interestingly, season did not influence the total amount of time these species were
detected on the sandflats when they were present. In fact, on days reticulate whiprays
were detected, they were recorded for more time on the sandflats during the cold season,
although these results may be confounded by receiver detection efficiencies. The
continued presence of individual shovelnose rays and reticulate whiprays on the sandflats
during winter, therefore, suggests that the observed decrease in densities of these species
in winter may be a result of differences in habitat use (i.e., more time spent in deep
habitats not sampled here or during visual surveys) during the cold season rather than
migration out of Shark Bay, which would have resulted in no detections during the cold
season. On the basis of dietary information (Vaudo and Heithaus 2011), examination of
potential prey densities on the sandflats, ray behaviors, and large shark densities, I
suggested that increased ray densities during the warm season might be a method of
avoiding predation from tiger sharks, Galeocerdo cuvier, and great hammerhead sharks,
Sphyrna mokarran, which are common in Shark Bay during the warm season, rather than
exploiting available prey or thermal heterogeneity (Chapter V). It is possible, however,
that nocturnal use of the flats could be thermally motivated. Nearshore microhabitats,

232
which were used most frequently, tended to be the coolest at night and rays may benefit
energetically by residing in cooler water, especially if they have been feeding (Matern et
al. 2000, Sims et al. 2006, Wallman and Bennett 2006, Di Santo and Bennett 2011).
Energy conservation associated with use of cool waters may be extremely important in
light of the high temperatures experienced during the day, especially in the warm season
(Chapter V) and requires further study.
Of the two most common species, reticulate whiprays showed a more consistent
presence on the Cape Rose flats than other species. Seven of the nine whiprays
monitored with Array 1 were detected over the course of two months, two rays were
present for over five months, and all were present at least 72% of days between tagging
and their last detection. Further, within the smaller area covered by Array 2, the
reticulate rays were present for 42 and 295 days, and they were present for at least 84%
of days. These data suggest that at least on the scale of months juvenile reticulate
whiprays make relatively limited movements. Shovelnose rays spent much less time on
Cape Rose flats, with five animals from Array 1 detected for less than two weeks and
only one shovelnose ray detected for over one month. One of the shovelnose rays from
Array 2, however, was detected for 59 consecutive days. Juvenile shovelnose rays,
therefore, may be more nomadic than reticulate whiprays. However, it is unlikely that
shovelnose rays move great distances. Indeed, two shovelnose rays last present at the end
of the cold season (late August) returned briefly the following March and one shovelnose
ray from Array 2 returned after a four-month absence. Additionally, shovelnose rays
tagged with dorsal fin tags were spotted on flats near Monkey Mia, ~10 km southeast of
the Cape Rose flats, over one year after being tagged on the Cape Rose Flats (Vaudo

233
personal observation), further suggesting that shovelnose rays may have larger home
ranges than whiprays, but still remain within the eastern gulf of Shark Bay. Limited
movements over similar timescales have been observed in other rays that spend large
amounts of time resting on the bottom (Vaudo and Lowe 2006, Simpfendorfer et al.
2010) and even in more mobile elasmobranch species, juveniles have often shown
restricted movements (e.g., Morrissey and Gruber 1993, Garla et al. 2006, Wetherbee et
al. 2007).
Pink whiprays, H. fai, and cowtail stingrays, Pastinachus atrus, are less
frequently observed on the flats of my study area (Vaudo and Heithaus 2009) and, not
surprisingly, were detected for shorter periods of time. Most individuals were detected
over periods of less than two weeks and present for <70% of days. Array 2, however, did
not provide full coverage of the Cape Rose flats, so it is possible individuals left the array
but remained on the flats. Cowtail stingrays may exhibit movement patterns similar to
those observed for the shovelnose rays. Cowtail stingrays are known to move into the
shallow nearshore waters of Shark Bay’s sandflats to rest in groups (Semeniuk and Dill
2005), but are also more often seen swimming than reticulate whiprays (Vaudo
unpublished), which may indicate a more active lifestyle. Cowtail stingrays appear to
forage more heavily on sandflat-associated prey than other ray species that I studied
(Vaudo and Heithaus 2011) and, therefore, may be responsible for many of the feeding
pits observed on the sandflats (Vaudo and Heithaus 2011). Prey densities on the
sandflats, however, are low (Wells et al 1985, Chapter V), which may require cowtail
stingrays to forage over large areas to locate adequate prey resources.

234
Pink whiprays appear to be more active than the other rays monitored.
Approximately 75% of pink whiprays observed within the study site were swimming
(Chapter V), therefore, it is not surprising that individuals would not remain within the
detection range of the array for long, especially considering the size of Array 2. Other
mobile rays, such as cownose rays, Rhinoptera bonasus, have been known to use areas
approximately three times larger than the Cape Rose flats over the course of a single day
(Collins et al. 2007). Pink whiprays are also the only species regularly observed
swimming in groups within the study area (Vaudo and Heithaus 2009) and large groups
(>30 individuals) have been observed foraging together (Heithaus personal observation).
Such group feeding may rapidly deplete prey within an area (Peterson et al. 2001)
necessitating movements to new areas.
Although residency to the Cape Rose flats varied between species, all species
were regularly present on the flats during the day and night, despite daytime behaviors
and diets that would suggest moving into seagrass habitats at night to forage (Vaudo and
Heithaus 2011, Chapter V). Further, some reticulate whiprays continued to visit the
sandflats during the cold season and overall, giant shovelnose rays were detected for
longer periods of time on the sandflats during cold season nights than any other time of
the year, indicating that the shallow waters of the sandflats may serve as more than just a
refuge from predators, which are most abundant during the warm season, although even
low predator abundances could trigger anti-predator behaviors (Heithaus and Dill 2002).
The continued use of the sandflats, especially nearshore microhabitats, by rays combined
with the high densities often observed (Vaudo and Heithaus 2009) suggests that rays may
play an important role in the structure of the sandflat community, not limited to predatory

235
effects because rays’ benthic nature contributes to bioturbation, reworking sediments and
potentially altering nutrient dynamics (Thrush et al. 1991, Myrick and Flessa 1996, Yahel
et al. 2008). Understanding the role this ray community plays will require more detailed
information of ray movements and behaviors, especially during the night, which acoustic
monitoring does not allow. Knowledge of the fine-scale movements and the factors
affecting movements of this ray community combined with manipulative experiments to
determine ray effects on prey communities and nutrient flux could provide important
insights into the dynamics of tropical and subtropical nearshore soft bottom ecosystems.
Acknowledgments
I would like to thank everyone who helped in the field and with logistics,
especially D. Heithaus, M. Dunphy-Daly, D. Burkholder, the Department of Environment
and Conservation, Shark Bay District and the Monkey Mia Dolphin Resort. This research
was conducted under authorization by the Florida International University IACUC,
Fisheries Western Australia permit 4/05 and Department of Environment and
Conservation permits CE002111 and SF006493 and was supported by Florida
International University Presidential and Dissertation Year Fellowships to J. Vaudo,
grants from the National Geographic Expeditions Council to J. Vaudo, National Science
Foundation (OCE0526065 and OCE0745606) to M. Heithaus and Florida International
University’s College of Arts and Sciences.

236
Fig. 1 This study was conducted on the Cape Rose Flats, Shark Bay, Western Australia.
White dots represent acoustic receiver locations for Array 1 (21 May 2006 – 9 November
2006). Black dots are the locations of acoustic receivers for Array 2 (27 January 2007 –
8 February 2008). Asterisks indicate receivers with temperature loggers

237
0
2
4
6
8
10
Nearshore Sand Patchy
Tota
l Tim
e (h
alf h
r blo
cks
per d
ay)
DayNight
a
b
bcc c c
Fig. 2 Spatial and diel variation in total detection time (mean ± SE) of reticulate
whiprays, Himantura uarnak within Array 1. Bars with different letters are significantly
different at P < 0.05

238
0
2
4
6
8
10
Nearshore Sand Patchy
Leng
th o
f sta
y (h
alf h
r blo
cks)
a
b b
Fig. 3 Spatial and diel variation in reticulate whiprays, Himantura uarnak, length of stay
(mean ± SE) in Array 1. Bars with different letters are significantly different at P < 0.05

239
0
1
2
3
4
Cold Warm
To
tal T
ime
(h
alf
hr
blo
ck
s p
er
da
y)
DayNighta
bab
ab
Fig. 4 Effect of season and time of day on total detection time (mean ± SE) of giant
shovelnose rays, Glaucostegus typus, within Array 1. Bars with different letters are
significantly different at P < 0.05

240
0
1
2
3
4
5
Nearshore Sand Patchy
Tota
l Tim
e (h
alf h
r blo
cks
per d
ay) Day
Nighta
b
b
bb
b
Fig. 5 Effect of time of day and microhabitat on total detection time (mean ± SE) of giant
shovelnose rays, Glaucostegus typus, within Array 1. Bars with different letters are
significantly different at P < 0.05

241
0
2
4
6
8
Nearshore Sand Patchy
Leng
th o
f sta
y (h
alf h
r blo
cks)
a
bb
Fig. 6 Spaial and diel variation in giant shovelnose ray, Glaucostegus typus, length of
stay (mean ± SE) in Array 1. Bars with different letters are significantly different at P <
0.05

242
15
16
17
18
19
20
21
22
23
24
25
Late Warm Cold Early Warm
Tem
pera
ture
(Co )
Nearshore-Midnight Midflats-Midnight Offshore-MidnightNearshore-Noon Midflats-Noon Offshore-Noon
df
i
f
b
gh
abcdce
hi
f
a
g
abcdab
gh
f
ab
gh
ef
Fig. 7 Spatial, seasonal, and diel variation in water temperatures (mean ± SE) on the
Cape Rose sandflat between 12 February 2007 and 31 December 2007. Bars with
different letters are significantly different at P < 0.05

243
LITERATURE CITED
Andrews KS, Williams GD, Levin PS (2010) Seasonal and ontogenetic changes in movement pattersn of sixgill sharks. PLoS ONE 5(9):e12549.doi:10.1371/journal.pone.0012549
Baum JK, Myers RA, Kehler DG, Worm B, Harley SJ, Doherty PA (2003) Collapse and
conservation of shark populations in the Northwest Atlantic. Science 299:389–392
Carlson JK, Heupel MR, Bethea DM, Hollensead LD (2008) Coastal habitat use and
residency of juvenile Atlantic sharpnose sharks (Rhizoprionodon terraenovae). Estuar Coast 31:931–940
Cartamil DP, Vaudo JJ, Lowe CG, Wetherbee BM, Holland KN (2003) Diel movement
patterns of the Hawaiian stingray, Dasyatis lata: Implications for ecological interactions between sympatric elasmobranch species. Mar Biol 142:841–847
Collins AB, Heupel MR, Motta PJ (2007) Residence and movement patterns of cownose
rays Rhinoptera bonasus within a south-west Florida estuary. J Fish Biol 71:1159–1178
Collins AB, Heupel MR, Simpfendorfer CA (2008) Spatial distribution and long-term
movement patterns of cownose rays Rhinoptera bonasus within an estuarine river. Estuar Coast 31:1174–1183
Conrath CL, Musick JA (2010) Residency, space use and movement patterns of juvenile
sandbar sharks (Carcharhinus plumbeus) within a Virginia summer nursery area. Mar Freshw Res 61:223–235
Cortés E (1999) Standardized diet compositions and trophic levels of sharks. ICES J Mar
Sci 56:707–717 Di Santo V, Bennett WA (2011) Is post-feeding thermotaxis advantageous in
elasmobranch fishes? J Fish Biol 78:195–207 Ebert DA, Bizzarro JJ (2007) Standardized diet compositions and trophic levels of skates
(Chondrichthyes: Rajiformes: Rajoidei). Environ Biol Fish 80:221–237 Ferretti F, Worm B, Britten GL, Heithaus MR, Lotze HK (2010) Patterns and ecosystem
consequences of shark declines in the ocean. Ecol Lett 13:1055–1071 Finstad B, Økland F, Thorstad EB, Bjørn PA, McKinley RS (2005) Migration of
hatchery-reared Atlantic salmon and wild anadromous brown trout post-smolts in a Norwegian fjord system. J Fish Biol 66:86–96

244
Garla, RC, Chapman DD, Wetherbee BM, Shivji M (2006) Movement patterns of young Caribbean reef sharks, Carcharhinus perezi, at Fernando de Noronha Archipelago, Brazil: the potential of marine protected areas for conservation of a nursery ground. Mar Biol 149:189–199
Heithaus MR, Dill LM (2002) Food availability and tiger shark predation risk influence
bottlenose dolphin habitat use. Ecology 83:480–491 Heithaus MR, Frid A, Vaudo JJ, Worm B, Wirsing AJ (2010) Unraveling the ecological
importance of elasmobranchs. In: Carrier JC, Musick JA, Heithaus MR (eds) Sharks and Their Relatives II: Biodiversity, Adaptive Physiology, and Conservation. CRC Press, Boca Raton, FL, pp 607–633
Heithaus MR, Wirsing AJ, Frid A, Dill LM (2007) Behavioral indicators in marine
conservation: lessons from a pristine seagrass ecosystem. Isr J Ecol Evol 53:355–370
Heupel MR, Hueter RE (2002) Importance of prey density in relation to the movement
patterns of juvenile blacktip sharks (Carcharhinus limbatus) within a coastal nursery area. Mar Freshw Res 53:543–550
Heupel MR, Semmens JM, Hobday AJ (2006) Automated acoustic tracking of aquatic
animals: scales, design and deployment of listening station arrays. Mar Freshw Res 57:1–13
Heupel MR, Simpfendorfer CA, Hueter RE (2004) Estimation of shark home ranges
using passive monitoring techniques. Environ Biol Fish 71:135–142 Jorgensen SJ, Reeb CA, Chapple TK, Anderson S, Perle C, Van Sommeran SR, Fritz-
Cope C, Brown AC, Klimley AP, Block BA (2010) Philopatry and migration of Pacific white sharks. Proc R Soc B 277:679–688
King JR, McFarlane GA (2010) Movement patterns and growth estimates of big skate
(Raja binoculata) based on tag-recapture data. Fish Res 101:50–59 Matern SA, Cech, JJ, Jr, Hopkins TE (2000) Diel movements of bat rays, Myliobatis
californica, in Tomales Bay, California: Evidence for behavioral thermoregulation? Environ Biol Fish 58:173–182
Meyer CG, Holland KN, Papastamatiou YP (2007) Seasonal and diel movements of giant
trevally Caranx ignobilis at remote Hawaiian atolls: implications for the design of marine protected areas. Mar Ecol Prog Ser 333:13–25

245
Meyer CG, Papastamatiou YP, Holland KN (2010) A multiple instrument approach to quantifying the movement patterns and habitat use of tiger (Galeocerdo cuvier) and Galapagos sharks (Carcharhinus galapagensis) at French Frigate Shoals, Hawaii. Mar Biol 157:1857–1868
Morris DW (2003) Toward an ecological synthesis: a case for habitat selection.
Oecologia 136:1–13. Morrissey JF, Gruber SH (1993) Home range of juvenile lemon sharks, Negaprion
brevirostris. Copeia 1993:425–434 Musick JA, Branstetter S, Colvocoresses JA (1993) Trends in shark abundance from
1974 to 1991 for the Chesapeake Bight Region of the U.S. Mid-Atlantic coast. NOAA Tech Rept NMFS 115:1–18
Myers RA, Baum JK, Shepherd TD, Powers SP, Peterson CH (2007) Cascading effects
of the loss of apex predatory sharks from a coastal ocean. Science 315:1846-1850 Myrick JL, Flessa KW (1996) Bioturbation rates in Bahia La Choya, Sonora, Mexico.
Cienc Mar 22:23–46 Payne NL, Gillanders BM, Webber DM, Semmens JM (2010) Interpreting diel activity
patterns from acoustic telemetry: the need for controls. Mar Ecol Prog Ser 419:295–301
Peterson CH, Fodrie FJ, Summerson HC, Powers SP (2001) Site-specific and density-
dependent extinction of prey by schooling rays: generation of a population sink in top-quality habitat for bay scallops. Oecologia 129:349–356
Semeniuk CAD, Dill LM (2005) Cost/benefit analysis of group and solitary resting in the
cowtail stingray, Pastinachus sephen. Behav Ecol 16:417–426 Shepherd TD, Myers RA (2005) Direct and indirect fishery effects on small coastal
elasmobranchs in the northern Gulf of Mexico. Ecol Lett 8:1095–1104 Simpfendorfer CA, Heupel MR, Collins AB (2008) Variation in the performance of
acoustic receivers and its implication for positioning algorithms in a riverine setting. Can J Fish Aquat Sci 65:482–492
Simpfendorfer CA, Wiley TR, Yeiser BG (2010) Improving conservation planning for an
endangered sawfish using data from acoustic telemetry. Biol Conserv 143:1460–1469

246
Sims DW, Wearmouth VJ, Southall EJ, Hill JM, Moore P, Rawlinson K, Hutchinson N, Budd GC, Righton D, Metcalfe JD, Nash JP, Morritt D (2006). Hunt warm, rest cool: bioenergetic strategy underlying diel vertical migration of a benthic shark. J Anim Ecol 75:176–190
Skomal GB, Zeeman SI, Chisholm JH, Summers EL, Walsh HJ, McMahon KW,
Thorrold SR (2009) Transequatorial migrations by basking sharks in the western Atlantic Ocean. Curr Biol 19:1019–1022
Sulikowski JA, Galuardi B, Bubley W, Furey NB, Driggers WB, III, Ingram W, Jr.,
Tsang PCW (2010) Use of satellite tags to reveal the movements of spiny dogfish Squalus acanthias in the western North Atlantic Ocean. Mar Ecol Prog Ser 418:249–254
Thrush SF, Pridmore RD, Hewitt JE, Cummings VJ (1991) Impact of ray feeding
disturbances on sandflat macrobenthos: do communities dominated by polychaetes or shellfish respond differently? Mar Ecol Prog Ser 69:245–252
Thrush SF, Pridmore RD, Hewitt JE, Cummings VJ (1994) The importance of predators
on a sandflat: interplay between seasonal changes in prey densities and predator effects. Mar Ecol Prog Ser 107:211–222
VanBaricom GR (1982) Experimental analyses of structural regulation in a marine sand
community exposed to oceanic swell. Ecol Monogr 52:283–305 Vaudo JJ, Heithaus MR (2009) Spatiotemporal variability in a sandflat elasmobranch
fauna in Shark Bay, Australia. Mar Biol 156:2579–2590 Vaudo JJ, Heithaus MR (2011) Dietary niche overlap in a nearshore elasmobranch
mesopredator community. Mar Ecol Prog Ser 425:247-260 Vaudo JJ, Lowe CG (2006) Movement patterns of the round stingray Urobatis halleri
(Cooper) near a thermal outfall. J Fish Biol 68:1756–1766 Wallman HL, Bennett WA (2006) Effects of parturition and feeding on thermal
preference of Atlantic stingray, Dasyatis sabina (Lesueur). Environ Biol Fish 75:259–267
Wells FE, Rose RA, Lang S (1985) An analysis of benthic marine invertebrate
communities in subtidal seagrass and sand habitats in Shark Bay, Western Australia. Rec West Aust Mus 12:47–56
Wetherbee BM, Gruber SH, Rose RA (2007) Movement patterns of juvenile lemon
sharks Negaprion brevisrostris within Atol das Rocas, Brazil: a nursery characterized by tidal extremes. Mar Ecol Prog Ser 343:283–293

247
White WT, Platell ME, Potter IC (2004) Comparisons between the diets of four abundant species of elasmobranchs in a subtropical embayment: implications for resource partitioning. Mar Biol 144:439–448
Whitty JM, Morgan DL, Peverell SC, Thorburn DC, Beatty SJ (2009) Ontogenetic depth
partitioning by juvenile freshwater sawfish (Pristis microdon: Pristidae) in a riverine environment. Mar Freshw Res 60:306–316
Yahel G, Yahel R, Katz T, Lazar B, Herut B, Tunnicliffe V (2008) Fish activity: a major
mechanism for sediment resuspension and organic matter remineralization in coastal marine sediments. Mar Ecol Prog Ser 372:195–209

248
CHAPTER VII
SUMMARY

249
Despite considerable interest in the behavior and ecology of large sharks,
relatively little research has been focused on smaller-bodied elasmobranch
mesopredators, especially batoids. This is a potentially important oversight since batoids
have the potential to exert top-down impacts of their own (VanBlaricom 1982, Thrush et
al. 1994, Peterson et al. 2001, Myers et al. 2007) and, therefore, transmit indirect effects
of apex predators (Myers et al. 2007, Ritchie and Johnson 2009). In my review of
elasmobranch trophic relationships in Chapter I, I found that studies have primarily
focused on elasmobranch diets and there is little information available on how
elasmobranchs interact with or effect their predators and prey. Further impeding an
understanding of the ecology and importance of batoids and other elasmobranch
mesopredators is the lack of systems with relatively undisturbed populations of batoids
and their predators (large sharks). By examining a batoid community in an isolated, near
pristine system, I was able to examine habitat use patterns and foraging ecology of
several batoid species and the biotic and abiotic factors that could potentially influence
these behaviors in the absence of major anthropogenic impacts.
I found that the batoid community of Shark Bay is very diverse (Chapter II), with
12 species found on the nearshore sandflats of Shark Bay during my study, including a
species that at the time of my fieldwork was undescribed. With at least 18 species of
batoids, Shark Bay supports species richness similar to that found in much larger areas,
like Australia’s Gulf of Carpentaria (Blaber et al. 1994). Batoids on the sandflats of
Shark Bay were mostly juveniles and, surprisingly, the most common species of batoids
displayed similar patterns of seasonal abundance and microhabitat use, with densities

250
increasing in nearshore microhabitats during Shark Bay’s warm season (September to
May).
In addition to having similar daytime microhabitat use patterns, the most common
species have a great deal of dietary overlap, feeding primarily on crustaceans, which are
most abundant in seagrass habitats (Chapter III). Stable isotopic analysis showed that
within species there was considerable variation, most of which could not be attributed to
ontogenetic dietary shifts, hence there may be varying levels of individual specialization
within these populations. Further, these batoid populations are highly dependant on
seagrass derived carbon. The combination of similar microhabitat use patterns and diets
contrasts with predictions for populations that are limited primarily by food – where
greater niche segregation would be expected in diets or habitat use – and raises the
intriguing possibility that populations are regulated by other factors such as predation.
With information on diet and behaviors observed during surveys, I was then able
to assess the factors that may affect habitat use in Chapter IV. By examining water
depth, thermal heterogeneity, and the abundance of predators and prey, I showed that
daytime batoid microhabitat use during the warm season is likely related to predator
avoidance. Choosing to rest in shallow waters (the nearshore microhabitat) as a means of
avoiding predators, however, appears to represent an energetic tradeoff. Not only are the
batoids using microhabitats with limited food availability, but these habitats are also
often the warmest microhabitats available, which for poikilothermic species such as
batoids will result in increased metabolic rates and therefore costs, but can lead to faster
growth rates if energy intake increases at a higher rate than metabolism.

251
Acoustic monitoring data presented in Chapter V also supports the hypothesis that
use of the sandflats is related to batoid predators. Individual batoids use the sandflats
throughout the diel cycle and during the cold season (June to August), suggesting that
lower abundances of batoids on the sandflats during the cold season are likely a result of
habitat shifts (i.e., movements into deeper waters where visual surveys and acoustic
monitoring were not practical) rather than a seasonal migration out of Shark Bay.
Overall, the nearshore sandflats of Shark Bay appear to act as a nursery habitat for
juvenile batoids, providing protection from the seasonally abundant tiger shark,
Galeocerdo cuvier, and great hammerhead (Sphyrna mokarran) populations. Given the
large number of batoids within the system and their use of the sandflats throughout the
diel cycle, batoids have the potential to influence the sandflat community of Shark Bay,
especially during the warm season. Interestingly, their largest impact is not likely to be
the result of their foraging activities, but rather bioturbation because they often bury in
the sand while resting. Bioturbation could displace and remove meiofauna (VanBlaricom
1982, Cross and Curran 2000) as well as resuspend nutrients within the sediments (Yahel
et al. 2008), potentially altering nutrient dynamics and ultimately community
composition.
The use of the nearshore sandflats as a refuge may also alter the dynamics
between batoids and their non-sandflat associated prey. The large amount of time batoids
spend resting on the sandflats to avoid predation risk equates to lost foraging
opportunities. Such risk effects can maintain mesopredator populations below the
carrying capacity set by their prey (Heithaus et al. 2008), effectively releasing
mesopredators from prey limitation. When resources are abundant, species face lessened

252
competitive pressures and are able to use the same resources, which may in part explain
the high dietary overlap observed among the dominant batoid species and may be a
contributor to the high batoid diversity observed.
Also of interest is the relationship between Shark Bay’s batoids and temperature.
Although the batoids can tolerate the highest water temperatures found in Shark Bay, the
relationship between their metabolic rates and temperature are unknown. Batoids
undoubtedly incur higher metabolic costs in warm water (Du Preez et al. 1988, Hopkins
and Cech 1994), which can negatively affect growth rates unless increased feeding can
offset the higher costs (Wurtsbaugh and Davis 1977, Russell et al. 1996). Depending on
the metabolic costs of inhabiting high temperatures, increasing global temperatures could
at some point in the future eliminate the shallow waters of the nearshore microhabitat as a
viable refuge from predators, altering the interactions between batoids and large sharks
and, ultimately, the dynamics of nearshore communities.
Top-down pressure from large sharks does appear to play an important role in
Shark Bay’s batoid community. Throughout the warm season, juvenile batoids select
habitats that provide protection from large sharks (i.e., habitats too shallow for large
sharks to enter). Batoids may then impact these shallow habitats through bioturbation
and limited foraging; therefore, large sharks, through their interaction with batoids, may
indirectly affect the dynamics of Shark Bay’s shallow sandflats, despite not normally
having access to these areas. Thus, my study provides further evidence for the
importance of apex predators and how their interactions with mesopredators can shape
systems.

253
LITERATURE CITED
Blaber SJM, Brewer DT, Harris AN (1994) Distribution, Biomass and Community Structure of Demersal Fishes of the Gulf of Carpentaria, Australia. Aust J Mar Freshw Res 45: 375–396
Cross RE, Curran MC (2000) Effects of feeding pit formation by rays on an intertidal
meiobenthic community. Estuar Coast Shelf S 51:293–298 Du Preez HH, McLachlan A, Marais JFK (1988) Oxygen consumption of two nearshore
marine elasmobranchs, Rhinobatos annulatus (Muller & Henle, 1841) and Myliobatus aquila (Linnaeus, 1758). Comp Biochem Phys B 89A:283–294
Heithaus MR, Frid A, Wirsing AJ, Worm B (2008) Predicting ecological consequences
of marine top predator declines. Trends Ecol Evol 23:202–210 Hopkins TE, Cech JJ, Jr. (1994) Effect of temperature on oxygen consumption of the bat
ray, Myliobatis californica (Chondrichthyes, Myliobatididae). Copeia 1994:529–532
Myers RA, Baum JK, Shepherd TD, Powers SP, Peterson CH (2007) Cascading effects
of the loss of apex predatory sharks from a coastal ocean. Science 315:1846-1850 Peterson CH, Fodrie FJ, Summerson HC, Powers SP (2001) Site-specific and density-
dependent extinction of prey by schooling rays: generation of a population sink in top-quality habitat for bay scallops. Oecologia 129:349–356
Ritchie EG, Johnson CN (2009) Predator interactions, mesopredator release and
biodiversity conservation. Ecol Lett 12:982–998 Russell NR, Fish JD, Wootton RJ (1996) Feeding and growth of juvenile sea bass: the
effect of ration and temperature on growth rate and efficiency. J Fish Biol 49:206–220
Thrush SF, Pridmore RD, Hewitt JE, Cummings VJ (1994) The importance of predators
on a sandflat: interplay between seasonal changes in prey densities and predator effects. Mar Ecol Prog Ser 107:211–222
VanBaricom GR (1982) Experimental analyses of structural regulation in a marine sand
community exposed to oceanic swell. Ecol Monogr 52:283–305 Wurtsbaugh WA, Davis GE (1977) Effects of temperature and ration level on the growth
and food conversion efficiency of Salmo gairdneri, Richardson. J Fish Biol 11:87–98

254
Yahel G, Yahel R, Katz T, Lazar B, Herut B, Tunnicliffe V (2008) Fish activity: a major mechanism for sediment resuspension and organic matter remineralization in coastal marine sediments. Mar Ecol Prog Ser 372:195–209

255
VITA
JEREMY VAUDO September 6, 1978 Born, Harbor City, California 2000 B. A. Creative Studies University of California, Santa Barbara Santa Barbara, California 2004 M. S. Biology California State University, Long Beach Long Beach, California PUBLICATIONS AND PRESENTATIONS Cartamil D, Vaudo J, Lowe CG, Wetherbee B, Holland K (2001) Diel movement patterns
of the Hawaiian stingray (Dasyatis lata) in Kaneohe Bay, Hawaii: Implications for interspecific competition among sympatric elasmobranchs. American Elasmobranch Society, Pennsylvania State University, PA, USA
Cartamil DP, Vaudo JJ, Lowe CG, Wetherbee BM, Holland KN (2003) Diel movement
patterns of the Hawaiian stingray, Dasyatis lata: implications for resource partitioning between sympatric elasmobranch species. Mar Biol 142:841–847
Heithaus MR, Frid A, Vaudo JJ, Worm B, Wirsing AJ (2010) Unraveling the ecological
importance of elasmobranchs. In: Carrier JC, Musick JA, Heithaus MR (Eds), Sharks and Their Relatives II: Biodiversity, Adaptive Physiology, and Conservation. CRC Press, Boca Raton, FL, pp. 607–633
Lowe C, Moss G, Hoisington G, Vaudo J (2001) Rate of barb regeneration and
population size of round stingrays, Urolophus halleri, at Seal Beach, California. Western Society of Naturalists, Ventura, CA, USA
Lowe CG, Anthony K, Bellquist L, Topping D, Vaudo J, Caselle J (2006) Effectiveness
of VR acoustic receivers in monitoring movements of fishes in different marine habitats. 7th International Congress on the Biology of Fish, St. John’s, New Foundland, Canada
Lowe CG, Moss GJ, Hoisington G, Vaudo JJ, Cartamil DP, Marcotte MM,
Papastamatiou YP (2007) Caudal Spine Shedding Periodicity and Site Fidelity of Round Stingrays, Urobatis halleri (Cooper), at Seal Beach, California: Implications for Stingray-related Injury Management. Bull Southern Calif Acad Sci 106:16-26

256
Lowe CG, Moss GJ, Hoisington G, Vaudo JJ, Cartamil DP, Papastamatiou YP, Topping DT, Marcotte MM, Johansson P (2003) Caudal spine replacement rates of the round stingray (Urolophus halleri): implications for public safety. American Elasmobranch Society, Manaus, Brazil
Vaudo JJ, Heithaus MR (2008) Factors Influencing The Abundance Of Sympatric Ray
Species Over A Shallow Sandflat In Shark Bay, Western Australia. American Elasmobranch Society, Montreal, Canada
Vaudo JJ, Heithaus MR (2009) Foraging ecology of a nearshore Australian batoid
community inferred from stable isotopic analysis. American Elasmobranch Society, Portland, OR, USA
Vaudo JJ, Heithaus MR (2009) Spatiotemporal variability in a sandflat elasmobranch
fauna in Shark Bay, Australia. Mar Biol 156:2579–2590 Vaudo JJ, Heithaus MR (2010) The effects of sampling unit and sample size on stable
isotopic community metrics in a batoid community. American Elasmobranch Society, Providence, RI, USA
Vaudo JJ, Heithaus MR (2011) Dietary niche overlap in a nearshore elasmobranch
mesopredator community. Mar Ecol Prog Ser 425:247-260 Vaudo JJ, Heithaus MR (in press) High trophic level consumers: elasmobranchs. In
Wolanski E, McLusky D (Eds), Treatise on Estuarine and Coastal Science. Elsevier Inc.
Vaudo JJ, Lowe CG (2004) Movements and site fidelity of the round stingray, Urobatis
halleri, at Seal Beach, California. American Elasmobranch Society, Norman, OK, USA
Vaudo JJ, Lowe CG (2004) Signal Detection and Range of an Acoustic Receiver Array
used to Monitor Stingrays off Seal Beach, California. American Elasmobranch Society, Norman, OK, USA
Vaudo JJ, Lowe CG (2006) Movement patterns of the round stingray, Urobatis halleri
(Cooper), near a thermal outfall. J Fish Biol 68:1756–1766 Vaudo JJ, Lowe CG, Moss GJ (2003) Round stingray (Urolophus halleri) movements
and site fidelity at Seal Beach, California: a preliminary report. American Elasmobranch Society, Manaus, Brazil
Vaudo JJ, Matich P, Heithaus MR (2010) Mother–offspring isotope fractionation in two
species of placentatrophic sharks. J Fish Biol 77:1724–1727