Modelling the foraging habitat selection of lesser kestrels: conservation implications of European...
12
Modelling the foraging habitat selection of lesser kestrels: conservation implications of European Agricultural Policies Aldina M.A. Franco * , William J. Sutherland Centre for Ecology, Evolution and Conservation, School of Biological Sciences, University of East Anglia, Norwich NR4 7TJ, UK Received 29 May 2003; received in revised form 27 October 2003; accepted 30 January 2004 Abstract Cereal steppe habitat is a low intensive system that is rapidly disappearing as a result of changes in agricultural practices, and has the highest number of bird species with an Unfavourable Conservation Status of any habitat in Europe. A logistic regression model showed that the lesser kestrel, a globally threatened species, prefers to forage close to colonies, selects fields with livestock and avoids tree plantations. The conservation of this species is dependent on maintenance of extensive agriculture characterised by a rotation of cereal and grazed fallow. Abandonment of traditional agriculture and recent changes in agri-environmental programme support, which favour afforestation, are jeopardising the future of cereal steppes. Agri-environment measures are likely to be the most ef- fective means of retaining the specific characteristics of cereal steppe habitat. Ó 2004 Elsevier Ltd. All rights reserved. Keywords: Cereal steppe; Lesser kestrel conservation; Habitat selection; Logistic regression; CAP 1. Introduction Pre-agricultural European landscape consisted of a combination of extensive open areas combined with closed forest (Svenning, 2002). These open areas are the natural habitat for many species that survived or flourish with agricultural practices and their wellbeing is now dependent on the continuation of farming practices such as mowing, stock grazing or scrub clearance (Ausden, 2004). Despite its artificial nature, European farmland supports an important community of open- country species. Pseudosteppes, also known as cereal steppes, are open habitats with scattered trees, flat relief and an av- erage rainfall bellow 700 mm, which historically resulted from various human activities, such as fires, felling woodland and scrub, ploughing and grazing (Su arez et al., 1997; van Dijk, 1991). Extensive cultivation of cereal crops is the main land use; the harvested fields remain uncultivated for one or more years (short- medium fallows) during which they are grazed exten- sively (Moreira, 1999; Su arez et al., 1997). Cereal steppes have the highest number of bird species with an Unfavourable Conservation Status in Europe (Tucker, 1997). Great bustard Otis tarda, little bustard Tetrax tetrax, black-bellied sandgrouse Pterocles orientalis, and lesser kestrel Falco naumanni are all threatened and declining southern European species that are strongly dependent upon cereal steppes. The decline of many of these bird species is associ- ated with land use changes (Mart ınez, 1991; Su arez et al., 1997; Tucker, 1997; Tucker and Heath, 1994; Wolff et al., 2001). In Southern Europe, cereal steppe habitat is a low intensive system that is rapidly changing as a result of changes in agricultural practices. Low intensity management generates low incomes, therefore farmers prefer to change to more profitable * Corresponding author. Present address: School of Biology, Uni- versity of Leeds, Leeds LS2 9JT, UK. Tel.: +0113-343-2842. E-mail address: [email protected] (A.M.A. Franco). 0006-3207/$ - see front matter Ó 2004 Elsevier Ltd. All rights reserved. doi:10.1016/j.biocon.2004.01.026 Biological Conservation 120 (2004) 63–74 www.elsevier.com/locate/biocon BIOLOGICAL CONSERVATION
-
Upload
independent -
Category
Documents
-
view
0 -
download
0
Transcript of Modelling the foraging habitat selection of lesser kestrels: conservation implications of European...

BIOLOGICAL
CONSERVATION
Biological Conservation 120 (2004) 63–74
www.elsevier.com/locate/biocon
Modelling the foraging habitat selection of lesserkestrels: conservation implications of European Agricultural Policies
Aldina M.A. Franco *, William J. Sutherland
Centre for Ecology, Evolution and Conservation, School of Biological Sciences, University of East Anglia,
Norwich NR4 7TJ, UK
Received 29 May 2003; received in revised form 27 October 2003; accepted 30 January 2004
Abstract
Cereal steppe habitat is a low intensive system that is rapidly disappearing as a result of changes in agricultural practices, and has
the highest number of bird species with an Unfavourable Conservation Status of any habitat in Europe. A logistic regression model
showed that the lesser kestrel, a globally threatened species, prefers to forage close to colonies, selects fields with livestock and avoids
tree plantations. The conservation of this species is dependent on maintenance of extensive agriculture characterised by a rotation of
cereal and grazed fallow. Abandonment of traditional agriculture and recent changes in agri-environmental programme support,
which favour afforestation, are jeopardising the future of cereal steppes. Agri-environment measures are likely to be the most ef-
fective means of retaining the specific characteristics of cereal steppe habitat.
� 2004 Elsevier Ltd. All rights reserved.
Keywords: Cereal steppe; Lesser kestrel conservation; Habitat selection; Logistic regression; CAP
1. Introduction
Pre-agricultural European landscape consisted of acombination of extensive open areas combined with
closed forest (Svenning, 2002). These open areas are the
natural habitat for many species that survived or
flourish with agricultural practices and their wellbeing is
now dependent on the continuation of farming practices
such as mowing, stock grazing or scrub clearance
(Ausden, 2004). Despite its artificial nature, European
farmland supports an important community of open-country species.
Pseudosteppes, also known as cereal steppes, are
open habitats with scattered trees, flat relief and an av-
erage rainfall bellow 700 mm, which historically resulted
from various human activities, such as fires, felling
* Corresponding author. Present address: School of Biology, Uni-
versity of Leeds, Leeds LS2 9JT, UK. Tel.: +0113-343-2842.
E-mail address: [email protected] (A.M.A. Franco).
0006-3207/$ - see front matter � 2004 Elsevier Ltd. All rights reserved.
doi:10.1016/j.biocon.2004.01.026
woodland and scrub, ploughing and grazing (Su�arezet al., 1997; van Dijk, 1991). Extensive cultivation of
cereal crops is the main land use; the harvested fieldsremain uncultivated for one or more years (short-
medium fallows) during which they are grazed exten-
sively (Moreira, 1999; Su�arez et al., 1997). Cereal
steppes have the highest number of bird species with an
Unfavourable Conservation Status in Europe (Tucker,
1997). Great bustard Otis tarda, little bustard Tetrax
tetrax, black-bellied sandgrouse Pterocles orientalis, and
lesser kestrel Falco naumanni are all threatened anddeclining southern European species that are strongly
dependent upon cereal steppes.
The decline of many of these bird species is associ-
ated with land use changes (Mart�ınez, 1991; Su�arezet al., 1997; Tucker, 1997; Tucker and Heath, 1994;
Wolff et al., 2001). In Southern Europe, cereal steppe
habitat is a low intensive system that is rapidly
changing as a result of changes in agricultural practices.Low intensity management generates low incomes,
therefore farmers prefer to change to more profitable

64 A.M.A. Franco, W.J. Sutherland / Biological Conservation 120 (2004) 63–74
systems, particularly forestry or irrigated crops, both of
which receive greater support from the European
Common Agriculture Policy of the European Union
(Donald et al., 2002; Pain and Pienkowski, 1997). The
intensification of agriculture has been one of the majorenvironmental problems of recent decades (Donald
et al., 2001; Robinson and Sutherland, 2002) and this is
likely to continue (Tilman et al., 2001).
The negative effects of intensive agriculture and bio-
diversity loss caused the introduction, in 1992, of agri-
environment schemes in which farmers are paid to
modify their farming practices to provide other services,
particularly environmental benefits (Robson, 1997).Agri-environment programmes vary markedly between
countries in Europe and their results for biodiversity
conservation are poorly assessed and not always effec-
tive in promoting biodiversity (Kleijn et al., 2001; Kleijn
and Sutherland, 2003). Effective species conservation
and management requires an understanding of wildlife
habitat requirements. If it is possible to identify the
habitat variables that can be used to classify whetherland is adequate for a species at a regional scale, then it
should be possible to predict how populations would
respond to habitat modifications. This could help wild-
life managers to evaluate future effects of agricultural
changes, and to predict which areas are suitable for the
species and, thus, where conservation measures
and suitable agri-environmental schemes could be
implemented.The lesser kestrel is an excellent target species for
identifying management strategies for wildlife inhabiting
European cereal steppes (Tella et al., 1998). It is one of
the most endangered birds in Europe (Heredia et al.,
1996) and is a Globally Threatened Species classified as
Vulnerable (Stattersfield and Capper, 2000). In Europe
the lesser kestrel has a Mediterranean range and its
populations have shown a rapid and major declineacross much of its breeding range (Tucker and Heath,
1994). Studies examining both landscape features
around the colonies (Bustamante, 1997; Parr et al.,
1995) and habitat selection through radio tracking
procedures (Donazar et al., 1993; Tella et al., 1998)
suggested that the recent decline of breeding populations
has been mainly caused by agricultural changes affecting
their foraging behaviour.The lesser kestrels require high densities of avail-
able and suitable prey (Biber, 1996). They feed mainly
on invertebrates, particularly large Orthoptera and
Coleoptera (Choisy et al., 1999; Cramp and Simmons,
1990; Lepley et al., 2000), small mammals and lizards
are taken infrequently (Franco and Andrada, 1976).
The reduction in both the extent and quality of for-
aging habitat in its Western Palearctic breedinggrounds appears to have been a primary cause of
lesser kestrel decline (Peet and Gallo-Orsi, 2000). This
species winters in Southern Africa, where habitat loss
is also though to be a primary cause of population
declines (Pepler, 1999).
The causes of the decline were analysed in detail for
the species action plan (Biber, 1996; Heredia et al., 1996;
Peet and Gallo-Orsi, 2000). However, causes of declinecan differ from one area to the next. In Andalucia
(Spain), several studies indicate that neither loss of nest
sites (Forero et al., 1996) nor pesticide pollution (Negro
et al., 1993) were causes of lesser kestrel decline. How-
ever, the reduction in the extent of suitable foraging
habitat (natural pastures and fallow lands) during recent
decades (Donazar et al., 1993) could explain the decline
of the species at a local scale in the Guadalquivir RiverBasin. It is important to know if such changes in land
use are also responsible for the decline of the lesser
kestrel at a regional scale.
The shortage of suitable nesting sites is another sug-
gested cause of lesser kestrel decline (Peet and Gallo-
Orsi, 2000). This species is dependent upon buildings
with undisturbed crevices, such as disused farm build-
ings, old churches or castles (Cramp and Simmons,1990). Such sites are likely to be restricted due to lack of
buildings with suitable cavities. To overcome this
problem conservation bodies are trying to improve ex-
isting colonies and establish new colonies in purpose
built structures. Therefore, knowing lesser kestrels’
preferred foraging areas is critical for deciding where to
improve and create colonies.
Statistical models are commonly used to examinespecies-habitat relationships; these models generally
correlate the location of a species with selected abiotic
and biotic habitat traits by either comparing sites where
the species is present with those where it is absent, or by
relating abundance to habitat variables. For presence/
absence surveys, logistic regression is the most com-
monly used statistical model (Augustin et al., 1996;
Brito et al., 1996; Bustamante, 1997; Franco et al., 2000;Hinsley et al., 1995; Luck, 2002; Osborne and Tigar,
1992). These models are mostly applied to explain the
habitat use of species, but they can also generate pre-
dictions about probability of occurrence in different
habitat types and some researchers have used logistic
regression to predict the distribution of a species across
landscapes (Austin et al., 1996; Franco et al., 2000;
Mladenoff et al., 1999).In order to predict the effects of habitat modifica-
tions on lesser kestrel populations at a regional scale,
we studied the habitat selection of foraging lesser
kestrels in the South of Portugal. In 1999, the study
region was classified in two Special Protection Areas
(SPA) under the European Birds Directive (79/409/
EEC), but management plans have yet to be con-
cluded. Currently the main force causing land usechanges stems from the decisions of individual farm-
ers’ that are based on the provision of European
subsidies and Council management plans. One of the
A.M.A. Franco, W.J. Sutherland / Biological Conservation 120 (2004) 63–74 65
study sites, the Castro Verde region, has a specific
agri-environment scheme to encourage maintenance of
traditional extensive agriculture (Castro Verde Zonal
Programme), but the Rural Development Program in
Portugal also supports the afforestation of agriculturalareas (DGDR, 1999), so farmers select the scheme
that gives them the highest economic benefit. This
strategy is not possible inside the Castro Verde council
that prepared a management plan defining areas for
agriculture and for tree plantations.
The aims of this study were firstly to identify which
habitat variables are associated with lesser kestrel oc-
currence at a regional scale; secondly, to produce mapsof the probability of occurrence of lesser kestrels based
on models of habitat suitability using Geographic In-
formation Systems (GIS). These maps identify the areas
where agriculture should be compatible with lesser kes-
trel conservation, and should therefore, be useful for the
development of the SPAs’ management plans; thirdly, to
predict the effect of Common Agricultural Policy on
extensive agriculture by the use of different supportscenarios.
2. Methods
2.1. Study area
The study area is located in the South of Portugal,Baixo-Alentejo (41�700N, 6�000E) and includes two vil-
lages, Castro Verde and M�ertola. It is divided into three
sub-areas (Pardieiro – 45 km2, Belver – 87 km2 and
M�ertola – 52 km2), each holds one of the three largest
lesser kestrel colonies in Portugal. In total 75% of the
Portuguese population was surveyed. Pardieiro and
Belver have similar habitat composition, with more than
80% of the area consisting of a mixed extensively man-aged rotational system of grassland, cereal, fodder crops
and grazed fallow land. The remaining habitat is open
evergreen forest dominated by holm-oak Quercus ro-
tundifolia, pine plantations from 1997, small areas of
introduced Eucalyptus trees, shrubby vegetation, and
orchards. The area around Belver and Pardieiro ranges
from 110 to 250 m above sea level. The third area
(M�ertola) includes the only urban colony in Portugal. Inthis area, many (50%) of the traditional agricultural
areas were abandoned or replaced by pine plantations
(17%), leaving only 30% of the area extensively farmed.
Altitude ranges from 10 to 220 m. The three sub-areas
are classified as a Meso-mediterranean bioclimatic stage
(Rivas-Mart�ınez, 1981).
2.2. Field methods
The area was scanned uniformly along driven
transects and from observation posts at high vantage
points, which is considered a suitable method for
lesser kestrel detection and habitat use (Franco et al.,
in press). The same number of transect counts was
carried out in each sub-area to assure uniform sam-
pling, twice a week. Transect counts were carried outalong a standard route in each area but starting at
different points and alternating directions and were
not performed during poor weather conditions (Bibby
et al., 1992; Gibbons et al., 1996). The open habitat
and gentle slope of the area assured uniform sampling.
Most pine plantations were from 1997, the pines with
approximately 1.5 m still allowed good visibility in
these areas. However, lesser kestrel detection mighthave been reduced in areas with open evergreen forest
dominated by holm-oak trees, which is a limitation of
this method. Data on foraging birds were collected
from 25 March to 15 July 2001. Each foraging flock
or isolated lesser kestrel detected was plotted on 1:25
000 maps.
2.3. Variable treatment
The study areas were divided into squares of
500� 500 m Universal Transverse of Mercator grid that
were classified according to each of the 25 independent
variables used for model construction (Table 1). Land
use was digitised and georeferenced from aerial photo-
graphs (1:40 000) taken in 1995, using ARCVIEW, and
confirmed by field data.Dry land agriculture systems were classified with
the Braun–Blanquet vegetation scale: (0) absent or
present in less than 1% of the square; (1) present in 1–
5% of the square; (2) 6–25% of the square; (3) 26–50%
of the square; (4) 51–75% of the square or (5) 76–
100% of the square. Soil suitability for agriculture was
classified from 1 (good) to 6 (poor) according to soil
maps for agricultural use (S.O.R.A, 1962). Variablesthat consider nearest distance were categorised in
classes of 500 m.
Presence/absence and distance variables were con-
sidered separately to allow the measurement of two
different effects: occurrence of a certain characteristic
and distance to it. A dummy variable was included to
allow for the possible effect of the three sub-areas in the
analysis. The co-ordinates of the squares were also in-cluded to examine location autocorrelation.
In total, there were 209 squares with lesser kestrel
observations and 526 with absences. We defined a bi-
nary dichotomous response variable of 0 if lesser kestrels
were absent from the square and 1 if lesser kestrels were
present. For the multinomial analysis we used abun-
dance data from all transect counts, and the response
variable had four categories: 0 (if lesser kestrels wereabsent), 1 (1–5 birds were located in the square), 2 (6–10
birds) and 3 (more than 10 birds).
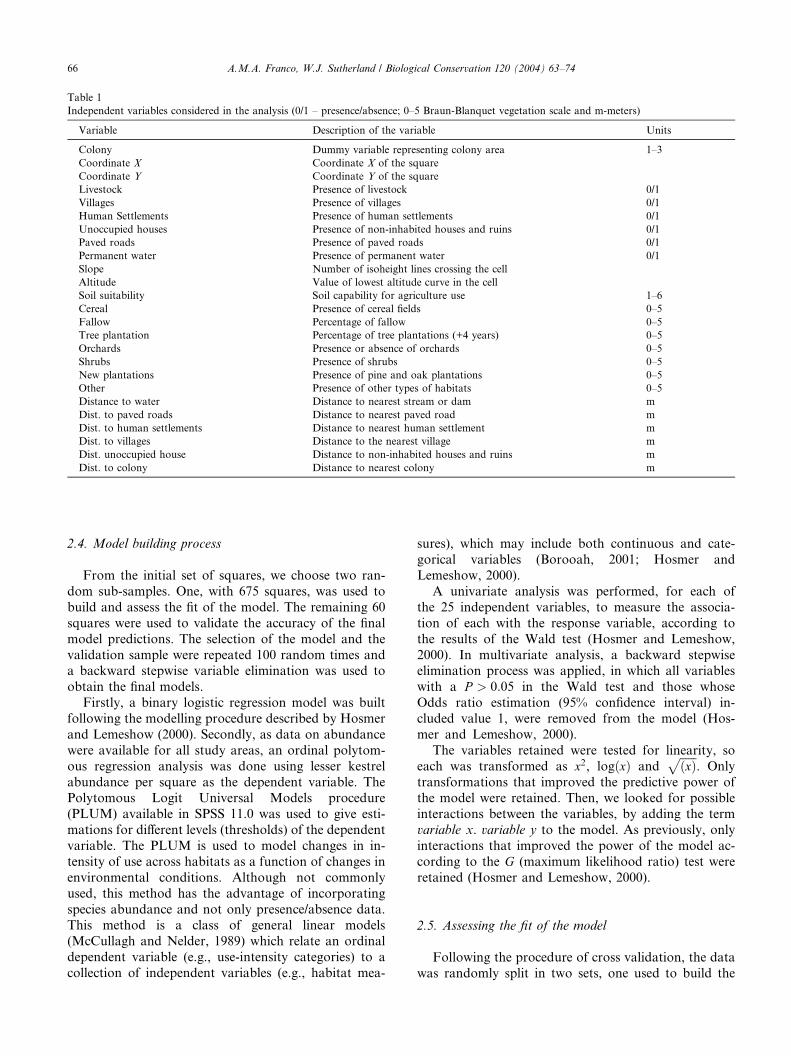
Table 1
Independent variables considered in the analysis (0/1 – presence/absence; 0–5 Braun-Blanquet vegetation scale and m-meters)
Variable Description of the variable Units
Colony Dummy variable representing colony area 1–3
Coordinate X Coordinate X of the square
Coordinate Y Coordinate Y of the square
Livestock Presence of livestock 0/1
Villages Presence of villages 0/1
Human Settlements Presence of human settlements 0/1
Unoccupied houses Presence of non-inhabited houses and ruins 0/1
Paved roads Presence of paved roads 0/1
Permanent water Presence of permanent water 0/1
Slope Number of isoheight lines crossing the cell
Altitude Value of lowest altitude curve in the cell
Soil suitability Soil capability for agriculture use 1–6
Cereal Presence of cereal fields 0–5
Fallow Percentage of fallow 0–5
Tree plantation Percentage of tree plantations (+4 years) 0–5
Orchards Presence or absence of orchards 0–5
Shrubs Presence of shrubs 0–5
New plantations Presence of pine and oak plantations 0–5
Other Presence of other types of habitats 0–5
Distance to water Distance to nearest stream or dam m
Dist. to paved roads Distance to nearest paved road m
Dist. to human settlements Distance to nearest human settlement m
Dist. to villages Distance to the nearest village m
Dist. unoccupied house Distance to non-inhabited houses and ruins m
Dist. to colony Distance to nearest colony m
66 A.M.A. Franco, W.J. Sutherland / Biological Conservation 120 (2004) 63–74
2.4. Model building process
From the initial set of squares, we choose two ran-
dom sub-samples. One, with 675 squares, was used to
build and assess the fit of the model. The remaining 60
squares were used to validate the accuracy of the final
model predictions. The selection of the model and the
validation sample were repeated 100 random times anda backward stepwise variable elimination was used to
obtain the final models.
Firstly, a binary logistic regression model was built
following the modelling procedure described by Hosmer
and Lemeshow (2000). Secondly, as data on abundance
were available for all study areas, an ordinal polytom-
ous regression analysis was done using lesser kestrel
abundance per square as the dependent variable. ThePolytomous Logit Universal Models procedure
(PLUM) available in SPSS 11.0 was used to give esti-
mations for different levels (thresholds) of the dependent
variable. The PLUM is used to model changes in in-
tensity of use across habitats as a function of changes in
environmental conditions. Although not commonly
used, this method has the advantage of incorporating
species abundance and not only presence/absence data.This method is a class of general linear models
(McCullagh and Nelder, 1989) which relate an ordinal
dependent variable (e.g., use-intensity categories) to a
collection of independent variables (e.g., habitat mea-
sures), which may include both continuous and cate-
gorical variables (Borooah, 2001; Hosmer and
Lemeshow, 2000).
A univariate analysis was performed, for each of
the 25 independent variables, to measure the associa-
tion of each with the response variable, according to
the results of the Wald test (Hosmer and Lemeshow,
2000). In multivariate analysis, a backward stepwiseelimination process was applied, in which all variables
with a P > 0:05 in the Wald test and those whose
Odds ratio estimation (95% confidence interval) in-
cluded value 1, were removed from the model (Hos-
mer and Lemeshow, 2000).
The variables retained were tested for linearity, so
each was transformed as x2, logðxÞ andffiffiffiffiffiffiðxÞ
p. Only
transformations that improved the predictive power ofthe model were retained. Then, we looked for possible
interactions between the variables, by adding the term
variable x. variable y to the model. As previously, only
interactions that improved the power of the model ac-
cording to the G (maximum likelihood ratio) test were
retained (Hosmer and Lemeshow, 2000).
2.5. Assessing the fit of the model
Following the procedure of cross validation, the data
was randomly split in two sets, one used to build the

A.M.A. Franco, W.J. Sutherland / Biological Conservation 120 (2004) 63–74 67
model and the other (10%) to assess the prediction error.
This process was repeated 100 times and the most fre-
quent of the 100 models generated was evaluated with
diagnostic statistics and goodness-of-fit tests. Thus, the
Pearson v2 was used resembling the presence/absenceregression approach (Hosmer and Lemeshow, 2000).
The prediction accuracy was assessed from the overall
correct classification ((CNi +CA)/TC), where TC is the
total sample of squares in the test, CNi represents the
correct number of individuals, and CA the correct ab-
sences. To choose the best model we also used the
Pearson v2 statistic and the classification table.
Models were obtained using a GIS package ARC-VIEW that allowed the combination of several layers
corresponding to the variables of the model. The final
output was a map with the probability of occurrence of
lesser kestrels throughout the study area. A final layer
was added allowing visualisation of points showing
species presence.
3. Results
3.1. Univariate analysis
Table 2 shows the results of the univariate analysis,
for the variables with P values less or equal to 0.05 in the
Wald test. Fig. 1 shows the relationship between
the percentage of presences and absences for some of thesignificant variables. This graph and the coefficient signs
of the univariate analysis show that lesser kestrels prefer
to forage close to the colony and to unoccupied build-
ings; they prefer good quality soils and fields with live-
stock, but avoid shrubs and tree plantations. Lesser
kestrels prefer to forage away from human settlements
and on shallow slopes.
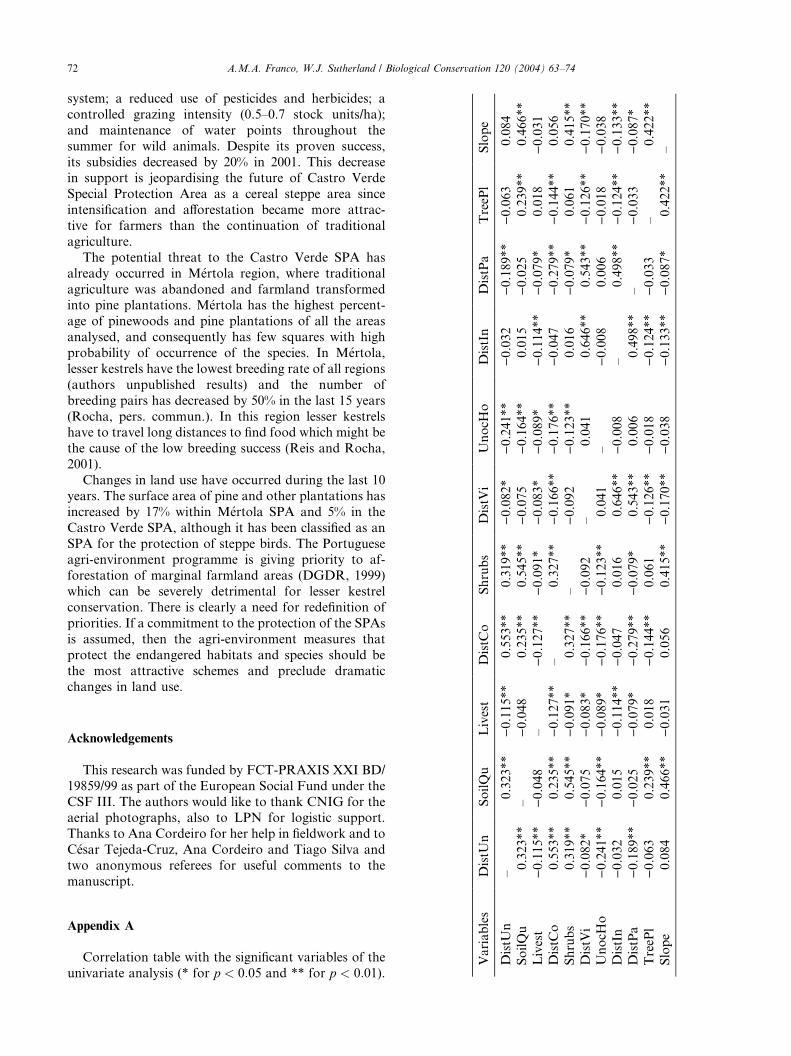
A correlation table was built to look for significantcorrelations between the independent variables (Ap-
pendix A). Although there were several variables with
Table 2
Variables with significant differences (P value <0.05) in the univariate analy
Variable Code
Distance to unoccupied buildings DistUn
Soil suitability for agriculture SoilQu
Presence of livestock Livest
Distance to the colony DistCo
Shrubs Shrubs
Distance to villages DistVi
Unoccupied houses UnocHo
Distance to inhabited houses DistIn
Distance to paved roads DistPa
Tree plantations TreePl
Slope Slope
significant correlations, the values of the correlation
coefficients (jrsj < 0:65) indicate that there are no
strong associations between the variables. Therefore,
all these variables were included in the multivariate
analysis.
3.2. Multivariate analysis
In the binary approach (presence/absence), the most
frequent model represented 51 out of 100 built models
(Fig. 2). The ordinal multinomial approach produced
two models with similar frequencies (Fig. 2), model 1
was the most frequent in the binary approach and had3 variables: distance to the colony, livestock and tree
plantations. The second model had 5 variables, three
in common with model 1 and two new variables,
presence of paved roads and distance to human set-
tlements. The variables retained were transformed and
the linearity tested, but no transformation or interac-
tion significantly improved the power of the model.
All significant variables were included in the models(Table 3), showing that lesser kestrels preferred to
forage close to the colony, in fields with livestock and
without tree plantations; they avoided human settle-
ments but preferred locations with paved roads. The
small values of the coefficients and standard errors
indicate that the independent variables are not highly
correlated (Hosmer and Lemeshow, 2000).
3.3. Assessing the fit of the model
In order to select the best model, we used the classi-
fication tables, the G test for the fitted models and the
Pearson v2 of both model and validation samples for the
most frequent models. Table 4 presents the correct
classifications for the models and validation samples,
and the Pearson v2 for each of the models. Both modelsclassify absence better than presence and describe the
sis
Relationship P value
Negative <0.001
Negative <0.001
Positive <0.001
Negative <0.001
Negative 0.001
Positive 0.002
Positive 0.005
Positive 0.006
Positive 0.008
Negative 0.017
Negative 0.042

distance to unoccupied buildings (km)54321
50
40
30
20
10
0
soil suitability for agriculture987654321
60
45
30
15
0
distance to the colony (km)
654321
60
45
30
15
0
presence of livestock
10
100
80
60
40
20
0
presence of shrubs
543210
80
60
40
20
0
distance to paved roads (km)
54321
50
40
30
20
10
0
% o
f sq
uare
s
distance to villages (km)
54321
30
20
10
0
distance to inhabited buildings
54321
40
30
20
10
0
Fig. 1. Plot of the first eight variables that were significant in the univariate analysis. The continuous line represents the percentage of squares the
lesser kestrels used; the dashed line represents the percentage of squares without observations.
68 A.M.A. Franco, W.J. Sutherland / Biological Conservation 120 (2004) 63–74
data well (model 1 v20:05;671 > 672:37 and model 2
v20:05;669 > 665:01).In the validation sample, model 1 was better at
classifying correct squares: 78% of the squares were
correctly classified (Table 4); nevertheless, there was
no significant difference between the correct classifi-
cation rates of the two models (v22 ¼ 0:03, n.s.). The
two models are similar, but model 1 (with the vari-
ables distance to the colony, livestock and tree plan-
tations) has fewer variables and is the most frequent
model using the presence/absence data, so was selected
as the best model.

0
10
20
30
40
50
60
10 20 30 40 50 60 70 80 90 100
model 1
model 2
model 3
model 4
model 5
0
5
10
15
20
25
30
35
10 20 30 40 50 60 70 80 90 100
model 1
model 2
model 3
model 4
model 5
freq
uenc
y of
the
mod
el
random models generated
(a)
(b)
Fig. 2. Frequency of the models generated in the 100 random built
models. (a) represents the most frequent binary (presence/absence)
models and (b) the most frequent multinomial models.
A.M.A. Franco, W.J. Sutherland / Biological Conservation 120 (2004) 63–74 69
Having selected the best model, it was necessary todecide which of the 33 models obtained, with the same
variables but slightly different coefficients, was to be
used to build the probability of occurrence map.
Therefore, we calculated the mean sum of squares for
the coefficients of all models and selected the one that
Table 3
Coefficients (b), standard errors (S.E.), significance (P ) and odds ratio for eac
test results
Variable Model 1
b S.E. P Odds
Threshold (y ¼ 0) )1.701 0.279 <0.001
Threshold (y ¼ 1) 0.222 0.277 0.412
Threshold (y ¼ 2) 1.426 0.329 <0.001
Livestock 0.760 0.207 <0.001 2.14
Distance to the colony )0.587 0.058 <0.001 0.56
Tree plantations )0.458 0.110 <0.001 0.63
Paved roads
Dist. inhabited houses
G test 144.2� (df 3)
� Independent variables significantly improve the model adjustment.
had the least square differences (thresholds: y ¼ 0, 1.701;
y ¼ 1;�0:222; y ¼ 2;�1:426 and coefficients: 0.76�livestock)0.587� distance to the colony )0.458� tree
plantations). In Fig. 3, we present the mapped proba-
bility of occurrence according to the above model,overlaid with the data from field observations.
4. Discussion
4.1. Selection of the best model
From the 100 models generated we selected themost frequent as the best model. The analysis of the
most frequent model is especially important because it
shows that if only one model is generated, a less
frequent model could have been incorrectly selected.
The selected model was the most frequent model, both
in the binary and multinomial logistic regression, re-
inforcing the results. The main advantage of using
ordinal multinomial logistic regression is its ability toestablish a relative measure of use-intensity, providing
a finer analysis of habitat variables (North and Rey-
nolds, 1996).
Both model and validation samples are well adjusted
to the data. However, the application of the current
model is probably limited to the area where the model
was generated, or areas with similar habitat conditions.
The model was built with data from three study sites(180 km2) within a region of approximately 800 km2
characterised by extensive cultivation of cereal. A large
part of this area consists of two SPAs, therefore the
model is especially useful for providing conservation
recommendations, regarding lesser kestrels, for imple-
mentation in the SPAs’ management plans. However, to
obtain a more general predictive model, it is necessary to
extend this research to other regions.
h variable of the two most frequent ordinal multinomial models and G
Model 2
ratio b S.E. P Odds ratio
)0.969 0.391 0.013
0.949 0.396 0.017
2.141 0.437 <0.001
0.868 0.211 <0.001 2.38
)0.572 0.060 <0.001 0.56
)0.440 0.113 <0.001 0.64
0.429 0.219 0.050 0.65
0.199 0.088 0.024 0.81
147.3� (df 5)

Fig. 3. Probability of occurrence of lesser kestrels in the study areas, according to the final model, in each square of 500 · 500 m.
Table 4
Correct classification rates of the two models analysed for both model and validation sample
Cells correctly classified Model 1 Model 2
Model sample (n ¼ 675) Validation sample (n ¼ 60) Model sample (n ¼ 675) Validation sample (n ¼ 60)
As y ¼ 0 0.94 0.93 0.95 0.98
As y ¼ 1 0.23 0.36 0.26 0.25
As y ¼ 2 0 0 0 0
As y ¼ 3 0 0 0 0
Overall 0.72 0.78 0.74 0.73
v2 672.37 (df 671) 40.82 (df 56) 665.01 (df 669) 68.66 (df 54)
The dependent variable y is 0 for absences, 1 for cells with 1–5 lesser kestrels, 2 for cells with 6–10 and 3 for more than 10 lesser kestrels. v2 is thePearson v2 value for the model adjustment.
70 A.M.A. Franco, W.J. Sutherland / Biological Conservation 120 (2004) 63–74

A.M.A. Franco, W.J. Sutherland / Biological Conservation 120 (2004) 63–74 71
When comparing two models, it is important to be
aware of the conservation implications that might come
from the selection of one. It is only meaningful, in
terms of species conservation, to include in the model
variables that have biological meaning. Furthermore,models with fewer variables have smaller standard er-
rors and become less dependent of observed data
(Hosmer and Lemeshow, 2000). The selected model
includes livestock, tree plantations and distance to the
colony. The second best model obtained includes these
three variables and two other variables, presence of
roads and human settlements. The selection of paved
roads is unlikely to be a product of bias because thetransect counts and the observations from high vantage
points allowed all the study areas to be surveyed ho-
mogeneously. The likely explanation for this is the as-
sociation of roads with presence of electrical pylons
that give good perching sites for lesser kestrels, but
since perching sites were not otherwise examined, it was
better not to include this variable in the model. The
avoidance of human settlements shown in the secondmodel was expected because the Portuguese colonies
are associated with uninhabited buildings (but the
Spanish populations frequently nest in town centres).
The selected model does not include these variables
and, being very general, can probably be extrapolated
to other areas with similar habitat conditions.
4.2. Foraging habitat selection
The selected model predicts well the species’ distri-
bution in the study areas, with most lesser kestrel ob-
servations located in squares predicted to have high
probability of occurrence. The lesser kestrel distribu-
tion is negatively related to distance to the colonies,
showing that lesser kestrels remain closer to them than
expected from a random distribution. Pine tree plan-tations are avoided presumably because foraging is not
possible. Livestock is positively selected, which might
be related to livestock raising maintaining the vegeta-
tion of fallows at a height that allows higher foraging
success (Toland, 1987). Many invertebrates are associ-
ated with the grazing animals (Ausden and Treweek,
1995), which may also explain why the lesser kestrels
prefer these areas. Grazed habitat was also importantto other species like Short-toed lark Calandrella
brachydactyla and Calandra lark Melanocorypha cal-
andra (Moreira, 1999).
Livestock and more specifically grazing intensity is
one of the major controllable factors influencing vege-
tation height and density in fallows. Habitat structure
seemed to be important through its effect on prey
availability. Moreira (1999) showed that vegetationheight, presence of shrubs and extent of bare ground
differentially influenced the densities of different bird
species in the same area. In the study areas, the main
method used is rotational grazing which is especially
beneficial for invertebrates because it creates a patch-
work of different swards (Ausden and Treweek, 1995).
From an agricultural management perspective, these
factors can be controlled in order to promote goodforaging habitat for lesser kestrels.
The results of this study indicate that lesser kestrels
are dependent upon sympathetic management of
farmland. Traditional agriculture with its typical 4-
year rotation is very extensive both in grazing and in
crop management and has resulted in a historical
landscape worthy of conservation for its importance
for many endangered species. Therefore, abandon-ment, intensification, or afforestation can all be serious
threats.
4.3. Effects of European agricultural policies
The majority of European lesser kestrel populations
are presently dependent on agricultural systems, which
have been subjected to significant changes driven byEuropean agricultural policies. Such changes have
been causing the decline of the lesser kestrel (Donazar
et al., 1993) and are likely to continue so it is very
important to predict the effect of different agricultural
policies.
If EU cereal support decreases (the abandonment
scenario) cereal fields and stubbles are likely to be
replaced by pastures and fallow land. Therefore, foodavailability during the chick-rearing period is likely to
be reduced. Nevertheless, an increase in stock density
would lead to changes in vegetation structure, reduced
vegetation height, and greater areas of bare ground
that could benefit lesser kestrels through an increase in
prey availability. However, this could be detrimental
to some other steppe bird species, especially great
bustard, little bustard and corn bunting (Delgado andMoreira, 2000). The most dramatic consequence of the
abandonment scenario is the replacement of cereal
steppes by either scrub or tree plantations. In the in-
tensification scenario, there would be loss of fallow
land and its transformation to other crops (e.g., sun-
flowers), these other crops involve intensive chemical
treatments against arthropods, which would influence
negatively the lesser kestrel, as well as the littlebustard and corn bunting (Delgado and Moreira,
2000).
To overcome abandonment or intensification, agri-
environment schemes are potentially one of the most
effective means of conservation. The Castro Verde
zonal programme, created under the scope of agri-
environmental measures in 1995, is a good example of
how extensive agricultural practices can be effectivefor protecting and increasing endangered bird popu-
lations (Borralho et al., 1999). This programme pro-
motes, among other measures, the traditional rotation
DistC
oShrubs
DistV
iUnocH
oDistIn
DistPa
TreeP
lSlope
*0.553**
0.319**
)0.082*
)0.241**
)0.032
)0.189**
)0.063
0.084
0.235**
0.545**
)0.075
)0.164**
0.015
)0.025
0.239**
0.466**
)0.127**
)0.091*
)0.083*
)0.089*
)0.114**
)0.079*
0.018
)0.031
*–
0.327**
)0.166**
)0.176**
)0.047
)0.279**
)0.144**
0.056
0.327**
–)0.092
)0.123**
0.016
)0.079*
0.061
0.415**
)0.166**
)0.092
–0.041
0.646**
0.543**
)0.126**
)0.170**
)0.176**
)0.123**
0.041
–)0.008
0.006
)0.018
)0.038
*)0.047
0.016
0.646**
)0.008
–0.498**
)0.124**
)0.133**
)0.279**
)0.079*
0.543**
0.006
0.498**
–)0.033
)0.087*
)0.144**
0.061
)0.126**
)0.018
)0.124**
)0.033
–0.422**
0.056
0.415**
)0.170**
)0.038
)0.133**
)0.087*
0.422**
–
72 A.M.A. Franco, W.J. Sutherland / Biological Conservation 120 (2004) 63–74
system; a reduced use of pesticides and herbicides; a
controlled grazing intensity (0.5–0.7 stock units/ha);
and maintenance of water points throughout the
summer for wild animals. Despite its proven success,
its subsidies decreased by 20% in 2001. This decreasein support is jeopardising the future of Castro Verde
Special Protection Area as a cereal steppe area since
intensification and afforestation became more attrac-
tive for farmers than the continuation of traditional
agriculture.
The potential threat to the Castro Verde SPA has
already occurred in M�ertola region, where traditional
agriculture was abandoned and farmland transformedinto pine plantations. M�ertola has the highest percent-
age of pinewoods and pine plantations of all the areas
analysed, and consequently has few squares with high
probability of occurrence of the species. In M�ertola,lesser kestrels have the lowest breeding rate of all regions
(authors unpublished results) and the number of
breeding pairs has decreased by 50% in the last 15 years
(Rocha, pers. commun.). In this region lesser kestrelshave to travel long distances to find food which might be
the cause of the low breeding success (Reis and Rocha,
2001).
Changes in land use have occurred during the last 10
years. The surface area of pine and other plantations has
increased by 17% within M�ertola SPA and 5% in the
Castro Verde SPA, although it has been classified as an
SPA for the protection of steppe birds. The Portugueseagri-environment programme is giving priority to af-
forestation of marginal farmland areas (DGDR, 1999)
which can be severely detrimental for lesser kestrel
conservation. There is clearly a need for redefinition of
priorities. If a commitment to the protection of the SPAs
is assumed, then the agri-environment measures that
protect the endangered habitats and species should be
the most attractive schemes and preclude dramaticchanges in land use.
DistU
nSoilQu
Livest
–0.323**
)0.115*
0.323**
–)0.048
)0.115**
)0.048
–
0.553**
0.235**
)0.127*
0.319**
0.545**
)0.091*
)0.082*
)0.075
)0.083*
)0.241**
)0.164**
)0.089*
)0.032
0.015
)0.114*
)0.189**
)0.025
)0.079*
)0.063
0.239**
0.018
0.084
0.466**
)0.031
Acknowledgements
This research was funded by FCT-PRAXIS XXI BD/
19859/99 as part of the European Social Fund under the
CSF III. The authors would like to thank CNIG for theaerial photographs, also to LPN for logistic support.
Thanks to Ana Cordeiro for her help in fieldwork and to
C�esar Tejeda-Cruz, Ana Cordeiro and Tiago Silva and
two anonymous referees for useful comments to the
manuscript.
Variables
DistU
n
SoilQu
Livest
DistC
o
Shrubs
DistV
iUnocH
o
DistIn
DistPa
TreeP
l
Slope
Appendix A
Correlation table with the significant variables of the
univariate analysis (* for p < 0:05 and ** for p < 0:01).

A.M.A. Franco, W.J. Sutherland / Biological Conservation 120 (2004) 63–74 73
References
Augustin, N.H., Mugglestone, M.A., Buckland, S.T., 1996. An
autologistic model for the spatial distribution of wildlife. Journal
of Applied Ecology 33, 339–347.
Ausden, M., 2004. Habitat management. In: Sutherland, W.J., Green,
R.E., Newton, I. (Eds.), Bird Ecology and Conservation: A
Handbook of Techniques. Oxford University Press, Oxford.
Ausden, M., Treweek, J., 1995. Grasslands. In: Sutherland, W.J., Hill,
D.A. (Eds.), Managing Habitats for Conservation. Cambridge
University Press, Cambridge, pp. 179–229.
Austin, G.E., Thomas, C.J., Houston, D.C., Thompson, D.B.A., 1996.
Predicting the spatial distribution of buzzard Buteo buteo nesting
areas using a geographical information system and remote sensing.
Journal of Applied Ecology 33, 1541–1550.
Bibby, C., Burgess, N., Hill, D., 1992. Bird Census Techniques.
Academic Press, London.
Biber, J.-P., 1996. International Action Plan for the Lesser Kestrel
(Falco naumanni). BirdLife International, Cambridge.
Borooah, V.K., 2001. Logit and Probit: Ordered and Multinomial
Models. In: Sage University Paper Series on Quantitative Appli-
cations in the Social Sciences, 07–138. Sage, London, Thousand
Oaks, CA.
Borralho, R., Rio Carvalho, C., Stoate, C., Ara�ujo, M., Reino, L.M.,
1999. Avaliac�~ao interm�edia do impacte do Plano Zonal de Castro
Verde na avifauna. II Congresso de Ornitologia da Sociedade
Portuguesa para o Estudo das Aves. SPEA, Faro, pp. 58–61.
Brito, J.C., Abreu, F.B.E., Paulo, O.S., Rosa, H.D., Crespo, E.G.,
1996. Distribution of Schreiber’s green lizard (Lacerta schreiberi) in
Portugal: a predictive model. Herpetological Journal 6, 43–47.
Bustamante, J., 1997. Predictive models for lesser kestrel Falco
naumanni distribution, abundance and extinction in southern
Spain. Biological Conservation 80, 153–160.
Choisy, M., Conteau, C., Lepley, M., Manceau, N., Yau, G., 1999.
R�egime et comportement alimentaires du faucon cr�ecerellette Falco
naumanni en Crau en p�eriode pr�enuptiale. Alauda 67, 51–60.
Cramp, S., Simmons, K.E.L., 1990. The birds of the Western Paleartic.
Oxford University Press, Oxford.
Delgado, A., Moreira, F., 2000. Bird assemblages of an Iberian cereal
steppe. Agriculture Ecosystems & Environment 78, 65–76.
DGDR, 1999. Plano de Desenvolvimento Rural 2000-06. In: Direcc�~aoGeral de Desenvolvimento Rural, Lisboa.
Donald, P.F., Green, R.E., Heath, M.F., 2001. Agricultural intensi-
fication and the collapse of Europe’s farmland bird populations.
Proceedings of the Royal Society of London Series B – Biological
Sciences 268, 25–29.
Donald, P.F., Pisano, G., Rayment, M.D., Pain, D.J., 2002. The
Common Agricultural policy, EU enlargement and the conserva-
tion of Europe’s farmland birds. Agriculture Ecosystems &
Environment 89, 167–182.
Donazar, J.A., Negro, J.J., Hiraldo, F., 1993. Foraging habitat
selection, land-use changes and population decline in the Lesser
Kestrel Falco naumanni. Journal of Applied Ecology 30, 515–522.
Forero, M.G., Tella, J.L., Donazar, J.A., Hiraldo, F., 1996. Can
interspecific competition and nest site availability explain the
decrease of lesser kestrel Falco naumanni populations? Biological
Conservation 78, 289–293.
Franco, A., Andrada, J., 1976. Alimentaci�on y selecci�on de presa en
Falco naumanni. Ardeola 23, 137–187.
Franco, A.M.A., Brito, J.C., Almeida, J., 2000. Modelling habitat
selection of Common Cranes Grus grus wintering in Portugal using
multiple logistic regression. Ibis 142, 351–358.
Franco, A.M.A., Catry, I., Sutherland, W.J., Palmeirim, J., in press.
Do different habitat preference methods produce the same
conservation recommendations for lesser kestrels? Animal
Conservation.
Gibbons, D.W., Hill, D., Sutherland, W.J., 1996. Birds. In: Suther-
land, W.J. (Ed.), Ecological Census Techniques. Cambridge
University Press, Cambridge.
Heredia, B., Rose, L., Painter, M., 1996. Globally Threatened Birds in
Europe: Action Plans. Council of Europe, France.
Hinsley, S.A., Bellamy, P.E., Newton, I., Sparks, T.H., 1995. Habitat
and landscape factors influencing the presence of individual
breeding bird species in woodland fragments. Journal of Avian
Biology 26, 94–104.
Hosmer, D.W., Lemeshow, S., 2000. Applied Logistic Regression.
Wiley, New York.
Kleijn, D., Berendse, F., Smit, R., Gilissen, N., 2001. Agri-environ-
ment schemes do not effectively protect biodiversity in Dutch
agricultural landscapes. Nature 413, 723–725.
Kleijn, D., Sutherland, W.J., 2003. How effective are agri-environment
schemes in conserving and promoting biodiversity? Journal of
Applied Ecology 40, 947–969.
Lepley, M., Brun, L., Foucart, A., Pilard, P., 2000. R�egime et
comportement alimentaires du faucon cr�ecerellette Falco naumanni
en Crau en p�eriode de reproduction et post-reproduction. Alauda
68, 177–184.
Luck, G.W., 2002. The habitat requirements of the rufous treecreeper
(Climacteris rufa). 1. Preferential habitat use demonstrated at
multiple spatial scales. Biological Conservation 105, 383–394.
Mart�ınez, C., 1991. Patterns of distribution and habitat selection of a
great bustard (Otis tarda) population in north-western Spain.
Ardeola 38, 137–147.
McCullagh, P., Nelder, J.A., 1989. Generalised linear models. Mono-
graphs on statistics and applied probability. Chapman & Hall,
London.
Mladenoff, D.J., Sickley, T.A., Wydeven, A.P., 1999. Predicting gray
wolf landscape recolonization: logistic regression models vs. new
field data. Ecological Applications 9, 37–44.
Moreira, F., 1999. Relationships between vegetation structure and
breeding bird densities in fallow cereal steppes in Castro Verde,
Portugal. Bird Study 46, 309–318.
Negro, J.J., Donazar, J.A., Hiraldo, F., Hernandez, L.M., Fernandez,
M.A., 1993. Organochlorine and heavy-metal contamination in
nonviable eggs and its relation to breeding success in a Spanish
population of lesser kestrels (Falco naumanni). Environmental
Pollution 82, 201–205.
North, M.P., Reynolds, J.H., 1996. Microhabitat analysis using
radiotelemetry locations and polytomous logistic regression. Jour-
nal of Wildlife Management 60, 639–653.
Osborne, P.E., Tigar, B.J., 1992. Interpreting bird atlas data using
logistic-models: an example from Lesotho, Southern Africa.
Journal of Applied Ecology 29, 55–62.
Pain, D.J., Pienkowski, M.W., 1997. Farming and Birds in Europe:
The Common Agricultural Policy and its Implications for Bird
Conservation. Academic Press, London.
Parr, S., Collin, P., Silk, S., Wilbraham, J., Williams, N.P., Yarar, M.,
1995. A base-line survey of lesser kestrels Falco naumanni in
Central Turkey. Biological Conservation 72, 45–53.
Peet, N.B., Gallo-Orsi, U., 2000. Action plan for the lesser kestrel
Falco naumanni. Council of Europe and BirdLife International,
Cambridge.
Pepler, D., 1999. The lesser kestrel. In: Barnes, K. (Ed.), Threatened
birds of South Africa, Lesotho and Swaziland. BirdLife South
Africa, Johannesburg.
Reis, S., Rocha, P.N.A., 2001. Home-range, reproduction and habitat
selection of radio-tagged lesser kestrel (Falco naumanni) in M�ertola
(Portugal). In: 4th Eurasian Congress on Raptors. Estaci�onBiol�ogica de Do~nana, Seville, pp. 155.
Rivas-Mart�ınez, S., 1981. Les �etages bioclimatiques de la v�eg�etation de
la Peninsule Ib�erique. Annales del Jardim Botanico de Madrid 37,
251–268.

74 A.M.A. Franco, W.J. Sutherland / Biological Conservation 120 (2004) 63–74
Robinson, R.A., Sutherland, W.J., 2002. Post-war changes in arable
farming and biodiversity in Great Britain. Journal of Applied
Ecology 39, 157–176.
Robson, N., 1997. The evolution of the Common Agricultural policy
and the incorporation of environmental considerations. In: Press,
A. (Ed.), The Common Agricultural Policy and its Implications for
Bird Conservation, San Diego, pp. 43–78.
S.O.R.A., 1962. Carta de Capacidade de Uso do Solo. In: Secretaria de
Estado da Agricultura, Lisboa.
Stattersfield, A.J., Capper, D.R., 2000. Threatened Birds of the World.
Lynx Editions, Spain.
Su�arez, F., Naveso, M.A., De Juana, E., 1997. Farming in the drylands
of Spain: birds of the pseudosteppes. In: Pain, D.J., Peinkowski,
M.W. (Eds.), Farming and Birds in Europe: The Common
Agricultural Policy and Its Implications for Bird Conservation.
Academic Press, London.
Svenning, J.C., 2002. A review of natural vegetation openness in north-
western Europe. Biological Conservation 104, 133–148.
Tella, J.L., Forero, M.G., Hiraldo, F., Donazar, J.A., 1998. Conflicts
between lesser kestrel conservation and European agricultural
policies as identified by habitat use analyses. Conservation Biology
12, 593–604.
Tilman, D., Fargione, J., Wolff, B., D’Antonio, C., Dobson, A.,
Howarth, R., Schindler, D., Schlesinger, W.H., Simberloff, D.,
Swackhamer, D., 2001. Forecasting agriculturally driven global
environmental change. Science 292, 281–284.
Toland, B.R., 1987. The effect of vegetative cover on foraging
strategies, hunting success and nesting distribution of American
kestrels in Central Missouri. Journal of Raptor Research 21,
14–20.
Tucker, G., 1997. Priorities for bird conservation in Europe: the
importance of the farmed landscape. In: Pain, D.J., Peinkowski,
M.W. (Eds.), Farming and Birds in Europe: The Common
Agricultural Policy and its Implications for Bird Conservation.
Academic Press, London, pp. 79–116.
Tucker, G.M., Heath, M.F., 1994. Birds in Europe: Their Conserva-
tion Status. BirdLife International, Cambridge.
van Dijk, G., 1991. The status of semi-natural grasslands in Europe.
The conservation of lowland dry grassland birds in Europe.
Joint Nature Conservation Committee, Reading, MA. pp.
15–37.
Wolff, A., Paul, J.P., Martin, J.L., Bretagnolle, V., 2001. The benefits
of extensive agriculture to birds: the case of the little bustard.
Journal of Applied Ecology 38, 963–975.