Mortality from tobacco in developed countries: indirect estimation from national vital statistics
11
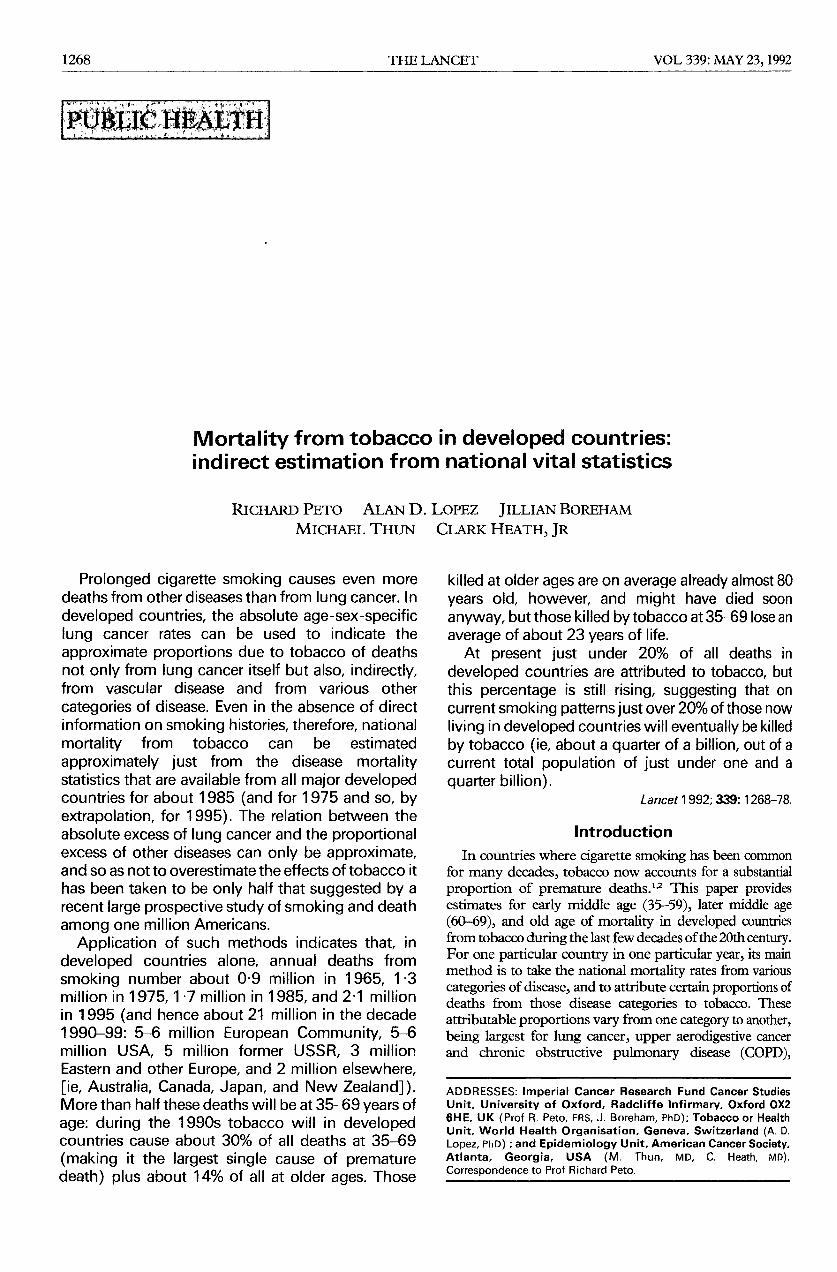
1268 PUBLIC HEALTH Mortality from tobacco in developed countries: indirect estimation from national vital statistics Prolonged cigarette smoking causes even more deaths from other diseases than from lung cancer. In developed countries, the absolute age-sex-specific lung cancer rates can be used to indicate the approximate proportions due to tobacco of deaths not only from lung cancer itself but also, indirectly, from vascular disease and from various other categories of disease. Even in the absence of direct information on smoking histories, therefore, national mortality from tobacco can be estimated approximately just from the disease mortality statistics that are available from all major developed countries for about 1985 (and for 1975 and so, by extrapolation, for 1995). The relation between the absolute excess of lung cancer and the proportional excess of other diseases can only be approximate, and so as not to overestimate the effects of tobacco it has been taken to be only half that suggested by a recent large prospective study of smoking and death among one million Americans. Application of such methods indicates that, in developed countries alone, annual deaths from smoking number about 0·9 million in 1965, 1·3 million in 1975, 1·7 million in 1985, and 2·1 million in 1995 (and hence about 21 million in the decade 1990-99: 5-6 million European Community, 5-6 million USA, 5 million former USSR, 3 million Eastern and other Europe, and 2 million elsewhere, [ie, Australia, Canada, Japan, and New Zealand]). More than half these deaths will be at 35-69 years of age: during the 1990s tobacco will in developed countries cause about 30% of all deaths at 35-69 (making it the largest single cause of premature death) plus about 14% of all at older ages. Those killed at older ages are on average already almost 80 years old, however, and might have died soon anyway, but those killed by tobacco at 35-69 lose an average of about 23 years of life. At present just under 20% of all deaths in developed countries are attributed to tobacco, but this percentage is still rising, suggesting that on current smoking patterns just over 20% of those now living in developed countries will eventually be killed by tobacco (ie, about a quarter of a billion, out of a current total population of just under one and a quarter billion). Introduction In countries where cigarette smoking has been common for many decades, tobacco now accounts for a substantial proportion of premature deaths.12 This paper provides estimates for early middle age (35-59), later middle age (60-69), and old age of mortality in developed countries from tobacco during the last few decades of the 20th century. For one particular country in one particular year, its main method is to take the national mortality rates from various categories of disease, and to attribute certain proportions of deaths from those disease categories to tobacco. These attributable proportions vary from one category to another, being largest for lung cancer, upper aerodigestive cancer and chronic obstructive pulmonary disease (COPD), ADDRESSES: Imperial Cancer Research Fund Cancer Studies Unit, University of Oxford, Radcliffe Infirmary, Oxford OX2 6HE, UK (Prof R. Peto, FRS, J. Boreham, PhD); Tobacco or Health Unit, World Health Organisation, Geneva, Switzerland (A. D. Lopez, PhD) ; and Epidemiology Unit, American Cancer Society, Atlanta, Georgia, USA (M. Thun, MD, C. Heath, MD). Correspondence to Prof Richard Peto.
-
Upload
independent -
Category
Documents
-
view
4 -
download
0
Transcript of Mortality from tobacco in developed countries: indirect estimation from national vital statistics
1268
PUBLIC HEALTH
Mortality from tobacco in developed countries:indirect estimation from national vital statistics
Prolonged cigarette smoking causes even moredeaths from other diseases than from lung cancer. Indeveloped countries, the absolute age-sex-specificlung cancer rates can be used to indicate the
approximate proportions due to tobacco of deathsnot only from lung cancer itself but also, indirectly,from vascular disease and from various other
categories of disease. Even in the absence of directinformation on smoking histories, therefore, nationalmortality from tobacco can be estimated
approximately just from the disease mortalitystatistics that are available from all major developedcountries for about 1985 (and for 1975 and so, byextrapolation, for 1995). The relation between theabsolute excess of lung cancer and the proportionalexcess of other diseases can only be approximate,and so as not to overestimate the effects of tobacco ithas been taken to be only half that suggested by arecent large prospective study of smoking and deathamong one million Americans.
Application of such methods indicates that, in
developed countries alone, annual deaths from
smoking number about 0·9 million in 1965, 1·3million in 1975, 1·7 million in 1985, and 2·1 millionin 1995 (and hence about 21 million in the decade1990-99: 5-6 million European Community, 5-6million USA, 5 million former USSR, 3 millionEastern and other Europe, and 2 million elsewhere,[ie, Australia, Canada, Japan, and New Zealand]).More than half these deaths will be at 35-69 years of
age: during the 1990s tobacco will in developedcountries cause about 30% of all deaths at 35-69
(making it the largest single cause of prematuredeath) plus about 14% of all at older ages. Those
killed at older ages are on average already almost 80years old, however, and might have died soonanyway, but those killed by tobacco at 35-69 lose anaverage of about 23 years of life.At present just under 20% of all deaths in
developed countries are attributed to tobacco, butthis percentage is still rising, suggesting that oncurrent smoking patterns just over 20% of those nowliving in developed countries will eventually be killedby tobacco (ie, about a quarter of a billion, out of acurrent total population of just under one and aquarter billion).
Introduction
In countries where cigarette smoking has been commonfor many decades, tobacco now accounts for a substantialproportion of premature deaths.12 This paper providesestimates for early middle age (35-59), later middle age(60-69), and old age of mortality in developed countriesfrom tobacco during the last few decades of the 20th century.For one particular country in one particular year, its mainmethod is to take the national mortality rates from variouscategories of disease, and to attribute certain proportions ofdeaths from those disease categories to tobacco. Theseattributable proportions vary from one category to another,being largest for lung cancer, upper aerodigestive cancerand chronic obstructive pulmonary disease (COPD),
ADDRESSES: Imperial Cancer Research Fund Cancer StudiesUnit, University of Oxford, Radcliffe Infirmary, Oxford OX26HE, UK (Prof R. Peto, FRS, J. Boreham, PhD); Tobacco or HealthUnit, World Health Organisation, Geneva, Switzerland (A. D.Lopez, PhD) ; and Epidemiology Unit, American Cancer Society,Atlanta, Georgia, USA (M. Thun, MD, C. Heath, MD).Correspondence to Prof Richard Peto.
1269
intermediate for vascular disease, and zero for cirrhosis,accidents, and violence. They also vary with age, sex, andcountry, being largest in populations where lung cancer iscommon.
For most developed countries large, nationallyrepresentative studies of smoking and mortality are not yetavailable to provide tobacco-attributable proportions for themain causes of death. Here, these proportions are thereforeestimated indirectly, based partly on a large recent
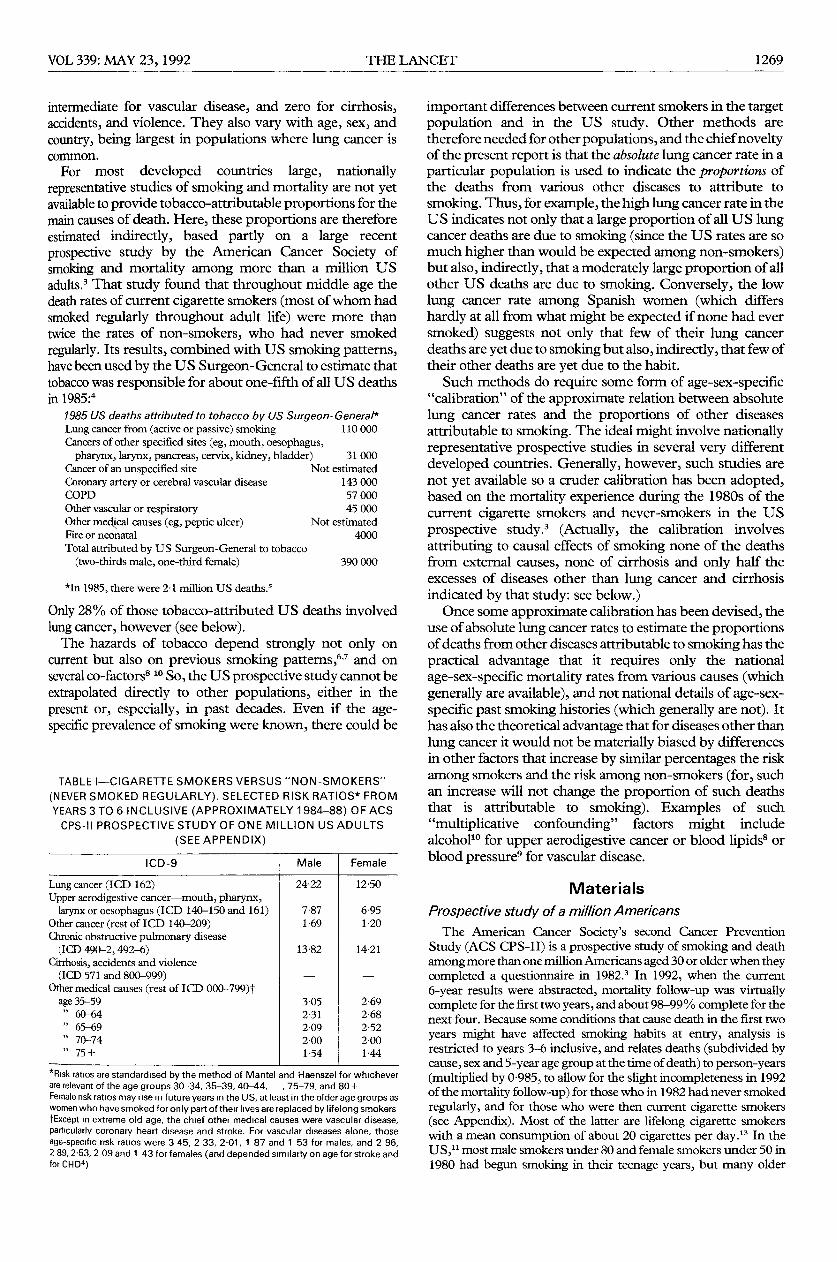
prospective study by the American Cancer Society ofsmoking and mortality among more than a million USadults.3 That study found that throughout middle age thedeath rates of current cigarette smokers (most of whom hadsmoked regularly throughout adult life) were more thantwice the rates of non-smokers, who had never smokedregularly. Its results, combined with US smoking patterns,have been used by the US Surgeon-General to estimate thattobacco was responsible for about one-fifth of all US deathsin 1985:4
1985 US deaths attributed to tobacco by US Surgeon-General*Lung cancer from (active or passive) smoking 110000
Cancers of other specified sites (eg, mouth, oesophagus,pharynx, larynx, pancreas, cervix, kidney, bladder) 31000
Cancer of an unspecified site Not estimated
Coronary artery or cerebral vascular disease 143000COPD 57 000Other vascular or respiratory 45 000Other medical causes (eg, peptic ulcer) Not estimatedFire or neonatal 4000Total attributed by US Surgeon-General to tobacco
(two-thirds male, one-third female) 390000
*In 1985, there were 21 million US deaths.s
Only 28% of those tobacco-attributed US deaths involvedlung cancer, however (see below).The hazards of tobacco depend strongly not only on
current but also on previous smoking patterns,6,7 and onseveral co-factors8-lO So, the US prospective study cannot beextrapolated directly to other populations, either in thepresent or, especially, in past decades. Even if the age-specific prevalence of smoking were known, there could be
TABLE I-CIGARETTE SMOKERS VERSUS "NON-SMOKERS"
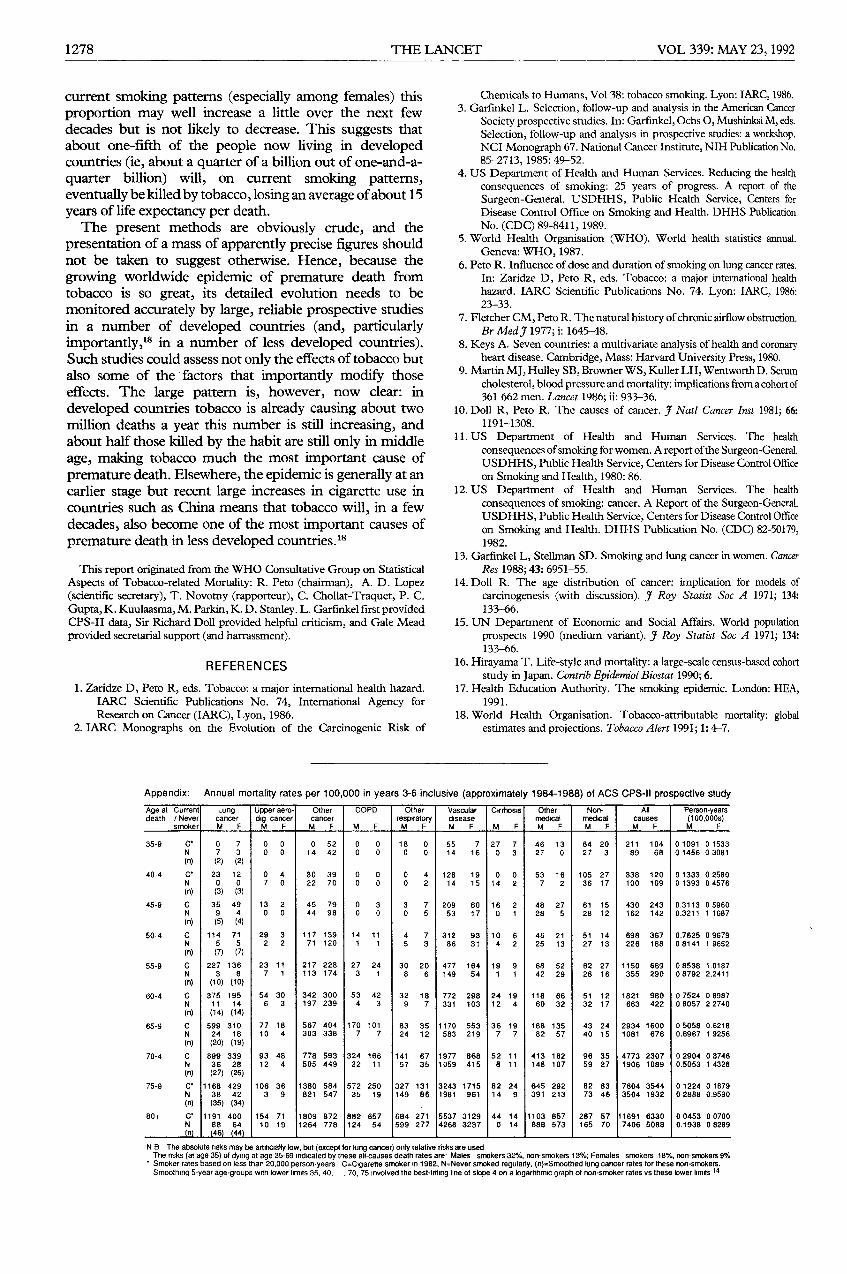
(NEVER SMOKED REGULARLY). SELECTED RISK RATIOS* FROMYEARS 3 TO 6 INCLUSIVE (APPROXIMATELY 1984-88) OF ACSCPS-II PROSPECTIVE STUDY OF ONE MILLION US ADULTS
(SEE APPENDIX)
*Risk ratios are standardised by the method of Mantel and Haenszel for whicheverare relevant of the age groups 30-34, 35-39, 40-44, , 75-79, and 80+Female risk ratios may rise in future years in the US, at least in the older age groups aswomen who have smoked for only part of their lives are replaced by lifelong smokers†Except in extreme old age, the chief other medical causes were vascular disease,particularly coronary heart disease and stroke. For vascular diseases alone, thoseage-specific risk ratios were 3 45, 2 33, 2·01, 1 87 and 1 53 for males, and 2 96,2 89, 2·53, 2 09 and 1 43 for females (and depended similarly on age for stroke andfor CHD4)
important differences between current smokers in the targetpopulation and in the US study. Other methods aretherefore needed for other populations, and the chief noveltyof the present report is that the absolute lung cancer rate in aparticular population is used to indicate the proportions ofthe deaths from various other diseases to attribute to
smoking. Thus, for example, the high lung cancer rate in theUS indicates not only that a large proportion of all US lungcancer deaths are due to smoking (since the US rates are somuch higher than would be expected among non-smokers)but also, indirectly, that a moderately large proportion of allother US deaths are due to smoking. Conversely, the lowlung cancer rate among Spanish women (which differshardly at all from what might be expected if none had eversmoked) suggests not only that few of their lung cancerdeaths are yet due to smoking but also, indirectly, that few oftheir other deaths are yet due to the habit.
Such methods do require some form of age-sex-specific"calibration" of the approximate relation between absolutelung cancer rates and the proportions of other diseasesattributable to smoking. The ideal might involve nationallyrepresentative prospective studies in several very differentdeveloped countries. Generally, however, such studies arenot yet available so a cruder calibration has been adopted,based on the mortality experience during the 1980s of thecurrent cigarette smokers and never-smokers in the USprospective study.3 (Actually, the calibration involves
attributing to causal effects of smoking none of the deathsfrom external causes, none of cirrhosis and only half theexcesses of diseases other than lung cancer and cirrhosisindicated by that study: see below.)Once some approximate calibration has been devised, the
use of absolute lung cancer rates to estimate the proportionsof deaths from other diseases attributable to smoking has thepractical advantage that it requires only the national
age-sex-specific mortality rates from various causes (whichgenerally are available), and not national details of age-sex-specific past smoking histories (which generally are not). Ithas also the theoretical advantage that for diseases other thanlung cancer it would not be materially biased by differencesin other factors that increase by similar percentages the riskamong smokers and the risk among non-smokers (for, suchan increase will not change the proportion of such deathsthat is attributable to smoking). Examples of such
"multiplicative confounding" factors might includealcohol" for upper aerodigestive cancer or blood lipids8 orblood pressure9 for vascular disease.
Materials
Prospective study of a million AmericansThe American Cancer Society’s second Cancer Prevention
Study (ACS CPS-11) is a prospective study of smoking and deathamong more than one million Americans aged 30 or older when theycompleted a questionnaire in 1982.3 In 1992, when the current6-year results were abstracted, mortality follow-up was virtuallycomplete for the first two years, and about 98-99 % complete for thenext four. Because some conditions that cause death in the first two
years might have affected smoking habits at entry, analysis is
restricted to years 3-6 inclusive, and relates deaths (subdivided bycause, sex and 5-year age group at the time of death) to person-years(multiplied by 0-985, to allow for the slight incompleteness in 1992of the mortality follow-up) for those who in 1982 had never smokedregularly, and for those who were then current cigarette smokers(see Appendix). Most of the latter are lifelong cigarette smokerswith a mean consumption of about 20 cigarettes per day." In theUS," most male smokers under 80 and female smokers under 50 in1980 had begun smoking in their teenage years, but many older
1270
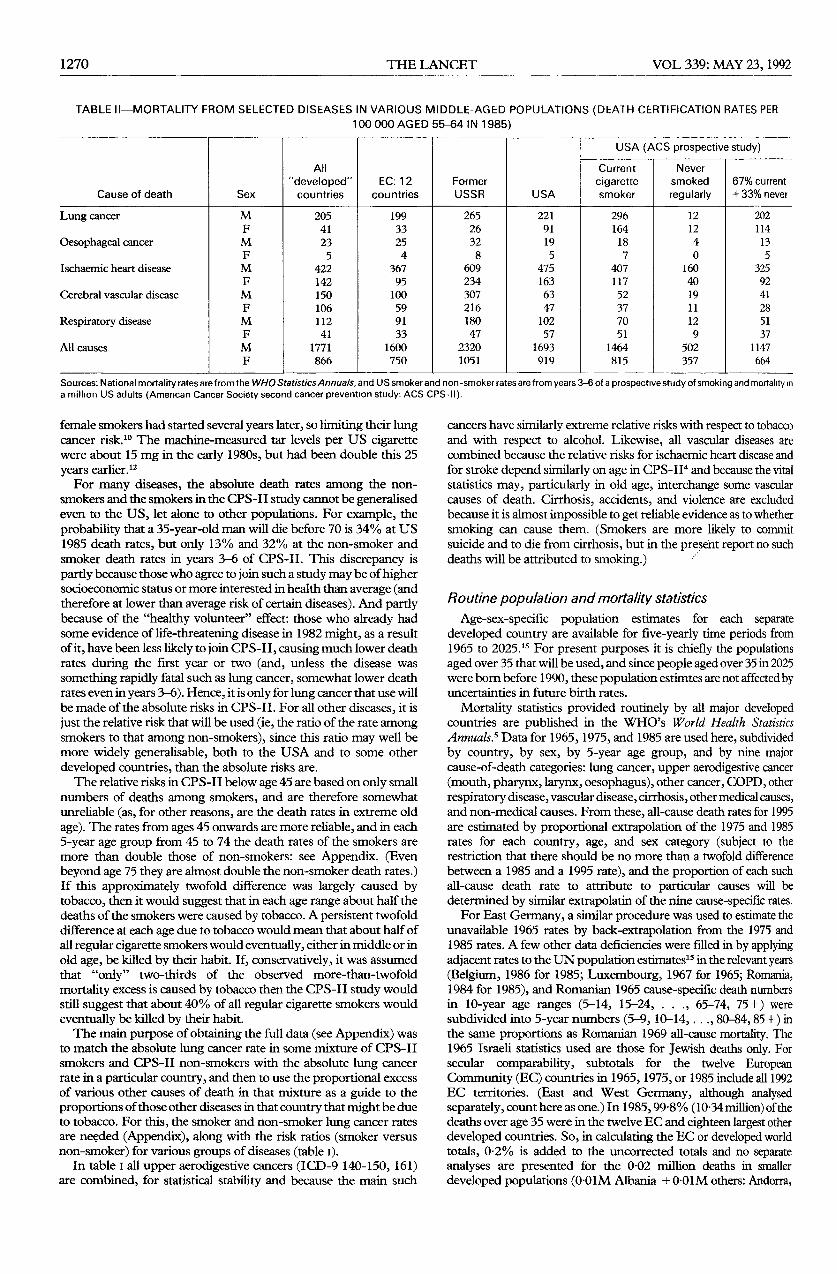
TABLE II-MORTALITY FROM SELECTED DISEASES IN VARIOUS MIDDLE-AGED POPULATIONS (DEATH CERTIFICATION RATES PER100 000 AGED 55-64 IN 1985)
1 1 1 1 1 1 -
Sources: National mortality rates are from the WHO Statistics Annuals, and US smoker and non-smoker rates are from years 3-6 of a prospective study of smoking and mortality ma million US adults (American Cancer Society second cancer prevention study: ACS CPS-11).
female smokers had started several years later, so limiting their lungcancer risk." The machine-measured tar levels per US cigarettewere about 15 mg in the early 1980s, but had been double this 25years earlier PFor many diseases, the absolute death rates among the non-
smokers and the smokers in the CPS-II study cannot be generalisedeven to the US, let alone to other populations. For example, theprobability that a 35-year-old man will die before 70 is 34% at US1985 death rates, but only 13% and 32% at the non-smoker andsmoker death rates in years 3-6 of CPS-11. This discrepancy ispartly because those who agree to join such a study may be of highersocioeconomic status or more interested in health than average (andtherefore at lower than average risk of certain diseases). And partlybecause of the "healthy volunteer" effect: those who already hadsome evidence of life-threatening disease in 1982 might, as a resultof it, have been less likely to join CPS-II, causing much lower deathrates during the first year or two (and, unless the disease wassomething rapidly fatal such as lung cancer, somewhat lower deathrates even in years 3-6). Hence, it is only for lung cancer that use willbe made of the absolute risks in CPS-11. For all other diseases, it isjust the relative risk that will be used (ie, the ratio of the rate amongsmokers to that among non-smokers), since this ratio may well bemore widely generalisable, both to the USA and to some otherdeveloped countries, than the absolute risks are.The relative risks in CPS-11 below age 45 are based on only small
numbers of deaths among smokers, and are therefore somewhatunreliable (as, for other reasons, are the death rates in extreme oldage). The rates from ages 45 onwards are more reliable, and in each5-year age group from 45 to 74 the death rates of the smokers aremore than double those of non-smokers: see Appendix. (Evenbeyond age 75 they are ahnost double the non-smoker death rates.)If this approximately twofold difference was largely caused bytobacco, then it would suggest that in each age range about half thedeaths of the smokers were caused by tobacco. A persistent twofolddifference at each age due to tobacco would mean that about half ofall regular cigarette smokers would eventually, either in middle or inold age, be killed by their habit. If, conservatively, it was assumedthat "only" two-thirds of the observed more-than-twofold
mortality excess is caused by tobacco then the CPS-11 study wouldstill suggest that about 40% of all regular cigarette smokers wouldeventually be killed by their habit.The main purpose of obtaining the full data (see Appendix) was
to match the absolute lung cancer rate in some mixture of CPS-IIsmokers and CPS-II non-smokers with the absolute lung cancerrate in a particular country, and then to use the proportional excessof various other causes of death in that mixture as a guide to theproportions of those other diseases in that country that might be dueto tobacco. For this, the smoker and non-smoker lung cancer ratesare needed (Appendix), along with the risk ratios (smoker versusnon-smoker) for various groups of diseases (table i).
In table I all upper aerodigestive cancers (ICD-9 140-150, 161)are combined, for statistical stability and because the main such
cancers have similarly extreme relative risks with respect to tobaccoand with respect to alcohol. Likewise, all vascular diseases arecombined because the relative risks for ischaemic heart disease andfor stroke depend similarly on age in CPS-II4 and because the vitalstatistics may, particularly in old age, interchange some vascularcauses of death. Cirrhosis, accidents, and violence are excludedbecause it is almost impossible to get reliable evidence as to whethersmoking can cause them. (Smokers are more likely to commitsuicide and to die from cirrhosis, but in the preserit report no suchdeaths will be attributed to smoking.)
Routine population and mortality statisticsAge-sex-specific population estimates for each separate
developed country are available for five-yearly time periods from1965 to 2025.15 For present purposes it is chiefly the populationsaged over 35 that will be used, and since people aged over 35 in 2025were bom before 1990, these population estimtes are not affected byuncertainties in future birth rates.
Mortality statistics provided routinely by all major developedcountries are published in the WHO’s World Health StatisticsAnnuals.5 Data for 1965, 1975, and 1985 are used here, subdividedby country, by sex, by 5-year age group, and by nine majorcause-of-death categories: lung cancer, upper aerodigestive cancer(mouth, pharynx, larynx, oesophagus), other cancer, COPD, otherrespiratory disease, vascular disease, cirrhosis, other medical causes,and non-medical causes. From these, all-cause death rates for 1995are estimated by proportional extrapolation of the 1975 and 1985rates for each country, age, and sex category (subject to therestriction that there should be no more than a twofold differencebetween a 1985 and a 1995 rate), and the proportion of each suchall-cause death rate to attribute to particular causes will bedetermined by similar extrapolatin of the nine cause-specific rates.For East Germany, a similar procedure was used to estimate the
unavailable 1965 rates by back-extrapolation from the 1975 and1985 rates. A few other data deficiencies were filled in by applyingadjacent rates to the UN population estimates15 in the relevant years(Belgium, 1986 for 1985; Luxembourg, 1967 for 1965; Romania,1984 for 1985), and Romanian 1965 cause-specific death numbersin 10-year age ranges (5-14, 15-24, ..., 65-74, 75+) weresubdivided into 5-year numbers (5-9, 10-14,..., 80-84, 85 +) inthe same proportions as Romanian 1969 all-cause mortality. The1965 Israeli statistics used are those for Jewish deaths only. Forsecular comparability, subtotals for the twelve EuropeanCommunity (EC) countries in 1965, 1975, or 1985 include all 1992EC territories. (East and West Germany, although analysedseparately, count here as one.) In 1985, 99.8 % (10’34 million) of thedeaths over age 35 were in the twelve EC and eighteen largest otherdeveloped countries. So, in calculating the EC or developed worldtotals, 0-2% is added to the uncorrected totals and no separateanalyses are presented for the 0-02 million deaths in smallerdeveloped populations (OO1M Albania + 0 01M others: Andorra,
1271
Channel Is, Faeroes, Gibraltar, Greenland, Iceland, Isle of Man,Lichtenstein, Malta, Monaco, San Marino, Vatican City).
Methods
In estimating the overall scale of the epidemic of death fromtobacco in developed countries, there is a range of uncertaintybetween the lower limits and the upper limits of what is scientificallyplausible, and the present report tends to base its calculations chieflyon the lower limits. The uncertainty derives not so much from themillion deaths each year from lung cancer, upper aerodigestivecancer, and COPD (the great majority of which can, with only anarrow range of uncertainty, be attributed to tobacco), but from thenine or ten million other deaths each year in developed countries(another million of which may, albeit with a wider range oruncertainty, also be attributed to tobacco). Vascular diseases-chiefly coronary heart disease (CHD) and stroke-account for morethan half these other deaths, and the CPS-11 study suggests that, atleast in North America, tobacco is associated with more deaths fromvascular disease than from lung cancer. But, whereas virtually all theexcess risk of lung cancer that is associated with smoking in the US(Appendix) is actually causedlO by the habit, this may not be true forvascular disease: part of the association (table i) may well be due toother differences between US smokers and US non-smokers.
Alternatively, if some cardioprotective factor (alcohol use, perhaps)is more common among smokers than among non-smokers then thereal cardiotoxicity of tobacco might be underestimated by table I.Hence, even within the CPS-II prospective study itself there issome uncertainty as to what fraction of the vascular mortalityamong smokers is actually caused by smoking.
Further uncertainties are added when extrapolating from CPS-11 Ito other populations, since even though for lung cancer mortalitythe absolute rates attributable to smoking in two populations may beequally high, that does not guarantee that for vascular mortality theporportions attributable to smoking in the two populations must beexactly equal to each other. For example (table 11), lung cancermortality just among the middle-aged male smokers in CPS-11 isabout the same as among all middle-aged males in the USSR, andvascular mortality among the middle-aged male smokers in CPS-11 Iis about 200% higher than in the corresponding non-smokers.Possibly, therefore, vascular mortality among middle-aged USSRmales as a whole is also about 200% higher than if none had eversmoked. Perhaps, however, once due allowance has been made forconfounding and for the problems of extrapolation from onepopulation to another, this excess percentage in the USSR might beonly 100%, not 200% (ie, perhaps only about half, not two-thirds,of the male vascular deaths in middle age are attributable to
tobacco).
Conservative underestimation of tobacco hazards
The present report subdivides the diseases that cause death into afew broad categories, and is then conservative in determining whatproportions to attribute to tobacco. Conservatively, deaths fromexternal causes (including fires, suicides, and accidents), neonataldeaths (including stillbirths), all other deaths under 35 years, and alldeaths from cirrhosis of the liver will not be attributed to tobacco,even though some of these deaths are due to smoking. Lung canceris dealt with by comparison of the absolute rates in each countrywith those among US non-smokers. The remaining six diseasecategories (upper aerodigestive cancer, other cancer, COPD, otherpulmonary disease, vascular disease and other medical causes) aredealt with by calculating (on an age-specific basis) the excesspercentages suggested indirectly by the national lung cancer rates,and then simply halving each excess percentage, in the hope ofobtaining a conservative estimate of the proportions of such deathsto attribute to tobacco (see Discussion).
In populations with high tobacco-attributable mortality fromupper aerodigestive cancer or from COPD, halving the largepercentage excess makes little difference. For example, whether theexcess is 400% or whether it is 800%, the large majority (either 4/5or 8/9, in this example) of all such deaths will still be attributed totobacco. But where only a minority of the deaths are attributable totobacco, halving the percentage excess will almost halve the numberattributed to tobacco.
Halving the percentage excess is crude and arbitrary, andalthough it provides a reasonable degree of protection againstoverestimation of the epidemic, it does so at the risk of somewhatunderestimating the hazards. The degree of underestimation willnot be great, however (since the possibility of confounding doeshave to be allowed for, particularly in diseases where the excessamong smokers is only moderate-and the halving has a substantialeffect only in these circumstances). Indeed, for the United Statesitself in 1985 the "conservative" procedures of the present report(by analyses only of national mortality rates) will be found toattribute to tobacco almost exactly the same number of deaths as theUS Surgeon-General did by combination of national mortalityrates with additional data on the prevalence of smoking in the US.Details of the conservative procedure are summarised below.
Ignore deaths under age 35-Most deaths from tobacco are inmiddle or old age and, conservatively, attention will be restricted tothese. Neonatal deaths, and all other deaths from tobacco before age35, will therefore be ignored.
Ignore cirrhosis and non-medical causes--Cirrhosis iscommoner among smokers than among non-smokers, as is suicide,but it is difficult to assess how much, if any, of these excesses toattribute to smoking. Deaths from cirrhosis (ICD-9 571) willtherefore be ignored, along with deaths from suicide, fires and allother external causes (ICD 800-999).Lung cancer at ages 35-79: compare with US non-smokers-
In developed countries, lung cancer is so rare among non-smokersthat big studies are needed to describe reliably their age-specificdeath rates from the disease. The two largest prospective studies ofsmoking, each of which involved over a million people, both tookplace in the US, one (CPS-1) in the 1960s and one (CPS-11) in the1980s. Comparing the lung cancer mortality among the non-smokers (never smoked regularly) in these two studies, there was nosignificant trend over the 20-year period that separated them4 (andno significant difference between these studies and the smallerstudy of British doctors1O). So, the US non-smoker lung cancer ratesin CPS-11 (Appendix) may approximately describe non-smokers inother developed countries. Among Spanish women, for example,where smoking cannot yet be causing much lung cancer (since onlya few per cent of those in later middle age are smokers) the lungcancer rates are still like those of the US female non-smokers.
(Among young Spanish women, however, about half now smoke,and if they continue to do so then when they eventually reach latermiddle age high death rates must be expected.)The similarity of non-smoker lung cancer death certification rates
in different developed countries is only approximate, for there willbe differences not only in the extent to which other diseases aremis-certified as primary lung cancer, or vice versa, but also in theeffects on non-smokers of other causative factors such as general airpollution or occupation (or, perhaps, some infective, nutritional orhormonal factors).lO Among non-smokers, however, the disease israre even in polluted areas-indeed, even radon and asbestos maycause only a small absolute risk among those who have neversmoked. So for each sex the tobacco-attributable lung cancer in eachcountry is estimated by subtracting the smoothed US non-smokerrates in the Appendix from the national rates (with no lung cancerdeaths attributed to tobacco in any of the age groups 35-59, 60-64,65-69,70-74 or 75-79 in which the national rate was less than theUS non-smoker rate or, conservatively, in any subsequent agegroup): also, because the rates at older ages may be unreliable orunstable, in each population the fraction of lung cancer attributed tosmoking was taken to be the same at 80 + as at 75-79.
Other diseases at ages 35-79. conservative halving of apparentexcess attributed to tobacco-For the other diseases, a morecomplicated procedure is needed to estimate the fractionsattributable to tobacco, since it cannot be assumed that the absoluterates among non-smokers will be comparable in different
populations. First, using the 5-yearly lung cancer rates from theAppendix, a mixture of CPS-II smokers and CPS-II non-smokersaged 35 to 79 is constructed, with the proportions of smokers at ages35-59, 60-64, 65-69, 70-74 and 75-79 chosen to make the lungcancer rates in each of these age groups in the mixed populationequal to those in the country to be analysed. (The ratio of thenon-smoker lung cancer rates to the national rates in these five
1272
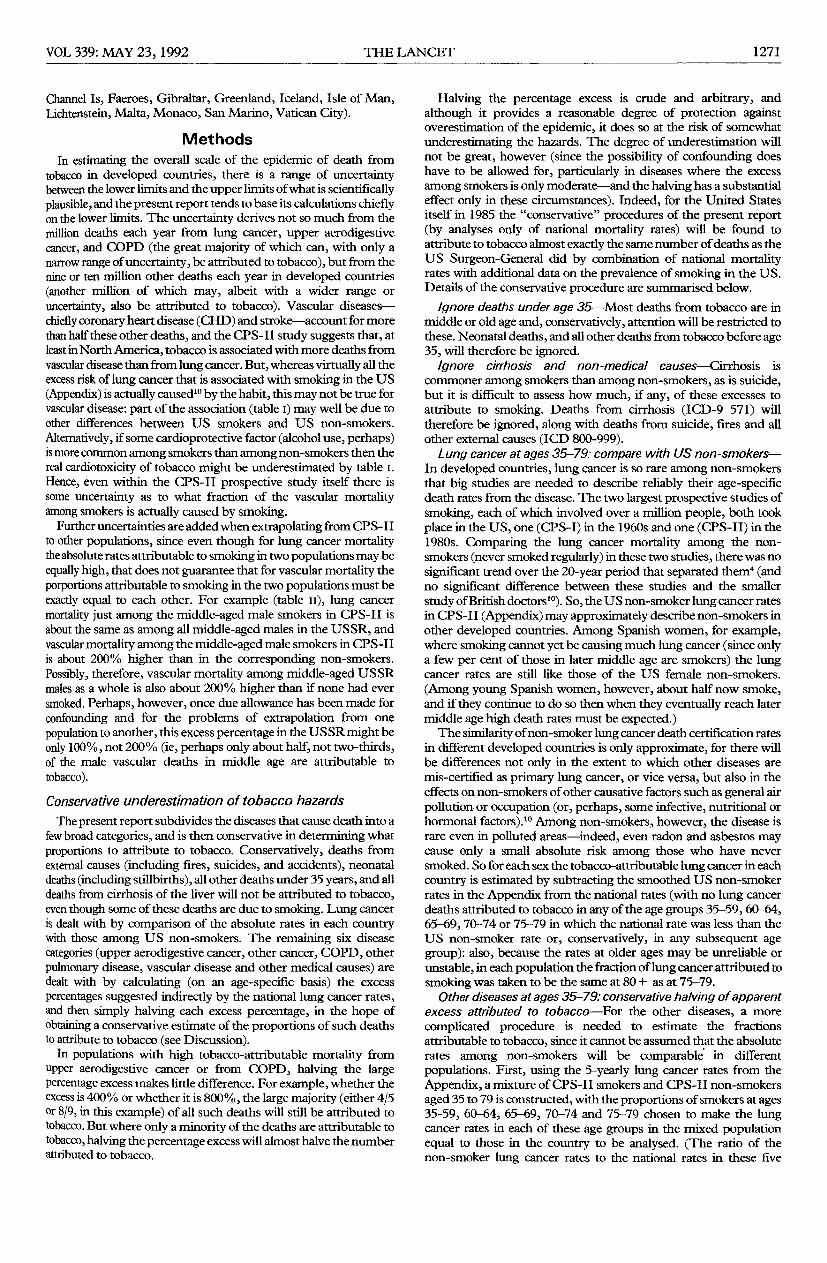
TABLE III-ALL DEVELOPED COUNTRIES, 1985 MORTALITY: SMOKING-ATTRIBUTED DEATHS/TOTAL DEATHS, IN THOUSANDS
*Any relationship of these deaths with smoking is ignoredtlncludes 784 (000) deaths at ages 0-34 ’
*
separate age groups determines the proportions not attributed totobacco.) Second, using for other diseases relative risks from table I(which are taken as if they were independent of age for cancer andfor chronic obstructive pulmonary disease), determine the excess ineach age group as a percentage of the non-smoker rates. Finally, fora particular disease category in a particular age group, the method ofextrapolation from this mixed population to the target country is toassume that the proportion of deaths due to smoking is similar in thetarget population and in the mixed population. But, it cannot beassumed that all the excess mortality among smokers in the CPS-11study was actually caused by tobacco. Upper aerodigestive cancers,for example, are caused both by tobacco and by alcohol, andsmokers may drink more than non-smokers. Likewise, even amongnon-smokers many diseases are inversely related to social class, andso too is smoking. Hence, in CPS-11 part of the excess mortalityamong smokers may be due to factors other than tobacco. To ensurethat the hazards of tobacco are not exaggerated, the excess mortalityin the mixed population will be halved before estimating the fractionof deaths attributable to tobacco. For example, if the mixture had 7times the COPD mortality of non-smokers (ie, a 6-fold excess) theninstead of 6/7 of the COPD deaths being attributed to tobacco, only3/4 would be, a 3-fold excess. In countries where lung cancer iscommon this does not greatly reduce the fractions of COPD orupper aerodigestive cancer deaths attributed to tobacco, but it doessubstantially reduce the fractions of other deaths attributed to thehabit. This simple halving of the excess risk is obviously not asatisfactory procedure, for it is crude and arbitrary and mayseriously under-estimate some of the true hazards of tobacco.Prospective studies in a number of countries of smoking, mortalityand various possible confounding factors should eventually clarifythe local hazards that are actually caused by tobacco, but in mostcountries these are not yet available.
Ages 80+: use 75-79 proportions-Because lung cancer ratesare particularly unreliable in extreme old age, the proportions ofeach disease category attributed to smoking will simply be taken tobe the same at 80 + as at 75-79.
Results
Does the method produce any obviously anomalousresults? Only if its results are generally plausible can theirimplications be explored. Although brief results will begiven for 1965 and 1975, chief emphasis will be on the resultsfor 1985 (the last year for which the results are based onactual mortality rates), on approximate extrapolations to1995 (the first year for which the results might be directlyrelevant to current planning of preventive strategies), and onthe longer-term trends.
1985 mortality by disease categoryTable III gives for 1985 the numbers of tobacco-
attributed deaths from various categories of disease. Theresults are subdivided into middle age (35-69) and old age(70 +). Scrutiny of table III does not reveal any obviousimplausibilities in particular causes of death, except perhapsfor some uncertainty about the large number of "othermedical" deaths attributed to smoking. This is such a minorcategory of death in North America that the excess seen in
the CPS-11 study cannot reliably be extrapolated to
populations where such deaths are common. (Note,however, that some of these "other medical" deaths innational mortality statistics include tobacco-relatedconditions such as peptic ulcer, tuberculosis, or even somemisclassified deaths from a respiratory, neoplastic or
vascular cause.)
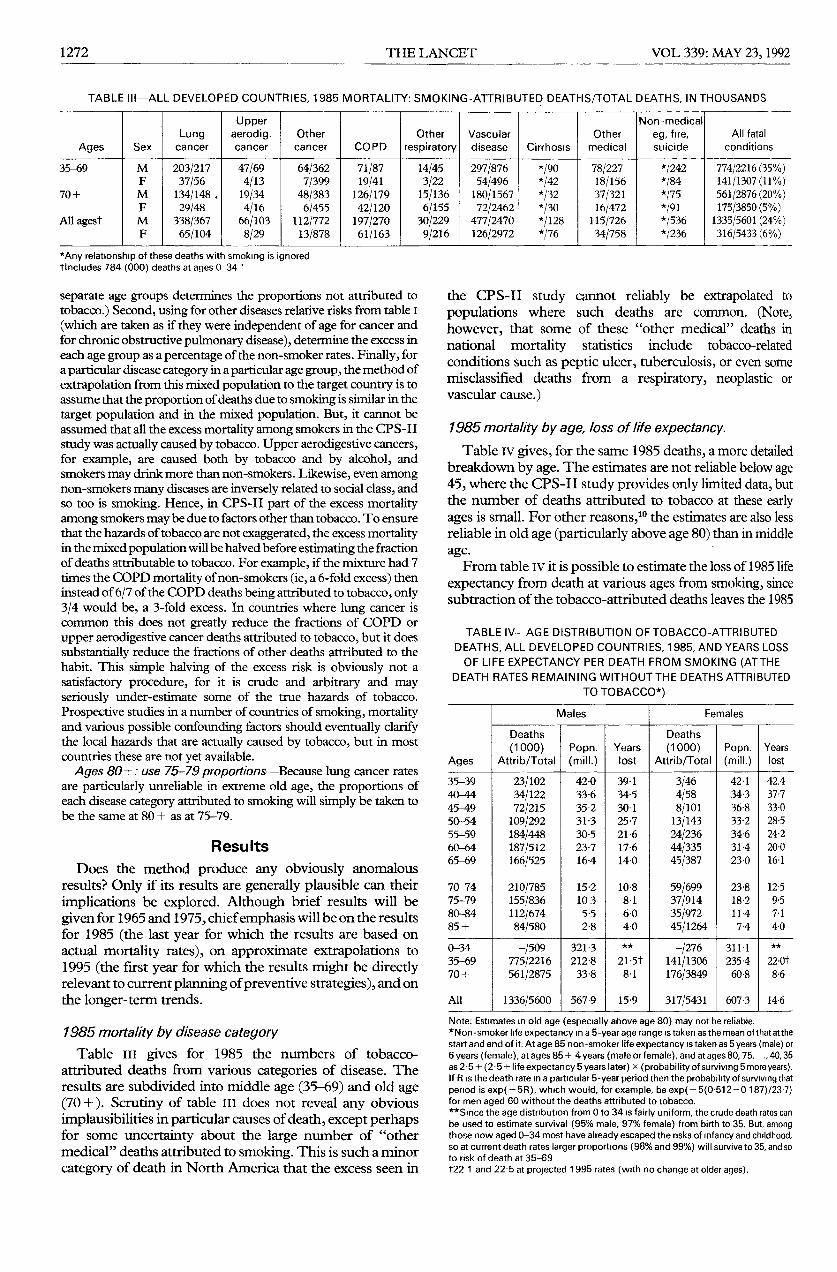
1985 mortality by age, loss of life expectancy.Table IV gives, for the same 1985 deaths, a more detailed
breakdown by age. The estimates are not reliable below age45, where the CPS-II study provides only limited data, butthe number of deaths attributed to tobacco at these earlyages is small. For other reasons,10 the estimates are also lessreliable in old age (particularly above age 80) than in middleage.From table IV it is possible to estimate the loss of 1985 life
expectancy from death at various ages from smoking, sincesubtraction of the tobacco-attributed deaths leaves the 1985
TABLE IV-AGE DISTRIBUTION OF TOBACCO-ATTRIBUTED
DEATHS, ALL DEVELOPED COUNTRIES, 1985, AND YEARS LOSSOF LIFE EXPECTANCY PER DEATH FROM SMOKING (ATTHE
DEATH RATES REMAINING WITHOUT THE DEATHS ATTRIBUTEDTO TOBACCO*)
Note: Estimates m old age (especially above age 80) may not be reliable.*Non-smoker life expectancy m a 5-year age range istaken as the mean ofthatatthestart and end of it. At age 85 non-smoker life expectancy istaken as 5 years (male) or6 years (female), at ages 85+ 4 years (male or female), and at ages 80, 75, ., 40, 35as 25 + (2’5 + + life expectancy 5 years later) x (probability of surviving 5 more years).If R is the death rate m a particular 5-year period then the probability of surviving thatpenod is exp( - 5R), which would, for example, be exp (- 5(0-512 - 0 187)/23-7)for men aged 60 without the deaths attributed to tobacco.**Smce the age distribution from 0 to 34 is fairly uniform, the crude death rates canbe used to estimate survival (95% male, 97% female) from birth to 35. But, amongthose now aged 0-34 most have already escaped the nsks of mfancy and childhood,so at current death rates larger proportions (98% and 99%) will survive to 35, and soto risk of death at 35-69t22 1 and 22 at projected 1995 rates (with no change at older ages).
1273
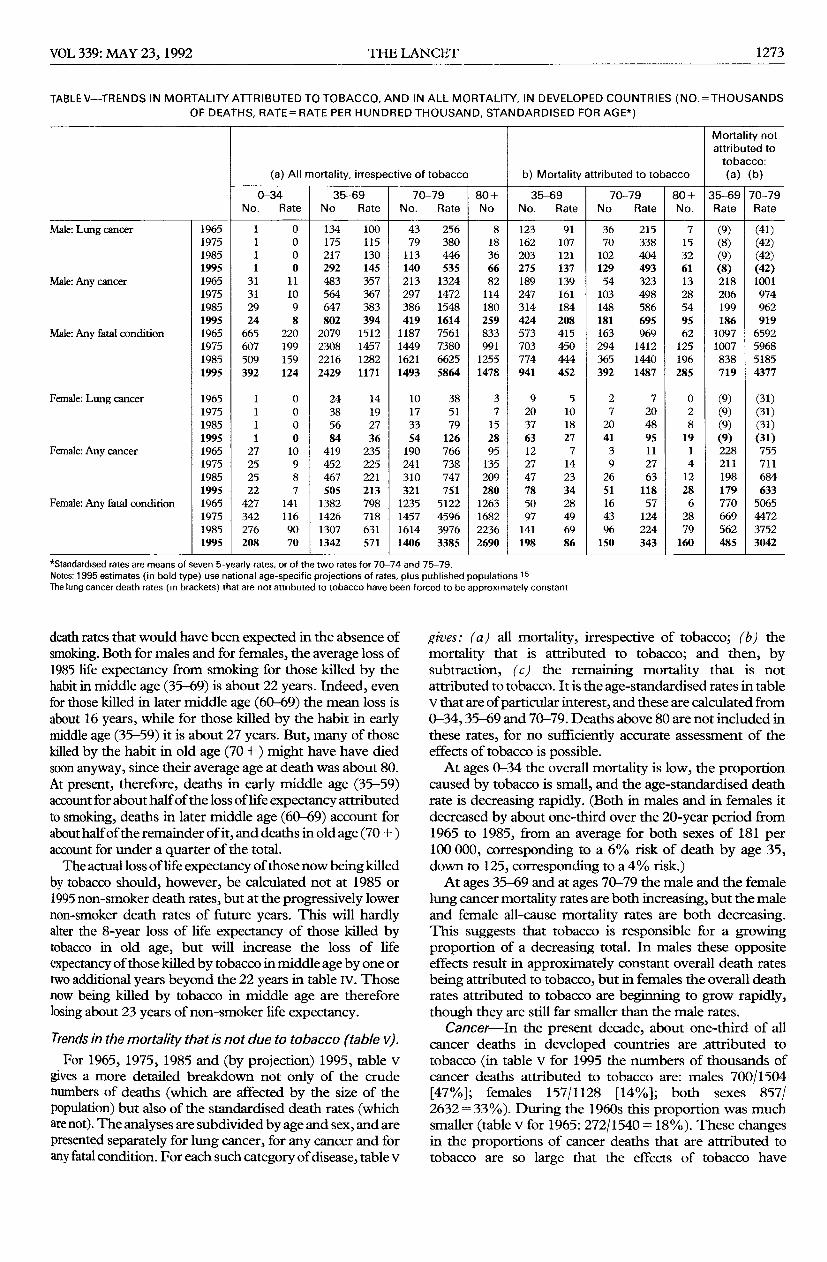
TABLE V-TRENDS IN MORTALITY ATTRIBUTED TO TOBACCO, AND IN ALL MORTALITY, IN DEVELOPED COUNTRIES (NO.=THOUSANDSOF DEATHS, RATE= RATE PER HUNDRED THOUSAND, STANDARDISED FOR AGE*)
I I I I I I I
*Standardised rates are means of seven 5-yearly rates, or of the two rates for 70-74 and 75-79.Notes: 1995 estimates (in bold type) use national age-specific projections of rates, plus published populations 15The lung cancer death rates (m brackets) that are not attributed to tobacco have been forced to be approximately constant
death rates that would have been expected in the absence ofsmoking. Both for males and for females, the average loss of1985 life expectancy from smoking for those killed by thehabit in middle age (35-69) is about 22 years. Indeed, evenfor those killed in later middle age (60-69) the mean loss isabout 16 years, while for those killed by the habit in earlymiddle age (35-59) it is about 27 years. But, many of thosekilled by the habit in old age (70 +) might have have diedsoon anyway, since their average age at death was about 80.At present, therefore, deaths in early middle age (35-59)account for about half of the loss of life expectancy attributedto smoking, deaths in later middle age (60-69) account forabout half of the remainder of it, and deaths in old age (70 + )account for under a quarter of the total.The actual loss of life expectancy of those now being killed
by tobacco should, however, be calculated not at 1985 or1995 non-smoker death rates, but at the progressively lowernon-smoker death rates of future years. This will hardlyalter the 8-year loss of life expectancy of those killed bytobacco in old age, but will increase the loss of life
expectancy of those killed by tobacco in middle age by one ortwo additional years beyond the 22 years in table Iv. Thosenow being killed by tobacco in middle age are thereforelosing about 23 years of non-smoker life expectancy.
Trends in the mortality that is not due to tobacco (table v).For 1965, 1975, 1985 and (by projection) 1995, table v
gives a more detailed breakdown not only of the crudenumbers of deaths (which are affected by the size of thepopulation) but also of the standardised death rates (whichare not). The analyses are subdivided by age and sex, and arepresented separately for lung cancer, for any cancer and forany fatal condition. For each such category of disease, table v
gives : (a) all mortality, irrespective of tobacco; (b) themortality that is attributed to tobacco; and then, bysubtraction, (c) the remaining mortality that is not
attributed to tobacco. It is the age-standardised rates in tablev that are of particular interest, and these are calculated from0-34,35-69 and 70-79. Deaths above 80 are not included inthese rates, for no sufficiently accurate assessment of theeffects of tobacco is possible.At ages 0-34 the overall mortality is low, the proportion
caused by tobacco is small, and the age-standardised deathrate is decreasing rapidly. (Both in males and in females itdecreased by about one-third over the 20-year period from1965 to 1985, from an average for both sexes of 181 per100 000, corresponding to a 6% risk of death by age 35,down to 125, corresponding to a 4% risk.)At ages 35-69 and at ages 70-79 the male and the female
lung cancer mortality rates are both increasing, but the maleand female all-cause mortality rates are both decreasing.This suggests that tobacco is responsible for a growingproportion of a decreasing total. In males these oppositeeffects result in approximately constant overall death ratesbeing attributed to tobacco, but in females the overall deathrates attributed to tobacco are beginning to grow rapidly,though they are still far smaller than the male rates.
Cancer-In the present decade, about one-third of allcancer deaths in developed countries are .attributed totobacco (in table v for 1995 the numbers of thousands ofcancer deaths attributed to tobacco are: males 700/1504[47%]; females 157/1128 [14%]; both sexes 857/2632=33%). During the 1960s this proportion was muchsmaller (table v for 1965: 272/1540 = 18%). These changesin the proportions of cancer deaths that are attributed totobacco are so large that the effects of tobacco have
1274
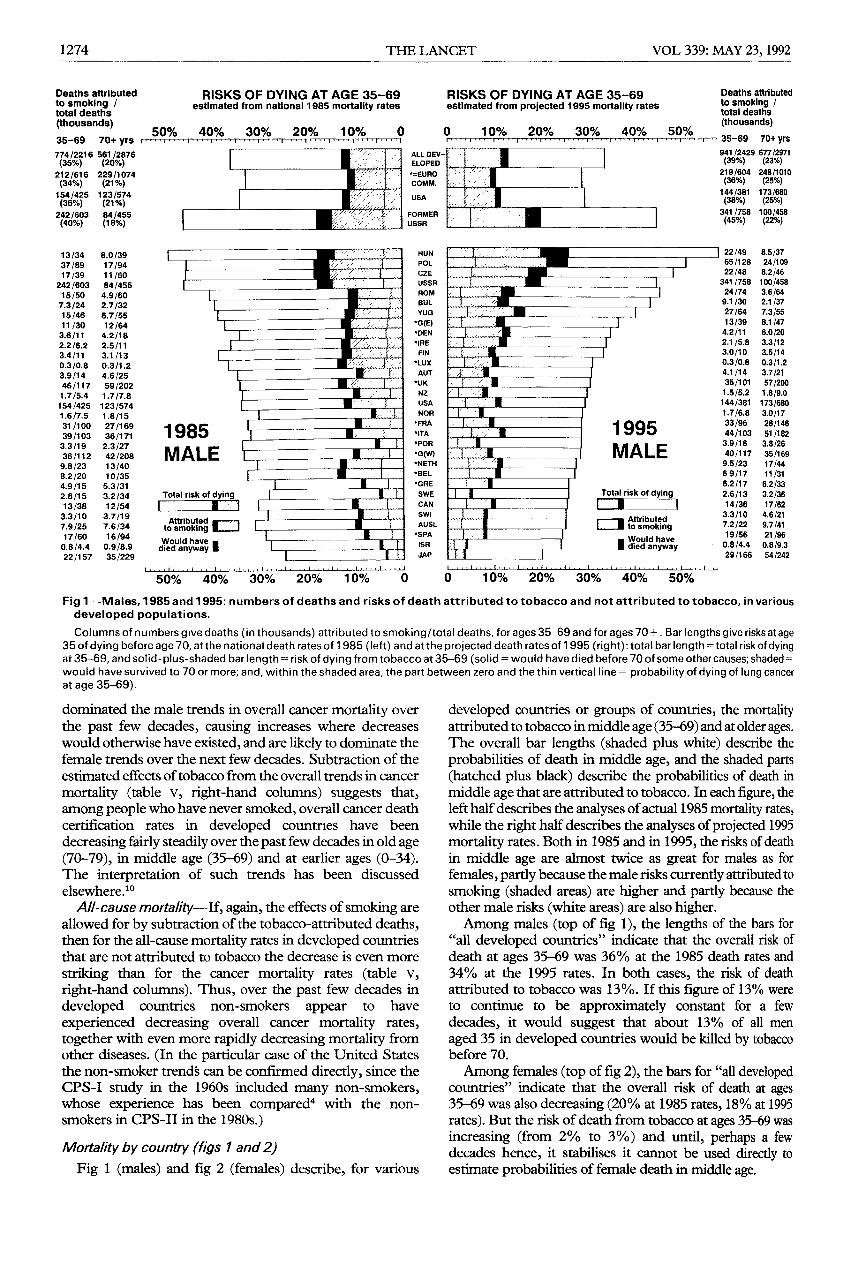
Fig 1-Males, 1985 and 1995: numbers of deaths and risks of death attributed to tobacco and not attributed to tobacco, in variousdeveloped populations.Columns of numbers give deaths (in thousands) attributed to smoking/total deaths, for ages 35-69 and for ages 70 +. Bar lengths give risks at age
35 of dying before age 70, at the national death rates of 1985 (left) and at the projected death rates of 1995 (right): total bar length =tota! risk of dyingat 35-69, and solid-plus-shaded bar length= risk of dying from tobacco at 35-69 (solid = would have died before 70 of some other causes; shaded= =would have survived to 70 or more; and, within the shaded area, the part between zero and the thin vertical line = probability of dying of lung cancerat age 35-69).
dominated the male trends in overall cancer mortality overthe past few decades, causing increases where decreaseswould otherwise have existed, and are likely to dominate thefemale trends over the next few decades. Subtraction of theestimated effects of tobacco from the overall trends in cancer
mortality (table v, right-hand columns) suggests that,among people who have never smoked, overall cancer deathcertification rates in developed countries have been
decreasing fairly steadily over the past few decades in old age(70-79), in middle age (35-69) and at earlier ages (0-34).The interpretation of such trends has been discussedelsewhere. to
All-cause mortality-If, again, the effects of smoking areallowed for by subtraction of the tobacco-attributed deaths,then for the all-cause mortality rates in developed countriesthat are not attributed to tobacco the decrease is even more
striking than for the cancer mortality rates (table v,
right-hand columns). Thus, over the past few decades indeveloped countries non-smokers appear to have
experienced decreasing overall cancer mortality rates,
together with even more rapidly decreasing mortality fromother diseases. (In the particular case of the United Statesthe non-smoker trends can be confirmed directly, since theCPS-I study in the 1960s included many non-smokers,whose experience has been compared4 with the non-smokers in CPS-II in the 1980s.)
Mortality by country (figs 1 and 2)Fig 1 (males) and fig 2 (females) describe, for various
developed countries or groups of countries, the mortalityattributed to tobacco in middle age (35-69) and at older ages.The overall bar lengths (shaded plus white) describe theprobabilities of death in middle age, and the shaded parts(hatched plus black) describe the probabilities of death inmiddle age that are attributed to tobacco. In each figure, theleft half describes the analyses of actual 1985 mortality rates,while the right half describes the analyses of projected 1995mortality rates. Both in 1985 and in 1995, the risks of deathin middle age are almost twice as great for males as forfemales, partly because the male risks currently attributed tosmoking (shaded areas) are higher and partly because theother male risks (white areas) are also higher.Among males (top of fig 1), the lengths of the bars for
"all developed countries" indicate that the overall risk ofdeath at ages 35-69 was 36% at the 1985 death rates and34% at the 1995 rates. In both cases, the risk of deathattributed to tobacco was 13%. If this figure of 13% wereto continue to be approximately constant for a few
decades, it would suggest that about 13% of all men
aged 35 in developed countries would be killed by tobaccobefore 70.
Among females (top of fig 2), the bars for "all developedcountries" indicate that the overall risk of death at ages35-69 was also decreasing (20% at 1985 rates, 18% at 1995rates). But the risk of death from tobacco at ages 35-69 wasincreasing (from 2% to 3%) and until, perhaps a fewdecades hence, it stabilises it cannot be used directly toestimate probabilities of female death in middle age.
1275
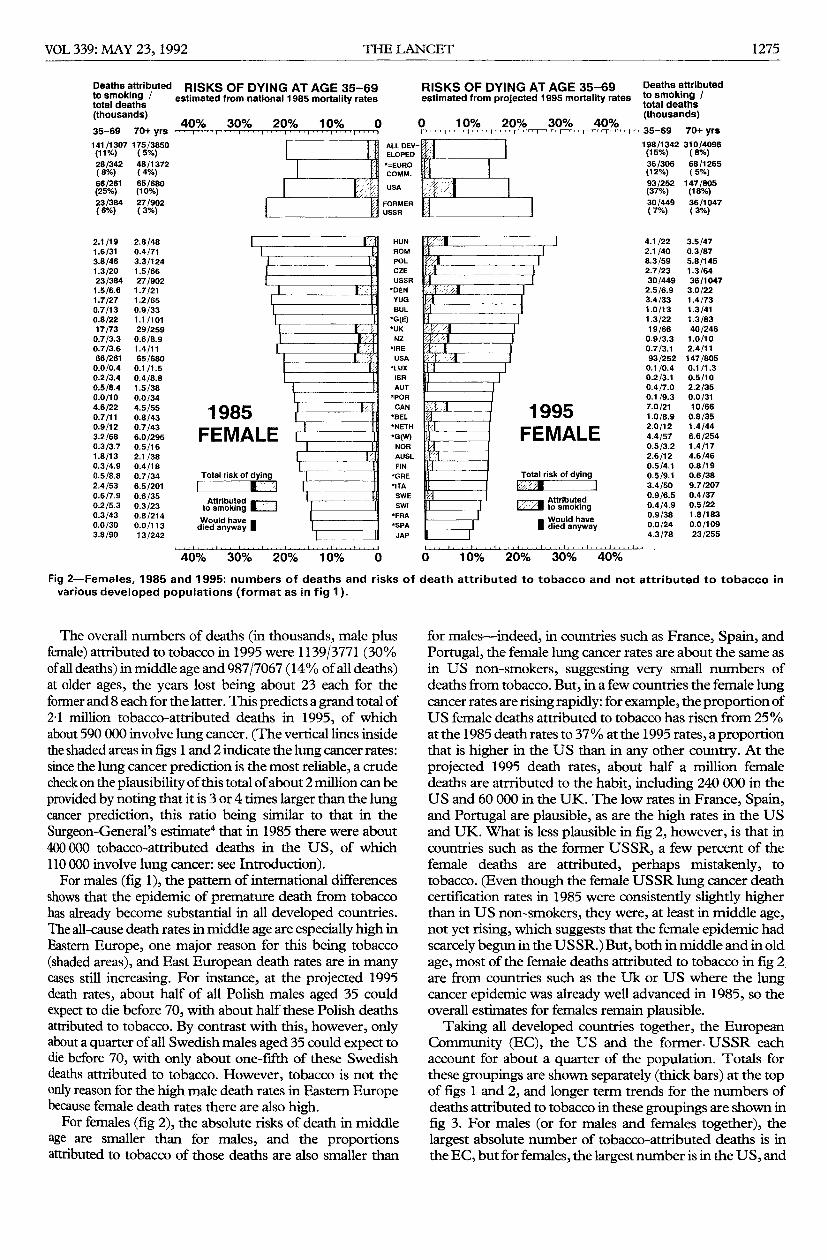
Fig 2-Females, 1985 and 1995: numbers of deaths and risks of death attributed to tobacco and not attributed to tobacco invarious developed populations (format as in fig 1).
The overall numbers of deaths (in thousands, male plusfemale) attributed to tobacco in 1995 were 1139/3771 (30%of all deaths) in middle age and 987/7067 (14% of all deaths)at older ages, the years lost being about 23 each for theformer and 8 each for the latter. This predicts a grand total of21 million tobacco-attributed deaths in 1995, of whichabout 590 000 involve lung cancer. (The vertical lines insidethe shaded areas in figs 1 and 2 indicate the lung cancer rates:since the lung cancer prediction is the most reliable, a crudecheck on the plausibility of this total of about 2 million can beprovided by noting that it is 3 or 4 times larger than the lungcancer prediction, this ratio being similar to that in theSurgeon-General’s estimate4 that in 1985 there were about400 000 tobacco-attributed deaths in the US, of which110 000 involve lung cancer: see Introduction).For males (fig 1), the pattern of international differences
shows that the epidemic of premature death from tobaccohas already become substantial in all developed countries.The all-cause death rates in middle age are especially high inEastern Europe, one major reason for this being tobacco(shaded areas), and East European death rates are in manycases still increasing. For instance, at the projected 1995death rates, about half of all Polish males aged 35 couldexpect to die before 70, with about half these Polish deathsattributed to tobacco. By contrast with this, however, onlyabout a quarter of all Swedish males aged 35 could expect todie before 70, with only about one-fifth of these Swedishdeaths attributed to tobacco. However, tobacco is not theonly reason for the high male death rates in Eastern Europebecause female death rates there are also high.For females (fig 2), the absolute risks of death in middle
age are smaller than for males, and the proportionsattributed to tobacco of those deaths are also smaller than
for males-indeed, in countries such as France, Spain, andPortugal, the female lung cancer rates are about the same asin US non-smokers, suggesting very small numbers ofdeaths from tobacco. But, in a few countries the female lungcancer rates are rising rapidly: for example, the proportion ofUS female deaths attributed to tobacco has risen from 25%at the 1985 death rates to 37 % at the 1995 rates, a proportionthat is higher in the US than in any other country. At theprojected 1995 death rates, about half a million femaledeaths are atrributed to the habit, including 240 000 in theUS and 60 000 in the UK. The low rates in France, Spain,and Portugal are plausible, as are the high rates in the USand UK. What is less plausible in fig 2, however, is that incountries such as the former USSR, a few percent of thefemale deaths are attributed, perhaps mistakenly, to
tobacco. (Even though the female USSR lung cancer deathcertification rates in 1985 were consistently slightly higherthan in US non-smokers, they were, at least in middle age,not yet rising, which suggests that the female epidemic hadscarcely begun in the USSR.) But, both in middle and in oldage, most of the female deaths attributed to tobacco in fig 2,are from countries such as the Uk or US where the lungcancer epidemic was already well advanced in 1985, so theoverall estimates for females remain plausible.
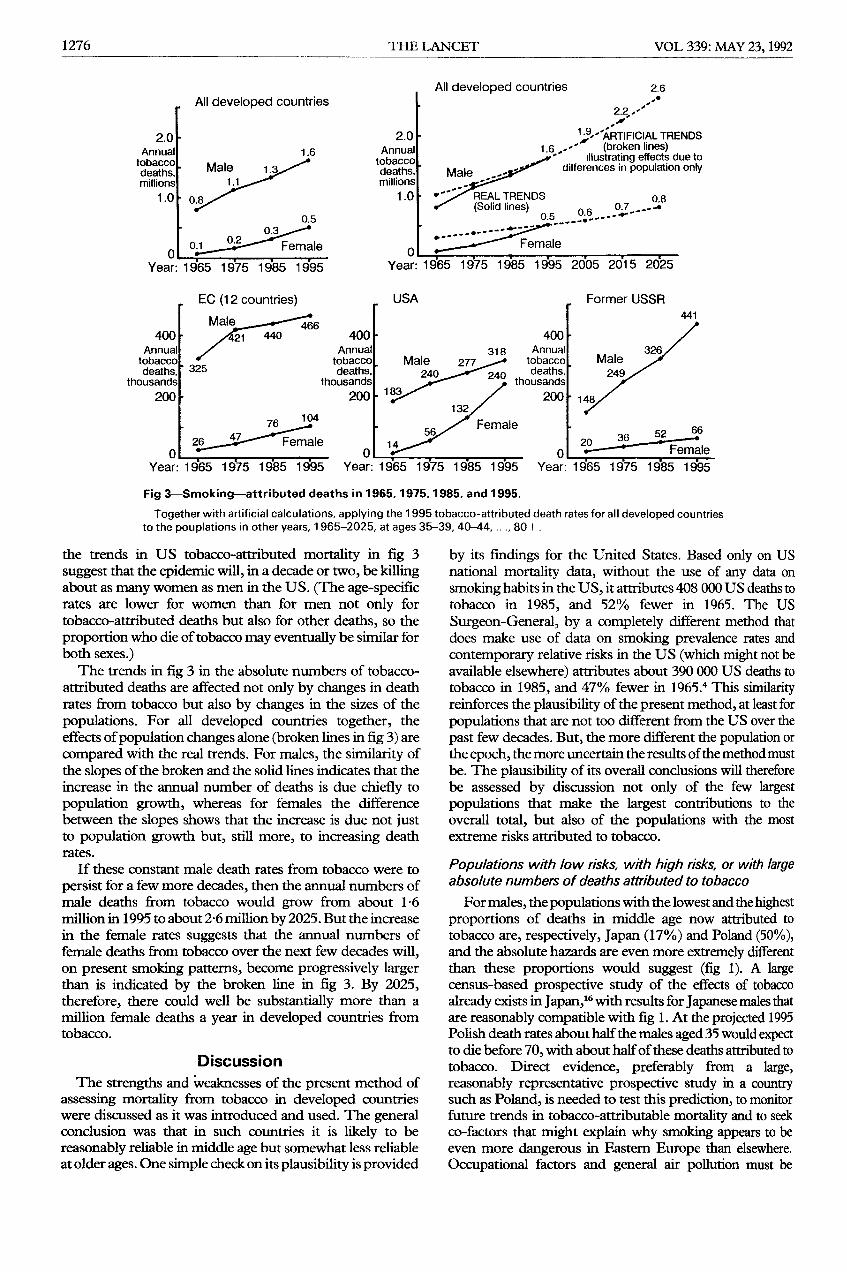
Taking all developed countries together, the EuropeanCommunity (EC), the US and the former. USSR eachaccount for about a quarter of the population. Totals forthese groupings are shown separately (thick bars) at the topof figs 1 and 2, and longer term trends for the numbers ofdeaths attributed to tobacco in these groupings are shown infig 3. For males (or for males and females together), thelargest absolute number of tobacco-attributed deaths is inthe EC, but for females, the largest number is in the US, and
1276
Fig 3-Smoking-attributed deaths in 1965,1975,1985, and 1995.
Together with artificial calculations, applying the 1995 tobacco-attributed death rates for all developed countriesto the pouplations in other years, 1965-2025, at ages 35-39, 40-44, ..., 80+.
the trends in US tobacco-attributed mortality in fig 3suggest that the epidemic will, in a decade or two, be killingabout as many women as men in the US. (The age-specificrates are lower for women than for men not only fortobacco-attributed deaths but also for other deaths, so theproportion who die of tobacco may eventually be similar forboth sexes.)The trends in fig 3 in the absolute numbers of tobacco-
attributed deaths are affected not only by changes in deathrates from tobacco but also by changes in the sizes of thepopulations. For all developed countries together, theeffects of population changes alone (broken lines in fig 3) arecompared with the real trends. For males, the similarity ofthe slopes of the broken and the solid lines indicates that theincrease in the annual number of deaths is due chiefly topopulation growth, whereas for females the differencebetween the slopes shows that the increase is due not justto population growth but, still more, to increasing deathrates.
If these constant male death rates from tobacco were to
persist for a few more decades, then the annual numbers ofmale deaths from tobacco would grow from about 16million in 1995 to about 2-6 million by 2025. But the increasein the female rates suggests that the annual numbers offemale deaths from tobacco over the next few decades will,on present smoking patterns, become progressively largerthan is indicated by the broken line in fig 3. By 2025,therefore, there could well be substantially more than amillion female deaths a year in developed countries fromtobacco.
DiscussionThe strengths and weaknesses of the present method of
assessing mortality from tobacco in developed countrieswere discussed as it was introduced and used. The generalconclusion was that in such countries it is likely to bereasonably reliable in middle age but somewhat less reliableat older ages. One simple check on its plausibility is provided
by its fmdings for the United States. Based only on USnational mortality data, without the use of any data onsmoking habits in the US, it attributes 408 000 US deaths totobacco in 1985, and 52% fewer in 1965. The US
Surgeon-General, by a completely different method thatdoes make use of data on smoking prevalence rates andcontemporary relative risks in the US (which might not beavailable elsewhere) attributes about 390 000 US deaths totobacco in 1985, and 47% fewer in 1965.4 This similarityreinforces the plausibility of the present method, at least forpopulations that are not too different from the US over thepast few decades. But, the more different the population orthe epoch, the more uncertain the results of the method mustbe. The plausibility of its overall conclusions will thereforebe assessed by discussion not only of the few largestpopulations that make the largest contributions to theoverall total, but also of the populations with the mostextreme risks attributed to tobacco.
Populations with low risks, with high risks, or with largeabsolute numbers of deaths attributed to tobacco
For males, the populations with the lowest and the highestproportions of deaths in middle age now attributed totobacco are, respectively, Japan (17%) and Poland (50%),and the absolute hazards are even more extremely differentthan these proportions would suggest (fig 1). A largecensus-based prospective study of the effects of tobaccoalready exists in Japan, t6 with results for Japanese males thatare reasonably compatible with fig 1. At the projected 1995Polish death rates about half the males aged 35 would expectto die before 70, with about half of these deaths attributed totobacco. Direct evidence, preferably from a large,reasonably representative prospective study in a countrysuch as Poland, is needed to test this prediction, to monitorfuture trends in tobacco-attributable mortality and to seekco-factors that might explain why smoking appears to beeven more dangerous in Eastern Europe than elsewhere.Occupational factors and general air pollution must be
1277
contributing to differing extents to the lung cancer rates invarious countries, and may be particularly important inEastern Europe. But, they are not likely to be majordeterminants of the international mortality patterns,10 andthe present approximate methods therefore remain
appropriate.For females, the populations with the lowest and with the
highest proportions of deaths in middle age attributed totobacco are, respectively, Spain (0%) and the USA (37%).In Spain a very low risk is reasonable, as female smoking israre in middle age and is common only among youngwomen (whose tobacco-attributable death rates will
eventually become high if they continue to smoke as theyage). In the US a high female death rate from tobacco is welldocumented for 1985, and a steep trend is well documentedfrom 1965 to 1985.4 The prediction that there will, duringthe current decade, be particularly high female death ratesfrom tobacco in the United States is therefore securely basedon reliable data from large prospective studies in the samecountry,4 and in view of the steep increase in US femalemortality from tobacco that is now in progress even
larger numbers of deaths from tobacco must be expectedamong US females during the first few years of the nextcentury.The validity of the overall estimates for all developed
populations in the current decade depends chiefly on thevalidity of the larger contributions. For females, much thelargest contribution involves the reliable estimates from theUnited States. On average during the 1990s, tobacco is
expected to cause about a quarter of a million female deaths ayear in the US plus about a quarter of a million female deathsa year in other developed countries. (The second largestcontribution is from UK females.) Because the US hazardsare well documented, the grand total of half a million femaledeaths a year (ie, about 5 million female deaths from tobaccoin developed countries during the whole decade 1990-1999)can be accepted as reliable.
In each population most of the deaths attributed totobacco are male, so male mortality is closely correlated withoverall (male plus female) mortality from the habit. Eitherfor males alone or for males and females together, thegreatest annual number of deaths currently attributed totobacco in any developed population is in the EuropeanCommunity (fig 3). It is estimated that in the EC there willbe about 570 000 deaths per year from tobacco during thecurrent decade, of which about a quarter of a million will stillbe in middle age (35-69). Within the EC, the countries withthe greatest numbers of deaths currently attributed totobacco are the UK (150 000 per year) and Germany(111000 per year), although the highest risk of death inmiddle age from tobacco in the EC (and the most rapidincrease in this risk) appears to be in Denmark. A largecollaborative European prospective study is currently beingorganised through the International Agency for Research onCancer that will monitor the evolution of this epidemicthroughout the EC, as well as seeking particularly reliableevidence on possible co-factors for the hazards of tobacco.Within the EC, the UK is the country with much the largestnumber of deaths attributed to tobacco, and a number ofstudies of the habit have been conducted there. None,however, has been on a representative sample of thepopulation. All estimates of UK mortality from tobaccohave therefore used indirect arguments. A recent estimate of110000 deaths a year by the UK Health EducationAuthority" is lower than the present estimate of 150 000(perhaps because it failed to allow appropriately for the delay
between the decrease in male smoking prevalence and thedecrease in male death), but is not grossly different.
Extrapolation to future decades
Extrapolation to 1995 is reasonably secure, but the furtherinto the next century the risks are extrapolated (fig 3) themore uncertainty there must be about the age-specific deathrates from tobacco. Substantial uncertainty about theage-specific death rates in future decades need not, however,imply similarly large uncertainties about the absolute annualnumbers of deaths, for even large changes in death rates(such as, for example, the decreases in causes other thantobacco of vascular mortality) may not have much effect onthe proportion of deaths attributable to tobacco. Hence, theage-specific death rates of the future from current smokingpatterns cannot be predicted reliably, as they depend onother factors, but the approximate annual number of deathsin the future from tobacco can be.At the 1995 tobacco-attributed mortality rates among
people of a given age there would be about 34 million deathsfrom tobacco in 2025 (2-6 million male plus 0-8 millionfemale: these numbers are larger than the 1 6 million maleand 05 million female in 1995 only because of populationgrowth). But, although the male tobacco-attributed deathrates may, on current smoking patterns, be approximatelystable (as they have been for the past few years), the femalerates are rising rapidly-indeed, although the age-specificrisks are lower for females than for males, if women smokelike men then the US example shows that the absolutenumber of female deaths from tobacco may eventually beabout as great as the male number. The uncertainties in thefuture predictions are greater than those in the currentestimates, but even though the decreasing male death ratesfrom tobacco that have been achieved in a few developedcountries may be extended to more developed countriesover the next few decades, the female death rates fromtobacco are now increasing rapidly and, taking men andwomen together, of all deaths the proportion attributed totobacco will for several years continue to increase. Hence, oncurrent smoking patterns in developed countries, at least 3million deaths a year from tobacco must be expected in 2025,and the actual number could well be considerably higherthan this. The UK was the first country to experience highmale lung cancer rates, but even in the UK the disease wasrare until the second quarter of this century, so worldwide
extrapolation of the numbers in fig 3 backwards to lownumbers a few decades before 1965 (and taking the numberin each decade to be ten times the annual number) indicatesthat deaths in developed countries from tobacco probablynumbered in total "only" a few million from 1930 to 1959,followed by about 9 million in the 1960s, 13 million in the1970s, 17 million in the 1980s, 21 million in the 1990s and, atthe 1995 tobacco-attributed death rates (which will not, ofcourse, really remain constant), 25 million, 29 million and 34million over the next 3 decades. These numbers total about150 million from 1930 to 2029, including about 50 million inthe 60-year period from 1930 to 1989 and about 100 millionin the 40-year period from 1990-2029. Although crude,such estimates suffice to provide a useful guide to theapproximate scale of tobacco-related mortality that must beexpected in the next century.An alternative approach to the assessment of these future
hazards is to note that in the mid-1990s about one-fifth (2 1million/10 8 million: figs 1 and 2) of all deaths in developedcountries were already attributed to tobacco, and that on
1278
current smoking patterns (especially among females) thisproportion may well increase a little over the next fewdecades but is not likely to decrease. This suggests thatabout one-fifth of the people now living in developedcountries (ie, about a quarter of a billion out of one-and-a-quarter billion) will, on current smoking patterns,eventually be killed by tobacco, losing an average of about 15years of life expectancy per death.The present methods are obviously crude, and the
presentation of a mass of apparently precise figures shouldnot be taken to suggest otherwise. Hence, because thegrowing worldwide epidemic of premature death fromtobacco is so great, its detailed evolution needs to bemonitored accurately by large, reliable prospective studiesin a number of developed countries (and, particularlyimportantly,t8 in a number of less developed countries).Such studies could assess not only the effects of tobacco butalso some of the factors that importantly modify thoseeffects. The large pattern is, however, now clear: in
developed countries tobacco is already causing about twomillion deaths a year this number is still increasing, andabout half those killed by the habit are still only in middleage, making tobacco much the most important cause ofpremature death. Elsewhere, the epidemic is generally at anearlier stage but recent large increases in cigarette use incountries such as China means that tobacco will, in a fewdecades, also become one of the most important causes ofpremature death in less developed countries.18
This report originated from the WHO Consultative Group on StatisticalAspects of Tobacco-related Mortality: R. Peto (chairman), A. D. Lopez(scientific secretary), T. Novotny (rapporteur), C. Chollat-Traquet, P. C.Gupta, K. Kuulaasma, M. Parkin, K. D. Stanley. L. Garfinkel first providedCPS-II data, Sir Richard Doll provided helpful criticism, and Gale Meadprovided secretarial support (and harrassment).
REFERENCES
1. Zaridze D, Peto R, eds. Tobacco: a major international health hazard.IARC Scientific Publications No. 74, International Agency forResearch on Cancer (IARC), Lyon, 1986.
2. IARC Monographs on the Evolution of the Carcinogenic Risk of
Chemicals to Humans, Vol 38: tobacco smoking. Lyon: IARC, 1986.3. Garfinkel L. Selection, follow-up and analysis in the American Cancer
Society prospective studies. In: Garfinkel, Ochs O, Mushinksi M, eds.Selection, follow-up and analysis in prospective studies: a workshop.NCI Monograph 67. National Cancer Institute, NIH Publication No.85-2713, 1985: 49-52.
4. US Department of Health and Human Services. Reducing the healthconsequences of smoking: 25 years of progress. A report of theSurgeon-General. USDHHS, Public Health Service, Centers forDisease Control Office on Smoking and Health. DHHS PublicationNo. (CDC) 89-8411, 1989.
5. World Health Organisation (WHO). World health statistics annual.Geneva: WHO, 1987.
6. Peto R. Influence of dose and duration of smoking on lung cancer rates.In: Zaridze D, Peto R, eds. Tobacco: a major international healthhazard. IARC Scientific Publications No. 74. Lyon: IARC, 1986:23-33.
7. Fletcher CM, Peto R. The natural history of chronic airflow obstruction.Br Med J 1977; i: 1645-48.
8. Keys A. Seven countries: a multivariate analysis of health and coronaryheart disease. Cambridge, Mass: Harvard University Press, 1980.
9. Martin MJ, Hulley SB, Browner WS, Kuller LH, Wentworth D. Serumcholesterol, blood pressure and mortality: implications from a cohort of361 662 men. Lancet 1986; ii: 933-36.
10. Doll R, Peto R. The causes of cancer. J Natl Cancer Inst 1981; 66:1191-1308.
11. US Department of Health and Human Services. The health
consequences of smoking for women. A report of the Surgeon-General.USDHHS, Public Health Service, Centers for Disease Control Officeon Smoking and Health, 1980: 86.
12. US Department of Health and Human Services. The health
consequences of smoking: cancer. A Report of the Surgeon-General.USDHHS, Public Health Service, Centers for Disease Control Officeon Smoking and Health. DHHS Publication No. (CDC) 82-50179,1982.
13. Garfinkel L, Stellman SD. Smoking and lung cancer in women. CancerRes 1988; 43: 6951-55.
14. Doll R. The age distribution of cancer: implication for models ofcarcinogenesis (with discussion). J Roy Statist Soc A 1971; 134:133-66.
15. UN Department of Economic and Social Affairs. World populationprospects 1990 (medium variant). J Roy Statist Soc A 1971; 134:133-66.
16. Hirayama T. Life-style and mortality: a large-scale census-based cohortstudy in Japan. Contrib Epidemiol Biostat 1990; 6.
17. Health Education Authority. The smoking epidemic. London: HEA,1991.
18. World Health Organisation. Tobacco-attributable mortality: globalestimates and projections. Tobacco Alert 1991; 1: 4-7.
N B The absolute risks may be artificially low, but (except for lung cancer) only relative risks are usedThe nsks (at age 35) of dying at age 35-69 indicated by these all-causes death rates are- Males smokers 32%, non-smokers 13%; Females smokers 18%, non-smokers 9%
*Smoker rates based on less than 20 000 person-years C=Cigarette smoker in 1982, N=Never smoked regularly, (n)=Smoothed lung cancer rates for these non-smokers.Smoothing 5-year age-groups with lower limits 35, 40, 70, 75 involved the best-fitting line of slope 4 on a logarithmic graph of non-smoker rates vs these lower limits 14