Morphologically cryptic biological species within the liverwort Frullania asagrayana
12
1707 American Journal of Botany 97(10): 1707–1718. 2010. American Journal of Botany 97(10): 1707–1718, 2010 ; http://www.amjbot.org/ © 2010 Botanical Society of America Considerable attention has been given to “the species prob- lem,” and there is widespread application of phylogenetic ap- proaches to circumscription of species. Nevertheless, most species are distinguished because they look different (i.e., are morphologically distinct from other putative species). In small, structurally simple plants such as bryophytes, morphology can be misleading because of convergence to similar morphologies in unrelated plants (e.g., Holyoak and Pedersen, 2007; Feldberg et al., 2010) and confusing levels of morphological plasticity that can make the identification of genetically based differences un- clear (e.g., Patterson et al., 1998; Såstad, 1999; Buryova and Shaw, 2005). Some morphologically differentiated species are not resolved as monophyletic on the basis of phylogenetic analy- ses of nucleotide sequences, possibly because (1) they diverged recently, (2) they are distinguished by environmentally induced character states, (3) the distinguishing features are polyphyletic in origin, or (4) there is insufficient variation at the loci examined (e.g., Holyoak and Hedenäs, 2006; Hedenäs, 2008). At the other end of the spectrum, morphologically cryptic lineages have been resolved within some widespread bryophytes and these have been interpreted as cryptic species (reviewed in Shaw, 2001; Heinrichs et al., 2009b). An extreme case recently came to light in the liverwort species Metzgeria furcata (L.) Dumort. (Metzge- riaceae) (Fuselier et al., 2009). Populations in North America and Europe are morphologically indistinguishable but belong to di- vergent sister clades that differ by over 60 nucleotide substitu- tions in sequenced portions of the plastid and nuclear genomes. Few studies of widespread bryophyte species have rigorously tested for evidence of reproductive isolation between putative cryptic species, although sympatric mixed populations without obvious evidence of recombination suggest that some are dis- tinct biological species. Here, we describe population structure on both local and regional scales in the leafy liverwort Frulla- nia asagrayana Mont. (Frullaniaceae) and present analyses of reproductive isolation between two groups of genetically diver- gent populations. Frullania Raddi is one of the largest genera of liverworts, with an estimated 350 species worldwide (Schuster, 1992). Frullania asagrayana is part of the so-called F. tamarisci complex, which includes plants with elongate leaf lobules (the 1 Manuscript received 18 May 2010; revision accepted 9 August 2010. The authors thank S. Boles for assistance with the laboratory work. This research was supported by National Science Foundation grants EF-0531730-002 (to A.J.S.) and EF-0531680 (to M.v.K. and J. Engel) and German Research Foundation grant HE 3584/2 (to J.H.). Thanks also to the curators of the following herbaria for permission to sample herbarium specimens for DNA: JE, SAAR, TENN, and UNAF. 7 Author for correspondence (e-mail: [email protected]) doi:10.3732/ajb.1000171 MORPHOLOGICALLY CRYPTIC BIOLOGICAL SPECIES WITHIN THE LIVERWORT FRULLANIA ASAGRAYANA 1 Megan Ramaiya 2 , Matthew G. Johnson 2 , Blanka Shaw 2 , Jochen Heinrichs 3 , Jörn Hentschel 4 , Matt von Konrat 5 , Paul G. Davison 6 , and A. Jonathan Shaw 2,7 2 Department of Biology, Duke University, Durham, North Carolina 27708, USA; 3 Department of Systematic Botany, Albrecht von Haller Institute of Plant Sciences, Georg-August-University, Untere Karspüle 2 37073 Göttingen, Germany; 4 Department of Systematic Botany with Herbarium Haussknecht and Botanical Garden, Friedrich Schiller University, Fürstengraben 1 07743 Jena, Germany; 5 Department of Botany, The Field Museum, 400 South Lake Shore Drive, Chicago, Illinois 60605-2496, USA; and 6 Department of Biology, University of Northern Alabama, Florence, Alabama 35632, USA • Premise of the study: The Frullania tamarisci complex includes eight Holarctic liverwort species. One of these, F. asagrayana, is distributed broadly throughout eastern North America from Canada to the Gulf Coast. Preliminary genetic data suggested that the species includes two groups of populations. This study was designed to test whether the two groups are reproductively isolated biological species. • Methods: Eighty-eight samples from across the range of F. asagrayana, plus 73 samples from one population, were genotyped for 13 microsatellite loci. Sequences for two plastid loci and nrITS were obtained from 13 accessions. Genetic data were ana- lyzed using coalescent models and Bayesian inference. • Key results: Frullania asagrayana is sequence-invariant at the two plastid loci and ITS2, but two clear groups were resolved by microsatellites. The two groups are largely reproductively isolated, but there is a low level of gene flow from the southern to the northern group. No gene flow was detected in the other direction. A local population was heterogeneous but displayed strong genetic structure. • Conclusions: The genetic structure of F. asagrayana in eastern North America reflects morphologically cryptic differentiation between reproductively isolated groups of populations, near-panmixis within groups, and clonal propagation at local scales. Reproductive isolation between groups that are invariant at the level of nucleotide sequences shows that caution must be exer- cised in making taxonomic and evolutionary inferences from reciprocal monophyly (or lack thereof) between putative species. Key words: biological species; cryptic speciation; Frullania; Frullaniaceae; gene flow; population structure; reproductive isolation.
-
Upload
independent -
Category
Documents
-
view
4 -
download
0
Transcript of Morphologically cryptic biological species within the liverwort Frullania asagrayana

1707
American Journal of Botany 97(10): 1707–1718. 2010.
American Journal of Botany 97(10): 1707–1718, 2010 ; http://www.amjbot.org/ © 2010 Botanical Society of America
Considerable attention has been given to “ the species prob-lem, ” and there is widespread application of phylogenetic ap-proaches to circumscription of species. Nevertheless, most species are distinguished because they look different (i.e., are morphologically distinct from other putative species). In small, structurally simple plants such as bryophytes, morphology can be misleading because of convergence to similar morphologies in unrelated plants (e.g., Holyoak and Pedersen, 2007 ; Feldberg et al., 2010 ) and confusing levels of morphological plasticity that can make the identifi cation of genetically based differences un-clear (e.g., Patterson et al., 1998 ; S å stad, 1999 ; Buryova and Shaw, 2005 ). Some morphologically differentiated species are not resolved as monophyletic on the basis of phylogenetic analy-ses of nucleotide sequences, possibly because (1) they diverged
recently, (2) they are distinguished by environmentally induced character states, (3) the distinguishing features are polyphyletic in origin, or (4) there is insuffi cient variation at the loci examined (e.g., Holyoak and Heden ä s, 2006 ; Heden ä s, 2008 ). At the other end of the spectrum, morphologically cryptic lineages have been resolved within some widespread bryophytes and these have been interpreted as cryptic species (reviewed in Shaw, 2001 ; Heinrichs et al., 2009b ). An extreme case recently came to light in the liverwort species Metzgeria furcata (L.) Dumort. (Metzge-riaceae) ( Fuselier et al., 2009 ). Populations in North America and Europe are morphologically indistinguishable but belong to di-vergent sister clades that differ by over 60 nucleotide substitu-tions in sequenced portions of the plastid and nuclear genomes.
Few studies of widespread bryophyte species have rigorously tested for evidence of reproductive isolation between putative cryptic species, although sympatric mixed populations without obvious evidence of recombination suggest that some are dis-tinct biological species. Here, we describe population structure on both local and regional scales in the leafy liverwort Frulla-nia asagrayana Mont. (Frullaniaceae) and present analyses of reproductive isolation between two groups of genetically diver-gent populations. Frullania Raddi is one of the largest genera of liverworts, with an estimated 350 species worldwide ( Schuster, 1992 ). Frullania asagrayana is part of the so-called F. tamarisci complex, which includes plants with elongate leaf lobules (the
1 Manuscript received 18 May 2010; revision accepted 9 August 2010. The authors thank S. Boles for assistance with the laboratory work.
This research was supported by National Science Foundation grants EF-0531730-002 (to A.J.S.) and EF-0531680 (to M.v.K. and J. Engel) and German Research Foundation grant HE 3584/2 (to J.H.). Thanks also to the curators of the following herbaria for permission to sample herbarium specimens for DNA: JE, SAAR, TENN, and UNAF.
7 Author for correspondence (e-mail: [email protected])
doi:10.3732/ajb.1000171
MORPHOLOGICALLY CRYPTIC BIOLOGICAL SPECIES WITHIN THE LIVERWORT FRULLANIA ASAGRAYANA 1
Megan Ramaiya 2 , Matthew G. Johnson 2 , Blanka Shaw 2 , Jochen Heinrichs 3 , J ö rn Hentschel 4 , Matt von Konrat 5 , Paul G. Davison 6 ,
and A. Jonathan Shaw 2,7
2 Department of Biology, Duke University, Durham, North Carolina 27708, USA; 3 Department of Systematic Botany, Albrecht von Haller Institute of Plant Sciences, Georg-August-University, Untere Karsp ü le 2 37073 G ö ttingen, Germany; 4 Department of
Systematic Botany with Herbarium Haussknecht and Botanical Garden, Friedrich Schiller University, F ü rstengraben 1 07743 Jena, Germany; 5 Department of Botany, The Field Museum, 400 South Lake Shore Drive, Chicago, Illinois 60605-2496, USA;
and 6 Department of Biology, University of Northern Alabama, Florence, Alabama 35632, USA
• Premise of the study: The Frullania tamarisci complex includes eight Holarctic liverwort species. One of these, F. asagrayana , is distributed broadly throughout eastern North America from Canada to the Gulf Coast. Preliminary genetic data suggested that the species includes two groups of populations. This study was designed to test whether the two groups are reproductively isolated biological species.
• Methods: Eighty-eight samples from across the range of F. asagrayana , plus 73 samples from one population, were genotyped for 13 microsatellite loci. Sequences for two plastid loci and nrITS were obtained from 13 accessions. Genetic data were ana-lyzed using coalescent models and Bayesian inference.
• Key results: Frullania asagrayana is sequence-invariant at the two plastid loci and ITS2, but two clear groups were resolved by microsatellites. The two groups are largely reproductively isolated, but there is a low level of gene fl ow from the southern to the northern group. No gene fl ow was detected in the other direction. A local population was heterogeneous but displayed strong genetic structure.
• Conclusions: The genetic structure of F. asagrayana in eastern North America refl ects morphologically cryptic differentiation between reproductively isolated groups of populations, near-panmixis within groups, and clonal propagation at local scales. Reproductive isolation between groups that are invariant at the level of nucleotide sequences shows that caution must be exer-cised in making taxonomic and evolutionary inferences from reciprocal monophyly (or lack thereof) between putative species.
Key words: biological species; cryptic speciation; Frullania ; Frullaniaceae; gene fl ow; population structure; reproductive isolation.

1708 American Journal of Botany [Vol. 97
species within this complex, and here we adopt such a taxon-omy. Frullania asagrayana is one of at least eight species of the F. tamarisci complex, which is distributed throughout the Holarctic and reaches Java and Sumatra in southeastern Asia. Frullania asagrayana is restricted to eastern North America from the maritime provinces of Canada to the Gulf Coast of the United States ( Hicks, 1992 ; Schuster, 1992 ). The only other species in the complex that occurs in eastern North America is F. tamarisci (L.) Dumort. s.str., which grows in the northeast-ern United States and southeastern Canada but is more common and widespread in Europe ( Grolle, 1970 ; Schuster, 1992 ).
smaller, ventral segment of a complicate-bilobed leaf, often forming a water sac) and ocelli (specialized leaf cells that con-tain one large oil body and lack chloroplasts) ( Fig. 1 ) . There has been much disagreement about the taxonomic status of mor-phological variants within the complex, with some authors recognizing one polymorphic species that occurs on multiple continents, and others, multiple species that have more re-stricted ranges ( Hattori, 1972 ; Crandall-Stotler et al., 1987 ; Schuster, 1992 ). Data from nucleotide sequences (Heinrichs et al., 2010) and variation at microsatellite loci (M. Ramaiya et al., unpublished data) strongly support the recognition of separate
Fig. 1. Gametophyte morphology of Frullania asagrayana . (A) Ventral view showing lobules of the lateral leaves. (B) Close-up of one lateral leaf showing the line of specialized cells, called ocelli, each containing one large oil body. (C) Flask-shaped perianth with beaked opening at summit. The pe-rianth surrounds the developing sporophyte until maturity, at which time the seta of the sporophyte elongates rapidly, raising the sporangium or capsule out of the perianth for release of spores.
Fig. 2. Map of the eastern United States showing the sampling of plants included in the molecular analyses. Classifi cation of plants as belonging to the Northern or the Southern cluster is based on the principal coordinate analyses (see Fig. 3 ).

1709October 2010] Ramaiya et al. — Cryptic Biological Species within FRULLANIA ASAGRAYANA
was represented by a single herbarium collection, from which one gametophyte was extracted for DNA.
More intensive local sampling at a single North Carolina site was conducted in July 2009. A total of 73 gametophytes of F. asagrayana were collected along the north and northwest slopes of Occoneechee Mountain in Orange County, North Carolina, using a hierarchical sampling scheme. Four sampling “ sites ” separated by ~100 m were identifi ed along a trail through a mixed forest domi-nated by species of Quercus L., Carya Nutt., and Pinus L. Selection of sites was based on seeing proximate groups of trees and rocks bearing patches of F. asag-rayana (which is patchily distributed throughout the forest). Within each sam-pling site, three to fi ve “ subsites ” were selected; each subsite was a single tree or rock with multiple patches of F. asagrayana . Within each subsite, one game-tophyte was sampled from each of fi ve “ patches. ” It was not known whether individual patches represent a single genetic individual or a population of mul-tiple individuals. Analyzing multiple samples from each of the 73 individual patches was not feasible, but we assessed the genetic make-up of three patches by genotyping fi ve separate gametophyte stems from each.
Microsatellite genotyping — Microsatellite loci were newly developed for our study of the F. tamarisci complex, and the previously unpublished primer sequences are provided in Table 1 . Genetic Identifi cation Services (Chatsworth, California, USA) “ enriched ” the genomic DNA for microsatellite motifs. Their methods for doing so employ a proprietary process that involves selection from among fragments of genomic DNA, of regions that contain microsatellites of a particular motif (such as – AC). The enriched product is then packaged into a plasmid library for screening and design of primers targeting known microsatellite-containing regions. Loci are isolated from the entire genome, and libraries are constructed for various motifs.
A total of 161 samples of F. asagrayana were included in the microsatellite study. DNA extractions were accomplished according to procedures outlined in Shaw et al. (2008) . Among the microsatellites developed for ongoing research on Frullania , 13 loci were assayed for this study: 9, 10, 22, 29, 39, 53, 75, 79,
Preliminary evidence from microsatellite analyses of F. asagrayana revealed high levels of genetic diversity and sug-gested that there may be morphologically cryptic groups within the taxonomic species. Here, we report genetic and phyloge-netic analyses of populations from throughout most of the range of F. asagrayana . We document two strongly differenti-ated groups based on hypervariable microsatellites that are not resolved by either morphology or sequence data. The goal of this study is to test, using Bayesian and coalescence models, whether these groups represent reproductively isolated bio-logical species.
MATERIALS AND METHODS
Study species — Frullania asagrayana has separate male and female game-tophytes, as do all other taxa in the F. tamarisci complex, and lacks asexual reproduction by caducous leaves or gemmae, which are frequent in the closely related species F. microphylla (Gottsche) Pearson and F. fragilifolia (Taylor) Gottsche, Lindenb. & Nees ( Hentschel et al., 2009 ). The species forms sporo-phytes fairly frequently, though mating systems, including gamete dispersal distances and the effi cacy of sporeling establishment, are completely unknown. Frullania asagrayana typically occurs in deciduous forests, on tree bark, at the bases of trees, and on rocks. The species generally grows in small patches of a few square centimeters. It is likely that mating can occur only between indi-viduals growing on the same tree or rock, as sperm require water for movement from antheridia to archegonia.
Plant sampling — Regional sampling was based on 88 collections of F. asagrayana . The F. asagrayana samples represent most of the known range of this species, from New Brunswick south to Georgia, Alabama, Tennessee, and Kentucky ( Fig. 2 ) . There is a gap in our sampling along the mid-Atlantic states, and the species is also said to occur westward to Minnesota ( Schuster, 1992 ); future work should address these distributional gaps, but the results are not likely to affect our main goal of assessing reproductive isolation between the two groups of populations resolved by genetic analyses. Voucher information is provided in Appendix 1; specimens are preserved in the following herbaria: DUKE, TENN, and UNAF. Each population included in the regional sampling
Table 1. Primer sequences for microsatellite loci in species of the Frullania tamarisci complex.
Primer name 5 ′ 3 ′
Fru_9 ACACATGACTTGTAGGTGTAGC
ATTCCACAACCAAAGCCCC
Fru_10 AGCTAAGATGCTAATGCCCC
AGGTCCAAGTCCACCTTGC
Fru_22 CTCTGGCTCCATCTCCCAC
TGGATGAGTGGCAGTTCAC
Fru_29 ATGGAATTGCAACCGACATC
TTCTCCGCAGACCCTGAAC
Fru_39 TTGGGTACGTCCGAGGTTG
GGCGATTGATAGCGTGGAG
Fru_53 GGGTTCAAGCCCAAACAAAG
TCAATGAGTGATCCTTCTCCTCC
Fru_75 CAGTGAGGGAGACAGACGC
CCAGCGCCCCATTTTCTAC
Fru_79 GCAGAAGAGGAGGACGAGG
CTCTCCATCGGGGCCTAAC
Fru_83 CTAACGGCCCAAACCTTGC
TCCTTCCTGAACACTCTTTCG
Fru_84 GGAATTCGCTCAGTGGGAC
CACCAGGCTCAGAGGAGAYG
Fru_88 CCCGCTCTCCTGCTGATAG
CGATCACAGCATCGTCCTC
Fru_93 TTGCGACTCGAAGTTGTGC
GGAGCAGATGCGTTTGGTG
Fru_94 TCAGAATCGAGCGTGGGAG
CATCTGCTGCACCTGTTACG
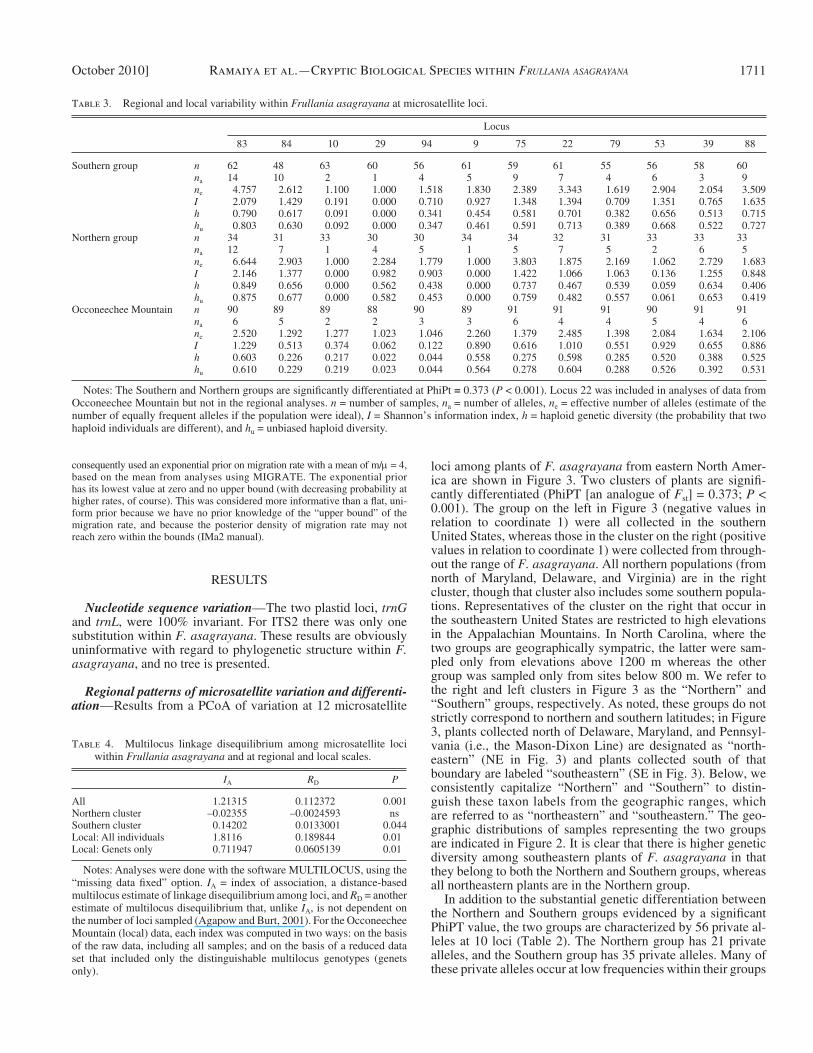
Fig. 3. Principal coordinate (PCo) plot of Frullania asagrayana sam-ples from eastern North America. Geographic provenance of samples: NE = northeastern United States, SE = southeastern United States, and O = Occoneechee Mountain. Percentage variance explained by the fi rst three coordinates: PCo1: 49.1%, PCo2: 13.8%, PCo3: 11.6, cumulative total: 74.4%).
1710 American Journal of Botany [Vol. 97
et al. (2008) . Across all loci and all samples, there was 6% missing data, rang-ing among loci from 0% (locus 83) to 18% (locus 93).
One allele was amplifi ed for most loci from most individuals, but in a lim-ited number of cases two alleles amplifi ed such that a gametophyte appeared to be heterozygous. As there is no evidence that gametophytes of F. asagrayana are polyploid, these occasional heterozygous patterns were interpreted as local-ized duplications. No individual in the data set was heterozygous for more than one locus, and 14 individuals (9% of all samples) were heterozygous at one locus. To analyze the data as haploid individuals, we took the conservative ap-proach of eliminating the second allele for individuals as necessary. In most cases the eliminated allele was unique to an individual that carried the dupli-cated locus. Our approach to deleting these alleles may result in a loss of some information but is conservative and would not affect the outcome of the analy-ses presented here. Duplicate alleles were eliminated from four loci.
Nucleotide sequencing — In an attempt to test a hypothesis of cryptic spe-ciation suggested by results of the microsatellite analyses, nucleotide sequences were obtained for the nuclear ribosomal ITS2 region and two plastid loci ( trn G [UCC] intron, trn L [UAA] 5 ′ exon- trn F [GAA] region; primer information pro-vided in Shaw et al., 2003) from 13 F. asagrayana . GenBank numbers for se-quences are provided in Appendix 1.
Statistical and phylogenetic analysis — Microsatellite data were analyzed as fragment sizes for analyses of population structure; alleles were coded as num-bers of nucleotides rather than repeat numbers. Estimates of variability, Shan-non ’ s diversity index, analyses of molecular variance (AMOVA), and principal coordinate analyses (PCoA) of samples were accomplished in GENALEX, ver-sion 6.0.3.3 ( Peakall and Smouse, 2006 ). Linkage disequilibrium (LD) among loci was estimated with MULTILOCUS (Agapow and Burt, 2001) with miss-ing data fi xed during randomizations. Analyses with other missing-data options did not change the results. Spatial autocorrelations for assessing the relation-ship between geographic and genetic distances among populations were ac-complished with GENALEX. Distance classes were created using the “ equal sample sizes ” method so that each class had an equal number of comparisons. In all analyses using GENALEX, genetic distance matrices were calculated with the “ interpolate missing data ” feature off.
After we observed that there were two well-marked clusters of F. asag-rayana populations on the basis of microsatellite variation, we assessed evi-dence of reproductive isolation between them using STRUCTURE, version 2.1.2 ( Pritchard et al., 2000 ), to test for genetic admixture within individuals, and MIGRATE-N, version 2.4 ( Beerli and Felsenstein, 2001 ; Beerli, 2005 ), and IMa2 ( Hey, 2010 ) to test for gene fl ow between the groups. Shared alleles be-tween the two groups could refl ect ancestral polymorphism or gene fl ow; MIGRATE assumes that all shared polymorphism results from gene fl ow, whereas IMa2 allows both ancestral polymorphism and gene fl ow subsequent to divergence.
For MIGRATE and IMa2, microsatellite allele sizes (in nucleotides) were converted to repeat numbers. To arrive at repeat numbers, the lowest allele length at a locus was subtracted from all alleles at that locus. This number was divided by 3, because the microsatellite library was made from trinucleotide repeats. “ Repeat number ” is, therefore, relative to the shortest allele at a locus. Eight loci (9, 10, 22, 29, 53, 79, 88, 94) showed repeats in regular intervals of three bases without any adjustment. For loci 83 and 84, the allele patterns were regular up to six and eight repeats (above the minimum allele length), respec-tively. The pattern then skips a single base but continues to be regular (for example, at locus 83 the calculated pattern in repeat number is … 3, 4, 5, 6, 7.333, 8.333, 9.333, 10.333 … ). At both loci, the repeat numbers were rounded down to the nearest integer and then rescaled so that the lowest integer at each locus was 30; this was done because IMa2 considers repeat numbers below 5 impossible. After adjustment, there were 10 loci treated as having regular allele patterns and that were converted to repeat numbers for IMa2 and MIGRATE.
Admixture analyses using STRUCTURE were run with K = 2 through K = 7, with 10 replicate runs of 1 million generations (following a burn-in of 250 000 generations) at each value of K . The optimum number of clusters ( K ) was as-sessed using the Δ - K method ( Evanno et al., 2005 ). MIGRATE was run with 10 replicate runs, each with a 1000-step burn-in, followed by 10 short chains (500 trees sampled) followed by fi ve long chains (5000 trees sampled) per locus. Convergence of the chains was evaluated on the basis of Gelmann ’ s R statistic, which was less than 1.2 for all loci. IMa2 analyses included 3604 sampled ge-nealogies per locus following a burn-in of 40 000 steps. The analyses were based on 150 chains, using a heating scheme suggested in the software manual for sites with high mutation rates. A uniform prior on migration rate was too low in initial runs, resulting in a fl at posterior distribution. In the fi nal runs, we
83, 84, 88, 93, and 94. Locus 22 was included in the study of local genetic structure at Occoneechee Mountain but not in the regional survey. Surveys of primer amplifi cation across a diversity of Frullania species indicate that these primers work for taxa within the F. tamarisci complex (i.e., F. asagrayana , F. californica (Austin ex Underw.) A. Evans, F. nisqualensis Sull., F. tamarisci ) but not more broadly across the genus. This specifi city contrasts with the situa-tion in the moss genus Sphagnum , where microsatellite markers developed for species in one complex amplify effectively without evidence of ascertainment bias across the whole genus ( Shaw et al., 2008 ). DNA extractions and microsat-ellite genotyping were accomplished according to protocols described by Ricca
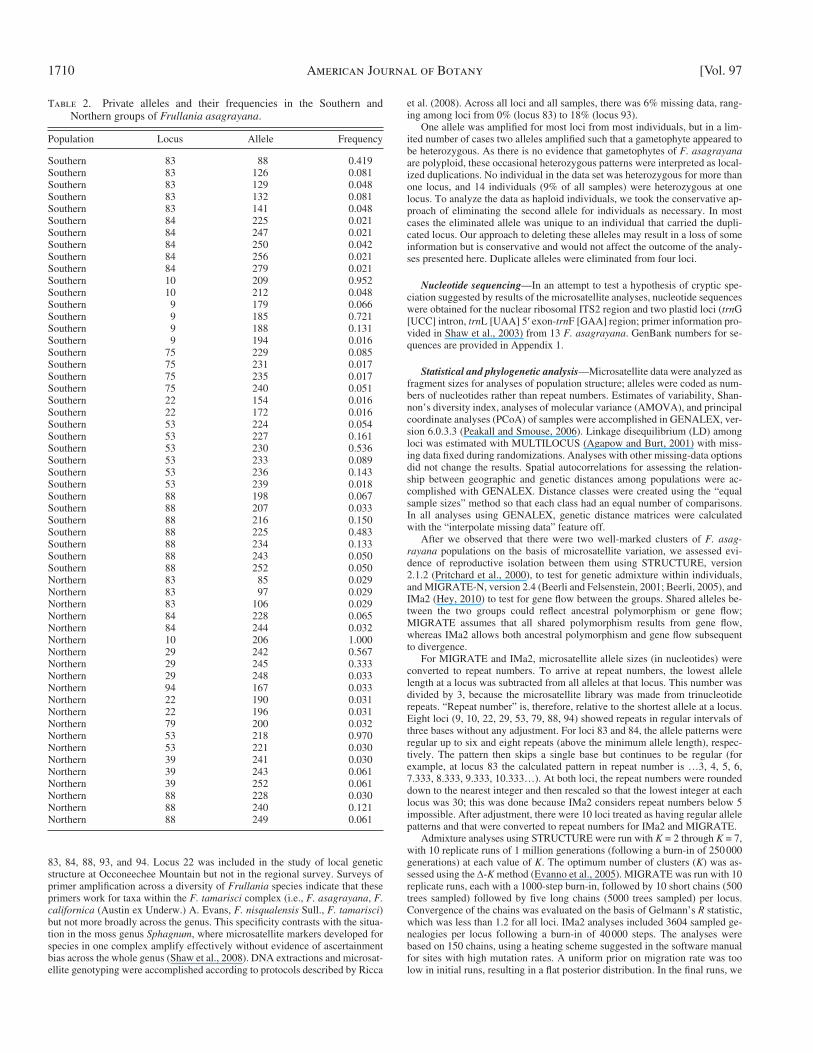
Table 2. Private alleles and their frequencies in the Southern and Northern groups of Frullania asagrayana .
Population Locus Allele Frequency
Southern 83 88 0.419Southern 83 126 0.081Southern 83 129 0.048Southern 83 132 0.081Southern 83 141 0.048Southern 84 225 0.021Southern 84 247 0.021Southern 84 250 0.042Southern 84 256 0.021Southern 84 279 0.021Southern 10 209 0.952Southern 10 212 0.048Southern 9 179 0.066Southern 9 185 0.721Southern 9 188 0.131Southern 9 194 0.016Southern 75 229 0.085Southern 75 231 0.017Southern 75 235 0.017Southern 75 240 0.051Southern 22 154 0.016Southern 22 172 0.016Southern 53 224 0.054Southern 53 227 0.161Southern 53 230 0.536Southern 53 233 0.089Southern 53 236 0.143Southern 53 239 0.018Southern 88 198 0.067Southern 88 207 0.033Southern 88 216 0.150Southern 88 225 0.483Southern 88 234 0.133Southern 88 243 0.050Southern 88 252 0.050Northern 83 85 0.029Northern 83 97 0.029Northern 83 106 0.029Northern 84 228 0.065Northern 84 244 0.032Northern 10 206 1.000Northern 29 242 0.567Northern 29 245 0.333Northern 29 248 0.033Northern 94 167 0.033Northern 22 190 0.031Northern 22 196 0.031Northern 79 200 0.032Northern 53 218 0.970Northern 53 221 0.030Northern 39 241 0.030Northern 39 243 0.061Northern 39 252 0.061Northern 88 228 0.030Northern 88 240 0.121Northern 88 249 0.061
1711October 2010] Ramaiya et al. — Cryptic Biological Species within FRULLANIA ASAGRAYANA
loci among plants of F. asagrayana from eastern North Amer-ica are shown in Figure 3 . Two clusters of plants are signifi -cantly differentiated (PhiPT [an analogue of F st ] = 0.373; P < 0.001). The group on the left in Figure 3 (negative values in relation to coordinate 1) were all collected in the southern United States, whereas those in the cluster on the right (positive values in relation to coordinate 1) were collected from through-out the range of F. asagrayana . All northern populations (from north of Maryland, Delaware, and Virginia) are in the right cluster, though that cluster also includes some southern popula-tions. Representatives of the cluster on the right that occur in the southeastern United States are restricted to high elevations in the Appalachian Mountains. In North Carolina, where the two groups are geographically sympatric, the latter were sam-pled only from elevations above 1200 m whereas the other group was sampled only from sites below 800 m. We refer to the right and left clusters in Figure 3 as the “ Northern ” and “ Southern ” groups, respectively. As noted, these groups do not strictly correspond to northern and southern latitudes; in Figure 3 , plants collected north of Delaware, Maryland, and Pennsyl-vania (i.e., the Mason-Dixon Line) are designated as “ north-eastern ” (NE in Fig. 3) and plants collected south of that boundary are labeled “ southeastern ” (SE in Fig. 3). Below, we consistently capitalize “ Northern ” and “ Southern ” to distin-guish these taxon labels from the geographic ranges, which are referred to as “ northeastern ” and “ southeastern. ” The geo-graphic distributions of samples representing the two groups are indicated in Figure 2 . It is clear that there is higher genetic diversity among southeastern plants of F. asagrayana in that they belong to both the Northern and Southern groups, whereas all northeastern plants are in the Northern group.
In addition to the substantial genetic differentiation between the Northern and Southern groups evidenced by a signifi cant PhiPT value, the two groups are characterized by 56 private al-leles at 10 loci ( Table 2 ) . The Northern group has 21 private alleles, and the Southern group has 35 private alleles. Many of these private alleles occur at low frequencies within their groups
consequently used an exponential prior on migration rate with a mean of m/ μ = 4, based on the mean from analyses using MIGRATE. The exponential prior has its lowest value at zero and no upper bound (with decreasing probability at higher rates, of course). This was considered more informative than a fl at, uni-form prior because we have no prior knowledge of the “ upper bound ” of the migration rate, and because the posterior density of migration rate may not reach zero within the bounds (IMa2 manual).
RESULTS
Nucleotide sequence variation — The two plastid loci, trnG and trnL , were 100% invariant. For ITS2 there was only one substitution within F. asagrayana . These results are obviously uninformative with regard to phylogenetic structure within F. asagrayana , and no tree is presented.
Regional patterns of microsatellite variation and differenti-ation — Results from a PCoA of variation at 12 microsatellite
Table 3. Regional and local variability within Frullania asagrayana at microsatellite loci.
Locus
83 84 10 29 94 9 75 22 79 53 39 88
Southern group n 62 48 63 60 56 61 59 61 55 56 58 60 n a 14 10 2 1 4 5 9 7 4 6 3 9 n e 4.757 2.612 1.100 1.000 1.518 1.830 2.389 3.343 1.619 2.904 2.054 3.509 I 2.079 1.429 0.191 0.000 0.710 0.927 1.348 1.394 0.709 1.351 0.765 1.635 h 0.790 0.617 0.091 0.000 0.341 0.454 0.581 0.701 0.382 0.656 0.513 0.715 h u 0.803 0.630 0.092 0.000 0.347 0.461 0.591 0.713 0.389 0.668 0.522 0.727
Northern group n 34 31 33 30 30 34 34 32 31 33 33 33 n a 12 7 1 4 5 1 5 7 5 2 6 5 n e 6.644 2.903 1.000 2.284 1.779 1.000 3.803 1.875 2.169 1.062 2.729 1.683 I 2.146 1.377 0.000 0.982 0.903 0.000 1.422 1.066 1.063 0.136 1.255 0.848 h 0.849 0.656 0.000 0.562 0.438 0.000 0.737 0.467 0.539 0.059 0.634 0.406 h u 0.875 0.677 0.000 0.582 0.453 0.000 0.759 0.482 0.557 0.061 0.653 0.419
Occoneechee Mountain n 90 89 89 88 90 89 91 91 91 90 91 91 n a 6 5 2 2 3 3 6 4 4 5 4 6 n e 2.520 1.292 1.277 1.023 1.046 2.260 1.379 2.485 1.398 2.084 1.634 2.106 I 1.229 0.513 0.374 0.062 0.122 0.890 0.616 1.010 0.551 0.929 0.655 0.886 h 0.603 0.226 0.217 0.022 0.044 0.558 0.275 0.598 0.285 0.520 0.388 0.525 h u 0.610 0.229 0.219 0.023 0.044 0.564 0.278 0.604 0.288 0.526 0.392 0.531
Notes: The Southern and Northern groups are signifi cantly differentiated at PhiPt = 0.373 ( P < 0.001). Locus 22 was included in analyses of data from Occoneechee Mountain but not in the regional analyses. n = number of samples, n a = number of alleles, n e = effective number of alleles (estimate of the number of equally frequent alleles if the population were ideal), I = Shannon ’ s information index, h = haploid genetic diversity (the probability that two haploid individuals are different), and h u = unbiased haploid diversity.
Table 4. Multilocus linkage disequilibrium among microsatellite loci within Frullania asagrayana and at regional and local scales.
I A R D P
All 1.21315 0.112372 0.001Northern cluster – 0.02355 – 0.0024593 nsSouthern cluster 0.14202 0.0133001 0.044Local: All individuals 1.8116 0.189844 0.01Local: Genets only 0.711947 0.0605139 0.01
Notes: Analyses were done with the software MULTILOCUS, using the “ missing data fi xed ” option. I A = index of association, a distance-based multilocus estimate of linkage disequilibrium among loci, and R D = another estimate of multilocus disequilibrium that, unlike I A , is not dependent on the number of loci sampled (Agapow and Burt, 2001 ). For the Occoneechee Mountain (local) data, each index was computed in two ways: on the basis of the raw data, including all samples; and on the basis of a reduced data set that included only the distinguishable multilocus genotypes (genets only).

1712 American Journal of Botany [Vol. 97
with alleles at frequencies greater than 0.5 that are private to the group, and another (locus 88) that occurs at a frequency of 0.483 (allele 225).
Within F. asagrayana overall, 11 of the 12 loci are polymor-phic (92%) and the numbers of alleles per polymorphic locus range from 2 (locus 10) to 14 (locus 83). Overall diversity ( h ) is 0.580 ( ± 0.068 SE). Diversity statistics are provided separately for the Northern and Southern groups ( Table 3 ) . A total of 80 alleles were detected in the Southern group, compared with 60 in the Northern group. Differences in genetic variation between the Northern and Southern groups vary among loci, but overall the two groups are similar in levels of genetic diversity ( I = 1.00 vs. 0.933, h = 0.487 vs. 0.446 for the Southern and Northern groups, respectively, averaged across loci). There is no evi-dence of linkage disequilibrium among microsatellite loci within the Northern group; LD is very low but signifi cantly dif-ferent from zero in the Southern group ( Table 4 ) . Consistent with the lack or near lack of linkage disequilibrium among loci, there is little evidence of regional population structure within the Northern and Southern groups ( Fig. 4 ) . These results are consistent with free recombination within the Northern and Southern groups, along with effective spore dispersal within their regional ranges. LD is signifi cant in the overall data set containing both Northern and Southern plants because of dif-ferentiation between the two groups ( Table 4 ).
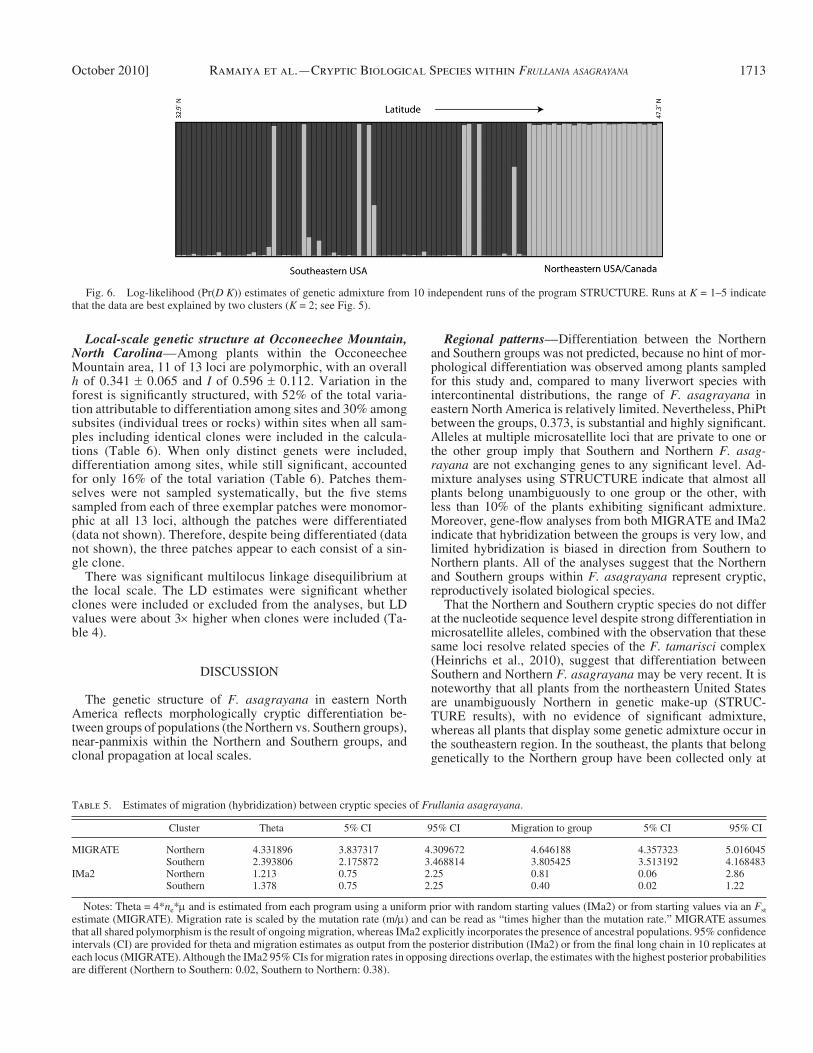
Gene fl ow between the Northern and Southern groups — Analyses using STRUCTURE indicated that two groups of populations best fi t the data ( Fig. 5 ) , and these correspond to the Northern and Southern groups resolved by PCoA ( Fig. 6 ) . Also in agreement with the PCoA results, plants belonging to the Southern group are restricted to lower latitudes in the southeast-ern United States whereas Northern-group plants in North Carolina are restricted to high elevations. Five plants are characterized by substantial admixture of alleles from the Northern and Southern groups. One is more than 50% Northern in its genetic make-up, another is close to 50% Northern, and three others are predominantly Southern but have substantial Northern genetic components. A few other plants from the southeastern region appear to have limited amounts of genetic infl uence from Northern plants.
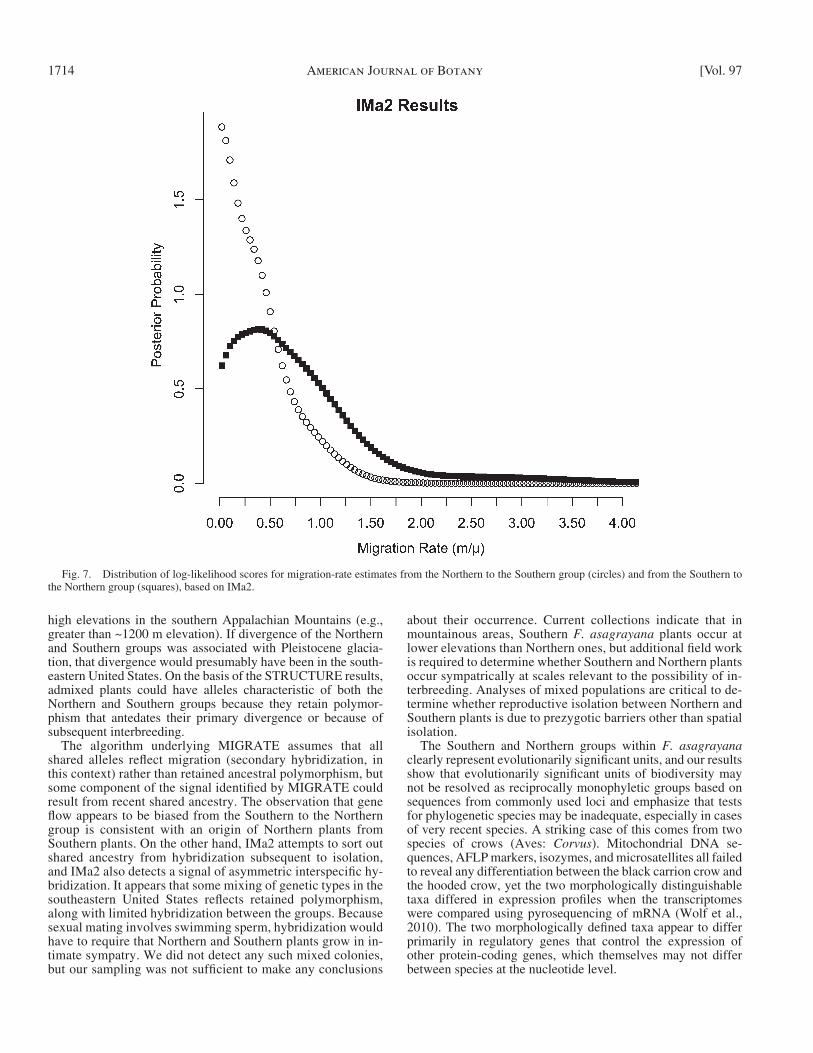
Both MIGRATE and IMa2 converge on a similar result with regard to gene fl ow between the Northern and Southern groups ( Table 5 ) . Both indicate that gene fl ow is very limited but signifi cantly greater than zero. MIGRATE estimates that gene fl ow is about 3.5 × the mutation rate but does not con-sider the possibility that shared polymorphisms are ancestral. When accounting for ancestral polymorphism in IMa2, the migration rates are still signifi cantly above zero but are much lower. A likelihood ratio test in MIGRATE confi rmed that gene fl ow is signifi cantly greater than zero (AIC = 37 716, df = 2) and signifi cantly asymmetric (AIC = – 78.14, df = 2), in favor of a higher rate from the Southern group to the Northern group. In IMa2, the posterior distribution of the migration rate from the Southern to the Northern group clearly peaks to the right of zero, whereas the migration from Northern to South-ern peaks close to zero ( Fig. 7 ) . Further evidence for asym-metric gene fl ow is that the 95% confi dence intervals around the mean of the two migration-rate estimates are nonoverlap-ping in the MIGRATE results ( Table 5 ). Both methods sug-gest that gene fl ow is asymmetric, with fl ow from the Southern to the Northern group being higher than fl ow from the North-ern to the Southern.
(e.g., 41 of the 56 alleles have frequencies below 0.10), but some are more common and one allele unique to the Northern group is fi xed (at locus 10). An alternative allele at this locus is nearly fi xed in the Southern group (one individual has a second, unique allele). The Southern group has three loci (9, 10, and 53)
Fig. 4. Spatial autocorrelation between genetic and geographic dis-tances among populations of Frullania asagrayana in eastern North Amer-ica. Distance classes (km) were designed to have equal sample sizes. Dotted lines show confi dence intervals for the null distribution (no isola-tion-by-distance), and the error bars were calculated by permuting the samples 1000 times. A signifi cantly positive R would indicate isolation-by-distance within that distance class.
Fig. 5. Plot of Δ - K ( Evanno et al., 2005 ) in relation to number of clus-ters resolved in STRUCTURE analyses.
1713October 2010] Ramaiya et al. — Cryptic Biological Species within FRULLANIA ASAGRAYANA
Regional patterns — Differentiation between the Northern and Southern groups was not predicted, because no hint of mor-phological differentiation was observed among plants sampled for this study and, compared to many liverwort species with intercontinental distributions, the range of F. asagrayana in eastern North America is relatively limited. Nevertheless, PhiPt between the groups, 0.373, is substantial and highly signifi cant. Alleles at multiple microsatellite loci that are private to one or the other group imply that Southern and Northern F. asag-rayana are not exchanging genes to any signifi cant level. Ad-mixture analyses using STRUCTURE indicate that almost all plants belong unambiguously to one group or the other, with less than 10% of the plants exhibiting signifi cant admixture. Moreover, gene-fl ow analyses from both MIGRATE and IMa2 indicate that hybridization between the groups is very low, and limited hybridization is biased in direction from Southern to Northern plants. All of the analyses suggest that the Northern and Southern groups within F. asagrayana represent cryptic, reproductively isolated biological species.
That the Northern and Southern cryptic species do not differ at the nucleotide sequence level despite strong differentiation in microsatellite alleles, combined with the observation that these same loci resolve related species of the F. tamarisci complex (Heinrichs et al., 2010), suggest that differentiation between Southern and Northern F. asagrayana may be very recent. It is noteworthy that all plants from the northeastern United States are unambiguously Northern in genetic make-up (STRUC-TURE results), with no evidence of signifi cant admixture, whereas all plants that display some genetic admixture occur in the southeastern region. In the southeast, the plants that belong genetically to the Northern group have been collected only at
Local-scale genetic structure at Occoneechee Mountain , North Carolina — Among plants within the Occoneechee Mountain area, 11 of 13 loci are polymorphic, with an overall h of 0.341 ± 0.065 and I of 0.596 ± 0.112. Variation in the forest is signifi cantly structured, with 52% of the total varia-tion attributable to differentiation among sites and 30% among subsites (individual trees or rocks) within sites when all sam-ples including identical clones were included in the calcula-tions ( Table 6 ) . When only distinct genets were included, differentiation among sites, while still signifi cant, accounted for only 16% of the total variation ( Table 6 ). Patches them-selves were not sampled systematically, but the fi ve stems sampled from each of three exemplar patches were monomor-phic at all 13 loci, although the patches were differentiated (data not shown). Therefore, despite being differentiated (data not shown), the three patches appear to each consist of a sin-gle clone.
There was signifi cant multilocus linkage disequilibrium at the local scale. The LD estimates were signifi cant whether clones were included or excluded from the analyses, but LD values were about 3 × higher when clones were included ( Ta-ble 4 ).
DISCUSSION
The genetic structure of F. asagrayana in eastern North America refl ects morphologically cryptic differentiation be-tween groups of populations (the Northern vs. Southern groups), near-panmixis within the Northern and Southern groups, and clonal propagation at local scales.
Fig. 6. Log-likelihood (Pr( D K )) estimates of genetic admixture from 10 independent runs of the program STRUCTURE. Runs at K = 1 – 5 indicate that the data are best explained by two clusters ( K = 2; see Fig. 5 ).
Table 5. Estimates of migration (hybridization) between cryptic species of Frullania asagrayana .
Cluster Theta 5% CI 95% CI Migration to group 5% CI 95% CI
MIGRATE Northern 4.331896 3.837317 4.309672 4.646188 4.357323 5.016045Southern 2.393806 2.175872 3.468814 3.805425 3.513192 4.168483
IMa2 Northern 1.213 0.75 2.25 0.81 0.06 2.86Southern 1.378 0.75 2.25 0.40 0.02 1.22
Notes: Theta = 4* n e * μ and is estimated from each program using a uniform prior with random starting values (IMa2) or from starting values via an F st estimate (MIGRATE). Migration rate is scaled by the mutation rate (m/ μ ) and can be read as “ times higher than the mutation rate. ” MIGRATE assumes that all shared polymorphism is the result of ongoing migration, whereas IMa2 explicitly incorporates the presence of ancestral populations. 95% confi dence intervals (CI) are provided for theta and migration estimates as output from the posterior distribution (IMa2) or from the fi nal long chain in 10 replicates at each locus (MIGRATE). Although the IMa2 95% CIs for migration rates in opposing directions overlap, the estimates with the highest posterior probabilities are different (Northern to Southern: 0.02, Southern to Northern: 0.38).
1714 American Journal of Botany [Vol. 97
about their occurrence. Current collections indicate that in mountainous areas, Southern F. asagrayana plants occur at lower elevations than Northern ones, but additional fi eld work is required to determine whether Southern and Northern plants occur sympatrically at scales relevant to the possibility of in-terbreeding. Analyses of mixed populations are critical to de-termine whether reproductive isolation between Northern and Southern plants is due to prezygotic barriers other than spatial isolation.
The Southern and Northern groups within F. asagrayana clearly represent evolutionarily signifi cant units, and our results show that evolutionarily signifi cant units of biodiversity may not be resolved as reciprocally monophyletic groups based on sequences from commonly used loci and emphasize that tests for phylogenetic species may be inadequate, especially in cases of very recent species. A striking case of this comes from two species of crows (Aves: Corvus ). Mitochondrial DNA se-quences, AFLP markers, isozymes, and microsatellites all failed to reveal any differentiation between the black carrion crow and the hooded crow, yet the two morphologically distinguishable taxa differed in expression profi les when the transcriptomes were compared using pyrosequencing of mRNA ( Wolf et al., 2010 ). The two morphologically defi ned taxa appear to differ primarily in regulatory genes that control the expression of other protein-coding genes, which themselves may not differ between species at the nucleotide level.
high elevations in the southern Appalachian Mountains (e.g., greater than ~1200 m elevation). If divergence of the Northern and Southern groups was associated with Pleistocene glacia-tion, that divergence would presumably have been in the south-eastern United States. On the basis of the STRUCTURE results, admixed plants could have alleles characteristic of both the Northern and Southern groups because they retain polymor-phism that antedates their primary divergence or because of subsequent interbreeding.
The algorithm underlying MIGRATE assumes that all shared alleles refl ect migration (secondary hybridization, in this context) rather than retained ancestral polymorphism, but some component of the signal identifi ed by MIGRATE could result from recent shared ancestry. The observation that gene fl ow appears to be biased from the Southern to the Northern group is consistent with an origin of Northern plants from Southern plants. On the other hand, IMa2 attempts to sort out shared ancestry from hybridization subsequent to isolation, and IMa2 also detects a signal of asymmetric interspecifi c hy-bridization. It appears that some mixing of genetic types in the southeastern United States refl ects retained polymorphism, along with limited hybridization between the groups. Because sexual mating involves swimming sperm, hybridization would have to require that Northern and Southern plants grow in in-timate sympatry. We did not detect any such mixed colonies, but our sampling was not suffi cient to make any conclusions
Fig. 7. Distribution of log-likelihood scores for migration-rate estimates from the Northern to the Southern group (circles) and from the Southern to the Northern group (squares), based on IMa2.

1715October 2010] Ramaiya et al. — Cryptic Biological Species within FRULLANIA ASAGRAYANA
Northern samples ( Fig. 3 ) shows why this seeming contradic-tion occurs. The plants at Occoneechee Mountain represent a broad sample of genetic types within the Southern group; ap-parently, genetic diversity at the Occoneechee site represents a random sample of genetic variation in the Southern group overall, derived by independent colonization of Occoneechee Mountain from disparate source populations. Subsequent to these colonizations, clonal propagation with limited dispersal of clones, along with restricted gene-fl ow distances via gamete dispersal, create genetically differentiated genetic neighbor-hoods. The observation that linkage disequilibrium estimates were about 3 × higher when clones were included in the com-putation than when only distinct multilocus genotypes were included shows that clonality contributes signifi cantly to ge-netic structure at the site. Linkage disequilibrium is still sig-nifi cantly greater than zero at Occoneechee Mountain when distinct genets only are included, which shows that sexual re-combination and spore dispersal within the forest site are in-suffi cient to homogenize subpopulations.
The genetic patterns we observed are consistent with the model of spore dispersal Sundberg (2005) developed for peat mosses ( Sphagnum ), another group of spore-reproducing plants. From empirical estimates of spore dispersal patterns, Sundberg made the prediction that a signal of isolation-by-distance should be detectable over local scales but that over increasing distances the spore rain would have a higher and higher representation from more distant populations. Our results, with no evidence of geographic structure at regional scales but strong evidence of structure at local scales, fi t those predictions well.
Few genera of mosses and liverworts are endemic to single continents, and even most individual temperate or boreal spe-cies have intercontinental ranges ( Crum, 1972 ; Schofi eld, 1985 ; Shaw, 2001 ). Some have interpreted intercontinental ranges as evidence of ancient vicariance associated with con-tinental drift and slow morphological evolution within species (e.g., Anderson, 1963 ; Crum, 1972 ; Frey et al., 1999 ), but there is a growing consensus, based on phylogenetic analyses, that most disjunctions more likely refl ect long-distance dis-persal ( Shaw, 2001 ; Hartmann et al., 2006 ; Heinrichs et al ., 2006 , 2009a ; Feldberg et al., 2007). On the other hand, in-fraspecifi c genetic structure at local and regional scales fre-quently show evidence of isolation-by-distance ( Cronberg, 2000 ; Sn ä ll et al ., 2004a ; Pohjamo et al ., 2006 ). Ecological studies similarly suggest dispersal limitations on patch occu-pancy in fragmented habitats ( Sn ä ll et al., 2004b ; Pharo and Zartman, 2007 ; L ö bel et al., 2009 ).
Some studies of genetic variation in widespread species have failed to detect population structure (e.g., Cronberg et al., 1997 ; Akiyama, 1994 ; Shaw et al., 2009 ) and imply near-panmixis at the landscape and regional scales. Anthropogenic substrates are often colonized by species not present in the local environment ( Abts and Heinrichs, 1997 ; Soro et al., 1999; Miller and McDaniel, 2005 ), demonstrating effective dispersal and establishment over regional scales. Of course, the bryophyte fl oras of oceanic is-lands attest to the dispersal abilities of species. Repeated coloni-zation of islands is a likely explanation for low levels of island endemism compared with seed plants ( Vanderpoorten et al., 2008 ). Clearly, there is tremendous interspecifi c variation among mosses and liverworts in regional and local genetic structure and in the extent to which species exhibit dispersal limitations. Divergent observations raise interesting questions about species-specifi c metapopulation processes such as dispersal and establishment abilities and local extinction rates.
Genetically and phylogenetically divergent population-groups with species have been documented in diverse groups of organisms, including plants, animals, and microorganisms. Pat-terns of infraspecifi c genetic structure in plants of eastern North America are highly diverse and likely refl ect multiple causes ( Soltis et al., 2006 ). Latitudinal divergence and differences in genetic diversity have been documented, although the patterns are not as congruent across species as in Europe, where the main mountain systems run east to west ( Soltis et al., 2006 ). In the mosses, regional genetic structure within eastern North America has rarely been detected (though studies have been limited); no evidence of differentiation was detected in the peat moss Sphagnum torreyanum Sull., sampled from Newfound-land to the Gulf Coast using microsatellites ( Shaw et al., 2009 ). On the other hand, the eastern North American species, S. mac-rophyllum Brid., includes reciprocally monophyletic, highly differentiated northern and southern clades (M. G. Johnson et al. unpublished data).
Within-region patterns — The importance of sexual repro-duction and spores in the life cycles of mosses and liverworts has been extensively debated ( Anderson, 1963 ; Longton and Miles, 1982 ; Sundberg and Rydin, 2002 ). Although many or most liverworts (like mosses) have the capacity for asexual propagation of gametophytes, the absence of linkage disequi-librium within the Southern and Northern groups of F. asag-rayana demonstrates that sexual reproduction is an important process in these taxa. Indeed, evidence of extensive recombina-tion among microsatellite loci, combined with the absence of any sign of isolation-by-distance among populations, suggests that the Southern and Northern groups each represent panmictic or nearly panmictic population systems over quite broad geo-graphic ranges. These results present a picture of outcrossing among gametophytes and effective dispersal and establishment by spores. Observations that suggest sexual recombination and effective regional mixing within the Southern and Northern groups reinforce the signifi cance of apparent reproductive iso-lation between the two cryptic species.
Local patterns — While regional patterns within the North-ern and Southern groups suggest genetic recombination and effective migration associated with spore production and dis-persal, local genetic structure at Occoneechee Mountain docu-ments clonality and differentiation among proximate genetic neighborhoods. There might seem to be a contradiction be-tween panmixis at the regional scale and marked population structure at the local scale, but plotting the Occoneechee Mountain plants within the PCoA analysis of all Southern and
Table 6. Hierarchical partitioning of genetic variation within Frullania asagrayana among sites, subsites, and patches at Occoneechee Mountain, North Carolina (* P < 0.01, ** P < 0.001).
All individuals df SS MSEstimated variance
Percent variance PhiPT
Among sites 3 354.488 118.163 5.617 52%Among subsites 10 227.242 22.724 4.181 38%Among patches 59 63.283 1.073 1.073 10%Total 72 645.014 10.870 100% 0.901
Genets onlyAmong sites 3 53.783 17.928 2.019 16%Within sites 11 115.283 10.480 10.480 84%Total 14 169.067 12.499 100% 0.162
1716 American Journal of Botany [Vol. 97
Heinrichs , J. , J. Hentschel , A. Bombosch , A. Fiebig , J. Reise , M. Edelmann, et al . 2010. One species or at least eight? Delimitation and distribution of Frullania tamarisci (L.) Dumort. s. l. (Jungermanniopsida, Porellales) inferred from nuclear and chlo-roplast DNA markers. Molecular Phylogenetics and Evolution 56: 1105 – 1114.
Heinrichs , J. , J. Hentschel , K. Feldberg , A. Bombosch , and H. Schneider . 2009a . Phylogenetic biogeography and taxonomy of disjunctly distributed bryophytes. Journal of Systematics and Evolution 47 : 497 – 508 .
Heinrichs , J. , F. Klugmann , J. Hentschel , and H. Schneider . 2009b . DNA taxonomy, cryptic speciation and diversifi cation of the Neotropical-African liverwort, Marchesinia brachiata (Lejeuneaceae, Porellales). Molecular Phylogenetics and Evolution 53 : 113 – 121 .
Heinrichs , J. , M. Lindner , H. Groth , J. Hentschel , K. Feldberg , C. Renker , J. J. Engel , et al . 2006 . Goodbye or welcome Gondwana? — Insights into the phylogenetic biogeography of the leafy liverwort Plagiochila with a description of Proskauera , gen. nov. (Plagiochilaceae, Jungermanniales). Plant Systematics and Evolution 258 : 227 – 250 .
Hentschel , J. , M. Von Konrat , T. P ó cs , A. Sch ä fer-Verwimp , A. J. Shaw , H. Schneider , and J. Heinrichs . 2009 . Molecular insights into the phylogeny and subgeneric classifi cation of Frullania Raddi (Frullaniaceae, Porellales). Molecular Phylogenetics and Evolution 52 : 142 – 156 .
Hey , J. 2010 . Isolation with migration models for more than two popula-tions. Molecular Biology and Evolution 27 : 905 – 920 .
Hicks , M. L. 1992 . Guide to the liverworts of North Carolina. Duke University Press, Durham, North Carolina, USA.
Holyoak , D. T. , and L. Heden ä s . 2006 . Morphological, ecological and molecular studies of the intergrading taxa Bryum neodamense and B. pseudotriquetrum (Bryopsida. Bryaceae). Journal of Bryology 28 : 299 – 311 .
Holyoak , D. T. , and N. Pedersen . 2007 . Confl icting molecular and morphological evidence of evolution within the Bryaceae (Bryophyta) and its implications for generic taxonomy. Journal of Bryology 29 : 111 – 124 .
L ö bel , S. , T. Sn ä ll , and R. Rydin . 2009 . Mating system, reproductive mode and diaspore size affect metacommunity diversity. Journal of Ecology 97 : 176 – 185 .
Longton , R. E. , and C. J. Miles . 1982 . Studies on the reproductive biology of mosses. Journal of the Hattori Botanical Laboratory 52 : 219 – 240 .
Miller , N. G. , and S. F. Mcdaniel . 2005 . Bryophyte dispersal in-ferred from colonization of an introduced substratum on Whiteface Mountain, New York. Bryologist 91 : 1173 – 1182 .
Patterson , E. , S. Boles , and A. J. Shaw . 1998 . Nuclear ribosomal DNA variation in Leucobryum glaucum and L. albidum (Leucobryaceae): A preliminary investigation. Bryologist 101 : 272 – 277 .
Peakall , R. , and P. E. Smouse . 2006 . GENALEX 6: Genetic analy-sis in Excel. Population genetic software for teaching and research. Molecular Ecology Notes 6 : 288 – 295 .
Pharo , E. J. , and C. E. Zartman . 2007 . Bryophytes in a changing landscape: The hierarchical effects of habitat fragmentation on eco-logical and evolutionary processes. Biological Conservation 135 : 315 – 325 .
Pohjamo , M. , S. Laaka-Lindberg , O. Ovaskainen , and H. Korpelainen . 2006 . Dispersal potential of spores and asexual diasporas in the epixylic hepatic Anastrophyllum hellerianum. Evolutionary Ecology 20 : 415 – 430 .
Pritchard , J. K. , M. Stephens , and P. Donnelly . 2000 . Inference of population structure using multilocus genotype data. Genetics 155 : 945 – 959 .
Ricca , M. , F. W. Beecher , S. B. Boles , E. Temsch , J. Greilhuber , E. F. Karlin , and A. J. Shaw . 2008 . Cytotype variation and allopo-lyploidy in North American species of the Sphagnum subsecundum complex. American Journal of Botany 95 : 1606 – 1620 .
S å stad , S. M. 1999 . Genetic and environmental sources of variation in leaf morphology of Sphagnum fallax and Sphagnum isoviitae
LITERATURE CITED
Abts , U. W. , and J. Heinrichs . 1997 . Zur Moosfl ora der Eternit- und Betonziegeld ä cher des Niederrheinischen Tiefl andes (Nordrhein-Westfalen). Bryologische Mitteilungen 2 : 5 – 10 .
Agapow , P.-M., and A. Burt . 2001 . Indices of multilocus linkage dis-equilibrium. Molecular Ecology Notes 1 : 101 – 102 .
Akiyama , H. 1994 . Allozyme variability within and among populations of the epiphytic moss Leucodon (Leucondontaceae: Musci). American Journal of Botany 81 : 1280 – 1287 .
Anderson , L. E. 1963 . Modern species concepts: Mosses. Bryologist 66 : 107 – 119 .
Beerli , P. 2005 . Comparison of Bayesian and maximum likelihood in-ference of population genetic parameters. Bioinformatics (Oxford, England) 22 : 341 – 345 .
Beerli , P. , and J. Felsenstein . 2001 . Maximum likelihood estimation of a migration matrix and effective population sizes in n subpopu-lations by using a coalescent approach. Proceedings of the National Academy of Sciences, USA 98 : 4563 – 4568 .
Buryova , B. , and A. J. Shaw . 2005 . Phenotypic plasticity in Philonotis fontana (Bryopsida: Bartramiaceae). Journal of Bryology 27 : 13 – 22 .
Crandall-Stotler , B. , R. E. Stotler , and P. Geissler . 1987 . A biosystematic study of the subspecies of Frullania tamarisci (L.). Bryologist 90 : 287 – 308 .
Cronberg , N. 2000 . Absence of genetic variation in populations of the liverwort Plagiochila porelloides from northern Greece and southern Scandinavia. Lindbergia 25 : 20 – 24 .
Cronberg , N. , U. Molau , and M. Sonesson . 1997 . Genetic variation in the clonal bryophyte Hylocomium splendens at hierarchical geo-graphic scales in Scandinavia. Heredity 78 : 293 – 301 .
Crum , H. A. 1972 . The geographic origins of the mosses of North America ’ s eastern deciduous forest. Journal of the Hattori Botanical Laboratory 35 : 269 – 298 .
Evanno , G. , S. Regnaut , and J. Goudet . 2005 . Detecting the number of clusters of individuals using the software STRUCTURE: A simula-tion study. Molecular Ecology 14 : 2611 – 2620 .
Feldberg , K. , J. Hentschel , R. Wilson , D. S. Rycroft , D. Glenny , and J. Heinrichs . 2007 . Phylogenetic biogeography of the leafy liverwort Herbertus (Jungermanniales, Herbertaceae) based on nuclear and chlo-roplast DNA sequence data: Correlation between genetic variation and geographical distribution. Journal of Biogeography 34 : 688 – 689 .
Feldberg , K. , J. Va ñ a , D. G. Long , J. Shaw , J. Hentschel , and J. Heinrichs . 2010 . A phylogeny of Adelanthaceae (Jungermanniales, Marchantiophyta) based on nuclear and chloroplast DNA markers, with comments on classifi cation, cryptic speciation and biogeogra-phy. Molecular Phylogenetics and Evolution 55 : 293 – 304 .
Frey , W. , M. Stech , and K. Meissner . 1999 . Chloroplast DNA relation-ships in the palaeoaustral Lopidium concinnum (Hypopterygiaceae, Musci). An example of stenoevolution in mosses. Studies in austral temperate rain forest bryophytes 2. Plant Systematics and Evolution 218 : 67 – 75 .
Fuselier , L. , P. G. Davison , M. Clements , B. Shaw , N. Devos , J. Heinrichs , J. Hentschel , et al. 2009 . Phylogeographic analy-ses reveal distinct lineages of Metzgeria furcata (L.) Dumort. and M. conjugata Lindb. (Metzgeriaceae) in Europe and North America. Biological Journal of the Linnean Society 98 : 745 – 756 .
Grolle , R. 1970 . Zur Kenntnis der Frullanien in Europa und Makaronesien. Wissenschaftliche Zeitschrift der Friedrich-Schiller-Universit ä t Jena/Th ü ringen. Mathematisch-naturwissenschaftliche Reihe 19 : 307 – 319 .
Hattori , S. 1972 . Frullania tamarisci -complex and the species concept. Journal of the Hattori Botanical Laboratory 35 : 202 – 251 .
Hartmann , F. A., R . Wilson , S.R . Gradstein , H. Schneider , and J. Heinrichs . 2006 . Testing hypotheses on species delimitations and dis-junctions in the liverwort Bryopteris (Jungermanniopsida: Lejeuneaceae) . International Journal of Plant Sciences 167 : 1205 – 1214 .
Heden ä s , L. 2008 . Molecular variation in Drepanocladus aduncus s.l. does not support recognition of more than one species in Europe. Journal of Bryology 30 : 108 – 120 .

1717October 2010] Ramaiya et al. — Cryptic Biological Species within FRULLANIA ASAGRAYANA
(Bryopsida): Comparison of experiments conducted in the fi eld and laboratory. Canadian Journal of Botany 77 : 1 – 10 .
Schofield , W. B. 1985 . Introduction to Bryology. Macmillan, New York, New York, USA.
Schuster , R. M. 1992 . The Hepaticae and Anthocerotae of North America east of the hundredth meridian, vol. 5. Field Museum of Natural History, Chicago, Illinois, USA.
Shaw , A. J. 2001 . Biogeographic patterns and cryptic speciation in bryo-phytes. Journal of Biogeography 28 : 253 – 261 .
Shaw , A. J. , T. Cao , L.-S. Wang , K. I. Flatberg , B. Flatberg , B. Shaw , P. Zhou , et al . 2008 . Genetic variation in three Chinese peat mosses (Sphagnum) based on microsatellite markers, with primer information and analysis of ascertainment bias. Bryologist 111 : 271 – 281 .
Shaw , A. J. , C. J. Cox , and S. B. Boles . 2003 . Polarity of peatmoss (Sphagnum) evolution: Who says mosses have no roots? American Journal of Botany 90 : 1777 – 1787 .
Shaw , B. , S. Terracciano , and A. J. Shaw . 2009 . A genetic analysis of two recently described peat moss species, Sphagnum atlanticum and S. bergianum (Sphagnaceae). Systematic Botany 34 : 6 – 12 .
Sn ä ll , T. , J. Fogelqvist , P. J. Ribeiro , and M. Lascoux . 2004a . Spatial genetic structure in two congeneric epiphytes with different dispersal strategies analysed by three different methods. Molecular Ecology 13 : 2109 – 2119 .
Sn ä ll , T. , A. Hagstrom , J. Rudolphi , and H. Rydin . 2004b . Distribution pattern of the epiphyte Neckera pennata on three spatial scales — Importance of past landscape structure, connectivity and lo-cal conditions. Ecography 27 : 757 – 766 .
Soltis , D. E. , A. B. Morris , J. S. Mclachlin , P. S. Manos , and P. S. Soltis . 2006 . Comparative phylogeography of unglaciated eastern North America. Molecular Ecology 15 : 4261 – 4293 .
Soro , A. , S. Sundberg , and H. Rydin . 1999 . Species diversity, niche metrics, and species associations in harvested and undisturbed bogs. Journal of Vegetation Science 10 : 549 – 560 .
Sundberg , S. 2005 . Larger capsules enhance short-range spore dispersal in Sphagnum, but what happens further away? Oikos 108 : 115 – 124 .
Sundberg , S. , and H. Rydin . 2002 . Habitat requirements for establish-ment of Sphagnum from spores. Journal of Ecology 90 : 268 – 278 .
Vanderpoorten , A. , N. Devos , B. Goffinet , O. J. Hardy , and A. J. Shaw . 2008 . The barriers to oceanic island radiation in bryophytes: Insights from the phylogeography of the moss Grimmia montana. Journal of Biogeography 35 : 654 – 663 .
Wolf , J. B. W. , T. Bayer , B. Haubold , M. Schilhabel , P. Rosenstiel , and D. Tautz . 2010 . Nucleotide divergence vs. gene expression differentiation: comparative transcriptome sequencing in natural iso-lates from the carrion crow and its hybrid zone with the hooded crow. Molecular Ecology 19 ( Supplement 1 ): 162 – 175 .
Appendix 1. Voucher list of specimens included in genetic analyses of Frullania asagrayana . Herbarium acronyms: DUKE = Duke University, TENN = University of Tennessee, and UNAF = University of Northern Alabama.
Laboratory DNA number, cluster (S = Southern group, N = Northern group, O = Occoneechee Mountain, and T = F. tamarisci outgroup), collector and collection number, state/province: county/district, herbarium, GenBank accessions for selected specimens ( trnG, trnL , ITS).
SB3327, N , Shaw 6988, Vermont: Essex Co., DUKE. SB3330, N , Shaw 8018, Maine: Washington Co., DUKE. SB3331, N , Shaw 8019, Maine: Washington Co., DUKE. SB3332, N , Shaw 8022, Maine: Washington Co., DUKE. HM746937, HM746945, HM746926, SB3333, N , Shaw 8040, Maine: Hancock Co., DUKE. SB3335, N , Shaw 8037, Maine: Hancock Co., DUKE. HM746941, HM746951, HM746916, SB3340, N , Schofi eld 95421, Nova Scotia: Digby Co., DUKE. SB3342, N , Belland 16761, Nova Scotia: Kejimkujik NP, DUKE. SB3343, N , Belland 16786, Nova Scotia: Kejimkujik NP, DUKE. SB3345, N , Belland 16945, Nova Scotia: Kejimkujik NP, DUKE. SB3347, N , Schofi eld 97014, Nova Scotia: Kejimkujik NP, DUKE. SB3348, N , Belland 97361, Nova Scotia: Kejimkujik NP, DUKE. SB3349, N , Schofi eld 97047, Nova Scotia: Kejimkujik NP, DUKE. SB3369, N , Breil 93-5846, Tennessee: Carter Co., DUKE. SB3370, N , Risk 591, Tennessee: Carter Co., DUKE. SB3372, N , Breil s.n., Virginia: Highland Co., DUKE. SB3374, N , Shaw 10397, West Virginia: Pocahontas Co., DUKE. SB3375, N , Shaw 10657, West Virginia: Pocahontas Co., DUKE. SB3376, N , Shaw 10404, West Virginia: Pocahontas Co., DUKE. SB3377, N , Schofi eld 17627, New Brunswick: Fundy NP, DUKE. SB3378, N , Belland 14134, New Brunswick: Kouchibouguac NP, DUKE. SB3379, N , Belland 14119, New Brunswick: Kouchibouguac NP, DUKE. SB3380, N , Belland 18463, New Brunswick: Fundy NP, DUKE. SB3382, N , Belland 17839, New Brunswick: Fundy NP, DUKE. HM746931, HM746944, HM746925, SB3383, N , Weber 17775, New Brunswick: Fundy NP, DUKE. SB3384, N , Schofi eld 17782, New Brunswick: Fundy NP, DUKE. SB3385, N , Belland 96899, Nova Scotia: Kejimkujik NP, DUKE. SB3388, N , Schofi eld 17355, Nova Scotia: Kejimkujik NP, DUKE. SB3398, N , Belland 16415, Nova Scotia: Cape Breton Highlands NP, DUKE. HM746929, HM746947, HM746927, SB3400, N , Risk 596b, Tennessee: Carter Co., DUKE. SB3401, N , Risk 546, Tennessee: Carter Co., DUKE. SB3404, N , Zartman 627, North Carolina: Macon Co., DUKE. SB3406, N , Thornton 48, North Carolina: Yancey Co., DUKE. SB3661, N , Hyatt 11544, Georgia: Union Co., DUKE. HM746930, HM746953, HM746928, SB3837, N , Davison 2690, Alabama: Rabun Co., UNAF. SB3881, N , Briscoe 798, Maine: Hancock Co., DUKE. HM746933, HM746949, HM746917, SB3336, S , Shaw 6083, North Carolina: Orange Co., DUKE. HM746940, HM746952, HM746918, SB3366, S , Risk 972, Kentucky:
Letcher Co., DUKE. SB3367, S , Risk 11469, Kentucky: Morgan Co., DUKE. HM746939, HM746946, HM746920, SB3368, S , Bowe s.n., South Carolina: Spartanburg Co., DUKE. SB3371, S , Breil s.n., Virginia: Buckingham Co., DUKE. SB3373, S , Solga 350, Virginia: Lunenburg Co., DUKE. SB3391, S , Horn 1831, North Carolina: Orange Co., DUKE. SB3392, S , Shaw s.n., North Carolina: Durham Co., DUKE. SB3393, S , Buck 15783, Arkansas: Franklin Co., DUKE. SB3394, S , Majestyk 5162, Arkansas: Conway Co., DUKE. SB3395, S , Zartman 1396, Alabama: Jackson Co., DUKE. SB3399, S , Shaw 5274, North Carolina: Orange Co., DUKE. SB3403, S , Shaw 4503, North Carolina: Watauga Co., DUKE. SB3405, S , Zartman 642, North Carolina: Macon Co., DUKE. SB3646, S , Davison & Smith 113, Tennessee: Coffee Co., TENN. SB3648, S , Davison & Smith 361, Tennessee: Coffee Co., TENN. HM746932, HM746942, HM746922, SB3650, S , Risk, Davison & Richardson 7745, Tennessee: Fentress Co., DUKE. SB3651, S , Davison 5840, Tennessee: Fentress Co., DUKE. SB3652, S , Davison & Nordman 5382, Tennessee: Grundy Co., DUKE. SB3653, S , Hyatt 11552, Georgia: Fannin Co., DUKE. SB3657, S , Davison 5718, Tennessee: Van Buren Co., UNAF. SB3658, S , Hyatt 11545, Georgia: Fannin Co., DUKE. SB3662, S , Davison & Risk 2520, Kentucky: Bell Co., UNAF. SB3663, S , Hyatt 8935, North Carolina: Macon Co., DUKE. HM746935, HM746943, HM746924, SB3664, S , Hyatt 8936, North Carolina: Macon Co., DUKE. SB3665, S , Davison & Risk 2613, Tennessee: Campbell Co., UNAF. SB3666, S , Hyatt 9211, North Carolina: Macon Co., DUKE. SB3667, S , Davison 4733, Alabama: Franklin Co., UNAF. SB3668, S , Davison 1950, Alabama: Lawrence Co., UNAF. SB3669, S , Davison 3140, Alabama: Lawrence Co., UNAF. SB3670, S , Davison 4624, Alabama: Marion Co., UNAF. SB3671, S , Kittle s.n., Alabama: St. Clair Co., UNAF. SB3672, S , Kittle s.n., Alabama: St. Clair Co., UNAF. SB3673, HM746936, HM746954, HM746921, S , Davison 6704, Alabama: Winston Co., UNAF. SB3674, S , Davison 4683, Alabama: Winston Co., UNAF. SB3677, S , Davison 3965, Alabama: Colbet Co., UNAF. SB3678, S , Davison 6912, Alabama: Jackson Co., UNAF. HM746938, HM746948, HM746919, SB3679, S , Davison 5060, Alabama: Jackson Co., UNAF. SB3680, S , Davison 5080, Alabama: Jackson Co., UNAF. SB3681, S , Davison 5107, Alabama: Jackson Co., UNAF. SB3683, S , Davison 4888, Alabama: Jackson Co., UNAF. SB3684, S , Davison 4945, Alabama: Jackson Co., UNAF. SB3685, S , Davison 4983, Alabama: Jackson Co., UNAF. SB3828, S , Kittle s.n., Alabama: St. Clair Co., UNAF. SB3835, S , Davison 4883, Alabama: Jackson Co., UNAF. SB3836, S , Davison 6647, Alabama: Winston Co., UNAF. HM746934, HM746950, HM746923, SB3838, S , Hyatt 11553, Georgia: Union Co., DUKE. SB3839, S , Davison & Nordman 5444,

1718 American Journal of Botany
Tennessee: Marion Co., UNAF. SB3840, S , Davison & Nordman 5399, Tennessee: Marion Co., UNAF. SB3841, S , Risk, Davison & Richardson 14860, Tennessee: Fentress Co., TENN. SB3842, S , Davison & Smith 120, Tennessee: Coffee Co., TENN. SB3843, S , Davison & Smith 397, Tennessee: Coffee Co., TENN. SB3924, O , Shaw, Shaw & Ramaiya 151, North Carolina: Orange Co., DUKE. SB3928, O , Shaw, Shaw & Ramaiya 155, North Carolina: Orange Co., DUKE. SB3929, O , Shaw, Shaw & Ramaiya 211, North Carolina: Orange Co., DUKE. SB3940, O , Shaw, Shaw & Ramaiya 132, North Carolina: Orange Co., DUKE. SB3941, O , Shaw, Shaw & Ramaiya 136, North Carolina: Orange Co., DUKE. SB3942, O , Shaw, Shaw & Ramaiya 231, North Carolina: Orange
Co., DUKE. SB3943, O , Shaw, Shaw & Ramaiya 232, North Carolina: Orange Co., DUKE. SB3960, O , Shaw, Shaw & Ramaiya 343a, North Carolina: Orange Co., DUKE. SB3969, O , Shaw, Shaw & Ramaiya 411, North Carolina: Orange Co., DUKE. SB3973, O , Shaw, Shaw & Ramaiya 415, North Carolina: Orange Co., DUKE. SB3979, O , Shaw, Shaw & Ramaiya 431, North Carolina: Orange Co., DUKE. SB3983, O , Shaw, Shaw & Ramaiya 441, North Carolina: Orange Co., DUKE. SB3989, O , Shaw, Shaw & Ramaiya 451, North Carolina: Orange Co., DUKE. SB3991, O , Shaw, Shaw & Ramaiya 453, North Carolina: Orange Co., DUKE. SB3994, O , Shaw, Shaw & Ramaiya 321, North Carolina: Orange Co., DUKE.