Isolation of oxidase-negative Aeromonas salmonicida from diseased turbot Scophthalmus maximus
Morphological Changes in Diseased Cementum Layers: A Scanning
Electron Microscopy Study
E. Bilgin,1 C. A. Gurgan,1 M. Nejat Arpak,1 H. S. Bostanci,1 K. Guven2
1Ankara University, Faculty of Dentistry, Department of Periodontology, Ankara, Turkey2Kirikkale University, Faculty of Art and Science, Department of Physics, Ankara, Turkey
Received: 28 July 2003 / Accepted: 13 November 2003 / Online publication: 4 March 2004
Abstract. The aim of this study was to compare themorphological changes that occurred in root cementumlayers due to periodontal disease by using scanningelectron microscopy (SEM). Ninety-two periodontallyhopeless teeth extracted from 29 patients were studied.Measurements of probing depth (PD) and clinical at-tachment loss (CAL) were taken prior to extractions.After the longitudinal fracturing process of root speci-mens, healthy and diseased cementum layers of rootswere evaluated by SEM for the thickness of the ce-mentum and the morphological changes in collagen fi-bers. The result of SEM evaluation revealed a significant(P< 0.001) decrease in the thickness of cementum layeron the diseased root surfaces compared to the healthysurfaces. There were denser and conspicuous collagenfibers with their interfibrillar matrix in cementum layerson the healthy root surfaces compared to the diseasedsurfaces. Within the limits of this study, the thickness ofcementum layers in diseased areas was found to be sig-nificantly less than that in the healthy areas of rootsurfaces. However, there exist variations in the densityand visibility of cemental fibers between individuals andwithin the individual.
Key words: Dental cementum — Collagen fibers —SEM
Cementum is a calcified avascular mesenchymal tissuethat forms the outer covering of the anatomic root. Themain types of cementum are acellular (primary) andcellular (secondary). Both consist of a calcified interfi-brillar matrix and collagen fibrils. Two sources of col-lagen fibers in cementum are Sharpey’s fibers (extrinsic),which are the embedded portion of the principal fibersof the periodontal ligament formed by fibroblasts, andfibers that belong to the cementum matrix per se (in-trinsic) produced by cementoblasts. Cementoblasts alsoform the noncollagenous components of the interfibril-
lar ground substance, such as proteoglycans, glycopro-teins, and phosphoproteins [1].On the basis of the absence or presence of cells and
the source of collagen fibers, cementum can be classifiedas: acellular afibrillar cementum, acellular extrinsic fibercementum, cellular intrinsic fiber cementum, acellularintrinsic fiber cementum, and cellular mixed stratifiedcementum [2].Acellular afibrillar cementum contains neither cells
nor collagen fibers, but only mineralized ground sub-stance, and is found in the coronal parts of root close tocementoenamel junction. Acellular extrinsic fiber ce-mentum is composed almost entirely of densely packedwell-oriented bundles of Sharpey’s fibers and lack ofcells. This cementum is found in the cervical and middleroot regions and may extend further apically. Cellularintrinsic fiber cementum contains cells (the cemento-cytes), and its collagen fibers are all intrinsic and run acircular or spiral course around the root. In humans, itfills resorption lacunae. Acellular intrinsic fiber cemen-tum is found at the apical portion of the root with in-trinsic collagen fibers and no cells, for the purpose ofadaptation. Cellular mixed stratified cementum is amixture of acellular extrinsic fiber and cellular/acellularintrinsic fiber cementum. It usually consists of a strati-fied tissue with consecutive or altering layers ofcementum types. In humans, it is inhomogeneouslymineralized and occurs primarily in the apical third ofthe roots and in the furcation regions. Its function ismainly in recompensing of the root surface as the toothshifts and drifts in its socket.Cementum tissue is formed very slowly and generally
is not subject to remodeling. Its organic and inorganicconstituents become more stable at the molecular leveland more resistant to subtle environmental changes.Similarly, collagen fibers near the cementum have a lowmetabolic turnover and presumably are more highlycross-linked than those located more peripherally. Thesurface layer of the cementum contains more fluoridethan bone tissue, resulting in greater stability of its
Correspondence to: C. A. Gurgan; E-mail: [email protected]
Calcif Tissue Int (2004) 74:476–485
DOI: 10.1007/s00223-003-0195-1 CalcifiedTissueInternational� 2004 Springer-Verlag New York Inc.

mineral crystals against dissolution in acids produced byclast cells. In addition, there are no blood vessels in thecementum, and far less vascularization of the connectivetissue occurs near the root surface than occurs near thealveolar bone. Because of these factors, cementum isnormally excluded to a greater extent from metabolicprocess and consequently remains largely unaffected bypathologic conditions that involve bone tissue [3].However, the cementum surface is not totally immune toultrastructural alteration adjacent to an inflammatoryprocess caused by periodontal disease.In a comprehensive light and electron microscopy
study, Selvig [4] evaluated the structural alterations thattook place within the cementum as a result of perio-dontal disease in humans. The author evaluated thecementum surface in four zones, starting with the mostapical region, as: (I) Intact connective tissue fibers at-tachment to cementum in the apical and middle regionsof the periodontal membrane, (II) Partial destruction ofthe connective tissue fibers. This zone was encountered0.5 to 1 mm beneath the epithelial attachment and ex-tended to within a small distance from the most apicallylocated epithelial cells, (III) Complete destruction of theconnective tissue fibers in a narrow zone immediatelybeneath the epithelial attachment, and (IV) Epitheliumlining the cementum. The major alterations caused byinflammatory process were partial decalcification anddegradation of collagen fibrils in the cementum matrix.However, these changes were limited to a superficialsurface layer within a narrow zone immediately apical tothe pocket epithelium [4, 5].The alterations resulting from periodontal pathology
can be divided into two categories: (a) effect of gingivalinflammation causing surface alterations and cervicalroot resorption and (b) exposure of root surface to oralenvironment resulting in bacterial contamination andhypermineralization [6].In the electron microscopy studies [7–9] dealing with
cementum in periodontal inflammation, mostly thesurface morphology has been investigated, rather thansections. According to the results of these studies, dis-eased cementum surfaces were found as irregular anduneven with resorption areas and no connective tissuefibers. However, in the studies dealing with the sectionsof cementum [2, 10], the physiological appearance of thecementum layer was evaluated. The pathological alter-ations have been investigated only by light and trans-mission electron microscopy and microradiography [11].Decrease or loss of collagen cross-banding at or near thecemental surfaces and hypermineralized cemental layerson the root surfaces exposed to oral environment werereported at acellular intrinsic level.This study was undertaken to elucidate the altera-
tions in the morphology of diseased cementum layers incomparison with healthy cementum on the same rootsurfaces.
Patients and Methods
Subjects were recruited from patients attending the Faculty ofDentistry Department of Periodontology of Ankara Univer-sity. The inclusion criteria were: (1) no systemic problem ormedication, (2) diagnosed as generalized chronic periodontitis,(3) no periodontal treatment in the last 5 years, (4) no anti-biotic prescription in the last 3 months, (5) vital teeth with nocaries or filling scheduled for extraction, and (6) presence ofradiographically available bone support not exceeding onethird of root length. The periodontal status of teeth and thereasons of extraction were explained and written informedconsent was obtained from each patient. Twenty-nine patients(12 women and 17 men; average age, 48. 14 years (± 9.56years; range, 35 to 73 years) participated on the basis of per-iodontal pocketing and having hopeless single-rooted teeth forperiodontal treatment.From the participating patients, 100 teeth were extracted
and prepared for examination. Following local infiltrative a-nesthesia, vertical grooves of 2 to 3 mm in length and 1 mm inwidth were prepared on four surfaces, namely, mesiovestibu-lar, midvestibular, distovestibular, and midoral, on the crownof each tooth. The vertical grooves were created by using cy-lindrical diamond burns close to the crown margin, with theirapical borders extending to the cementoenamel junction. Byusing the vertical grooves as reference points, clinical attach-ment level (CAL) and probing depth (PD) measurements weredone at four surfaces of each tooth. All clinical measurementswere taken to the nearest 0.5 mm by using an NF-14 perio-dontal probe (Safico�, France). Care was taken during ex-traction not to damage the root surfaces. All the teeth werewashed with 0.1 M sodium phosphate buffer immediately afterextraction. The teeth were fixed in 2.5% glutaraldehyde solu-tion for 48 hours. The attachment levels at the four surfaces ofthe roots were marked with approximately 1-mm-wide, shal-low ‘‘V’’ shaped notches by a diamond burr, using the CALmeasurements taken prior to extraction.Following the removal of the crown parts of the teeth, the
root parts were cut longitudinally until a portion of 1 mmwas left intact by using a technique as shown in Figure 1a.The sectioning process was performed by a thin diamond sawusing distilled water as a coolant solution. Dentin powderproduced during the sectioning procedure was washed awayusing distilled water spray, and the intact 1-mm uncut por-tions of the roots were fractured into two parts by using asteel wedge and hammer as shown in Figure 1b. One half ofeach specimen was dehydrated in a dry-air oven at 80�C for 6hours.Each specimen was fixed on a stub and sputtered with a 200
A� gold layer with an ANATECH HUMMER VII sputteringsystem. All the specimens were evaluated with a JEOL JSM6400 scanning electron microscope. For each root section,micrographs were taken at magnification of ·500 and ·1500,below the notch for the healthy, and above for the diseasedcementum layers (Fig. 2).By using the magnification scale on the micrographs ob-
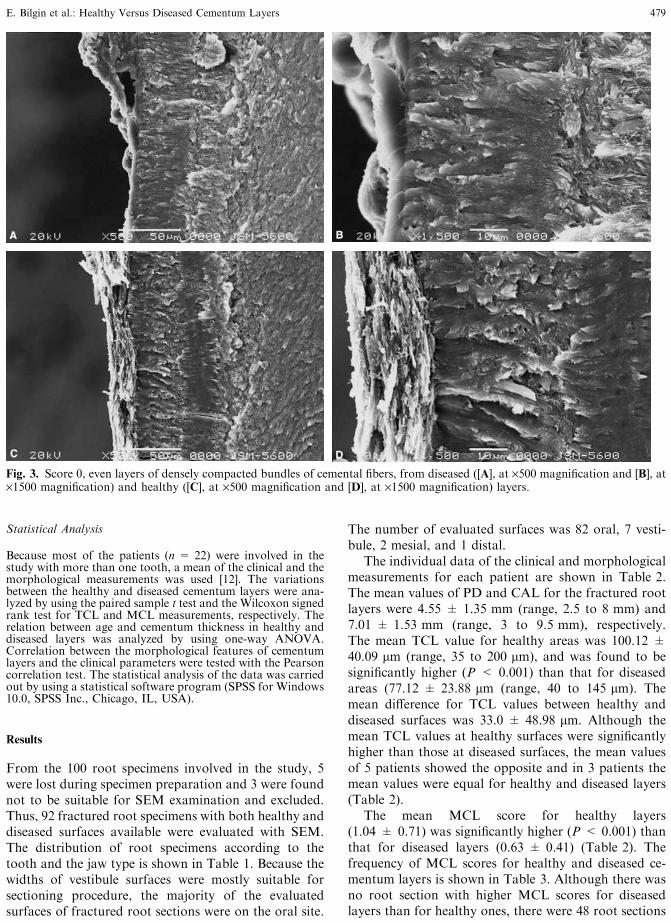
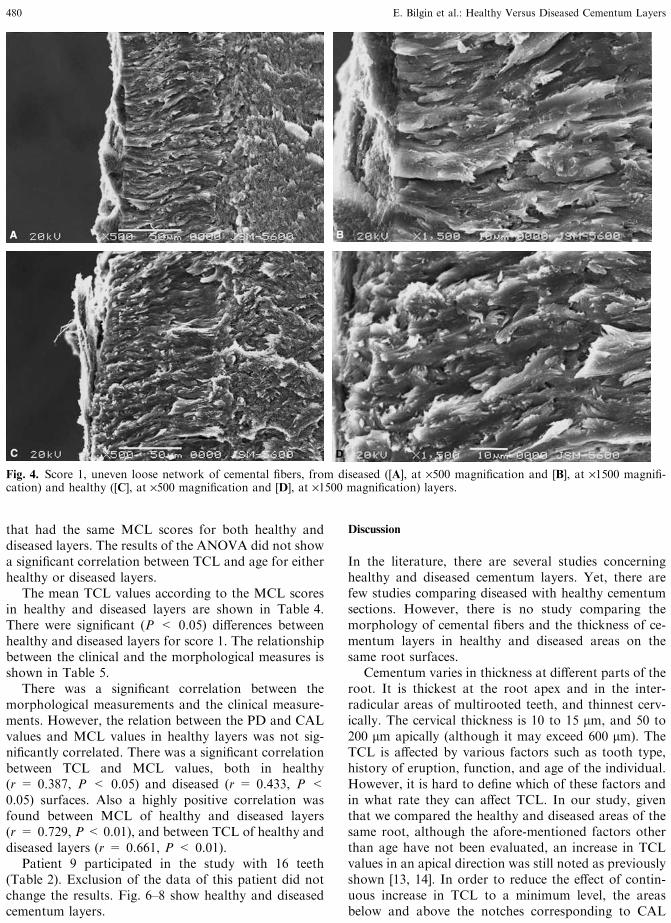
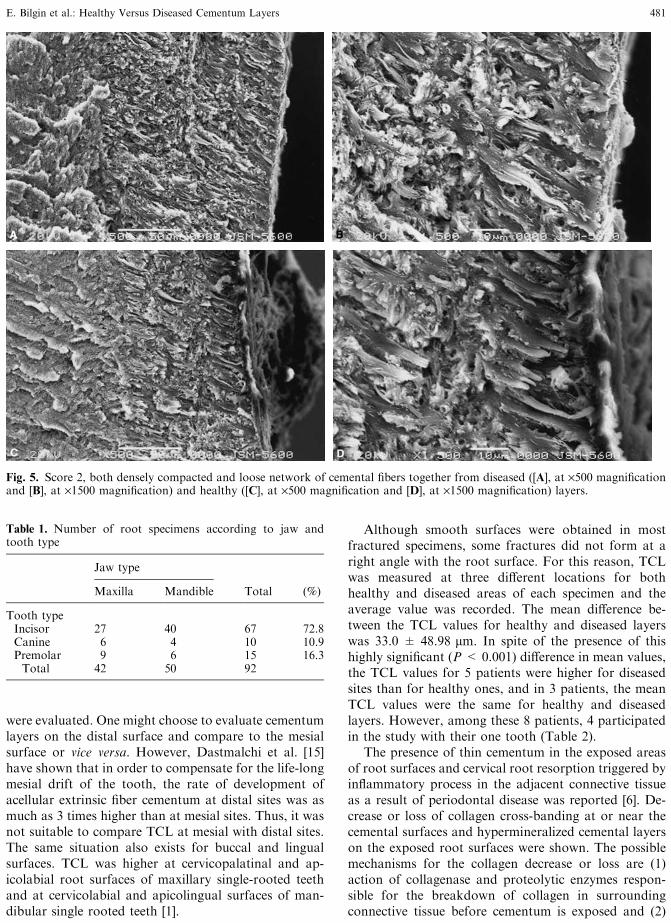
tained from scanning electron Microscopy (SEM), the thick-ness of the cementum layer (TCL) for the healthy and diseasedpart was measured at three different sites and the average valuewas calculated. On the same micrographs, the morphology ofthe cementum layer (MCL) was evaluated. On the basis of thedensity and visibility of the cemental fibers in their calcifiedinterfibrillar matrix, scores from 0 to 2 were given. The valuesof the scores were as follows: 0, Even layers of densely com-pacted bundles of cemental fibers (Fig. 3 A, B, C, D); 1, un-even loose network of cemental fibers (Fig. 4 A, B, C, D); 2,both densely compacted and loose network of cemental fiberstogether (Fig. 5 A, B, C, D).One examiner performed all of the morphological evalua-
tions. The same examiner repeated the readings 3 weeks laterin order to evaluate the intraexaminer agreement. Kappa testwas used for the evaluation of intraexaminer agreement. TheKappa values for the healthy and the diseased cementumlayers were 0.862 and 0.913, respectively.
E. Bilgin et al.: Healthy Versus Diseased Cementum Layers 477
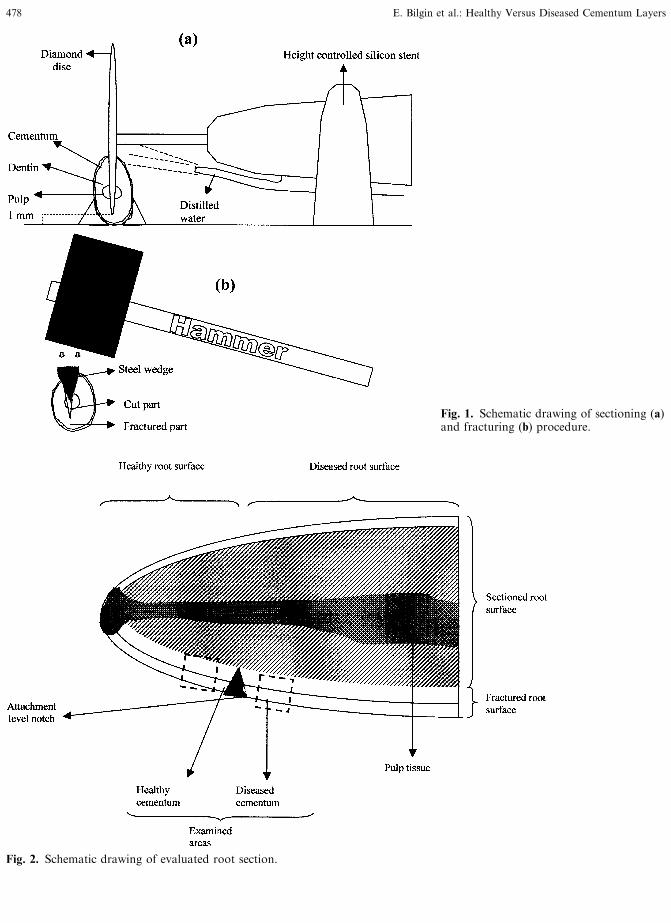
Fig. 1. Schematic drawing of sectioning (a)and fracturing (b) procedure.
Fig. 2. Schematic drawing of evaluated root section.
478 E. Bilgin et al.: Healthy Versus Diseased Cementum Layers
Statistical Analysis
Because most of the patients (n = 22) were involved in thestudy with more than one tooth, a mean of the clinical and themorphological measurements was used [12]. The variationsbetween the healthy and diseased cementum layers were ana-lyzed by using the paired sample t test and the Wilcoxon signedrank test for TCL and MCL measurements, respectively. Therelation between age and cementum thickness in healthy anddiseased layers was analyzed by using one-way ANOVA.Correlation between the morphological features of cementumlayers and the clinical parameters were tested with the Pearsoncorrelation test. The statistical analysis of the data was carriedout by using a statistical software program (SPSS for Windows10.0, SPSS Inc., Chicago, IL, USA).
Results
From the 100 root specimens involved in the study, 5were lost during specimen preparation and 3 were foundnot to be suitable for SEM examination and excluded.Thus, 92 fractured root specimens with both healthy anddiseased surfaces available were evaluated with SEM.The distribution of root specimens according to thetooth and the jaw type is shown in Table 1. Because thewidths of vestibule surfaces were mostly suitable forsectioning procedure, the majority of the evaluatedsurfaces of fractured root sections were on the oral site.
The number of evaluated surfaces was 82 oral, 7 vesti-bule, 2 mesial, and 1 distal.The individual data of the clinical and morphological
measurements for each patient are shown in Table 2.The mean values of PD and CAL for the fractured rootlayers were 4.55 ± 1.35 mm (range, 2.5 to 8 mm) and7.01 ± 1.53 mm (range, 3 to 9.5 mm), respectively.The mean TCL value for healthy areas was 100.12 ±40.09 lm (range, 35 to 200 lm), and was found to besignificantly higher (P < 0.001) than that for diseasedareas (77.12 ± 23.88 lm (range, 40 to 145 lm). Themean difference for TCL values between healthy anddiseased surfaces was 33.0 ± 48.98 lm. Although themean TCL values at healthy surfaces were significantlyhigher than those at diseased surfaces, the mean valuesof 5 patients showed the opposite and in 3 patients themean values were equal for healthy and diseased layers(Table 2).The mean MCL score for healthy layers
(1.04 ± 0.71) was significantly higher (P < 0.001) thanthat for diseased layers (0.63 ± 0.41) (Table 2). Thefrequency of MCL scores for healthy and diseased ce-mentum layers is shown in Table 3. Although there wasno root section with higher MCL scores for diseasedlayers than for healthy ones, there were 48 root sections
Fig. 3. Score 0, even layers of densely compacted bundles of cemental fibers, from diseased ([A], at ·500 magnification and [B], at·1500 magnification) and healthy ([C], at ·500 magnification and [D], at ·1500 magnification) layers.
E. Bilgin et al.: Healthy Versus Diseased Cementum Layers 479
that had the same MCL scores for both healthy anddiseased layers. The results of the ANOVA did not showa significant correlation between TCL and age for eitherhealthy or diseased layers.The mean TCL values according to the MCL scores
in healthy and diseased layers are shown in Table 4.There were significant (P < 0.05) differences betweenhealthy and diseased layers for score 1. The relationshipbetween the clinical and the morphological measures isshown in Table 5.There was a significant correlation between the
morphological measurements and the clinical measure-ments. However, the relation between the PD and CALvalues and MCL values in healthy layers was not sig-nificantly correlated. There was a significant correlationbetween TCL and MCL values, both in healthy(r = 0.387, P < 0.05) and diseased (r = 0.433, P <0.05) surfaces. Also a highly positive correlation wasfound between MCL of healthy and diseased layers(r = 0.729, P< 0.01), and between TCL of healthy anddiseased layers (r = 0.661, P < 0.01).Patient 9 participated in the study with 16 teeth
(Table 2). Exclusion of the data of this patient did notchange the results. Fig. 6–8 show healthy and diseasedcementum layers.
Discussion
In the literature, there are several studies concerninghealthy and diseased cementum layers. Yet, there arefew studies comparing diseased with healthy cementumsections. However, there is no study comparing themorphology of cemental fibers and the thickness of ce-mentum layers in healthy and diseased areas on thesame root surfaces.Cementum varies in thickness at different parts of the
root. It is thickest at the root apex and in the inter-radicular areas of multirooted teeth, and thinnest cerv-ically. The cervical thickness is 10 to 15 lm, and 50 to200 lm apically (although it may exceed 600 lm). TheTCL is affected by various factors such as tooth type,history of eruption, function, and age of the individual.However, it is hard to define which of these factors andin what rate they can affect TCL. In our study, giventhat we compared the healthy and diseased areas of thesame root, although the afore-mentioned factors otherthan age have not been evaluated, an increase in TCLvalues in an apical direction was still noted as previouslyshown [13, 14]. In order to reduce the effect of contin-uous increase in TCL to a minimum level, the areasbelow and above the notches corresponding to CAL
Fig. 4. Score 1, uneven loose network of cemental fibers, from diseased ([A], at ·500 magnification and [B], at ·1500 magnifi-cation) and healthy ([C], at ·500 magnification and [D], at ·1500 magnification) layers.
480 E. Bilgin et al.: Healthy Versus Diseased Cementum Layers
were evaluated. One might choose to evaluate cementumlayers on the distal surface and compare to the mesialsurface or vice versa. However, Dastmalchi et al. [15]have shown that in order to compensate for the life-longmesial drift of the tooth, the rate of development ofacellular extrinsic fiber cementum at distal sites was asmuch as 3 times higher than at mesial sites. Thus, it wasnot suitable to compare TCL at mesial with distal sites.The same situation also exists for buccal and lingualsurfaces. TCL was higher at cervicopalatinal and ap-icolabial root surfaces of maxillary single-rooted teethand at cervicolabial and apicolingual surfaces of man-dibular single rooted teeth [1].
Although smooth surfaces were obtained in mostfractured specimens, some fractures did not form at aright angle with the root surface. For this reason, TCLwas measured at three different locations for bothhealthy and diseased areas of each specimen and theaverage value was recorded. The mean difference be-tween the TCL values for healthy and diseased layerswas 33.0 ± 48.98 lm. In spite of the presence of thishighly significant (P< 0.001) difference in mean values,the TCL values for 5 patients were higher for diseasedsites than for healthy ones, and in 3 patients, the meanTCL values were the same for healthy and diseasedlayers. However, among these 8 patients, 4 participatedin the study with their one tooth (Table 2).The presence of thin cementum in the exposed areas
of root surfaces and cervical root resorption triggered byinflammatory process in the adjacent connective tissueas a result of periodontal disease was reported [6]. De-crease or loss of collagen cross-banding at or near thecemental surfaces and hypermineralized cemental layerson the exposed root surfaces were shown. The possiblemechanisms for the collagen decrease or loss are (1)action of collagenase and proteolytic enzymes respon-sible for the breakdown of collagen in surroundingconnective tissue before cementum is exposed and (2)
Fig. 5. Score 2, both densely compacted and loose network of cemental fibers together from diseased ([A], at ·500 magnificationand [B], at ·1500 magnification) and healthy ([C], at ·500 magnification and [D], at ·1500 magnification) layers.
Table 1. Number of root specimens according to jaw andtooth type
Jaw type
Maxilla Mandible Total (%)
Tooth typeIncisor 27 40 67 72.8Canine 6 4 10 10.9Premolar 9 6 15 16.3Total 42 50 92
E. Bilgin et al.: Healthy Versus Diseased Cementum Layers 481

action of bacteria and salivary enzymes producing thechanges after cementum is exposed to the oral envi-ronment. In our study, we examined the area very closeto the bottom of periodontal pocket. Accordingly, theformer mechanism, activity of the factors responsible forthe collagen decrease or loss, could be responsible forthe decrease in the thickness of cementum layers indiseased surfaces. On the other hand, one might con-
sider the effect of cementum apposition as a result ofaging at the apical part of the root, causing an increasein cementum thickness [14] in healthy surfaces. After all,cementum layers evaluated in our study were locatedapically. Yet, the significant mean difference of TCLvalues between closely located diseased and healthy ce-mentum layers shows the effect of disease process oncementum layers exposed to the periodontal pocket. Inaddition, the mean age of the patients in our study was48.14 years (± 9.56 years, and the majority of themwere within the range close to this mean value. Thus, theeffect of cementum apposition causing increase in TCLvalues of healthy layers could be discarded within thelimits of our study. Another possible mechanism for thedecrease in the thickness of cementum layers in diseasedroot surfaces was interruption of continuous cementumdeposition during the inflammatory process by alteringthe environment from the healthy to the diseased situ-ation, which ultimately affected physiological deposi-
Table 2. Mean values and frequency of the morphological and the clinical measurements and the number of teeth for each patient
MCL-H MCL-D
Patient no. No. of teeth 0 1 2 0 1 2 TCL-H TCL-D PD CAL
1 4 4 4 137.5 ± 38.6 77.5 ± 12.58 4.01 ± 0.12 7.25 ± 0.52a 3 1 2 2 180 ± 56.37 145 ± 35.36 6.33 ± 3.21 8.67 ± 2.083 6 3 3 6 95 ± 54.68 63.3 ± 27.33 5 ± 1.41 7.83 ± 2.144a 5 3 1 1 3 67.5 ± 12.58 45 ± 12.91 4.25 ± 0.5 6.5 ± 0.585 4 2 2 2 2 55 ± 17.32 57.5 ± 15.1 4.25 ± 0.96 6.25 ± 0.966 4 3 1 1 3 105 ± 46.55 59.1 ± 18.26 7.75 ± 3.59 8.25 ± 3.57a 7 1 2 3 2 4 85 ± 37.82 58.3 ± 27.14 5.33 ± 1.51 6.83 ± 0.758 4 4 2 2 117.5 ± 26.3 87.5 ± 15.1 3.1 ± 0.12 5.5 ± 1.299a 16 1 6 9 3 12 185.63 ± 80.25 102.5 ±33.76 5.56 ± 1.82 7.87 ± 1.7110 1 1 1 90 70 3 611 2 1 1 2 70 ± 14.14 60 ± 12.15 3.5 ± 0.71 4 ± 0.5212 1 1 1 80 80 3 513 1 1 1 40 60 4 814a 5 2 2 4 110 ± 46.9 115 ± 70.47 5.5 ± 2.08 7.5 ± 1.7315 4 1 3 3 1 122.5 ± 27.54 97.5 ± 30.96 5.5 ± 1.91 9.5 ± 1.9116a 3 2 1 1 60 ± 28.28 50 ± 12.12 3.5 ± 0.71 5.5 ± 0.7117 1 1 1 80 80 3 318 1 1 1 90 80 5 919 1 1 1 100 100 4 920 4 2 2 4 117.5 ± 18.93 105 ± 12.91 4.75 ± 0.96 6.25 ± 1.521 2 2 2 130 ± 12.28 90 8 ± 1.41 9 ± 1.4122 2 1 1 2 85 ± 7.07 110 ± 14.14 6 8.5 ± 0.7123 5 1 1 3 4 1 88 ± 31.14 60 ± 10.1 4 ± 0.71 6 ± 1.1424 4 1 1 2 2 2 87.5 ± 15.1 67.5 ± 15.2 3.75 ± 0.5 5 ± 0.8225 2 1 1 1 1 90 ± 14.14 55 ± 7.07 2.5 ± 0.71 8.5 ± 0.7126 1 1 1 200 80 5 827b 3 2 2 135 ± 21.21 80 ± 14.14 4 628a 2 2 1 35 ± 7.07 40 5 ± 1.41 6.5 ± 0.7129 2 2 1 1 65 ± 7.07 60 3.5 ± 0.71 6 ± 1.41Total 100 9 48 38 28 63 1Mean S.D. 1.04* ± 0.51 0.63 ± 0.41 100.12** ± 40.09 77.12 ± 23.88 4.55 ± 1.35 7.01 ± 1.53
CAL, clinical attachment level; PD, probing deptha Data are mean (± SD). Excluded 3 root specimens for SEM analysisb Lost 5 root specimens during preparation*P < 0.001 for morphology of cementum layer (MCL) between healthy and diseased layers**P < 0.001 for thickness of cementum (TCL) between healthy and diseased layers
Table 3. Distribution of MCL scores for healthy and diseasedcementum layers
Diseased layers(scores)
Healthy layers (scores) 0 1 2 Total
0 9 91 10 38 482 9 25 1 35Total 28 63 1 92
482 E. Bilgin et al.: Healthy Versus Diseased Cementum Layers
tion. During this process, cementum apposition in thehealthy apical part was continuing. However, the areasof the healthy and diseased root surfaces that wereevaluated in our study were very close to each other.Because of this, the result of interruption of cementumdeposition in diseased areas could be the reason forthese differences in cementum thickness.As there was no study examining the sections of ce-
mentum layers, we determined our own scoring systemfor the qualitative morphological evaluation of cementalfibers in their interfibrillar mineral matrix. The repea-tability of the scoring system was found as 0.862 forhealthy and 0.913 for diseased layers.There were denser and remarkable collagen fibers in
cementum layers on healthy areas compared to diseasedones. From 92 diseased layers only one layer was scoredas 2 and the same score for healthy layers was 35. Alsonone of the specimens from diseased surfaces was foundas a having higher MCL score than healthy ones.However, 48 root sections had the same MCL scores forboth healthy and diseased layers. There were also 9healthy cementum surfaces scored as 0 (Table 3).In our study, as periodontally hopeless teeth were
used, the mean CAL values were located apically. Forthis reason acellular afibrillar cementum found in heal-thy layers close to coronal parts of root surfaces couldnot be observed. Instead, the types of observed cemen-tum were morphologically similar to acellular extrinsic,cellular intrinsic fiber, or cellular mixed stratified ce-mentum [10]. The appearance of cementum layers scoredas 0, was even layers of densely compacted bundles offibers and was similar to acellular extrinsic fiber cemen-tum, which could be at the stage of completing its min-eralization. In healthy situations, for acellular extrinsicfiber cementum, all the collagen is derived as Sharpey’sfibers from the periodontal ligament. This type of
cementum corresponds with primary acellular cementumand, therefore, covers the cervical two thirds of the root[10]. The fibers are generally well mineralized. All theobserved microfractures probably caused by increasedmineralization were found only in some of the specimensthat scored as 0. There were 9 healthy layers that be-longed to different patients that scored as 0.For cementum layers that scored as 1, there were
uneven loose networks of cemental fibers in dense cal-cified interfibrillar matrix. These types of cementumlayers looked like less mineralized form of acellular ex-trinsic fiber cementum [10]. The fibers observed werelocated perpendicular to the cementum layers and in theareas close to the outer surface where not the Sharpey’sfibers, but their insertion spaces, were observed.In the type of cemental fibers that scored as 2, both
the intrinsic fibers located parallel and extrinsic fiberslocated perpendicular to cementum layers and even thetiny fibers could be easily observed. Unlike score 1, notonly various types of cementum layers but also theSharpey’s fibers extending to the outside of cementumsurface could be seen. The cementum tissue close to theapical area of periodontal pocket was evaluated withelectron microscopy [4]. In the most apically locatedzone, the presence of thin collagen fibrils, which couldbe traced from the periodontal membrane into the cal-cified tissue, where they became masked by mineralcrystals and ground substance deposited within andaround them were reported. In the coronally locatedzone where partly destroyed connective tissue fiber at-tachment presented some distance from the surface ofcementum tissue, thin collagen fibrils bundles that dif-fered from the typical collagen fibrils were reported. Inaddition to this, the number of intact fibrils attached tothe cementum decreased rapidly toward the cervicaldirection, leaving the cementum surface denuded.
Table 5. Correlation between the clinical and the morphological measurements of cementum layers at healthy and diseased sites
TCL-H TCL-D MCL-H MCL-D
CAL 0.363* 0.356* 0.321 (NS) 0.475**PD 0.377* 0.369* 0.354 (NS) 0.495**TCL-H 0.661** 0.387* 0.420*TCL-D 0.379* 0.433*MCL-H 0.729**
*P < 0.05**P < 0.01NS, not significant; H, healthy surfaces; D, diseased surfaces; CAL, clinical attachment level; PD, probingdepth; TCL, thickness of cementum; MCL, morphology of cementum layer
Table 4. TCL values (in lm) according to the MCL scores
TCL (lm)
MCL Healthy Diseased
Score 0 64.1 (± 27.16) (range, 30–120) NS 61.79 (± 21.44) (range, 20–130)Score 1 107.49 (± 35.19) (range, 40–180) P < 0.05 68.74 (± 32.46) (range, 40–220)Score 2 128.95 (± 50.43) (range, 70–260) NS 140a
Data are mean (± SD) and rangesNS, Not significanta There was only one root specimen
E. Bilgin et al.: Healthy Versus Diseased Cementum Layers 483

In a healthy situation, cementum derives its or-ganic matrix from two sources: the inserting Shar-pey’s fibers of the periodontal ligament and thecementoblasts. It is, therefore, possible to classifycementum according to the nature and origin of thefibrous matrix. When derived from the periodontalligament, the fibers are referred to as the extrinsic
fibers. These Sharpey’s fibers continue into the ce-mentum in the same direction as the principal fibersof the ligament (i.e., perpendicular or oblique to theroot surface). When derived from the cementoblasts,the fibers are referred to as intrinsic fibers. Thesefibers run parallel to the root surface and approxi-mately at right angles to the extrinsic fibers. Where
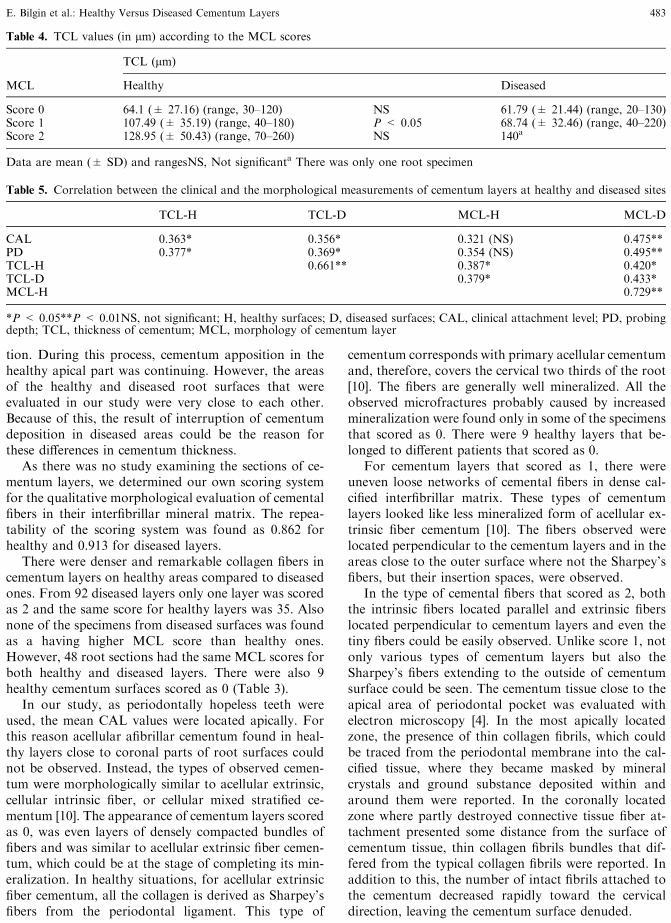
Fig. 6. Sectional view of cementum layer scored as 0, from diseased ([A], at ·500 magnification) and scored as 1, from healthy([B]), at ·500 magnification) areas of a specimen.
Fig. 7. Sectional view of cementum layer scored as 0, from diseased ([A], at ·500 magnification) and scored as 2 from healthy ([B],at ·500 magnification) areas of a specimen.
Fig. 8. Sectional view of cementum layer scored as 1, from diseased ([A], at ·500 magnification) and scored as 2 from healthy ([B],at ·500 magnification) areas of a specimen.
484 E. Bilgin et al.: Healthy Versus Diseased Cementum Layers

both extrinsic and intrinsic fibers are present, thetissue is also termed as mixed fiber cementum [1].For acellular extrinsic fiber cementum, all the colla-
gen is derived as Sharpey’s fibers from the periodontalligament, and the ground substance itself may be pro-duced by the cementoblasts. This type of cementumcorresponds with primary acellular cementum and,therefore, covers the cervical two thirds of the root. Thefibers are generally well mineralized. Cellular intrinsicfiber cementum is composed only of intrinsic fibersrunning parallel to the root surface. For mixed-fibercementum, the collagen fibers of the organic matrix arederived from both extrinsic fibers (from the periodontalligament) and intrinsic fibers (from cementoblasts). Theextrinsic and intrinsic fibers can be readily distinguished.The intrinsic fibers run between the extrinsic fibers witha different orientation. Indeed, the fewer the number ofintrinsic fibers in mixed fiber cementum, the closer theextrinsic fiber bundles.In diseased situations, the qualitative changes ob-
served in cementum layers were mostly an increase inmineralization, and, thus, changes in visibility of colla-gen fibers. These changes were more obvious when moreapically located cementum layers were evaluated. Cal-cium and phosphorus contents were greater in humandental roots exposed to periodontal pocket when com-pared to the roots exposed to the oral environment bygingival recession [16]. In addition, the longstandingpresence of an inflammatory process in the gingivalconnective tissue results in a net loss of collagen and inbreakdown of dentogingival fibers. The extension of thisenzymatic breakdown of collagen fibers in the hard tis-sue of the root, with loss a of collagen cross-banding andthe mineralization of its inorganic structure in the su-perficial layers [4, 5] increases to depth varying between40 and 100 lm. However, no decrease in mineralizationwas found in deeper layers of cementum [17]. The pos-itive significant correlation between CAL measurementsand MCL values in diseased layers was the proof of thiscondition. The disease process has changed the com-plexity of various cementum types that were observed inthis region. However, although this condition wasdominant in most of the cases of our study, still indi-vidual variations were exist (Table 2).Because of the close approximation of the evaluated
areas of healthy and diseased cementum layers, althoughthe difference in the morphology of cementum was notclearly identifiable, the thickness of cementum layersdiffered significantly (P < 0.05) (Table 4). However,there was a positive significant (P < 0.05) correlationbetween TCL and MCL for both healthy and diseasedlayers. For the latter, this correlation was stronger(Table 5). Presence of dense and thick cemental fibers,with various orientations, surrounded by calcified ma-trix could cause this increase in TCL values.
Within the limits of this study, the thickness of ce-mentum layers in diseased areas was significantly lessthan that in the healthy areas of root surfaces. However,there are variations in the density and visibility of ce-mental fibers between individuals and within the indi-vidual.
Acknowledgments. This work was supported by a grant fromAnkara University Research Foundation (No. 20010802038).The authors would like to acknowledge the statistical assist-ance provided by Dr. Atilla Elhan and express our apprecia-tion to Defne Akinci for her assistance in preparing thismanuscript in English.
References
1. Carranza FA, Bernard GW (2002) The tooth-supportingstructures. Caranza’s Clinical Periodontology. W.B.Saunders pp 36–57
2. Schroeder HE (1992) Biological problems of regenerativecementogenesis: synthesis and attachment of collagenousmatrices on growing and established root surfaces. Int RevCytol 142:1–59
3. Selvig KA (1990) Ultrastructural changes in periodontaldisease. In: Genco, Goldman, Cohen (eds) Contemporaryperiodontis Mosby, St. Louis, pp 82–96
4. Selvig KA (1966) Ultrastructural changes in cementumand adjacent connective tissue in periodontal disease. ActaOdontol Scand 24:459–500
5. Selvig KA (1968) Nonbanded fibrils of collagenous naturein human periodontal connective tissue. J Periodontal Res3:169–179
6. Bosshardt DD, Selvig KA (1997) Dental cementum: thedynamic tissue covering the root. Periodontology200013:41–75
7. Carassi A, Abati S, Santralli G (1988) The role of scanningelectron microscopy in periodontal research. ScanningMicroscopy 2:1123–1138
8. Jones SJ, Boyde A (1972) A study of human rootcementum surfaces as prepared for and examined in thescanning electron microscope. Z Zellforsch 130:318–337
9. Barton NS, Van Swol RL (1987) Periodontally diseased vs.normal roots as evaluated by scanning electron microscopyand electron probe analysis. J Periodontol 58:634–638
10. Schroeder HE (1993) Human cellular mixed stratified ce-mentum: a tissue with alternating layers of acellular ex-trinsic-and cellular intrinsic fiber cementum. SchweizMonatsschr Zahnmed 103:550–560
11. Garrett JS (1975) Cementum in periodontal disease.J West Soc Periodontics Periodont Abstr 23:6–12
12. Spence J, Cotton J, Underwood B, Duncan C (1983) El-ementary Statistics. Prentice-Hall, Englewood Cliffs, NJ,pp 145–195
13. Azaz B, Ulmansky M, Moshev R, Sela J (1974) Correla-tion between age and thickness of cementum in impactedteeth. Oral Surg Oral Med Oral Pathol 38:691–691
14. Solheim T (1990) Dental cementum apposition as an in-dicator of age. Scan J Dent Res 98:510–519
15. Dastmalchi R, Polson A, Bouwsma O, Proskin H (1990)Cementum thickness and mesial drift. J Clin Periodontol17:709–713
16. Cohen M, Garnick JJ, Ringle RD, Hanes PJ, ThompsonWO (1992) Calcium and phosphorus content of roots ex-posed to the oral environment. J Clin Periodontol 19:268–273
17. Selvig KA, Hals E (1977) Periodontally diseased cemen-tum studied by correlated microradiography, electronprobe analysis and electron microscopy. J. PeriodontalRes 12:419–429
E. Bilgin et al.: Healthy Versus Diseased Cementum Layers 485
Copyright © 2022 FDOKUMEN